41
Virginia Sentencing Guidelines Preliminary FY2011 Report September 12, 2011

Virginia Sentencing Guidelines Preliminary FY2011 Report September 12, 2011

Preliminary FY2011 Report Guideline Worksheets Keyed as of 8/26/11
(n=20,998)
Drug Schedule I/II Cases FY07 36.6% FY08 35.4% FY09 30.1% FY10 26.9% FY11 26.1%
2
Preliminary FY2011 Report: General Compliance

Preliminary FY2011 Report
Judicial Agreement with Guideline Recommendations
General Compliance:
The degree to which judges agree with the overall guidelines recommendation.
Compliance 79.4%
Mitigation 10.8%
Aggravation 9.8%
Overall Compliance Rate
Mitigation 52.6%
Aggravation 47.4%
Direction of Departures
4

Preliminary FY2011 Report Judicial Agreement
with Type of Recommended Disposition
ACTUAL DISPOSITION
Dispositional Compliance:
The degree to which judges agree with the type of sanction recommended.
5

Preliminary FY2011 Report Judicial Agreement with Sentence Length
Durational Compliance:
The degree to which judges agree with the sentence length in cases in which defendants are
recommended for jail/prison and receive at least one day incarceration.
Median 10 months
below
6

Preliminary FY2011 Report: Departure Reasons

Aggravation (n=2,054)
• Plea agreement 443 (22%**)
• Severity/type of
prior record 314 (15%**)
• Flagrancy of
offense/facts of case 230 (11%**)
• Poor rehabilitation
potential 150 (7%**)
• Recommendation of jury 123 (6%**)
• Multiple counts
involved in event 119 (6%**)
• Degree of victim injury 99 (5%**)
n=397 missing a departure reason
Mitigation (n=2,278)
• Plea agreement 760 (34%*)
• Cooperated with 184 (8%*)
authorities
• Minimal prior record 148 (7%*)
• Facts of case 146 (6%*)
• Sentenced to alternative 128 (6%*)
• Offender to serve sentence
• in other jurisdiction 107 (5%*)
• Recommendation of CA 102 (5%*)
• Offender health 79 (4%*)
n=433 missing a departure reason
Preliminary FY2011 Report Most Frequently Cited Departure Reasons
* Of mitigating cases requiring departure reason ** Of aggravating cases requiring departure reasons
8
Preliminary FY2011 Report: Compliance by Circuit

Circuit Name Circuit Number Compliance Mitigation Aggravation Total
Chesapeake 1 76.9% 10.2% 13.0% 857
Virginia Beach 2 80.9% 11.9% 7.3% 1020
Portsmouth 3 76.2% 11.5% 12.3% 537
Norfolk 4 79.9% 13.6% 6.5% 937
Suffolk Area 5 77.9% 9.4% 12.7% 417
Sussex Area 6 74.9% 11.9% 13.3% 354
Newport News 7 86.7% 7.1% 6.2% 616
Hampton 8 81.5% 14.5% 4.0% 324
Williamsburg Area 9 72.2% 7.2% 20.7% 489
South Boston Area 10 79.3% 12.2% 8.5% 492
Petersburg Area 11 82.5% 8.0% 9.5% 274
Chesterfield Area 12 79.0% 9.8% 11.3% 932
Richmond City 13 75.2% 15.9% 8.9% 1061
Henrico 14 80.9% 11.1% 8.0% 864
Fredericksburg Area 15 75.4% 11.5% 13.1% 1439
Charlottesville Area 16 78.1% 12.1% 9.7% 718
Arlington Area 17 78.1% 8.3% 13.7% 278
Alexandria 18 77.5% 13.7% 8.8% 262
Fairfax 19 77.8% 11.1% 11.1% 1127
Loudoun Area 20 84.6% 4.6% 10.8% 499
Martinsville Area 21 76.1% 18.8% 5.1% 234
Danville Area 22 78.5% 6.2% 15.3% 567
Roanoke Area 23 72.6% 17.7% 9.8% 707
Lynchburg Area 24 78.1% 14.9% 7.0% 818
Staunton Area 25 77.2% 14.9% 7.8% 778
Harrisonburg Area 26 82.9% 10.4% 6.7% 1195
Radford Area 27 88.5% 6.8% 4.7% 1040
Bristol Area 28 89.1% 3.8% 7.2% 559
Buchanan Area 29 74.4% 8.8% 16.8% 656
Lee Area 30 79.1% 5.9% 15.0% 374
Prince William Area 31 87.4% 6.6% 6.0% 563
Preliminary FY2011
Most cases received:
-Circuit 15 (Fredericksburg)
-Circuit 26 (Harrisonburg)
-Circuit 19 (Fairfax)
Highest compliance:
-Circuit 28 (Bristol) 89.1%
-Circuit 27 (Radford) 88.5%
Lowest compliance:
-Circuit 9 (Williamsburg) 72.2%
Highest aggravation:
-Circuit 9 (Williamsburg) 20.7%
Highest mitigation:
-Circuit 21 (Martinsville) 18.8%

Preliminary FY2011 Report: Compliance by Offense Type

Preliminary FY2011 Report Compliance by Type of Offense
1,354 2,154 4,637 5,473 1,739 497 543 485 1,360 496 188 1,007 114 773 178
14

Preliminary FY2011 Report Compliance by Type of Offense
1,354 2,154 4,637 5,473 1,739 497 543 485 1,360 496 188 1,007 114 773 178 Highest mitigation rates Robbery (27.6%)
Most frequent departure reasons: Plea agreement Cooperation with authorities Sentenced to Dept. of Juvenile Justice
Median age of robbery offenders = 21 yrs Median age of guideline offenders = 30 yrs
Rape (18.1%)
Most frequent departure reasons: Plea agreement Victim will not/cannot testify
Highest aggravation rate Murder/Homicide (26.4%)
Most frequent departure reasons: Recommendation of jury
Largest percentage of jury trials (15%) Flagrancy of the offense
15

Preliminary FY2011 Report: Nonviolent Offender
Risk Assessment

Preliminary FY2011 Report Nonviolent Risk Assessment
Risk assessment applies in drug, fraud, & larceny cases
Offender must meet eligibility criteria
− Recommended for incarceration
− No current or violent felony conviction
− Did not distribute an ounce or more of cocaine
− Not convicted of crime requiring mandatory
minimum term of incarceration
Purpose: To recommend alternative sanctions for
offenders who are statistically less likely to recidivate
Type of alternative at discretion of judge
17

Nonviolent Offender Risk Assessment

1 0
7 1 4
19

Preliminary FY2011 Report Nonviolent Offenders Eligible for Risk Assessment
by Type of Offense
20
Total = 5,668 cases

Preliminary FY2011 Nonviolent Offenders Eligible for Risk Assessment
Fraud
Larceny
All Risk Cases 7%
9%
8%
Drug 6%
64%
75%
50%
61%
22%
9%
38%
25%
7%
7%
4%
8%
5,668
1,894
951
2,823
Offense Mitigation
Compliance
Aggravation
Number of Cases Traditional Alternative
86%
84%
88%
86%
21

85.3%
49.7%
35.5%
19.2%
15.2%
12.6%
9.2%
8.5%
6.2%
4.3%
4.0%
2.9%
2.7%
2.4%
1.9%
1.9%
Supervised Probation
Jail Sentence (in lieu of prison)
Restitution
Indefinite Prob
Fines
Unsup Probation
Diversion Center
Time Served
Detention Center
Community Service
Drug Treatment
Restrictions (No contact, etc.)
CCCA
Electronic Monitoring
Intensive Supervision
First Offender
Preliminary FY2011 Report More Frequent Sanctions Imposed in Risk Assessment Cases
Recommended for and Receiving Alternative Sanctions
Median 7 months
22

Preliminary FY2011 Report: Sex Offender Risk Assessment
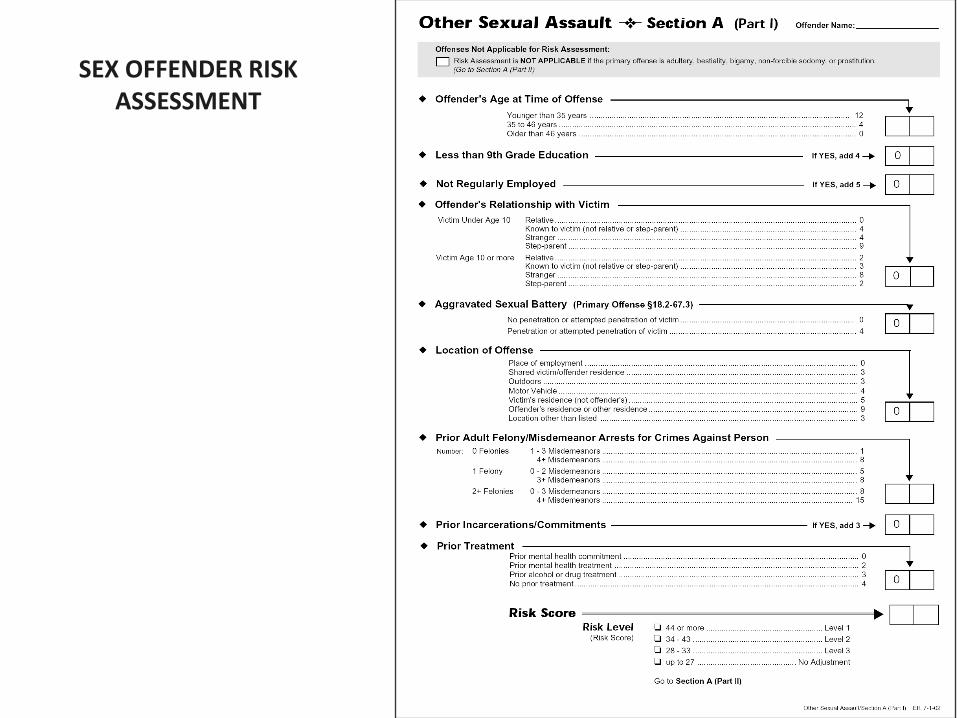
SEX OFFENDER RISK ASSESSMENT

Preliminary FY2011 Report Sex Offender Risk Assessment
Risk assessment incorporated into the guidelines for
Rape & Other Sexual Assault
Purpose: To extend the upper end of the guidelines
recommendation for sex offenders who are statistically
more likely to recidivate
Enhancements
Level 1 = 300% Increase in upper end of
guidelines range
Level 2 = 100% Increase in upper end of
guidelines range
Level 3 = 50% Increase in upper end of
guidelines range
25

Level 3
50%
Level 2
100%
Level 1
300%
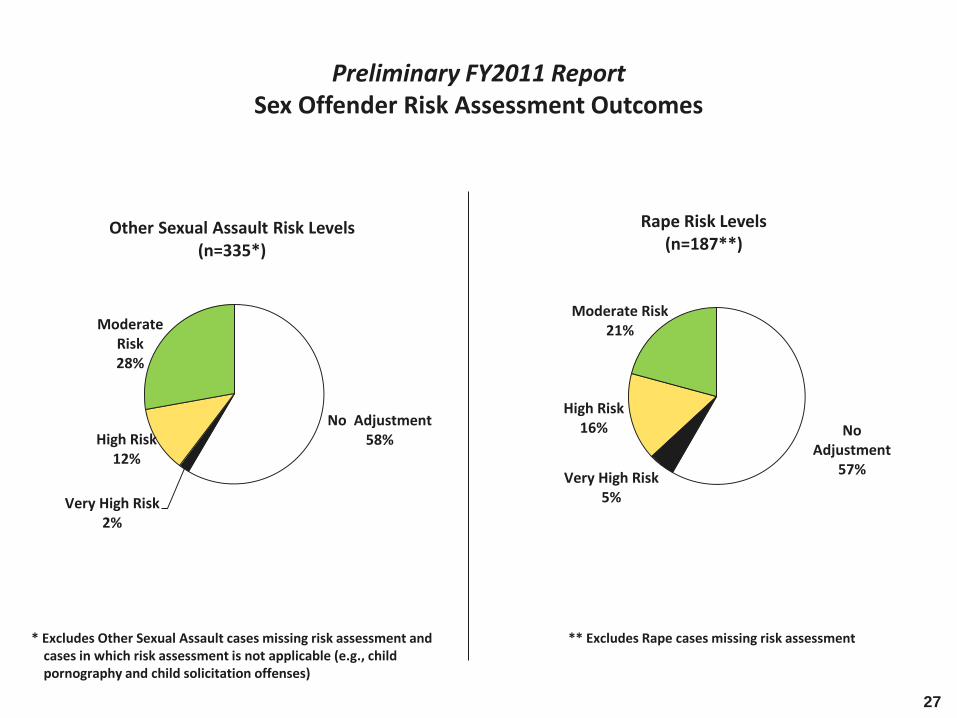
Preliminary FY2011 Report Sex Offender Risk Assessment Outcomes
* Excludes Other Sexual Assault cases missing risk assessment and cases in which risk assessment is not applicable (e.g., child pornography and child solicitation offenses)
No Adjustment 58%
Very High Risk 2%
High Risk 12%
Moderate Risk 28%
Other Sexual Assault Risk Levels (n=335*)
** Excludes Rape cases missing risk assessment
No Adjustment
57% Very High Risk
5%
High Risk 16%
Moderate Risk 21%
Rape Risk Levels (n=187**)
27

Preliminary FY2011 Report Compliance Rates by Risk Level for Rape Offenders
(n=187*)
Very High Risk
High Risk
Moderate Risk 18%
7%
22%
No Level 21%
69%
57%
56%
60%
8%
30%
22%
---
5%
7%
0%
19%
39
30
9
109
Risk Level Mitigation
Compliance
Aggravation
Number of Cases Traditional Adjusted
77%
87%
78%
* 1 Rape case did not have the Risk Assessment instrument completed 28

Preliminary FY2011 Report Compliance Rates by Risk Level for Other Sexual Assault Offenders
(n=335*)
Very High Risk
High Risk
Moderate Risk 17%
12%
0%
No Level 9%
66%
60%
86%
60%
16%
26%
14%
---
1%
2%
0%
31%
90
42
7
196
Risk Level Mitigation
Compliance
Aggravation Number of Cases Traditional Adjusted
82%
86%
100%
* Excludes Other Sexual Assault cases missing risk assessment and cases in which risk assessment is not applicable (e.g., child pornography and child solicitation offenses) 29

Preliminary FY2011 Report: Jury Sentencing
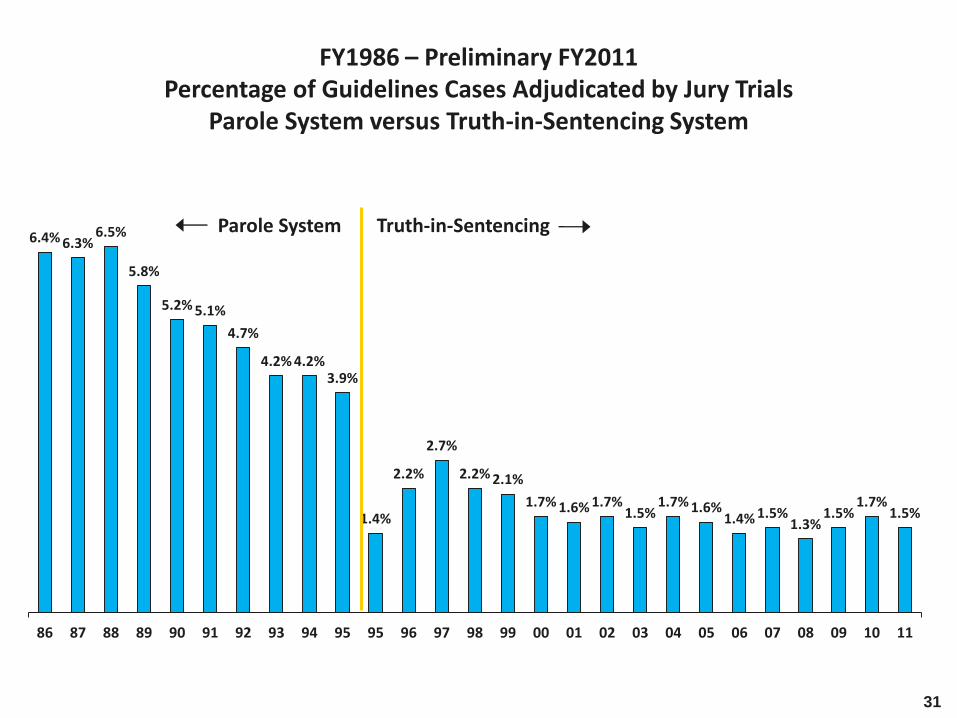
6.4% 6.3% 6.5%
5.8%
5.2% 5.1%
4.7%
4.2% 4.2% 3.9%
1.4%
2.2%
2.7%
2.2% 2.1%
1.7% 1.6% 1.7% 1.5%
1.7% 1.6% 1.4% 1.5%
1.3% 1.5%
1.7% 1.5%
86 87 88 89 90 91 92 93 94 95 95 96 97 98 99 00 01 02 03 04 05 06 07 08 09 10 11
FY1986 – Preliminary FY2011 Percentage of Guidelines Cases Adjudicated by Jury Trials
Parole System versus Truth-in-Sentencing System
Truth-in-Sentencing Parole System
31

Compliance 39.0%
Mitigation 9.7%
Aggravation 51.3%
Jury Cases (N=290*)
Preliminary FY2011 Report Jury vs. Non-Jury Sentencing
Compliance 79.8%
Mitigation 10.9%
Aggravation 9.3%
Non-Jury Cases (N=20,707)
Median departure
1.4 years above high end
of guidelines range
* Excludes 13 jury trials involving juveniles & 1 split bench/jury trial
32

Preliminary FY2011 Report: Additions/Changes to the
Guidelines Effective July 1, 2010
33

Compliance 67% Mitigation
8%
Aggravation 25%
FY2011 Preliminary (n=24*)
Preliminary 2011 Report Arson of an Occupied Dwelling/Church
(§ 18.2-77 (A,i))
Actual Disposition Percentage Median
Sentence
Probation/No Incarceration 4.2% --
Jail (up to 12 months) 20.8% 6 months
Prison (1 year or more) 75.0% 3.5 years
* Includes 5 cases involving attempted arson of an occupied dwelling/church
Primary Departure Reason: Flagrancy of offense
34

Compliance 62%
Mitigation 24%
Aggravation 14%
Participation in criminal act to benefit gang-- no juvenile member
(n=29*)
Preliminary 2011 Report Participation in Offense for Benefit of Gang—No Juvenile Member
(§ 18.2-46.2)
Primary Departure Reason: Plea Agreement
Actual Disposition Percentage Median
Sentence
Probation/No Incarceration 31.0% --
Jail (up to 12 months) 31.0% 6 months
Prison (1 year or more) 37.9% 2.25 years
* Includes 2 cases involving conspiracy to participate in an offense for benefit of gang (with no juvenile member) 35

Compliance 67%
Aggravation 33%
FY2011 Preliminary (n=6)
Preliminary 2011 Report Participation in Offense for Benefit of Gang—Juvenile Member
(§ 18.2-46.2)
Actual Disposition Percentage Median
Sentence
Probation/No Incarceration 0% --
Jail (up to 12 months) 33.3% 12 months
Prison (1 year or more) 66.7% 2.6 years
Departure Reasons (2 cases): Type of victim
No reason cited
36
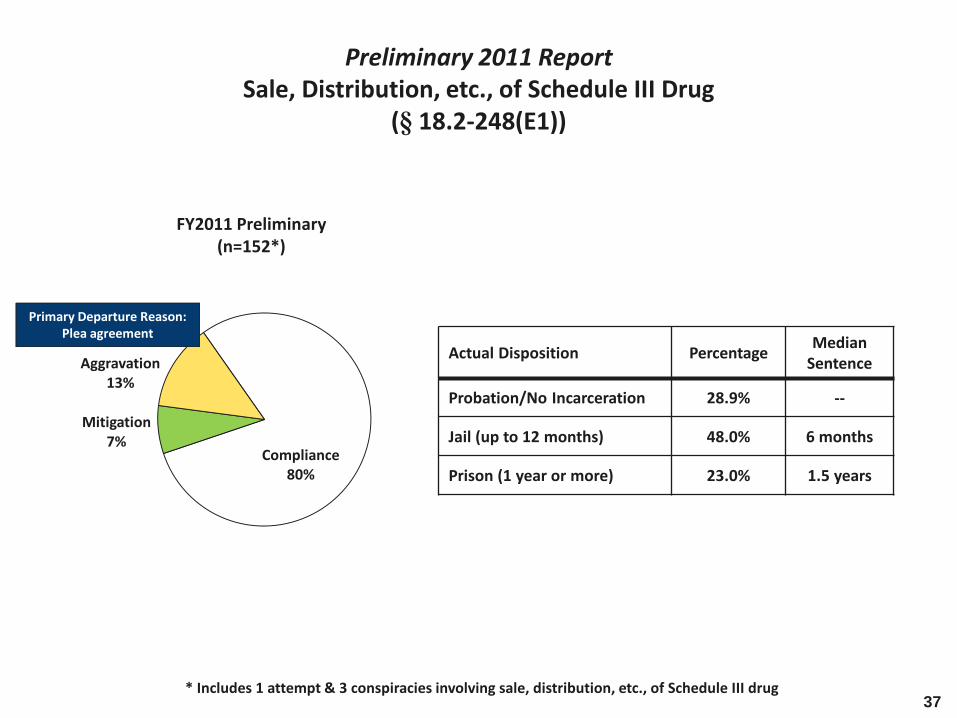
Compliance 80%
Mitigation 7%
Aggravation 13%
Preliminary 2011 Report Sale, Distribution, etc., of Schedule III Drug
(§ 18.2-248(E1))
FY2011 Preliminary (n=152*)
Actual Disposition Percentage Median
Sentence
Probation/No Incarceration 28.9% --
Jail (up to 12 months) 48.0% 6 months
Prison (1 year or more) 23.0% 1.5 years
Primary Departure Reason: Plea agreement
* Includes 1 attempt & 3 conspiracies involving sale, distribution, etc., of Schedule III drug 37

Preliminary 2011 Report Hit & Run—Property Damage, $1,000 or more
(§ 46.2-894)
Actual Disposition Percentage Median
Sentence
Probation/No Incarceration 21.3% --
Jail (up to 12 months) 47.5% 6 months
Prison (1 year or more) 31.3% 1.5 years
Compliance 77%
Mitigation 9%
Aggravation 14%
FY2011 Preliminary (n=160)
38

FY2011 Hit & Run, Victim Injury (§ 46.2-894) Added points for Prior Criminal Traffic Misdemeanors on Sections B & C and
Legal Restraint on Section C
Section B
Section C
39

Preliminary 2011 Report Hit & Run – Victim Injury
(§ 46.2-894)
Compliance 77%
Mitigation 17%
Aggravation 6%
FY2011 Preliminary (n=84)
Actual Disposition Percentage Median
Sentence
Probation/No Incarceration 19.0% --
Jail (up to 12 months) 47.6% 4 months
Prison (1 year or more) 33.4% 1.5 years
Primary Departure Reason: Plea Agreement
+ 5% over FY2010
40