Virginia’s Registered Nurse Workforce: 2017 Healthcare Workforce Data Center October 2017 Virginia Department of Health Professions Healthcare Workforce Data Center Perimeter Center 9960 Mayland Drive, Suite 300 Richmond, VA 23233 804-367-2115, 804-527-4466(fax) E-mail: [email protected]Follow us on Tumblr: www.vahwdc.tumblr.com
Transcript
Virginia’s Registered Nurse Workforce: 2017
Healthcare Workforce Data Center
October 2017
Virginia Department of Health Professions Healthcare Workforce Data Center
Perimeter Center 9960 Mayland Drive, Suite 300
Richmond, VA 23233 804-367-2115, 804-527-4466(fax) E-mail: [email protected]
39,780 Registered Nurses voluntarily participated in this survey. Without their efforts the work of the center would not be possible. The Department of Health Professions, the Healthcare Workforce Data Center, and the Board of Nursing express our sincerest appreciation for your ongoing cooperation.
Thank You!
Virginia Board of Nursing
President
Joyce A. Hahn, PhD, RN, NEA-BC, FNAP Oak Hill
Vice-President
Louise Hershkowitz, CRNA, MSHA Reston
Members
Laura F. Cei, BS, LPN, CCRP
Richmond
Alice B. Clark Ashland
Margaret Joan Friedenberg Richmond
Marie Gerardo, MS, RN, ANP-BC
Midlothian
Regina Gilliam, LPN
Sandston Michelle D. Hereford, MSHA, RN, FACHE
Glen Allen
Ethlyn McQueen-Gibson, DNP, MSN, RN-BC Yorktown
Trula E. Minton, MS, RN Richmond
Mark Monson Fairfax
Jennifer Phelps, LPN/QMHPA Lynchburg
Rebecca Poston, PhD, RN, CPNP
Norfolk
Dustin S. Ross, DNP, MBA, RN, NE-BC
Chesapeake
Executive Director
Jay P. Douglas, MSM, RN, CSAC, FRE
Contents
Results in Brief ............................................................................................................................................................................ 2
Summary of Trends .................................................................................................................................................................... 3
The Workforce ............................................................................................................................................................................ 5
Military Service......................................................................................................................................................................... 11
Current Employment Situation ................................................................................................................................................. 12
Work Site Distribution .............................................................................................................................................................. 15
Establishment Type .................................................................................................................................................................. 16
Time Allocation ........................................................................................................................................................................ 18
Full-Time Equivalency Units ...................................................................................................................................................... 22
Maps ........................................................................................................................................................................................ 23 Council on Virginia’s Future Regions ............................................................................................................................................ 23 Area Health Education Center Regions ........................................................................................................................................ 24 Workforce Investment Areas ....................................................................................................................................................... 25 Health Services Areas ................................................................................................................................................................... 26 Planning Districts .......................................................................................................................................................................... 27
The Workforce Background Current Employment t Licensees: 108,857 Rural Childhood: 37% Employed in Prof.: 90% Virginia’s Workforce: 90,574 HS Degree in VA: 56% Hold 1 Full-time Job: 69% FTEs: 77,979 Prof. Degree in VA: 67% Satisfied?: 93%
Survey Response Rate Education Job Turnover t All Licensees: 37% Baccalaureate: 45% Switched Jobs: 7% Renewing Practitioners: 86% Associate: 31% Employed over 2 yrs: 63%
Demographics Finances Time Allocation t Female: 93% Median Income: $60k-$70k Patient Care: 80%-89% Diversity Index: 37% Health Benefits: 66% Patient Care Role: 66% Median Age: 46 Under 40 w/ Ed debt: 61% Admin. Role: 7%
Source: Va. Healthcare Workforce Data Center
2
Results in Brief
39,780 Registered Nurses (RNs) voluntarily took part in the 2017 Registered Nurse Workforce Survey. The Virginia
Department of Health Professions’ Healthcare Workforce Data Center (HWDC) administers the survey during the license renewal process, which takes place during a two-year renewal cycle on the birth month of each respondent. Therefore, only approximately half of all RNs have access to the survey in any given year. Thus, these survey respondents represent only 37% of the 108,857 RNs who are licensed in the state but 86% of renewing practitioners.
The HWDC estimates that 90,574 RNs participated in Virginia’s workforce during the survey period, which is defined
as those who worked at least a portion of the year in the state or who live in the state and intend to return to work as an RN at some point in the future. Between October 2016 and September 2017, Virginia’s RN workforce provided 77,979 “full-time equivalency units”, which the HWDC defines simply as working 2,000 hours a year (or 40 hours per week for 50 weeks with 2 weeks off).
93% of all RNs are female, while the median age of the RN workforce is 46. In a random encounter between two
RNs, there is a 37% chance that they would be of different races or ethnicities, a measure known as the diversity index. This makes Virginia’s RN workforce considerably less diverse than the state’s overall population, where there is a 56% chance that two randomly chosen people would be of different races or ethnicities. Among RNs who are under the age of 40, there is slightly more diversity, with an index of 40%.
37% of all RNs grew up in a rural area, and 19% of these professionals currently work in non-Metro areas of the
state. Overall, just 9% of all RNs work in a non-Metro area of the state. Meanwhile, 56% of Virginia’s RNs graduated from high school in Virginia, and 67% earned their initial professional degree in the state. In total, 70% of Virginia’s RN workforce has some educational background in the state.
45% of all RNs hold a bachelor’s degree as their highest professional degree, while 31% have earned an associate
degree in Nursing. 40% of Virginia’s RN workforce currently has education debt, including 61% of those under the age of 40. The median debt burden for those RNs with educational debt is between $20,000 and $30,000.
90% of RNs are currently employed in the profession. 69% of all RNs hold one full-time position at the moment,
while 10% currently hold two or more positions. 41% of Virginia’s RNs work between 40 and 49 hours per week, while 14% of RNs work less than 30 hours per week. Although 7% of RNs have switched jobs at some point in the past year, another 63% of RNs have remained at their primary work location for more than two years.
The median annual income for RNs is between $60,000 and $70,000. In addition, 84% of wage or salaried RNs
receive at least one employer-sponsored benefit, including 66% who receive health insurance. 93% of RNs are satisfied with their current employment situation, including 58% who indicate they are “very satisfied”.
19% of Virginia’s RNs have worked at two or more locations in the past year, and 17% of RNs currently do the same.
84% of RNs work in the private sector, including 42% who work at a for-profit institution. In fact, 39% of all RNs work in the inpatient department of a hospital, which is by far the most of any establishment type in the state.
A typical RN spends nearly all of her time treating patients. In fact, 66% of RNs serve a patient care role, meaning that at least 60% of their time is spent in patient care activities. Meanwhile, a typical RN spends approximately half of her time treating adults and one-quarter of her time treating elderly patients.
39% of RNs expect to retire by the age of 65. 8% of the current workforce expects to retire in the next two years,
while half the current workforce expects to retire by 2042. Over the next two years, 29% of all RNs expected to pursue additional educational opportunities, while 7% plan on increasing their patient care hours.
3
Summary of Trends
Examining data from the past five Virginia Registered Nurse (RN) Surveys reveals some interesting trends. The
number of licensed RNs has increased gradually and consistently over the past half-decade. The number of licensed RNs has increased by 9% from 99,901 in 2013 to 108,857 in 2017. Similar increases were recorded in the number of RNs who are in the state’s workforce and the number of full time equivalency units provided by those in the workforce; both measures increased by 6% and 5%, respectively, between 2013 and 2017.
However, there has been very minimal change in diversity within the RN workforce. Females still constitute 93%
of the workforce, down from 94% in the 2013 survey. The median age is now 46, down from 48 in 2013. The percent under 40 has increased from 32% to 36% and the percent over age 55 has declined from 33% to 31% in the period. The diversity index increased from 33% in 2013 to 37% in the current report. The diversity index for those under 40 years has, however, only increased from 39% to 40% in the same period.
The presence of RNs in rural areas has not increased over the five years of survey. In 2013, 10% of all RNs work
in non-metro counties. In the present survey, only 9% do. However, a higher proportion of RNs now have an educational background in the state. In 2013, 67% completed high school or college in the state whereas, in 2017, 70% did.
Educational attainment has improved in the RN workforce. Those holding a baccalaureate degree have
increased from 38% in 2013 to 45% in 2017; conversely, the percent reporting an associate degree as their highest degree has declined from 34% to 31% in the same period. The percent holding at most a RN diploma as their highest degree has also declined from 14% in 2013 to 10% in 2017. A slightly higher proportion now hold a Master’s or doctoral degree.
The increase in educational attainment, however, comes at a cost. The percent holding education debt was 32% in
2013 but is now 40%. For those under age 40, the increase is from 57% in 2013 to 61% in the current report. The distribution of education debt also changed during the period, particularly for those under age 40. Those under 40 reporting education debt of less than $20,000 were 26% in 2013. Now, they are just 22%. A higher proportion are now at the upper tail of the distribution. In 2013, 3.5% and 3.4% of all RNs with debt and RNs under age 40 with education debt, respectively, reported above $100,000 in education debt. In 2017, the corresponding prevalence was 6.3% and 5.4%, respectively. It is important to keep an eye on the debt burden of RNs as close to a third report wanting to pursue additional education in the past five surveys.
Income has not changed much in the period. Although the median income in 2013 was $50,000-$60,000 and the
median income now is $60,000-$70,000, the increase occurred in 2015 and has not changed subsequently. However, there has been some change in the distribution of income. In 2017, 9% earned more than $100,000 whereas 6% did in 2013. Additionally, 33% earned less than $50,000 in 2013 whereas 26% did in 2017.
There are some changes in the specialties of RNs although acute/critical care still ranked the most reported
specialty in both 2013 and 2017. However, 16% reported they had specialty in acute/critical care in 2013 whereas 20% did in 2017. Furthermore, 11% reported surgical specialty in 2013 whereas 8% did in 2017. Specialties like women’s health and obstetrics declined from 7% in 2013 to 6% in 2017. However, the percent holding a nurse practitioner license remains the same, at 6%.
In both 2013 and 2017, 84% of RNs worked in the private sector. However, 42% now report working for for-
profit organizations compared to 38% in 2013. Most of the shift appears to be RNs moving from non-profit to for-profit organizations as the percent reporting working for non-profit declined from 46% to 42% in the same period.
Retirement is becoming a more critical issue in the RN workforce. A higher proportion of RNs expect to retire
under 60 and 65 years of age. In 2013, 10% expected to retire by age 60 and 32% by age 65. In 2017, 12% and 39%, respectively, reported the same. Adequate preparation is needed for the anticipated exodus from the workforce.
4
Survey Response Rates
A Closer Look:
Response Rates
Statistic Non
Respondents Respondent
Response Rate
By Age
Under 30 9,455 3,213 25%
30 to 34 7,643 4,918 39%
35 to 39 7,788 3,820 33%
40 to 44 5,972 4,885 45%
45 to 49 7,598 4,137 35%
50 to 54 6,375 5,231 45%
55 to 59 8,230 4,363 35%
60 and Over 16,016 9,213 37%
Total 69,077 39,780 37%
New Licenses
Issued After Sept. 2016
5,909 1 0%
Metro Status
Non-Metro 7,753 4,855 39%
Metro 51,518 32,000 38%
Not in Virginia 9,801 2,923 23%
Licensees License Status # %
Renewing Practitioners
47,274 43%
New Licensees 5,910 5%
Non-Renewals 6,450 6%
Renewal date not in survey period
49,223 45%
All Licensees 108,857 100%
Response Rates Completed Surveys 39,780
Response Rate, all licensees 37%
Response Rate, Renewals 86%
At a Glance:
Licensed RNs Number: 108,857 New: 5% Not Renewed: 6%
Response Rates All Licensees: 37% Renewing Practitioners: 86%
Definitions
1. The Survey Period: The survey was conducted between October 2016 and September 2017 on the birth month of each renewing practitioner.
2. Target Population: All RNs who held a Virginia license at some point during the survey time period.
3. Survey Population: The survey was available to RNs who renewed their licenses online. It was not available to those who did not renew, including RNs newly licensed during the survey time frame.
HWDC surveys tend to achieve very high response rates. 86% of renewing RNs submitted a survey. These represent 37% of RNs who held a license at some point
Utilization Ratios Licensees in VA Workforce: 83% Licensees per FTE: 1.40 Workers per FTE: 1.16
Definitions
1. Virginia’s Workforce: A licensee with a primary or secondary work site in Virginia at any time during the survey timeframe or who indicated intent to return to Virginia’s workforce at any point in the future.
2. Full Time Equivalency Unit (FTE): The HWDC uses 2,000 (40 hours for 50 weeks) as its baseline measure for FTEs.
3. Licensees in VA Workforce: The proportion of licensees in Virginia’s Workforce.
4. Licensees per FTE: An indication of the number of licensees needed to create 1 FTE. Higher numbers indicate lower licensee participation.
5. Workers per FTE: An indication of the number of workers in Virginia’s workforce needed to create 1 FTE. Higher numbers indicate lower utilization of available workers.
This report uses weighting to
estimate the figures in this
report. Unless otherwise noted,
figures refer to the Virginia
Workforce only. For more
information on HWDC’s
methodology visit:
www.dhp.virginia.gov/hwdc
Source: Va. Healthcare Workforce Data Center
Source: Va. Healthcare Workforce Data Center
Source: Va. Healthcare Workforce Data Center
6
Demographics
A Closer Look:
Age & Gender
Age Male Female Total
# %
Male # % Female #
% in Age Group
Under 30 647 6% 10,092 94% 10,739 13%
30 to 34 710 7% 9,482 93% 10,193 12%
35 to 39 663 7% 8,741 93% 9,403 11%
40 to 44 654 8% 7,947 92% 8,600 10%
45 to 49 760 8% 8,487 92% 9,247 11%
50 to 54 630 7% 8,339 93% 8,969 11%
55 to 59 620 7% 8,913 93% 9,533 11%
60 + 904 5% 15,569 95% 16,472 20%
Total 5,587 7% 77,570 93% 83,157 100%
Race & Ethnicity
Race/ Ethnicity
Virginia* RNs RNs under 40
% # % # %
White 63% 65,548 78% 23,148 76%
Black 19% 9,106 11% 3,292 11%
Asian 6% 4,105 5% 1,654 5%
Other Race <1% 859 1% 282 1% Two or more races
3% 1,769 2% 880 3%
Hispanic 9% 2,131 3% 1,116 4%
Total 100% 83,517 100% 30,371 100% *Population data in this chart is from the US Census, Annual Estimates of the Resident Population by Sex, Race, and Hispanic Origin for the United States, States, and Counties: July 1, 2015.
At a Glance:
Gender % Female: 93% % Under 40 Female: 93%
Age Median Age: 46 % Under 40: 36% % 55+: 31%
Diversity Diversity Index: 37% Under 40 Div. Index: 40%
In a chance encounter between two RNs, there is a 37% chance they would be of a different race/ethnicity (a measure known as the Diversity Index), compared to a 56% chance for Virginia’s population as a whole.
36% of RNs are under the age of 40. 93% of these professionals are female. In addition, the diversity index among RNs under the age of 40 is 40%, which is higher than the diversity index for Virginia’s overall RN workforce.
care/emergency/trauma center as their primary work location, the most of any establishment
type in the state.
Source: Va. Healthcare Workforce Data Center
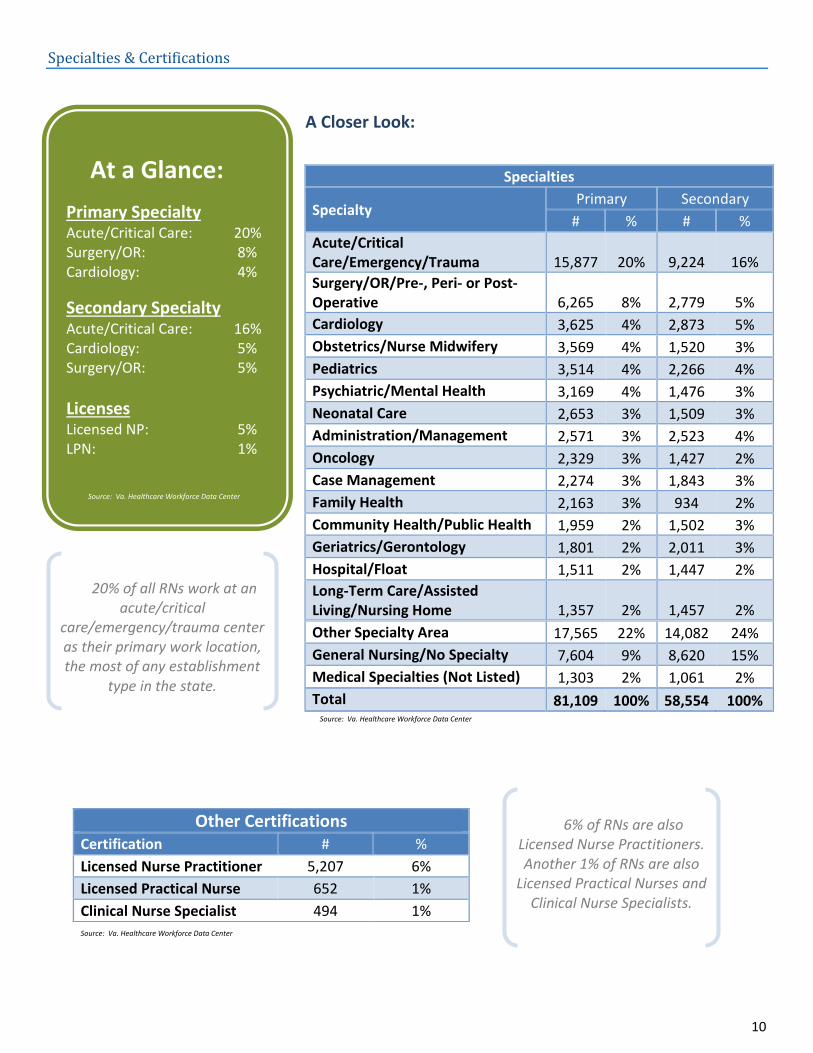
6% of RNs are also Licensed Nurse Practitioners. Another 1% of RNs are also
Licensed Practical Nurses and Clinical Nurse Specialists.
Source: Va. Healthcare Workforce Data Center
11
Military Service
A Closer Look:
Military Service Service? # %
Yes 6,179 8%
No 73,335 92%
Total 79,514 100%
Branch of Service Branch # %
Army 2,222 38%
Navy/Marine 2,173 37%
Air Force 1,307 23%
Other 103 2%
Total 5,806 100%
Military Occupation Occupation # %
Army Health Care Specialist (68W Army Medic) 411 7%
Navy Basic Medical Technician (Navy HM0000) 328 6%
Air Force Basic Medical Technician (Air Force BMTCP 4NOX1) 145 3%
Air Force Independent Duty Medical Technician (IDMT 4NOX1C) 15 0%
Other 4,706 84%
Total 5,604 100%
Source: Va. Healthcare Workforce Data Center
At a Glance:
Military Service % Served: 8%
Branch of Service Army: 38% Navy/Marine: 37% Air Force: 23%
Occupation Army Health Care Spec.: 7% Navy Basic Med. Tech.: 6% Air Force Basic Med. Tech.: 2%
Source: Va. Healthcare Workforce Data Center
8% of Virginia’s RN workforce has served in the military. 38% of
these RNs served in the Army, including 7% who worked as an
Army Health Care Specialist (68W Army Medic).
Source: Va. Healthcare Workforce Data Center
Source: Va. Healthcare Workforce Data Center
12
Current Employment Situation
A Closer Look:
Current Work Status Status # %
Employed, capacity unknown 72 <1%
Employed in a nursing- related capacity
74,012 90%
Employed, NOT in a nursing-related capacity
2,368 3%
Not working, reason unknown 12 0%
Involuntarily unemployed 287 <1%
Voluntarily unemployed 3,608 4%
Retired 1,945 2%
Total 82,305 100%
Current Positions Positions # %
No Positions 3,907 5%
One Part-Time Position 12,695 16%
Two Part-Time Positions 1,819 2%
One Full-Time Position 54,381 69%
One Full-Time Position & One Part-Time Position
5,606 7%
Two Full-Time Positions 180 0%
More than Two Positions 426 1%
Total 79,014 100%
Current Weekly Hours Hours # %
0 hours 3,907 5%
1 to 9 hours 1,411 2%
10 to 19 hours 2,809 4%
20 to 29 hours 6,751 9%
30 to 39 hours 23,550 30%
40 to 49 hours 31,856 41%
50 to 59 hours 5,560 7%
60 to 69 hours 1,673 2%
70 to 79 hours 590 1%
80 or more hours 481 1%
Total 78,588 100%
At a Glance:
Employment Employed in Profession: 90% Involuntarily Unemployed: 0%
Positions Held 1 Full-time: 69% 2 or More Positions: 10%
Weekly Hours: 40 to 49: 41% 60 or more: 3% Less than 30: 14%
90% of RNs are currently employed in their profession. 69% of RNs hold one full-time job, while
10% currently have multiple jobs. 41% of all RNs work between 40 and 49 hours per week, while
14% work less than 30 hours per week.
Source: Va. Healthcare Workforce Data Center
Source: Va. Healthcare Workforce Data Center
Source: Va. Healthcare Workforce Data Center
Source: Va. Healthcare Workforce Data Center
13
Employment Quality
A Closer Look:
Income Hourly Wage # %
Volunteer Work Only 966 2%
Less than $20,000 2,584 4%
$20,000-$29,999 1,889 3%
$30,000-$39,999 3,963 6%
$40,000-$49,999 8,147 13%
$50,000-$59,999 11,496 18%
$60,000-$69,999 10,866 17%
$70,000-$79,999 8,212 13%
$80,000-$89,999 5,965 9%
$90,000-$99,999 3,526 6%
$100,000 or more 6,408 9%
Total 64,022 100%
Job Satisfaction Level # %
Very Satisfied 45,183 58%
Somewhat Satisfied 28,129 36%
Somewhat Dissatisfied
4,039 5%
Very Dissatisfied 1,227 2%
Total 78,578 100%
Employer-Sponsored Benefits
Benefit # % % of Wage/Salary
Employees
Retirement 53,239 72% 73%
Paid Leave 51,669 70% 71%
Health Insurance 48,560 66% 66%
Dental Insurance 47,724 64% 65%
Group Life Insurance 36,448 49% 50%
Signing/Retention Bonus 5,584 8% 8%
Received at Least One Benefit 62,415 84% 84% *From any employer at time of survey.
At a Glance:
Earnings Median Income: $60k-$70k
Benefits Health Insurance: 66% Retirement: 73%
Satisfaction Satisfied: 93% Very Satisfied: 58%
The typical RN earned between $60,000 and $70,000 in the past year. Among RNs who received either a salary or an hourly
wage as compensation at their primary work location, 84% had access to at least one
employer-sponsored benefit, including 66% who received health insurance.
Source: Va. Healthcare Workforce Data Center
Source: Va. Healthcare Workforce Data Center
Source: Va. Healthcare Workforce Data Center
Source: Va. Healthcare Workforce Data Center
14
2016-2017 Labor Market
A Closer Look:
2
2 As reported by the US Bureau of Labor Statistics. The average non-seasonally adjusted monthly unemployment rate was 3.9% in October 2016 to September 2017, the period of the survey. The low of the period was 3.6% in September 2017 and the high was 4.2% in January 2017. The data for September 2017 was preliminary.
Employment Instability in Past Year In the past year did you . . .? # %
Experience Involuntary Unemployment? 855 1%
Experience Voluntary Unemployment? 5,564 6%
Work Part-time or temporary positions, but would have preferred a full-time/permanent position? 1,961 2%
Work two or more positions at the same time? 10,864 12%
Turnover & Tenure Switched Jobs: 7% New Location: 19% Over 2 years: 63% Over 2 yrs, 2nd location: 48%
Employment Type Hourly Wage: 66% Salary: 29%
1% of Virginia’s RNs experienced involuntary unemployment at some point during the renewal cycle. By
comparison, Virginia’s average monthly unemployment rate was 3.9% during the same time period.2
63% of RNs have worked at their primary location for more
than 2 years—the job tenure normally required to attain a conventional mortgage loan.
Source: Va. Healthcare Workforce Data Center
66% of RNs receive an hourly wage at their primary work location,
while 29% are salaried employees.
Source: Va. Healthcare Workforce Data Center
Source: Va. Healthcare Workforce Data Center
Source: Va. Healthcare Workforce Data Center
15
Work Site Distribution
A Closer Look:
Number of Work Locations
Locations
Work Locations in
Past Year
Work Locations
Now*
# % # %
0 3,825 5% 5,645 7%
1 61,115 76% 61,131 76%
2 10,071 13% 9,347 12%
3 4,102 5% 3,395 4%
4 360 0% 173 0%
5 209 0% 134 0%
6 or More
427 1% 285 0%
Total 80,109 100% 80,109 100% *At the time of survey completion (Oct. 2016-Sept. 2017, birth month of respondent). 3 These are now referred to as VA Perform’s regions: http://vaperforms.virginia.gov/Regions/regionalScorecards.php
Regional Distribution of Work Locations
COVF Region3
Primary Location
Secondary Location
# % # %
Central 20,841 28% 3,397 23%
Eastern 959 1% 269 2%
Hampton Roads 15,861 21% 3,017 21%
Northern 17,504 23% 3,324 23%
Southside 2,522 3% 539 4%
Southwest 3,087 4% 689 5%
Valley 5,143 7% 776 5%
West Central 8,992 12% 1,718 12%
Virginia Border State/DC
335 0% 265 2%
Other US State 467 1% 669 5%
Outside of the US 12 0% 29 0%
Total 75,723 100% 14,692 100%
Item Missing 11,050
591
At a Glance:
Concentration Top Region: 28% Top 3 Regions: 72% Lowest Region: 1%
Locations 2 or more (Past Year): 19% 2 or more (Now*): 17%
19% of all RNs held two or more positions over the past year, while 17%
currently hold multiple positions.
28% of all RNs work in Central Virginia, the most of
any region in the state. Another 23% of RNs work in
Northern Virginia, while 21% work in Hampton Roads.
Patient Care RNs Median Admin Time: 0% Ave. Admin Time: 1%-9%
A typical RN spends nearly all of her time on patient care activities. 66% of all RNs fill a patient care role, defined as spending 60% or more of their time on patient care activities. Another 7% of RNs serve an administrative role, while 5% serve a supervisory role.
Source: Va. Healthcare Workforce Data Center
Source: Va. Healthcare Workforce Data Center
Source: Va. Healthcare Workforce Data Center
19
Patients
A Closer Look:
Patient Allocation
Time Spent
Children Adolescents Adults Elderly
Prim. Site
Sec. Site
Prim. Site
Sec. Site
Prim. Site
Sec. Site
Prim. Site
Sec. Site
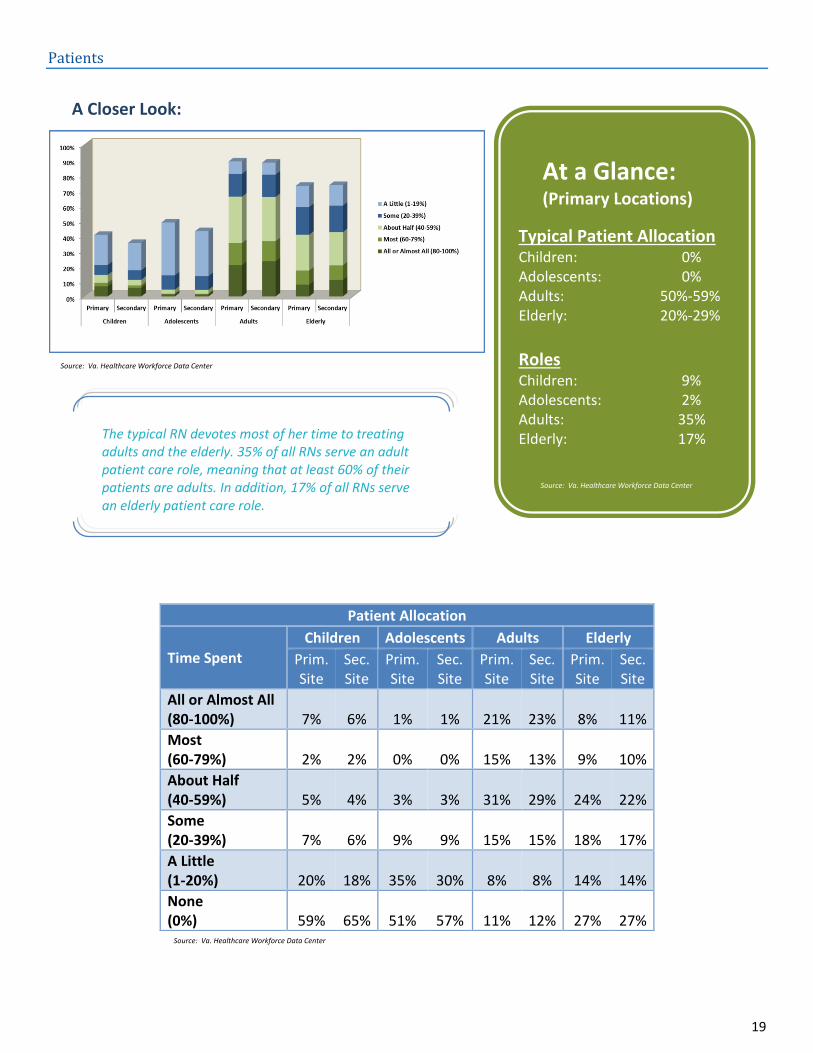
All or Almost All (80-100%) 7% 6% 1% 1% 21% 23% 8% 11%
The typical RN devotes most of her time to treating adults and the elderly. 35% of all RNs serve an adult patient care role, meaning that at least 60% of their patients are adults. In addition, 17% of all RNs serve an elderly patient care role.
Source: Va. Healthcare Workforce Data Center
20
Retirement & Future Plans
A Closer Look:
Retirement Expectations
Expected Retirement Age
All RNs RNs over 50
# % # %
Under age 50 1,478 2% - -
50 to 54 1,839 3% 163 1%
55 to 59 5,290 8% 1,321 5%
60 to 64 18,160 26% 6,998 24%
65 to 69 27,990 40% 12,906 45%
70 to 74 8,669 12% 4,330 15%
75 to 79 2,049 3% 1,044 4%
80 or over 818 1% 380 1%
I do not intend to retire 3,111 4% 1,448 5%
Total 69,404 100% 28,590 100%
Future Plans
2 Year Plans: # %
Decrease Participation
Leave Profession 1,576 2%
Leave Virginia 3,203 4%
Decrease Patient Care Hours 7,461 8%
Decrease Teaching Hours 413 0%
Increase Participation
Increase Patient Care Hours 6,742 7%
Increase Teaching Hours 4,729 5%
Pursue Additional Education 26,338 29%
Return to Virginia’s Workforce 1,551 2%
At a Glance:
Retirement Expectations All RNs Under 65: 39% Under 60: 12% RNs 50 and over Under 65: 30% Under 60: 5%
Time until Retirement Within 2 years: 8% Within 10 years: 24% Half the workforce: By 2042
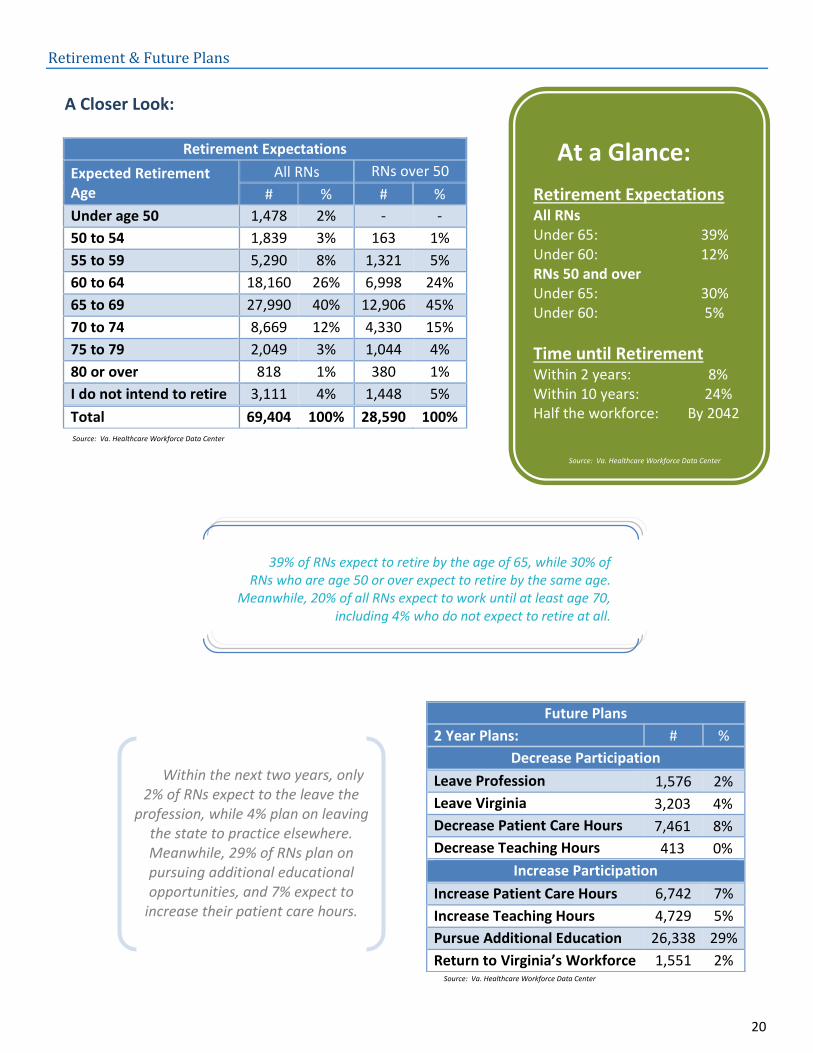
39% of RNs expect to retire by the age of 65, while 30% of RNs who are age 50 or over expect to retire by the same age.
Meanwhile, 20% of all RNs expect to work until at least age 70, including 4% who do not expect to retire at all.
Within the next two years, only 2% of RNs expect to the leave the
profession, while 4% plan on leaving the state to practice elsewhere. Meanwhile, 29% of RNs plan on pursuing additional educational opportunities, and 7% expect to
increase their patient care hours.
Source: Va. Healthcare Workforce Data Center
Source: Va. Healthcare Workforce Data Center
Source: Va. Healthcare Workforce Data Center
21
Time to Retirement
Expect to retire within. . . # % Cumulative
%
2 years 5,210 8% 8%
5 years 2,916 4% 12%
10 years 8,583 12% 24%
15 years 7,978 11% 36%
20 years 6,954 10% 46%
25 years 7,789 11% 57%
30 years 7,656 11% 68%
35 years 7,609 11% 79%
40 years 6,274 9% 88%
45 years 3,910 6% 93%
50 years 957 1% 95%
55 years 258 0% 95%
In more than 55 years 198 0% 96%
Do not intend to retire 3,111 4% 100%
Total 69,403 100%
By comparing retirement expectation to age, we can
estimate the maximum years to retirement for RNs. 8% of RNs expect to retire in the next two
years, while 24% expect to retire in the next 10 years. More than half
of the current RN workforce expects to retire by 2042.
Using these estimates, retirements will begin to reach over
10% of the current workforce every 5 years by 2027. Retirements will peak
at 12% of the current workforce around the same time before
declining to under 10% of the current workforce again around 2057.
Source: Va. Healthcare Workforce Data Center
Source: Va. Healthcare Workforce Data Center
22
Full-Time Equivalency Units
A Closer Look: 4
4 Due to assumption violations in Mixed between-within ANOVA (Levene’s Test and Interaction effect are significant)
Partial Eta2 Explained: Partial Eta2 is a statistical
measure of effect size.
The typical (median) RN provided 0.91 FTEs, or approximately 37 hours per week for 50 weeks. Although FTEs appear to vary by age and gender, statistical tests did not verify that a difference exists.4
Source: Va. Healthcare Workforce Data Center
Source: Va. Healthcare Workforce Data Center
Source: Va. Healthcare Workforce Data Center Source: Va. Healthcare Workforce Data Center
23
Maps
Council on Virginia’s Future Regions3
24
Area Health Education Center Regions
25
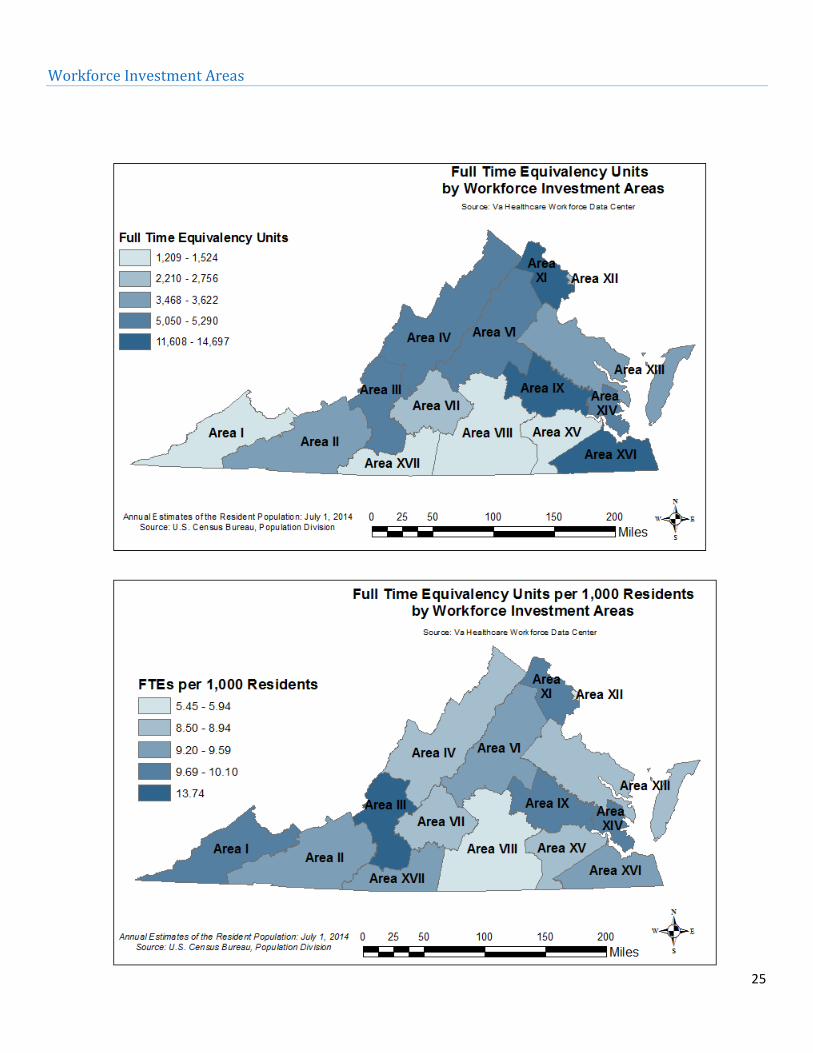
Workforce Investment Areas
26
Health Services Areas
27
Planning Districts
28
Appendices
Appendix A: Weights
See the Methods section on the HWDC website
for details on HWDC Methods: www.dhp.virginia.gov/hwdc/
Final weights are calculated by multiplying the two weights and the overall response rate:
Age Weight x Rural Weight x Response Rate
= Final Weight.
Overall Response Rate: 0.365433
Rural Status
Location Weight Total Weight
# Rate Weight Min Max
Metro, 1 million+
62,889 33.96% 2.945069 2.304241 3.862506
Metro, 250,000 to 1 million
9,852 34.64% 2.88661 2.258502 3.785836
Metro, 250,000 or less
10,673 34.79% 2.874495 2.249023 3.769947
Urban pop 20,000+, Metro adj
1,904 35.45% 2.820741 2.206966 3.699447
Urban pop 20,000+, nonadj
0 NA NA NA NA
Urban pop, 2,500-19,999, Metro adj
4,293 33.92% 2.948489 2.306917 3.866991
Urban pop, 2,500-19,999, nonadj
2,807 34.95% 2.861366 2.238751 3.752728
Rural, Metro adj
2,473 32.03% 3.122475 2.443044 4.095176
Rural, nonadj
1,124 33.72% 2.965699 2.320382 3.889563
Virginia border state/DC
3,359 23.97% 4.172671 3.264725 5.472526
Other US State
8,752 18.40% 5.436025 4.253181 7.129435
Age Age Weight Total Weight
# Rate Weight Min Max
Under 30 12,368 24.81% 4.031291 3.699447 7.129435 30 to 34 12,073 37.99% 2.632003 2.415345 4.654762
35 to 39 10,900 28.17% 3.550489 3.258223 6.279125 40 to 44 11,024 40.74% 2.454687 2.252625 4.341173 45 to 49 11,539 30.08% 3.324402 3.050748 5.879285
50 to 54 12,092 41.58% 2.404932 2.206966 4.253181
55 to 59 13,077 29.63% 3.37471 3.096914 5.968255 60 and Over