Virtual Electrophysiological Studyin a 3-Dimensional Cardiac Magnetic ResonanceImaging Model of Porcine Myocardial Infarction
Jason Ng, PHD,* Jason T. Jacobson, MD,* Justin K. Ng, MS,* David Gordon, MD, PHD,*Daniel C. Lee, MD,* James C. Carr, MD,† Jeffrey J. Goldberger, MD*
Chicago, Illinois
Objectives This study sought to test the hypothesis that “virtual” electrophysiological studies (EPS) on an anatomic platformgenerated by 3-dimensional magnetic resonance imaging reconstruction of the left ventricle can reproduce thereentrant circuits of induced ventricular tachycardia (VT) in a porcine model of myocardial infarction.
Background Delayed-enhancement magnetic resonance imaging has been used to characterize myocardial infarction and“gray zones,” which are thought to reflect heterogeneous regions of viable and nonviable myocytes.
Methods Myocardial infarction by coronary artery occlusion was induced in 8 pigs. After a recovery period, 3-dimensionalcardiac magnetic resonance images were obtained from each pig in vivo. Normal areas, gray zones, and infarctcores were classified based on voxel intensity. In the computer model, gray zones were assigned slower conduc-tion and longer action potential durations than those for normal myocardium. Virtual EPS was performed andcompared with results of actual in vivo programmed stimulation and noncontact mapping.
Results The left ventricular volumes ranged from 97.8 to 166.2 cm3, with 4.9% to 17.5% of voxels classified as infarctzones. Six of the 7 pigs in which VT developed during actual EPS were also inducible with virtual EPS. Four of the6 pigs that had simulated VT had reentrant circuits that approximated the circuits seen with noncontact map-ping, whereas the remaining 2 had similar circuits but propagating in opposite directions.
Published by Elsevier Inc. http://dx.doi.org/10.1016/j.jacc.2012.03.029
Sudden cardiac death (SCD) is a major health issue in theUnited States, affecting as many as 400,000 people yearly(1). Most SCDs are due to arrhythmias, namely, ventriculartachycardia (VT) or ventricular fibrillation. The ability toidentify at-risk patients before they experience cardiac arrest iscritical because prophylactic implantable cardioverter-defibrillators can significantly reduce mortality. Although cur-rent techniques and algorithms identify populations that are at
From the *Division of Cardiology and Bluhm Cardiovascular Institute, FeinbergSchool of Medicine, Northwestern University, Chicago, Illinois; and the †Depart-ment of Radiology, Feinberg School of Medicine, Northwestern University, Chicago,Illinois. This study was supported by grants from the NIH (1 R21 HL094902-01) andfrom St. Jude Medical Systems. Dr. Jacobson consults for St. Jude Medical Systems.Dr. Carr consults for and has grant support from Siemens Healthcare and Astellas.Dr. Lee and Dr. Goldberger receive grant support from St. Jude Medical. All otherauthors have reported that they have no relationships relevant to the contents of thispaper to disclose.
Manuscript received January 3, 2012; revised manuscript received February 23,2012, accepted March 12, 2012.
higher risk of SCD, they lack the ability to truly differentiatethe low-risk group from the high-risk group (2).
Electrical mapping and pacing during animal (3,4) andclinical (5–7) studies have demonstrated that VTs aftermyocardial infarction (MI) are often macroreentrant circuitssupported by an anatomic substrate resulting from infarctscarring. These circuits can be complex, containing areasof slow conduction and multiple pathways of reentry.Stevenson et al. (8) showed that some of the pathways maybe critical, whereas others may simply be bystander areaswhich when interrupted through ablation will not terminatethe arrhythmia.
It has been shown that magnetic resonance imaging(MRI) with contrast can be used to detect scarring after MI.It has also been shown that infarct size is a better predictorof inducible VT than the left ventricular ejection fraction(9), highlighting the importance of the infarct substrate inthe generation of VT. Infarct size measure by MRI has also
been shown to be an independent predictor of mortality (10)
424 Ng et al. JACC Vol. 60, No. 5, 2012Virtual Electrophysiological Study July 31, 2012:423–30
and spontaneous VT (11). Thesurrounding border zones, alsoknown as gray zones, are thoughtto be a heterogeneous mix ofviable and nonviable myocar-dium and have been shown tocorrelate with post-MI mortality(12), clinical VT (13), and VTinducibility (14). Infarct trans-murality measured from MRIhas also been shown to be apredictor of ventricular arrhyth-mias (15). Because of the strongcorrelation observed between theinfarct morphologies observed onMRI and pathologic analysis(16), we hypothesized that vir-
tual electrophysiological study (VEPS) consisting of thecombination of: 1) anatomic characterization of infarctmorphology by 3-dimensional (3D) MRI in vivo; and 2) thecomputer simulation of cardiac electrophysiology could beused to predict the characteristics of induced VT duringactual electrophysiological study (EPS). This hypothesiswas tested using a porcine model of chronic MI.
Methods
Animal model of MI. Eight pigs weighing 55 to 75 kgwere used for this study. The closed chest coronary occlu-sion protocol to induce MI was described previously (17)and presented in more detail in the Online Appendix.Briefly, 300 ml of agarose gel beads diluted in 1.5 ml ofsaline solution was injected by a balloon catheter into eitherthe left circumflex artery or the left anterior descendingcoronary artery just distal to the second marginal or diagonalbranch to cause infarction. The pigs were then allowed 4 to8 weeks to recover. The experimental protocol was approvedby the Animal Care and Use Committee of NorthwesternUniversity.Contrast-enhanced 3D MRI. After the recovery period,cardiac magnetic resonance images were obtained from thepigs under general anesthesia (1% to 2.5% isoflurane) usinga Siemens 3.0-T Trio MRI scanner (Siemens MedicalSolutions, Erlangen, Germany) in the Center for AdvancedMRI at Northwestern University. A free-breathing 3Dphase-sensitive inversion recovery turbo FLASH pulse se-quence was used for acquisition (18). The average 3Dphase-sensitive inversion recovery scan time was 9.8 � 3.4min. Phase-sensitive inversion recovery reconstruction wasused to eliminate the need for precise setting of theinversion time, and parallel imaging was used to improvethe acquisition speed. Image data were collected during freebreathing by synchronizing the acquisition to the respiratorycycle using a crossed slice navigator. This technique yieldsnear-isotropic spatial resolution with voxel sizes of 1.8 �
Abbreviationsand Acronyms
3D � 3-dimensional
EPS � electrophysiologicalstudy
LV � left ventricle
MI � myocardial infarction
MRI � magnetic resonanceimaging
SCD � sudden cardiacdeath
VEPS � virtualelectrophysiological study
VT � ventriculartachycardia
1.9 � 1.8 mm. Images were acquired approximately 15 to
20 min after an intravenous injection of contrast (0.2mmol/kg of gadopentetate dimeglumine, Magnevist, BayerHealthCare, Leverkusen, Germany).Noncontact mapping of VT. EPS was performed after the4- to 8-week recovery period within 3 days of MRI.Noncontact mapping (19) was performed using a commer-cial system (EnSite 3000, Endocardial Solutions, Inc., St.Paul, Minnesota), which recorded signals from a 64-electrode array mounted on a 9-French catheter positionedin the left ventricle (LV) via a retrograde transaorticapproach. The system creates a 3D geometry on whichsequential isopotential maps constructed from �3,000 vir-tual unipolar electrograms are displayed. Induction of VTwas attempted by programmed ventricular stimulation inthe right ventricle and LV with as many as 3 extrastimuliafter a drive train of 8 paced beats at 2 basic cycle lengths.The virtual unipolar electrograms of any induced tachycar-dias (either by programmed ventricular stimulation or cath-eter manipulation) were saved for offline determination ofarrhythmia characteristics and scar exit sites. Episodes �30 swere considered sustained VT.MRI processing. All image processing of MRI data wasperformed using custom-designed software. The regionscorresponding to the LV were then manually segmented.The segmented data were then linearly interpolated for aresulting resolution of 0.45 � 0.475 � 0.45 mm.
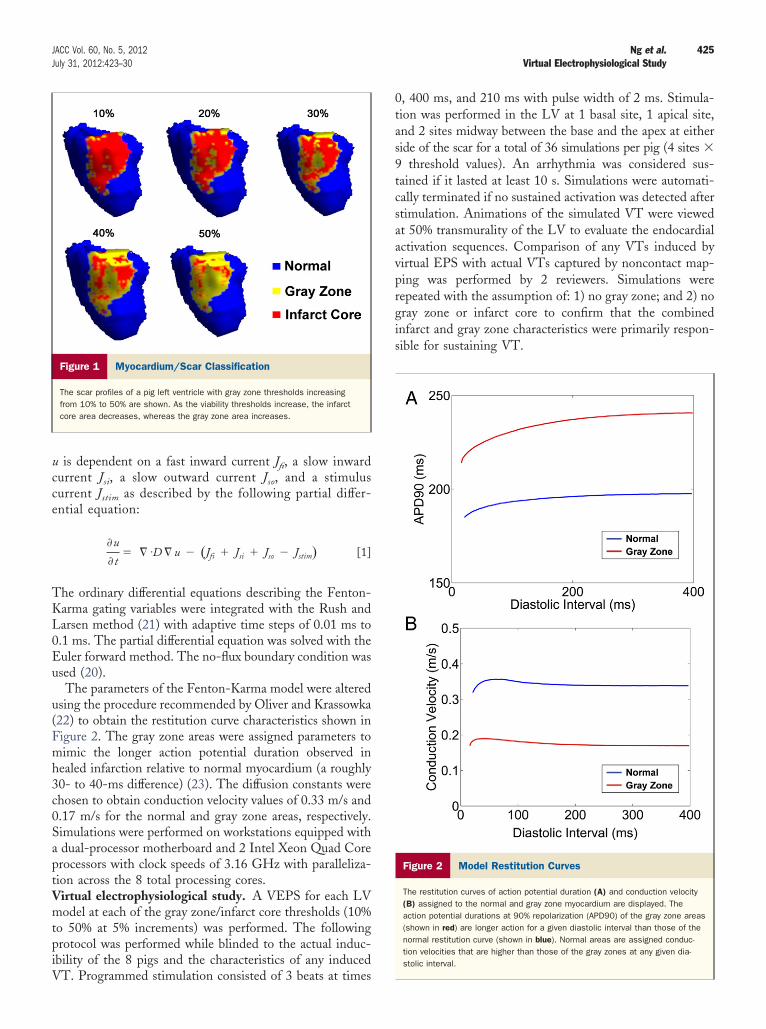
Each voxel of the LV was classified as either normal, grayzone, or nonviable infarct core using a modification of apreviously published algorithm by Schmidt et al. (14). First,the enhanced area of the MRI corresponding to the infarctwas manually approximated. The selected area was over-estimated to include normal regions at the boundaries of thescar. The nonselected area was therefore classified as normalmyocardium. The classification algorithm was not appliedto the nonselected area to avoid false detection of scar dueto noise or artifacts. Within the selected scar region, allvoxels with intensity values less than the mean � 3 SDs ofthe intensities of the selected normal myocardium wereclassified as completely viable. A second threshold was usedto determine whether the remaining voxels were classified aspart of the gray zone or part of the infarct core. Thresholdvalues between 10% and 50% of the range bounded by themean and 3 SDs of the normal myocardium intensities onthe lower end and the maximum intensity of the identifiedscar area on the upper end were used at 5% increments.Figure 1 shows how the distribution of gray zone as seen onthe epicardium increases relative to the nonviable scar as thethreshold value is increased from 10% to 50%.Mathematical modeling of cardiac electrophysiology.Three-dimensional isotropic computer models were imple-mented using the 3D geometry of the LV constructed fromthe MRI. The Fenton-Karma 3-current ventricular actionpotential model (20) was used for this study. The tissue-conduction model was created by the coupling of neighbor-ing cells in a 3D lattice with current diffusion controlled by
a diffusion constant D. A scaled membrane voltage variable
9tcsaavprgis
425JACC Vol. 60, No. 5, 2012 Ng et al.July 31, 2012:423–30 Virtual Electrophysiological Study
u is dependent on a fast inward current Jfi, a slow inwardcurrent Jsi, a slow outward current Jso, and a stimuluscurrent Jstim as described by the following partial differ-ential equation:
�u
�t� � ·D � u � �Jfi � Jsi � Jso � Jstim� [1]
The ordinary differential equations describing the Fenton-Karma gating variables were integrated with the Rush andLarsen method (21) with adaptive time steps of 0.01 ms to0.1 ms. The partial differential equation was solved with theEuler forward method. The no-flux boundary condition wasused (20).
The parameters of the Fenton-Karma model were alteredusing the procedure recommended by Oliver and Krassowka(22) to obtain the restitution curve characteristics shown inFigure 2. The gray zone areas were assigned parameters tomimic the longer action potential duration observed inhealed infarction relative to normal myocardium (a roughly30- to 40-ms difference) (23). The diffusion constants werechosen to obtain conduction velocity values of 0.33 m/s and0.17 m/s for the normal and gray zone areas, respectively.Simulations were performed on workstations equipped witha dual-processor motherboard and 2 Intel Xeon Quad Coreprocessors with clock speeds of 3.16 GHz with paralleliza-tion across the 8 total processing cores.Virtual electrophysiological study. A VEPS for each LVmodel at each of the gray zone/infarct core thresholds (10%to 50% at 5% increments) was performed. The followingprotocol was performed while blinded to the actual induc-ibility of the 8 pigs and the characteristics of any induced
Figure 1 Myocardium/Scar Classification
The scar profiles of a pig left ventricle with gray zone thresholds increasingfrom 10% to 50% are shown. As the viability thresholds increase, the infarctcore area decreases, whereas the gray zone area increases.
VT. Programmed stimulation consisted of 3 beats at times
0, 400 ms, and 210 ms with pulse width of 2 ms. Stimula-tion was performed in the LV at 1 basal site, 1 apical site,and 2 sites midway between the base and the apex at eitherside of the scar for a total of 36 simulations per pig (4 sites �
threshold values). An arrhythmia was considered sus-ained if it lasted at least 10 s. Simulations were automati-ally terminated if no sustained activation was detected aftertimulation. Animations of the simulated VT were viewedt 50% transmurality of the LV to evaluate the endocardialctivation sequences. Comparison of any VTs induced byirtual EPS with actual VTs captured by noncontact map-ing was performed by 2 reviewers. Simulations wereepeated with the assumption of: 1) no gray zone; and 2) noray zone or infarct core to confirm that the combinednfarct and gray zone characteristics were primarily respon-ible for sustaining VT.
Figure 2 Model Restitution Curves
The restitution curves of action potential duration (A) and conduction velocity(B) assigned to the normal and gray zone myocardium are displayed. Theaction potential durations at 90% repolarization (APD90) of the gray zone areas(shown in red) are longer action for a given diastolic interval than those of thenormal restitution curve (shown in blue). Normal areas are assigned conduc-tion velocities that are higher than those of the gray zones at any given dia-stolic interval.
wdvcmEcEiplVfTz“ipVm(otgr
ammadb
popTdzbbopwiVVtaotcpoFdrtes
virtual
426 Ng et al. JACC Vol. 60, No. 5, 2012Virtual Electrophysiological Study July 31, 2012:423–30
Statistics. The Student’s t test was used to compare theactual and simulated VT cycle lengths. Pearson’s correlationcoefficients were used to correlate VT cycle lengths with LVand infarct volumes. Values of p � 0.05 were consideredstatistically significant.
Results
MRI characteristics. The left ventricularmyocardium, asdetermined by MRI, had volumes ranging from 97.8 to166.2 cm3 (mean 134 � 22 cm3). The left circumflex artery
as occluded in 4 pigs, and the left anterior diagonalescending artery was occluded in 4 pigs. The infarctolumes when considering both infarct cores and gray zonesomposed 4.9% to 17.5% (mean 10 � 4%) of the total LVyocardium volume.lectrophysiological study. Sustained monomorphic VT
ould be induced at least twice in 7 of the 8 pigs duringPS. Six pigs had VTs induced from the LV, whereas VT
n 1 pig was induced from the right ventricle. Two of theigs had 2 different VT circuits. The VTs had a mean cycle
ength of 280 � 51 ms.irtual electrophysiological study. A set of 36 simulations
or each pig required on average 14 � 2 h to complete.able 1 shows the results of VEPS at each of the gray
one/infarct core threshold. Each of the thresholds labeledx” correspond to having VT lasting at least 10 s. Pig 1 hadnducible VT with VEPS but not with actual EPS, whereasig 7 had inducible VT with actual EPS but not withEPS. There was no significant difference between theean cycle lengths of the actual VT and the virtual VT
280 � 51 ms vs. 263 � 61 ms; p � 0.58). The comparisonf cycle lengths for each pig is shown in Table 2. Repeatinghe VEPS on the 8 heart models with the assumption of noray zone (all infarct core) and no gray zone or infarct coreesulted in no VT.
Simulated VT was induced via a common mechanism forll episodes, as illustrated in the 3D membrane potentialaps shown in Figure 3. The 3D maps show the simulatedembrane potentials of the LV epicardial surface with blue
reas representing resting tissue and red areas representingepolarized tissue. The gray regions are scar. The first paced
Inducibility With EPS and VEPS at Different GraTable 1 Inducibility With EPS and VEPS at D
Pig # Inducible With EPS? 10% 15% 2
1 No
2 Yes
3 Yes x
4 Yes x
5 Yes
6 Yes
7 Yes
8 Yes
x � inducibility with VEPS; EPS � electrophysiological study; VEPS �
eat, located outside but near the infarct area, at time 0
ropagates through both the normal and gray zone regionsf the left ventricle. The second beat at time 400 ms alsoropagates through both the normal and gray zone areas.he second beat in normal areas have action potentialurations of 197 ms, whereas the second beat in the grayones have action potential durations of 236 ms. The thirdeat at 610 ms propagates through the normal region butlocks at a scar isthmus due to the longer refractory periodf the gray zone in the isthmus. The wavefront thenropagates around the infarct area to the other side, athich point the gray zone is repolarized and the wavefront
s able to re-enter. VT then follows.EPS versus EPS. Six pigs had VT induced with bothEPS and actual EPS. Figure 4 shows the comparison of
he endocardial membrane potential maps obtained by VEPSnd the corresponding noncontact unipolar voltage mapsbtained during EPS for the 4 pigs where good agreement inhe scar exit sites were seen. Complete agreement of the VTircuits and scar exit sites was seen in pigs #3, #5, and #6. Inig #8, 2 exit sites were seen in the simulated VT circuit, 1f which appears to match the exit site of the actual VT.igure 5 shows the results for 2 pigs where the VT exit sitesid not match. However, examination of the VT circuitsevealed that activation propagated in opposite directions inhe simulated versus actual VTs with reversed entrance andxits sites; this suggests that a similar isthmus may beupporting both the simulated and actual VT.
e Threshold Levelsent Gray Zone Threshold Levels
ay Zone/Infarct Core Threshold
25% 30% 35% 40% 45% 50%
x x x x
x
x x
x x
x
electrophysiological study.
Comparison of Actual and Virtual VT Cycle LengthsTable 2 Comparison of Actual and Virtual VT Cycle Lengths
Pig #
VT Cycle Lengths, ms
Actual Virtual
1 None 234
2 306 214
3 370 390
4 270 226
5 237 236
6 291 255
7 270 None
8 213 286
y Zoniffer
Gr
0%
VT � ventricular tachycardia.
0
427JACC Vol. 60, No. 5, 2012 Ng et al.July 31, 2012:423–30 Virtual Electrophysiological Study
Correlation of VT cycle lengths with LV and infarctsizes. Table 3 shows the correlation coefficients ofactual and simulated VT cycles lengths versus the leftventricular, infarct core, gray zone, and combined infarctcore and gray zone volumes. The actual VT cycle lengths
Figure 3 Illustration of Arrhythmia Induction
The membrane potential maps illustrate simulated arrhythmia induction. The first400 ms later also propagates through both healthy and scar regions with the scarthrough the normal regions but blocks at the initial contact with the scar (E and F
Figure 4 Simulated and Actual VT Circuits With Good Agreeme
The membrane potential maps of simulated ventricular tachycardia (VT) from 4 pigand activation directions when compared with noncontact maps of the actual VT.
were not significantly correlated with any of the volumemeasurements. However, the simulated VT cycle lengthswere significantly correlated with LV volume (r �0.79, p � 0.04) and infarct core volume (r � 0.90, p �
.007).
ropagates through both healthy and scar regions (A and B). The second beattaking longer to repolarize (C and D). The third beat 210 ms later propagates
ntry around the scar is now initiated (G and H).
shown to have good agreement in infarct exit sites
beat pregion
). Re-e
nt
s are
428 Ng et al. JACC Vol. 60, No. 5, 2012Virtual Electrophysiological Study July 31, 2012:423–30
Discussion
This study demonstrates the feasibility of applying a math-ematical model of the action potential to simulate conduc-tion and predict VT circuits in an individualized model ofthe LV generated in vivo using contrast-enhanced MRI forthe purpose of scar characterization. Virtual EPS resultswere similar to those obtained by actual EPS in 6 of 8 pigs.Virtual EPS may be useful for evaluating VT circuits tobetter plan approaches to catheter ablation and could beevaluated for its ability to predict future VT events inpatients with MI and no history of VT.MRI to predict VT. A combination of structural (24–28)and electrophysiological (23,29) remodeling resulting fromMI contribute to susceptibility to VT. For structural remod-eling to provide a sufficient substrate for VT, a combinationof infarct core and peri-infarct regions is needed. Theinfarct core provides the anatomic boundary needed forsustained reentry. Infarct size/mass quantification by MRIhave been shown to predict EPS-induced (9) and clinical(10,11,15) VT. The peri-infarct zones are damaged butviable regions of myocardium which contribute to VTthrough slowing of conduction and unidirectional block dueto altered refractory periods. The peri-infarct zones are
Figure 5 Simulated and Actual VT Circuits With Reversed Direc
The membrane potential maps of simulated ventricular tachycardia (VT) from 2 pigwhen compared with noncontact maps of the actual VT. However, the reversal of tentry for both the simulated and actual VT circuits.
Correlation Between VT Cycle Lengthsand MRI CharacteristicsTable 3 Correlation Between VT Cycle Lengthsand MRI Characteristics
Volume
Actual VTCycle Length
Simulated VTCycle Length
r p Value r p Value
LV 0.25 0.58 0.79 0.04
Infarct core 0.52 0.28 0.90 0.007
Gray zone 0.15 0.78 0.03 0.95
Infarct core �
gray zone0.2 0.67 0.56 0.19
LV � left ventricular; MRI � magnetic resonance imaging; VT � ventricular tachycardia.
characterized by gray zones in the MRI—intermediateintensities between the darker normal myocardium and theenhanced infarct core. Quantification of MRI gray zoneshas been used to predict both EPS-induced (14) and clinical(12,13) VT.
In addition to the volume of infarct core and gray zones,there are morphological factors of both that appear to playa significant role in the inducibility of VT (30). Channelisthmuses within the infarct are known to facilitate VT andhave been targeted for ablation. Perez-David et al. (31)showed that these isthmuses can be detected by MRI andthat patients with sustained monomorphic VT were morelikely to have MRI-detected isthmuses than patients withsimilar ejection fractions without VT. The transmurality ofthe infarct is another important feature because VT circuitslikely require both endocardial and epicardial boundaries tosupport reentry. Boyé et al. (15) showed that relative infarcttransmurality measured from the MRI was an independentpredictor of clinical VT events.
Although the size and morphological characteristics ofthe infarct mentioned likely all play a critical role in VT,their relative contributions are not easily quantified. Forexample, a larger infarct volume with a shorter isthmuslength may be equally arrhythmogenic as a smaller infarctwith a longer channel. The proposed VEPS system takes allof these factors into account in the prediction of VT circuits.Although electrophysiological information cannot be ob-tained from the MRI, it is known that refractory periodgradients across the normal myocardium and peri-infarctzones are needed for the VT induction process. Thus, ourmodel assumes higher refractory periods in the MRI grayzones to allow realistic induction of VT with simulatedprogrammed stimulation.Other computer models of VT. Vigmond et al. (32)
shown to not have good agreement in infarct exit sites and activation directionsentrance and exit sites suggests that a similar isthmus may be supporting re-
tions
s arehe VT
demonstrated simulated VT in a computer model created
1
1
1
1
1
429JACC Vol. 60, No. 5, 2012 Ng et al.July 31, 2012:423–30 Virtual Electrophysiological Study
using high-resolution MRI of a canine ventricle imaged exvivo 4 weeks after MI. This model incorporated fiberorientation with diffusion tensor imaging and a simulatedHis-Purkinje network, while also characterizing nonviableinfarct areas and the viable border zones. Pop et al. (33)showed in a pig with induced MI that computer simulationbased on ex vivo diffusion tensor MRI could predict the VTcircuit obtained with actual EPS. In another study, Serme-sant et al. (34) demonstrated the feasibility of an electro-mechanical model of the infarct ventricle registered to fitclinical data from MRI and x-ray, as well as actual cardiacelectrical activity.
The present study is the first to demonstrate the possi-bility of computer simulation of VT with in vivo MRI usingclinically available sequences. In contrast to the previouslypublished study using MRI, certain details such as fiberorientation cannot be obtained due to lower spatial resolu-tion. In the development of our model, we therefore focusedthe model on the key elements of VT that can be obtainedby clinical MRI, namely, the infarct core and gray zonecharacteristics. Even with the omission of the right ventri-cle, fiber orientation, and the His-Purkinje system, wedemonstrated the VT circuits can be predicted in our VEPSsystem. The simple model also makes simulation practicalon commercial workstations rather than requiring a sophis-ticated computer cluster. Further study is needed to testwhether more realistic ventricular modeling is necessary forthe prediction of VT induction.Study limitations. A limitation of the study is the smallsample size. Spatial resolution of the current images wasapproximately 2 mm in all 3 dimensions. This may beinadequate to delineate some VT circuits. However, imageresolution is likely to improve with time and advances inMRI technology. Defining the gray zone is challenging, andthere are no well-accepted criteria for this. Our study foundthat there was not a consistent threshold value that allowedinducible VT with simulation for all the pigs. Differences insignal-to-noise ratio may in part account for the differencesin threshold. Better delineation of this region will also likelyimprove the performance of VEPS. Further work to developand evaluate an algorithm for accurate tissue classificationfrom MRI data is an important future study that will requirelarge numbers of subjects. Clearly, further development andtesting will be required to establish the utility of VEPS inhumans.Potential clinical implications. Computer modeling ofthe heart has generally been confined to research applica-tions. This pilot study suggests that contrast-enhanced MRIfor VEPS could have several potential applications to helpidentify VT circuits before catheter ablation and potentiallyas a platform for risk stratification for SCD. The techniqueis noninvasive, avoiding the risks and time required for thesedation and catheterization needed for standard electro-physiology testing. In addition, VEPS could allow detailedcharacterization of the induced arrhythmia that would
otherwise only be possible with high-resolution mapping.
Ablation strategies could be planned with this information.Further evaluation and development of this technology willbe necessary to assess its utility in the clinical setting.
AcknowledgmentsThe authors thank Kathleen Harris and Brandon Benefieldfor their assistance with this study.
Reprint requests and correspondence: Dr. Jeffrey J. Goldberger,Division of Cardiac Electrophysiology, Northwestern UniversityFeinberg School of Medicine, 251 East Huron, Feinberg Pavilion,Suite 8-503, Chicago, Illinois 60611. E-mail: [email protected].
REFERENCES
1. State-specific mortality from sudden cardiac death–United States,1999 by the Centers for Disease Control and Prevention. MMWRMorb Mortal Wkly Rep 2002;51:123–6.
2. Goldberger JJ, Cain ME, Hohnloser SH, et al. American HeartAssociation/American College of Cardiology Foundation/HeartRhythm Society scientific statement on noninvasive risk stratificationtechniques for identifying patients at risk for sudden cardiac death: ascientific statement from the American Heart Association Council onClinical Cardiology Committee on Electrocardiography and Arrhyth-mias and Council on Epidemiology and Prevention. J Am Coll Cardiol2008;52:1179–99.
3. El-Sherif N, Scherlag BJ, Lazzara R, Hope RR. Re-entrant ventriculararrhythmias in the late myocardial infarction period. 1. Conductioncharacteristics in the infarction zone. Circulation 1977;55:686–702.
4. Kabell G, Scherlag BJ, Hope RR, Lazzara R. Patterns of interectopicactivation recorded during pleomorphic ventricular tachycardia aftermyocardial infarction in the dog. Am J Cardiol 1982;49:56–62.
5. Kaltenbrunner W, Cardinal R, Dubuc M, et al. Epicardial andendocardial mapping of ventricular tachycardia in patients with myo-cardial infarction. Is the origin of the tachycardia always subendocar-dially localized? Circulation 1991;84:1058–71.
6. Downar E, Saito J, Doig JC, et al. Endocardial mapping of ventriculartachycardia in the intact human ventricle. III. Evidence of multiusereentry with spontaneous and induced block in portions of reentrantpath complex. J Am Coll Cardiol 1995;25:1591–600.
7. de Bakker JM, van Capelle FJ, Janse MJ, et al. Reentry as a cause ofventricular tachycardia in patients with chronic ischemic heart disease:electrophysiologic and anatomic correlation. Circulation 1988;77:589–606.
8. Stevenson WG, Khan H, Sager P, et al. Identification of reentrycircuit sites during catheter mapping and radiofrequency ablation ofventricular tachycardia late after myocardial infarction. Circulation1993;88:1647–70.
9. Bello D, Fieno DS, Kim RJ, et al. Infarct morphology identifiespatients with substrate for sustained ventricular tachycardia. J Am CollCardiol 2005;45:1104–8.
0. Bello D, Einhorn A, Kaushal R, et al. Cardiac magnetic resonanceimaging: infarct size is an independent predictor of mortality inpatients with coronary artery disease. Magn Reson Imaging 2011;29:50–6.
1. Bernhardt P, Stiller S, Kottmair E, et al. Myocardial scar extentevaluated by cardiac magnetic resonance imaging in ICD patients:relationship to spontaneous VT during long-term follow-up. IntJ Cardiovasc Imaging 2011;116:1096–104.
2. Yan AT, Shayne AJ, Brown KA, et al. Characterization of theperi-infarct zone by contrast-enhanced cardiac magnetic resonance imag-ing is a powerful predictor of post-myocardial infarction mortality.[see comment]. Circulation 2006;114:32–9.
3. Roes SD, Borleffs CJ, van der Geest RJ, et al. Infarct tissue hetero-geneity assessed with contrast-enhanced MRI predicts spontaneousventricular arrhythmia in patients with ischemic cardiomyopathy andimplantable cardioverter-defibrillator. Circ Cardiovasc Imaging 2009;2:183–90.
4. Schmidt A, Azevedo CF, Cheng A, et al. Infarct tissue heterogeneity
by magnetic resonance imaging identifies enhanced cardiac arrhythmia
430 Ng et al. JACC Vol. 60, No. 5, 2012Virtual Electrophysiological Study July 31, 2012:423–30
susceptibility in patients with left ventricular dysfunction. Circulation2007;115:2006–14.
5. Boyé P, Abdel-Aty H, Zacharzowsky U, et al. Prediction of life-threatening arrhythmic events in patients with chronic myocardialinfarction by contrast-enhanced CMR. J Am Coll Cardiol Img2011;4:871–9.
6. Kim RJ, Fieno DS, Parrish TB, et al. Relationship of MRI delayedcontrast enhancement to irreversible injury, infarct age, and contractilefunction. Circulation 1999;100:1992–2002.
7. Eldar M, Ohad D, Bor A, Varda-Bloom N, Swanson DK, Battler A.A closed-chest pig model of sustained ventricular tachycardia. PacingClin Electrophysiol 1994;17:1603–9.
8. Zuehldorff S. 3D phase sensitive IR prepared spoiled gradient echotechnique with free breathing navigators: a tool for quantitativecharacterization of scar. In: Chung YC, Weale PJ, Jerecic R, editors.Berkeley, CA: Proceedings of the International Society of MagneticResonance in Medicine, 2007:683.
9. Schilling RJ, Peters NS, Davies DW. Simultaneous endocardialmapping in the human left ventricle using a noncontact catheter:comparison of contact and reconstructed electrograms during sinusrhythm. Circulation 1998;98:887–98.
0. Fenton F, Karma A. Vortex dynamics in three-dimensional continu-ous myocardium with fiber rotation: filament instability and fibrilla-tion. Chaos 1998;8:20–47.
1. Rush S, Larsen H. A practical algorithm for solving dynamic mem-brane equations. IEEE Trans Biomed Eng 1978;25:389–92.
2. Oliver RA, Krassowska W. Reproducing cardiac restitution propertiesusing the Fenton-Karma membrane model. Ann Biomed Eng 2005;33:907–11.
3. Myerburg RJ, Epstein K, Gaide MS, et al. Cellular electrophysiologyin acute and healed experimental myocardial infarction. Ann N YAcad Sci 1982;382:90–115.
4. Buxton AE, Lee KL, Fisher JD, Josephson ME, Prystowsky EN,Hafley G. A randomized study of the prevention of sudden death inpatients with coronary artery disease. N Engl J Med 1999;341:1882–90.
5. Bourke J, Young A, Richards D, Uther J. Reduction in incidence ofinducible ventricular tachycardia after myocardial infarction by treat-
ment with streptokinase during infarct evolution. J Am Coll Cardiol1990;16:1703–10.
6. Bolick D, Hackel D, Reimer K, Ideker R. Quantitative analysis ofmyocardial infarct structure in patients with ventricular tachycardia.Circulation 1986;74:1266–79.
7. Jones-Collins B, Patterson R. Quantitative measurement of electricalinstability as a function of myocardial infarct size in the dog. Am JCardiol 1981;48:858–63.
8. Wilber DJ, Lynch JJ, Montgomery D, Lucchesi BR. Postinfarctionsudden death: significance of inducible ventricular tachycardia andinfarct size in a conscious canine model. Am Heart J 1985;109:8–18.
9. Ohara T, Ohara K, Cao JM, et al. Increase wave break duringventricular fibrillation in the epicardial border zone of hearts withhealed myocardial infarction. Circulation 2001;103:1465–72.
0. Ciaccio EJ, Ashikaga H, Kaba RA, et al. Model of reentrantventricular tachycardia based on infarct border zone geometry predictsreentrant circuit features as determined by activation mapping. HeartRhythm 2007;4:1034–45.
1. Perez-David E, Arenal A, Rubio-Guivernau JL, et al. Noninvasiveidentification of ventricular tachycardia-related conducting channelsusing contrast-enhanced magnetic resonance imaging in patients withchronic myocardial infarction: comparison of signal intensity scarmapping and endocardial voltage mapping. J Am Coll Cardiol2011;57:184–94.
2. Vigmond E, Vadakkumpadan F, Gurev V, et al. Toward predictivemodelling of the electrophysiology of the heart. Exp Physiol 2009;94:563–77.
3. Pop M, Sermesant M, Mansi T, et al. Correspondence between simple3-D MRI-based computer models and in-vivo EP measurements inswine with chronic infarctions. IEEE Trans Biomed Eng 2011;58:3483–6.
4. Sermesant M, Rhode K, Sanchez-Ortiz GI, et al. Simulation ofcardiac pathologies using an electromechanical biventricular model andXMR interventional imaging. Med Image Anal 2005;9:467–80.
Key Words: computer-based model y magnetic resonance imaging yyocardial infarction y ventricular tachycardia.
APPENDIX
For supplemental data, please see the online version of this article.