21
Virtual Instrumentation With LabVIEW
| Date post: | 13-Dec-2015 |
| Category: |
Documents |
| Upload: | gervase-townsend |
| View: | 236 times |
| Download: | 2 times |

Virtual Instrumentation With LabVIEW

Front Panel• Controls = Inputs• Indicators = Outputs
Block Diagram• Accompanying “program”
for front panel• Components “wired”
together
LabVIEW Programs Are Called Virtual Instruments (VIs)
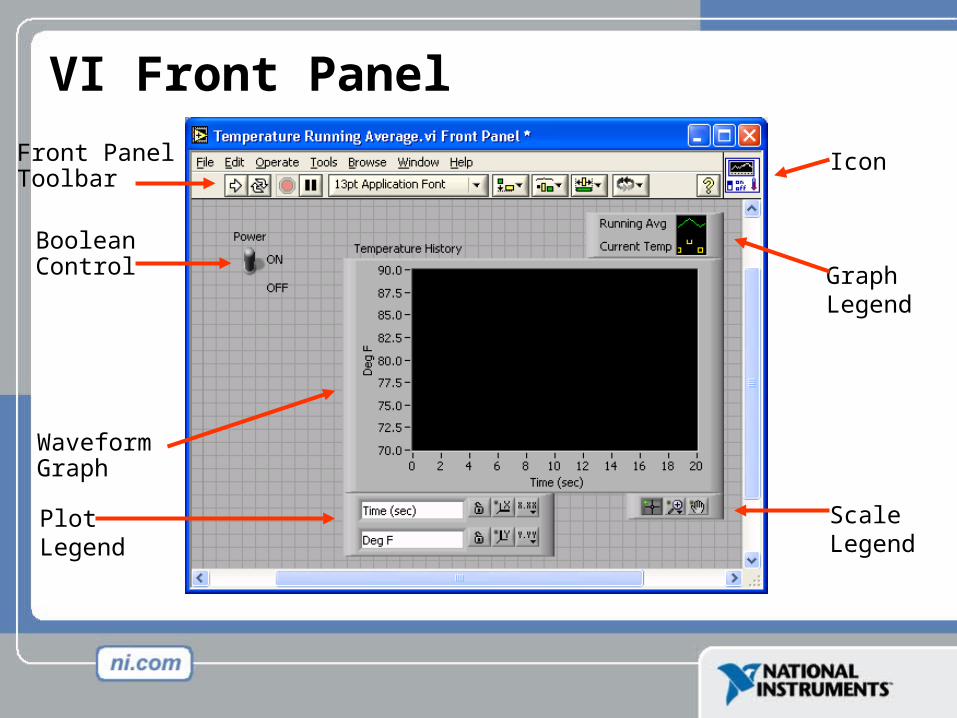
VI Front Panel
Front Panel Toolbar
GraphLegend
BooleanControl
WaveformGraph
Icon
PlotLegend
ScaleLegend

VI Block Diagram
Wire Data
GraphTerminal
SubVI
While LoopStructure
Block Diagram Toolbar Divide
Function
Numeric Constant
Timing Function
Boolean Control Terminal

Controls and Functions Palettes
Controls Palette (Front Panel Window)
Functions Palette (Block Diagram Window)
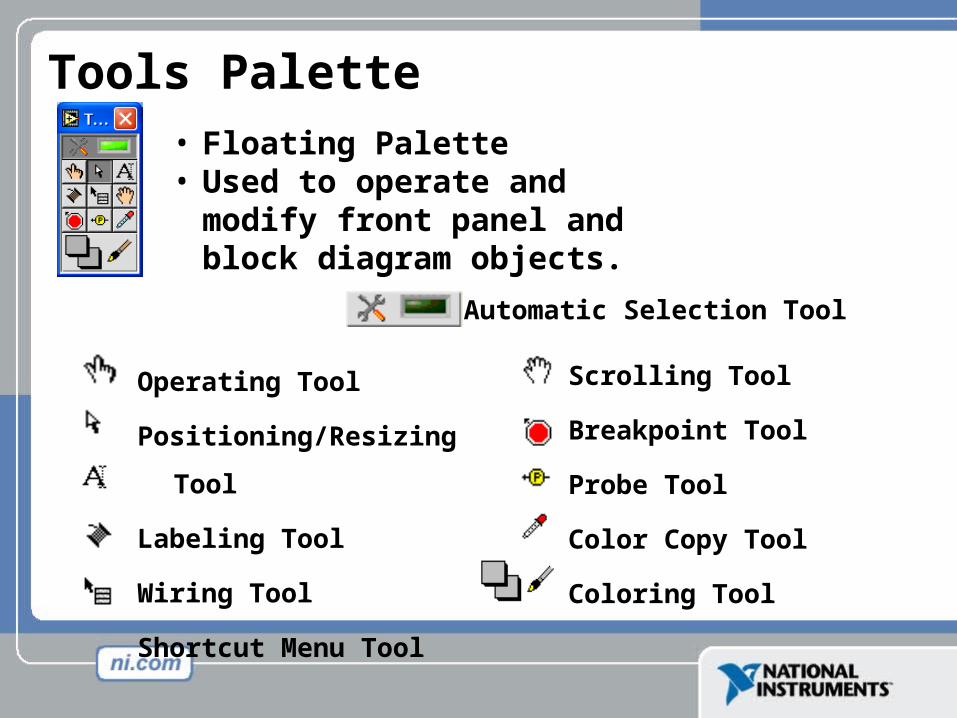
Operating Tool
Positioning/Resizing Tool
Labeling Tool
Wiring Tool
Shortcut Menu Tool
• Floating Palette• Used to operate and modify
front panel and block diagram objects.
Scrolling Tool
Breakpoint Tool
Probe Tool
Color Copy Tool
Coloring Tool
Tools Palette
Automatic Selection Tool
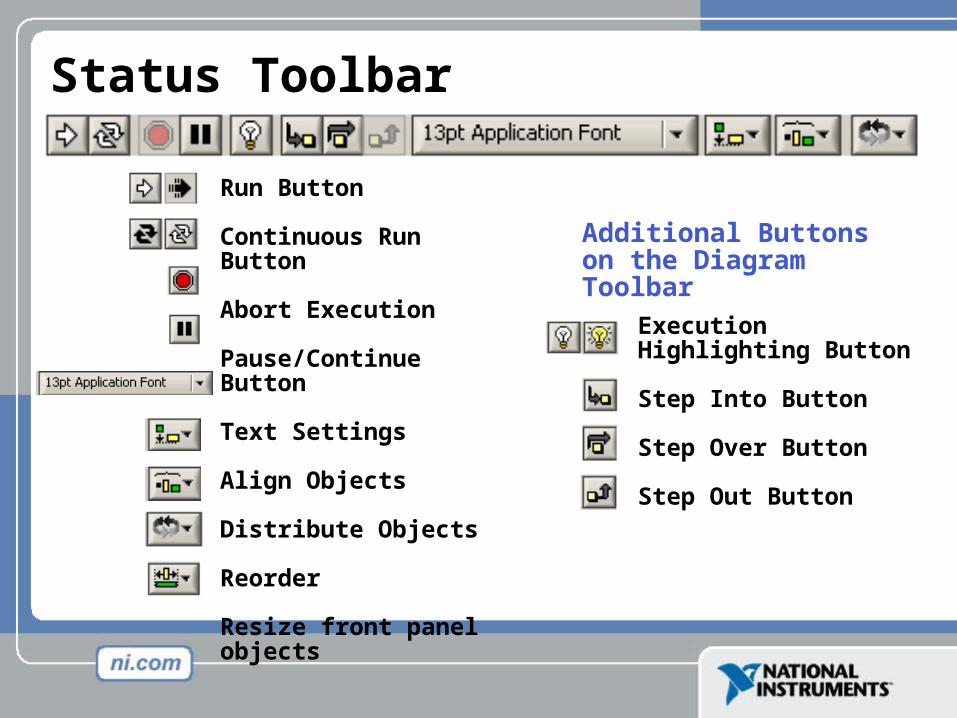
Run Button
Continuous Run Button
Abort Execution
Pause/Continue Button
Text Settings
Align Objects
Distribute Objects
Reorder
Resize front panel objects
Execution Highlighting Button Step Into Button
Step Over Button
Step Out Button
Additional Buttons on the Diagram Toolbar
Status Toolbar
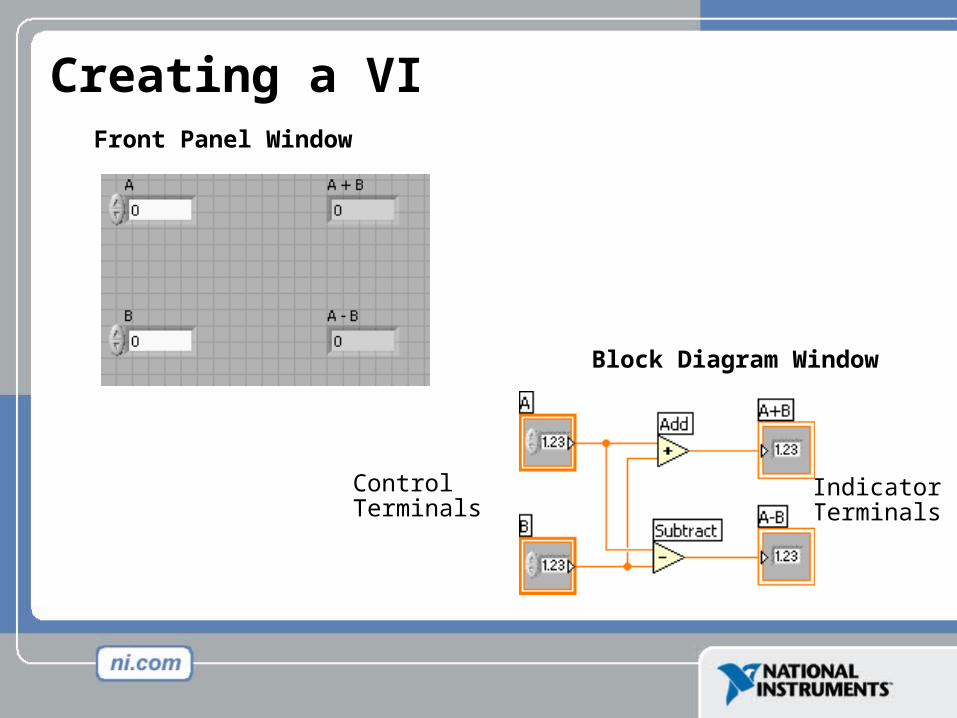
ControlTerminals
Block Diagram Window
Front Panel Window
Indicator Terminals
Creating a VI

Creating a VI – Block Diagram

• Block diagram executes dependent on the flow of data; block diagram does NOT execute left to right
• Node executes when data is available to ALL input terminals
• Nodes supply data to all output terminals when done
Dataflow Programming

Help Options
Context Help• Online help• Lock help• Simple/Complex Diagram help• Ctrl + H
Online reference• All menus online• Pop up on functions in diagram to access online info directly

Debugging Techniques• Finding Errors
• Execution Highlighting
• Probe
Click on broken Run buttonWindow showing error appears
Click on Execution Highlighting button; data flow is animated using bubbles. Values are displayed on wires.
Right-click on wire to display probe and it shows data as it flows through wire segment
You can also select Probe tool from Tools palette and click on wire

SubVIs• A SubVI is a VI that can be used within another VI• Similar to a subroutine• Advantages
– Modular– Easier to debug– Don’t have to recreate code– Require less memory

Icon and Connector
• An icon represents a VI in other block diagrams
• A connector shows available terminals for data transfer
Icon
Connector
Terminals
Tips for Working in LabVIEW
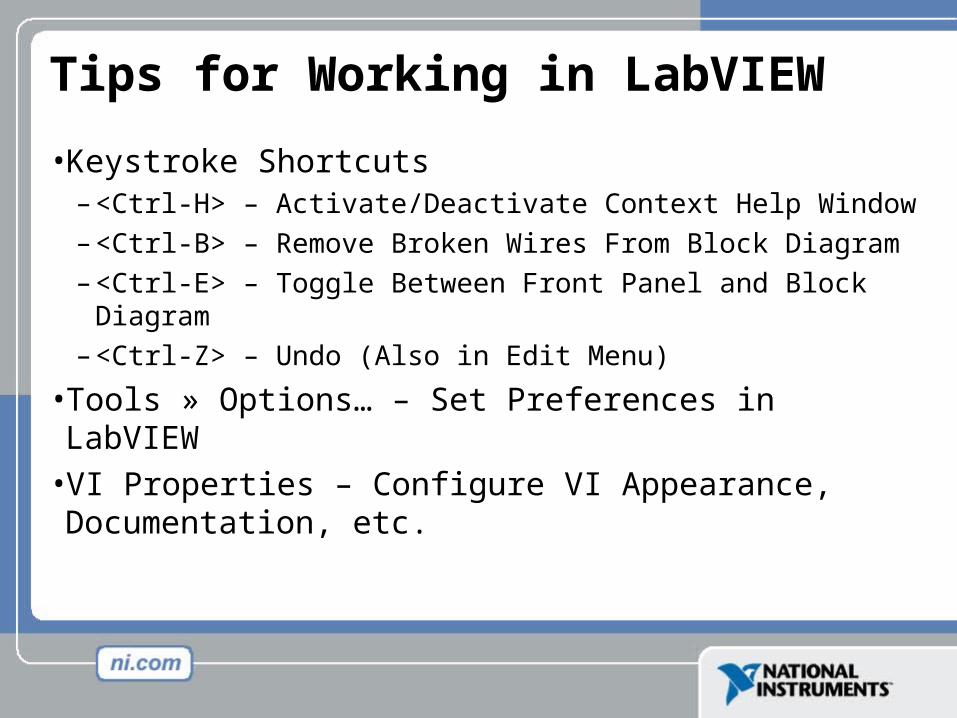
• Keystroke Shortcuts– <Ctrl-H> – Activate/Deactivate Context Help Window– <Ctrl-B> – Remove Broken Wires From Block Diagram– <Ctrl-E> – Toggle Between Front Panel and Block
Diagram– <Ctrl-Z> – Undo (Also in Edit Menu)
• Tools » Options… – Set Preferences in LabVIEW• VI Properties – Configure VI Appearance, Documentation, etc.
Data Acquisition Terminology
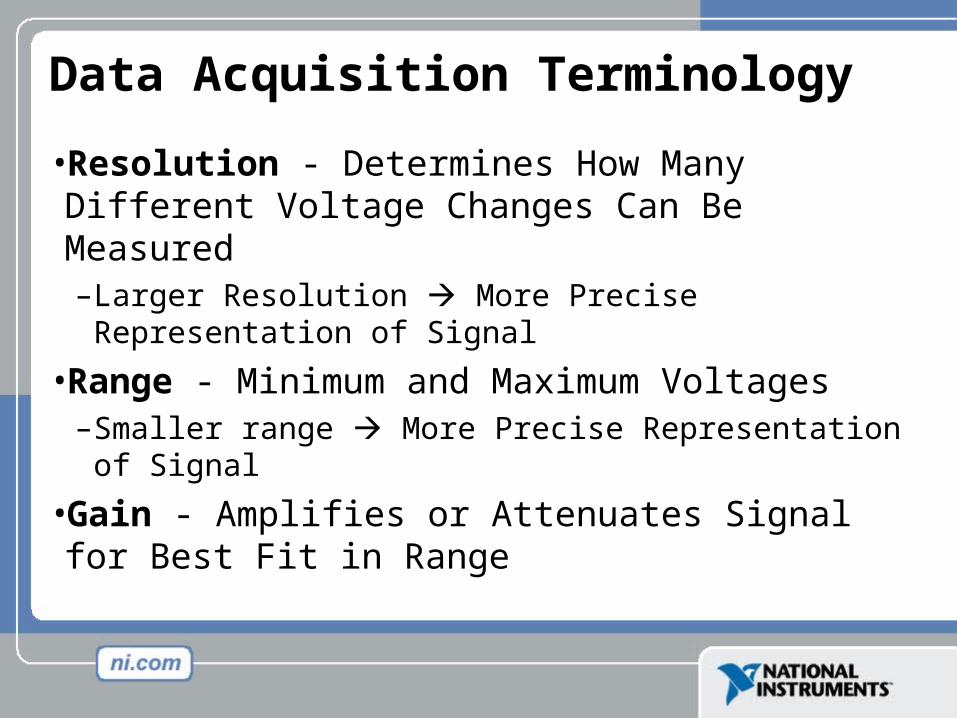
• Resolution - Determines How Many Different Voltage Changes Can Be Measured– Larger Resolution More Precise Representation of Signal
• Range - Minimum and Maximum Voltages– Smaller range More Precise Representation of Signal
• Gain - Amplifies or Attenuates Signal for Best Fit in Range
Loops
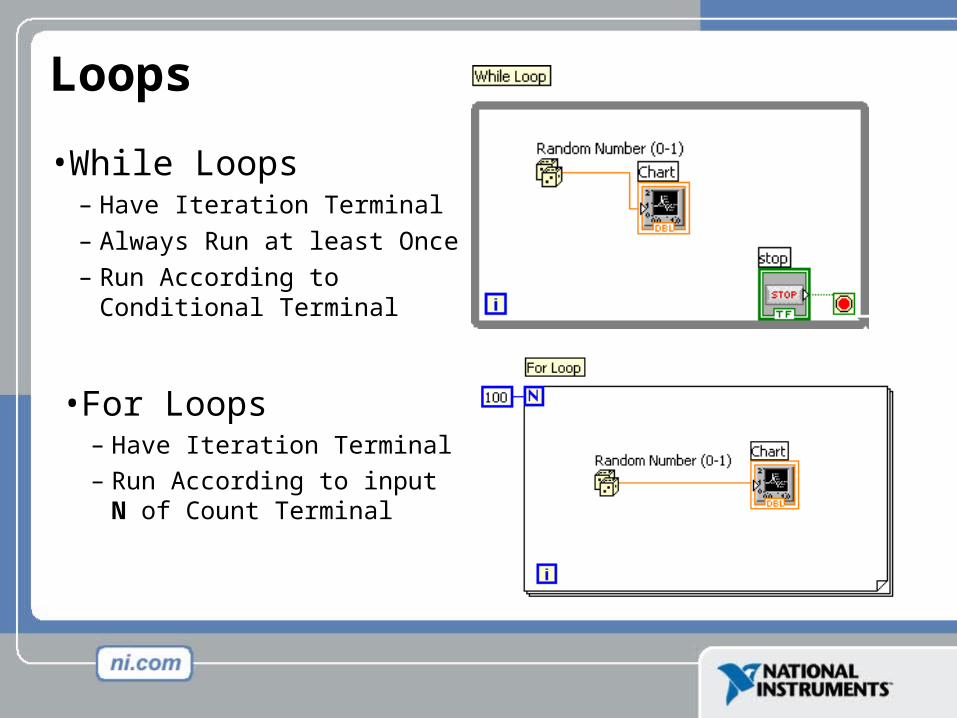
• While Loops– Have Iteration Terminal– Always Run at least Once– Run According to Conditional
Terminal
• For Loops– Have Iteration Terminal– Run According to input N of
Count Terminal
Charts
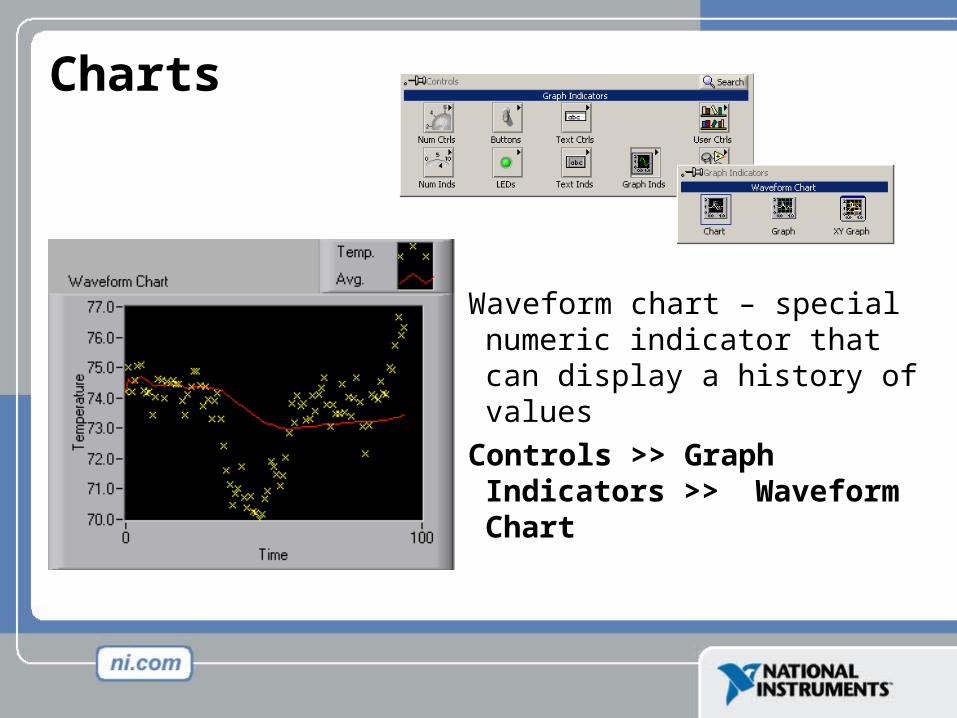
Waveform chart – special numeric indicator that can display a history of values
Controls >> Graph Indicators >> Waveform Chart

File I/O
File I/O – passing data to and from files
- Files can be binary, text, or spreadsheet
- Write/Read LabVIEW Measurements file (*.lvm)
Writing to LVM fileWriting to LVM file Reading from LVM fileReading from LVM file
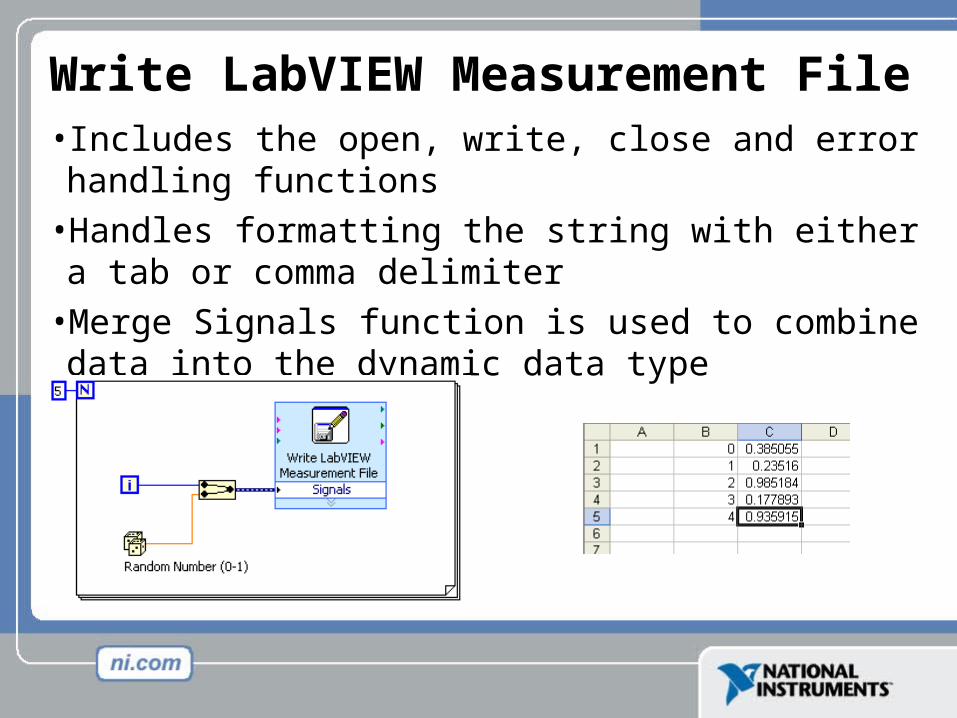
Write LabVIEW Measurement File• Includes the open, write, close and error handling functions • Handles formatting the string with either a tab or comma
delimiter • Merge Signals function is used to combine data into the
dynamic data type
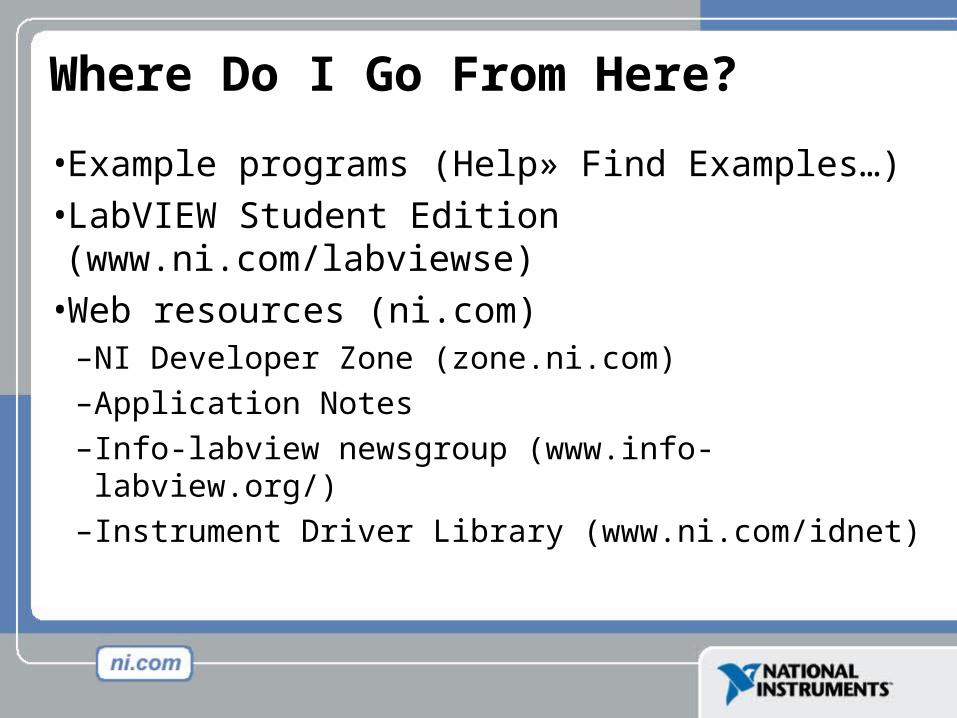
Where Do I Go From Here?
• Example programs (Help» Find Examples…)• LabVIEW Student Edition (www.ni.com/labviewse)• Web resources (ni.com)
– NI Developer Zone (zone.ni.com)– Application Notes – Info-labview newsgroup (www.info-labview.org/)– Instrument Driver Library (www.ni.com/idnet)


