Page 1
© Power Systems Consultants
Virtual Statcom:
Work Package 1 Report
Prepared by Grant McCormick
For Western Power Distribution Ltd (WPD)
Client Reference NIA_WPD_37
PSC Reference JK7261-TR-01 Rev 04
Date 10th April 2019
Page 2
Virtual Statcom WP1 report
JK7261-TR-01-04 WPD Virtual Statcom WP1 report 10/04/19 © Power Systems Consultants i
List of Revisions
Revision Date Description of changes
0A 08/03/2019 First draft issued for PSC internal review
0B 10/03/2019 Second draft issued for PSC internal review
01 10/03/2019 Issue to WPD
01A 27/03/2019 Updated based on WPD comments and issued for PSC internal review
02 31/03/2019 Second Issue to WPD
02A 8/04/2019 Updated based on WPD comments and issued for PSC internal review
03 8/04/2019 Final report issued to WPD
04 10/4/2019 Final report approved by WPD
Revision Date Signatures
Author Peer Review Approved
01 10/03/2019 Grant McCormick
Perry Hofbauer
Zia Emin
Zia Emin
02 31/03/2019 Grant McCormick
Perry Hofbauer
Zia Emin
Zia Emin
03 08/04/2019 Grant McCormick
Zia Emin Zia Emin
04 10/04/2019 Grant McCormick
Zia Emin Zia Emin
Page 3
Virtual Statcom WP1 report
JK7261-TR-01-04 WPD Virtual Statcom WP1 report 10/04/19 © Power Systems Consultants ii
Table of Contents Table of Abbreviations ...................................................................... 1
1 Introduction ................................................................................. 2
2 Scope of Work – Work Package 1 (WP1) .................................. 3
3 Virtual Statcom project background ......................................... 4
3.1 Passive Distribution Networks ............................................................. 4
3.2 Accommodating distribution connected generation ............................. 5
3.2.1 Voltage regulation ................................................................................ 5
3.2.2 Voltage step constraints ...................................................................... 6
3.2.3 Thermal ratings .................................................................................... 7
3.2.4 Fault levels .......................................................................................... 7
3.2.5 Power quality ....................................................................................... 7
3.3 Techniques to increase hosting capacity ............................................. 7
3.4 Virtual Statcom concept ....................................................................... 7
4 Literature review ......................................................................... 8
4.1 Network Hosting Capacity Evaluation .................................................. 8
4.1.1 Per node non-concurrent hosting capacity evaluation ......................... 8
4.1.2 Concurrent hosting capacity evaluation ............................................. 10
4.1.2.1 Iterative scaling method ..................................................................... 10
4.1.2.2 Optimal Power flow method ............................................................... 10
4.1.3 Summary of hosting capacity evaluation and Virtual Statcom approach .......................................................................................................... 11
4.2 Optimisation of network hosting capacity........................................... 12
4.2.1 Optimal reactive power dispatch ........................................................ 12
4.2.2 Optimisation solvers .......................................................................... 13
4.2.3 Summary of network hosting capacity optimisation and Virtual Statcom approach ....................................................................................................... 14
4.3 WPD’s Network Equilibrium project ................................................... 15
4.4 National Grid/UKPN Power Potential project ..................................... 15
5 Validation of Power System models ....................................... 16
5.1 Models/data provided from WPD ....................................................... 16
5.2 Model validation approach ................................................................. 16
5.2.1 Convergence Check .......................................................................... 16
5.2.2 Network summaries ........................................................................... 17
5.2.3 Review Discussion ............................................................................ 18
Page 4
Virtual Statcom WP1 report
JK7261-TR-01-04 WPD Virtual Statcom WP1 report 10/04/19 © Power Systems Consultants iii
6 Network selection methodology .............................................. 19
6.1 Study Zone selection criteria ............................................................. 19
6.2 Networks selected ............................................................................. 19
6.2.1 33kV Networks .................................................................................. 19
6.2.2 11kV Networks .................................................................................. 23
7 Validation of time series data .................................................. 24
7.1 Timeseries data validation approach ................................................. 24
7.1.1 Standard timeseries format ................................................................ 24
7.1.2 Tag rules and calculations ................................................................. 25
7.1.3 Validation of timeseries data with LTDS ............................................ 26
7.1.4 Timeseries data mapping to PSS/E ................................................... 28
8 Network hosting capacity algorithms ..................................... 29
8.1 Generation hosting capacity .............................................................. 29
8.1.1 Overview ............................................................................................ 29
8.1.2 Model Checks .................................................................................... 30
8.1.3 Placement of ‘dummy’ generators ..................................................... 30
8.1.4 Scale ‘dummy’ generation and check for network constraints ........... 30
8.1.5 Calculate network generation hosting capacity .................................. 31
8.2 Load hosting capacity ........................................................................ 32
8.3 Implementing hosting capacity algorithms ......................................... 33
9 Virtual Statcom optimisation ................................................... 34
9.1 P-Q capability of DGs ........................................................................ 34
9.2 Optimisation strategy ......................................................................... 34
9.2.1 Objective function .............................................................................. 34
9.2.2 Control variables ................................................................................ 35
9.2.3 Optimisation constraints .................................................................... 35
9.2.4 Optimisation solver ............................................................................ 35
9.2.5 Particle Swarm Optimisation (PSO) overview .................................... 36
9.3 Virtual Statcom algorithm overview ................................................... 36
9.3.1 Model Checks & Pre-optimisation network capacity .......................... 37
9.3.2 Allocate PQ capabilities ..................................................................... 37
9.3.3 Initialise Optimisation ......................................................................... 38
9.3.4 Perform Optimisation ......................................................................... 39
9.3.5 Post-optimisation network capacity ................................................... 39
9.4 Implementation of the Virtual Statcom algorithm ............................... 39
Page 5
Virtual Statcom WP1 report
JK7261-TR-01-04 WPD Virtual Statcom WP1 report 10/04/19 © Power Systems Consultants iv
References ....................................................................................... 40
Appendix A – BSP and Primary network summaries ................... A1
Appendix B – Tag rules for timeseries data .................................. B1
Appendix C – Timeseries data validation plots ............................ C1
Appendix D – Timeseries data mapping to PSS/E ........................ D1
Appendix E – Tiverton Moorhayes 11kV PSS/E SLD .................... E1
Page 6
Virtual Statcom WP1 report
JK7261-TR-01-04 WPD Virtual Statcom WP1 report 10/04/2019 © Power Systems Consultants 1
Table of Abbreviations
Abbreviation Term
DG Distributed Generator
FPL Flexible Power link
LTDS Long Term Development Statement (Nov 2018)
MW Megawatts, unit for real power
MVAr Mega Volt-Amps reactive, unit for real power
NIA Network Innovation Allowance
NOP Normally open point
OPF Optimal power flow
ORPD Optimal reactive power dispatch
p.u Per unit
pf Power Factor
PSC Power Systems Consultants UK Ltd
PSS/E Power System Simulator for Engineering
Python A high-level, general-purpose programming language
RPF Reverse power flow
Statcom Static Synchronous Compensator
UKPN United Kingdom Power Networks
VBA Visual basic for Applications
WP Work Package
WPD Western Power Distribution
Page 7
Virtual Statcom WP1 report
JK7261-TR-01-04 WPD Virtual Statcom WP1 report 10/04/2019 © Power Systems Consultants 2
1 Introduction
Western Power Distribution (WPD) has engaged PSC UK LTD to deliver an innovation project
known as the Virtual Statcom project, the project is being run by WPD and funded under the
Ofgem Network Innovation Allowance (NIA).
As an increasing number of distributed generators (DGs) connect to distribution networks,
technical constraints arise that can limit the total amount of generation a network can host. To
overcome the technical constraints associated with distributed generators and continue to
operate a safe, secure and reliable network, WPD undertake traditional network
reinforcements as well as initiating and leading innovation projects to develop new solutions.
A key focus of innovation projects is to increase the utilisation of existing assets to defer
network reinforcements, the Virtual Statcom project fits in this category of project.
The objective of the Virtual Statcom project is to determine the technical feasibility of
increasing the network hosting capacity, for both generation and load, through implementing
an algorithm to control and coordinate the reactive power output of existing generators in the
distribution network.
If the project demonstrates benefit it will enable more generation and load to be connected to
distribution network without the need for network reinforcement.
The project is structured into the following 5 work packages (WP):
• WP1 - Data gathering/validation and study zone selection.
• WP2 - Power flow simulations & Virtual Statcom algorithm.
• WP3 - Graphical User Interface.
• WP4 - Time series comparison studies.
• WP5 - Virtual Statcom feasibility study reporting.
The work packages are being delivered in order.
This report details the work completed in delivering Work Package 1.
Page 8
Virtual Statcom WP1 report
JK7261-TR-01-04 WPD Virtual Statcom WP1 report 10/04/2019 © Power Systems Consultants 3
2 Scope of Work – Work Package 1 (WP1)
The scope of WP1 includes all the preparatory work required before commencing the detailed
power system studies and the development of the hosting capacity evaluation and optimisation
algorithms in Work Package 2. The scope of work for WP1 as set out in the Project
Collaboration agreement [1] between PSC and WPD is as follows:
D1-1 Validation of modelling data.
The data that must be validated includes but is not limited to the Power System Simulator for
Engineers (PSS/E) power flow models in the selected zones (PSS/E saved cases and single
line diagram), time series data, etc.
D1-2 Selection of substation networks to be studied.
Four networks will be selected. The selected networks will cover the substation and all of the
feeders it feeds, down to the Normal Open Points (NOPs).
D1-3 Literature review on optimisation algorithms for network capacity optimisation.
This involves researching the already developed optimisation algorithms that optimise the
network capacity through reactive power control in the network.
D1-4 Specification of the first version of the methodology that will be implemented to
evaluate the network capacity.
The specification will include a flowchart demonstrating the methodology and a written
explanation of how the methodology works. This methodology needs to be able to quantify
how much is the load capacity and how much is the generation capacity of the network in
Megawatts (MWs). It must be able to evaluate the network capacity in any network under any
conditions.
D1-5 Specification of the first version of the optimisation algorithm that will be
implemented to optimise the network capacity.
The specification will include a flowchart demonstrating the algorithm operation and a written
explanation of how the algorithm works. The algorithm must be able to adjust the reactive
power output (or other generator parameters if required) of generators in the most optimal way
such that the capacity of the network increases compared to the existing network capacity.
The algorithm must be able to work on any network and under any operating conditions.
D1-6 Work Package 1 Report.
This report will be documenting all the work completed for all deliverables of Work Package 1.
Page 9
Virtual Statcom WP1 report
JK7261-TR-01-04 WPD Virtual Statcom WP1 report 10/04/2019 © Power Systems Consultants 4
3 Virtual Statcom project background
3.1 Passive Distribution Networks
The design of traditional distribution networks was based on a top down passive approach. In
these traditional distribution systems, the primary function was to transfer power from the
transmission system level Grid Supply Points (GSPs) to the Bulk Supply Points (BSPs) and
onwards to primary substations and the end consumers of electricity. A key characteristic of
passive distribution networks was that power flows were always considered in a single
direction, notably from a higher voltage sources towards lower voltage loads.
Transmisson Level 275/400 kV
Grid Supply Point (GSP)
132 kV
Bulk Supply Point (BSP)
33 kV
Primary Substations
11 kV
Distribution Network
Figure 1 - Distribution Network layout
Page 10
Virtual Statcom WP1 report
JK7261-TR-01-04 WPD Virtual Statcom WP1 report 10/04/2019 © Power Systems Consultants 5
3.2 Accommodating distribution connected generation
The past 10-20 years has seen an increase in generators connected to distribution networks,
known as Distributed Generators (DGs). In WPD’s South West network DGs predominantly
consist of renewable generation (i.e. wind, solar) connected at 33kV and 11kV voltage levels.
The increase of DGs changes the key characteristic of passive distribution networks. Power
will now flow in either direction and is dictated by changing loads and generation which can
be intermittent in nature.
The uptake of DGs provides benefits of low carbon energy. Initially, it can also help relieve
network thermal constraints by supplying power closer to the load centres. This can therefore
reduce loadings on upstream lines, cables and transformers. However, distribution networks
cannot accommodate ever increasing connections of DGs. Aside from the practical
considerations such as land availability and favourable sites for wind or solar irradiance,
technical factors will constrain the total amount of DGs that can be connected.
A terminology used to quantify how much generation a network can accommodate is “hosting
capacity” [2] [3]. The Hosting Capacity of a network is defined as the total amount of
distributed generation that the network can accommodate without violating predefined
operational, physical and statutory limits.
The technical factors that can constrain the hosting capacity of a network include:
• Voltage regulation
• Voltage step constraints
• Thermal ratings
• Fault levels
• Power quality
The impact of these technical factors on hosting capacity is briefly explained in this section.
3.2.1 Voltage regulation
The statutory voltage limits for distribution networks in the UK are set in the Electricity Safety,
Quality and Continuity Regulations 2002 and are +/- 6% of the nominal voltage at 11kV and
33kV. These statutory voltage limits will be incorporated in to the Virtual Statcom project.
The traditional method of voltage regulation in passive distribution networks is to increase the
bus voltage at BSPs and primary substations above the 33kV and 11 kV nominal ratings to
account for the voltage drop along the distributions feeders and ensure that far end of feeders
are within the statutory limits. However, the situation changes if DGs are connected along the
feeders or at the end of feeder. The connection of DGs can lead to voltage rise issues. This
is due to the voltage at the point of connection of a DG being proportional to the real and
reactive power of DG and load [4]. For combinations of load and generation, when load is
less than generation a voltage rise takes places at the DGs point of connection. With traditional
voltage regulation and DG, bus voltages along the feeder can exceed the +6% statutory
voltage limit. It is for this reason that DGs are typically required to operate with a leading
power factor (importing reactive power) to counter this voltage rise.
The voltage head room on a feeder limits the size of individual DGs and therefore the hosting
capacity for the network. The voltage head room on a feeder is defined as the difference
Page 11
Virtual Statcom WP1 report
JK7261-TR-01-04 WPD Virtual Statcom WP1 report 10/04/2019 © Power Systems Consultants 6
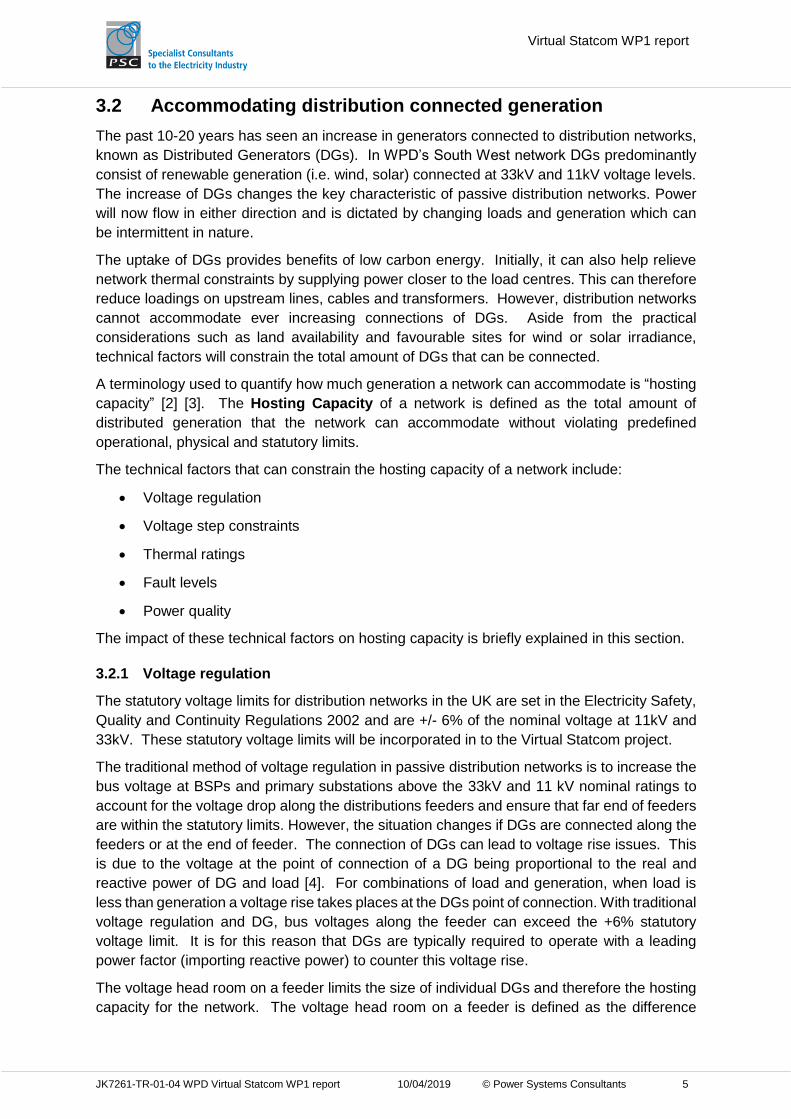
between the upper statutory voltage limit and the bus voltage at a given bus. To illustrate
voltage head room, consider the following two bus example where:
• The bus voltage at the BSP is fixed at 1.0 p.u.
• The reactive power of the load and generator are ignored.
• 3 arbitrary scenarios are considered:
o When the real power of the generator is less than the load. (Pg < Pd)
o When the real power of the generator is equal to the load. (Pg = Pd)
o When the real power of the generator is greater than the load. (Pg > Pd)
External Network
BSP Bus 1
Pg = Pd
Pg < Pd
Pg > Pd
1.00 p.u
1.06 p.u
0.94 p.u
Pd
Length along feeder
Voltage Head room
Pg
Voltage
Figure 2 - Voltage head room
Figure 2 demonstrates that as the amount to real power from the generator (Pg) increases the
voltage head room decreases.
3.2.2 Voltage step constraints
The hosting capacity may also be constrained by voltage step constraints. The voltage step
constraints for distribution networks in the UK are set in the Distribution Planning and
Connection Code and Engineering Recommendation P28. The voltage step constraints are
+/- 3% for frequently occurring events. The tripping of a DG can cause voltage steps in either
direction depending on the size of the DG and system conditions, this can also limit the size
of DG on a feeder and hence hosting capacity. These voltage step constraints will be
incorporated in to the Virtual Statcom project.
Page 12
Virtual Statcom WP1 report
JK7261-TR-01-04 WPD Virtual Statcom WP1 report 10/04/2019 © Power Systems Consultants 7
3.2.3 Thermal ratings
The installation of DGs in networks can be beneficial and can reduce the loading of lines,
cables and transformers. However, as the total distributed generation installed increases,
reverse power flows arise which can exceed the thermal ratings of connected equipment.
Therefore, the hosting capacity can be limited by the thermal ratings of equipment. Further to
this, some equipment such as transformer tap changers and circuit breakers have lower
ratings under reverse power conditions limiting the hosting capacity even further.
3.2.4 Fault levels
A distribution system is designed to safely handle a certain level of short circuit current. In
passive distribution networks the short circuit current infeed was assumed to come from the
upstream network. However, by adding distributed generation, this condition changes as the
distributed generators will also contribute fault current. This can lead to the short circuit
capacity of the distribution network being exceeded thus limiting the hosting capacity. Specific
issues associated with fault levels are not part of the scope of this project and therefore will
not be considered any further in the Virtual Statcom Project.
3.2.5 Power quality
By increasing DG connections, there is the potential to affect voltage and current quality in the
grid. The proliferation of power electronic based devices is expected to introduce impacts
including: harmonic distortion (both characteristic and low order non-characteristic); rapid
voltage changes; unbalance due to single phase connections; and long-term voltage variation
and transients due to the connection and disconnection of various DG sources. Specific issues
associated with power quality are not part of the scope of this project and therefore will not be
considered any further in the Virtual Statcom Project.
3.3 Techniques to increase hosting capacity
The traditional means to increase hosting capacity is to undertake network reinforcements -
this can be costly and time consuming. Alternative means to increase hosting capacity
include:
• Voltage control schemes to control transformer set points and switched capacitors.
• Reactive power or power factor regulation.
It is worth nothing that non-firm connections that require active power curtailment under certain
system conditions which are becoming more prevalent in distribution networks, increase the
total installed generation however, do not increase a network’s hosting capacity.
3.4 Virtual Statcom concept
The existing DGs connected to WPD’s BSPs and primary networks operate with a fixed power
factor between unity and 0.95 leading (import reactive power). While this is appropriate for
the extreme case of maximum generation and minimum load this fixed power factor may not
be appropriate for all network conditions. This is the fundamental concern that the Virtual
Statcom project aims to investigate. The concept of the Virtual Statcom is to assume that
instead of operating with fixed power factor, the DGs can operate across a power factor range
by optimising the reactive power output of DGs in a network for different conditions, the hosting
capacity can be increased.
Page 13
Virtual Statcom WP1 report
JK7261-TR-01-04 WPD Virtual Statcom WP1 report 10/04/2019 © Power Systems Consultants 8
4 Literature review
As part of WP1, PSC undertook a literature review of existing academic journal papers and
innovation projects in order to capture the existing academic and industry knowledge on the
subject.
The academic journal papers that were reviewed focused on:
• Network hosting capacity evaluation methods.
• Optimisation of network hosting capacity.
The innovation projects that were reviewed were:
• WPD’s Network Equilibrium project.
• UKPN/National Grid Power Potential project.
The findings of the literature review are presented in this section.
4.1 Network Hosting Capacity Evaluation
Two approaches for evaluating the network hosting capacity were found from the literature:
• Per node non-concurrent hosting capacity [2] [5]
• Concurrent hosting capacity [6] [3] [7] [8] [9]
4.1.1 Per node non-concurrent hosting capacity evaluation
The per-node non-concurrent approach evaluates the hosting capacity at each node (bus) in
the network independent of surrounding nodes. It does this by placing generation (or load) at
a node and iteratively increasing the generation (or load), calculating load flows and checking
for voltage or thermal excursions. The following flow chart in Figure 3 is of the method
presented in [2] and graphical results from [5]:
Page 14
Virtual Statcom WP1 report
JK7261-TR-01-04 WPD Virtual Statcom WP1 report 10/04/2019 © Power Systems Consultants 9
Figure 3 - per-node non-concurrent process and visual results
The metric “mean per-node non-concurrent hosting capacity” is presented in [2] as a method
to determine the merit of various techniques to increase network hosting capacity. In [2] it is
used to compare back-to-back convertor links in distribution networks for capacity.
The benefits of the per-node non-concurrent method are:
• Computationally simple to implement.
• Effective tool for initial site selection for DG.
• Effective way to visualise capacity.
The per-node non-concurrent approach in the context of the Virtual Statcom project would not
be effective as this project is not focused on a per-node analysis at this time.
Page 15
Virtual Statcom WP1 report
JK7261-TR-01-04 WPD Virtual Statcom WP1 report 10/04/2019 © Power Systems Consultants 10
4.1.2 Concurrent hosting capacity evaluation
Concurrent hosting capacity, unlike per node non-concurrent hosting capacity, is a measure
of the total generation (or load) that can be connected to a network without violating
operational, physical and statutory limits for a given scenario of load and generation.
Two methods of evaluating concurrent hosting capacity were discovered in the literature
review, one method is based on an iterative scaling approach similar to that presented in 4.1.1
[6, 3] and the other method is based on an Optimal Power Flow (OPF) approach [7, 8, 9, 10]
4.1.2.1 Iterative scaling method
The iterative approach for concurrent hosting capacity presented in [6] and [3] differ slightly
but both are based on scaling generation until a network limit is violated. The method
presented in [6] is calculated by scaling existing DGs in the network whereas the approach
presented in [3] places a new generator at every bus to be scaled. The method presented
in [6] takes and extra step and performs a per feeder approach to scaling generation,
according to the following logic.
1. Scale all existing generation until a voltage constraint or thermal constraint is found
in the network analysed.
2. Check if there are any feeders with no constraints.
3. Continue scaling the feeders with no constraints.
4. Stop scaling once all feeders have constraints.
The author of [6] states this ensures that the network generation hosting capacity is not
underestimated. However, if a feeder doesn’t have an existing generator the hosting
capacity of the feeder is not included, so in some cases there is the potential to slightly
underestimate the hosting capacity.
The benefit of a concurrent iterative method is computational simplicity. This approach
also matches the definition of hosting capacity which has been selected for the Virtual
Statcom project. Concurrent hosting capacity defines the potential total hosting capacity
that can be connected to the network at the same time, so this is a good metric to use to
test methods of improving hosting capacity. This method could also easily be extended to
evaluate the hosting capacity with fault level and voltage step considerations.
4.1.2.2 Optimal Power flow method
The methods presented in [7, 8] to evaluate the network capacity are based on formulating
and solving an Optimal Power Flow problem.
A high-level summary of the method is:
• In a network, identify 𝑛 candidate buses for new DG.
• Set the objective function to:
𝑀𝑎𝑥𝑖𝑚𝑖𝑠𝑒 ∑ 𝑃𝑔
𝑛
𝑔=1
Where (𝑃1, 𝑃2, … 𝑃𝑛, ) are the control variables i.e. the real power output of each generator.
Page 16
Virtual Statcom WP1 report
JK7261-TR-01-04 WPD Virtual Statcom WP1 report 10/04/2019 © Power Systems Consultants 11
Subject to (constraints):
• Real and Reactive power balance (i.e. load demand is still met)
• Bus voltage limits
• Branch flow limits (i.e. Thermal limits)
• Voltage step change [9]
• Fault level limits [10]
It is noted that the summation is independent of existing generation, so this must be added
Various solvers were used across the OPF papers. Of interest was that in [8] a method
was described that made use of the PSS/E OPF add on module to assess the network
capacity.
In the OPF method of evaluating hosting capacity, different outcomes can be achieved
depending on the user’s manual selection of the candidate bus(es).
• If only one bus is selected the optimisation will return the largest value of generation
that can be connected to that bus and in this case is essentially the same as the
per-node capacity evaluation method.
• If multiple sites within the network have been identified that are well suited to DG
due to land availability and energy source (wind/solar irradiance) the optimisation
will provide a comparison of the optimal sizing of DGs across feeders or within the
same feeder.
• If the candidate buses are selected at the ends of feeders, as presented in [8], the
total potential hosting capacity is returned.
The benefit of the concurrent OPF method for hosting capacity is it may provide a slightly
more accurate assessment compared to the iterative method due to using independent
continuous control variables for generators rather than iteratively incrementing reactive
power contribution from DGs. The downside is computationally it is much more complex
to implement and incorporate contingencies and constraints than the concurrent iterative
method.
4.1.3 Summary of hosting capacity evaluation and Virtual Statcom approach
The literature review identified the following two approaches in evaluating the hosting capacity
of a network.
1. Per-node non-concurrent hosting capacity.
2. Concurrent hosting capacity.
Under the concurrent hosting capacity approach, the hosting capacity can be determined
using two methods, an iterative scaling method or an optimal power flow method.
The objective of the Virtual Statcom project is to determine how much extra generation (or
load) can be added across a network, rather than maximising the generation or load connected
to a single node (bus). The concurrent hosting capacity approach calculates the maximum
simultaneous generation (or load) that can be connected to a network. This provides a metric
that aligns with the objective of the project and for this reason, the Virtual Statcom project will
Page 17
Virtual Statcom WP1 report
JK7261-TR-01-04 WPD Virtual Statcom WP1 report 10/04/2019 © Power Systems Consultants 12
use the concurrent hosting capacity evaluation approach when calculating network hosting
capacity. Of the two methods identified for the concurrent hosting capacity the Virtual Statcom
project has opted to use the iterative scaling method over the optimal power flow method as
a basis for the development of the hosting capacity algorithm for the following reasons:
• Computational simplicity.
• Ability to easily incorporate contingencies and constraints.
• Applicable to generation and load.
4.2 Optimisation of network hosting capacity
4.2.1 Optimal reactive power dispatch
The literature review identified multiple papers that focused on the Optimal Reactive Power
Dispatch (ORPD) problem [11] [12] [13] [14] [15] [16] [17] [18] [19]. The objective function in
the papers was set to minimise real power losses in a network using various reactive power
devices, including the reactive output of DGs.
The general objective function for ORPD is developed to minimise the active power loss in the
network, by summing the real power branch losses.
𝑀𝑖𝑛𝑖𝑚𝑖𝑠𝑒 ∑ 𝑃𝑙𝑜𝑠𝑠𝑒𝑠𝑛
𝑏𝑟
𝑛=1
Where 𝑏𝑟 = Total number of branches in the network
𝑃𝑙𝑜𝑠𝑠𝑒𝑠𝑛 = Calculated real power losses in branch 𝑛
The optimisation can be set up to use control variables that include:
• Reactive power output of generators
• Voltage control setpoints
• Transformer tap positions
• Reactive devices (SVC, Statcoms, Shunts)
Subject to (constraints):
• Limits on control variables
• Real and Reactive power balance (i.e. load demand is still met)
• Bus voltage limits
• Branch flow limits (i.e. thermal limits)
The constrained ORPD problem summarised above ensures that real power losses are
minimised. By using exclusively reactive power control variables and the real and reactive
power balance constraint, the optimisation corresponds to the maximum thermal headroom of
the network. To visualize this, the following two-bus example shown in Figure 4 demonstrates
the OPRD method:
Page 18
Virtual Statcom WP1 report
JK7261-TR-01-04 WPD Virtual Statcom WP1 report 10/04/2019 © Power Systems Consultants 13
R = 0.16 p.uX = 0.32 p.u
External Network
Pg = 4
Pd = 8
Qg
Qd = 4
Smax = 20 MVA
Figure 4 - two bus network
• The objective is to minimise the real power losses of the network using the reactive
power of the generator – Qg is the control variable.
• All other values are fixed i.e. Pg, Pd, Qd, R, X, Smax.
• Only apply the real and reactive power balance and thermal constraints. i.e. ignore
the reactive power limits of the generator and the bus voltage limits.
Figure 5 - Losses and thermal head room with increasing Qg
Figure 5 demonstrates that the locus of the maximum thermal headroom coincides with
minimum real power losses and minimum reactive power losses.
4.2.2 Optimisation solvers
For any optimisation problem two main methods exist, gradient based algorithms and gradient-
free algorithms. Gradient based algorithms utilise the derivative(s) of the objective function to
determine the search direction to locate the optimal solution whereas gradient-free algorithms
use stochastic models to determine the search direction to locate the optimal solution.
The preference determined from the literature is to apply gradient-free algorithms to the ORPD
problem as opposed to classical gradient based optimisation methods. Gradient-free
0%
10%
20%
30%
40%
50%
60%
70%
80%
90%
100%
0
0.1
0.2
0.3
0.4
0.5
0.6
0.7
0.8
0.9
1
0 1 2 3 4 5 6 7 8
Loss
es
Qg (MVAr)
Losses and thermal headroomwith increasing Qg
P loss (MW) Q loss (MVAr) MVA headroom (%)
Page 19
Virtual Statcom WP1 report
JK7261-TR-01-04 WPD Virtual Statcom WP1 report 10/04/2019 © Power Systems Consultants 14
algorithms are more likely to find the global optimum than gradient based algorithms due to
their ability to handle complex objective functions and discrete control variables such as
transformer tap position and switchable shunts [12] [14]. Multiple solver algorithms have been
applied (academically and professionally) to solve the optimal reactive power dispatch ORPD
problem, such as:
• Particle swarm optimisation [12]
• Mean-Variance mapping
optimisation [14]
• Flower pollination algorithm [15]
• Artificial bee colony method [16]
• Ant lion optimiser [17]
• Gravitational search algorithm [18]
• Cuckoo search algorithm [19]
The literature reviewed identified Particle Swarm Optimisation as the benchmark to compare
new novel solvers to as it is a proven optimisation method. Some of the optimisation methods
above are computationally more efficient than Particle Swarm Optimisation but the results
converge to very similar values. An overview of particle swarm is presented in Section 9.2.5.
Table 1 presents the open source Python packages for the solvers identified in the literature
review. Table 1 - Python open source solver packages.
Solver from literature review. Open source Python packages
Particle swarm optimisation [12] psopy 0.2.3
pyswarm 1.0.0.
NiaPy 1.0.2
SwarmPackagePy 1.0.0a5
Mean-Variance mapping optimisation [14] None
Flower pollination algorithm [15] NiaPy 1.0.2
Artificial bee colony method [16] honeybee 0.1.0a3
NiaPy 1.0.2
SwarmPackagePy 1.0.0a5
Ant lion optimiser [17] None
Gravitational search algorithm [18] optimal 0.2.0
SwarmPackagePy 1.0.0a5
Cuckoo search algorithm [19] SwarmPackagePy 1.0.0a5
4.2.3 Summary of network hosting capacity optimisation and Virtual Statcom
approach
The objective of the Virtual Statcom project is to determine how much extra generation (or
load) can be added across a network by optimising the reactive power output of existing DGs,
this is essentially an Optimal Reactive Power Dispatch (ORPD) problem as described in the
literature. The literature review demonstrated that gradient-free solvers are best suited to
solve ORPD problems and that an array of gradient-free solvers exist.
The Virtual Statcom project will define the optimisation of the network hosting capacity as an
ORPD problem and of the many solvers identified, will initially develop the Virtual Statcom
algorithm to incorporate a Particle Swarm Optimisation (PSO) solver. A PSO solver was
selected for the following reasons:
• PSO is a proven method and often used as a benchmark for ORPD problems.
• Open source Python PSO packages are available.
• For the size of WPD’s 33kV & 11kV networks the computational time advantages of
other solvers compared to PSO is expected to be minimal.
Page 20
Virtual Statcom WP1 report
JK7261-TR-01-04 WPD Virtual Statcom WP1 report 10/04/2019 © Power Systems Consultants 15
4.3 WPD’s Network Equilibrium project
The Network Equilibrium project was an innovation project undertaken by WPD which
investigated and demonstrated that voltage and power flow management can release network
capacity, the project’s trial locations focused on the 33kV and 11 kV networks in the counties
of Somerset and Devon in WPD’s South West area. The Network Equilibrium project focused
on three technical areas:
• The Enhanced Voltage Assessment (EVA) Method
• The System Voltage Optimisation (SVO) Method
• The Flexible Power Link (FPL) Method
The EVA method involved two parts, 1) the creation of the advance planning tool and 2) a
Voltage level assessment (VLA) to determine the impact of widening existing statutory voltage
limits. The results of the VLA quantify the extra hosting capacity released if the distribution
statutory limits mentioned of +/- 6% were relaxed to +/- 8% at 11 kV and +/- 10% at 33kV. No
changes to the statutory limits have resulted so far as a result of this work, therefore the Virtual
Statcom project will consider bus voltage limits of +/- 6% at 11kV and 33kV.
The SVO method involved assessing and implementing a control system to determine in real
time the most optimal Automatic Voltage Control (AVC) setpoint for Bulk Supply Points (BSP)
132/33kV and Primary 33/11 kV transformers. The results in [20] show that for certain BSP
and Primary networks significant hosting capacity is released. Some of the BSP networks and
Primaries investigated in the Network Equilibrium are also being considered for the Virtual
Statcom Project. The Virtual Statcom project is expected to complement the SVO. However,
the Virtual Statcom project will consider the AVC setpoints to be static.
The FPL Method involved assessing and implementing a back to back AC–DC-AC converter
to control real and reactive power flows between two WPD 33kV networks. The control of a
FPL will not be considered in the Virtual Statcom project, however an FPL will be treated as
source of controllable reactive power based on a P-Q characteristic if located in a network
selected.
4.4 National Grid/UKPN Power Potential project
The Power Potential project is being undertaken by National Grid and UKPN, the aim of the
project is to open up new markets for distributed energy resources and generate additional
capacity by alleviating transmission and distribution constraints [21]. The project
demonstrates that DGs can be used to supply real and reactive power at the Grid Supply Point
to manage transmission constraints. The project involves Optimal Power flows (OPF) for a
day ahead and real time dispatch of real and reactive power. The project uses an AC heuristic
optimisation approach compared to and AC mathematical approach to solve the OPF to
ensure solve times are less than 10s for the real time OPF. An AC heuristic optimisation
reduces the complexity of the AC mathematical optimisation approach but may only find the
local minima not the global minima [21]. PSC contacted National Grid to discuss finer details
of the OPF approach but learned this outsourced to a supplier and treated by National
Grid/UKPN as a black box. The Virtual Statcom project will implement an AC mathematical
approach for optimisation.
Page 21
Virtual Statcom WP1 report
JK7261-TR-01-04 WPD Virtual Statcom WP1 report 10/04/2019 © Power Systems Consultants 16
5 Validation of Power System models
The objective of validating the power system models in WP1 is to gain insight into WPD’s
models, modelling assumptions and to ensure that these models can be relied upon for
subsequent work packages. This section outlines the steps taken by PSC to validate WPD
power system models.
5.1 Models/data provided from WPD
WPD provided PSC with models in PSS/E version 32 and 34 of the WPD South West network
area.
The following 400/132/33kV network models were provided:
• 20181219 South West PSSE 20172018 DIV Primary Day MD v32.sav
• 20181219 South West PSSE 20172018 DIV Primary Day MD v32.raw
• 20181219 South West PSSE 20172018 DIV Primary Day MD v34.sav
• 20181219 South West PSSE 20172018 DIV Primary Day MD v34.raw
A selection of BSP networks PSS/E SLDs were also provided.
The following Primary 11kV network models were provided:
• 310023_TivertonMoorhayes_Final.sav
• ColleyLane_20072017_V50.sav
• Dunkeswell_310057_FINAL.sav
• Lydeard_St_Lawrence - Final v1.0.sav
• MarshGreen-Final v2.0.sav
• Millfield Final v3.0.sav
• Nether Stowey Final v2.0.sav
• Waterlake-Final 32 v2.0.sav
11kV network PSS/E SLDs were provided, one for each of the models above.
5.2 Model validation approach
The following approach was taken by PSC to validate the models provided:
1. Perform initial convergence check in PSS/E.
2. Develop network summaries for the following two cases:
a. Minimum Generation – Maximum Load
b. Maximum Generation – Minimum Load
3. Review prepared network summaries with WPD, clarified modelling assumptions, and
updated summaries.
The following describes the approach taken and the outcomes of each check.
5.2.1 Convergence Check
The purpose was to check that with the PSS/E models received, a convergent power flow
simulation could be performed, and data appeared realistic.
Page 22
Virtual Statcom WP1 report
JK7261-TR-01-04 WPD Virtual Statcom WP1 report 10/04/2019 © Power Systems Consultants 17
5.2.2 Network summaries
To validate the models received, network summaries were developed for all WPD South West
33kV BSP networks and the 11kV networks received. The network summaries provided
power system statistics and analysed the networks under the following two boundary cases:
1. Minimum Generation – Maximum Load
2. Maximum Generation – Minimum Load
The networks summaries and assumptions for the power flow studies were discussed with
WPD to ensure that the Min-Gen Max-load and Max-Gen Min-Load used in work package 2
are accurate. The final assumptions and network summary results are detailed below.
33kV networks:
The following assumptions are used when developing the 33kV network summaries:
• The WPD South West region case provided has the correct generation profile for
generators connected above 33kV.
• The loads given in the original WPD PSSE models are the maximum load.
• Minimum load is 30% of maximum load – WPD LTDS Nov 2018.
• Min Gen-Max Load case assumptions:
o All generators that are connected to WPD’s network at 33kV and below are out of
service.
o Generators connected above 33kV are in/out of service as provided in original
400/132/33kV model.
o All battery sites are loads (i.e. not providing power).
o Loads as provided in original 400/132/33kV model.
• Max Gen-Min Load case assumptions:
o All generators are in service, regardless of voltage level.
o All battery sites providing power (i.e. not loads)
o Scale all loads regardless of voltage level to 30% of max load case provided.
Power flow studies were run for the two cases, the results for the 33kV networks that have
been selected for inclusion in the Virtual Statcom project are presented in 6.2.1. The full 33kV
networks summary in included in Appendix A – BSP and Primary network summaries
11kV networks:
The following assumptions are used when developing the 11kV network summaries:
• Min Gen-Max Load case assumptions
o All generators that are connected to WPD’s network at 11kV and below are out of
service.
o All battery sites are loads (i.e. not providing power).
o Loads values as provided in original 11kV model.
• Max Gen-Min Load case assumptions
o All generators are in service, regardless of voltage level
o All battery sites in model providing power (i.e. not loads)
o Scale all loads regardless of voltage level to 30% of max load 11kV case provided.
Page 23
Virtual Statcom WP1 report
JK7261-TR-01-04 WPD Virtual Statcom WP1 report 10/04/2019 © Power Systems Consultants 18
Power flow studies were run for the two cases. The results for the 11kV networks that have
been selected for inclusion in the Virtual Statcom project are presented in 6.2.2. The full 11kV
networks summary in included in Appendix A – BSP and Primary network summaries.
5.2.3 Review Discussion
All the models received converged and from discussion with WPD it was determined that the
results were reasonable and representative of the WPD system. Thereafter, the models were
considered validated and processed through the network selection criteria outlined in Section
6.1.
Page 24
Virtual Statcom WP1 report
JK7261-TR-01-04 WPD Virtual Statcom WP1 report 10/04/2019 © Power Systems Consultants 19
6 Network selection methodology
The models received contained 42 BSPs in WPD’s Southwest region and eight primary
substations that had been modelled as part of the WPD’s Network Equilibrium project. Out of
the models provided, three BSPs and one primary were to be included as study zones in the
Virtual Statcom project. The main aim was to select networks with different characteristics to
test the applicability of the Virtual Statcom method across a range of network scenarios.
6.1 Study Zone selection criteria
The following describes the criteria that were used to select the networks for study.
1. Amount of DGs installed – The Virtual Statcom method seeks to utilise reactive power
from existing DGs to increase network hosting capacity. Therefore, it is fundamental to
have at least one DG. By choosing networks with larger numbers of generators, the
Virtual Statcom method will be given more control points to demonstrate effectiveness.
Preference is also given to networks with disperse DGs, rather than networks with all
generation at one bus.
2. Historical data granularity– To determine the benefit of the Virtual Statcom method,
studies will be performed using timeseries data to compare hosting capacity before and
after the Virtual Statcom algorithm is run. Therefore, it is essential to have timeseries
data with high data granularity to enable this comparison, sites that took part in the
Network Equilibrium Project have high data granularity and are preferred for this study.
3. Networks with historical voltage regulation and thermal constraints – As discussed
in Section 3.2, voltage regulation and thermal issues can limit the hosting capacity of a
network. The Virtual Statcom algorithm will seek to mitigate these issues to increase
hosting capacity.
4. No existing reverse power limitations - The reverse power N-1 limit of the 132/33 kV
Grid Transformers must not be exceeded in the Maximum generation, minimum load
case as this suggests the transformer reverse power limit is the limiting factor for hosting
capacity.
5. WPD network owner experience – To select suitable networks it is also essential for
PSC to utilise WPD’s network experience. PSC assessed the results and learnings from
WPD’s Network Equilibrium SVO project and consulted with WPD Primary System
Design engineers regarding network challenges and historical constraint conditions.
6.2 Networks selected
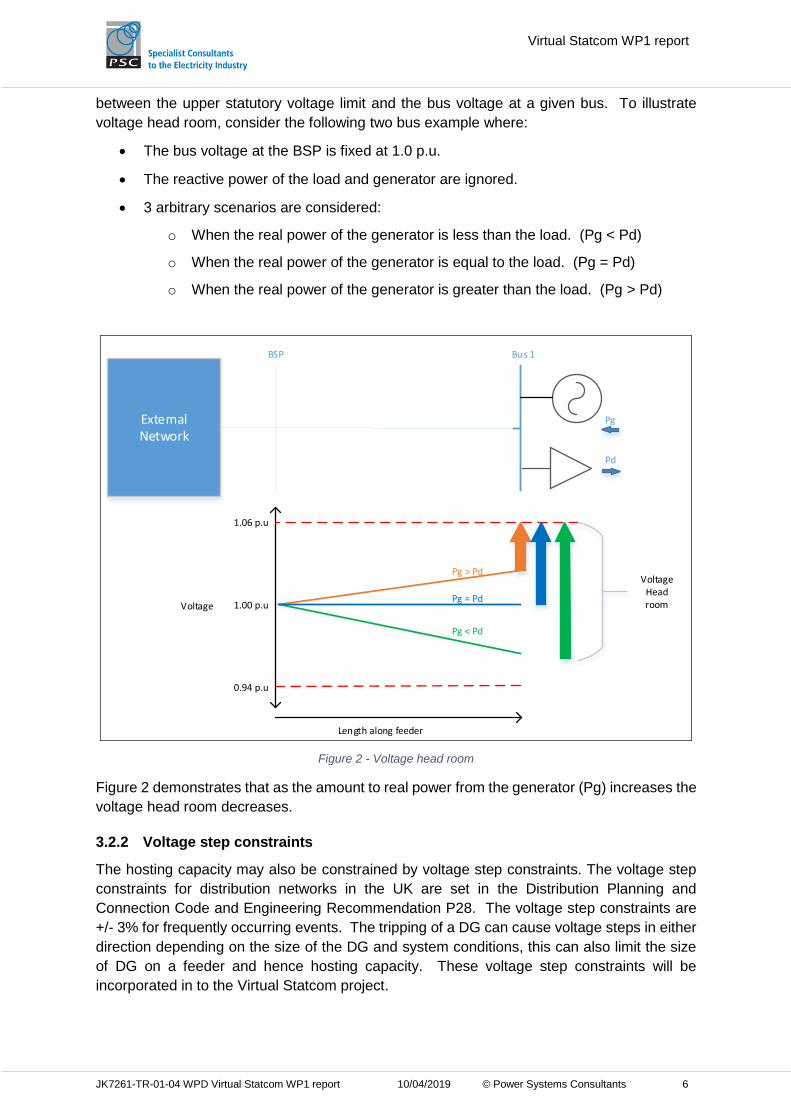
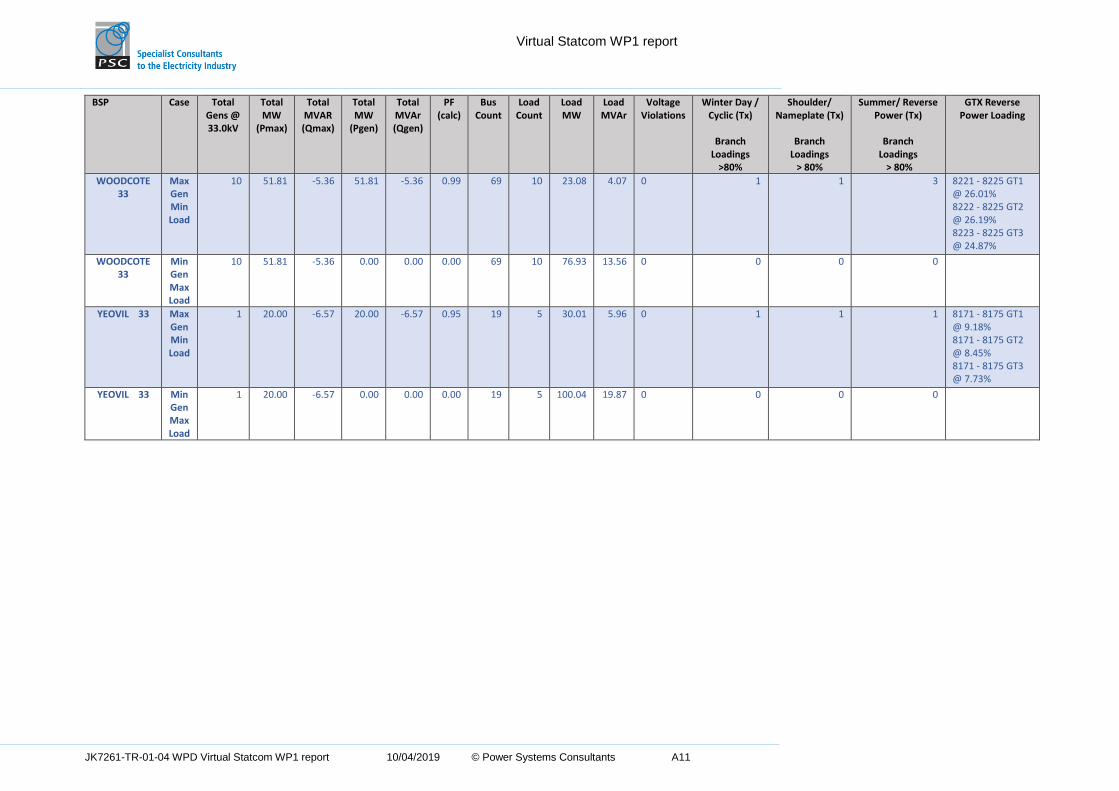
6.2.1 33kV Networks
After applying the criteria from Section 6.1, the 33kV networks selected for inclusion in the Virtual Statcom project are:
• Barnstaple 33kV BSP
• Pyworthy and North Tawton 33kV BSP
• Tiverton 33kV BSP
Page 25
Virtual Statcom WP1 report
JK7261-TR-01-04 WPD Virtual Statcom WP1 report 10/04/2019 © Power Systems Consultants 20
Barnstaple 132/33kV BSP
The following tables present the network summary for Barnstaple 33kV BSP. Barnstaple was
selected due to having a high number of voltage violations and two branches with high
loadings for the Maximum Generation – Minimum load case. Table 2 - Barnstaple Network summary
BSP Case Total Gens @ 33.0kV
Total MW
(Pmax)
Total MVAR (Qmax)
Total MW
(Pgen)
Total MVAr (Qgen)
PF (calc) Load MW
Load MVAr
BARNSTAPL 33 Max Gen Min Load
8 48.25 -8.45 48.25 -8.45 0.98 12.77 3.65
BARNSTAPL 33 Min Gen
Max Load 8 48.25 -8.45 0.00 0.00 0.00 42.58 12.15
Table 3 - Barnstaple Network Violations
BSP Case Voltage Violations
Winter Day / Cyclic (Tx)
Branch
Loadings > 80%
Shoulder/ Nameplate (Tx)
Branch
Loadings > 80%
Summer/ Reverse Power (Tx)
Branch
Loadings > 80%
GTx Reverse Power Loading
BARNSTAPL 33 Max Gen Min Load
3 violations
2 2 2 GT1 @ 48.61% GT2 @ 32.54%
BARNSTAPL 33 Min Gen
Max Load
0 0 0 0
n/a
Figure 6 - Barnstaple BSP SLD
Page 26
Virtual Statcom WP1 report
JK7261-TR-01-04 WPD Virtual Statcom WP1 report 10/04/2019 © Power Systems Consultants 21
Pyworthy and North Tawton 132/33kV BSPs
The following tables present the network summary for Pyworthy and North Tawton 132/33kV
BSPs. Pyworthy and North Tawton 33kV BSPs are normally operated in parallel. Pyworthy
and North Tawton was selected due to having high number of generators and three/four
branches with high loadings for the Maximum Generation – Minimum load case.
Table 4 - Pyworthy and North Tawton network summary
BSP Case Total Gens @ 33.0kV
Total MW
(Pmax)
Total MVAR (Qmax)
Total MW
(Pgen)
Total MVAr (Qgen)
PF (calc) Load MW
Load MVAr
PYWORTHY 33 &
N/TAWTON 33
Max Gen Min Load
16 98.172 -8.17 98.172 -8.17 0.985 21.009 4.3029
PYWORTHY 33 &
N/TAWTON 33
Min Gen Max Load
16 98.172 -8.17 0 0 0 70.029 14.343
Table 5 - Pyworthy and North Tawton Violations
BSP Case Voltage Violations
Winter Day / Cyclic (Tx)
Branch
Loadings > 80%
Shoulder/ Nameplate (Tx)
Branch
Loadings > 80%
Summer/ Reverse Power (Tx)
Branch
Loadings > 80%
GTx Reverse Power Loading
PYWORTHY 33 &
N/TAWTON 33
Max Gen Min Load
0 3 3 4
GT1 @ 43.65% GT2 @ 36.52% GT3 @ 37.04% GT4 @ 36.52%
PYWORTHY 33 &
N/TAWTON 33
Min Gen Max Load
0 0 0 0
n/a
Figure 7 - Pyworthy and North Tawton BSPs SLD
Page 27
Virtual Statcom WP1 report
JK7261-TR-01-04 WPD Virtual Statcom WP1 report 10/04/2019 © Power Systems Consultants 22
Tiverton 132/33kV BSP
The following tables present the network summary for Tiverton 33kV BSPs. Tiverton was
selected from discussion with WPD and it is a smaller and simpler network compared with
Barnstaple and Pyworthy/North Tawton. In the Network Equilibrium SVO project Tiverton BSP
did not show a large capacity increase – this will test the Virtual Statcom method.
Table 6 - Tiverton Network Summary
BSP Case Total Gens @ 33.0kV
Total MW
(Pmax)
Total MVAR (Qmax)
Total MW
(Pgen)
Total MVAr (Qgen)
PF (calc) Load MW
Load MVAr
TIVERTON 33 Max Gen Min Load
5 18.55 -2.84 18.55 -2.84 0.99 14.78 2.35
TIVERTON 33 Min Gen
Max Load 5 18.55 -2.84 -0.65 0.00 1.00 49.27 7.84
Table 7 - Tiverton Violations Summary
BSP Case Voltage Violations
Winter Day / Cyclic (Tx)
Branch
Loadings > 80%
Shoulder/ Nameplate (Tx)
Branch
Loadings > 80%
Summer/ Reverse Power (Tx)
Branch
Loadings > 80%
GTx Reverse Power
Loading
TIVERTON 33 Max Gen Min Load
0 0 0 0 GT1 @ 27.25% GT2 @ 36.01%
TIVERTON 33 Min Gen
Max Load 0 0 0 0
n/a
Figure 8 - Tiverton BSP SLD
Page 28
Virtual Statcom WP1 report
JK7261-TR-01-04 WPD Virtual Statcom WP1 report 10/04/2019 © Power Systems Consultants 23
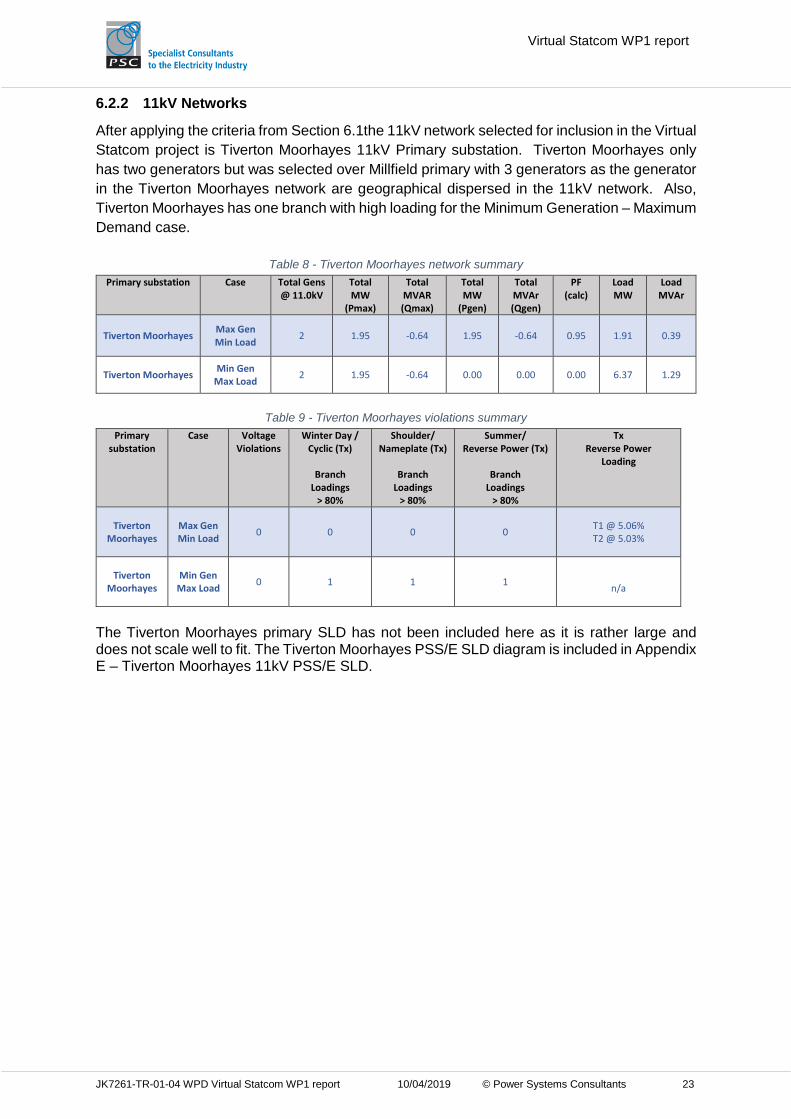
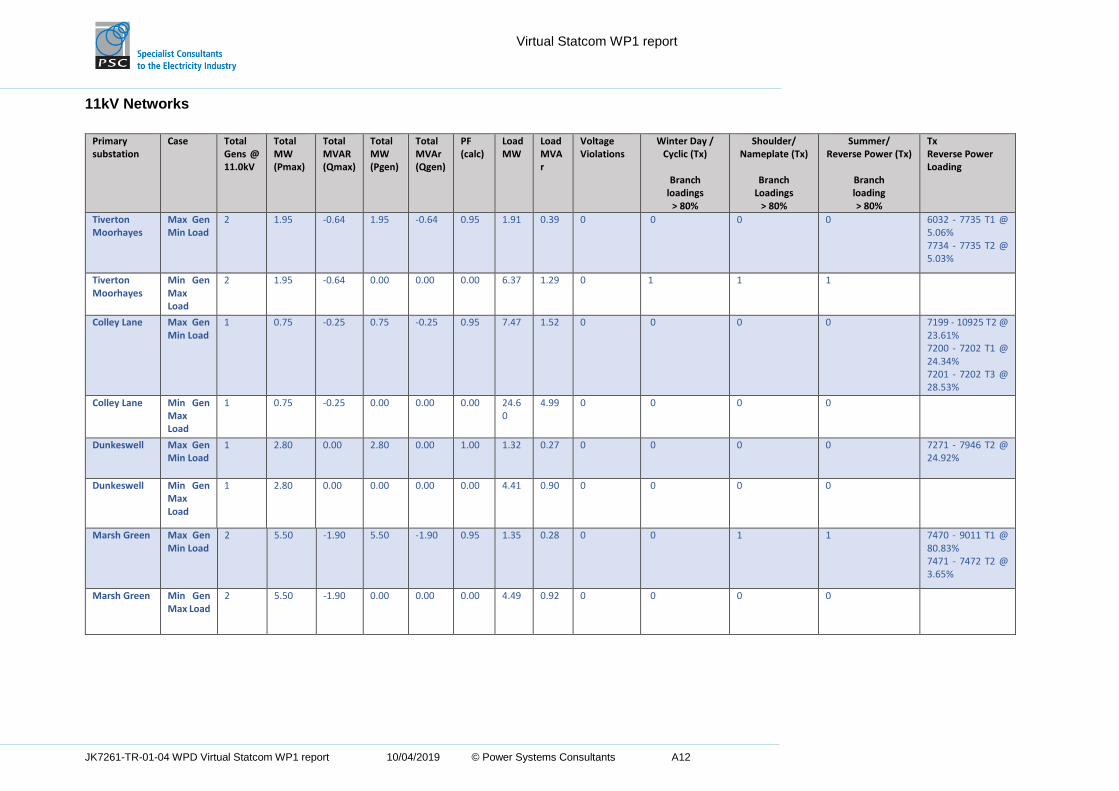
6.2.2 11kV Networks
After applying the criteria from Section 6.1the 11kV network selected for inclusion in the Virtual
Statcom project is Tiverton Moorhayes 11kV Primary substation. Tiverton Moorhayes only
has two generators but was selected over Millfield primary with 3 generators as the generator
in the Tiverton Moorhayes network are geographical dispersed in the 11kV network. Also,
Tiverton Moorhayes has one branch with high loading for the Minimum Generation – Maximum
Demand case.
Table 8 - Tiverton Moorhayes network summary
Primary substation Case Total Gens @ 11.0kV
Total MW
(Pmax)
Total MVAR (Qmax)
Total MW
(Pgen)
Total MVAr (Qgen)
PF (calc)
Load MW
Load MVAr
Tiverton Moorhayes Max Gen Min Load
2 1.95 -0.64 1.95 -0.64 0.95 1.91 0.39
Tiverton Moorhayes Min Gen
Max Load 2 1.95 -0.64 0.00 0.00 0.00 6.37 1.29
Table 9 - Tiverton Moorhayes violations summary
Primary substation
Case Voltage Violations
Winter Day / Cyclic (Tx)
Branch
Loadings > 80%
Shoulder/ Nameplate (Tx)
Branch
Loadings > 80%
Summer/ Reverse Power (Tx)
Branch
Loadings > 80%
Tx Reverse Power
Loading
Tiverton Moorhayes
Max Gen Min Load
0 0 0 0 T1 @ 5.06% T2 @ 5.03%
Tiverton Moorhayes
Min Gen Max Load
0 1 1 1
n/a
The Tiverton Moorhayes primary SLD has not been included here as it is rather large and does not scale well to fit. The Tiverton Moorhayes PSS/E SLD diagram is included in Appendix E – Tiverton Moorhayes 11kV PSS/E SLD.
Page 29
Virtual Statcom WP1 report
JK7261-TR-01-04 WPD Virtual Statcom WP1 report 10/04/2019 © Power Systems Consultants 24
7 Validation of time series data
The objective of validating the timeseries data in WP1 is to ensure that the Virtual Statcom
project has credible and consistent load and generation data for Work Package 4. This section
outlines the steps taken by PSC to validate WPD’s timeseries data.
7.1 Timeseries data validation approach
Timeseries data for the networks selected in Section 6.2 was provided by WPD. The
timeseries data received was for 1 year (2018), with 365 day files per network that include
every SCADA tag from that network. The approach taken by PSC to validate the time series
data involved:
1. Transforming the data into a standard timeseries format.
2. Defining tag rules to extract or calculate real and reactive power in a format useable
by PSS/E.
3. Validating timeseries data against load and generation values from the Long Term
Development Statement November 2018 (LTDS).
4. Discussion of timeseries data with WPD Primary System Design and updating tag rules
and calculation assumptions.
7.1.1 Standard timeseries format
The initial data received was not in a standard timeseries format. PSC used an Excel VBA
script to transform the data received into a standard timeseries format for each site to aid the
validation. Individual site comma separated variable (csv) files were saved for each load and
generation site. The following tables show the format of the data before transformation and
the outputted timeseries data after the transformation. HH stands for a half hour period.
Example File 1 – 1/1/18
Site Device Code Type Date SCADA Tag Ref HH1
HH2 …
HH47
HH48
HEDDON CROSS CB 51 6
Yellow current 01/01/2018
HEDDON CROSS > 11kV > T1 Busbar > CB 51 > 11kV Current 77 78 … 51 53
HEDDON CROSS VT 1 2 kV 01/01/2018
HEDDON CROSS > 11kV > T1 Busbar > CB 51 > VT 1 & Isolator > VT 1 11 12 … 12 12
HEDDON CROSS CB 51 10
Power MVAr 01/01/2018
HEDDON CROSS > 11kV > T1 Busbar > CB 51 > CB 51 > Power Analogues > MVAr Analogue 0.1 0.1 … 0.1 0.1
HEDDON CROSS CB 51 9
Power MW 01/01/2018
HEDDON CROSS > 11kV > T1 Busbar > CB 51 > CB 51 > Power Analogues > MW Analogue 1.5 1.6 … 1.0 1.1
Example File 2 – 2/1/18
Site Device Code Type Date SCADA Tag Ref HH1
HH2 …
HH47
HH48
HEDDON CROSS CB 51 6
Yellow current 02/01/2018
HEDDON CROSS > 11kV > T1 Busbar > CB 51 > 11kV Current 69 70 … 46 48
HEDDON CROSS VT 1 2 kV 02/01/2018
HEDDON CROSS > 11kV > T1 Busbar > CB 51 > VT 1 & Isolator > VT 1 10 10 … 10 10
HEDDON CROSS CB 51 10
Power MVAr 02/01/2018
HEDDON CROSS > 11kV > T1 Busbar > CB 51 > CB 51 > Power Analogues > MVAr Analogue 0.1 0.1 … 0.1 0.1
HEDDON CROSS CB 51 9
Power MW 02/01/2018
HEDDON CROSS > 11kV > T1 Busbar > CB 51 > CB 51 > Power Analogues > MW Analogue 1.4 1.4 … 0.9 1.0
Page 30
Virtual Statcom WP1 report
JK7261-TR-01-04 WPD Virtual Statcom WP1 report 10/04/2019 © Power Systems Consultants 25
Example output timeseries data for all SCADA tags
Date-Time HEDDON CROSS > 11kV > T1 Busbar > CB 51 > 11kV Current
HEDDON CROSS > 11kV > T1 Busbar > CB 51 > VT 1 & Isolator > VT 1
HEDDON CROSS > 11kV > T1 Busbar > CB 51 > CB 51 > Power Analogues > MVAr Analogue
HEDDON CROSS > 11kV > T1 Busbar > CB 51 > CB 51 > Power Analogues > MW Analogue
01/01/2018 00:30 77 11 0.1 1.5
01/01/2018 01:00 78 12 0.1 1.6
… … … … …
01/01/2018 23:30 51 12 0.1 1.0
02/01/2018 00:00 53 12 0.1 1.1
02/01/2018 00:30 69 10 0.1 1.4
02/01/2018 01:00 70 10 0.1 1.4
… … … … …
02/01/2018 23:30 46 10 0.1 0.9
03/01/2018 00:00 48 10 0.1 1.0
7.1.2 Tag rules and calculations
To select the correct SCADA tags for each site, tag rules were developed using detailed SLDs
provided by WPD to identify the correct power system devices (circuit breakers, voltage
transformers, current transformers). The sign convention used by WPD for SCADA tags is
positive flows away from a bus and negative flows into a bus. It is worth noting that program
of metering direction consistency is being rolled out progressively at WPD. This has affected
some of the sites in the study networks selected.
PSS/E requires that loads have positive real power and positive reactive power (if inductive)
and requires that generator have positive real power and positive reactive power (if exporting
reactive power). This results in some SCADA values requiring direction changes to be in the
correct format for PSS/E.
A different number of SCADA tags were available for each site and some new tags were
introduced during 2018 for certain sites. The following list presents a summary of rules in
descending preference order to obtain real and reactive power.
1. Direct method (DM): Use real power (MW) and reactive power (MVAr) SCADA values
(if available)
2. Voltage & Current Method (VIM): Use Voltage (V) and Current (I) SCADA values
and the power factor from the LTDS to calculate real power (MW) and reactive power
(MVAr).
3. Combination Method (CM): Use a combination for V&I method and direct method
depending on availability and quality of real power (MW) and reactive power (MVAr)
SCADA.
A Python script was used for the Direct Methods and Voltage & Current Method but
calculations for the combination method were done manually.
After initial tag rules were developed, PSC compared the timeseries data to the LTDS load
and generation values. These comparisons results were discussed with WPD Primary System
Design engineers. The discussion determined that some sites tag values required scaling and
some sites had to revert to the Voltage & Current Method even when real and reactive power
tags were available for that site. The tag rules were updated based on the initial LTDS
comparisons and discussion with WPD, the final SCADA tag rules are set out in Appendix B
– Tag rules for timeseries data.
Page 31
Virtual Statcom WP1 report
JK7261-TR-01-04 WPD Virtual Statcom WP1 report 10/04/2019 © Power Systems Consultants 26
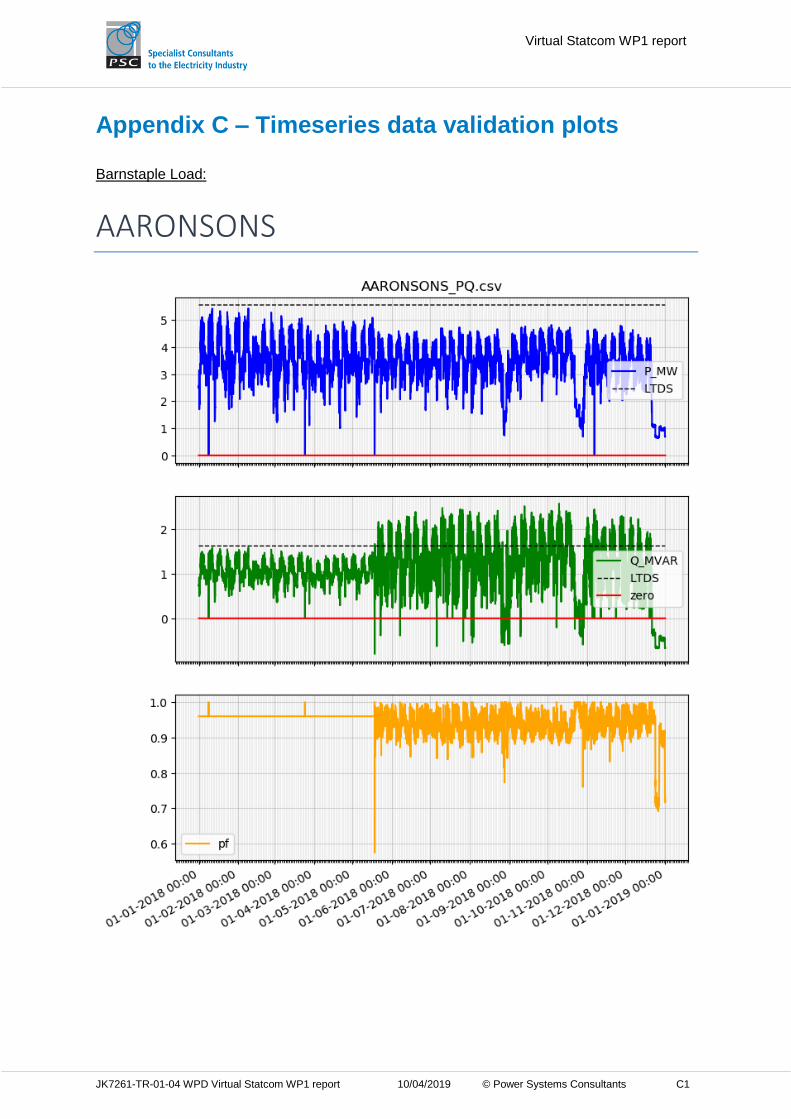
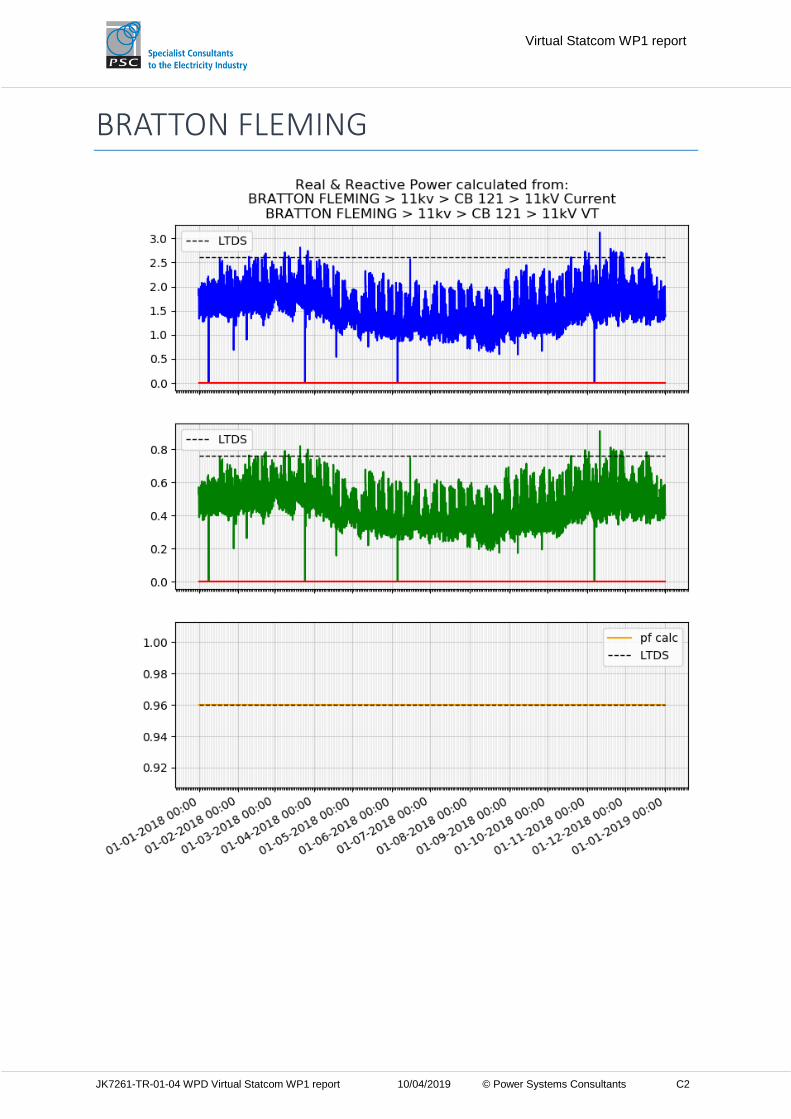
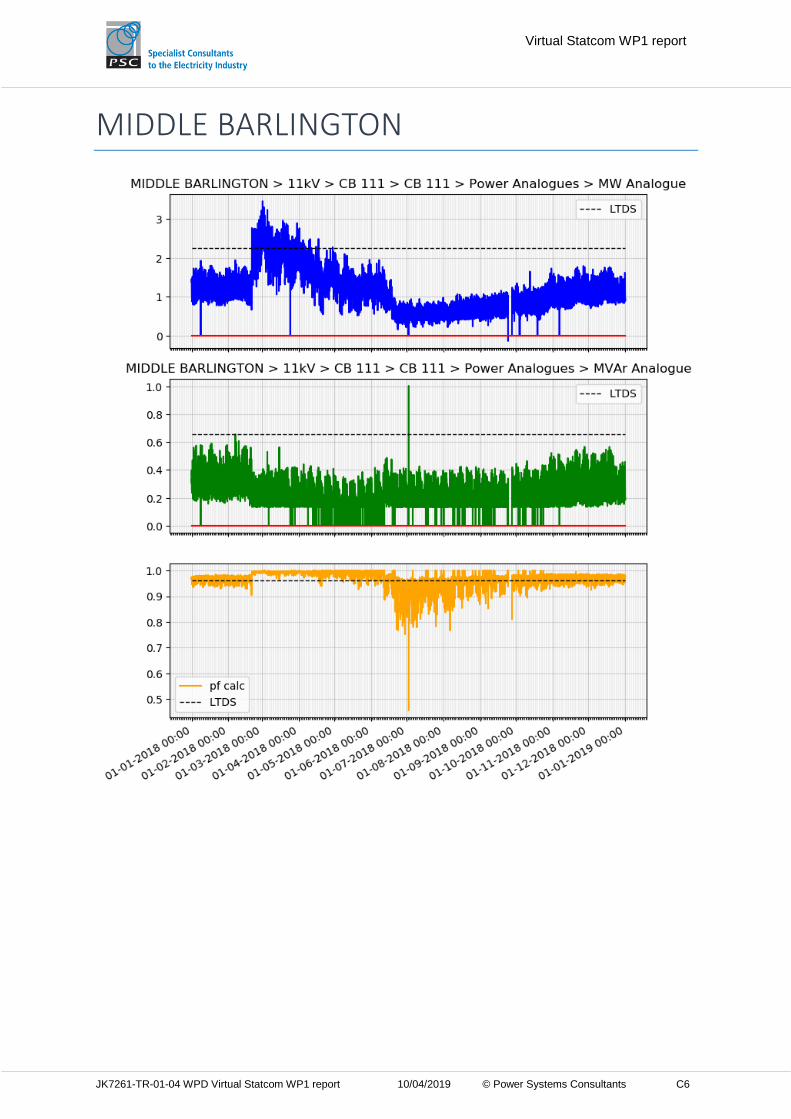
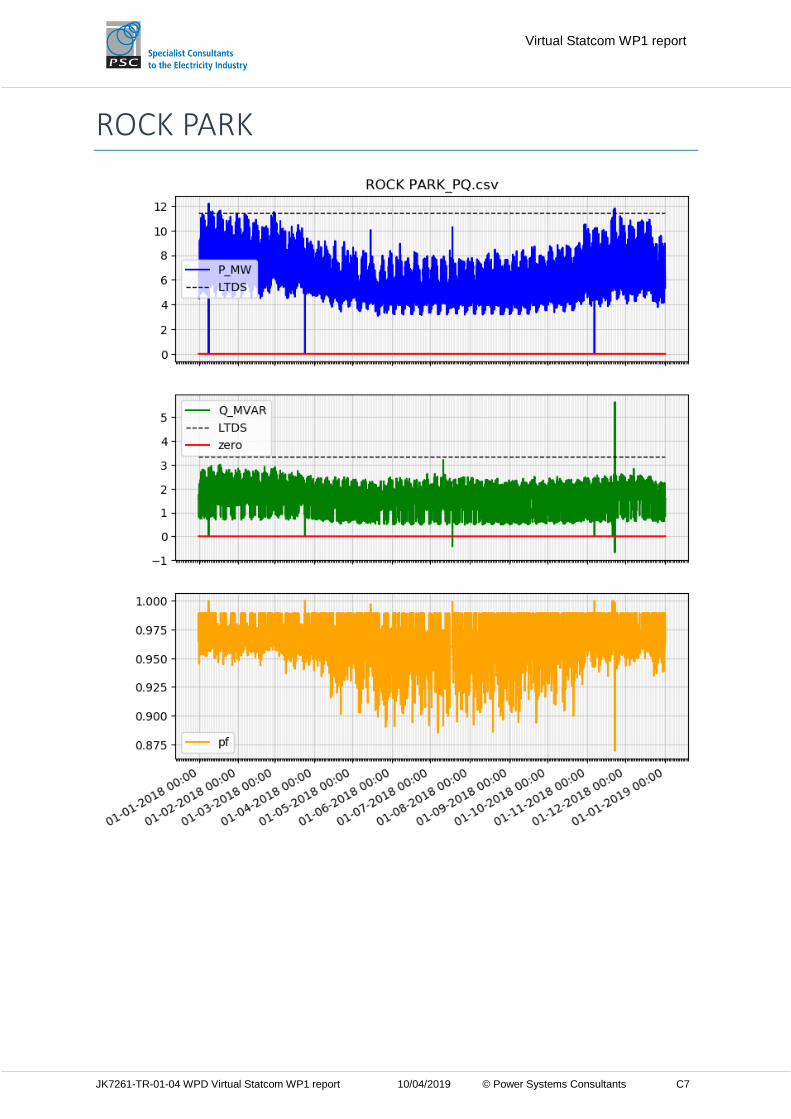
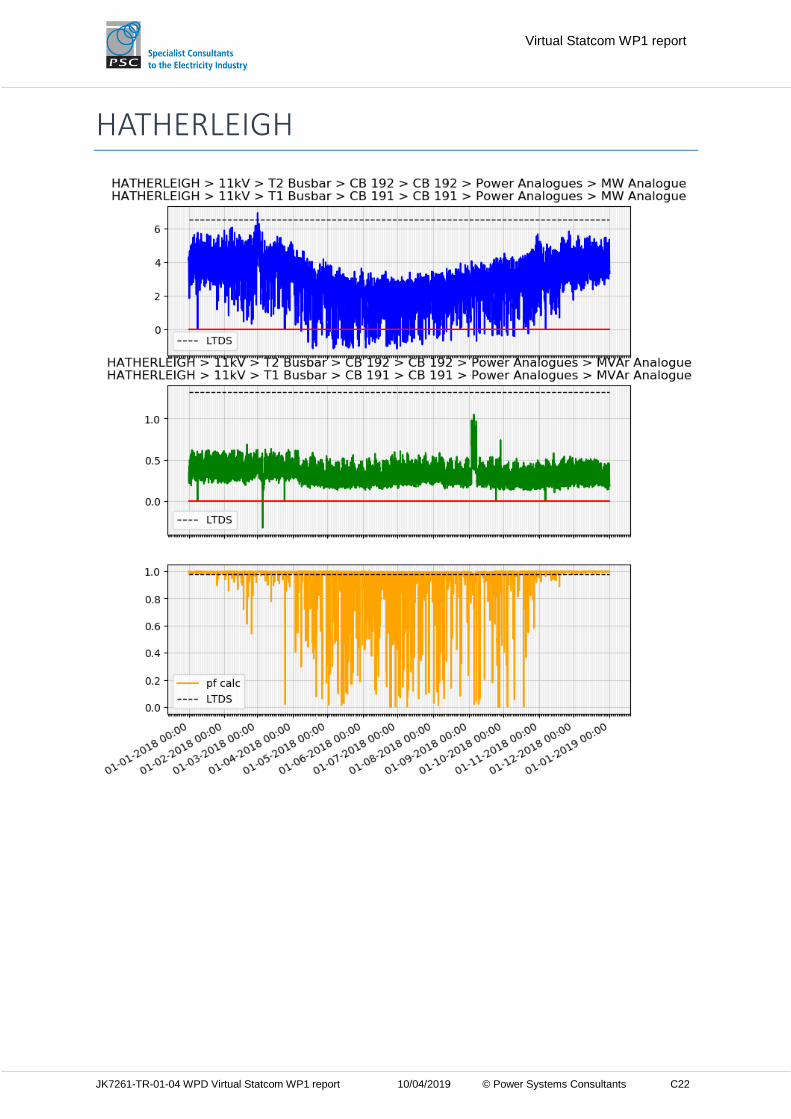
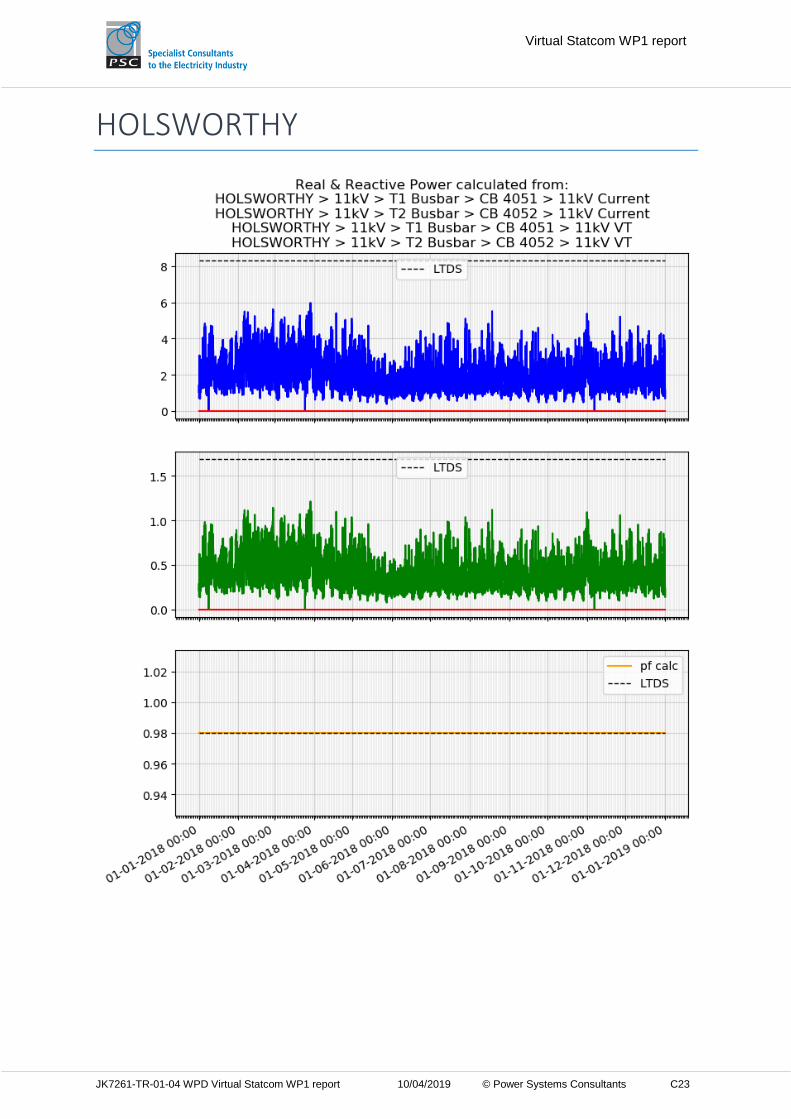
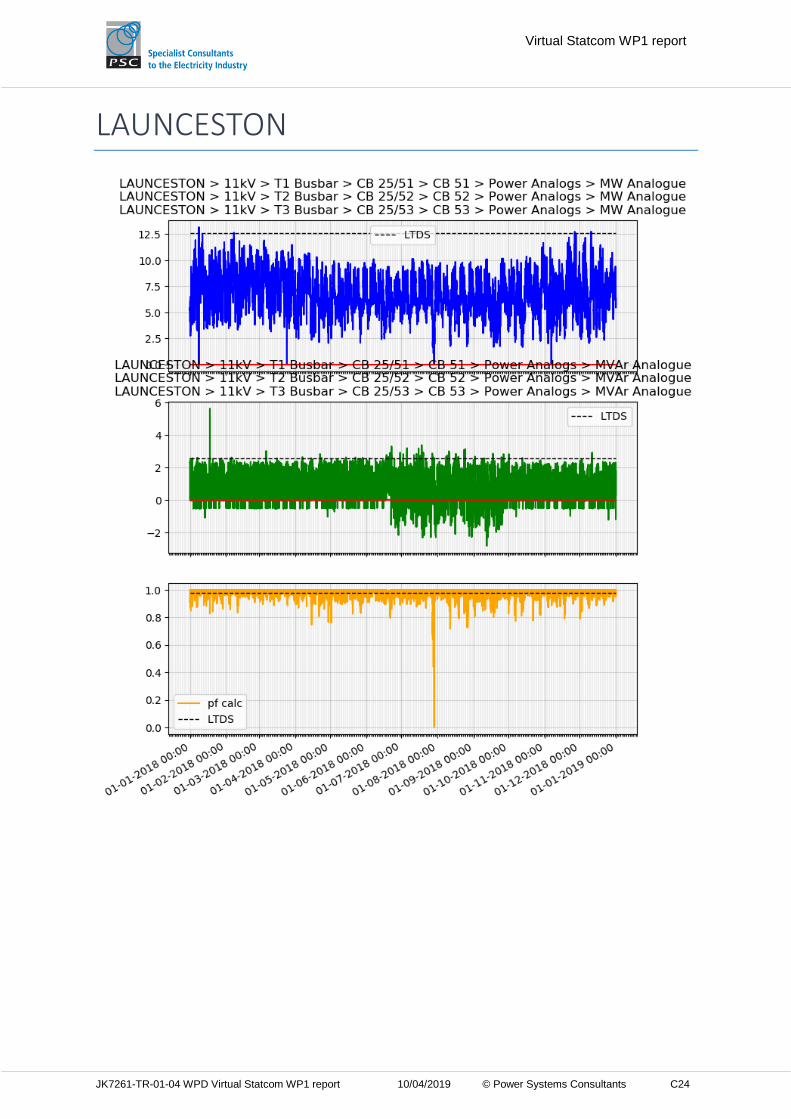
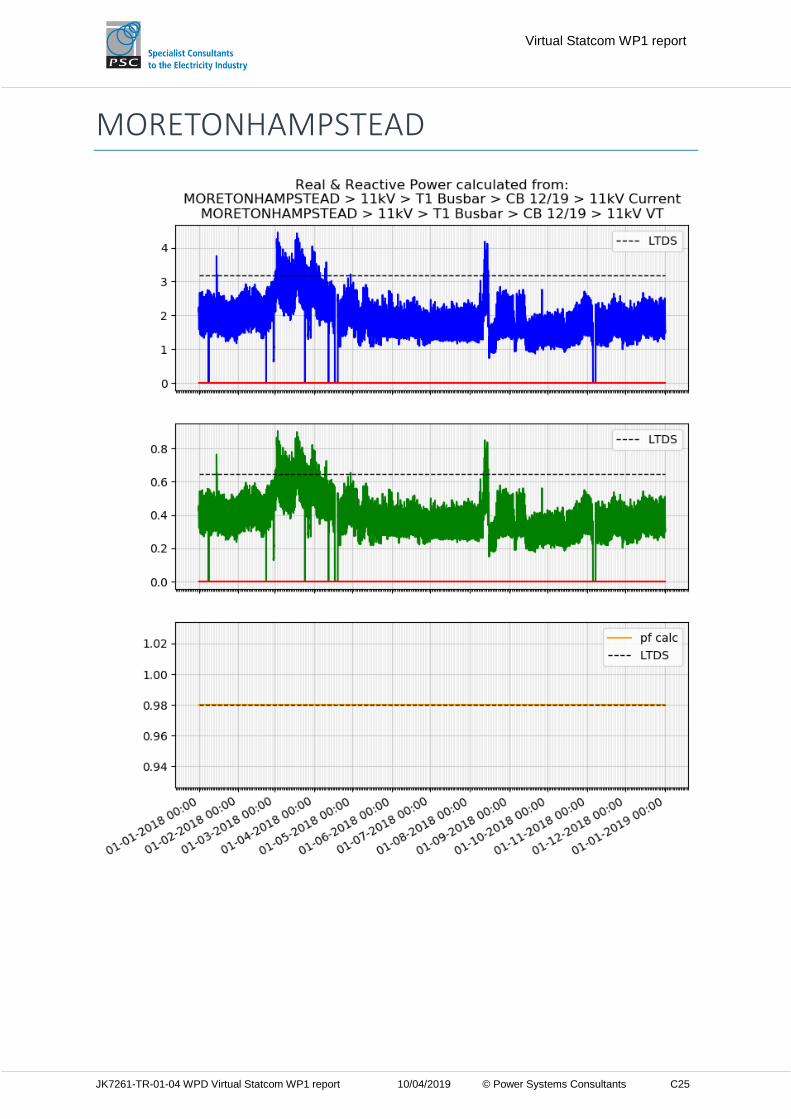
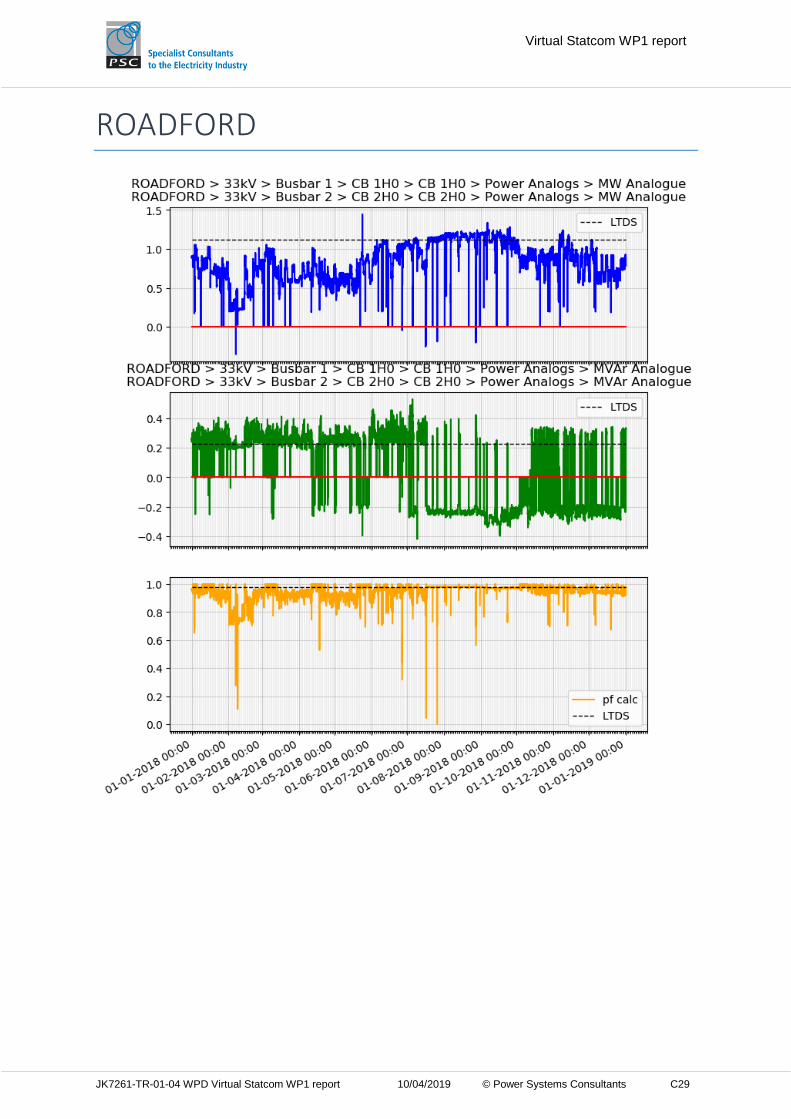
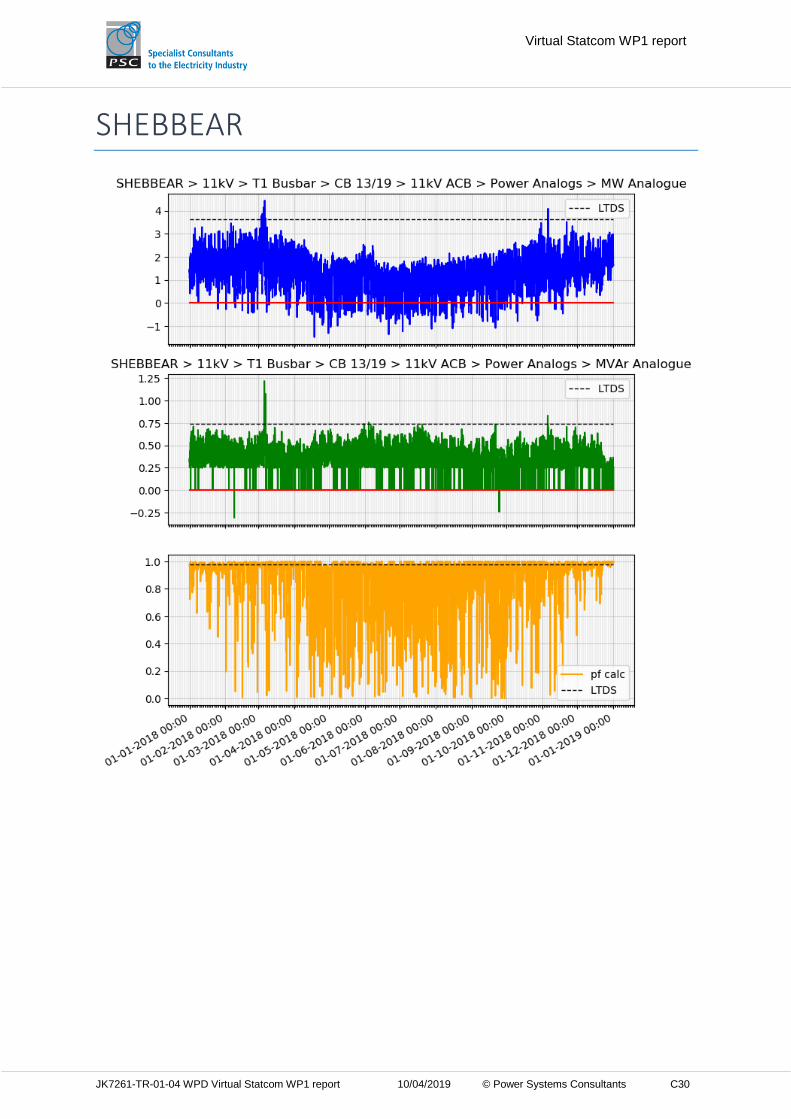
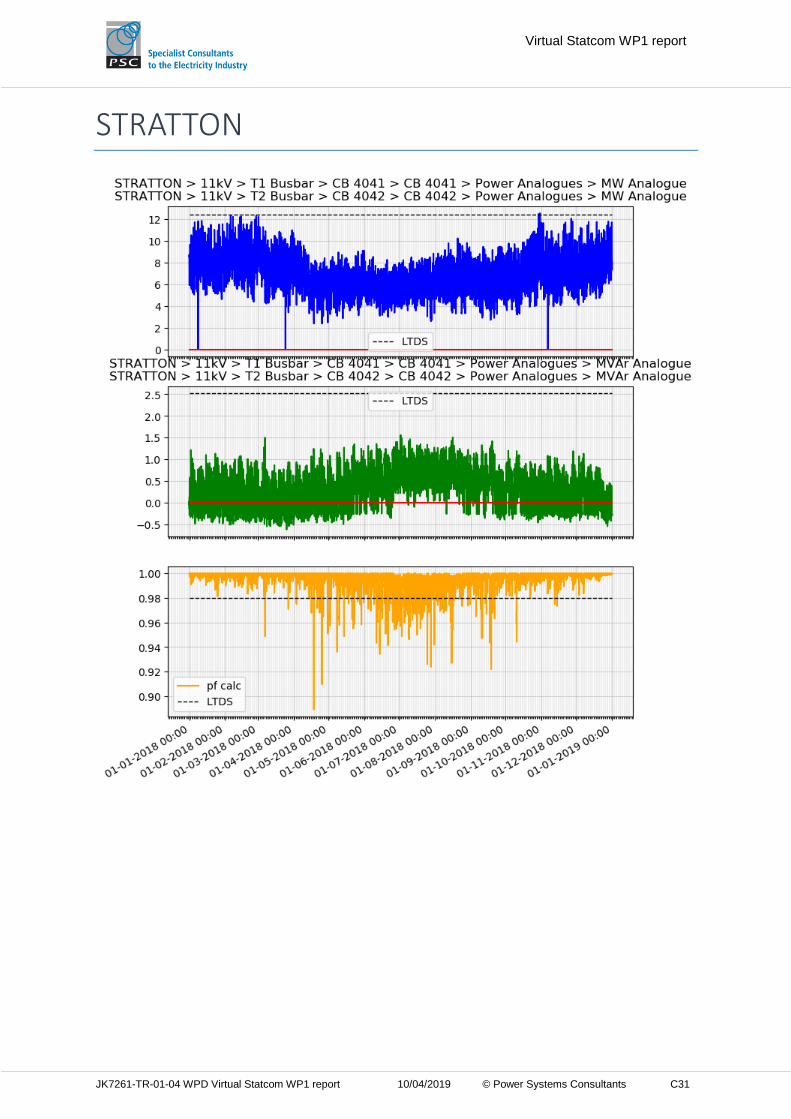
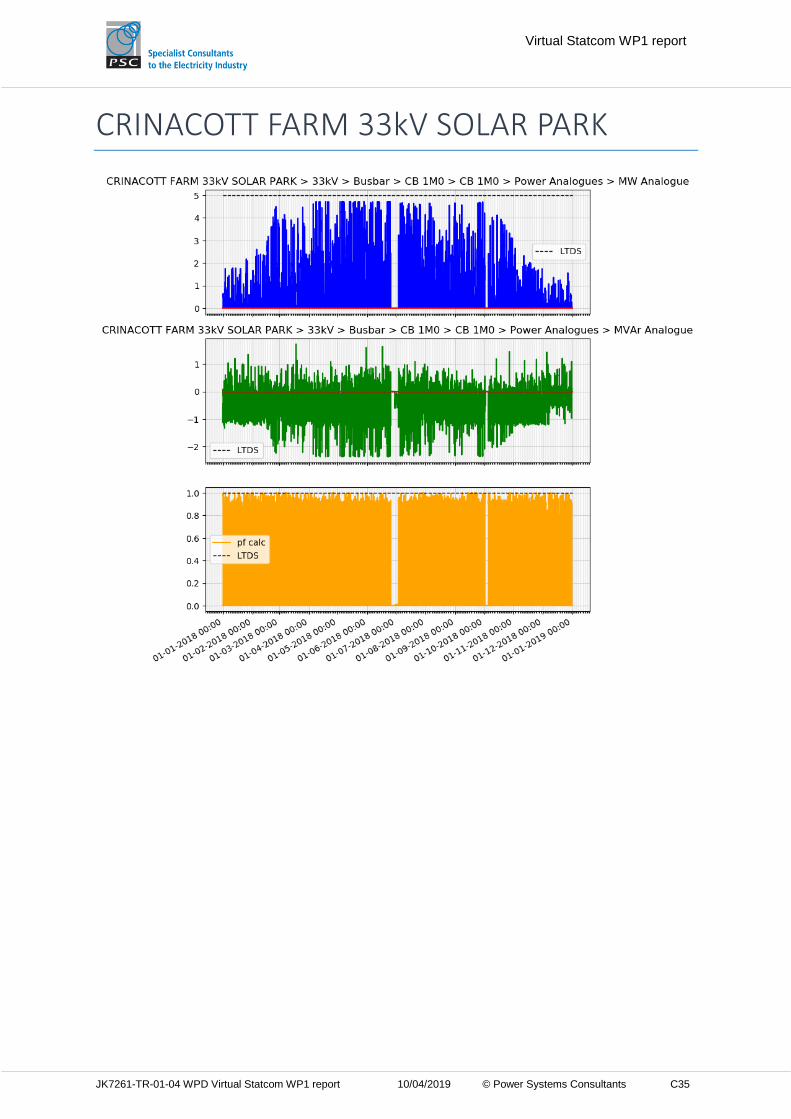
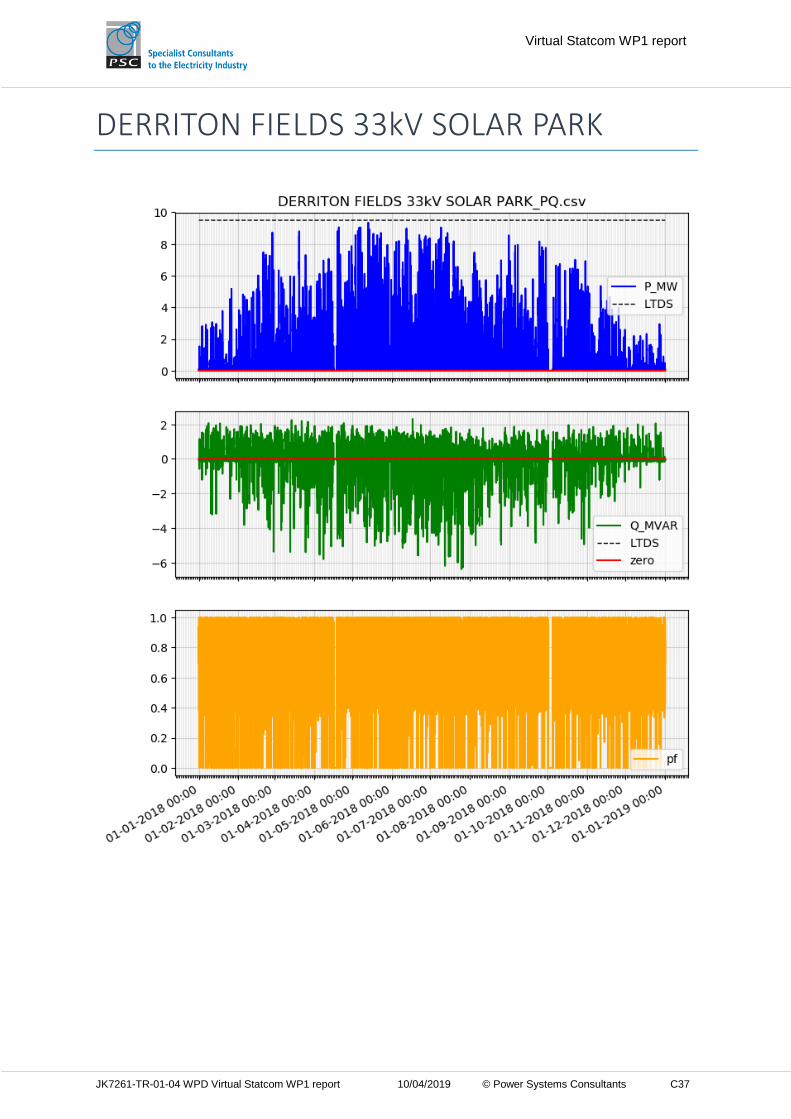
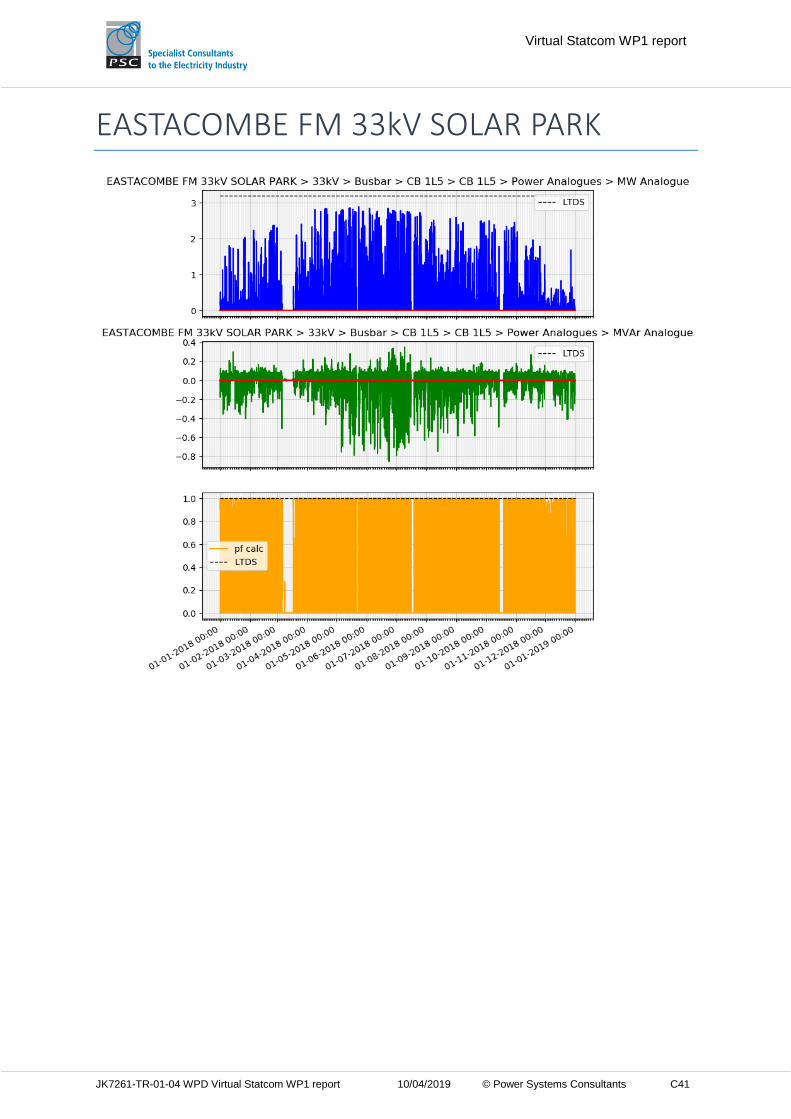
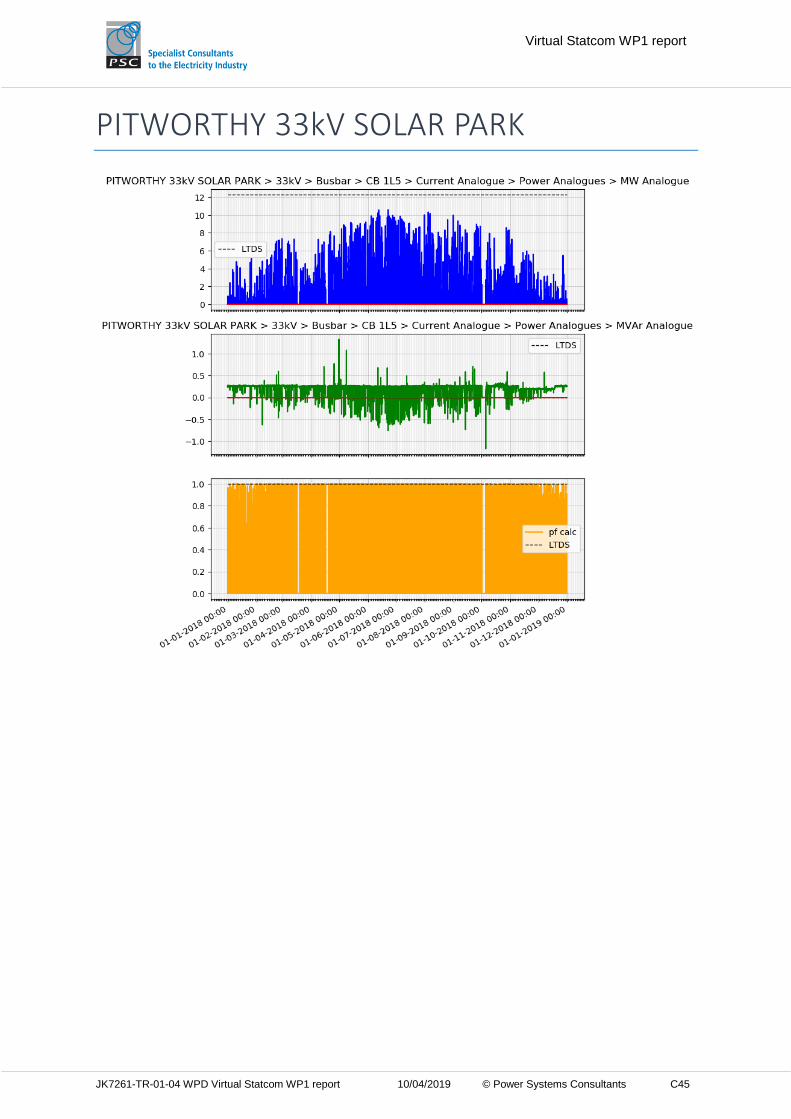
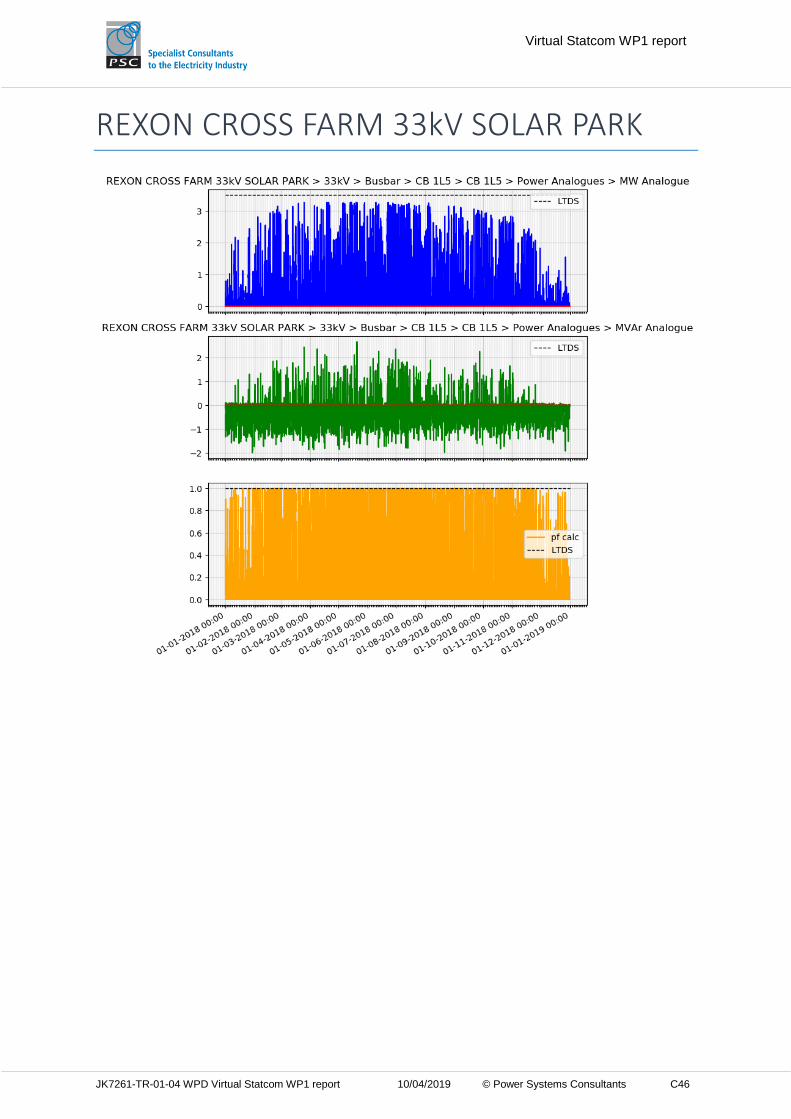
7.1.3 Validation of timeseries data with LTDS
To validate the timeseries data, PSC compared the SCADA values with values from the LTDS.
For load sites the Maximum Demand MVA 2017/18 and power factor from the LTDS was used
to calculate the maximum real and reactive power. For generation sites the size of the
generator was used to determine the maximum real and reactive power. The timeseries data
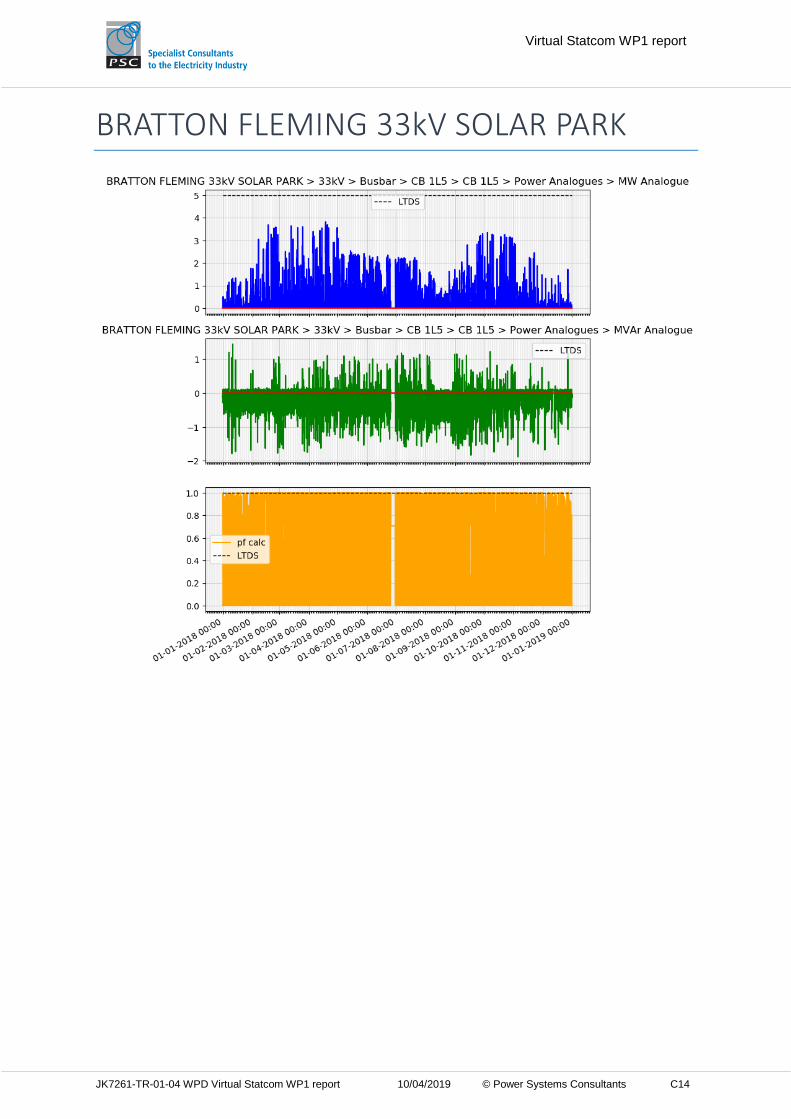
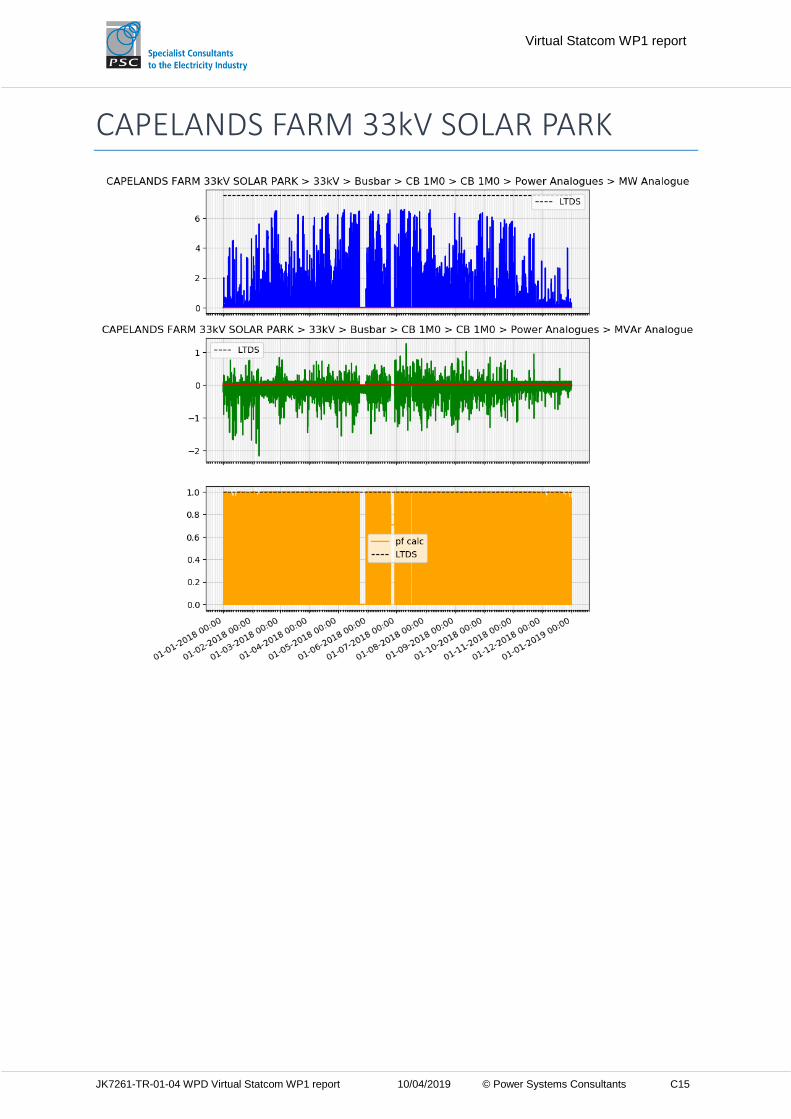
was plotted over a year to check that expected seasonal variations are present in the data.
For example, higher load demand over winter, larger solar generation output over summer.
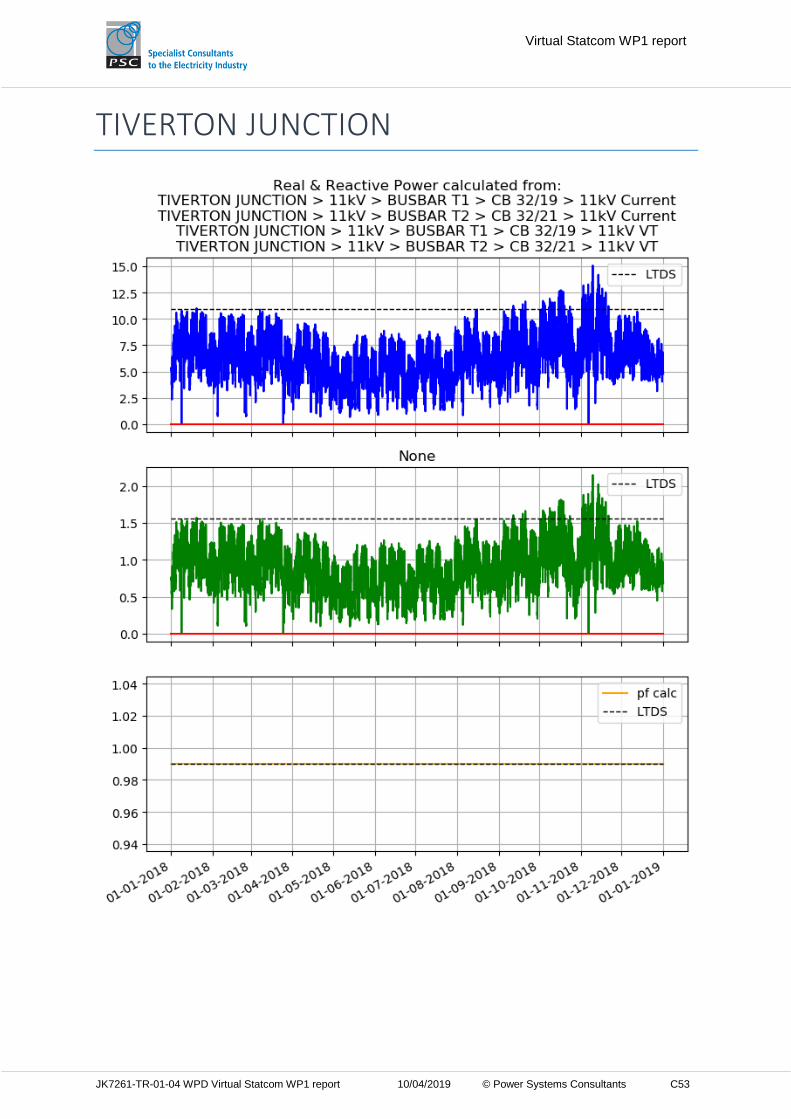
Figure 9 and Figure 10, show the timeseries data validation plots for a load site and a solar
generation site respectively. All site timeseries data validation plots are available in Appendix
C.
Figure 9 - Heddon Cross Load timeseries data 2018
Page 32
Virtual Statcom WP1 report
JK7261-TR-01-04 WPD Virtual Statcom WP1 report 10/04/2019 © Power Systems Consultants 27
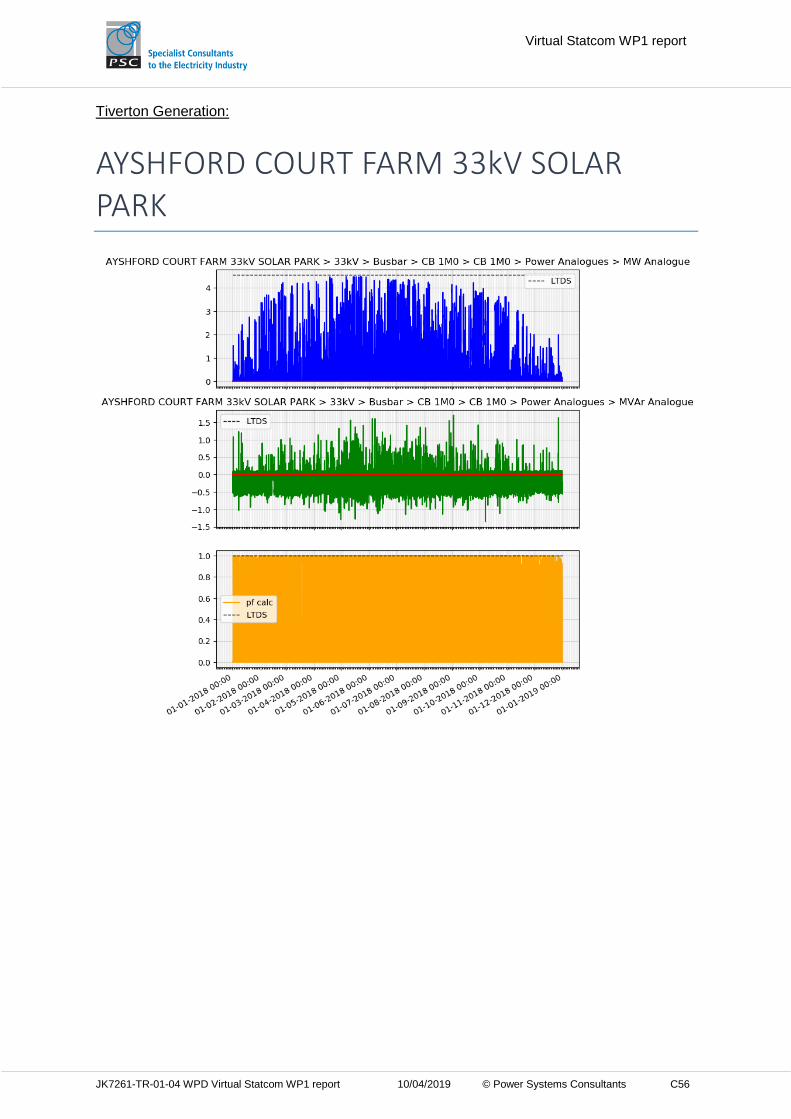
Figure 10 - Beaford 33 kV Solar farm timeseries data 2018
Note: It is expected that the power factor for solar and wind farms will deteriorate when not generating due to zero real power output, Figure 11 shows a zoomed in view of the plot in Figure 10 to demonstrate this.
Figure 11 - Beaford 33kV solar farm timeseries data (zoomed in)
Page 33
Virtual Statcom WP1 report
JK7261-TR-01-04 WPD Virtual Statcom WP1 report 10/04/2019 © Power Systems Consultants 28
7.1.4 Timeseries data mapping to PSS/E
To be able to use the timeseries data in PSS/E the real and relative power extracted/calculated
from the SCADA values need to be mapped to the correct PSS/E load and generation. The
mapping rules that the timeseries studies will use are set out in Appendix D – Timeseries data
mapping to PSS/E.
Page 34
Virtual Statcom WP1 report
JK7261-TR-01-04 WPD Virtual Statcom WP1 report 10/04/2019 © Power Systems Consultants 29
8 Network hosting capacity algorithms
To determine the benefit of a Virtual Statcom it is necessary to compare the existing network
capacity before and after the Virtual Statcom algorithm optimises the reactive power output of
generators.
8.1 Generation hosting capacity
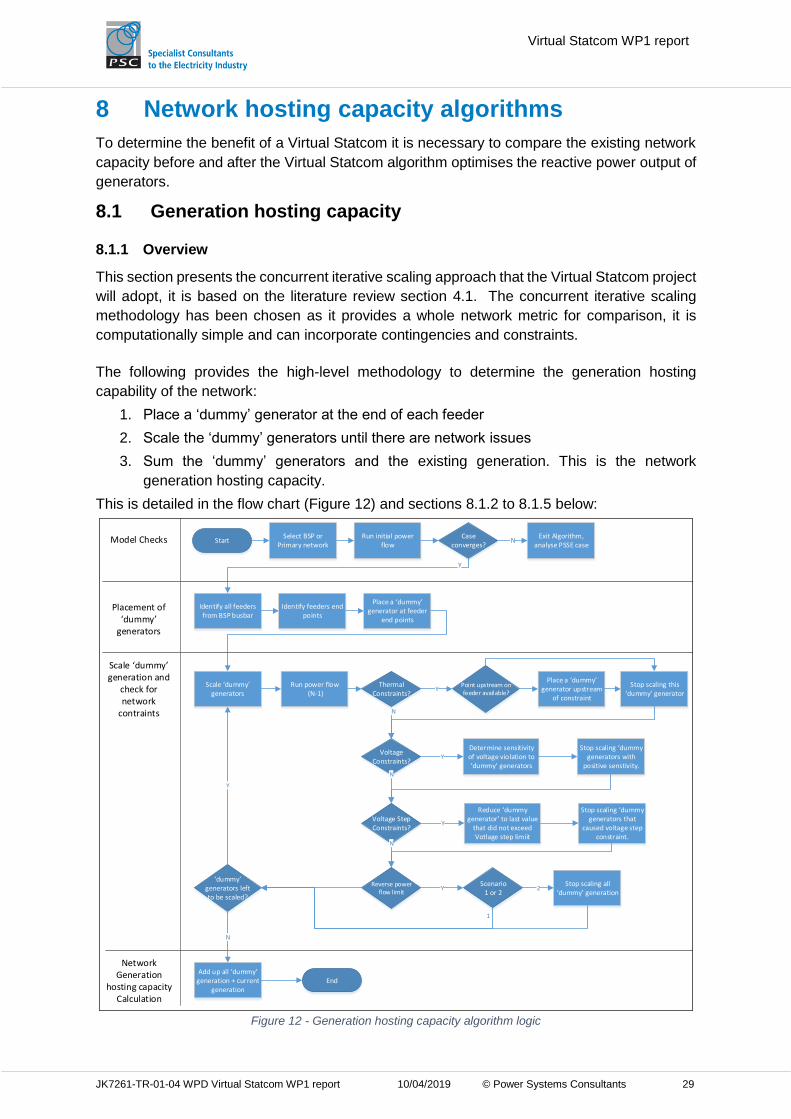
8.1.1 Overview
This section presents the concurrent iterative scaling approach that the Virtual Statcom project
will adopt, it is based on the literature review section 4.1. The concurrent iterative scaling
methodology has been chosen as it provides a whole network metric for comparison, it is
computationally simple and can incorporate contingencies and constraints.
The following provides the high-level methodology to determine the generation hosting
capability of the network:
1. Place a ‘dummy’ generator at the end of each feeder
2. Scale the ‘dummy’ generators until there are network issues
3. Sum the ‘dummy’ generators and the existing generation. This is the network
generation hosting capacity.
This is detailed in the flow chart (Figure 12) and sections 8.1.2 to 8.1.5 below:
StartRun initial power
flowCase
converges?Exit Algorithm,
analyse PSSE case
Identify all feeders from BSP busbar
Identify feeders end points
Select BSP or Primary network
Y
N
Scale dummy generators
Run power flow (N-1)
Place a dummy generator at feeder
end points
Add up all dummy generation + current
generation
Model Checks
End
Scale dummy generation and
check for network
contraints
Network Generation
hosting capacityCalculation
Placement of dummy
generators
Thermal Constraints?
Voltage Constraints?
Reverse power flow limit
Scenario 1 or 2
Y
Y
Point upstream on feeder available?
N
Place a dummy generator upstream
of constraint
Stop scaling this dummy generator
N
Determine sensitivity of voltage violation to dummy generators
Y
Stop scaling dummy generators with
positive senstivity.
Stop scaling all dummy generation
2
dummy generators left to be scaled?
Y
1
N
Voltage StepConstraints?
Reduce dummy generator to last value
that did not exceed Votlage step limiit
Y
Stop scaling dummy generators that
caused voltage step constraint.
N
Figure 12 - Generation hosting capacity algorithm logic
Page 35
Virtual Statcom WP1 report
JK7261-TR-01-04 WPD Virtual Statcom WP1 report 10/04/2019 © Power Systems Consultants 30
8.1.2 Model Checks
The hosting capacity algorithm to be developed in WP2 needs to be generic so that it can work
on any of WPD’s BSPs or Primary networks. Before entering the algorithm, checks will be
performed to ensure that the network model selected results in a convergent power flow.
8.1.3 Placement of ‘dummy’ generators
The hosting capacity algorithm will be required to identify all feeders from a BSP or Primary
busbar and identify the downstream ‘end points’. It is anticipated that this will be done by
summing the feeder impedance path from the BSP busbar, with particular attention being
needed in the algorithm for parallel feeders. Once the end points have been identified the
algorithm will add a ‘dummy’ generator. The initial PQ characteristic of the ‘dummy generator’
will be a generator with zero real and reactive power and unity power factor. The end of the
feeder has been selected to give the largest value of generation that can be located anywhere
along the feeder. The existing generators will not be scaled as they will be used to set up the
operating conditions, initially this will be a minimum generation maximum load case and a
maximum generation minimum load case.
8.1.4 Scale ‘dummy’ generation and check for network constraints
With the ‘dummy’ generators placed the algorithm will then scale the set of ‘dummy’
generators. The initial increment of generation will be 1 MW. The algorithm will use PSS/E
to run a power flow after each increment of generation and assess the network constraints
described in Section 3.2(including N-1 in networks with parallel feeders).
The algorithm will check for different network constraints after each power flow and perform
different adjustments based on the network.
Thermal constraints:
After the power flow is run, if thermal constraints are present the algorithm will determine if
there is a location upstream of the constraint where a new ‘dummy’ generator can be placed.
If there is no upstream point available, the ‘dummy’ generator causing the constraint will not
be scaled on the next iteration of the algorithm.
The following example shown in Figure 13 demonstrates the algorithm for a thermal constraint
where an upstream unconstrained location exists on the feeder.
• A ‘dummy’ generator called ‘Feeder 1’ is placed at Bus 2.
• The algorithm scales generator ‘Feeder 1’ until the line between Bus 1 and Bus 2
overloads.
• The algorithm then determines that the line from the BSP to Bus 1 still has capacity
and places a new ‘dummy’ generator ‘Feeder 1-1’ at Bus 1.
• The algorithm stops scaling generator ‘Feeder 1’ and starts scaling ‘Feeder 1-1’ until
the line between Bus 1 and Bus 2 overloads.
• The hosting capacity will be the summation of the dummy generators. i.e. ‘Feeder 1’ +
‘Fedder 1-1’
Page 36
Virtual Statcom WP1 report
JK7261-TR-01-04 WPD Virtual Statcom WP1 report 10/04/2019 © Power Systems Consultants 31
External Network
BSP
Bus 2
Bus 1
Branch rating 5 MVA
Branch Rating10 MVA
Dummy Generation ( Feeder 1 )
BSP
Bus 2
Bus 1
Branch rating 5 MVA
Branch Rating10 MVA
Dummy Generation ( Feeder 1 )
Dummy Generation
( Feeder 1-1 )
External Network
Figure 13 - Thermal constraint example
Voltage constraints:
After the power flow is run, if voltage constraints are present the algorithm will perform
sensitivity analysis on the ‘dummy’ generators. The ‘dummy’ generators that have a negative
effect on the voltage constraint will not be scaled on the next iterations.
Voltage step constraints:
After the power flow is run, the algorithm will determine if any voltage steps greater that +/-3%
exist by tripping each ‘dummy’ generator in turn and running a power flow. If the voltage step
limit of +/- 3% is exceeded the ‘dummy’ generator the causes the voltage step will be reduced
to the last value that did not cause a voltage step.
Reverse Power flow (RPF) constraints:
After the power flow simulation is run, if the reverse power flow on a network connection
transformer (132/33kV for BSP networks or 33/11kV for primary networks) exceeds its reverse
power flow rating the algorithm will check which of the below scenarios is being run and if:
• Scenario 1, will stop scaling all ‘dummy’ generators.
• Scenario 2, will ignore the reverse power flow constraints and continue to scale the
‘dummy’ generators.
Scenario 2 is included to test the hosting capacity of the network excluding the upstream
transformers’ constraints. This provides comparison between results and demonstrates what
the hosting capacity could be if the reverse power flow ratings of the transformers are
increased.
8.1.5 Calculate network generation hosting capacity
Once the algorithm has stopped scaling all ‘dummy’ generators in the ‘dummy’ generator set,
the generation hosting capacity is calculated as the sum of the apparent power output of the
‘dummy’ generators and the apparent power output of existing generation for the given
generation scenario being considered.
Page 37
Virtual Statcom WP1 report
JK7261-TR-01-04 WPD Virtual Statcom WP1 report 10/04/2019 © Power Systems Consultants 32
8.2 Load hosting capacity
The algorithm used to determine the load hosting capacity is similar to the generation hosting
capacity algorithm but scales existing load rather than ‘dummy’ generators. As loads are at
the ends of a feeder there is no need to place ‘dummy’ loads for the algorithm. The following
provides the high-level methodology to determine the load hosting capability of the network.
1. Identify existing network loads.
2. Scale the network loads until there are network issues.
3. Sum the new value of existing loads. This is the network load hosting capacity.
This is detailed in the flow chart (Figure 14):
StartRun initial power
flowCase
converges?Exit Algorithm,
analyse PSSE case
Identify all feeders existing loads
Select BSP or Primary network
Y
N
Scale loadsRun power flow
(N-1)
Sum all loads
Model Checks
End
Scale load and check for network
constraints
Network Load hosting capacity
Calculation
Identify networks loads
Thermal Constraints?
Voltage Constraints?
Y
N
Stop scaling loads downstream of
thermal constraint
N
Determine sensitivity of voltage violation to
loadY
Stop scaling loads with positive
senstivity.
Loads left to be scaled?
Y
N
Figure 14 - Load hosting capacity algorithm logic
Page 38
Virtual Statcom WP1 report
JK7261-TR-01-04 WPD Virtual Statcom WP1 report 10/04/2019 © Power Systems Consultants 33
8.3 Implementing hosting capacity algorithms
The hosting capacity algorithms will be implemented in a Python 2.7 script to automate PSS/E.
Automation will follow the algorithms described in Sections 8.1 and 8.2. For each scenario the
algorithm will output:
• An excel spreadsheet with the algorithm summary results including:
o The load and generation summary for the network.
o The overall hosting capacity (generation and load), with and without RPF
constraints.
o The limiting constraint type and location.
o The number of power flows run.
o The time taken to calculate the hosting capacity.
• A .sav file with the scaled model
• A .log file with the details of the automation actions
Page 39
Virtual Statcom WP1 report
JK7261-TR-01-04 WPD Virtual Statcom WP1 report 10/04/2019 © Power Systems Consultants 34
9 Virtual Statcom optimisation
9.1 P-Q capability of DGs
The DGs modelled in WPD’s PSS/E network models are currently modelled with a fixed power
factor. The fundamental assumption of the Virtual Statcom algorithm is the ability to control
the reactive power output of existing generators.
Detailed modelling of the PQ capabilities of the DGs in the study network selected proved not
practical due to the limited information available. For this reason, the initial algorithm
developed will assume that every DG can operate in the power factor range from 0.95 leading
to 0.95 lagging across the active power range of the DG, this is shown by the blue shaded
area in Figure 6 below. This is more conservative than assuming that each DG has a full
converter connection.
Figure 15 - PQ capability of DGs
9.2 Optimisation strategy
The objective of the Virtual Statcom algorithm is to maximise the hosting capacity using the
reactive power output of generators. The literature review in Section 4.2 identified that the
objective of Virtual Statcom algorithm can be defined as an ORPD problem, therefore the
Virtual Statcom project will take this approach to the optimisation strategy. This section sets
out the formulation of the ORPD problem for the Virtual Statcom algorithm.
9.2.1 Objective function
The objective of the Virtual Statcom algorithm is to maximise the hosting capacity using the
reactive power output of generators. This suggests that the objective function could be defined
to maximise the hosting capacity calculated from the algorithm in Section 8.1 and this is
possible. However, hosting capacity is calculated iteratively and during the optimisation
process the objective function needs to be evaluated multiple times, this could place a high
burden on computation resources and result in slow solving times.
Page 40
Virtual Statcom WP1 report
JK7261-TR-01-04 WPD Virtual Statcom WP1 report 10/04/2019 © Power Systems Consultants 35
As shown in the literature review Section 4.2.1 the minimisation of real power losses in the
branches corresponds to minimised reactive power branch flow and the greatest thermal
headroom on branches which can be used as a proxy for maximum hosting capacity. From
PSS/E, the branch real or reactive power and losses can be extracted. As both are
computationally similar in complexity, either can be used as the objective function. Therefore,
the objective function will be set as:
𝑀𝑖𝑛𝑖𝑚𝑖𝑠𝑒 ∑ 𝑃𝑙𝑜𝑠𝑠𝑒𝑠𝑛
𝑏𝑟
𝑛=1
or
𝑀𝑖𝑛𝑖𝑚𝑖𝑠𝑒 ∑ 𝑄𝑓𝑙𝑜𝑤𝑛
𝑏𝑟
𝑛=1
Where:
𝑏𝑟 = the total branches in the network
𝑃𝑙𝑜𝑠𝑠𝑒𝑠𝑛 = The real power losses in branch 𝑛
𝑄𝑓𝑙𝑜𝑤𝑛 = Reactive power flowing on the branch 𝑛
Note: When developing the optimisation algorithm, these objective functions will be compared
to ensure consistency and if any speed advantages exist between the two.
9.2.2 Control variables
The control variables for the optimisation are the set of power factors for each generator.
𝜃 = (𝜃1, 𝜃2 , … , 𝜃𝑛)
Where
𝜃1 = the power factor for generator 1
𝑛 = the total number of DGs in the network
9.2.3 Optimisation constraints
The optimisation will be subject to the following constraints:
• The power factor of each generator is within operating range set out in Section 9.1 or
by voltage step considerations.
• Real and Reactive power balance (i.e. load real and reactive power is met).
• Bus voltages are within +/- 6 %.
• Branch flow is less than the branch ratings.
Note: Voltage step constraints will be incorporated by limiting the power factor range of
generators initially to reduce computational burden, see Section 9.3.2 for more detail.
9.2.4 Optimisation solver
The initial optimisation algorithm will be developed using a Particle Swarms Optimisation approach as it provides the following advantages:
• From the literature review it is tried and proven and used as a benchmark for optimal reactive power dispatch problems.
Page 41
Virtual Statcom WP1 report
JK7261-TR-01-04 WPD Virtual Statcom WP1 report 10/04/2019 © Power Systems Consultants 36
• Computational time - with the size of the WPD’s BSP and primary networks, it is not anticipated that the computational time associated with particle swarm will be burdensome.
• Availability of open source Python packages – psopy 0.2.3 and pyswarm 1.0.0.
9.2.5 Particle Swarm Optimisation (PSO) overview
The basis of Particle Swarm Optimisation is to define a set of particles (swarm), these particles
then search the objective function space following certain rules to find the global solution. It
is an iterative approach and the swarm ‘communicates’ at the end of each iteration to modify
the swarm’s best solution and particle’s best solution. The swarm’s and particle’s best values
are used to update particle search parameters for the next iteration. A particle in the Virtual
Statcom algorithm is the vector of generator power factors.
𝜃𝑝1 = (𝜃𝑝𝑓1, 𝜃𝑝𝑓2 , … , 𝜃𝑝𝑓𝑛)
Where
𝜃𝑝1 = is particle 1
𝜃𝑝𝑓1 = the power factor for generator 1
𝑛 = the total number of DGs in the network
9.3 Virtual Statcom algorithm overview
The high-level overview of the algorithm is presented in the flowchart in Figure 16. The
algorithm is split into the following areas:
1. Model Checks.
2. Pre-optimisation network capacity (using algorithm in Section 8.1).
3. Allocate PQ capabilities.
4. Initialise optimisation.
5. Perform optimisation.
6. Post-optimisation network capacity.
Page 42
Virtual Statcom WP1 report
JK7261-TR-01-04 WPD Virtual Statcom WP1 report 10/04/2019 © Power Systems Consultants 37
Start
Run initial power flow
Case converges?
Exit Algorithm, analyse PSSE case
Calculate the Before
optimisation network capacity
Allocate PQ capabilities to DGs
Select BSP or Primary network
Y
Define Control Variables
(i.e DGs reactive power)
Define Network Constraints
Define Objective function
Set End Criteria: Iterations limits
and/or tolerance
Initialise particle population & search
parameters
Evaluate objective function for each
particle (PSSE)
Update Particles and Swarms best archive
End Criteria met?
Update particles search parameters
N
Calculate the After optimisation
network capacity
Y
Model Checks
End
Pre-optimisation Network Capacity
Initialise Optimisation
Perform Optimisation
Post optimisation
Network Capacity
Contains Generation?
N
N
Allocate PQ Capabilities
Voltage Step calculations
Figure 16 - Virtual Statcom optimisation algorithm
9.3.1 Model Checks & Pre-optimisation network capacity
The Virtual Statcom to be developed in WP2 needs to be generic so that it can work on any
of WPD’s BSPs or Primary networks. Before entering the algorithm, checks will be performed
to ensure that the network model selected results in a convergent power flow and includes
generation.
After the model passes the model checks the network hosting capacity algorithms described
in Section 8.1 will determine the base case hosting capacity for load and generation for the
given generation and load scenario in the model. The base case hosting capacities will be
saved to compare with the after-optimisation hosting capacities.
9.3.2 Allocate PQ capabilities
The majority of DGs modelled in WPD’s PSS/E network models are currently modelled at a
fixed power factor. However, the algorithm will first assess if any of the DGs have PQ capability
modelled, indicated in PSS/E by Qmax ≠ Qmin. These DGs will be excluded from being
Page 43
Virtual Statcom WP1 report
JK7261-TR-01-04 WPD Virtual Statcom WP1 report 10/04/2019 © Power Systems Consultants 38
allocated PQ capabilities. For the DGs that have a fixed power, the algorithm will update the
DGs reactive power parameters in the PSS/E model to reflect the PQ capability range
described in Section 9.1.
After PQ capability have been assigned the algorithm will perform voltage step calculations
for each generator at both maximum power factor leading and lagging. If a voltage step
change is greater than +/3 % the algorithm will scale back the power factor until there is no
violation. The generator PQ capability will then be updated. For example, a certain generator
may be updated to a power factor range of 0.96 leading to 0.96 lagging due to voltage step
limits, as shown in Figure 17.
Figure 17 - P-Q characteristic with voltage step limit
9.3.3 Initialise Optimisation
Objective function - For the selected network the algorithm will determine the network
branches to include in the objective function summation.
Define Control variables - For the selected network the algorithm will determine the generators
to control reactive power output through pf control.
Define Network constraints - For the selected network the algorithm will determine the network
bus and branches to act as constraints. Bus voltage limits will be hardcoded at +/-6%, branch
thermal limits will be extracted from the network model. The load balance constraints will be
met when the load flow is run in PSS/E.
Set End Criteria – Particle Swarm Optimisation is an iterative based optimisation. The end
criteria can be a tolerance between successive iterations and/or iterations limit. Based on
literature the iterations limit will be initially set at 1000. The effect of the end criteria tolerance
and iteration limit will be assessed when developing the Virtual Statcom algorithm and
changes may be introduced and best approach will be suggested dependent on the
observations and experience gathered.
MW
pf 0.95
pf 0.95
-Q +Q
1 p.u
pf 0.96
pf 0.96
Page 44
Virtual Statcom WP1 report
JK7261-TR-01-04 WPD Virtual Statcom WP1 report 10/04/2019 © Power Systems Consultants 39
9.3.4 Perform Optimisation
The algorithm will utilise an open source python PSO package to minimise the objective
function. The flow chart in provides a high-level summary of PSO. The number of particles will
be initially set at 100. The effect of the number of particles on the performance of the algorithm
will be will be assessed when developing the Virtual Statcom algorithm and changes may be
introduced.
9.3.5 Post-optimisation network capacity
Once the reactive power has been optimised, the algorithm will evaluate the network capacity
using the network capacity algorithms of Section 8 and compare to the un-optimised case.
9.4 Implementation of the Virtual Statcom algorithm
The optimisation algorithm will be implemented in a Python 2.7 script to automate PSS/E.
Automation will follow the algorithm described in Section 9.3 and use a PSO python package
to optimise the objective function. The output of the algorithm will be:
• An excel spreadsheet with the algorithm summary results including:
o The load and generation summary for the network.
o The power factor for each DG in the network.
o The before and after generation and load hosting capacity.
o The number of power flows run.
o The time taken to calculate the capacity.
• A .sav file with the optimised model.
• A .log file with the details of the automation actions.
Page 45
Virtual Statcom WP1 report
JK7261-TR-01-04 WPD Virtual Statcom WP1 report 10/04/2019 © Power Systems Consultants 40
References
[1] Western Power Distribution & Power System Consultants UK, Network Innovation Allowance Virtual Statcom Project Collaboration agreement, 2018.
[2] Thomas, L. J., Burchill, A., Rogers, D. J., Guest, M., & Jenkins, N, “Assessing distribution network hosting capacity with the addition of soft open points,” IET, 2016.
[3] Al Alamat, Fadi, “"Increasing the hosting capacity of radial distribution grids in Jordan.,” 2015.
[4] Mahmud, M. A., Hossain, M. J., & Pota, H. R, “Analysis of voltage rise effect on distribution network with distributed generation,” IFAC Proceedings Volumes, no. 44, 2011.
[5] Reno, M. J., Coogan, K., Seuss, J., & Broderick, R. J., “Novel Methods to Determine Feeder Locational PV Hosting Capacity and PV Impact Signatures,” Sandia National Lab (No. SAND2017-4954, 2017.
[6] Y. Mavrocostanti, J.Berry, “SDRC-4 – Trialling and Demonstrating the EVA method,” Western Power Distribution, 2017.
[7] Dent, C. J., Ochoa, L. F., Harrison, G. P., & Bialek, J. W., “Efficient secure AC OPF for network generation capacity assessment,” IEEE Transactions on Power systems 25.1 (2010), vol. 25.1, pp. 575-583, 2010.
[8] Harrison, G. P., and A. R. Wallace, “Optimal power flow evaluation of distribution network capacity for the connection of distributed generation.,” IEE Proceedings-Generation, Transmission and Distribution, vol. 152.1, pp. 115-122, 2005.
[9] Dent, Chris J., Luis F. Ochoa, and Gareth P. Harrison, “Network distributed generation capacity analysis using OPF with voltage step constraints,” IEEE Transactions on Power systems, vol. 25.1, pp. 296-304, 2010.
[10] Vovos, P. N., Harrison, G. P., Wallace, A. R., & Bialek, J. W., “Optimal power flow as a tool for fault level-constrained network capacity analysis,” EEE Transactions on Power Systems, vol. 20(2), pp. 734-741, 2005.
[11] Wanik, Mohd Zamri; Che, Istvan Erlich; Mohamed, Azah, “Intelligent management of distributed generators reactive power for loss minimization and voltage control,” in 2010 15th IEEE Mediterranean Electrotechnical Conference.
[12] Li, Ying; Cao, Yijia; Liu, Zhaoyan; Liu, Yi; Jiang., Quanyuan, “Dynamic optimal reactive power dispatch based on parallel particle swarm optimization algorithm.,” Computers & Mathematics with Applications, Vols. 57(11-12), pp. 1835-1842, 2009.
[13] Singh, Sameer; Jain, Vivek Kumar; Prasad., Upendra, “Power Loss Reduction in Power System based on PSO: Case Study.,” International Journal of Computer Applications, vol. 164, 2017.
[14] Nakawiro, Worawa; Erlich, István; Rueda, José Luis, “A novel optimization algorithm for optimal reactive power dispatch: A comparative study,” in 2011 4th International Conference on Electric Utility Deregulation and Restructuring and Power Technologies , 2011.
[15] Sakthivel, S; Manopriya, P; Venus, S; Ranjitha, S; Subhashini, R, “Optimal reactive power dispatch problem solved by using flower pollination algorithm,” International Journal of Applied Engineering Research, vol. 11(6), pp. 4387-4391, 2016.
[16] Dieu, Vo Ngoc; An, Nguyen Huu Thien; Kien, Vo Trung, “Optimal Reactive Power Dispatch Using Artificial Bee Colony Method,” GMSARN INTERNATIONAL JOURNAL, vol. 29, 2015.
[17] Mouassa, Souhil; Bouktir, Tarek; Salhi, Ahmed, “Ant lion optimizer for solving optimal reactive power dispatch problem in power systems,” Engineering science and technology, an international journal, vol. 20(3), pp. 885-895, 2017.
Page 46
Virtual Statcom WP1 report
JK7261-TR-01-04 WPD Virtual Statcom WP1 report 10/04/2019 © Power Systems Consultants 41
[18] S. Duman, Y. Sönmez, U. Güvenç and N. Yörükeren, “Optimal reactive power dispatch using a gravitational search algorithm,” IET generation, transmission & distribution, vol. 6(6), pp. 563-576, 2012.
[19] Govindaraj, T; Udayakumar, S, “Optimal reactive power planning and real power loss minimization using cuckoo search algorithm,” International journal of innovative research in electrical, electronics, instrumentation and control engineering, vol. 2(2), pp. 1-5, 2014.
[20] Y. Mavrocostanti, J.Berry, “SDRC‐7 – Trialling and Demonstrating the Integration of the EVA, SVO and FPL Methods,” Western Power Distribution, 2018.
[21] UK Power Networks, National Grid, “Transmission & Distribution Interface 2.0 (TDI 2.0) - SDRC 9.1 – Technical High Level Design,” 2017.
Page 47
Virtual Statcom WP1 report
JK7261-TR-01-04 WPD Virtual Statcom WP1 report 10/04/2019 © Power Systems Consultants A1
Appendix A – BSP and Primary network summaries
Page 48
Virtual Statcom WP1 report
JK7261-TR-01-04 WPD Virtual Statcom WP1 report 10/04/2019 © Power Systems Consultants A1
BSP Case Total Gens @ 33.0kV
Total MW
(Pmax)
Total MVAR (Qmax)
Total MW
(Pgen)
Total MVAr (Qgen)
PF (calc)
Bus Count
Load Count
Load MW
Load MVAr
Voltage Violations
Winter Day / Cyclic (Tx)
Branch
Loadings >80%
Shoulder/ Nameplate (Tx)
Branch
Loadings > 80%
Summer/ Reverse Power (Tx)
Branch
Loadings > 80%
GTX Reverse Power Loading
AVONMOUTH 33
Max Gen Min Load
8 77.60 -23.74 77.60 -23.74 0.96 39 6 22.20 11.19 0 2 2 2 8861 GT1 @ 58.56% 8862 - 8865 GT2 @ 39.60%
AVONMOUTH 33
Min Gen Max Load
8 77.60 -23.74 0.00 0.00 1.00 39 6 73.99 37.29 0 0 0 0
BARNSTAPL 33
Max Gen Min Load
8 48.25 -8.45 48.25 -8.45 0.98 61 11 12.77 3.65 3 violations
2 2 2 8131 - 8135 GT1 @ 48.61% 8132 - 8135 GT2 @ 32.54%
BARNSTAPL 33
Min Gen Max Load
8 48.25 -8.45 0.00 0.00 0.00 61 11 42.58 12.15 0 0 0 0
BATH 33 Max Gen Min Load
0 0.00 0.00 0.00 0.00 0.00 40 9 23.52 1.85 0 0 0 0 8931 - 8935 GT1 @ 18.70% 8932 - 8935 GT2 @ 18.70%
BATH 33 Min Gen Max Load
0 0.00 0.00 0.00 0.00 0.00 40 9 78.41 6.15 0 0 0 0
BOWHAYS X 33
Max Gen Min Load
2 30.82 -5.08 30.82 -5.08 0.99 27 7 6.37 0.76 0 1 1 1 8621 - 8625 GT1 @ 43.05% 8622 - 8625 GT2 @ 43.16%
BOWHAYS X 33
Min Gen Max Load
2 30.82 -5.08 0.00 0.00 0.00 27 7 21.22 2.54 0 0 0 0
BRADLY ST 33 Max Gen Min Load
5 62.88 -0.79 62.88 -0.79 1.00 55 13 39.94 9.06 0 0 0 0 8871 - 8875 GT1 @ 6.40% 8873 - 8875 GT2 @ 11.31%
Page 49
Virtual Statcom WP1 report
JK7261-TR-01-04 WPD Virtual Statcom WP1 report 10/04/2019 © Power Systems Consultants A2
BSP Case Total Gens @ 33.0kV
Total MW
(Pmax)
Total MVAR (Qmax)
Total MW
(Pgen)
Total MVAr (Qgen)
PF (calc)
Bus Count
Load Count
Load MW
Load MVAr
Voltage Violations
Winter Day / Cyclic (Tx)
Branch
Loadings >80%
Shoulder/ Nameplate (Tx)
Branch
Loadings > 80%
Summer/ Reverse Power (Tx)
Branch
Loadings > 80%
GTX Reverse Power Loading
BRADLY ST 33 Min Gen Max Load
5 62.88 -0.79 0.00 0.00 0.00 55 13 110.65 27.39 2 violations
0 1 0
BRIDGWATR 33
Max Gen Min Load
14 125.05 -24.12 125.05 -24.12 0.98 85 12 33.59 6.49 3 violations
1 2 3 10846 - 10848 GT1 @ 30.03% 10847 - 10849 GT2 @ 30.03%
BRIDGWATR 33
Min Gen Max Load
14 125.05 -24.12 0.00 0.00 1.00 85 12 111.95 21.62 0 0 1 0
CAMBORNE 33
Max Gen Min Load
4 27.50 -4.70 27.50 -4.70 0.99 28 4 12.38 1.62 0 0 0 1 8461 - 8465 GT1 @ 26.52% 8462 - 8465 GT2 @ 22.47%
CAMBORNE 33
Min Gen Max Load
4 27.50 -4.70 0.00 0.00 0.00 28 4 41.27 5.39 0 0 1 0
CHURCHILL 33
Max Gen Min Load
5 30.39 -0.85 30.39 -0.85 1.00 72 12 17.71 4.39 0 0 0 0 8731 - 8735 GT1 @ 16.88% 8732 - 8735 GT2 @ 17.85%
CHURCHILL 33
Min Gen Max Load
5 30.39 -0.85 0.00 0.00 0.00 72 12 59.02 14.62 0 0 1 0
EAST YELL 33 Max Gen Min Load
7 49.53 -8.45 49.53 -8.45 0.99 46 8 16.57 2.15 0 0 1 1 8121 - 8125 GT1 @ 40.47% 8122 - 8125 GT2 @ 50.20%
Page 50
Virtual Statcom WP1 report
JK7261-TR-01-04 WPD Virtual Statcom WP1 report 10/04/2019 © Power Systems Consultants A3
BSP Case Total Gens @ 33.0kV
Total MW
(Pmax)
Total MVAR (Qmax)
Total MW
(Pgen)
Total MVAr (Qgen)
PF (calc)
Bus Count
Load Count
Load MW
Load MVAr
Voltage Violations
Winter Day / Cyclic (Tx)
Branch
Loadings >80%
Shoulder/ Nameplate (Tx)
Branch
Loadings > 80%
Summer/ Reverse Power (Tx)
Branch
Loadings > 80%
GTX Reverse Power Loading
EAST YELL 33 Min Gen Max Load
7 49.53 -8.45 0.00 0.00 0.00 46 8 55.23 7.16 0 0 0 0
ERNESETTL 33 Max Gen Min Load
4 47.00 -6.57 47.00 -6.57 0.99 33 7 14.96 3.67 0 1 1 2 8531 - 8535 GT1 @ 26.94% 8532 - 8535 GT2 @ 26.59%
ERNESETTL 33 Min Gen Max Load
4 47.00 -6.57 0.00 0.00 1.00 33 7 49.88 12.23 0 0 0 0
EXETER CI 33 Max Gen Min Load
3 42.07 -11.03 42.07 -11.03 0.97 55 11 26.91 5.36 0 3 3 3 8332 - 8335 GT2 @ 53.54% 8333 - 8335 GT3 @ 37.28%
EXETER CI 33 Min Gen Max Load
3 42.07 -11.03 0.00 0.00 0.00 55 11 89.69 17.85 0 0 0 0
EXETER MA 33
Max Gen Min Load
3 22.90 -0.80 22.90 -0.80 1.00 30 6 8.69 2.35 0 0 0 0 8312 - 8314 GT1 @ 16.92% 8313 - 8315 GT2 @ 16.29%
EXETER MA 33
Min Gen Max Load
3 22.90 -0.80 0.00 0.00 0.00 30 6 28.95 7.84 0 0 0 0
EXMOUTH 33
Max Gen Min Load
3 13.38 0.00 13.38 0.00 1.00 27 6 8.94 1.65 0 0 0 0 8321 - 8325 GT1 @ 31.33% 8322 - 8325 GT2 @ 5.51%
Page 51
Virtual Statcom WP1 report
JK7261-TR-01-04 WPD Virtual Statcom WP1 report 10/04/2019 © Power Systems Consultants A4
BSP Case Total Gens @ 33.0kV
Total MW
(Pmax)
Total MVAR (Qmax)
Total MW
(Pgen)
Total MVAr (Qgen)
PF (calc)
Bus Count
Load Count
Load MW
Load MVAr
Voltage Violations
Winter Day / Cyclic (Tx)
Branch
Loadings >80%
Shoulder/ Nameplate (Tx)
Branch
Loadings > 80%
Summer/ Reverse Power (Tx)
Branch
Loadings > 80%
GTX Reverse Power Loading
EXMOUTH 33
Min Gen Max Load
3 13.38 0.00 0.00 0.00 0.00 27 6 29.79 5.49 0 0 1 0
FEEDER RD 33 Max Gen Min Load
3 27.50 -9.04 27.50 -9.04 0.95 65 10 54.37 6.64 0 0 0 0 8831 - 8835 GT1 @ 22.14% 8832 - 8836 GT2 @ 11.02% 8833 - 8835 GT3 @ 17.38% 8834 - 8836 GT4 @ 13.05%
FEEDER RD 33 Min Gen Max Load
3 27.50 -9.04 0.00 0.00 1.00 65 10 181.23 22.14 0 0 0 0
FRADDON 33
Max Gen Min Load
16 133.83 -9.68 133.83 -9.68 1.00 83 12 23.74 2.72 0 0 0 3 8449 - 8457 GT3 @ 36.61% 8450 - 8458 GT4 @ 34.04% 8453 - 8456 GT1 @ 45.60% 8454 - 8455 GT2 @ 55.42%
FRADDON 33
Min Gen Max Load
16 133.83 -9.68 0.00 0.00 0.00 83 12 79.15 9.06 0 0 0 0
HAYLE 33 Max Gen Min Load
2 33.00 0.00 33.00 0.00 1.00 57 10 18.14 1.13 1 violation
0 1 2 8431 - 8435 GT2 @ 23.51% 8432 - 8435 GT1 @ 23.51%
Page 52
Virtual Statcom WP1 report
JK7261-TR-01-04 WPD Virtual Statcom WP1 report 10/04/2019 © Power Systems Consultants A5
BSP Case Total Gens @ 33.0kV
Total MW
(Pmax)
Total MVAR (Qmax)
Total MW
(Pgen)
Total MVAr (Qgen)
PF (calc)
Bus Count
Load Count
Load MW
Load MVAr
Voltage Violations
Winter Day / Cyclic (Tx)
Branch
Loadings >80%
Shoulder/ Nameplate (Tx)
Branch
Loadings > 80%
Summer/ Reverse Power (Tx)
Branch
Loadings > 80%
GTX Reverse Power Loading
HAYLE 33 Min Gen Max Load
2 33.00 0.00 0.00 0.00 0.00 57 10 60.46 3.78 1 violation
0 0 0
LANDULPH 33
Max Gen Min Load
5 38.42 0.00 38.42 0.00 1.00 36 8 11.43 3.26 0 1 1 1 8512 - 8515 GT2 @ 93.10%
LANDULPH 33
Min Gen Max Load
5 38.42 0.00 0.00 0.00 0.00 36 8 38.09 10.87 0 0 0 0
LOCKLEAZE 33
Max Gen Min Load
5 47.16 -9.86 47.16 -9.86 0.98 61 11 37.40 2.77 0 0 0 2 8851 - 8856 GT1 @ 15.20% 8852 - 8855 GT2 @ 45.66% 8853 - 8855 GT3 @ 46.39% 8854 - 8856 GT4 @ 16.44%
LOCKLEAZE 33
Min Gen Max Load
5 47.16 -9.86 0.00 0.00 1.00 61 11 124.66 9.23 0 1 1 1
MILEHOUSE 33
Max Gen Min Load
1 23.90 0.00 23.90 0.00 1.00 19 6 17.94 2.70 0 0 0 0 8061 - 8065 GT1 @ 3.63% 8063 - 8065 GT2 @ 3.60%
MILEHOUSE 33
Min Gen Max Load
1 23.90 0.00 0.00 0.00 0.00 19 6 59.80 8.99 0 0 0 0
N/TAWTON 33
Max Gen Min Load
3 22.70 -5.90 22.70 -5.90 0.97 20 5 5.69 1.16 0 1 1 1 8950 - 8955 GT1 @ 43.65%
Page 53
Virtual Statcom WP1 report
JK7261-TR-01-04 WPD Virtual Statcom WP1 report 10/04/2019 © Power Systems Consultants A6
BSP Case Total Gens @ 33.0kV
Total MW
(Pmax)
Total MVAR (Qmax)
Total MW
(Pgen)
Total MVAr (Qgen)
PF (calc)
Bus Count
Load Count
Load MW
Load MVAr
Voltage Violations
Winter Day / Cyclic (Tx)
Branch
Loadings >80%
Shoulder/ Nameplate (Tx)
Branch
Loadings > 80%
Summer/ Reverse Power (Tx)
Branch
Loadings > 80%
GTX Reverse Power Loading
N/TAWTON 33
Min Gen Max Load
3 22.70 -5.90 0.00 0.00 0.00 20 5 18.96 3.88 0 0 0 0
NEWTON AB 33
Max Gen Min Load
5 33.62 -3.25 33.62 -3.25 1.00 42 7 22.86 2.72 0 0 0 0 8351 - 8355 GT2 @ 23.82% 8352 - 8355 GT1 @ 23.88%
NEWTON AB 33
Min Gen Max Load
5 33.62 -3.25 0.00 0.00 0.00 42 7 76.20 9.06 0 0 1 0
PAIGNTON 33
Max Gen Min Load
4 30.58 -8.56 30.58 -8.56 0.96 38 8 18.95 1.99 0 0 0 0 8361 - 8365 GT1 @ 24.10% 8362 - 8365 GT2 @ 26.04%
PAIGNTON 33
Min Gen Max Load
4 30.58 -8.56 0.00 0.00 0.00 38 8 63.18 6.62 0 0 0 0
PLYMOUTH 33
Max Gen Min Load
3 41.95 -4.96 41.95 -4.96 0.99 53 10 23.92 0.82 0 0 1 1 8051 - 8055 GT1 @ 13.42% 8051 - 8055 GT2 @ 13.44% 8052 - 8055 GT3 @ 12.43%
PLYMOUTH 33
Min Gen Max Load
3 41.95 -4.96 0.00 0.00 0.00 53 10 79.74 2.75 0 0 0 0
PLYMPTON 33
Max Gen Min Load
5 39.82 -0.81 39.82 -0.81 1.00 41 9 12.10 2.31 0 0 0 0 8041 - 8045 GT1 @ 42.16% 8042 - 8045 GT2 @ 42.13%
Page 54
Virtual Statcom WP1 report
JK7261-TR-01-04 WPD Virtual Statcom WP1 report 10/04/2019 © Power Systems Consultants A7
BSP Case Total Gens @ 33.0kV
Total MW
(Pmax)
Total MVAR (Qmax)
Total MW
(Pgen)
Total MVAr (Qgen)
PF (calc)
Bus Count
Load Count
Load MW
Load MVAr
Voltage Violations
Winter Day / Cyclic (Tx)
Branch
Loadings >80%
Shoulder/ Nameplate (Tx)
Branch
Loadings > 80%
Summer/ Reverse Power (Tx)
Branch
Loadings > 80%
GTX Reverse Power Loading
PLYMPTON 33
Min Gen Max Load
5 39.82 -0.81 0.00 0.00 0.00 41 9 40.34 7.69 0 0 0 0
PORTISHED 33
Max Gen Min Load
0 0.00 0.00 0.00 0.00 0.00 34 7 12.63 2.87 0 0 0 0 8980 - 8985 GT1 @ 12.65% 8981 - 8985 GT2 @ 12.55%
PORTISHED 33
Min Gen Max Load
0 0.00 0.00 0.00 0.00 0.00 34 7 42.10 9.57 0 0 0 1
PYWORTHY 33
Max Gen Min Load
13 75.47 -2.27 75.47 -2.27 1.00 69 10 15.32 3.14 0 2 2 3 8481 - 8485 GT2 @ 36.52% 8482 - 8485 GT3 @ 37.04% 8483 - 8485 GT4 @ 36.52%
PYWORTHY 33
Min Gen Max Load
13 75.47 -2.27 0.00 0.00 0.00 69 10 51.07 10.46 0 0 0 0
RADSTOCK 33
Max Gen Min Load
12 68.79 -12.21 68.79 -12.21 0.98 84 12 22.15 4.38 0 1 1 2 8921 - 8925 GT1 @ 38.83% 8922 - 8925 GT2 @ 38.33%
RADSTOCK 33
Min Gen Max Load
12 68.79 -12.21 0.00 0.00 0.00 84 12 73.85 14.60 0 0 1 0
RAME 33 Max Gen Min Load
8 49.33 -1.56 49.33 -1.56 1.00 54 10 21.32 3.93 0 0 0 0 8471 - 8475 GT1 @ 30.07% 8472 - 8475 GT2 @ 30.07% 8473 - 8475 GT3 @ 32.58%
Page 55
Virtual Statcom WP1 report
JK7261-TR-01-04 WPD Virtual Statcom WP1 report 10/04/2019 © Power Systems Consultants A8
BSP Case Total Gens @ 33.0kV
Total MW
(Pmax)
Total MVAR (Qmax)
Total MW
(Pgen)
Total MVAr (Qgen)
PF (calc)
Bus Count
Load Count
Load MW
Load MVAr
Voltage Violations
Winter Day / Cyclic (Tx)
Branch
Loadings >80%
Shoulder/ Nameplate (Tx)
Branch
Loadings > 80%
Summer/ Reverse Power (Tx)
Branch
Loadings > 80%
GTX Reverse Power Loading
RAME 33 Min Gen Max Load
8 49.33 -1.56 0.00 0.00 0.00 54 10 71.06 13.11 0 0 1 0
SEABANK 33 Max Gen Min Load
4 76.00 -20.37 76.00 -20.37 0.97 14 2 2.51 1.27 0 1 1 1 8085 - 80967 GT1 @ 44.36% 8085 - 80968 GT2 @ 44.37%
SEABANK 33 Min Gen Max Load
4 76.00 -20.37 0.00 0.00 1.00 14 2 8.38 4.22 0 0 1 1
SOWTON 33 Max Gen Min Load
1 3.40 -0.69 3.40 -0.69 0.98 46 12 18.55 0.00 0 1 1 1 8371 - 8375 GT1 @ 10.08% 8372 - 8375 GT3 @ 0.95%
SOWTON 33 Min Gen Max Load
1 3.40 -0.69 0.00 0.00 0.00 46 12 61.82 0.00 0 0 0 0
ST AUSTEL 33 Max Gen Min Load
7 44.03 -5.60 44.03 -5.60 0.99 59 10 17.37 0.54 0 0 0 0 8421 - 8425 GT1 @ 48.45% 8422 - 8425 GT2 @ 41.54%
ST AUSTEL 33 Min Gen Max Load
7 44.03 -5.60 0.00 0.00 0.00 59 10 57.91 1.80 0 0 0 0
ST GERMAN 33
Max Gen Min Load
10 59.38 -1.48 59.38 -1.48 1.00 43 5 8.47 2.42 0 0 0 0 8521 - 8525 GT1 @ 20.13% 8522 - 8525 GT2 @ 75.25%
Page 56
Virtual Statcom WP1 report
JK7261-TR-01-04 WPD Virtual Statcom WP1 report 10/04/2019 © Power Systems Consultants A9
BSP Case Total Gens @ 33.0kV
Total MW
(Pmax)
Total MVAR (Qmax)
Total MW
(Pgen)
Total MVAr (Qgen)
PF (calc)
Bus Count
Load Count
Load MW
Load MVAr
Voltage Violations
Winter Day / Cyclic (Tx)
Branch
Loadings >80%
Shoulder/ Nameplate (Tx)
Branch
Loadings > 80%
Summer/ Reverse Power (Tx)
Branch
Loadings > 80%
GTX Reverse Power Loading
ST GERMAN 33
Min Gen Max Load
10 59.38 -1.48 0.00 0.00 0.00 43 5 28.23 8.05 0 0 0 0
ST TUDY 33 Max Gen Min Load
8 51.96 0.00 51.96 0.00 1.00 56 9 14.38 2.01 0 1 2 2 8441 - 8445 GT1 @ 50.11% 8442 - 8445 GT2 @ 50.32%
ST TUDY 33 Min Gen Max Load
8 51.96 0.00 0.00 0.00 0.00 56 9 47.94 6.71 0 0 0 0
STREET 33 Max Gen Min Load
4 28.49 -4.45 28.49 -4.45 0.99 34 6 12.04 2.33 0 0 0 0 8741 - 8745 GT1 @ 49.71%
STREET 33 Min Gen Max Load
4 28.49 -4.45 0.00 0.00 0.00 34 6 40.15 7.75 0 0 0 0
TAUNTON 33
Max Gen Min Load
12 94.55 -20.66 94.55 -20.66 0.98 59 10 23.26 3.63 0 2 3 3 8611 - 8615 GT1 @ 32.29% 8611 - 8615 GT2 @ 32.39% 8611 - 8616 GT3 @ 88.48%
TAUNTON 33
Min Gen Max Load
12 94.55 -20.66 0.00 0.00 1.00 59 10 77.52 12.11 0 1 4 1
TIVERTON 33 Max Gen Min Load
5 18.55 -2.84 18.55 -2.84 0.99 41 8 14.78 2.35 0 0 0 0 8345 - 8348 G1 @ 27.25% 8345 - 8349 G2 @ 36.01%
Page 57
Virtual Statcom WP1 report
JK7261-TR-01-04 WPD Virtual Statcom WP1 report 10/04/2019 © Power Systems Consultants A10
BSP Case Total Gens @ 33.0kV
Total MW
(Pmax)
Total MVAR (Qmax)
Total MW
(Pgen)
Total MVAr (Qgen)
PF (calc)
Bus Count
Load Count
Load MW
Load MVAr
Voltage Violations
Winter Day / Cyclic (Tx)
Branch
Loadings >80%
Shoulder/ Nameplate (Tx)
Branch
Loadings > 80%
Summer/ Reverse Power (Tx)
Branch
Loadings > 80%
GTX Reverse Power Loading
TIVERTON 33 Min Gen Max Load
5 18.55 -2.84 0.00 0.00 1.00 41 8 49.27 7.84 0 0 0 0
TORQUAY 33
Max Gen Min Load
1 19.84 -6.52 19.84 -6.52 0.95 25 4 13.45 4.01 0 1 1 1 8032 - 8035 GT2 @ 12.15%
TORQUAY 33
Min Gen Max Load
1 19.84 -6.52 0.00 0.00 0.00 25 4 44.82 13.35 0 0 0 0
TOTNES 33 Max Gen Min Load
7 40.17 -0.81 40.17 -0.81 1.00 46 7 13.39 1.49 0 0 0 0 8021 - 8025 GT1 @ 34.23% 8022 - 8025 GT2 @ 32.08%
TOTNES 33 Min Gen Max Load
7 40.17 -0.81 0.00 0.00 0.00 46 7 44.63 4.95 0 0 0 0
TRURO 33 Max Gen Min Load
7 43.86 -4.40 43.86 -4.40 1.00 35 5 10.23 1.50 0 0 0 1 8491 - 8495 GT2 @ 45.26% 8492 - 8495 GT1 @ 43.13%
TRURO 33 Min Gen Max Load
7 43.86 -4.40 0.00 0.00 0.00 35 5 34.09 5.01 0 0 0 2
WESTON 33 Max Gen Min Load
5 36.38 -10.53 36.38 -10.53 0.96 27 5 16.32 3.35 0 0 0 0 8721 - 8725 GT1 @ 35.82% 8722 - 8725 GT2 @ 46.66%
WESTON 33 Min Gen Max Load
5 36.38 -10.53 0.00 0.00 1.00 27 5 54.39 11.17 0 0 0 0
Page 58
Virtual Statcom WP1 report
JK7261-TR-01-04 WPD Virtual Statcom WP1 report 10/04/2019 © Power Systems Consultants A11
BSP Case Total Gens @ 33.0kV
Total MW
(Pmax)
Total MVAR (Qmax)
Total MW
(Pgen)
Total MVAr (Qgen)
PF (calc)
Bus Count
Load Count
Load MW
Load MVAr
Voltage Violations
Winter Day / Cyclic (Tx)
Branch
Loadings >80%
Shoulder/ Nameplate (Tx)
Branch
Loadings > 80%
Summer/ Reverse Power (Tx)
Branch
Loadings > 80%
GTX Reverse Power Loading
WOODCOTE 33
Max Gen Min Load
10 51.81 -5.36 51.81 -5.36 0.99 69 10 23.08 4.07 0 1 1 3 8221 - 8225 GT1 @ 26.01% 8222 - 8225 GT2 @ 26.19% 8223 - 8225 GT3 @ 24.87%
WOODCOTE 33
Min Gen Max Load
10 51.81 -5.36 0.00 0.00 0.00 69 10 76.93 13.56 0 0 0 0
YEOVIL 33 Max Gen Min Load
1 20.00 -6.57 20.00 -6.57 0.95 19 5 30.01 5.96 0 1 1 1 8171 - 8175 GT1 @ 9.18% 8171 - 8175 GT2 @ 8.45% 8171 - 8175 GT3 @ 7.73%
YEOVIL 33 Min Gen Max Load
1 20.00 -6.57 0.00 0.00 0.00 19 5 100.04 19.87 0 0 0 0
Page 59
Virtual Statcom WP1 report
JK7261-TR-01-04 WPD Virtual Statcom WP1 report 10/04/2019 © Power Systems Consultants A12
11kV Networks
Primary substation
Case Total Gens @ 11.0kV
Total MW (Pmax)
Total MVAR (Qmax)
Total MW (Pgen)
Total MVAr (Qgen)
PF (calc)
Load MW
Load MVAr
Voltage Violations
Winter Day / Cyclic (Tx)
Branch
loadings > 80%
Shoulder/ Nameplate (Tx)
Branch
Loadings > 80%
Summer/ Reverse Power (Tx)
Branch loading > 80%
Tx Reverse Power Loading
Tiverton Moorhayes
Max Gen Min Load
2 1.95 -0.64 1.95 -0.64 0.95 1.91 0.39 0 0 0 0 6032 - 7735 T1 @ 5.06% 7734 - 7735 T2 @ 5.03%
Tiverton Moorhayes
Min Gen Max Load
2 1.95 -0.64 0.00 0.00 0.00 6.37 1.29 0 1 1 1
Colley Lane Max Gen Min Load
1 0.75 -0.25 0.75 -0.25 0.95 7.47 1.52 0 0 0 0 7199 - 10925 T2 @ 23.61% 7200 - 7202 T1 @ 24.34% 7201 - 7202 T3 @ 28.53%
Colley Lane Min Gen Max Load
1 0.75 -0.25 0.00 0.00 0.00 24.60
4.99 0 0 0 0
Dunkeswell Max Gen Min Load
1 2.80 0.00 2.80 0.00 1.00 1.32 0.27 0 0 0 0 7271 - 7946 T2 @ 24.92%
Dunkeswell Min Gen Max Load
1 2.80 0.00 0.00 0.00 0.00 4.41 0.90 0 0 0 0
Marsh Green Max Gen Min Load
2 5.50 -1.90 5.50 -1.90 0.95 1.35 0.28 0 0 1 1 7470 - 9011 T1 @ 80.83% 7471 - 7472 T2 @ 3.65%
Marsh Green Min Gen Max Load
2 5.50 -1.90 0.00 0.00 0.00 4.49 0.92 0 0 0 0
Page 60
Virtual Statcom WP1 report
JK7261-TR-01-04 WPD Virtual Statcom WP1 report 10/04/2019 © Power Systems Consultants A13
Primary substation
Case Total Gens @ 11.0kV
Total MW (Pmax)
Total MVAR (Qmax)
Total MW (Pgen)
Total MVAr (Qgen)
PF (calc)
Load MW
Load MVAr
Voltage Violations
Winter Day / Cyclic (Tx)
Branch
loadings > 80%
Shoulder/ Nameplate (Tx)
Branch
Loadings > 80%
Summer/ Reverse Power (Tx)
Branch loading > 80%
GTx Reverse Power Loading
Millfield Max Gen Min Load
3 11.03 -3.63 11.03 -3.63 0.95 5.30 1.08 0 0 0 0 7490 - 96602 T2 @ 36.86% 7491 - 7492 T1 @ 37.23%
Millfield Min Gen Max Load
3 11.03 -3.63 0.00 0.00 0.00 17.6 3.59 0 2 2 2
Waterlake Max Gen Min Load
0 0.00 0.00 0.00 0.00 0.00 1.42 0.28 0 0 0 0 7789 - 7791 T2 @ 7.74% 7790 - 7792 T1 @ 6.15%
Waterlake Min Gen Max Load
0 0.00 0.00 0.00 0.00 0.00 4.74 0.93 0 0 0 0
Page 61
Virtual Statcom WP1 report
JK7261-TR-01-04 WPD Virtual Statcom WP1 report 10/04/2019 © Power Systems Consultants B1
Appendix B – Tag rules for timeseries data Barnstaple Loads
Site Tags used Method Scaling
AARONSONS AARONSONS > 33kV > CB 1H0 > Current Analogue
AARONSONS > 33kV > CB 1H0 > AARONSONS VT
AARONSONS > 33kV > CB 1H0 > 1H0 > Power Analogues > MW Analogue
AARONSONS > 33kV > CB 1H0 > 1H0 > Power Analogues > MVAr Analogue
CM -1
BRATTON FLEMING BRATTON FLEMING > 11kv > CB 121 > 11kV Current
BRATTON FLEMING > 11kv > CB 121 > 11kV VT
VIM 1
GREAT TORRINGTON GREAT TORRINGTON > 33kV > T2 Busbar > CB 2L5 > Current Analogue
GREAT TORRINGTON > 33kV > T2 Busbar > VT2
VIM 0.4
HEDDON CROSS HEDDON CROSS > 11kV > T1 Busbar > CB 51 > CB 51 > Power Analogues > MVAr Analogue
HEDDON CROSS > 11kV > T1 Busbar > CB 51 > CB 51 > Power Analogues > MW Analogue
DM 1
LYNTON LYNTON > 11kV > T2 Busbar > CB 72 > 11kV Current
LYNTON > 11kV > T2 Busbar > CB 72 > VT 2 & Isolator > VT 2
VIM 1
MIDDLE BARLINGTON MIDDLE BARLINGTON > 11kV > CB 111 > CB 111 > Power Analogues > MVAr Analogue
MIDDLE BARLINGTON > 11kV > CB 111 > CB 111 > Power Analogues > MW Analogue
DM -1
ROCK PARK ROCK PARK > 11kV > T1 Busbar > CB 151 > 11kV Current
ROCK PARK > 11kV > T1 Busbar > CB 151 > 11kV VT
ROCK PARK > 11kV > T2 Busbar > CB 152 > 152 > Power Analogs > MW Analogue
ROCK PARK > 11kV > T2 Busbar > CB 152 > 152 > Power Analogs > MVAr Analogue
CM -1
ROUNDSWELL ROUNDSWELL > 11kV > T1 Busbar > CB 0081 > 11kV Current
ROUNDSWELL > 11kV > T2 Busbar > CB 0082 > 11kV Current
ROUNDSWELL > 11kV > T1 Busbar > CB 0081 > 11kV VT
ROUNDSWELL > 11kV > T2 Busbar > CB 0082 > 11kV VT
VIM 1
SOUTH MOLTON SOUTH MOLTON > 11kV > T1 Busbar > CB 0091 > 11kV Current
SOUTH MOLTON > 11kV > T2 Busbar > CB 0092 > 11kV Current
SOUTH MOLTON > 11kV > T2 Busbar > CB 0092 > 11kV VT
SOUTH MOLTON > 11kV > T1 Busbar > CB 0091 > 11kV VT
VIM 1
TINKERS CROSS J TINKERS CROSS > 11kV > T2 Busbar > CB 0102 > 11kV Current
TINKERS CROSS > 11kV > T2 Busbar > CB 0102 > 11kV VT
VIM 1
TINKERS CROSS K TINKERS CROSS > 11kV > T1 Busbar > CB 0101 > 11kV Current
TINKERS CROSS > 11kV > T1 Busbar > CB 0101 > 11kV VT
VIM 1
Barnstaple Generation
Site Tags used Method Scaling
BATSWORTHY CROSS 33kV WIND FARM
BATSWORTHY CROSS 33kV WIND FARM > 33kV > Busbar > CB 1M0 > CB 1M0 > Power Analogues > MW Analogue
BATSWORTHY CROSS 33kV WIND FARM > 33kV > Busbar > CB 1M0 > CB 1M0 > Power Analogues > MVAr Analogue
DM 1
Page 62
Virtual Statcom WP1 report
JK7261-TR-01-04 WPD Virtual Statcom WP1 report 10/04/2019 © Power Systems Consultants B2
BEAFORD 33kV SOLAR FARM
BEAFORD 33kV SOLAR FARM > 33kV > Busbar > CB 1L5 > CB 1L5 > Power Analogues > MW Analogue
BEAFORD 33kV SOLAR FARM > 33kV > Busbar > CB 1L5 > CB 1L5 > Power Analogues > MVAr Analogue
DM 1
BRATTON FLEMING 33kV SOLAR PARK
BRATTON FLEMING 33kV SOLAR PARK > 33kV > Busbar > CB 1L5 > CB 1L5 > Power Analogues > MW Analogue
BRATTON FLEMING 33kV SOLAR PARK > 33kV > Busbar > CB 1L5 > CB 1L5 > Power Analogues > MVAr Analogue
DM -1
CAPELANDS FARM 33kV SOLAR PARK
CAPELANDS FARM 33kV SOLAR PARK > 33kV > Busbar > CB 1M0 > CB 1M0 > Power Analogues > MW Analogue
CAPELANDS FARM 33kV SOLAR PARK > 33kV > Busbar > CB 1M0 > CB 1M0 > Power Analogues > MVAr Analogue
DM -1
DARRACOTT MOOR WINDFARM
DARRACOTT MOOR WINDFARM > 33kV > Busbar > CB 1M0 > Current Analogue
DARRACOTT MOOR WINDFARM > 33kV > Busbar > VT 1
DARRACOTT MOOR WINDFARM > 33kV > Busbar > CB 1M0 > CB 1M0 > Power Analogues > MW Analogue
CM 1
KINGSLAND BARTON 33kV SOLAR PARK
KINGSLAND BARTON 33kV SOLAR PARK > 33kV > Busbar > CB 1L5 > CB 1L5 > Power Analogues > MW Analogue
KINGSLAND BARTON 33kV SOLAR PARK > 33kV > Busbar > CB 1L5 > CB 1L5 > Power Analogues > MVAr Analogue
DM 1
KNOCKWORTHY 33kV SOLAR PARK
KNOCKWORTHY 33kV SOLAR PARK > 33kV > Busbar > CB 1M0 > CB 1M0 > Power Analogues > MW Analogue
KNOCKWORTHY 33kV SOLAR PARK > 33kV > Busbar > CB 1M0 > CB 1M0 > Power Analogues > MVAr Analogue
DM 1
Pyworthy Loads
Site Tags used Method Scaling
ASHWATER ASHWATER > 11kV > CB 4081 > CB 4081 > Power Analogs > MVAr Analogue
ASHWATER > 11kV > CB 4081 > CB 4081 > Power Analogs > MW Analogue
DM 1
CLOVELLY CLOVELLY > 11kV > T2 Busbar > CB 21 > CB 21 > Power Analogues > MW Analogue
CLOVELLY > 11kV > T2 Busbar > CB 21 > CB 21 > Power Analogues > MVAr Analogue
DM 1
EAST CURRY EAST CURRY > 11kV > CB 4061 > 11kV Current
EAST CURRY > 11kV > CB 4061 > 11kV VT
VIM 4
HATHERLEIGH HATHERLEIGH > 11kV > T2 Busbar > CB 192 > CB 192 > Power Analogues > MW Analogue
HATHERLEIGH > 11kV > T2 Busbar > CB 192 > CB 192 > Power Analogues > MVAr Analogue
HATHERLEIGH > 11kV > T1 Busbar > CB 191 > CB 191 > Power Analogues > MW Analogue
HATHERLEIGH > 11kV > T1 Busbar > CB 191 > CB 191 > Power Analogues > MVAr Analogue
DM -1
HOLSWORTHY HOLSWORTHY > 11kV > T1 Busbar > CB 4051 > 11kV Current
HOLSWORTHY > 11kV > T2 Busbar > CB 4052 > 11kV Current
HOLSWORTHY > 11kV > T1 Busbar > CB 4051 > 11kV VT
HOLSWORTHY > 11kV > T2 Busbar > CB 4052 > 11kV VT
VIM 1
LAUNCESTON LAUNCESTON > 11kV > T1 Busbar > CB 25/51 > CB 51 > Power Analogs > MW Analogue
LAUNCESTON > 11kV > T1 Busbar > CB 25/51 > CB 51 > Power Analogs > MVAr Analogue
LAUNCESTON > 11kV > T2 Busbar > CB 25/52 > CB 52 > Power Analogs > MW Analogue
LAUNCESTON > 11kV > T2 Busbar > CB 25/52 > CB 52 > Power Analogs > MVAr Analogue
LAUNCESTON > 11kV > T3 Busbar > CB 25/53 > CB 53 > Power Analogs > MW Analogue
LAUNCESTON > 11kV > T3 Busbar > CB 25/53 > CB 53 > Power Analogs > MVAr Analogue
DM -1
MORETONHAMPSTEAD MORETONHAMPSTEAD > 11kV > T1 Busbar > CB 12/19 > 11kV Current
MORETONHAMPSTEAD > 11kV > T1 Busbar > CB 12/19 > 11kV VT
VIM 1
MORWENSTOW MORWENSTOW > 11kV > CB 4031 > CB 4031 > Power Analogs > MW Analogue
MORWENSTOW > 11kV > CB 4031 > CB 4031 > Power Analogs > MVAr Analogue
DM 1
Page 63
Virtual Statcom WP1 report
JK7261-TR-01-04 WPD Virtual Statcom WP1 report 10/04/2019 © Power Systems Consultants B3
NORTH TAWTON NORTH TAWTON > 11kV > T2 Busbar > CB 21 > CB 21 > Power Analogues > MW Analogue
NORTH TAWTON > 11kV > T2 Busbar > CB 21 > CB 21 > Power Analogues > MVAr Analogue
NORTH TAWTON > 11kV > T1 Busbar > CB 19 > CB 19 > Power Analogues > MW Analogue
NORTH TAWTON > 11kV > T1 Busbar > CB 19 > CB 19 > Power Analogues > MVAr Analogue
DM 1
OKEHAMPTON OKEHAMPTON > 11kV > T2 Busbar > CB 21 > CB 21 > Power Analogues > MVAr Analogue
OKEHAMPTON > 11kV > T2 Busbar > CB 21 > CB 21 > Power Analogues > MW Analogue
OKEHAMPTON > 11kV > T1 Busbar > CB 19 > CB 19 > Power Analogues > MVAr Analogue
OKEHAMPTON > 11kV > T1 Busbar > CB 19 > CB 19 > Power Analogues > MW Analogue
DM 1
ROADFORD ROADFORD > 33kV > Busbar 1 > CB 1H0 > CB 1H0 > Power Analogs > MW Analogue
ROADFORD > 33kV > Busbar 1 > CB 1H0 > CB 1H0 > Power Analogs > MVAr Analogue
ROADFORD > 33kV > Busbar 2 > CB 2H0 > CB 2H0 > Power Analogs > MW Analogue
ROADFORD > 33kV > Busbar 2 > CB 2H0 > CB 2H0 > Power Analogs > MVAr Analogue
DM 1
SHEBBEAR SHEBBEAR > 11kV > T1 Busbar > CB 13/19 > 11kV ACB > Power Analogs > MW Analogue
SHEBBEAR > 11kV > T1 Busbar > CB 13/19 > 11kV ACB > Power Analogs > MVAr Analogue
DM -1
STRATTON STRATTON > 11kV > T1 Busbar > CB 4041 > CB 4041 > Power Analogues > MVAr Analogue
STRATTON > 11kV > T1 Busbar > CB 4041 > CB 4041 > Power Analogues > MW Analogue
STRATTON > 11kV > T2 Busbar > CB 4042 > CB 4042 > Power Analogues > MVAr Analogue
STRATTON > 11kV > T2 Busbar > CB 4042 > CB 4042 > Power Analogues > MW Analogue
DM 1
WHIDDON DOWN WHIDDON DOWN > 11kV > T1 Busbar > CB 21/19 > 11kV Current
WHIDDON DOWN > 11kV > T2 Busbar > CB 21/21 > 11kV Current
WHIDDON DOWN > 11kV > T1 Busbar > CB 21/19 > 11kV VT
WHIDDON DOWN > 11kV > T2 Busbar > CB 21/21 > 11kV VT
VIM 1
Pyworthy Generation
Site Tags used Method Scaling
ASHWATER 33kV SOLAR PARK
ASHWATER > 11kV > CB 4081 > CB 4081 > Power Analogs > MVAr Analogue
ASHWATER > 11kV > CB 4081 > CB 4081 > Power Analogs > MW Analogue
DM 1
BRADFORD MANOR 33kV SOLAR PARK
BRADFORD MANOR 33kV SOLAR PARK > 33kV > Busbar > CB 1L5 > CB 1L5 > Power Analogues > MW Analogue
BRADFORD MANOR 33kV SOLAR PARK > 33kV > Busbar > CB 1L5 > CB 1L5 > Power Analogues > MVAr Analogue
DM -1
CRINACOTT FARM 33kV SOLAR PARK
CRINACOTT FARM 33kV SOLAR PARK > 33kV > Busbar > CB 1M0 > CB 1M0 > Power Analogues > MW Analogue
CRINACOTT FARM 33kV SOLAR PARK > 33kV > Busbar > CB 1M0 > CB 1M0 > Power Analogues > MVAr Analogue
DM 1
DENBROOK 33kV WIND FARM
DENBROOK 33kV WIND FARM > 33kV > Busbar > CB 1M0 > CB 1M0 > Power Analogues > MW Analogue
DENBROOK 33kV WIND FARM > 33kV > Busbar > CB 1M0 > CB 1M0 > Power Analogues > MVAr Analogue
DM 1
DERRITON FIELDS 33kV SOLAR PARK
DERRITON FIELDS 33kV SOLAR PARK > 33kV > Busbar > CB 1M0 > Current Analogue
DERRITON FIELDS 33kV SOLAR PARK > 33kV > Busbar > CB 1M0 > VT1
DERRITON FIELDS 33kV SOLAR PARK > 33kV > Busbar > CB 1M0 > Current Analogue > Power Analogues > MVAr Analogue
CM 1
DUNSLAND CROSS 33kV WIND FARM
DUNSLAND CROSS 33kV WIND FARM > 33kV > Busbar > CB 1M0 > CB 1M0 > Power Analogues > MW Analogue
DUNSLAND CROSS 33kV WIND FARM > 33kV > Busbar > CB 1M0 > CB 1M0 > Power Analogues > MVAr Analogue
DM -1
EAST LANGFORD 33kV SOLAR PARK
EAST LANGFORD 33kV SOLAR PARK > 33kV > Busbar > CB 1L5 > CB 1L5 > Power Analogues > MW Analogue
EAST LANGFORD 33kV SOLAR PARK > 33kV > Busbar > CB 1L5 > CB 1L5 > Power Analogues > MVAr Analogue
DM 1
Page 64
Virtual Statcom WP1 report
JK7261-TR-01-04 WPD Virtual Statcom WP1 report 10/04/2019 © Power Systems Consultants B4
Tiverton Loads
EAST YOULSTONE 33kV WINDFARM
EAST YOULSTONE 33kV WINDFARM > 33kV > Busbar > CB 1M0 > CB 1M0 > Power Analogues > MW Analogue
EAST YOULSTONE 33kV WINDFARM > 33kV > Busbar > CB 1M0 > CB 1M0 > Power Analogues > MVAr Analogue
DM -1
EASTACOMBE FM 33kV SOLAR PARK
EASTACOMBE FM 33kV SOLAR PARK > 33kV > Busbar > CB 1L5 > CB 1L5 > Power Analogues > MW Analogue
EASTACOMBE FM 33kV SOLAR PARK > 33kV > Busbar > CB 1L5 > CB 1L5 > Power Analogues > MVAr Analogue
DM 1
FORESTMOOR WINDFARM
FORESTMOOR WINDFARM > 33kV > Busbar > CB 1L5 > Current Analogue
FORESTMOOR WINDFARM > 33kV > Busbar > CB 1L5 > VT
VIM 1
FOXCOMBE 33kV SOLAR PARK
FOXCOMBE 33kV SOLAR PARK > 33kV > Busbar > CB 1L5 > CB 1L5 > Power Analogues > MW Analogue
FOXCOMBE 33kV SOLAR PARK > 33kV > Busbar > CB 1L5 > CB 1L5 > Power Analogues > MVAr Analogue
DM 1
HIGHER NORTH BEER FARM SOLAR PARK
HIGHER NORTH BEER FARM SOLAR PARK > 33kV > Busbar > CB 1M0 > CB 1M0 > Power Analogues > MW Analogue
HIGHER NORTH BEER FARM SOLAR PARK > 33kV > Busbar > CB 1M0 > CB 1M0 > Power Analogues > MVAr Analogue
DM 5 (MW) 1 (MVAr)
PITWORTHY 33kV SOLAR PARK
PITWORTHY 33kV SOLAR PARK > 33kV > Busbar > CB 1L5 > Current Analogue > Power Analogues > MW Analogue
PITWORTHY 33kV SOLAR PARK > 33kV > Busbar > CB 1L5 > Current Analogue > Power Analogues > MVAr Analogue
DM 1
REXON CROSS FARM 33kV SOLAR PARK
REXON CROSS FARM 33kV SOLAR PARK > 33kV > Busbar > CB 1L5 > CB 1L5 > Power Analogues > MW Analogue
REXON CROSS FARM 33kV SOLAR PARK > 33kV > Busbar > CB 1L5 > CB 1L5 > Power Analogues > MVAr Analogue
DM -1
WILLSLAND 33kV SOLAR PARK
WILLSLAND 33kV SOLAR PARK > 33kV > Busbar > CB 1L5 > CB 1L5 > Power Analogues > MVAr Analogue
WILLSLAND 33kV SOLAR PARK > 33kV > Busbar > CB 1L5 > CB 1L5 > Power Analogues > MW Analogue
DM -1
Site Tags used Method Scaling
BRIDGE MILLS BRIDGE MILLS > 11kV > T1 Busbar > CB 18/19 > 11kV Current
BRIDGE MILLS > 11kV > T2 Busbar > CB 18/21 > 11kV Current
BRIDGE MILLS > 11kV > T1 Busbar > CB 18/19 > 1819 > Power Analogs > MW Analogue
BRIDGE MILLS > 11kV > T1 Busbar > CB 18/19 > 1819 > Power Analogs > MVAr Analogue
CM 1
BURLESCOMBE BURLESCOMBE > 11kV > T1 Busbar > CB 33/19 > 11kV Current
BURLESCOMBE > 11kV > T2 Busbar > CB 33/22 > 11kV Current
BURLESCOMBE > 11kV > T1 Busbar > CB 33/19 > 11kV VT
BURLESCOMBE > 11kV > T2 Busbar > CB 33/22 > 11kV VT
VIM 1
CULLOMPTON CULLOMPTON > 11kV > T1 Busbar > CB 24/19 > 2419 > Power Analogues > MW Analogue
CULLOMPTON > 11kV > T1 Busbar > CB 24/19 > 2419 > Power Analogues > MVAr Analogue
CULLOMPTON > 11kV > T2 Busbar > CB 24/21 > 2421 > Power Analogues > MW Analogue
CULLOMPTON > 11kV > T2 Busbar > CB 24/21 > 2421 > Power Analogues > MVAr Analogue
DM Abs(P) Abs (Q)
DUNKESWELL DUNKESWELL > 11kV > T2 Busbar > CB 57/21 > 11kV Current
DUNKESWELL > 11kV > T2 Busbar > CB 57/21 > 11kV VT
VIM 1
HEMYOCK HEMYOCK > 11kV > T2 Busbar > CB 56/21 > 11kV Current
HEMYOCK > 11kV > T2 Busbar > CB 56/21 > 11kV VT
VIM 1
TIVERTON JUNCTION TIVERTON JUNCTION > 11kV > BUSBAR T1 > CB 32/19 > 11kV Current
TIVERTON JUNCTION > 11kV > BUSBAR T2 > CB 32/21 > 11kV Current
TIVERTON JUNCTION > 11kV > BUSBAR T1 > CB 32/19 > 11kV VT
TIVERTON JUNCTION > 11kV > BUSBAR T2 > CB 32/21 > 11kV VT
VIM 1
TIVERTON MOORHAYES TIVERTON MOORHAYES > 11kV > T1 Busbar > CB 23/19 > CB 19 > Power Analogues > MW Analogue DM Abs(P)
Page 65
Virtual Statcom WP1 report
JK7261-TR-01-04 WPD Virtual Statcom WP1 report 10/04/2019 © Power Systems Consultants B5
Tiverton Generation
TIVERTON MOORHAYES > 11kV > T1 Busbar > CB 23/19 > CB 19 > Power Analogues > MVAr Analogue
TIVERTON MOORHAYES > 11kV > T2 Busbar > CB 23/21 > CB 21 > Power Analogues > MW Analogue
TIVERTON MOORHAYES > 11kV > T2 Busbar > CB 23/21 > CB 21 > Power Analogues > MVAr Analogue
Abs (Q)
TIVERTON SOUTH TIVERTON SOUTH > 11kV > T1 Busbar > CB 25/19 > 11kV Current
TIVERTON SOUTH > 11kV > T2 Busbar > CB 25/21 > 11kV Current
TIVERTON SOUTH > 11kV > T1 Busbar > CB 25/19 > 11kV VT
TIVERTON SOUTH > 11kV > T2 Busbar > CB 25/21 > 11kV VT
TIVERTON SOUTH > 11kV > T1 Busbar > CB 25/19 > 2519 > Power Analogues > MVAr Analogue
TIVERTON SOUTH > 11kV > T1 Busbar > CB 25/19 > 2519 > Power Analogues > MW Analogue
TIVERTON SOUTH > 11kV > T2 Busbar > CB 25/21 > CB 21 > Power Analogues > MVAr Analogue
TIVERTON SOUTH > 11kV > T2 Busbar > CB 25/21 > CB 21 > Power Analogues > MW Analogue
CM 1
Site Tags used Method Scaling
AYSHFORD COURT FARM 33kV SOLAR PARK
AYSHFORD COURT FARM 33kV SOLAR PARK > 33kV > Busbar > CB 1M0 > CB 1M0 > Power Analogues > MW Analogue
AYSHFORD COURT FARM 33kV SOLAR PARK > 33kV > Busbar > CB 1M0 > CB 1M0 > Power Analogues > MVAr Analogue
DM 1
CULLOMPTON 33kV SOLAR PARK
CULLOMPTON > 11kV > T1 Busbar > CB 24/19 > 2419 > Power Analogues > MW Analogue
CULLOMPTON > 11kV > T1 Busbar > CB 24/19 > 2419 > Power Analogues > MVAr Analogue
CULLOMPTON > 11kV > T2 Busbar > CB 24/21 > 2421 > Power Analogues > MW Analogue
CULLOMPTON > 11kV > T2 Busbar > CB 24/21 > 2421 > Power Analogues > MVAr Analogue
DM 1
STONESHILL 33kV SOLAR PARK
STONESHILL 33kV SOLAR PARK > 33kV > Busbar > CB 1L5 > CB 1L5 > Power Analogues > MW Analogue
STONESHILL 33kV SOLAR PARK > 33kV > Busbar > CB 1L5 > CB 1L5 > Power Analogues > MVAr Analogue
DM 1
Page 66
Virtual Statcom WP1 report
JK7261-TR-01-04 WPD Virtual Statcom WP1 report 10/04/2019 © Power Systems Consultants C1
Appendix C – Timeseries data validation plots
Barnstaple Load:
AARONSONS
Page 67
Virtual Statcom WP1 report
JK7261-TR-01-04 WPD Virtual Statcom WP1 report 10/04/2019 © Power Systems Consultants C2
BRATTON FLEMING
Page 68
Virtual Statcom WP1 report
JK7261-TR-01-04 WPD Virtual Statcom WP1 report 10/04/2019 © Power Systems Consultants C3
GREAT TORRINGTON
Page 69
Virtual Statcom WP1 report
JK7261-TR-01-04 WPD Virtual Statcom WP1 report 10/04/2019 © Power Systems Consultants C4
HEDDON CROSS
Page 70
Virtual Statcom WP1 report
JK7261-TR-01-04 WPD Virtual Statcom WP1 report 10/04/2019 © Power Systems Consultants C5
LYNTON
Page 71
Virtual Statcom WP1 report
JK7261-TR-01-04 WPD Virtual Statcom WP1 report 10/04/2019 © Power Systems Consultants C6
MIDDLE BARLINGTON
Page 72
Virtual Statcom WP1 report
JK7261-TR-01-04 WPD Virtual Statcom WP1 report 10/04/2019 © Power Systems Consultants C7
ROCK PARK
Page 73
Virtual Statcom WP1 report
JK7261-TR-01-04 WPD Virtual Statcom WP1 report 10/04/2019 © Power Systems Consultants C8
ROUNDSWELL
Page 74
Virtual Statcom WP1 report
JK7261-TR-01-04 WPD Virtual Statcom WP1 report 10/04/2019 © Power Systems Consultants C9
SOUTH MOLTON
Page 75
Virtual Statcom WP1 report
JK7261-TR-01-04 WPD Virtual Statcom WP1 report 10/04/2019 © Power Systems Consultants C10
TINKERS CROSS
Page 76
Virtual Statcom WP1 report
JK7261-TR-01-04 WPD Virtual Statcom WP1 report 10/04/2019 © Power Systems Consultants C11
TINKERS CROSSK
Page 77
Virtual Statcom WP1 report
JK7261-TR-01-04 WPD Virtual Statcom WP1 report 10/04/2019 © Power Systems Consultants C12
Barnstaple Generation
BATSWORTHY CROSS 33kV WIND FARM
Page 78
Virtual Statcom WP1 report
JK7261-TR-01-04 WPD Virtual Statcom WP1 report 10/04/2019 © Power Systems Consultants C13
BEAFORD 33kV SOLAR FARM
Page 79
Virtual Statcom WP1 report
JK7261-TR-01-04 WPD Virtual Statcom WP1 report 10/04/2019 © Power Systems Consultants C14
BRATTON FLEMING 33kV SOLAR PARK
Page 80
Virtual Statcom WP1 report
JK7261-TR-01-04 WPD Virtual Statcom WP1 report 10/04/2019 © Power Systems Consultants C15
CAPELANDS FARM 33kV SOLAR PARK
Page 81
Virtual Statcom WP1 report
JK7261-TR-01-04 WPD Virtual Statcom WP1 report 10/04/2019 © Power Systems Consultants C16
DARRACOTT MOOR WINDFARM
Page 82
Virtual Statcom WP1 report
JK7261-TR-01-04 WPD Virtual Statcom WP1 report 10/04/2019 © Power Systems Consultants C17
KINGSLAND BARTON 33kV SOLAR PARK
Page 83
Virtual Statcom WP1 report
JK7261-TR-01-04 WPD Virtual Statcom WP1 report 10/04/2019 © Power Systems Consultants C18
KNOCKWORTHY 33kV SOLAR PARK
Page 84
Virtual Statcom WP1 report
JK7261-TR-01-04 WPD Virtual Statcom WP1 report 10/04/2019 © Power Systems Consultants C19
Pyworthy Load
ASHWATER
Page 85
Virtual Statcom WP1 report
JK7261-TR-01-04 WPD Virtual Statcom WP1 report 10/04/2019 © Power Systems Consultants C20
CLOVELLY
Page 86
Virtual Statcom WP1 report
JK7261-TR-01-04 WPD Virtual Statcom WP1 report 10/04/2019 © Power Systems Consultants C21
EAST CURRY
Page 87
Virtual Statcom WP1 report
JK7261-TR-01-04 WPD Virtual Statcom WP1 report 10/04/2019 © Power Systems Consultants C22
HATHERLEIGH
Page 88
Virtual Statcom WP1 report
JK7261-TR-01-04 WPD Virtual Statcom WP1 report 10/04/2019 © Power Systems Consultants C23
HOLSWORTHY
Page 89
Virtual Statcom WP1 report
JK7261-TR-01-04 WPD Virtual Statcom WP1 report 10/04/2019 © Power Systems Consultants C24
LAUNCESTON
Page 90
Virtual Statcom WP1 report
JK7261-TR-01-04 WPD Virtual Statcom WP1 report 10/04/2019 © Power Systems Consultants C25
MORETONHAMPSTEAD
Page 91
Virtual Statcom WP1 report
JK7261-TR-01-04 WPD Virtual Statcom WP1 report 10/04/2019 © Power Systems Consultants C26
MORWENSTOW
Page 92
Virtual Statcom WP1 report
JK7261-TR-01-04 WPD Virtual Statcom WP1 report 10/04/2019 © Power Systems Consultants C27
NORTH TAWTON
Page 93
Virtual Statcom WP1 report
JK7261-TR-01-04 WPD Virtual Statcom WP1 report 10/04/2019 © Power Systems Consultants C28
OKEHAMPTON
Page 94
Virtual Statcom WP1 report
JK7261-TR-01-04 WPD Virtual Statcom WP1 report 10/04/2019 © Power Systems Consultants C29
ROADFORD
Page 95
Virtual Statcom WP1 report
JK7261-TR-01-04 WPD Virtual Statcom WP1 report 10/04/2019 © Power Systems Consultants C30
SHEBBEAR
Page 96
Virtual Statcom WP1 report
JK7261-TR-01-04 WPD Virtual Statcom WP1 report 10/04/2019 © Power Systems Consultants C31
STRATTON
Page 97
Virtual Statcom WP1 report
JK7261-TR-01-04 WPD Virtual Statcom WP1 report 10/04/2019 © Power Systems Consultants C32
WHIDDON DOWN
Page 98
Virtual Statcom WP1 report
JK7261-TR-01-04 WPD Virtual Statcom WP1 report 10/04/2019 © Power Systems Consultants C33
Pyworthy Generation
ASHWATER 33kV SOLAR PARK
Page 99
Virtual Statcom WP1 report
JK7261-TR-01-04 WPD Virtual Statcom WP1 report 10/04/2019 © Power Systems Consultants C34
BRADFORD MANOR 33kV SOLAR PARK
Page 100
Virtual Statcom WP1 report
JK7261-TR-01-04 WPD Virtual Statcom WP1 report 10/04/2019 © Power Systems Consultants C35
CRINACOTT FARM 33kV SOLAR PARK
Page 101
Virtual Statcom WP1 report
JK7261-TR-01-04 WPD Virtual Statcom WP1 report 10/04/2019 © Power Systems Consultants C36
DENBROOK 33kV WIND FARM
Page 102
Virtual Statcom WP1 report
JK7261-TR-01-04 WPD Virtual Statcom WP1 report 10/04/2019 © Power Systems Consultants C37
DERRITON FIELDS 33kV SOLAR PARK
Page 103
Virtual Statcom WP1 report
JK7261-TR-01-04 WPD Virtual Statcom WP1 report 10/04/2019 © Power Systems Consultants C38
DUNSLAND CROSS 33kV WIND FARM
Page 104
Virtual Statcom WP1 report
JK7261-TR-01-04 WPD Virtual Statcom WP1 report 10/04/2019 © Power Systems Consultants C39
EAST LANGFORD 33kV SOLAR PARK
Page 105
Virtual Statcom WP1 report
JK7261-TR-01-04 WPD Virtual Statcom WP1 report 10/04/2019 © Power Systems Consultants C40
EAST YOULSTONE 33kV WINDFARM
Page 106
Virtual Statcom WP1 report
JK7261-TR-01-04 WPD Virtual Statcom WP1 report 10/04/2019 © Power Systems Consultants C41
EASTACOMBE FM 33kV SOLAR PARK
Page 107
Virtual Statcom WP1 report
JK7261-TR-01-04 WPD Virtual Statcom WP1 report 10/04/2019 © Power Systems Consultants C42
FORESTMOOR WINDFARM
Page 108
Virtual Statcom WP1 report
JK7261-TR-01-04 WPD Virtual Statcom WP1 report 10/04/2019 © Power Systems Consultants C43
FOXCOMBE 33kV SOLAR PARK
Page 109
Virtual Statcom WP1 report
JK7261-TR-01-04 WPD Virtual Statcom WP1 report 10/04/2019 © Power Systems Consultants C44
HIGHER NORTH BEER FARM SOLAR PARK
Page 110
Virtual Statcom WP1 report
JK7261-TR-01-04 WPD Virtual Statcom WP1 report 10/04/2019 © Power Systems Consultants C45
PITWORTHY 33kV SOLAR PARK
Page 111
Virtual Statcom WP1 report
JK7261-TR-01-04 WPD Virtual Statcom WP1 report 10/04/2019 © Power Systems Consultants C46
REXON CROSS FARM 33kV SOLAR PARK
Page 112
Virtual Statcom WP1 report
JK7261-TR-01-04 WPD Virtual Statcom WP1 report 10/04/2019 © Power Systems Consultants C47
WILLSLAND 33kV SOLAR PARK
Page 113
Virtual Statcom WP1 report
JK7261-TR-01-04 WPD Virtual Statcom WP1 report 10/04/2019 © Power Systems Consultants C48
Tiverton Load
BRIDGE MILLS
Page 114
Virtual Statcom WP1 report
JK7261-TR-01-04 WPD Virtual Statcom WP1 report 10/04/2019 © Power Systems Consultants C49
BURLESCOMBE
Page 115
Virtual Statcom WP1 report
JK7261-TR-01-04 WPD Virtual Statcom WP1 report 10/04/2019 © Power Systems Consultants C50
CULLOMPTON
Page 116
Virtual Statcom WP1 report
JK7261-TR-01-04 WPD Virtual Statcom WP1 report 10/04/2019 © Power Systems Consultants C51
DUNKESWELL
Page 117
Virtual Statcom WP1 report
JK7261-TR-01-04 WPD Virtual Statcom WP1 report 10/04/2019 © Power Systems Consultants C52
HEMYOCK
Page 118
Virtual Statcom WP1 report
JK7261-TR-01-04 WPD Virtual Statcom WP1 report 10/04/2019 © Power Systems Consultants C53
TIVERTON JUNCTION
Page 119
Virtual Statcom WP1 report
JK7261-TR-01-04 WPD Virtual Statcom WP1 report 10/04/2019 © Power Systems Consultants C54
TIVERTON MOORHAYES
Page 120
Virtual Statcom WP1 report
JK7261-TR-01-04 WPD Virtual Statcom WP1 report 10/04/2019 © Power Systems Consultants C55
TIVERTON SOUTH
Page 121
Virtual Statcom WP1 report
JK7261-TR-01-04 WPD Virtual Statcom WP1 report 10/04/2019 © Power Systems Consultants C56
Tiverton Generation:
AYSHFORD COURT FARM 33kV SOLAR PARK
Page 122
Virtual Statcom WP1 report
JK7261-TR-01-04 WPD Virtual Statcom WP1 report 10/04/2019 © Power Systems Consultants C57
CULLOMPTON 33kV SOLAR PARK
Page 123
Virtual Statcom WP1 report
JK7261-TR-01-04 WPD Virtual Statcom WP1 report 10/04/2019 © Power Systems Consultants C58
STONESHILL 33kV SOLAR PARK
Page 124
Virtual Statcom WP1 report
JK7261-TR-01-04 WPD Virtual Statcom WP1 report 10/04/2019 © Power Systems Consultants D1
Appendix D – Timeseries data mapping to PSS/E Barnstaple 33kV BSP Loads:
PSS/E Model data
Site CSV file (P & Q from tag rules) No. Loads Bus Number Bus Name Id
AARONSONS.csv 1 7000 AARO3 1
BRATTON FLEMING.csv 1 7097 BRAF5 1
GREAT TORRINGTON.csv 1 7750 TORR5K 1
HEDDON CROSS.csv 1 7361 HEDX5 1
LYNTON.csv 1 7456 LYNT5 1
MIDDLE BARLINGTON.csv 1 7486 MIDB5 1
ROCK PARK.csv 1 7625 ROCP5 1
ROUNDSWELL.csv 1 7633 ROUN5 1
SOUTH MOLTON.csv 1 7666 SMOL5 1
TINKERS CROSS.csv 1 7731 TINX5 1
TINKERS CROSSK.csv 1 7732 TINX5K 1
Barnstaple 33kV BSP Generation:
PSS/E Model data
Site CSV file (P & Q from tag rules) No. Gens Bus Number Bus Name Id
BATSWORTHY CROSS 33kV WIND FARM.csv 1 10415 BATS3 W1
BEAFORD 33kV SOLAR FARM.csv 1 9355 BEAF3 P1
BRATTON FLEMING 33kV SOLAR PARK.csv 1 9560 BRAT3 P1
CAPELANDS FARM 33kV SOLAR PARK.csv 1 9995 CAPE3 P1
DARRACOTT MOOR WINDFARM.csv 1 9035 DARM3 W1
KINGSLAND BARTON 33kV SOLAR PARK.csv 1 9730 KING3 P1
KNOCKWORTHY 33kV SOLAR PARK.csv 1 9400 KNOK3 P1
Page 125
Virtual Statcom WP1 report
JK7261-TR-01-04 WPD Virtual Statcom WP1 report 10/04/2019 © Power Systems Consultants D2
Pyworthy 33kV BSP Loads:
PSS/E Model data
Site CSV file (P & Q from tag rules)
No. Loads
Bus Number
Bus Name Id
Bus Number
Bus Name Id
ASHWATER.csv 1 7025 ASHW5 1
CLOVELLY.csv 1 7188 CLOV5 1
EAST CURRY.csv 1 7285 ECUR5 1
HATHERLEIGH.csv 1 7350 HATH5 1
HOLSWORTHY.csv 1 7379 HOLS5 1
LAUNCESTON.csv 2 7423 LAUN5J 1 6093 LAUN5K 1
MORETONHAMPSTEAD.csv 1 7503 MORH5 1
MORWENSTOW.csv 1 7506 MORW5 1
NORTH TAWTON.csv 1 7985 NTAW5 1
OKEHAMPTON.csv 1 7552 OKEH5 1
ROADFORD.csv 1 7623 ROAD3 1
SHEBBEAR.csv 1 7649 SHEB5 1
STRATTON.csv 1 7712 STRA5 1
WHIDDON DOWN.csv 1 7827 WHID5 1
Pyworthy 33kV BSP Generation:
PSS/E Model data
Site CSV file (P & Q from tag rules)
No. Gens
Bus Number
Bus Name Id
ASHWATER 33kV SOLAR PARK.csv 1 9265 ASWR3 P1
BRADFORD MANOR 33kV SOLAR PARK.csv 1 9210 BRPV3 P1
CRINACOTT FARM 33kV SOLAR PARK.csv 1 9650 CRPV3 P1
DENBROOK 33kV WIND FARM.csv 1 9635 DENB3 W1
DERRITON FIELDS 33kV SOLAR PARK.csv 1 9790 DERF3 P1
DUNSLAND CROSS 33kV WIND FARM.csv 1 10040 DUNX3 W1
EASTACOMBE FM 33kV SOLAR PARK.csv 1 9190 EAST3 P1
EAST LANGFORD 33kV SOLAR PARK.csv 1 9180 ESLA3 P1
EAST YOULSTONE 33kV WINDFARM.csv 1 9515 EYWF3 W1
FORESTMOOR WINDFARM.csv 1 8990 FORG3 W1
FOXCOMBE 33kV SOLAR PARK.csv 1 9445 FOXC3 P1
HIGHER NORTH BEER FARM SOLAR PARK.csv 1 9270 HNBF3 P1
PITWORTHY 33kV SOLAR PARK.csv 1 9625 PITW3 P1
REXON CROSS FARM 33kV SOLAR PARK.csv 1 9655 RCPV3 P1
WILLSLAND 33kV SOLAR PARK.csv 1 9185 WILL3 P1
Page 126
Virtual Statcom WP1 report
JK7261-TR-01-04 WPD Virtual Statcom WP1 report 10/04/2019 © Power Systems Consultants D3
Tiverton 33kV BSP Loads
PSS/E Model data
Site CSV file (P & Q from tag rules)
No. Loads Bus Number Bus Name Id
BRIDGE MILLS.csv 1 7117 BRIM5 1
BURLESCOMBE.csv 1 7136 BURL5 1
CULLOMPTON.csv 1 7238 CULL5 1
DUNKESWELL.csv 1 7271 DUNK5 1
HEMYOCK.csv 1 7367 HEMY5 1
TIVERTON JUNCTION.csv 1 7733 TIVE5 1
TIVERTON MOORHAYES.csv 1 7735 TIVM5 1
TIVERTON SOUTH.csv 1 7737 TIVS5 1
Tiverton 33kV BSP Generation
PSS/E Model data
Site CSV file (P & Q from tag rules)
No. Gens Bus Number Bus Name Id
AYSHFORD COURT FARM 33kV SOLAR PARK.csv 1 9370 AYSH3 P1
CULLOMPTON 33kV SOLAR PARK.csv 1 9830 CMPV3 P1
STONESHILL 33kV SOLAR PARK.csv 1 9850 STFA3 P1
Page 127
Virtual Statcom WP1 report
JK7261-TR-01-04 WPD Virtual Statcom WP1 report 10/04/2019 © Power Systems Consultants D4
Tiverton Moorhayes 11kV Primary
Generation values will be randomly allocated between 0 MW to the rated MW of to the two
solar farms in the Tiverton Moorhayes 11kV primary between the hours of 7 am and 7pm.
The total Tiverton Moorhayes 11kV generation will be added to the Tiverton Moorhayes 11kV
load from SCADA and then will be will be distributed to the 11kV individual load based on the
original load distribution in the Tiverton Moorhayes 11kV PSS/E model.
Bus Number Bus Name Id P% Q%
95001 313648 1 0.15% 0.15%
95003 315525 1 0.15% 0.15%
95005 313653 1 0.04% 0.05%
95007 313651 1 0.07% 0.08%
95008 315234 1 0.02% 0.02%
95010 313687 1 0.07% 0.08%
95012 313688 1 0.05% 0.05%
95014 314886 1 0.07% 0.08%
95016 315304 1 0.02% 0.02%
95018 313683 1 0.05% 0.05%
95020 315684 1 0.05% 0.05%
95022 316138 1 0.05% 0.05%
95026 315346 1 0.02% 0.02%
95028 315346 1 0.02% 0.02%
95029 315305 1 0.05% 0.05%
95031 312403 1 0.07% 0.08%
95033 316139 1 2.14% 2.14%
95034 312401 1 0.30% 0.29%
95036 313659 1 0.05% 0.05%
95038 313673 1 0.04% 0.05%
95040 313670 1 0.04% 0.05%
95042 313675 1 0.07% 0.08%
95044 313667 1 0.04% 0.05%
95046 316275 1 0.07% 0.08%
95048 313665 1 0.07% 0.08%
95050 315258 1 0.05% 0.05%
95052 313677 1 0.07% 0.08%
95054 313679 1 0.04% 0.05%
95056 313671 1 0.04% 0.05%
95058 314885 1 0.07% 0.08%
95060 311920 1 0.07% 0.08%
95062 315782 1 1.49% 1.48%
95064 311897 1 0.07% 0.08%
95066 313817 1 0.94% 0.93%
95068 313668 1 0.07% 0.08%
95070 314889 1 0.04% 0.05%
Bus Number Bus Name Id P% Q%
95072 314890 1 0.04% 0.05%
95074 311919 1 0.30% 0.29%
95076 311728 1 0.94% 0.93%
95078 315335 1 0.07% 0.08%
95079 313650 1 0.07% 0.08%
95081 313652 1 0.07% 0.08%
95083 318054 1 2.38% 2.37%
95086 317188 1 0.07% 0.08%
95088 316538 1 0.05% 0.05%
95090 314888 1 0.07% 0.08%
95091 313850 1 0.30% 0.29%
95093 315914 1 0.05% 0.05%
95094 314523 1 0.04% 0.05%
95096 315519 1 0.07% 0.08%
95098 314887 1 0.04% 0.05%
95100 314884 1 0.04% 0.05%
95102 313678 1 0.07% 0.08%
95104 313681 1 0.07% 0.08%
95106 313680 1 0.04% 0.05%
95108 315671 1 0.05% 0.05%
95109 313647 1 0.04% 0.05%
95111 313646 1 0.07% 0.08%
95113 313649 1 0.05% 0.05%
95115 316298 1 0.15% 0.15%
95117 313656 1 0.04% 0.05%
95119 313657 1 0.07% 0.08%
95120 316341 1 0.05% 0.05%
95121 312404 1 0.15% 0.15%
95122 314525 1 0.15% 0.15%
95124 312399 1 0.04% 0.05%
95126 313499 1 0.05% 0.05%
95127 313685 1 0.04% 0.05%
95129 313682 1 0.05% 0.05%
95130 313684 1 0.07% 0.08%
95131 315699 1 0.07% 0.08%
95132 313664 1 0.04% 0.05%
Page 128
Virtual Statcom WP1 report
JK7261-TR-01-04 WPD Virtual Statcom WP1 report 10/04/2019 © Power Systems Consultants D5
Bus Number Bus Name Id P% Q%
95134 313663 1 0.07% 0.08%
95135 313945 1 0.04% 0.05%
95137 314858 1 0.07% 0.08%
95139 313654 1 0.15% 0.15%
95141 313655 1 0.07% 0.08%
95143 315663 1 0.05% 0.05%
95145 313662 1 0.07% 0.08%
95147 313674 1 0.07% 0.08%
95148 313661 1 0.04% 0.05%
95150 313660 1 0.04% 0.05%
95151 316329 1 0.05% 0.05%
95152 314891 1 0.07% 0.08%
95153 315494 1 0.04% 0.05%
95154 313686 1 0.07% 0.08%
95156 313676 1 0.07% 0.08%
95158 312402 1 0.15% 0.15%
95160 312400 1 0.15% 0.15%
95161 313672 1 0.04% 0.05%
95168 314462 1 0.04% 0.05%
95170 312148 1 0.04% 0.05%
95172 315550 1 0.07% 0.08%
95174 312133 1 0.04% 0.05%
95176 312141 1 0.15% 0.15%
95178 315452 1 0.04% 0.05%
95180 312149 1 0.15% 0.15%
95182 314464 1 0.04% 0.05%
95184 317040 1 0.15% 0.15%
95186 312144 1 0.94% 0.93%
95187 312143 1 0.15% 0.15%
95189 313410 1 0.15% 0.15%
95191 315617 1 0.05% 0.05%
95193 311804 1 0.04% 0.05%
95195 311805 1 0.30% 0.29%
95197 314380 1 0.30% 0.29%
95199 312150 1 0.04% 0.05%
95201 312134 1 0.02% 0.02%
95203 312135 1 0.05% 0.05%
95205 312652 1 0.15% 0.15%
95207 311815 1 0.07% 0.08%
95209 312140 1 0.05% 0.05%
95211 312152 1 0.07% 0.08%
95213 312155 1 0.04% 0.05%
95215 311820 1 0.07% 0.08%
95217 311819 1 0.05% 0.05%
Bus Number Bus Name Id P% Q%
95219 311821 1 0.05% 0.05%
95221 312730 1 0.02% 0.02%
95223 316034 1 0.05% 0.05%
95225 314507 1 0.07% 0.08%
95226 311812 1 0.05% 0.05%
95228 311814 1 0.04% 0.05%
95230 311780 1 0.07% 0.08%
95232 311778 1 0.07% 0.08%
95234 315739 1 0.15% 0.15%
95236 311779 1 0.04% 0.05%
95238 311782 1 0.04% 0.05%
95240 315498 1 0.05% 0.05%
95242 314212 1 0.04% 0.05%
95244 311807 1 0.04% 0.05%
95246 316825 1 0.05% 0.05%
95248 311834 1 0.05% 0.05%
95250 311833 1 0.04% 0.05%
95252 315702 1 0.05% 0.05%
95254 312192 1 0.15% 0.15%
95256 312191 1 0.05% 0.05%
95258 314228 1 0.05% 0.05%
95260 311830 1 0.07% 0.08%
95262 312197 1 0.04% 0.05%
95264 312199 1 0.02% 0.02%
95266 316992 1 0.05% 0.05%
95268 311842 1 0.04% 0.05%
95270 314211 1 0.04% 0.05%
95271 312153 1 0.07% 0.08%
95273 312154 1 0.07% 0.08%
95275 311816 1 0.05% 0.05%
95276 313621 1 0.04% 0.05%
95278 313622 1 0.07% 0.08%
95280 311818 1 0.05% 0.05%
95282 311822 1 0.05% 0.05%
95284 311824 1 0.15% 0.15%
95286 311817 1 0.05% 0.05%
95288 313860 1 0.05% 0.05%
95289 315857 1 0.05% 0.05%
95291 311841 1 0.07% 0.08%
95293 315640 1 0.05% 0.05%
95295 312188 1 0.07% 0.08%
95297 315784 1 0.04% 0.05%
95299 311828 1 0.15% 0.15%
95301 312213 1 0.05% 0.05%
Page 129
Virtual Statcom WP1 report
JK7261-TR-01-04 WPD Virtual Statcom WP1 report 10/04/2019 © Power Systems Consultants D6
Bus Number Bus Name Id P% Q%
95303 316356 1 0.05% 0.05%
95305 312196 1 0.07% 0.08%
95307 311844 1 0.15% 0.15%
95309 315883 1 0.30% 0.29%
95311 313962 1 0.15% 0.15%
95313 311855 1 0.05% 0.05%
95315 311825 1 0.04% 0.05%
95317 311826 1 0.30% 0.29%
95319 315689 1 0.05% 0.05%
95321 317131 1 0.30% 0.29%
95323 311857 1 0.04% 0.05%
95325 311827 1 0.07% 0.08%
95326 312217 1 0.04% 0.05%
95328 312215 1 0.04% 0.05%
95330 312203 1 0.07% 0.08%
95332 313806 1 0.04% 0.05%
95334 314020 1 0.05% 0.05%
95335 316915 1 2.97% 2.96%
95337 315728 1 0.05% 0.05%
95338 311852 1 0.05% 0.05%
95340 311851 1 0.07% 0.08%
95342 311863 1 0.15% 0.15%
95344 315278 1 0.05% 0.05%
95346 311845 1 0.15% 0.15%
95348 314671 1 0.05% 0.05%
95350 312221 1 0.04% 0.05%
95352 312222 1 0.04% 0.05%
95354 312220 1 0.15% 0.15%
95356 316293 1 0.07% 0.08%
95358 311853 1 0.05% 0.05%
95360 314672 1 0.07% 0.08%
95361 313913 1 0.07% 0.08%
95363 315209 1 0.04% 0.05%
95365 311850 1 0.04% 0.05%
95367 311743 1 0.07% 0.08%
95369 311823 1 0.05% 0.05%
95371 311856 1 0.60% 0.59%
95374 311865 1 0.05% 0.05%
95376 311864 1 0.15% 0.15%
95378 311746 1 0.07% 0.08%
95380 311744 1 0.07% 0.08%
95382 313519 1 0.07% 0.08%
95384 311742 1 0.07% 0.08%
95386 311854 1 0.05% 0.05%
Bus Number Bus Name Id P% Q%
95388 311860 1 0.07% 0.08%
95390 311862 1 0.30% 0.29%
95392 311829 1 0.07% 0.08%
95394 314540 1 0.05% 0.05%
95395 311840 1 0.15% 0.15%
95397 314395 1 0.15% 0.15%
95399 311871 1 0.04% 0.05%
95401 313515 1 0.05% 0.05%
95403 311861 1 0.04% 0.05%
95404 314676 1 0.04% 0.05%
95405 311866 1 0.04% 0.05%
95407 311867 1 0.05% 0.05%
95409 314479 1 0.15% 0.15%
95410 311859 1 0.05% 0.05%
95412 315132 1 0.04% 0.05%
95414 312210 1 0.07% 0.08%
95416 312211 1 0.04% 0.05%
95418 311739 1 0.30% 0.29%
95420 315577 1 0.15% 0.15%
95422 312209 1 0.07% 0.08%
95424 311836 1 0.15% 0.15%
95426 311835 1 0.15% 0.15%
95428 311873 1 0.15% 0.15%
95430 313500 1 0.30% 0.29%
95431 315957 1 0.07% 0.08%
95433 316077 1 1.31% 1.30%
95435 311869 1 0.05% 0.05%
95437 311872 1 0.30% 0.29%
95439 311870 1 0.15% 0.15%
95441 311839 1 0.07% 0.08%
95442 311837 1 0.15% 0.15%
95444 312355 1 0.30% 0.29%
95446 314286 1 0.60% 0.59%
95448 316622 1 0.15% 0.15%
95450 316621 1 0.15% 0.15%
95452 316594 1 0.05% 0.05%
95454 316148 1 0.15% 0.15%
95456 315916 1 0.15% 0.15%
95458 316207 1 0.07% 0.08%
95460 311721 1 0.07% 0.08%
95462 311718 1 0.15% 0.15%
95464 311731 1 0.30% 0.29%
95466 311712 1 0.04% 0.05%
95468 216963 1 0.07% 0.08%
Page 130
Virtual Statcom WP1 report
JK7261-TR-01-04 WPD Virtual Statcom WP1 report 10/04/2019 © Power Systems Consultants D7
Bus Number Bus Name Id P% Q%
95470 311720 1 0.07% 0.08%
95472 311716 1 0.15% 0.15%
95474 311717 1 0.07% 0.08%
95476 313400 1 0.07% 0.08%
95478 311732 1 0.07% 0.08%
95480 315126 1 0.15% 0.15%
95482 314698 1 0.15% 0.15%
95484 311722 1 0.02% 0.02%
95486 311723 1 0.07% 0.08%
95488 315469 1 0.30% 0.29%
95490 316021 1 0.30% 0.29%
95492 312351 1 0.05% 0.05%
95494 315517 1 0.05% 0.05%
95496 311715 1 0.89% 0.89%
95498 311726 1 0.60% 0.59%
95499 311727 1 1.49% 1.48%
95503 311713 1 0.07% 0.08%
95505 312356 1 2.38% 2.37%
95507 311734 1 0.07% 0.08%
95509 316307 1 0.07% 0.08%
95511 317196 1 4.46% 4.45%
95514 312352 1 0.60% 0.59%
95516 316765 1 0.94% 0.93%
95517 316847 1 2.38% 2.37%
95518 312202 1 0.07% 0.08%
95520 312185 1 0.02% 0.02%
95522 314583 1 0.15% 0.15%
95524 312201 1 0.07% 0.08%
95526 316941 1 1.49% 1.48%
95528 311781 1 0.04% 0.05%
95529 316918 1 0.94% 0.93%
95531 317212 1 3.57% 3.56%
95534 312357 1 1.49% 1.48%
95536 312353 1 2.38% 2.37%
95538 317265 1 0.15% 0.15%
95539 317021 1 0.60% 0.59%
95540 311847 1 0.30% 0.29%
95541 312014 1 0.05% 0.05%
95543 316076 1 0.05% 0.05%
95544 313847 1 0.15% 0.15%
95545 311777 1 0.07% 0.08%
95547 316425 1 0.30% 0.29%
95549 315291 1 0.05% 0.05%
95551 311785 1 0.07% 0.08%
Bus Number Bus Name Id P% Q%
95553 311783 1 0.04% 0.05%
95555 312350 1 0.04% 0.05%
95556 315800 1 0.05% 0.05%
95557 311868 1 0.30% 0.29%
95558 312212 1 0.04% 0.05%
95559 315040 1 0.07% 0.08%
95560 317364 1 0.15% 0.15%
95562 317385 1 0.30% 0.29%
95564 316954 1 0.05% 0.05%
95565 312729 1 0.15% 0.15%
95567 312208 1 0.07% 0.08%
95569 312216 1 0.07% 0.08%
95571 317412 1 0.07% 0.08%
95572 312195 1 0.30% 0.29%
95574 312223 1 0.04% 0.05%
95576 311745 1 0.07% 0.08%
95578 315005 1 0.05% 0.05%
95579 315004 1 0.07% 0.08%
95581 311741 1 0.07% 0.08%
95583 316658 1 0.05% 0.05%
95584 316334 1 0.05% 0.05%
95585 314108 1 0.15% 0.15%
95586 315150 1 0.15% 0.15%
95588 312206 1 0.07% 0.08%
95590 312207 1 0.30% 0.29%
95591 312219 1 0.04% 0.05%
95593 313689 1 0.07% 0.08%
95594 313520 1 0.07% 0.08%
95595 313912 1 0.07% 0.08%
95597 315314 1 0.07% 0.08%
95599 314214 1 0.30% 0.29%
95601 311874 1 0.04% 0.05%
95603 316042 1 0.07% 0.08%
95605 316041 1 0.05% 0.05%
95606 316556 1 0.15% 0.15%
95608 311719 1 0.07% 0.08%
95612 311737 1 0.30% 0.29%
95614 315068 1 0.05% 0.05%
95615 313750 1 0.07% 0.08%
95616 311738 1 0.15% 0.15%
95617 311735 1 0.07% 0.08%
95618 311733 1 0.15% 0.15%
95620 315374 1 0.05% 0.05%
95622 314807 1 0.07% 0.08%
Page 131
Virtual Statcom WP1 report
JK7261-TR-01-04 WPD Virtual Statcom WP1 report 10/04/2019 © Power Systems Consultants D8
Bus Number Bus Name Id P% Q%
95624 311729 1 0.07% 0.08%
95626 311730 1 0.15% 0.15%
95627 315424 1 0.60% 0.59%
95628 213544 1 0.07% 0.08%
95630 316970 1 0.05% 0.05%
95632 213545 1 0.04% 0.05%
95634 213798 1 0.04% 0.05%
95635 316393 1 0.05% 0.05%
95637 316394 1 0.07% 0.08%
95638 316912 1 0.07% 0.08%
95639 312160 1 0.05% 0.05%
95641 312159 1 0.04% 0.05%
95643 316908 1 0.05% 0.05%
95644 313878 1 0.05% 0.05%
95646 311811 1 0.15% 0.15%
95648 312147 1 0.04% 0.05%
95649 312145 1 0.02% 0.02%
95651 312146 1 0.04% 0.05%
95652 311806 1 0.07% 0.08%
95654 312158 1 0.15% 0.15%
95656 314584 1 0.04% 0.05%
95657 315458 1 0.05% 0.05%
95661 312161 1 0.15% 0.15%
95665 312157 1 0.15% 0.15%
95667 312156 1 0.05% 0.05%
95669 312142 1 0.05% 0.05%
95671 312527 1 0.15% 0.15%
95675 311808 1 0.04% 0.05%
95676 313854 1 0.15% 0.15%
95678 311784 1 0.15% 0.15%
95680 315207 1 0.05% 0.05%
95682 315274 1 0.05% 0.05%
95684 315710 1 0.07% 0.08%
95685 312163 1 0.05% 0.05%
95687 312162 1 0.07% 0.08%
95688 312151 1 0.30% 0.29%
95690 312136 1 0.04% 0.05%
95692 312139 1 0.05% 0.05%
95693 312190 1 0.15% 0.15%
95695 312138 1 0.07% 0.08%
95697 312137 1 0.15% 0.15%
95698 315226 1 0.05% 0.05%
95700 311813 1 0.07% 0.08%
95702 312526 1 0.07% 0.08%
Bus Number Bus Name Id P% Q%
95704 316453 1 0.05% 0.05%
95706 315319 1 0.07% 0.08%
95707 312189 1 0.05% 0.05%
95708 312187 1 0.04% 0.05%
95710 312193 1 0.04% 0.05%
95711 311832 1 0.05% 0.05%
95713 316441 1 0.05% 0.05%
95715 316013 1 0.05% 0.05%
95716 312186 1 0.07% 0.08%
95717 312200 1 0.02% 0.02%
95719 312198 1 0.05% 0.05%
95720 315108 1 0.04% 0.05%
95722 311846 1 0.30% 0.29%
95724 311843 1 0.05% 0.05%
95726 316061 1 0.05% 0.05%
95727 315956 1 0.07% 0.08%
95729 315444 1 0.05% 0.05%
95730 314258 1 0.07% 0.08%
95732 312194 1 0.04% 0.05%
95733 312224 1 0.04% 0.05%
95734 312214 1 0.05% 0.05%
95736 312218 1 0.07% 0.08%
95737 312204 1 0.04% 0.05%
95739 312205 1 0.07% 0.08%
95741 311858 1 0.07% 0.08%
95743 311848 1 0.15% 0.15%
95745 311849 1 0.15% 0.15%
95746 316620 1 0.05% 0.05%
95756 316524 1 0.94% 0.93%
95757 316366 1 2.38% 2.37%
95759 316365 1 0.94% 0.93%
95761 315875 1 1.49% 1.48%
95763 316706 1 0.60% 0.59%
95765 316200 1 2.38% 2.37%
95768 316859 1 0.94% 0.93%
95770 316858 1 1.49% 1.48%
95772 314443 1 0.94% 0.93%
95774 317020 1 0.94% 0.93%
95779 312380 1 0.94% 0.93%
95783 316532 1 0.15% 0.15%
95788 315579 1 0.30% 0.29%
95793 315089 1 0.94% 0.93%
95795 313751 1 1.49% 1.48%
95797 313658 1 1.49% 1.48%
Page 132
Virtual Statcom WP1 report
JK7261-TR-01-04 WPD Virtual Statcom WP1 report 10/04/2019 © Power Systems Consultants D9
Bus Number Bus Name Id P% Q%
95799 312385 1 1.49% 1.48%
95801 312384 1 0.94% 0.93%
95803 313833 1 0.89% 0.89%
95805 312382 1 0.60% 0.59%
95807 314454 1 0.94% 0.93%
95809 312383 1 1.49% 1.48%
95811 316888 1 1.49% 1.48%
95815 314400 1 1.49% 1.48%
Page 133
Virtual Statcom WP1 report
JK7261-TR-01-04 WPD Virtual Statcom WP1 report 10/04/2019 © Power Systems Consultants E1
Appendix E – Tiverton Moorhayes 11kV PSS/E SLD
Page 134
Virtual Statcom WP1 report
JK7261-TR-01-04 WPD Virtual Statcom WP1 report 10/04/2019 © Power Systems Consultants E2
Continued on next page…
33/11 kV Connection
Page 135
Virtual Statcom WP1 report
JK7261-TR-01-04 WPD Virtual Statcom WP1 report 10/04/2019 © Power Systems Consultants E3
Continued on next page…
Page 136
Virtual Statcom WP1 report
JK7261-TR-01-04 WPD Virtual Statcom WP1 report 10/04/2019 © Power Systems Consultants E4