Virtual Tourism Destination Image Innovating measurement methodologies Robert Govers Flemish Center for Tourism Policy Studies, University of Leuven W. de Croylaan 42, B3001 Heverlee, Belgium E-mail: [email protected]Promoters: Prof. Dr. Frank M. Go Rotterdam School of Management, Erasmus University Rotterdam Centre for Tourism Management PO Box 1738, 3000 DR Rotterdam, The Netherlands E-mail: [email protected]Prof. Dr. Kuldeep Kumar Rotterdam School of Management, Erasmus University Rotterdam Department of Decision & Information Sciences PO Box 1738, 3000 DR Rotterdam, The Netherlands E-mail: [email protected]College of Business Administration, Florida International University, Department of Decision Sciences and Information Systems 11200 SW 8th St. University Park, RB 310, Miami, Florida 33199, USA E-mail: [email protected]Acknowledgements: We would like to thank the sponsors of this research: Travellerspoint.com for hosting our survey and promoting it to their members and visitors, KLM Royal Dutch Airlines and Jebel Ali International Hotels for providing the incentive raffle prize. We would also like to thank MeetURplanet.com, Trekshare.com, Mytripjournal.com, and iTravelnet.com for their support. Lastly we are indebted to the Delphi panel experts for their input, thanks to: Dimitrios Buhalis, Daniel R. Fesenmaier, Matthias Fuchs, William C. Gartner, Ulrike Gretzel, Jafar Jafari, Jamie Murphy and Karl Wöber.
Robert Govers Flemish Center for Tourism Policy Studies, University of Leuven W. de Croylaan 42, B3001 Heverlee, Belgium E-mail: [email protected] Promoters: Prof. Dr. Frank M. Go Rotterdam School of Management, Erasmus University Rotterdam Centre for Tourism Management PO Box 1738, 3000 DR Rotterdam, The Netherlands E-mail: [email protected] Prof. Dr. Kuldeep Kumar Rotterdam School of Management, Erasmus University Rotterdam Department of Decision & Information Sciences PO Box 1738, 3000 DR Rotterdam, The Netherlands E-mail: [email protected] College of Business Administration, Florida International University, Department of Decision Sciences and Information Systems 11200 SW 8th St. University Park, RB 310, Miami, Florida 33199, USA E-mail: [email protected] Acknowledgements: We would like to thank the sponsors of this research: Travellerspoint.com for hosting our survey and promoting it to their members and visitors, KLM Royal Dutch Airlines and Jebel Ali International Hotels for providing the incentive raffle prize. We would also like to thank MeetURplanet.com, Trekshare.com, Mytripjournal.com, and iTravelnet.com for their support. Lastly we are indebted to the Delphi panel experts for their input, thanks to: Dimitrios Buhalis, Daniel R. Fesenmaier, Matthias Fuchs, William C. Gartner, Ulrike Gretzel, Jafar Jafari, Jamie Murphy and Karl Wöber.
Abstract This paper reports on an innovative research study that utilised the enabling technologies of the internet and computerised content analysis to approach the measurement of destination image from a phenomenographic post-positivist perspective. In an online survey, respondents were asked to describe their image of one of seven case-study destinations that they had never visited before, in story format. The large amount of qualitative data of 1,100 respondents was content analysed using artificial neural network software. The results produce a vivid three dimensional picture of the differences and commonalities between seven sample destinations. For each destination unique characteristics are identified, but common attributes across destinations are observed as well. The measured image components match results reported in literature, both from a theoretical perspective as well as through applied studies that report on the case-study destinations that were included here. The limitation of our approach is that common attributes move towards the centre of our three-dimensional clustering space, as these attributes are shared by several of the destinations that were included in the study. This makes it virtually impossible to assess the relative position of different destinations on these common attributes. Hence, this is where traditional attribute-based measurement scales will come in useful in future research. Introduction With the proliferation of the internet and its convergence with and influence on the de-massification of the media (Toffler 1980: p. 165; Werthner & Klein 1999: p. 69), tourism destination images are becoming increasingly fragmented and ephemeral in nature (Harvey 1989: p. 293). What Boorstin already argued in 1962 - that the consumer is ruled by extravagant expectations - seems to ring more true every day. As opposed to Boorstin’s original query of how exotic the nearby can be, we now ask ourselves how nearby the exotic can be; and not how familiar the exotic can become, but how to preserve the exotic of the unfamiliar. Through the extensive media coverage of large scale news events such as for instance Olympic games or the completion of global architectural icons as in our central case-study Dubai, or, on the other side of the coin, negative events such as SARS, the second Gulf war, or the 2004 Indian Ocean tsunami, destination images change rapidly and unique characteristics and holistic aspects of the destination image become increasingly important. Technological advancement, extraordinary events, and increased international competition thus affect the way in which tourism destinations are imagined, perceived and consumed. Creating destination image is no longer a one-way ‘push’ process of mass communication, but a dynamic one of selecting, reflecting, sharing, and experiencing. Tourism is indeed often referred to as a hedonic consumption experience (Vogt & Fesenmaier 1998), which “designates those facets of consumer behaviour that relate to the multisensory, fantasy and emotive aspects of one’s experience of products” (Hirschman & Holbrook 1982: p. 92). With experiential products like travel and tourism, the consumption experience is an end in itself and the planning of a trip is an ongoing enjoyable and interactive social process, where fantasy and emotions play an important role and consumers are involved in ongoing information search (Decrop & Snelders 2004). By going through this process and collecting all this information, the consumer creates an ‘image’ or ‘mental portrayal or prototype’ (Alhemoud & Armstrong 1996; Crompton 1979; Kotler et al. 1993; Tapachai & Waryszak 2000: p. 37) of what the travel experience might look like. Such an image is generally accepted (Echtner & Ritchie 1993: p. 4; Padgett & Allen 1997: p. 50; Tapachai & Waryszak 2000: p. 38) to be based on attributes, functional consequences, (or expected benefits) and the
symbolic meanings or psychological characteristics consumers associate with a specific destination (or service), and therefore the image influences destination positioning and ultimately the tourist’s buying behaviour. There seems to be a consensus among authors that the destination image research stream has emerged from Hunt’s work of 1971 (Gallarza et al. 2002: p. 58; Hunt 1975). “From this time onwards, there have been numerous and varied approaches to its study”, totalling 65 works, between 1971 and 1999, as identified by the thorough synoptic work of Gallarza et al. (2002) as well as Pike (2002) who reviewed 142 papers. One influential study was published by Echtner and Ritchie (1993; 2003). Through their research Echtner and Ritchie concluded that:
• Destination image should be envisioned as having two main components: those that are attribute based and those that are holistic;
• Each of these components contains functional (or more tangible) and psychological (or more abstract) characteristics;
• Images of destinations can also range from those based on “common” functional and psychological traits [components] to those based on more distinctive or even unique features, events, feelings or auras.
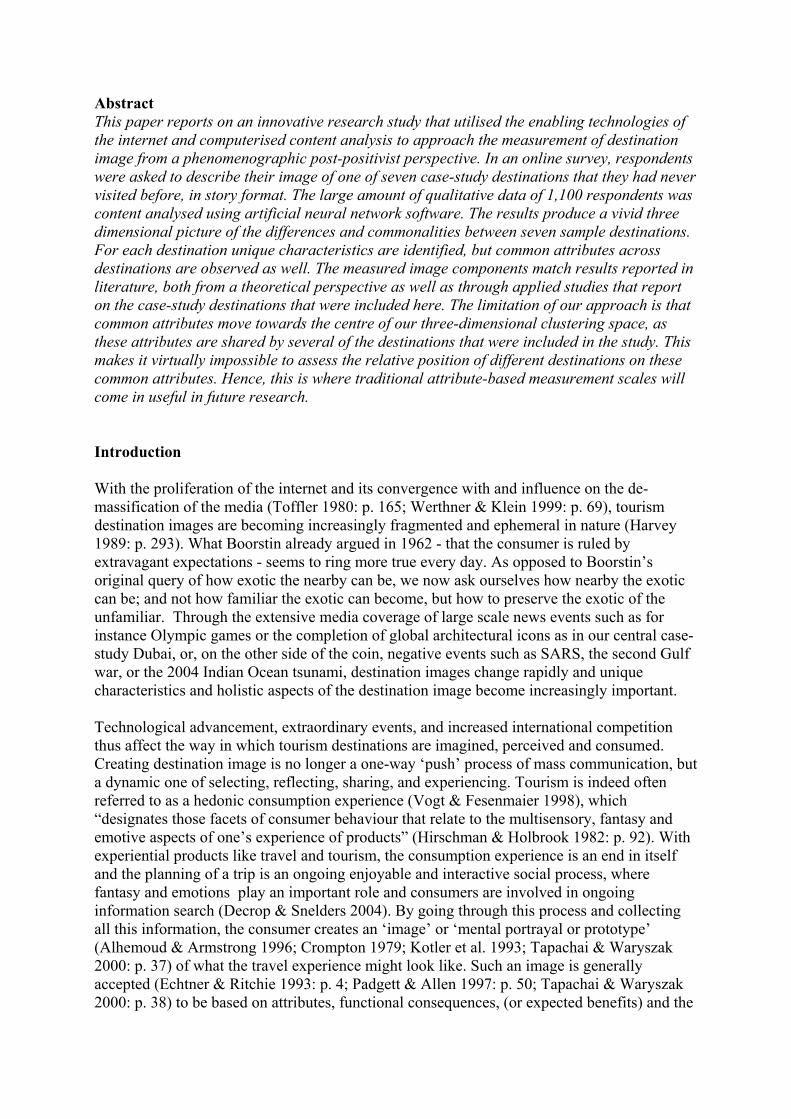
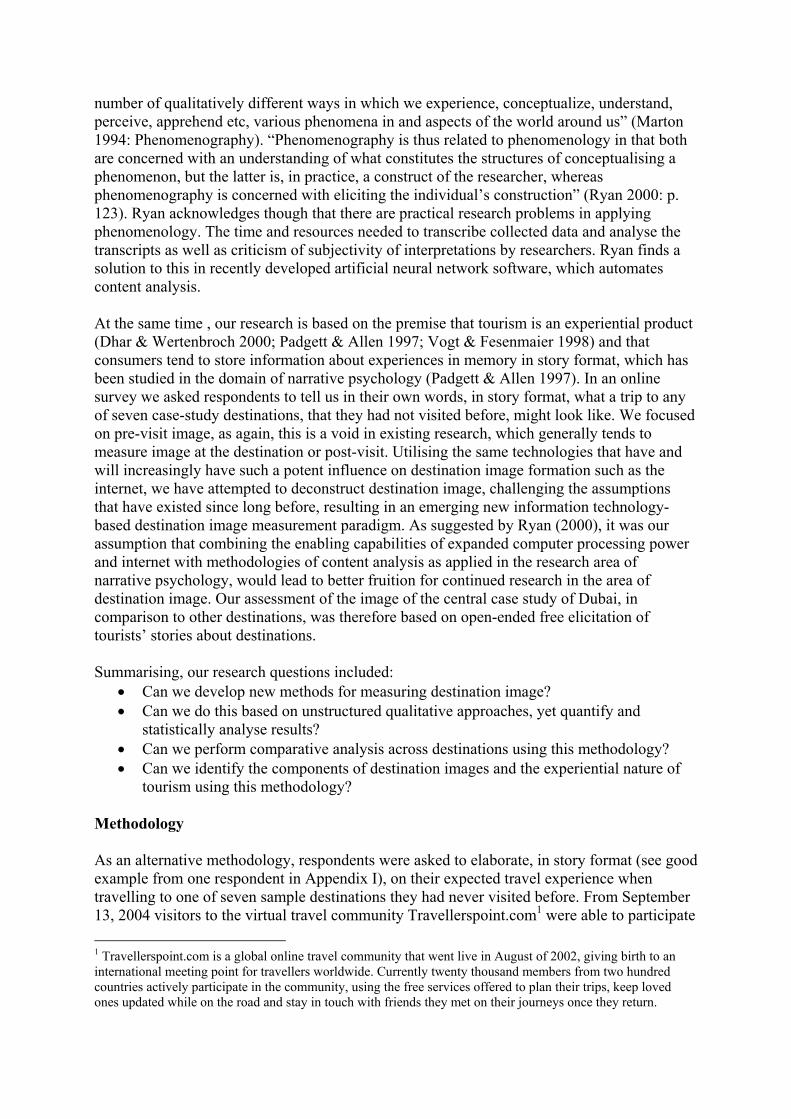
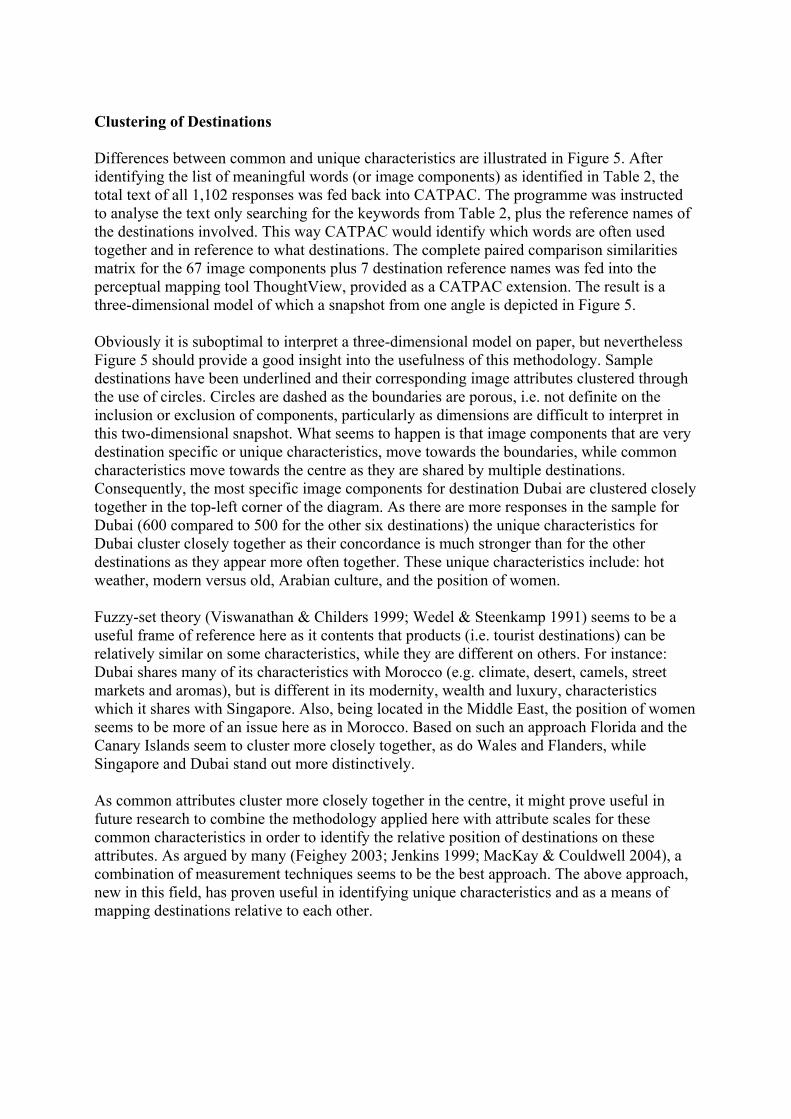
This illustrates that there are many aspects involved in formulating the total destination image in the mind of the tourist. The three-dimensional model envisaged by Echtner and Ritchie is depicted in Figure 1, together with some examples for four of the six components. The common versus unique-dimension is missing in this example for Nepal, but normally identifies if image aspects are unique for the specific destination, or shared by others as well.
PsychologicalCharacteristics
FunctionalCharacteristics
Attributes Holistic (imagery)
Common
Unique
PsychologicalCharacteristics
FunctionalCharacteristics
Attributes Holistic (imagery)
• Cool climate
• Low prices
• Poor roads
• Poor nightlife
• Friendly people
• Generally safe
• Mental picture of physical characteristics (mountainous, villages)
• General feeling or atmosphere (mystic)
Figure 1: The components of destination image and an example of four of those (Nepal) Note: Reproduced from “The Meaning and Measurement of Destination Image”, Echtner, C.M. & Ritchie, J.R.B., 2003, Journal of Tourism Studies, 14 (1), 37-48. Because of the complexity of the construct of destination image, Echtner and Ritchie (1993) proposed a combination of structured and unstructured methodologies to measure destination images. They proposed open-ended, semi-structured questionnaires to capture holistic components and more distinctive or unique features of the destination image. Secondly, a structured attribute-based 8-factor scale was produced to measure destination image performance across destinations. Most studies to date just emphasise the second attribute-
based approaches to assessing destination image. Gallarza et al. (2002: p. 67) conclude that: “for the most part, there is a combination of multivariate and bivariate techniques, with a greater or lesser presence of qualitative techniques in the preliminary steps. Very few studies use qualitative methods as the main technique. Among all collection procedures, the seven-point Likert Scale is the most commonly used” when measuring image attributes and factors. Such studies must however be limited because they cannot capture the holistic nature and subjective perspective of the individual, nor the destination’s unique characteristics of the image (Echtner & Ritchie 2003; Tapachai & Waryszak 2000). As Bigné et al. (2001: p. 611) state: “the sum of the attribute scores is not an adequate measurement of the overall image”. In recent years the call for more pluralistic approaches to understanding tourism destination image formation has become louder (Feighey 2003; Jenkins 1999; MacKay & Couldwell 2004). Some for instance have started to utilise photographs (Dann 1996; MacKay & Couldwell 2004; MacKay & Fesenmaier 1997; Markwell 1997). In the research on retail store image, the use of scales has been long criticised based on the observation that “people are encouraged to respond to characteristics that do not necessarily comprise the image they have of the store being studied” (Kunkel & Berry 1968: p. 25). “It has been suggested that a more appropriate measurement would be achieved by the use of unstructured instruments, followed by content analysis and coding of responses” (McDougall & Fry 1974: p. 54). In this way “the respondent is free to discuss only that which is relevant to his image of the store” (Kunkel & Berry 1968: p. 25). Research Objective A strong image means perceived superior customer value that positively influences buying behaviour and consequently enhances marketing effectiveness (Echtner & Ritchie 1993; MacKay & Fesenmaier 2000; Padgett & Allen 1997; Sirgy & Su 2000; Tapachai & Waryszak 2000). Past and present destination image research therefore seems to have focused on measuring place-performance on attributes that define our “extravagant” - according to Boorstin (1962) - expectations with regards to travel. These would include: the perfect climate; the most friendly, multilingual and culturally rich local population; the lowest possible cost; the most accessible yet most exotic location; the most interesting and adventurous or entertaining activities on offer; the best organised tourist infrastructure and highest quality facilities, yet unspoilt and the most attractive natural beauty. However, one of the issues is that methodologies that measure image using only such common attribute scales have been proved to be incapable of measuring unique differences and the ephemeral character of image. In an earlier study by Govers and Go (2003), the traditional multi-attribute system, used in tourism destination image literature, was incapable of measuring differences in destination image among different groups of consumers that show unequal levels of destination preference (i.e. based on this method, tourists that visit a destination regularly, do not report a different image of that destination, compared to non-visitors). Therefore, multi-attribute approaches on their own seem to be inadequate in measuring destination image and preference of tourism destinations and alternative methods should be evaluated. Therefore, the objective of this paper is to report upon the development of an alternate methodology for measuring destination image. As apposed to most prior research on destination image, our study focuses on applying a phenomenographic approach to measuring destination image, in order to include the subjective view of the individual (Ryan 2000). Phenomenography has been defined by one of the Scandinavian founders of the school of thought as: “the empirical study of the limited
number of qualitatively different ways in which we experience, conceptualize, understand, perceive, apprehend etc, various phenomena in and aspects of the world around us” (Marton 1994: Phenomenography). “Phenomenography is thus related to phenomenology in that both are concerned with an understanding of what constitutes the structures of conceptualising a phenomenon, but the latter is, in practice, a construct of the researcher, whereas phenomenography is concerned with eliciting the individual’s construction” (Ryan 2000: p. 123). Ryan acknowledges though that there are practical research problems in applying phenomenology. The time and resources needed to transcribe collected data and analyse the transcripts as well as criticism of subjectivity of interpretations by researchers. Ryan finds a solution to this in recently developed artificial neural network software, which automates content analysis. At the same time , our research is based on the premise that tourism is an experiential product (Dhar & Wertenbroch 2000; Padgett & Allen 1997; Vogt & Fesenmaier 1998) and that consumers tend to store information about experiences in memory in story format, which has been studied in the domain of narrative psychology (Padgett & Allen 1997). In an online survey we asked respondents to tell us in their own words, in story format, what a trip to any of seven case-study destinations, that they had not visited before, might look like. We focused on pre-visit image, as again, this is a void in existing research, which generally tends to measure image at the destination or post-visit. Utilising the same technologies that have and will increasingly have such a potent influence on destination image formation such as the internet, we have attempted to deconstruct destination image, challenging the assumptions that have existed since long before, resulting in an emerging new information technology-based destination image measurement paradigm. As suggested by Ryan (2000), it was our assumption that combining the enabling capabilities of expanded computer processing power and internet with methodologies of content analysis as applied in the research area of narrative psychology, would lead to better fruition for continued research in the area of destination image. Our assessment of the image of the central case study of Dubai, in comparison to other destinations, was therefore based on open-ended free elicitation of tourists’ stories about destinations. Summarising, our research questions included:
• Can we develop new methods for measuring destination image? • Can we do this based on unstructured qualitative approaches, yet quantify and
statistically analyse results? • Can we perform comparative analysis across destinations using this methodology? • Can we identify the components of destination images and the experiential nature of
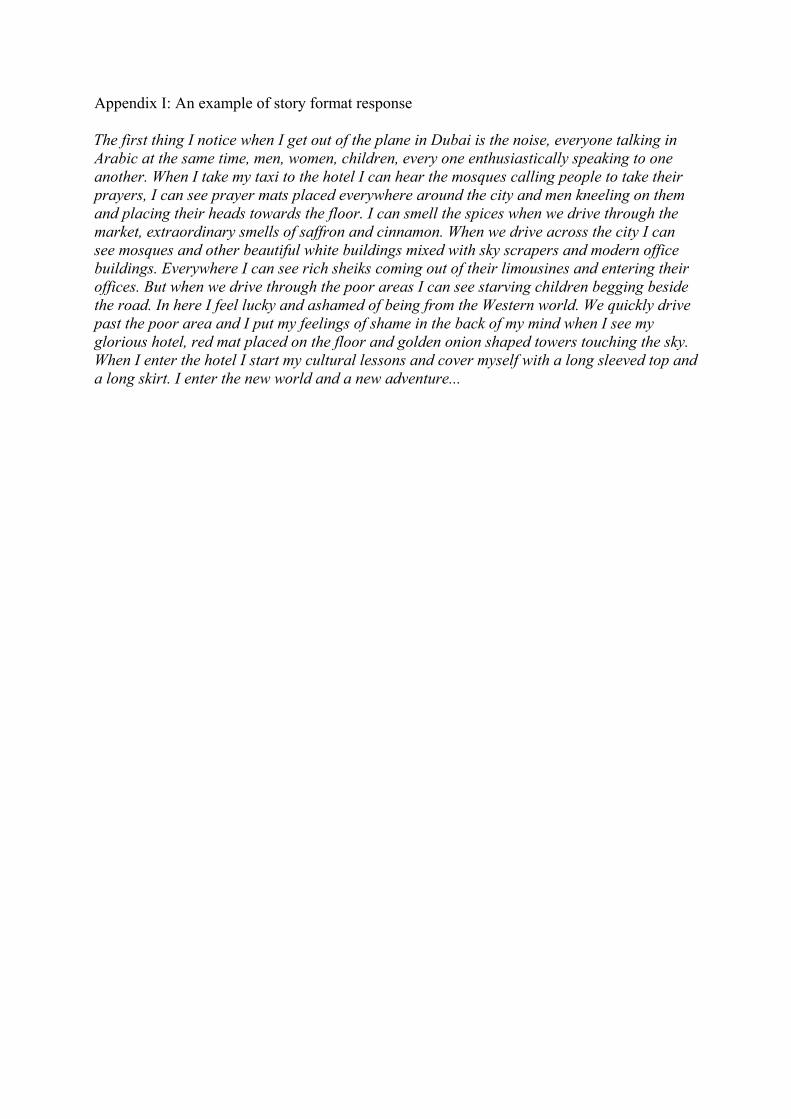
tourism using this methodology? Methodology As an alternative methodology, respondents were asked to elaborate, in story format (see good example from one respondent in Appendix I), on their expected travel experience when travelling to one of seven sample destinations they had never visited before. From September 13, 2004 visitors to the virtual travel community Travellerspoint.com1 were able to participate 1 Travellerspoint.com is a global online travel community that went live in August of 2002, giving birth to an international meeting point for travellers worldwide. Currently twenty thousand members from two hundred countries actively participate in the community, using the free services offered to plan their trips, keep loved ones updated while on the road and stay in touch with friends they met on their journeys once they return.
in this research. The project focused on the image of Dubai, but as compared to other destinations that are in some way either similar or particularly contrasting. The global comparative study included destinations such as the Canary Islands, Flanders (Belgium), Florida, Morocco, Singapore, and Wales. Travellerspoint, with nearly half a million ‘unique’ visitors a month and its twenty thousand members from 200 countries; would, it was hoped, generate a good responses from all over the world. To maximise response rates, all participants were automatically eligible to win the grand prize raffle draw: a free holiday to Dubai. Until recently, it would have been virtually impossible to analyse the large quantity of qualitative data that this approach generates, as the researcher would have had to wade through literally hundreds of thousands of words and code them. Then, to assure reliability of the results, at least two other colleagues would have had to go through the same process, creating serious time and man-power demands on limited resources. However today, with computerised neural network content analysis software such as CATPAC, these types of constraints have been eliminated. CATPAC is a self-organising artificial neural network software package used for content analysis of text. “CATPAC is able to identify the most important words in a text and determine the patterns of similarity based on the way they are used in the text” (Woelfel 1998: p. 11). The theoretical foundation for CATPAC is based on an area of cognitive science, called neuroscience, which is a branch of psychology. Neuroscience is the study of the functioning of the nervous system which includes the structures and functioning of the brain and its relationship to behaviour. Artificial neural networks are computing systems which mimic the brain through a network of highly interconnected, processing elements, which give them learning capabilities and enable them to recognize, and to understand, subtle or complex patterns. In simple terms, CATPAC produces a frequency table and proximity matrix for the most frequently used words in the text. “Neural network software like CATPAC is modelled to operate like the structure of the human brain and like the human brain the software recognizes patterns of words and learns the regularities of co-occurrences of patterns. Moreover, if words are connected repeatedly the network will ‘learn’ the pattern, while patterns which are presented seldom will fade. The most frequently used words of a text build the nodes/neurons of the network. The relations between these words are defined by the co-occurring of the words in one unit. Connections between words co-occurring in a unit are strengthened, if words are co-occurring in a unit, otherwise the connection values are reduced” (Züll & Landmann 2004: p. 2) The unit of analysis is a sliding text window chosen by the researcher. Default window size is 7 words, i.e. CATPAC moves a window of 7 words across the text and calculates word proximities based on the number of times words are found together (or not) within these frames. Alternatively the window of analysis can be case-based, i.e CATPAC calculates word proximities based on the number of times respondents use words (or not) in each response to a question. The latter approach was used in this study. The advantage of CATPAC over other software is that the researcher does not need to build a dictionary of words that the software should search for (Züll & Landmann 2004). CATPAC will work with any and all words in the text; produce a frequency table and then perform the neural network analysis on the top-X most frequently found words. X (i.e. the maximum number of words to be included in the analysis) is to be defined by the researcher. However, words incorporated in an exclude file are ignored. A default exclude file containing words like articles, prepositions, and other "meaningless" words is provided with CATPAC, but the researcher can incorporate additional words in de exclude file.
Summarising, CATPAC identifies subtle and complex patterns in any documents or qualitative survey responses it processes and is therefore ideal for analysing long pieces of text or high quantity qualitative data in order to identify the main concepts that authors of such texts or respondents like to convey. It would go beyond the object of this paper to explain the detailed working of the programme here any further, as the above explanation is a simplification, but for a good overview please refer to (Woelfel & Stoyanoff 1993)). Among others, Gretzel and Fesenmaier (2003) and Ryan (2000) have advocated CATPAC to be a valuable tool for content analysis. With respondents submitting their written accounts online, the data was already in digital format, and therefore the time involved in data-entry and analysis is significantly reduced,. At the same time it is possible to criticise these types of approached on several counts.
First, most require that respondents translate imagery processing into a discursive mode (e.g. verbal responses), confusing even more the distinction between the processing modes. Moreover, individual differences in verbosity or vocabulary can influence the nature of this translation. In addition, studies that ask individuals to detail imagery scenarios may not be assessing the extent of detail contained in the image, but rather subjects’ abilities to control their image so that details can be specified (MacInnes & Price 1987: p. 485).
Also the level of detail provided by unstructured methodologies is highly variable as it depends upon the verbal and/or writing skills of the individuals used in the study, their willingness to provide multiple responses and their knowledge base of the product (McDougall & Fry 1974). Furthermore, because of the qualitative nature of the data, statistical analyses of the results are limited. In particular, comparative analyses across several products are not facilitated by unstructured methodologies (Echtner & Ritchie 2003). The latter however, can be overcome with the use of recent technologies for automated content analysis as described. The former issue of verbosity, vocabulary and writing skills was partly dealt with through thorough automatic spelling and grammar checking and pre-reading of all texts, but it is acknowledged that this issue forms a potential limitation of this study. Questionnaire The central question of the questionnaire was formulated through a Delphi type discussion with eight scientific experts from the UK, US, Australia and Austria. All experts are academics at assistant (2), associate (3) of full (3) professor level and experts in tourism research with an emphasis on destination image research or research in the area of information technology and tourism. Delphi participants were first given general information about the research set-up and about the first page of the questionnaire that would be provided to respondents in order to have them indicate which of the seven case-study destinations they had ever visited. Subsequently, Delphi participants were told that, based on the survey response on the first page, the central question would be put forward. An initial draft formulation of that central question was provided to Delphi participants accompanied by a request for their feedback on the formulation of that question. After receiving all comments from Delphi participants in the first round, the central question was reformulated accordingly and sent back to the participants again. After a second round of incorporating comments, the second page of the survey questionnaire was finalised as displayed in Exhibit 1 (Destination X to be substituted
by a random pick of one of the sample destinations that the survey respondent had indicated on the first page not to have visited before. In other words, each respondent would provide feedback for just one destination and respondents were ‘assigned to destinations’ randomly, although Dubai was oversampled). Length as well as complexity of the wording of the central question was reduced significantly, while retaining the main elements that the probing contained, which include:
• Pre-visit perceived destination image; • Experiential in nature, shared through story telling; • Including sensory information.
Imagine that next week you will visit Destination X for the first time. Tell us your story. What do you think your experience in Destination X would be like? What images and thoughts immediately come to mind? What would you expect to see, or feel, hear, smell, taste there? Without any research or additional information, kindly be spontaneous and share with us whatever thoughts come to your mind right now, whether positive or negative. Make your response as detailed or as brief as you like, there are no limits, but try to write in story format; using complete sentences, not just loose words. If you know little about Destination X, your story will probably be short. If you already have clear ideas about Destination X, your story might be very long. But remember, there is no right, wrong or best model answer; simply express your own ideas about Destination X, and NOT what you think we want to hear. The content of your response will have NO impact whatsoever on your chance to win the grand prize. Share your ideas about Destination X with us right now, in the space below: Exhibit 1: Final wording of page two of the questionnaire resulting from Delphi-method Lastly, a third and final page was added to the questionnaire to obtain some additional details about respondents, such as:
• Information sources on which their perception was based (also through an open ended question);
• Attitude towards the one selected sample destination (same as on page 2) on a ten-point scale ranging from: 10 - Extremely positive, would definitely want to go there; to 1 – Extremely negative, will definitely never want to go there.
• Intention to visit any of the seven sample destinations within two years, as an indication of choice-set membership and prior information search;
• Socio-demographic variables, including: country of residence; homeland (if different from country of residence), number of countries ever visited; age, family life cycle situation; income, education, occupation, gender.
Comparative Destinations in Literature The selection of case-study destinations was the result of a combination of considerations. First of all, the study reported in this paper was part of a larger PhD-research project in which Dubai is the central case-study. Secondly, Flanders (Belgium) was included for obvious reasons as the current location of employment of the author.
Third, some case studies were selected because of their striking resemblance to Dubai on one or more attributes:
• The Canary Islands compares to Dubai as an exotic see, sun, sand destination; • Flanders could be positioned as a complete opposite to Dubai, in terms of its
characteristics as a tourism destination; • Florida compares to Dubai in terms of being the entertainment capital in the region; • Singapore compares to Dubai as a rapidly developed city state and financial and trade
centre in the Orient, contrasting modernity and tradition; • Morocco compares to Dubai as a new exotic destination with Arabian heritage and
expansive desert ecology; • Wales is again a complete opposite of Dubai.
Fourth, in March 2004, National Geographic Traveler reported on a destination scorecard study conducted by Leeds Metropolitan University (Tourtellot 2004). The survey convened a global panel of 200 experts in a variety of fields: ecology, sustainable tourism, geography, urban and regional planning, travel writing and photography, historic preservation, cultural anthropology and archaeology. The experts were asked to “evaluate only those places with which they were familiar, using six criteria weighed as appropriate to each destination: environmental and ecological quality; social and cultural integrity; condition of historic buildings and archaeological sites; aesthetic appeal; quality of tourism management; and the outlook for the future” (Tourtellot 2004: p. 67). Judgements were then indexed on a 1-100 scale indicating the overall level of stewardship at each of the 115 destinations included by National Geographic Traveler. Some of the case studies studied in this paper were among the destinations reported on by Tourtellot (2004), such as:
• The Canary Islands which received a low ranking with 52 points (the lowest score being 41);
• Florida, more specifically, Key West which ended up somewhere at the bottom with 42 points;
• Morocco, more specifically, Fez historic centre, which received a high score of 71 (the highest score being 82).
This must illustrate that it was attempted to incorporate a sample destination from every category of top, middle and low scores. Fifth, several of the selected destinations have been described as case studies in the literature on destination branding:
• Florida, best practice (Ritchie & Ritchie 1998) • Morocco, bad practice (Polunin 2002) • Singapore, best practice (Ooi 2004) • Spain (Canary Islands), best practice (Morgan & Pritchard 2004) • Wales, best practice (Pride 2004; Pritchard & Morgan 1998; Pritchard & Morgan
2001). The referenced literature provides us with additional information regarding the brand identity of some of the sample destinations. Pritchard and Morgan (2001) identified those aspects that define Welsh identity, through the analysis of the existing branding campaigns, marketing efforts and consumer research. They include for the overseas market:
• Language (Cymraeg) • Celtic heritage and fascinating history • Myths and legends
• Welsh emblems: such as the daffodil, the leek, the Welsh dragon and national flag • Musical tradition • Arts, crafts and entertainment • Castles • Friendly people.
For the UK market: • Conflict, foreignness and otherness • Second class citizens • Inferiority: dingy, untalented and sly • Remote • Scenic • Unspoilt • Traditional • Safe • Down-to-earth people • Natural • Activities.
Morocco was discussed by Polunin (2002: p. 4):
Sometimes outsiders are the saboteurs. Morocco thought it had come up with a winning strapline. ‘A Feast for the Senses’, supported by stunning visuals of the Moroccan countryside and culture. Initially it was widely accepted. However, it had to be dropped when German tour operators told the tourist board that they wanted a sun and sea product for their clients.
The identity of Singapore is summarised by Ooi (2004: p. 247) through the Singapore Tourism Promotion Board’s Destination Marketing brief:
‘New Asia – Singapore’ expresses the essence of today’s Singapore: a vibrant, multicultural, sophisticated city-state where tradition and modernity, East and West meet in harmony; a place where one can see and feel the energy that makes New Asia – Singapore the exemplar of the dynamism of the South-East Asia region.
Additional considerations for destination selection included the wish to obtain a global spread with destinations from all continents, considering that the survey itself was to be conducted on a global scale. Also, the relative global awareness of the destination and its basic perimeters and characteristics should be relatively easy to assess by a global audience. For instance, popular destination branding case studies such as Australia, Western Australia & New Zealand were considered, for a general global audience, to be either too ‘big’ and heterogeneous within, or too difficult to delineate. Half way the data-collection stage, when four hundred responses were collected, it was decided to exclude three destinations, Canary Islands, Morocco, and Wales from the survey so as to increase response on the remaining four case studies. This lead to the following sample population. Sample In total 1,198 responses were collected. Most respondents reacted to e-mail newsletters sent out via Travellerspoint.com at first and later joined by MeetURplanet.com, and TrekShare.com, advertising the survey to the roughly 33,000 members of these three websites. This would indicate a response rate of 3.6%, although it is very difficult to be
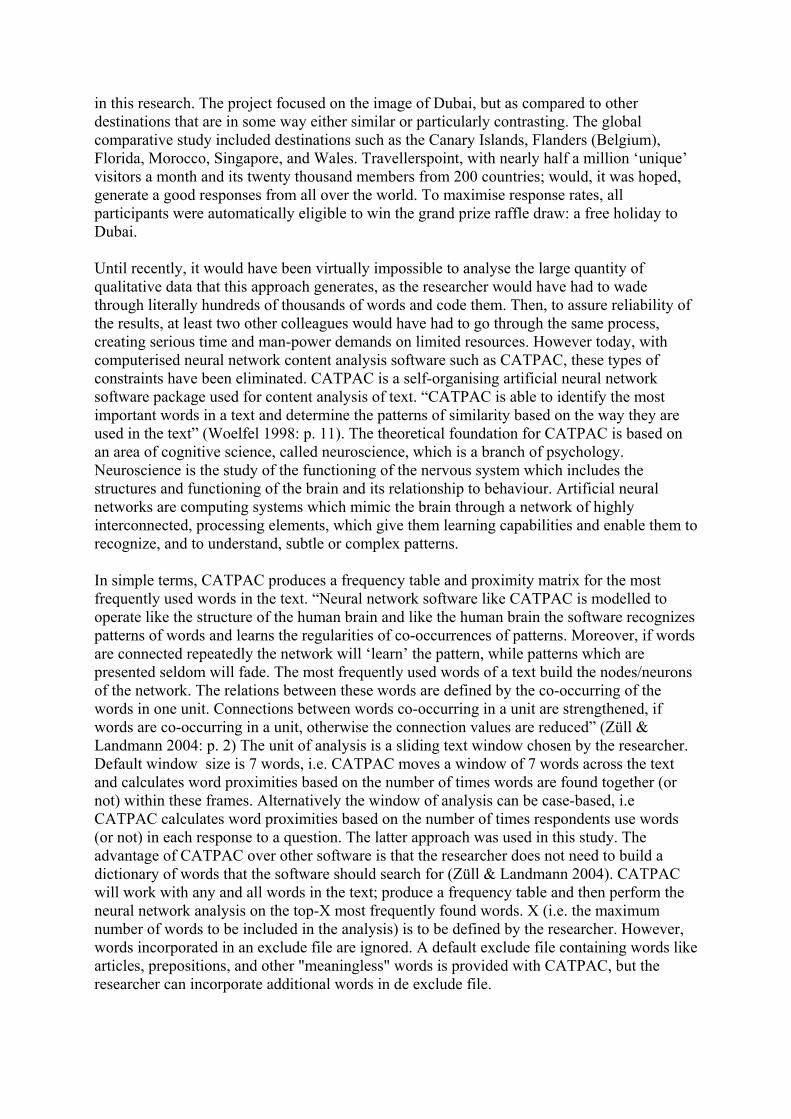
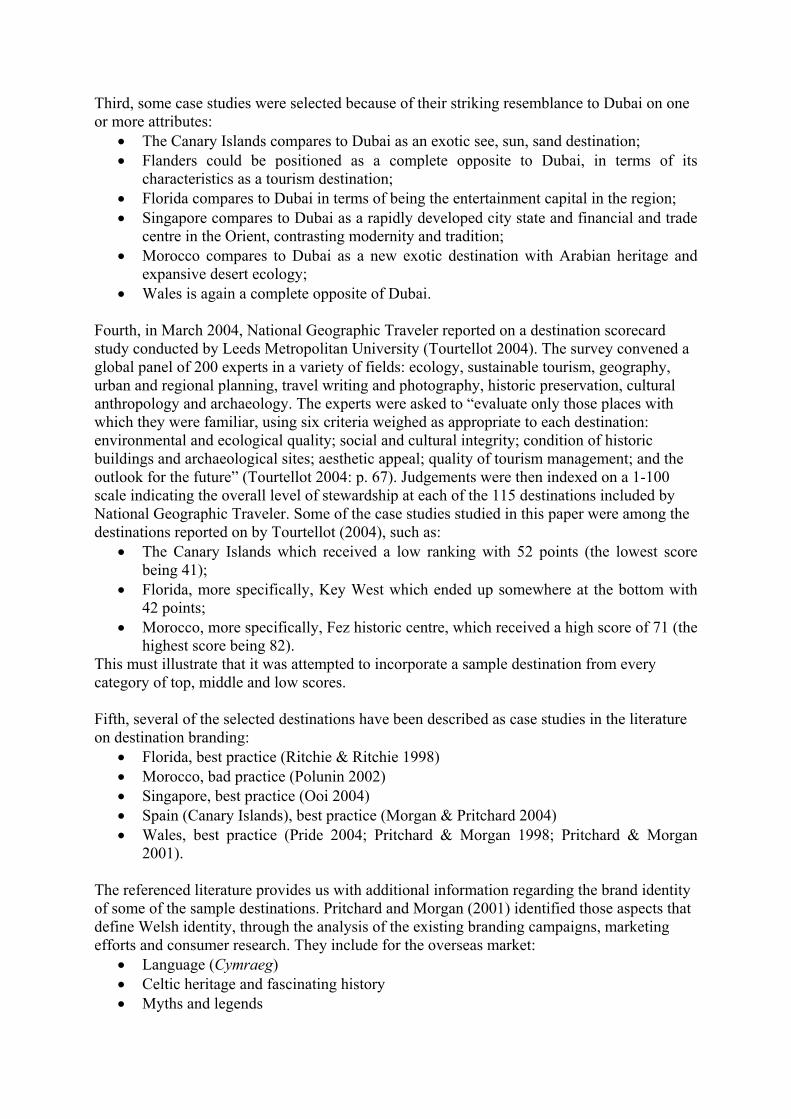
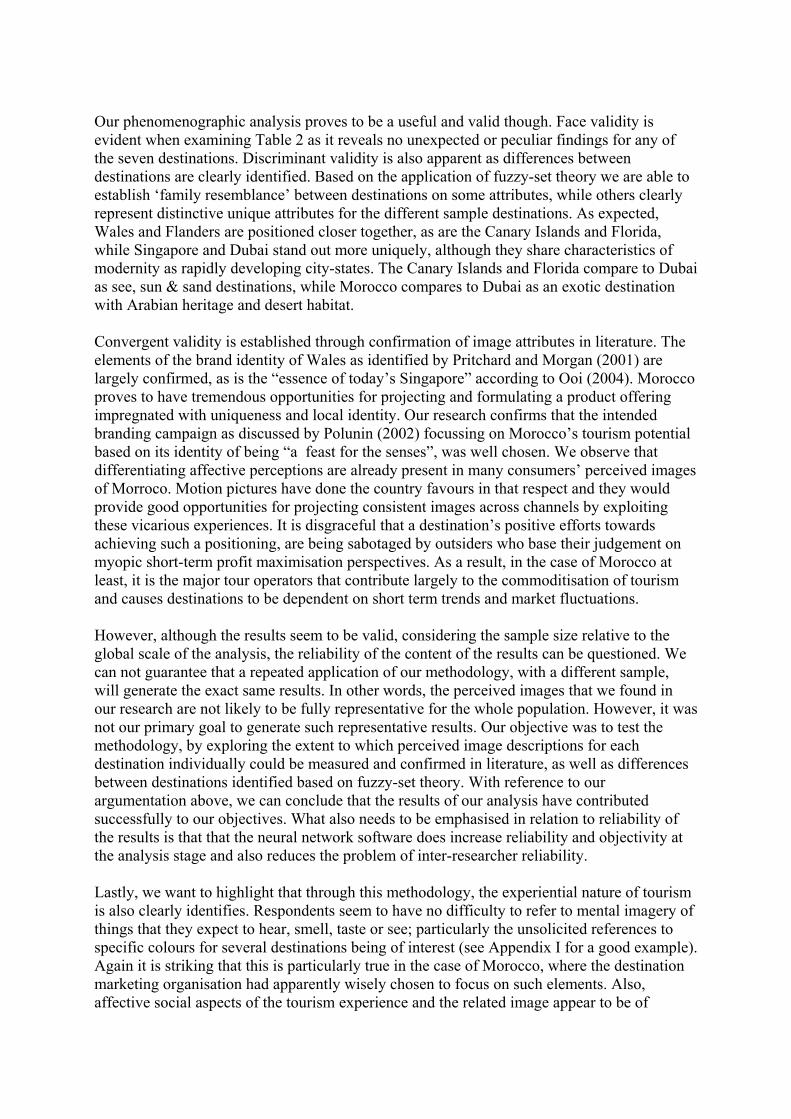
conclusive on that, as it is impossible to know exactly how many people read the newsletters and/or saw the additional banner-ads on the above websites as well as Mytripjournal.com and iTravelnet.com. After data quality evaluation and cross-checking of completeness of answers, 1,102 useable questionnaires were retained in the analysis. These provided a total of 111,000 words of destination image descriptions (For an average description of roughly 100 words per respondent, without any significant differences between destinations). Figure 1 shows the split of the sample according to the destinations on which respondents provided feedback. Obviously Dubai was over-sampled, being the central destination of reference in this research.
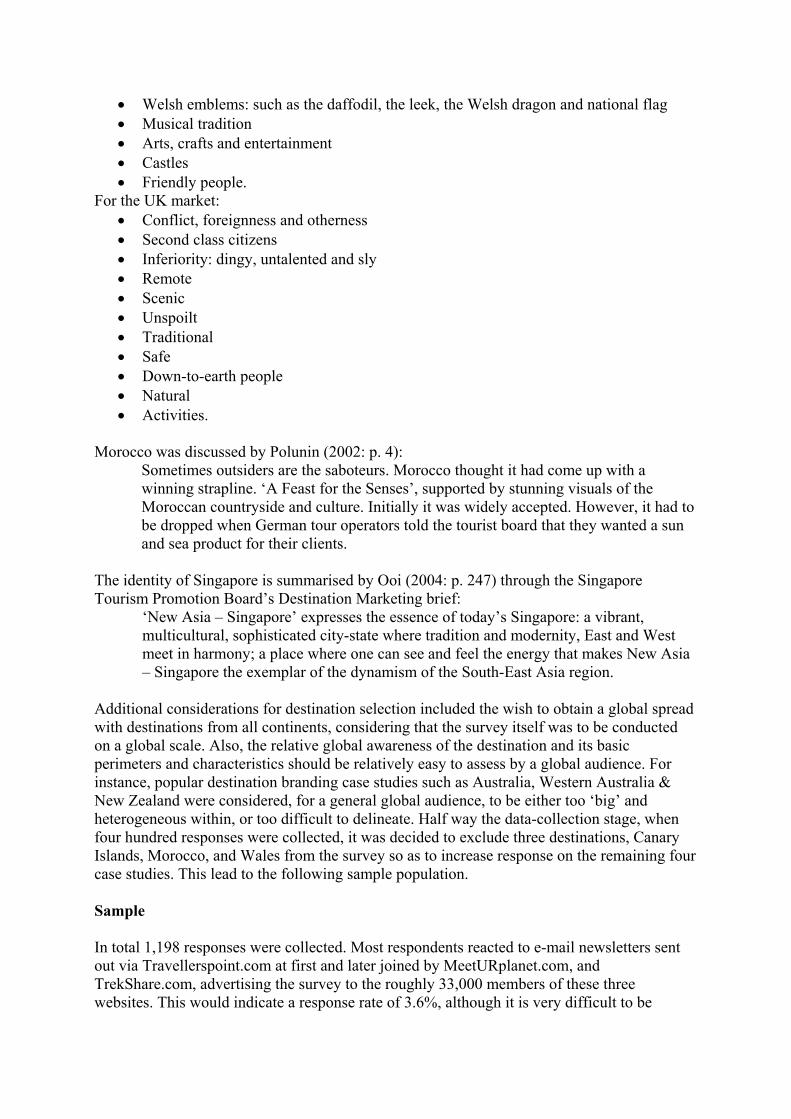
0.0%
1.0%
2.0%
3.0%
4.0%
5.0%
6.0%
7.0%
15 20 25 30 35 40 45 50 55 60 65 70
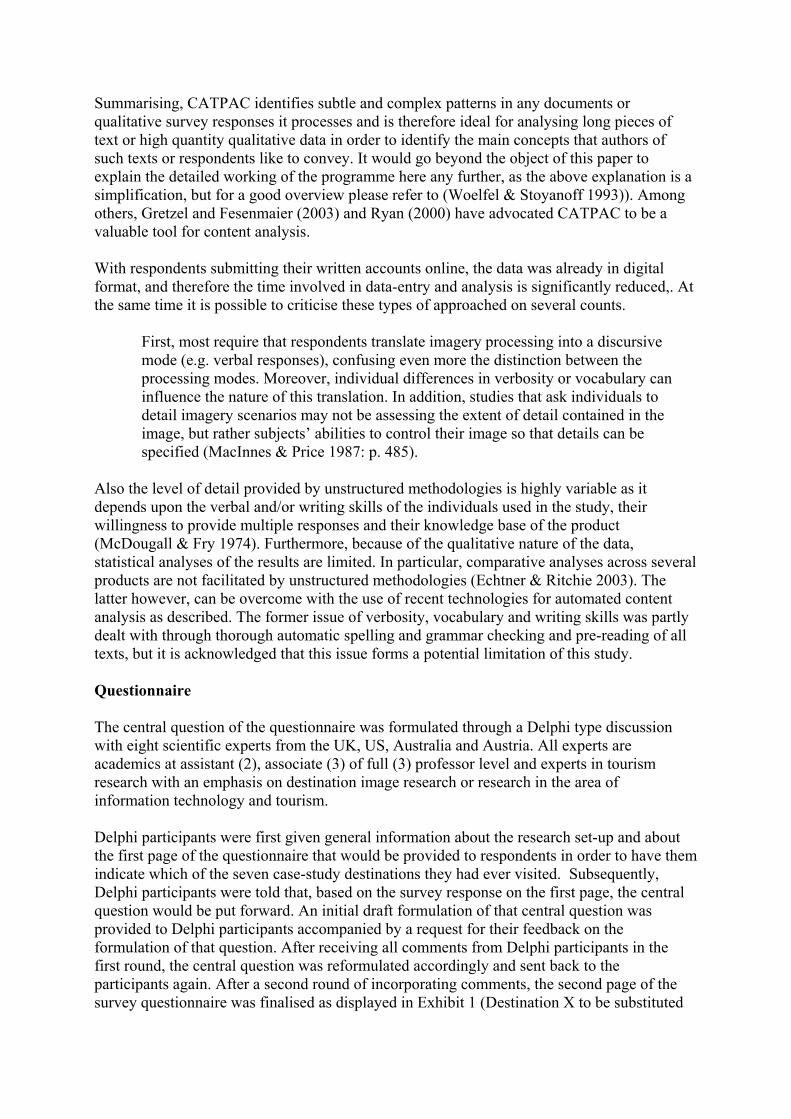
Figure 3: Sample according to age of respondent Figure 2 shows the distribution of the sample according to age. Not surprising, this being an online study, the younger age group up to 30 years of age is relatively overrepresented. 54.7% of respondents is female. Based on country of residence the sample was subdivided according to world continent. This is depicted in the left hand column of Table 1.
Table 1: Sample across continents Residency Cultural background
Europe 39.5% 37.9% North America 26.5% 26.0% Asia 13.9% 14.1% Australasia 11.2% 12.6% Africa 6.3% 6.6% Middle- and South America 2.6% 2.7%
Respondents were also asked to indicate their country of origin or ‘homeland’ if different from the country of residence. 18% of respondents indicated a different country than their country of residence to consider their homeland. However, the migration between continents
Dubai; 598
Flanders; 142
Florida; 94
Canary Isl; 62
Morocco; 68
Singapore; 82Wales; 55
Figure 2: Sample across destinations
in the sample is limited to 12.8%. Major continental migration representing more than 1% of the sample involves Europeans and Asians that moved to North America; Asians and Australasians that moved to Europe; and North Americans and Europeans that moved to Asia. This is represented in the right hand column of Table 1. Of course if a respondent did not indicate a different ‘homeland’, the country of origin is equal to the country of residence.
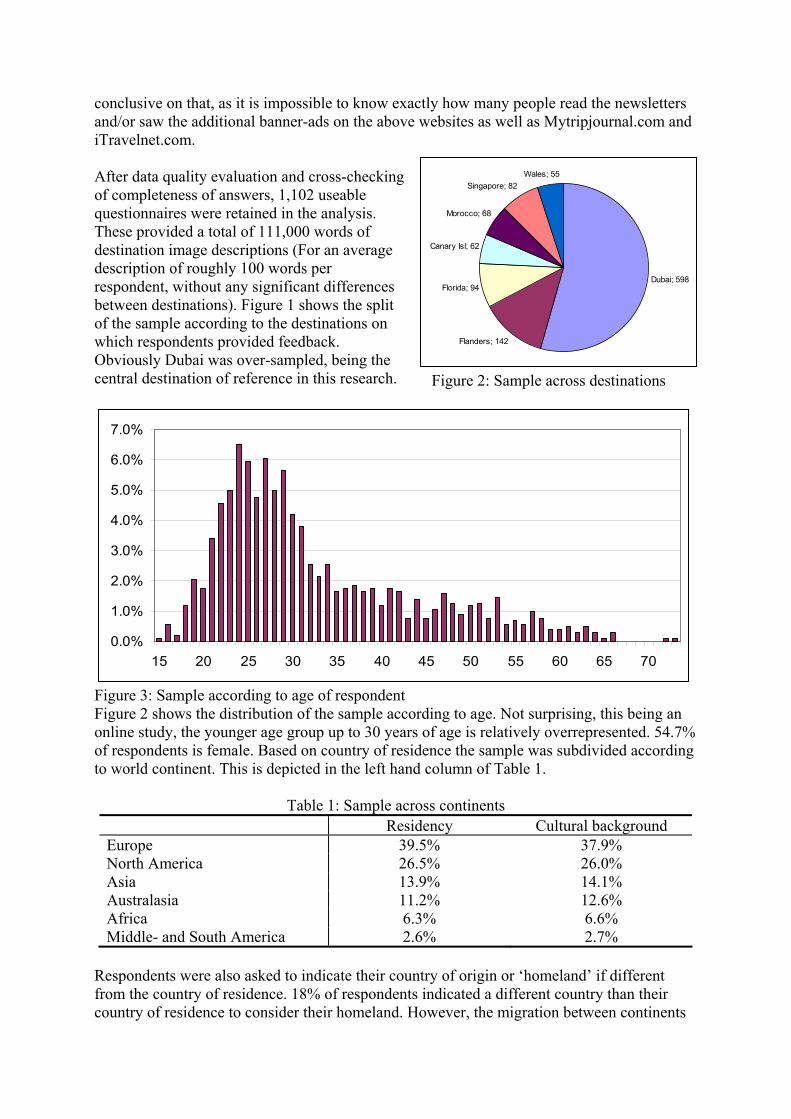
0.0%1.0%2.0%3.0%4.0%5.0%6.0%7.0%8.0%9.0%
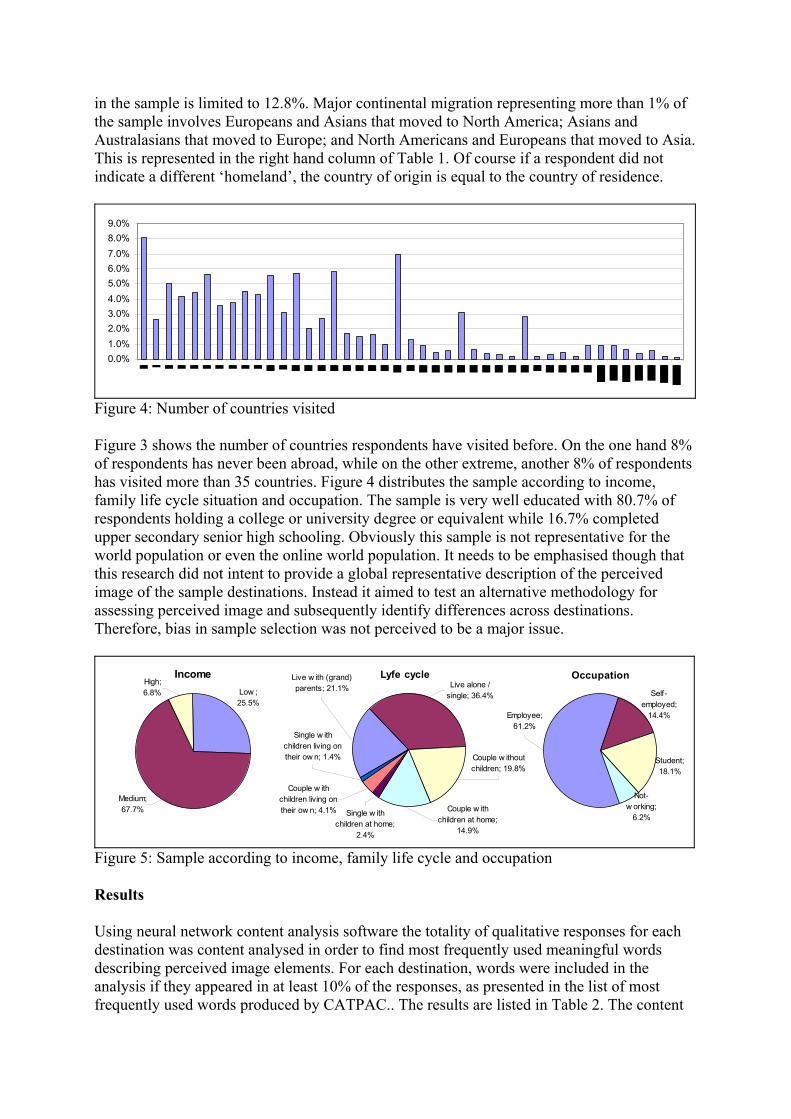
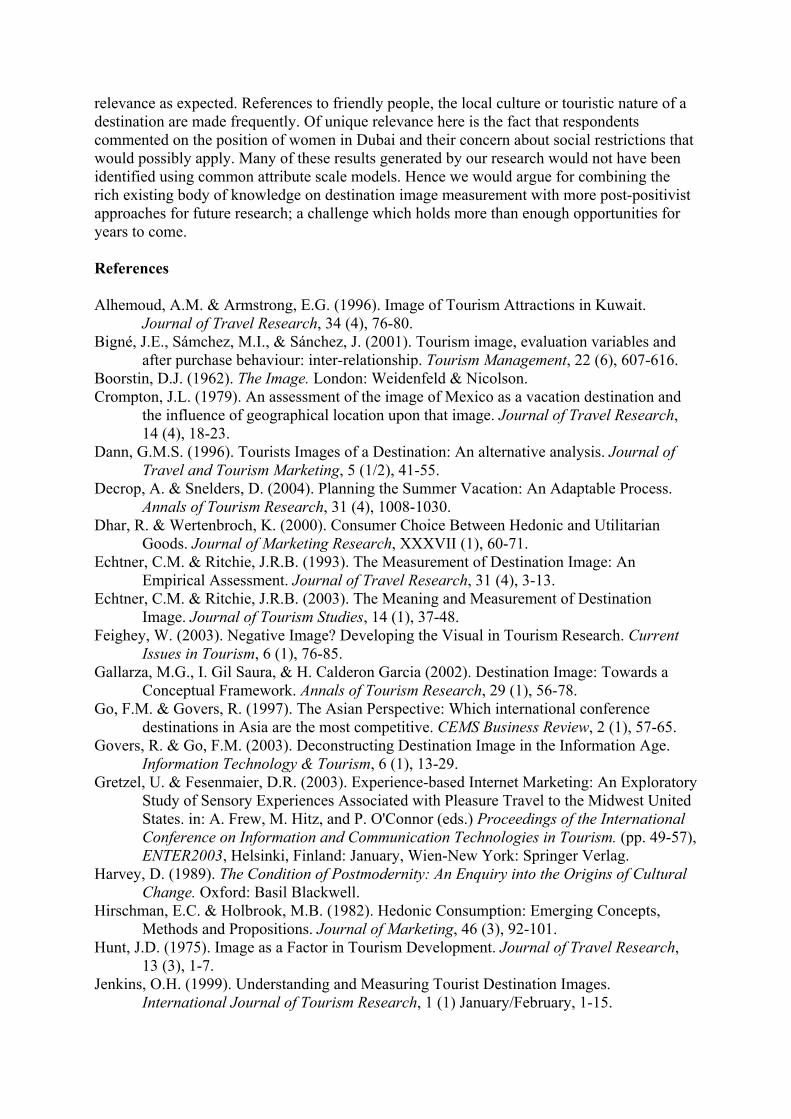
Figure 4: Number of countries visited Figure 3 shows the number of countries respondents have visited before. On the one hand 8% of respondents has never been abroad, while on the other extreme, another 8% of respondents has visited more than 35 countries. Figure 4 distributes the sample according to income, family life cycle situation and occupation. The sample is very well educated with 80.7% of respondents holding a college or university degree or equivalent while 16.7% completed upper secondary senior high schooling. Obviously this sample is not representative for the world population or even the online world population. It needs to be emphasised though that this research did not intent to provide a global representative description of the perceived image of the sample destinations. Instead it aimed to test an alternative methodology for assessing perceived image and subsequently identify differences across destinations. Therefore, bias in sample selection was not perceived to be a major issue.
IncomeLow ; 25.5%
Medium; 67.7%
High; 6.8%
Lyfe cycleLive w ith (grand) parents; 21.1%
Single w ith children at home;
2.4%
Couple w ith children living on their ow n; 4.1% Couple w ith
children at home; 14.9%
Single w ith children living on their ow n; 1.4%
Live alone / single; 36.4%
Couple w ithout children; 19.8%
Occupation
Employee; 61.2%
Not-w orking;
6.2%
Self-employed;
14.4%
Student; 18.1%
Figure 5: Sample according to income, family life cycle and occupation Results Using neural network content analysis software the totality of qualitative responses for each destination was content analysed in order to find most frequently used meaningful words describing perceived image elements. For each destination, words were included in the analysis if they appeared in at least 10% of the responses, as presented in the list of most frequently used words produced by CATPAC.. The results are listed in Table 2. The content
of Table 2 speaks for itself, but interestingly, the destination specific literature, on which the selection of the sample case-study destinations was based, is confirmed. In the National Geographic Traveler study on destination stewardship (Tourtellot 2004), the Canary Islands and Florida received low scores. In our study, these are the only two destinations which respondents perceive to be particularly touristy. As far as reported image attributes is concerned, our findings also match the branding literature. The identity of Wales summarised in aspects such as historic, castles, scenic, natural beauty and friendly people, are characteristics confirmed in our research. References to the Welsh language (7 times), musical tradition (2 times) and even the leek as the Welsh emblem (once) were also found, but not frequently enough to appear in the dominating image. Myths and legends and arts and crafts were not mentioned as image attributes, but we need to emphasise that only 55 responses were collected for Wales. The sabotaged slogan for Morocco – ‘A Feast for the Senses’ – does not appear to be all that misplaced. At least, according to our findings, the second most important image attribute for Morocco relates to smell. People indeed seem to relate Morocco to strong sensual images of the smell of spices, aromatic Arabic food and fragrances, heat and colourful surroundings. These are very unique aspects that specifically apply to Morocco, even when compared to Dubai, where these images are far less dominant. It seems that the Moroccan tourist board was on the right track until German tour operators misused their market power. As far as Singapore is concerned, the essence of today’s Singapore being a vibrant, multicultural, sophisticated city state where tradition and modernity, East and West meet in harmony, also seems to be well reflected in the perceived image as identified in our study. Referring back to the destination image components as identified by Echtner & Ritchie (1993; 2003), several common attributes that appear repeatedly across destinations, can also be identified. These include image components such as for instance: the physical and natural surroundings (buildings / architecture and nature / sea); cultural distance; weather / climate conditions; activities on offer (i.e. shopping or water sports); and tourist facilitation (i.e. hotels). However, for each destination very specific unique image components can also be identified, such as in the case of Dubai: the desert; wealth; luxury; life in the streets; the smell of various fragrances; sand; oil; and camels. Some components are holistic (i.e. Arab and Muslim culture) while others are attribute based (availability and quality of beaches). Some are functional (i.e. shopping) others more psychological (i.e. friendliness of the people). This seems to confirm the theory as developed by Echtner and Ritchie (1993; 2003). Nevertheless, the results also show that the importance of unique image components should not be underestimated. More explicitly: for most of the sample destinations included in this study, one or two unique negative image components were identified. For instance in the case of Dubai, over 14% of respondents made reference to the position of women in Muslim / Arab societies. Several misperceptions seem to exist, such as: the need for women tourists to cover their hair in Dubai; or women not being allowed to drive cars; or the idea that one will not see many women in the streets and public places in Dubai. Also in the case of Dubai, 21% of respondents made comments along the lines of “I have never been there or to that region / never visited / never heard of”. The same was found for the destinations of Flanders and Wales. This seems to indicate a general lack of knowledge about the destinations, the comments made being an excuse for not being able to provide much detail about the places in question. Additional analysis of the data, by searching for the phrase “do not know” confirmed this. Indexing this phrase by the number of times it was used by the equivalent of a hundred respondents showed an index of 11.2 for Dubai, 12 for Flanders, and 16.4 for Wales, whiles the index for the Canary Islands and Florida was 3 and Singapore scored 6. This indicates that it was harder for respondents to control their perceived image for the first three
destinations. In other cases particular destinations were found to be specifically touristy or suffering from distinctive bad weather conditions. Such misperceptions and negative image components would obviously demand active involvement from destination marketing organisations in order to try and change such public perceptions. Unfortunately, when utilising the generally applied traditional attribute based destination image research methodologies, such unique negative components would never be identified. It emphasises the utility of the methodology presented in this paper. The same applies to the ephemeral character of image, as illustrated by the case of Florida. Taking into consideration that the fieldwork for this survey was conducted during fall 2004, many references were made to hurricanes, obviously because of the intensive media reporting of the effects of hurricane Frances. It is doubtful that such perceptions would still dominate if this survey was conducted half a year earlier or later. This illustrates the effects of temporal environmental and situational influences. The subjectivity and individual private nature of image is also illustrated. For Dubai, the most frequently mentioned image component, ‘hot weather’, was still only mentioned by less than 30% of respondents. This seems to indicate that although stereotypical mental images exist, the act of perceiving is a purely individual affair. Many differences among consumers exist. Hence it is not surprising that only measuring common attribute scales does not explain destination choice behaviour, as was concluded by Govers and Go (2003). Also, the experiential nature of tourism was clearly identified. It seemed to be natural for respondents to make comments along the following lines: “hear the waves of the sea”, “feel the heat”, “experience the busy streets”, “smell the spices in the street markets and souks”. For many of the cases a reference to colour was made. Hence, multi-sensory experiential elements seem to be at least as important as gazing (for instance upon buildings / architecture or people). Again, this seems to be difficult to capture in attribute based scales as experiential remarks often refer to very specific unique and characteristic expectations related to a particular destination.
Table 2: Image descriptions for seven sample destinations
Dubai (n=598, words = 63,918)
% of 3,706 meaningful
words
% of respondents
HOT (warm weather / heat / warm climate) 5.8% 28.6% CULTURE (as in different, local culture) 5.4% 27.1% HOTEL (famous / 7,6,5-star / luxury / expensive hotel) 6.0% 26.9% BUILDING (as in amazing / special architecture / buildings) 5.6% 25.9% DESERT 6.0% 25.4% SHOP (shops / shopping) 5.5% 24.9% ARAB (Arabic / Arabian) 5.4% 24.6% MODERN 4.7% 23.7% RICH (wealth / wealthy / rich) 4.6% 22.6% NEVER (never been there / visited / heard of) 3.8% 21.1% LUXURY (luxurious) 2.9% 15.9% WOMAN (as in the position of women in Muslim / Arab countries) 3.5% 14.2% SMELL (smell of spices / food / fragrances / heat) 2.8% 13.2% WATER (water / sea) 2.5% 13.0% MARKET(S) 2.3% 12.7% BEACH(ES) 2.3% 11.5% STREET (busy /lively / people in the street) 2.3% 11.0% MUSLIM 2.5% 10.9% SAND 2.2% 10.6% OIL 1.8% 9.7% CAMEL(S) 1.6% 9.2%
Canary Islands (n=62, words = 6,419)
% of 314 meaningful
words
% of respondents
BEACH(ES) 12.1% 48.4% ISLAND(S) 14.3% 38.7% WATER (water / sea) 9.6% 32.3% HOT (warm weather / heat / warm climate) 5.4% 25.8% SUN (sunny / sunshine) 6.1% 24.2% SPAIN (Spanish) 6.7% 22.6% TOURIST (as in touristy) 4.8% 21.0% HOTEL (comfortable / nice / good / luxurious / fancy hotel) 3.8% 17.7% SAND 3.8% 16.1% CULTURE (as in different, local culture) 3.2% 12.9% BLUE (blue water/ skies) 2.9% 11.3% NATURE (natural) 2.9% 9.7%
Flanders (n=142, words = 13,260)
% of 661 meaningful
words % of
respondents BELGIUM (Belgian) 20.1% 53.5% BUILDING (old / historic buildings / architecture) 5.9% 22.5% CHOCOLATE(S) 6.7% 21.8% EUROPE (European) 3.9% 16.2% CULTURE (as in different, local culture) 4.2% 15.5% HISTORY (historic) 4.1% 15.5% OLD (as in old town / buildings / castles) 4.4% 14.8% STREET (cobbled / narrow / winding streets) 4.2% 14.8% FRENCH 4.5% 14.1% NEVER (never been there / visited / heard of) 3.5% 14.1% SHOP (shops / shopping) 4.1% 14.1% BEER 3.5% 12.0% CAFÉ(S) 2.6% 12.0% FRIENDLY (as in friendly people) 2.7% 11.3%
Florida (n=94, words = 7,964)
% of 454 meaningful
words
% of respondents
BEACH(ES) 16.7% 53.2% HOT (warm weather / heat / warm climate) 9.7% 35.1% SUN (sunny / sunshine) 8.6% 30.9% DISNEY (Disneyland / Disneyworld) 6.6% 29.8% MIAMI 7.7% 26.6% AMERICA (American / Americans) 6.6% 25.5% EVERGLADES 4.6% 21.3% WATER (water / sea) 5.5% 21.3% HURRICANE(S) 3.1% 14.9% TOURIST (as in touristy) 3.3% 13.8% NATURE (Natural) 2.4% 11.7% PALM (Palm tree(s)) 2.4% 11.7% WHITE (white beach / houses / paving) 2.6% 11.7%
Wales (n=55, words = 4,811)
% of 236 meaningful
words
% of respondents
GREEN 8.5% 32.7% RAIN (rains / rainy) 7.6% 27.3% HILLS 5.9% 25.5% NATURE (natural) 7.2% 25.5% PUB 6.4% 25.5% CASTLE(S) 5.5% 21.8% COUNTRYSIDE 5.5% 21.8% NEVER (never been there / visited / heard of) 5.5% 21.8% BUILDING (old / historic buildings / architecture) 5.5% 20.0% FRIENDLY (friendly people) 4.7% 18.2% VILLAGE(S) 4.7% 18.2% OLD (as in old buildings / castles) 4.2% 16.4% COLD (as in cold weather) 3.8% 14.5% WALK (walking / longs walks) 4.2% 14.5% SHEEP 3.8% 12.7%
Morocco (n=68, words = 7,763)
% of 374 meaningful
words
% of respondents
HOT (warm weather / heat / warm climate) 8.0% 32.4% SMELL (smell of spices / food / fragrances / heat) 7.0% 32.4% CULTURE (as in different, local culture) 6.7% 26.5% SPICE (spices / spicy) 5.6% 26.5% DESERT 5.6% 25.0% COLOUR (colours / colourful) 4.8% 23.5% BUILDING (old / beautiful buildings / architecture) 3.5% 17.6% ARAB (Arabic / Arabian) 3.7% 16.2% MARKET(S) 3.2% 16.2% STREET (busy / lively / people in the street) 4.5% 16.2% CASABLANCA 4.0% 14.7% MUSLIM 3.5% 14.7% AFRICA(N) 3.2% 13.2% SUN (sunny / sunshine) 2.7% 13.2% CAMEL(S) 2.9% 11.8% TEA 3.2% 10.3%
Singapore (n=82, words = 8,298)
% of 401 meaningful
words
% of respondents
MODERN 9.0% 31.7% CULTURE (as in variety of local culture) 8.2% 30.5% CLEAN 6.7% 29.3% STREET (busy /lively / people in the street) 7.7% 26.8% ASIA(N) 6.7% 25.6% BUILDING (as in high-rise buildings / special architecture) 5.7% 24.4% HOT (warm weather / heat / warm climate) 5.0% 18.3% FRIENDLY (friendly people) 3.5% 17.1% SMELL (smell of spices / food / fragrances / heat) 3.2% 15.9% BUSY 3.0% 14.6% DIFFERENT (as in different culturally) 4.0% 14.6% SHOP (shops / shopping) 4.2% 14.6% HOTEL (nice / luxurious hotels) 3.0% 13.4% MIX (cultural mix) 4.2% 13.4% AIRPORT (busy / clean / modern airport) 3.0% 12.2% CHINESE 3.5% 12.2% COLOUR (colours / colourful) 2.7% 12.2% EAST (as in Orient) 2.7% 11.0% EXOTIC 2.7% 11.0%
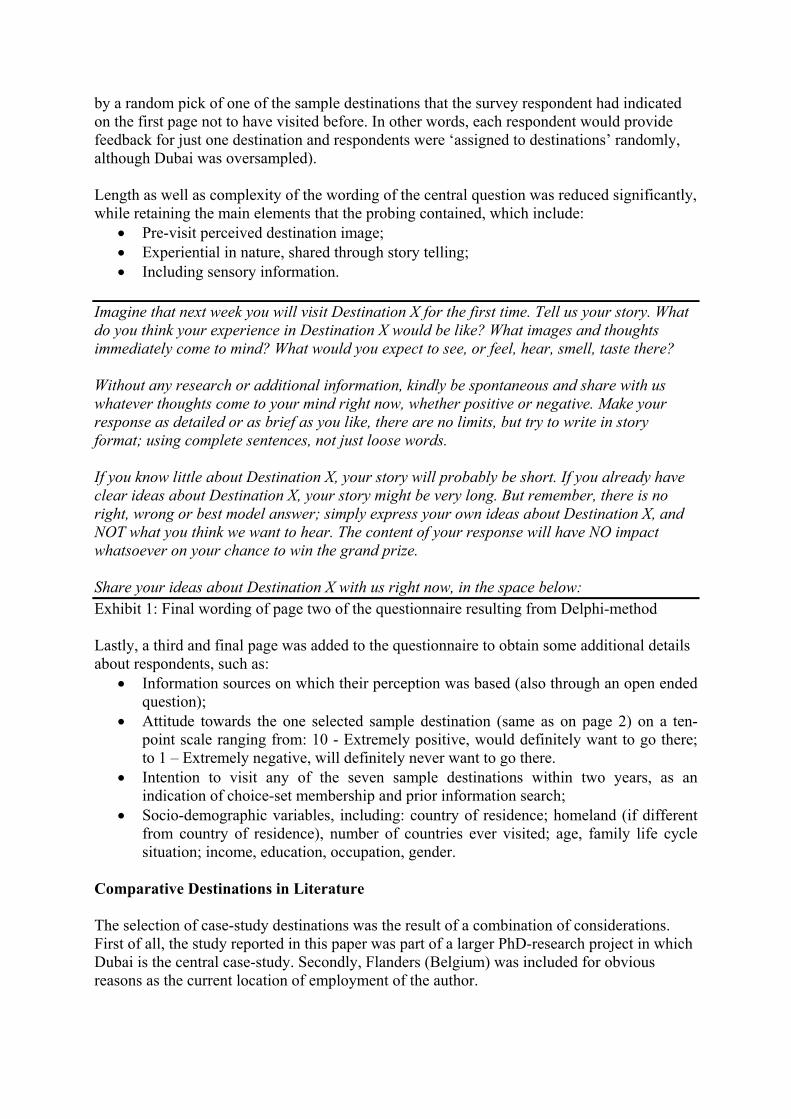
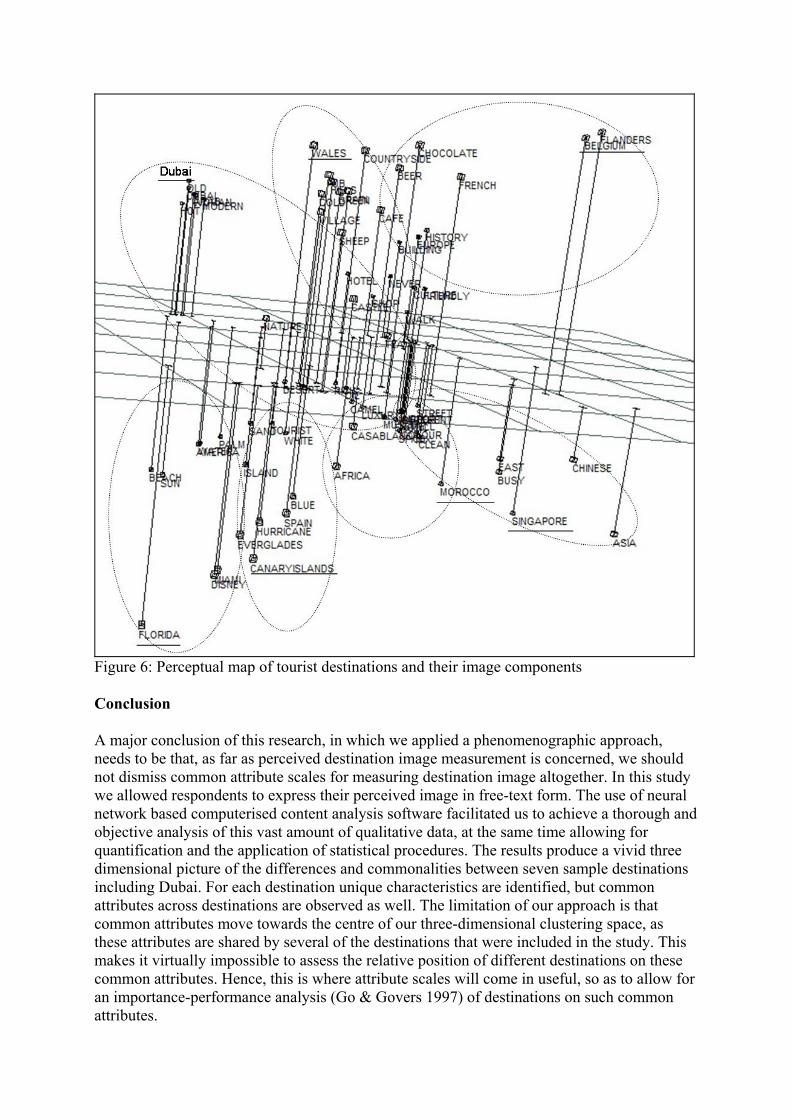
Clustering of Destinations Differences between common and unique characteristics are illustrated in Figure 5. After identifying the list of meaningful words (or image components) as identified in Table 2, the total text of all 1,102 responses was fed back into CATPAC. The programme was instructed to analyse the text only searching for the keywords from Table 2, plus the reference names of the destinations involved. This way CATPAC would identify which words are often used together and in reference to what destinations. The complete paired comparison similarities matrix for the 67 image components plus 7 destination reference names was fed into the perceptual mapping tool ThoughtView, provided as a CATPAC extension. The result is a three-dimensional model of which a snapshot from one angle is depicted in Figure 5. Obviously it is suboptimal to interpret a three-dimensional model on paper, but nevertheless Figure 5 should provide a good insight into the usefulness of this methodology. Sample destinations have been underlined and their corresponding image attributes clustered through the use of circles. Circles are dashed as the boundaries are porous, i.e. not definite on the inclusion or exclusion of components, particularly as dimensions are difficult to interpret in this two-dimensional snapshot. What seems to happen is that image components that are very destination specific or unique characteristics, move towards the boundaries, while common characteristics move towards the centre as they are shared by multiple destinations. Consequently, the most specific image components for destination Dubai are clustered closely together in the top-left corner of the diagram. As there are more responses in the sample for Dubai (600 compared to 500 for the other six destinations) the unique characteristics for Dubai cluster closely together as their concordance is much stronger than for the other destinations as they appear more often together. These unique characteristics include: hot weather, modern versus old, Arabian culture, and the position of women. Fuzzy-set theory (Viswanathan & Childers 1999; Wedel & Steenkamp 1991) seems to be a useful frame of reference here as it contents that products (i.e. tourist destinations) can be relatively similar on some characteristics, while they are different on others. For instance: Dubai shares many of its characteristics with Morocco (e.g. climate, desert, camels, street markets and aromas), but is different in its modernity, wealth and luxury, characteristics which it shares with Singapore. Also, being located in the Middle East, the position of women seems to be more of an issue here as in Morocco. Based on such an approach Florida and the Canary Islands seem to cluster more closely together, as do Wales and Flanders, while Singapore and Dubai stand out more distinctively. As common attributes cluster more closely together in the centre, it might prove useful in future research to combine the methodology applied here with attribute scales for these common characteristics in order to identify the relative position of destinations on these attributes. As argued by many (Feighey 2003; Jenkins 1999; MacKay & Couldwell 2004), a combination of measurement techniques seems to be the best approach. The above approach, new in this field, has proven useful in identifying unique characteristics and as a means of mapping destinations relative to each other.
Figure 6: Perceptual map of tourist destinations and their image components Conclusion A major conclusion of this research, in which we applied a phenomenographic approach, needs to be that, as far as perceived destination image measurement is concerned, we should not dismiss common attribute scales for measuring destination image altogether. In this study we allowed respondents to express their perceived image in free-text form. The use of neural network based computerised content analysis software facilitated us to achieve a thorough and objective analysis of this vast amount of qualitative data, at the same time allowing for quantification and the application of statistical procedures. The results produce a vivid three dimensional picture of the differences and commonalities between seven sample destinations including Dubai. For each destination unique characteristics are identified, but common attributes across destinations are observed as well. The limitation of our approach is that common attributes move towards the centre of our three-dimensional clustering space, as these attributes are shared by several of the destinations that were included in the study. This makes it virtually impossible to assess the relative position of different destinations on these common attributes. Hence, this is where attribute scales will come in useful, so as to allow for an importance-performance analysis (Go & Govers 1997) of destinations on such common attributes.
Our phenomenographic analysis proves to be a useful and valid though. Face validity is evident when examining Table 2 as it reveals no unexpected or peculiar findings for any of the seven destinations. Discriminant validity is also apparent as differences between destinations are clearly identified. Based on the application of fuzzy-set theory we are able to establish ‘family resemblance’ between destinations on some attributes, while others clearly represent distinctive unique attributes for the different sample destinations. As expected, Wales and Flanders are positioned closer together, as are the Canary Islands and Florida, while Singapore and Dubai stand out more uniquely, although they share characteristics of modernity as rapidly developing city-states. The Canary Islands and Florida compare to Dubai as see, sun & sand destinations, while Morocco compares to Dubai as an exotic destination with Arabian heritage and desert habitat. Convergent validity is established through confirmation of image attributes in literature. The elements of the brand identity of Wales as identified by Pritchard and Morgan (2001) are largely confirmed, as is the “essence of today’s Singapore” according to Ooi (2004). Morocco proves to have tremendous opportunities for projecting and formulating a product offering impregnated with uniqueness and local identity. Our research confirms that the intended branding campaign as discussed by Polunin (2002) focussing on Morocco’s tourism potential based on its identity of being “a feast for the senses”, was well chosen. We observe that differentiating affective perceptions are already present in many consumers’ perceived images of Morroco. Motion pictures have done the country favours in that respect and they would provide good opportunities for projecting consistent images across channels by exploiting these vicarious experiences. It is disgraceful that a destination’s positive efforts towards achieving such a positioning, are being sabotaged by outsiders who base their judgement on myopic short-term profit maximisation perspectives. As a result, in the case of Morocco at least, it is the major tour operators that contribute largely to the commoditisation of tourism and causes destinations to be dependent on short term trends and market fluctuations. However, although the results seem to be valid, considering the sample size relative to the global scale of the analysis, the reliability of the content of the results can be questioned. We can not guarantee that a repeated application of our methodology, with a different sample, will generate the exact same results. In other words, the perceived images that we found in our research are not likely to be fully representative for the whole population. However, it was not our primary goal to generate such representative results. Our objective was to test the methodology, by exploring the extent to which perceived image descriptions for each destination individually could be measured and confirmed in literature, as well as differences between destinations identified based on fuzzy-set theory. With reference to our argumentation above, we can conclude that the results of our analysis have contributed successfully to our objectives. What also needs to be emphasised in relation to reliability of the results is that that the neural network software does increase reliability and objectivity at the analysis stage and also reduces the problem of inter-researcher reliability. Lastly, we want to highlight that through this methodology, the experiential nature of tourism is also clearly identifies. Respondents seem to have no difficulty to refer to mental imagery of things that they expect to hear, smell, taste or see; particularly the unsolicited references to specific colours for several destinations being of interest (see Appendix I for a good example). Again it is striking that this is particularly true in the case of Morocco, where the destination marketing organisation had apparently wisely chosen to focus on such elements. Also, affective social aspects of the tourism experience and the related image appear to be of
relevance as expected. References to friendly people, the local culture or touristic nature of a destination are made frequently. Of unique relevance here is the fact that respondents commented on the position of women in Dubai and their concern about social restrictions that would possibly apply. Many of these results generated by our research would not have been identified using common attribute scale models. Hence we would argue for combining the rich existing body of knowledge on destination image measurement with more post-positivist approaches for future research; a challenge which holds more than enough opportunities for years to come. References Alhemoud, A.M. & Armstrong, E.G. (1996). Image of Tourism Attractions in Kuwait.
Journal of Travel Research, 34 (4), 76-80. Bigné, J.E., Sámchez, M.I., & Sánchez, J. (2001). Tourism image, evaluation variables and
after purchase behaviour: inter-relationship. Tourism Management, 22 (6), 607-616. Boorstin, D.J. (1962). The Image. London: Weidenfeld & Nicolson. Crompton, J.L. (1979). An assessment of the image of Mexico as a vacation destination and
the influence of geographical location upon that image. Journal of Travel Research, 14 (4), 18-23.
Dann, G.M.S. (1996). Tourists Images of a Destination: An alternative analysis. Journal of Travel and Tourism Marketing, 5 (1/2), 41-55.
Decrop, A. & Snelders, D. (2004). Planning the Summer Vacation: An Adaptable Process. Annals of Tourism Research, 31 (4), 1008-1030.
Dhar, R. & Wertenbroch, K. (2000). Consumer Choice Between Hedonic and Utilitarian Goods. Journal of Marketing Research, XXXVII (1), 60-71.
Echtner, C.M. & Ritchie, J.R.B. (1993). The Measurement of Destination Image: An Empirical Assessment. Journal of Travel Research, 31 (4), 3-13.
Echtner, C.M. & Ritchie, J.R.B. (2003). The Meaning and Measurement of Destination Image. Journal of Tourism Studies, 14 (1), 37-48.
Feighey, W. (2003). Negative Image? Developing the Visual in Tourism Research. Current Issues in Tourism, 6 (1), 76-85.
Gallarza, M.G., I. Gil Saura, & H. Calderon Garcia (2002). Destination Image: Towards a Conceptual Framework. Annals of Tourism Research, 29 (1), 56-78.
Go, F.M. & Govers, R. (1997). The Asian Perspective: Which international conference destinations in Asia are the most competitive. CEMS Business Review, 2 (1), 57-65.
Govers, R. & Go, F.M. (2003). Deconstructing Destination Image in the Information Age. Information Technology & Tourism, 6 (1), 13-29.
Gretzel, U. & Fesenmaier, D.R. (2003). Experience-based Internet Marketing: An Exploratory Study of Sensory Experiences Associated with Pleasure Travel to the Midwest United States. in: A. Frew, M. Hitz, and P. O'Connor (eds.) Proceedings of the International Conference on Information and Communication Technologies in Tourism. (pp. 49-57), ENTER2003, Helsinki, Finland: January, Wien-New York: Springer Verlag.
Harvey, D. (1989). The Condition of Postmodernity: An Enquiry into the Origins of Cultural Change. Oxford: Basil Blackwell.
Hirschman, E.C. & Holbrook, M.B. (1982). Hedonic Consumption: Emerging Concepts, Methods and Propositions. Journal of Marketing, 46 (3), 92-101.
Hunt, J.D. (1975). Image as a Factor in Tourism Development. Journal of Travel Research, 13 (3), 1-7.
Jenkins, O.H. (1999). Understanding and Measuring Tourist Destination Images. International Journal of Tourism Research, 1 (1) January/February, 1-15.
Kotler, P., Haider, D.H., & Rein, I. (1993). Marketing Places: Attracting Investment, Industry, and Tourism to Cities, States, and Nations. New York: The Free Press.
Kunkel, J.H. & Berry, L.L. (1968). A Behavioral Concept of Retail Image. Journal of Marketing, 32 (4), 21-27.
MacInnes, D.J. & Price, L.L. (1987). The Role of Imagery in Information Processing: Review and Extensions. Journal of Consumer Research, 13 (4) March, 473-491.
MacKay, K.J. & Couldwell, C.M. (2004). Using Visitor-Employed Photography to Investigate Destination Image. Journal of Travel Research, 42 (4) May, 390-396.
MacKay, K.J. & Fesenmaier, D. (2000). An Exploration of Cross-Cultural Destination Image Assessment. Journal of Travel Research, 38 (4) May, 417-423.
MacKay, K.J. & Fesenmaier, D.R. (1997). Pictorial Element of Destination in Image Formation. Annals of Tourism Research, 24 (3), 537-565.
Markwell, K.W. (1997). Dimensions of Photography in a Nature-Based Tour. Annals of Tourism Research, 24 (1), 131-155.
Marton, F. (1994). Phenomenography. in: T. Husén and T.N. Postlethwaite (eds.) The International Encyclopedia of Education. (Second ed.) (pp. 4424) Vol. 8 Pergamon.
McDougall, G.H.G. & Fry, J.N. (1974). Combining two methods of image measurement: Semantic Differential and Open-End Technique. Journal of Retailing, 50 (4), 53-61.
Morgan, N. & Pritchard, A. (2004). Meeting the destination branding challenge. in: N. Morgan, A. Pritchard, and R. Pride (eds.) Destination Branding: Creating the unique destination proposition. (Second ed.) (pp. 59-78) Oxford: Elsevier Butterworth-Heinemann.
Ooi, C.S. (2004). Brand Singapore: the hub of 'New Asia'. in: N. Morgan, A. Pritchard, and R. Pride (eds.) Destination Branding: Creating the unique destination proposition. (Second ed.) (pp. 242-260) Oxford: Elsevier Butterworth-Heinemann.
Padgett, D. & Allen, D. (1997). Communicating Experiences: A Narrative Approach to Creating Service Brand Image. Journal of Advertising, XXVI (4) Winter, 49-62.
Pike, S. (2002). Destination image analysis—a review of 142 papers from 1973 to 2000. Tourism Management, 23 (5), 541-549.
Polunin, I. (2002). Book Review: Destination Branding: Creating the unique destination proposition (Morgan, Pritchard & Pride (Eds.), Oxford: Butterworth-Heinemann). Eclipse 7, Moonshine Travel Marketing (online) www.moonshinetravel.com/eclips/, 1-5.
Pride, R. (2004). A challenger brand: Wales, golf as it should be. in: N. Morgan, A. Pritchard, and R. Pride (eds.) Destination Branding: Creating the unique destination proposition. (Second ed.) (pp. 159-168) Oxford: Elsevier Butterworth-Heinemann.
Pritchard, A. & Morgan, N. (1998). "Mood Marketing". The New Destination Branding Strategy: A case study of "Wales" The Brand. Journal of Vacation Marketing, 4 (3), 215-229.
Pritchard, A. & Morgan, N.J. (2001). Culture, identity and tourism representation: marketing Cymru or Wales? Tourism Management, 22 (2), 167-179.
Ritchie, J.R.B. & Ritchie, R.J.B. (1998). The Branding of Tourism Destinations: Past Achievements and Future Challenges. in: P. Keller (ed.) Proceedings of the international AIEST conference. (pp. 89-116), Destination Marketing - Scopes and limitations, Marrakech (Morocco): September, St-Gall (Switzerland): International Association of Scientific Experts in Tourism.
Ryan, C. (2000). Tourist Experiences: Phenomenographic analysis, post-positivism and neural network software. International Journal of Tourism Research, 2 (2), 119-131.
Sirgy, M.J. & Su, C. (2000). Destination Image, Self Congruity, and Travel Behaviour: Toward an Integrative Model. Journal of Travel Research, 38 (4) May, 340-352.
Tapachai, N. & Waryszak, R. (2000). An Examination of the Role of Beneficial Image in Tourist Destination Selection. Journal of Travel Research, 39 (1) August, 37-44.
Toffler, A. (1980). The Third Wave. New York: Bantam Books. Tourtellot, J.B. (2004). Destination Scorecard: 115 places rated. National Geographic
Traveler (March), 60-67. Viswanathan, M. & Childers, R.L. (1999). Understanding How Product Attributes Influence
Product Categorisation: Development and Validation of Fuzzy Set-Based Measures of Gradedness in Product Categories. Journal of Marketing Research, XXXVI (1), 75-94.
Vogt, C.A. & Fesenmaier, D.R. (1998). Expanding the Functional Tourism Information Search Model: Incorporating Aesthetic, Hedonic, Innovation, and Sign Dimensions. Annals of Tourism Research, 25 (3), 551-578.
Wedel, M. & Steenkamp, J.-B.E.M. (1991). A Clusterwise Regression Method for Simultaneous Fuzzy Market structuring and Benefit Segmentation. Journal of Marketing Research, XXVIII (4), 385-96.
Werthner, H. & Klein, S. (1999). Information Technology and Tourism: A Challenging Relationship. Wien: SpringerVerlag.
Woelfel, J. (1998). CATPAC II: User's Guide. Rah Press. Woelfel, J. & Stoyanoff, N.J. (1993). CATPAC: A Neural Network for Qualitative Analysis
of Text. Paper presented at the annual meeting of the Australian Marketing Association, Melbourne, Australia: September 1993.
Züll, C. & Landmann, J. (2004). Computer-assisted Content Analysis without Dictionary? , Sixth International Conference on Logic and Methodology (RC33) - Recent Developments and Applications In Social Research Methodology, Amsterdam, The Netherlands: August 17-20.
Appendix I: An example of story format response The first thing I notice when I get out of the plane in Dubai is the noise, everyone talking in Arabic at the same time, men, women, children, every one enthusiastically speaking to one another. When I take my taxi to the hotel I can hear the mosques calling people to take their prayers, I can see prayer mats placed everywhere around the city and men kneeling on them and placing their heads towards the floor. I can smell the spices when we drive through the market, extraordinary smells of saffron and cinnamon. When we drive across the city I can see mosques and other beautiful white buildings mixed with sky scrapers and modern office buildings. Everywhere I can see rich sheiks coming out of their limousines and entering their offices. But when we drive through the poor areas I can see starving children begging beside the road. In here I feel lucky and ashamed of being from the Western world. We quickly drive past the poor area and I put my feelings of shame in the back of my mind when I see my glorious hotel, red mat placed on the floor and golden onion shaped towers touching the sky. When I enter the hotel I start my cultural lessons and cover myself with a long sleeved top and a long skirt. I enter the new world and a new adventure...