S1
Electronic Supplementary Information
Effect of Controlling the Number of Fused Rings on Polymer Photocatalysts for Visible-Light-Driven Hydrogen Evolution
Li-Yu Ting,+ Jayachandran Jayakumar,+ Chih-Li Chang, Wei-Cheng Lin, Mohamed Hammad Elsayed, and Ho-Hsiu Chou*a
+These authors contributed equally
Department of Chemical Engineering, National Tsing Hua University
No. 101, Sec. 2, Kuang-Fu Rd., Hsinchu 30013, Taiwan
E-mail: [email protected]
Electronic Supplementary Material (ESI) for Journal of Materials Chemistry A.This journal is © The Royal Society of Chemistry 2019
S2
General methods: All reagents were obtained from commercial suppliers and used without further
purification. 2,7-Bis(4,4,5,5-tetramethyl-1,3,2-dioxaborolan-2-yl)-9,9-di-n-octylfluorene (F-B),
2,8-Bis(4,4,5,5-tetramethyl-1,3,2-dioxaborolan-2-yl)-6,12-dihydro-6,6,12,12-tetra-octylindeno
[1,2-b]fluorine (IF-B), were synthesized using previous literature procedures.1 1H NMR spectra
were measured using a Bruker Avance 500 MHz NMR spectrometer. The molecular weights of
the polymers were determined using GPC and polystyrene standards; the mobile phase was
tetrahydrofuran (flow rate: 1 mL min–1) at 40 °C. The energy levels of the HOMOs were measured
using a photoelectron spectrometer (model AC-2). Optical bandgaps (Eg) were calculated from the
onsets of the absorption spectra. The energy levels of the LUMOs were calculated by subtracting
the Eg from the HOMO energy levels. Water for the H2 evolution experiments was purified using
an Elix UV. All reactions were performed under a N2 atmosphere using standard Schlenk
techniques. UV–vis absorption spectra of the polymers were recorded using Hitachi U-3300
spectrophotometers. Fluorescence spectra of the polymers were recorded using a Hitachi F-7000
spectrophotometer, with an excitation wavelength of 420 nm, at room temperature. TGA of the
polymers was performed under N2 using a TA Q600 instrument over the temperature range 50–
600°C (heating rate: 10 °C min–1). Absolute quantum yields (AQYs) were recorded using the
Wrighton–Ginley–Morse method,2 and was determined under the same catalytic conditions stated
above, with the light source is 350 W Xe-lamp with a single wavelength cutoff filter (λ = 420, 460,
500 nm) (Figure S5(b)). Time resolved transient PL spectra of the polymer photocatalysts were
measured on a spectrometer (FLS980, Edinburgh Instruments) with a gated photomultiplier tube.
The molecular geometries of the polymers were optimized, and their orbital energies and charge
distributions computed using DFT at the B3LYP/6-31G* (H, C, S) levels.3
S3
Experimental Section
General procedure for Suzuki–Miyaura coupling polymerization:[4] Toluene and water were
injected into a sealed tube charged with the monomers, Na2CO3, and Pd(PPh3)4. The mixture was
degassed by bubbling with N2 for 30 min and then heated at 120 °C for 72 h. After cooling to room
temperature, bromobenzene was added and then the sealed tube was heated at 120 °C for 6 h,
followed by addition of phenyl boronic acid and heating at 120 °C for another 6 h. The mixture
was cooled to room temperature and poured into MeOH. The yellow precipitate was collected
through membrane filtration. Purification of the polymer was performed through Soxhlet
extraction with MeOH and hexane. Finally, the polymer was dissolved in hot CHCl3, concentrated,
and then precipitated in MeOH. The polymer was collected and dried under vacuum.
PFT: Monomer F-B (2,7-Bis(4,4,5,5-tetramethyl-1,3,2-dioxaborolan-2-yl)-9,9-di-n-
octylfluorene, 643 mg, 1 mmol), 5-dibromothiophene (T-Br) (242 mg, 1 mmol), Na2CO3 (2540
mg, 24 mmol), tetra-n-butylammonium bromide (TBAB, 13.0 mg, 0.04 mmol), Pd(PPh3)4 (55.0
mg, 0.048 mmol), toluene (40 mL), and water (10 mL) were used for polymerization. GPC (THF):
Mw 4.641 kg mol-1; 1H NMR (500 MHz, CDCl3): δ 7.69 (t), 7.65 (d, J = 6 Hz), 7,59 (d, J = 8
Hz),7.5 (d, J = 1 Hz), 7.45 (s),7.39 (d, J = 4 Hz), 7.11 (d, J = 4 Hz), 7.04 (d, J = 4 Hz), 2.04 (br),
1.16 (br), 1.07 (br), 0.78 (t), 0.71 (br)
PF2T: Monomer F-B (643 mg, 1 mmol), 2,5-dibromothieno[3,2-b]thiophene (2T-Br) (298 mg, 1
mmol), Na2CO3 (2540 mg, 24 mmol), TBAB (13.0 mg, 0.04 mmol), Pd(PPh3)4 (55.0 mg, 0.048
mmol), toluene (40 mL), and water (10 mL) were used for polymerization. GPC (THF): Mw
121.036 kg mol-1; 1H NMR (500 MHz, CDCl3): δ 7.55-7.65 (m), 2.05 (br), 1.07 (br), 0.78 (t)
S4
PIFT: Monomer IF-B (2,8-Bis(4,4,5,5-tetramethyl-1,3,2-dioxaborolan-2-yl)-6,12-dihydro-
6,6,12,12-tetraoctylindeno[1,2-b]fluorine, 955 mg, 1 mmol), T-Br (242 mg, 1 mmol), Na2CO3
(2540 mg, 24 mmol), TBAB (13.0 mg, 0.04 mmol), Pd(PPh3)4 (55.0 mg, 0.048 mmol), toluene (40
mL), and water (10 mL) were used for polymerization. GPC (THF): Mw 7.365 kg mol-1; 1H NMR
(500 MHz, CDCl3): δ 7.74 (t), 7.71 (d, J = 8 Hz), 7.67 (d, J = 6 Hz), 7.60~7.62 (m), 7.50 (d, J = 8
Hz), 7.45 (s), 7.39 (s), 7.11 (d, J = 3.5 Hz), 7.04 (d, J = 3.5 Hz), 7.03 (s), 2.07 (br), 1.12-1.15 (m),
1.06 (br), 0.77 (t), 0.70 (br)
PIF2T: Monomer IF-B (477 mg, 0.5 mmol), 2T-Br (149 mg, 1 mmol), Na2CO3 (1270 mg, 12
mmol), TBAB (6.5 mg, 0.02 mmol), Pd(PPh3)4 (27.5 mg, 0.024 mmol), toluene (20 mL), and water
(5 mL) were used for polymerization. GPC (THF): Mw 15.177 kg mol-1; 1H NMR (500 MHz,
CDCl3): δ 7.79 (d, J = 7.5 Hz), 7.76 (d, J = 7.5 Hz), 7.61-7.68 (m), 7.58 (s), 7.55 (s), 7.45-7.48
(m), 7.35 (t), 2.06 (br), 1.13-1.16 (m), 1.07 (br), 0.75-0.78 (m), 0.71 (br).
PF3T: Monomer F-B (2,7-Bis(4,4,5,5-tetramethyl-1,3,2-dioxaborolan-2-yl)-9,9-di-n-
octylfluorene, 643 mg, 1 mmol), 2,6-dibromodithieno[3,2-b:2',3'-d]thiophene (3T-Br, 351 mg, 1
mmol), Na2CO3 (2540 mg, 24 mmol), TBAB (13.0 mg, 0.04 mmol), Pd(PPh3)4 (55.0 mg, 0.048
mmol), toluene (40 mL), and water (10 mL) were used for polymerization. GPC (THF): Mw
121.036 kg mol-1; 1H NMR (500 MHz, CDCl3): δ 7.51 -7.80 (m), 3.95 (s), 3.39 (t), 2.03 (br), 1.60
(s), 1.16 (br), 1.07 (br), 0.76-0.79 (m)
PIF3T: Monomer IF-B (2,8-Bis(4,4,5,5-tetramethyl-1,3,2-dioxaborolan-2-yl)-6,12-dihydro-
6,6,12,12-tetraoctylindeno[1,2-b]fluorine, 477 mg, 0.5 mmol), 3T-Br (351 mg, 1 mmol), Na2CO3
(1270 mg, 12 mmol), TBAB (6.5 mg, 0.02 mmol), Pd(PPh3)4 (27.5 mg, 0.024 mmol), toluene (20
mL), and water (5 mL) were used for polymerization. GPC (THF): Mw 15.177 kg mol-1; 1H NMR
S5
(500 MHz, CDCl3): δ 7.77-7.78 (m), 7.65 (br), 7.59-7.62 (m), 2.06 (br), 1.13-1.16 (m), 1.07 (br),
0.75-0.78 (m).
The AQY measurement and wavelength experiment: The apparent quantum yield (AQY) for
H2 evolution was measured using monochromatic visible light (420 ± 20.0 nm) at ambient
temperature (27 C 1C). Depending on the amounts of hydrogen gases produced by the
photocatalytic reaction in an average of one hour, and the AQY was calculated as follow:
Eq-S1 𝜂𝐴𝑄𝑌 =
2 × 𝑀 × 𝑁𝐴 × ђ × 𝑐
𝑆 × 𝑃 × 𝑡 × 𝜆× 100%
Where M = amount of H2 molecule (mol)
NA = Avogadro constant (6.022 x 10²³ mol-1)
Ђ = Planck constant (6.626 x 10⁻³⁴ J s)
S = irradiation area (cm2)
P = intensity of irradiation light (W cm-2)
t = photoreaction time (s)
λ = wavelength of the monochromatic light (m)
Photocatalytic H2 evolution: The polymer powder (1 or 5 mg) and 10 mL of the mixture (water,
triethylamine, and methanol (1:1:1)) inserted into the reaction glass then closed with a septum.
The resulting mixture was ultra-sonicated and degassed completely by N2 bubbling, prior to
irradiation. The suspension was illuminated with 350 W Xe-lamp (1000 W/m2, λ > 420 nm)
S6
preserving its temperature at 27 C 1C under atmospheric pressure and the space between
reaction mixture and light source fixed at specific distance. Hydrogen samples was taken with a
gas-tight syringe and injected in a Shimazhu GC-2014 gas chromatograph, with Ar as carrier gas.
Hydrogen was detected with a thermal conductivity detector, referring to the standard hydrogen
gases with known concentrations. Increased pressure from the evolved hydrogen is neglected in
the calculations.
Photocurrent method; Photo current measurements were performed on a Zahner Zennium E
workstation equipped with three-electrode cell including a Pt wire counter electrode, Ag/AgCl as
reference electrode (3M NaCl) and a fluorine doped tin oxide (FTO) glass as working electrode.
About 5 mg of polymers were dispersed into a toluene solution (1 mL) and sonicate for 1 h. After
that, 200 µL of as-prepared suspension was spin-coated on FTO glass with an active area of 6.875
cm2. Here, 0.5 M Na2SO4 aqueous solution was prepared as electrolyte. 1.5 V constant potential
was applied with the 20 s light on-off after a certain time interval to record the photo and dark
current under LED light irradiation.
C8H17
C8H17
C8H17 C8H17
C8H17
C8H17
+
S BrB
O
O
SBr
SBr
S Br
S
SBr
Pd(PPh3)4, Na2CO3, TBAB
toluene/H2O, reflux, 72 h
C8H17 C8H17
S
n
C8H17 C8H17
S
Sn
C8H17 C8H17
S
S
S
n
C8H17
C8H17 C8H17
C8H17
S
n
C8H17
C8H17 C8H17
C8H17
S
S nC8H17
C8H17 C8H17
C8H17
S
S
S
n
PFT
PF2T
PF3T
PIFT
PIF2T
PIF3T
BO
O
BO
OB
O
O
Br
F-B
IF-B
T-Br
2T-Br
3T-Br
S7
Scheme S1. General synthetic routes of polymer photocatalysts
Table S1. Summarized photophysical, thermal properties and palldium content of polymer photocatalysts.
Photocatalysts Emisson Mw PDI Td Dihedral angle
Pd-content
[nm]a []b [Mw/Mn]b [C]c [] d [wt%]e
PFT 474 4651 1.27 329 0.35 0.34
PIFT 475 7365 1.31 344 27.30 0.10
PF2T 477 121036 1.45 339 0.01 0.18
PIF2T 478 15177 1.16 400 27.20 0.10
PF3T 484 8254 3.04 342 0.08 0.35
PIF3T 486 115071 2.41 336 26.80 0.18aEmission measuered in dichloromethane solution (0.05 mg/mL). b PDI were determined by gel permeation
chromatography in THF at 40 C. cThe decomposition temperature was determined by thermogravimetric analysis.
dCalculated from mercury software. eThe residual Pd contents were determined by ICP-MS.
Fig. S1. Thermogravimetric analysis (TGA) of polymer photocatalysts.
S8
Fig. S2. a) Emission spectra of copolymers measured in DCM (0.05 mg/mL) at room temperature
and b) photographs of conjugated polymers dissolved in DCM solution.
b)a)
Fig. S3. a) UV-visible absorption spectra of F-B, IF-B and b) T-Br, 2T-Br, 3T-Br in DCM
measured at room temperature.
S9
a) b)
c) d)
e) f)
Fig. S4. Calculated HOMOs of polymer photocatalysts a) PFT, b) PIFT, c) PF2T, d) PIF2T, e)
PF3T and f) PIF3T by photoelectron spectroscopy (model: AC-II).
Fig. S5. Energy level diagram of PFT, PIFT, PF2T, PIF2T, PF3T and PIF3T.
S10
Table S2. Optimization studies for the hydrogen evolution reaction.a
0 1 2 3 4 5 60
1000
2000
3000
4000
H2 (
μmol
g-1)
Time (h)
PF2T/5mg/10mL PF2T/5mg/25mL PF2T/25mg/25mL
0 1 2 3 4 5 60
1000
2000
3000
4000
H 2 (µm
ol g
-1)
Time (h)
PF2T/5mg/TEA/10mL PF2T/5mg/ascorbic acid/10mL PF2T/5mg/DEA/10mL PF2T/5mg/TEOA/10mL
b)
a)
aOptimization studies for the PF2T as the photocatalysts under various amounts, concentration and
sacrificial agents; Conditions; 10 mL of sacrificial agents/methanol/water (1:1:1) and x mg of
photocatalysts (20 vol%), 350 W, Xenon light (>420 nm, 1000 W m-2, AM. 1.5). Corresponding optimized
photocatalytic H2 evolution plots of conjugated polymers (a and b).
Table S3. Optimization studies for the hydrogen evolution reaction of efficient conjugated
polymers.a
Polymer
Amount
Sacrificial Agents (SA)
HER (µmol g-1
h-1
) at 420 nm
PF2T 1 mg/10 mL TEA 655
PF3T 1 mg/10 mL TEA 1095
PIF3T 1 mg/10 mL TEA 582 aOptimization studies of polymer
photocatalysts using following conditions; 10 mL of triethylamine/methanol/water (1:1:1) and 1 mg of
photocatalysts (20 vol%), 350 W, Xenon light (>420 nm, 1000 W m-2, AM. 1.5).
S11
400 450 500 550 600 650
0.0
0.2
0.4
0.6
0.8
1.0
Abso
rptio
n (a
.u.)
wavelength (nm)
PF2T
0.0
0.2
0.4
0.6
0.8
1.0
1.2
1.4 AQY
AQY
(%)
400 450 500 550 600 650
0.0
0.2
0.4
0.6
0.8
1.0
Abs
orpt
ion
(a.u
.)
wavelength (nm)
PIF3T
0.0
0.2
0.4
0.6
0.8 AQY
AQ
Y (%
)
b)a) c)
400 450 500 550 600 650
0.0
0.2
0.4
0.6
0.8
1.0
Abs
orpt
ion
(a.u
.)
wavelength (nm)
PF3T
0.0
0.2
0.4 AQY
AQ
Y (%
)
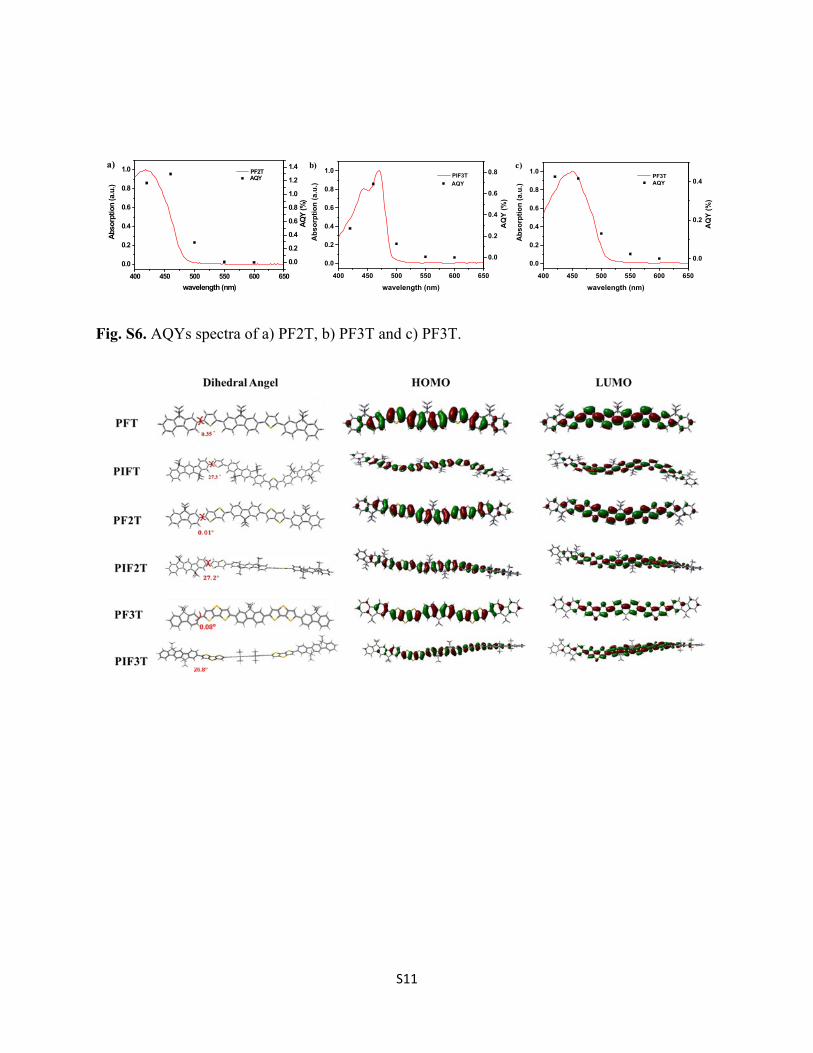
Fig. S6. AQYs spectra of a) PF2T, b) PF3T and c) PF3T.
S13
Fig. S7. Optimized structures and the HOMO and LUMO distribution of PFT, PIFT, PF2T, PIF2T,
PF3T and PIF3T.
Fig. S8. Transient PL decay curve for the copolymer of PFnTs and PIFnTs.
0 5 20 250
200
400
600
800
1000
1200
1400
1600
H2 (
µmol
g-1)
Time (h)
PF3T
12 hours
Fig. S9. Long-term stability tests of PF3T.
S14
Table S4. Compared the photophysical, HERs and AQYs of various photocatalysts in the known literature.
Polymer Catalysts
Metal Co-Catalysts
HERa)
> 420 nm(mmol h-1g-1)
Conditions@ λ > 420 nm References
CP-CMP10 Pd-residues 0.18 Water/20 vol% DEA
J. Am. Chem. Soc., 2015, 137, 3265−3270
P7 Pd-residues 3.68 Water/MeOH/TEA Angew. Chem. Int. Ed., 2016, 55, 1792
PCP4e 2 wt% Pt 0.17 Water/MeOH/TEA J. Am. Chem. Soc., 2016, 138, 7681-7686.
P8-i Pd-residues 0.12 Water/MeOH/TEA Adv. Energy Mater., 2017, 7, 1700479
PrCMP-3 3 wt% Pt 0.12Water/
20 vol% TEOA Macromol. Chem. Phys., 2017, 218, 1700049
OB-POP-3 3 wt% Pt 0.91Water/
20 vol% TEOA Adv. Funct. Mater., 2017, 27, 1703146
P12 Pd-residues 0.42 Water/MeOH/TEA J. Mater. Chem. A, 2018, 6, 11994–12003
PyBT-2 3 wt% Pt 1.06 20 vol% TEOA Appl. Catal. B: Environ., 2018, 228, 1-9
PMTPA-250 3 wt% Pt 0.58 Water/20 vol% TEOA
Green Chem., 2018, 20, 664-670
P28 Pd-residues 0.96 Water/MeOH/TEA Chem. Mater., 2018, 30, 5733−5742
SNP-BTT1 Pd-residues 0.49 Water/acetonitrile/TEOA Angew. Chem. Int. Ed., 2018, 57, 14188
PFN-Br Pd-residues 0.68 Water/TEOA Nano Energy., 2019, 60, 775–783
PF2T Pd-residues 0.65 Water/MeOH/ 33 vol% TEA This work
PF3T Pd-residues 1.09 Water/MeOH/ 33 vol% TEA This work
PIF3T Pd-residues 0.58 Water/MeOH/ 33 vol% TEA This work
a)Hydrogen evolution rate (light source, > 420 nm).
Supplementary References:
1 H. Y. Liu, P. J. Wu, S. Y. Kuo, C. P. Chen, E. H. Chang, C. Y. Wu and Y. H. Chan, J. Am.
Chem. Soc., 2015, 137, 10420.
2 M. S. Wrighton, D. S. Ginley and D. L. Morse, J. Phys. Chem., 1974, 78, 2229-2233.
3 A. D. Becke, J. Chem. Phys., 1993, 98, 5648−5652.
4 P.-J. Tseng, C.-L. Chang, Y.-H. Chan, L.-Y. Ting, P.-Y. Chen, C.-H. Liao, M.-L. Tsai and
H.-H. Chou, ACS Catal., 2018, 8, 7766-7772.


![Electronic Supplementary Information (ESI) · 1 Electronic Supplementary Information (ESI) for First synthesis of an aziridinyl fused pyrrolo[1,2-a]benzimidazole and toxicity evaluation](https://static.documents.pub/doc/80x56/5b50dc8a7f8b9a1b6e8f0c54/electronic-supplementary-information-esi-1-electronic-supplementary-information.jpg)
![Stereoselective synthesis of carbohydrate fused pyrano[3,2- … · 2018-07-09 · S1 Supplementary material Stereoselective synthesis of carbohydrate fused pyrano[3,2-c]pyranones](https://static.documents.pub/doc/80x56/5f1ec9b6b924c25dd12db5d2/stereoselective-synthesis-of-carbohydrate-fused-pyrano32-2018-07-09-s1-supplementary.jpg)


