Clays and Clay Minerals, Vol. 36, No. 3, 214-224, 1988. VISIBLE SPECTROSCOPY OF METHYLENE BLUE ON HECTORITE, LAPONITE B, AND BARASYM IN AQUEOUS SUSPENSION J. CENENS AND R. A. SCHOONHEYDT Laboratorium voor Oppervlaktechemie, Katholieke Universiteit Leuven Kardinaal Mercierlaan 92, B-3030 Leuven (Heverlee), Belgium Abstract--The absorption spectra of methylene blue ion exchanged on hectorite, Laponite B, Barasym, or sepiolite in dilute aqueous suspensions show the presence of the monomer, the protonated monomer, the dimer, and the trimer. Due to conformational differences, the absorption band maximum of the monomer with respect to its maximum in aqueous solution is red shifted when it is adsorbed on the external surface and blue shifted when it is adsorbed on the interlamellar surface. The availability of the interlamellar surface for methylene blue as a function of the type of clay and/or the counterion present thereby can be probed. The results indicate that 0.6-0.7% of the cation-exchange capacity of Barasym consists of acid sites capable of protonating methylene blue. Counterions of low hydration energy were found to induce a small number of similar sites in hectorite and Laponite B; hence, these sites must be situated on the external surface. Dimers formed on external surfaces show one absorption band. Dimers formed on the interlamellar surface of hectofite yield spectra having two absorption bands. The trimer was formed only at the external surface. With increasing loading of the clays, the spectra of methylene blue showed metachromasy. The metachromatic behavior can be fully explained by dye aggregation, which is the result of its concentration on the surface. No 7r-electroninteraction with the surface oxygens need be invoked. Key Words--Adsorption, Barasym, Hectorite, Laponite, Methylene blue, Sepiolite, Visible spectroscopy. INTRODUCTION The techniques of photochemistry and photophysics have been intensively applied to the study of interfaces, both organic (micelles, membranes, polymers) and in- organic (silica, alumina, zeolites, clays). A general re- view of the methods and materials was given by Thom- as (1984, 1987). For organic molecules on clays, luminescence spectroscopy is a useful technique be- cause of its extremely high sensitivity and because dy- namic processes can be studied. The disadvantage of luminescence spectroscopy is its restriction to lumi- nescent molecules on clays that are essentially free of Fe 3+ (Schoonheydt et al., 1984, 1986; Cenens et al., 1987; Viaene et al., 1987). Moreover, interpretation of the results is hampered by the heterogeneity of the clay minerals themselves and by side reactions of the organic probe, such as protonation and aggregation. Methylene blue (MB) is a cationic dye (Figure 1), which forms face-to-face dimers in dilute aqueous so- lutions and higher aggregates at increasing dye con- centration (Fornili et al., 1981). The dye is sensitive to changes in the polarity of its surroundings (Handa et al., 1983). A summary of its spectral properties is given in Table 1. The adsorption of MB is useful in determining the cation-exchange capacity and the sur- face area of clay minerals and in differentiating mont- morillonites from illites or kaolinites in mixtures (Pham Thi Hang and Brindley, 1970; Taylor, 1985). Bergmann and O'Konski (1963) were the first to give a detailed spectroscopic account of MB adsorption on Na-montmorillonite. The intensity of the monomer Copyright 1988, The Clay Minerals Society band, at 670 nm, rapidly decreased with increasing loading, and at shorter wavelengths new bands, at 605 and 579 nm, gained intensity. Such a shift of the most important absorption band to shorter wavelengths has been observed with many concentrated dye solutions, and is generally called metachromasy (Michaelis and Granick, 1945; Schubert and Levine, 1955). Because the observed band positions were identical to those of concentrated dye solutions, Bergmann and O'Konski (1963) concluded that dimers and even higher poly- mers were formed on the surface of montmorillonite. The presence of dimers even at small loadings was explained by the hypothesis that special sites existed that had a strong preference for dimers. Yariv and Lurie (1971) also observed metachromasy of MB on Wyoming bentonite. Because the observed d(001) value was only 13.5 ~, they ascribed the meta- chromasy to the interaction of the lone pair of electrons of the surface oxygens with the ~r electrons of the dye. The same observation and interpretation was put for- ward for acridine orange (Cohen and Yariv, 1984). Grauer et al. (1984), however, did not detect meta- chromasy with rhodamine 6G because the C6HsCOOC2H 5 substituent of rhodamine 6G ham- pered an efficient interaction between the oxygens and the 7r electrons (the formulae of the dyes are given in Figure 1). The phenomenon of metachromasy has been de- scribed also for proflavine, and Cenens et al. (1987) agreed with Bergmann and O'Konski that it was due to surface aggregation of the dye molecules which were 214
Transcript
Clays and Clay Minerals, Vol. 36, No. 3, 214-224, 1988.
VISIBLE SPECTROSCOPY OF METHYLENE BLUE ON HECTORITE, LAPONITE B, AND BARASYM IN AQUEOUS SUSPENSION
Abstract--The absorption spectra of methylene blue ion exchanged on hectorite, Laponite B, Barasym, or sepiolite in dilute aqueous suspensions show the presence of the monomer, the protonated monomer, the dimer, and the trimer. Due to conformational differences, the absorption band maximum of the monomer with respect to its maximum in aqueous solution is red shifted when it is adsorbed on the external surface and blue shifted when it is adsorbed on the interlamellar surface. The availability of the interlamellar surface for methylene blue as a function of the type of clay and/or the counterion present thereby can be probed. The results indicate that 0.6-0.7% of the cation-exchange capacity of Barasym consists of acid sites capable of protonating methylene blue. Counterions of low hydration energy were found to induce a small number of similar sites in hectorite and Laponite B; hence, these sites must be situated on the external surface. Dimers formed on external surfaces show one absorption band. Dimers formed on the interlamellar surface of hectofite yield spectra having two absorption bands. The trimer was formed only at the external surface. With increasing loading of the clays, the spectra of methylene blue showed metachromasy. The metachromatic behavior can be fully explained by dye aggregation, which is the result of its concentration on the surface. No 7r-electron interaction with the surface oxygens need be invoked.
The techniques of photochemistry and photophysics have been intensively applied to the study of interfaces, both organic (micelles, membranes, polymers) and in- organic (silica, alumina, zeolites, clays). A general re- view of the methods and materials was given by Thom- as (1984, 1987). For organic molecules on clays, luminescence spectroscopy is a useful technique be- cause of its extremely high sensitivity and because dy- namic processes can be studied. The disadvantage of luminescence spectroscopy is its restriction to lumi- nescent molecules on clays that are essentially free of Fe 3+ (Schoonheydt et al., 1984, 1986; Cenens et al., 1987; Viaene et al., 1987). Moreover, interpretation of the results is hampered by the heterogeneity of the clay minerals themselves and by side reactions of the organic probe, such as protonation and aggregation.
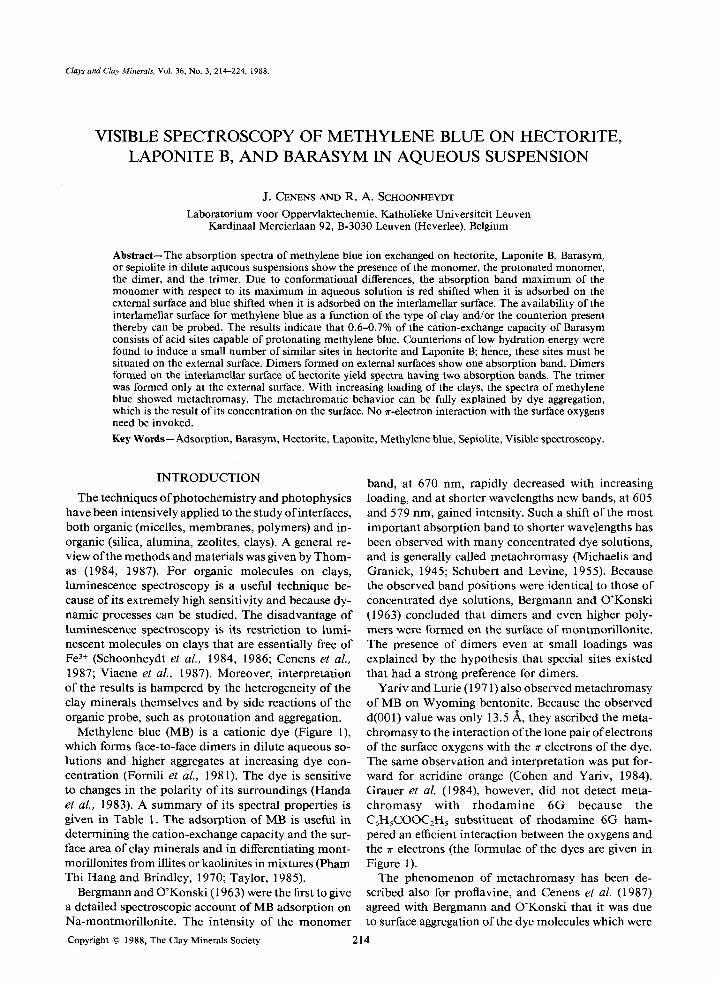
Methylene blue (MB) is a cationic dye (Figure 1), which forms face-to-face dimers in dilute aqueous so- lutions and higher aggregates at increasing dye con- centration (Fornili et al., 1981). The dye is sensitive to changes in the polarity of its surroundings (Handa et al., 1983). A summary of its spectral properties is given in Table 1. The adsorption of MB is useful in determining the cation-exchange capacity and the sur-
face area of clay minerals and in differentiating mont- morillonites from illites or kaolinites in mixtures (Pham Thi Hang and Brindley, 1970; Taylor, 1985).
Bergmann and O'Konski (1963) were the first to give a detailed spectroscopic account of MB adsorption on Na-montmorillonite. The intensity of the monomer
Copyright �9 1988, The Clay Minerals Society
band, at 670 nm, rapidly decreased with increasing loading, and at shorter wavelengths new bands, at 605 and 579 nm, gained intensity. Such a shift of the most important absorption band to shorter wavelengths has been observed with many concentrated dye solutions, and is generally called metachromasy (Michaelis and Granick, 1945; Schubert and Levine, 1955). Because the observed band positions were identical to those of concentrated dye solutions, Bergmann and O'Konski (1963) concluded that dimers and even higher poly- mers were formed on the surface of montmorillonite. The presence of dimers even at small loadings was explained by the hypothesis that special sites existed that had a strong preference for dimers.
Yariv and Lurie (1971) also observed metachromasy of MB on Wyoming bentonite. Because the observed d(001) value was only 13.5 ~, they ascribed the meta- chromasy to the interaction of the lone pair of electrons of the surface oxygens with the ~r electrons of the dye. The same observation and interpretation was put for- ward for acridine orange (Cohen and Yariv, 1984). Grauer et al. (1984), however, did not detect meta- chromasy with r h o d a m i n e 6G because the C6HsCOOC2H 5 substituent of rhodamine 6G ham- pered an efficient interaction between the oxygens and the 7r electrons (the formulae of the dyes are given in Figure 1).
The phenomenon of metachromasy has been de- scribed also for proflavine, and Cenens et al. (1987) agreed with Bergmann and O'Konski that it was due to surface aggregation of the dye molecules which were
214
Vol. 36, No. 3, 1988 Adsorption of methylene blue on clays 215
HsC2H N ~ ~ r ~ I~HC2Hs
H 3 C ~ ~ _ _ H3
~ c02C~Hs
rhodamine 6G
H 2 a ~ N H 2 i �9 H
proflavine
methylene blue acridine orange
Figure 1. Structural formulae of the dye molecules.
concen t ra ted in a very small v o l u m e a round the clay particles. The a im o f the present paper is to subs tant ia te this conclus ion and to see i f in fo rmat ion , s imilar to that ob ta ined by luminescence techniques (Schoon- heydt et al., 1984, 1986; Cenens et al., 1987; Viaene et aL, 1987), can be ob ta ined by classical abso rp t ion spect roscopy using MB as a p robe molecule.
E X P E R I M E N T A L
Preparation of the clays
Hectorite and Barasym, from the Source Clays Repository of the Clay Minerals Society, sepiolite from Tolsa SA (Madrid, Spain), and Laponite B from Laporte Industries (United King- dom) were used. Barasym is a synthetic 2:1 phyllosilicate having a random layering of expandable and non-expandable dioctahedral layers (Wright et al., 1972). The ratio of non- expandable to expandable layers is 2 to 1 (van Olphen and Fripiat, 1979). Only the sites on the external surface and those situated on the swelling layers are easily accessible for ex- change. Hectorite is a trioctahedral montmorillonite (Grim, 1953). Laponite B is a synthetic hectorite of small particle size (200-300/~, van Olphen and Fripiat, 1979). Sepiolite is a non-expandable clay mineral containing 9.6 x 10.6/~ struc- tural channels (Alvarez, 1984). These clays have significantly different external surfaces (Table 2) and low iron contents.
The clays were saturated with Na + by repeated (three times) exchange with 1-mole/dm 3 NaC1 solutions. The <2-/zm frac- tion was separated, concentrated in 1-mole/dm 3 NaC1, and stored in the dark at 277 K to minimize bacterial growth. Stable suspensions suitable for spectroscopic studies were pre- pared by dialyzing the stock suspension until they were salt- free, and separating the <0.3-#m fraction by centrifugation. The clay content was about 5 g/dm 3. The Laponite B sample Was not fractionated, because of its small particle size. Cation- exchange capacities (CEC) of these fractions (Table 2) were measured using the nNa-method (Peigneur et al., 1975). The value for Barasym was much lower than expected from the charge density of the layers. The ammonium ions which com- pensated the charges in the non-expandable layers (van O1- phen and Fripiat, 1979) were not accessible for exchange with Na + ions. Samples of hectorite and Laponite B having differ- ent counterions (K +, Cs +, NH4 +, Mg 2+, and Ca 2+) were pre- pared by exchanging desalted Na-clay with the desired C1 salt, and dialyzing until no C1 was detected (AgC1 test).
Preparation of the dye-clay samples
Dye-clay suspensions were prepared by shaking overnight 0.01 dm 3 of an aqueous 10 -5 mole/dm 3 solution of MB with
Table 1. Band positions ()~) and extinction coefficients (0 of methylene blue.
In aqueous solution Adsorbed on clays X ~ A
Species (nm) (dmVmole.cm) (nm) (dm3/mole.cm)
MB § 664 95,000 (1) 653 100,000 673 116,000
MBH 2+ 741 763 86,000 (MB+)2 605 596 80,000
697 718 30,000 (MB+)3 580 570 114,000
76,000 (2) 132,000 (1) 22,000 (1)
110,000 (3)
(1) Bergmann and O'Konski (1963); (2) Lewis and Bigelei- sen (1943); (3) Braswell (1968).
0.03 dm 3 of the clay suspensions, containing the appropriate amount of clay to obtain the desired loading. The final dye concentration was always 2.5 • 10 6 mole/dm 3. Loadings are herein expressed as a percentage of the CEC values given in Table 2. Buffered suspensions were prepared by adding 0.01 dm 3 of a dilute (0.001 mole/dm 3) buffer solution (CH3COONaJ CH3COOH for pH 4 or NaOH/NaHCO3 for pH 9) instead of 0.01 dm 3 H20. Because the dye concentration was constant (2.5 • 10 -6 mole/dm3), extremely small loadings were realized by a high concentration of clay in the suspension. This was easiest to realize for Laponite B. Indeed, the average particle size of the clays (Table 2) was smaller than the wavelength of recording (800-500 nm). Therefore, light scattering decreased with decreasing particle size (Kortum, 1969). On the other hand, Laponite B was also the only clay that formed stable aqueous suspensions with 100% loading of methylene blue. For hectorite and Barasym, the maximum loading to avoid flocculation was 20-25%. All manipulations were done in polyethylene vessels (because MB adsorbs on glass surfaces) and in the dark to minimize photochemical degradation of MB. The adsorption of MB was checked by centrifugation of the clay suspensions at 20,000 g during 30 min or by dialyzing against a known amount of distilled water. The supematant and the equilibrium dialysate were checked for residual meth- ylene blue by UV-VIS spectroscopy. For Laponite B, Bara- sym, and hectorite samples the adsorption was quantitative for all loadings investigated. On sepiolite the adsorbed MB was always in equilibrium with MB in solution and adsorption was not quantitative.
Methylene blue (100%) from UCB (Belgium) was used as received. The spectral properties were similar to those re- ported in the literature (Table 1).
Spectroscopy
Absorption spectra of MB-clay suspensions and identical MB-free clay suspensions were taken in the range 800-500 nm against pure water with a Cary 17 instrument connected to a HP 9825B desktop computer. The spectra of the pure clays were subtracted from those of the corresponding MB-
Table 2. N2-surface areas, nNa-cation-exchange capacity (CEC), and particle diameter of the clays.
Surface area CEC Diameter Clay (m2/g) 0~mole/g) (~)
(1) van Olphen and Fripiat (1979); (2) Avery and Ramsay (1986); (3) Alvarez (1984); (4) Cenens et al. (1987).
216 Cenens and Schoonheydt Clays and Clay Minerals
13G!
0
x
ol 500
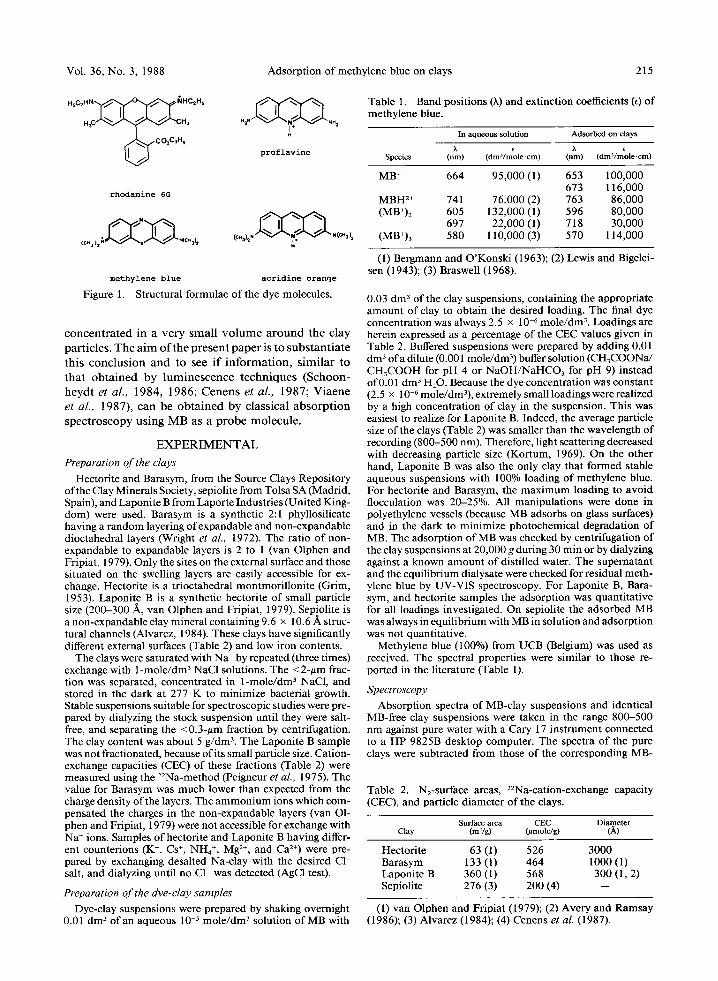
Figure 2. Schematic presentation of the different band po- sitions of methylene blue adsorbed on clays. The height of the lines equals the extinction coefficients given in Table 1,
(1~ ]+)3 MB+ 0 .3
MB+I \ 0
A b ~ �9
a0 ! Lt L �9 0 5 800
WAVELENGTH (nm)
. . . . i
clay materials to obtain the spectra of adsorbed MB only. By this subtraction the background due to light scattering of the clay particles was eliminated.
RESULTS
Four different MB species were found on the clays: the m o n o m e r (MB+), the p ro tona t ed m o n o m e r (MBH2+), the dimer ((MB§ and the trimer ((MB§ These species were also present in aqueous solution. In water the 0-0 band of the monomer adsorbed at 664 nm, with a molar extinction coefficient ~ of 95,000 dm3/(mole .em); a shoulder at 610 nm was identified as the corresponding 0-1 vibronic transition (Berg- mann and O'Konski, 1963). According to Lewis and Bigeleisen (1943), the pKa of MBH 2§ is 0.5 and MB § is completely protonated only in a 3 N H2SO4 solution. Under these conditions the absorption maximum is at 741 nm with a second maximum at 678 nm and a shoulder at ~615 rim. These maxima represent the vibronic components of MBH 2§ and have relative in- tensities of 1, 0.52, and 0.17, respectively (Lewis and Bigeleisen, 1943). The 741-nm band has an ~ value o f 76,000 dmV(mole.cm). By increasing the dye concen- tration dimers were formed, which produced bands at 605 nm (~ = 132,000 dm3/(mole.cm)) and at ~697 nm (, = 22,000 dm3/(mole �9 cm)) (Bergmann and O'Konski, 1963). A further increase o f the concentration led to trimerization; one band was noted at ~580 nm (~ = 110,000 dm3/(mole �9 cm)) (Braswell, 1968). The spectra o f the dye aggregates were very difficult to obtain in solution due to the high dye concentrations necessary to observe them.
The positions of the band maxima and the corre- sponding ~ values of the four species on the surface of clay minerals are given in Table 1. The positions of
0 1 2 3
% of CEC Figure 3. Variation of the MB § absorbance with the loading on: (O) Barasym at 673 nm (pH 9); (A) Na-hectorite at 653 nm (pH 7).
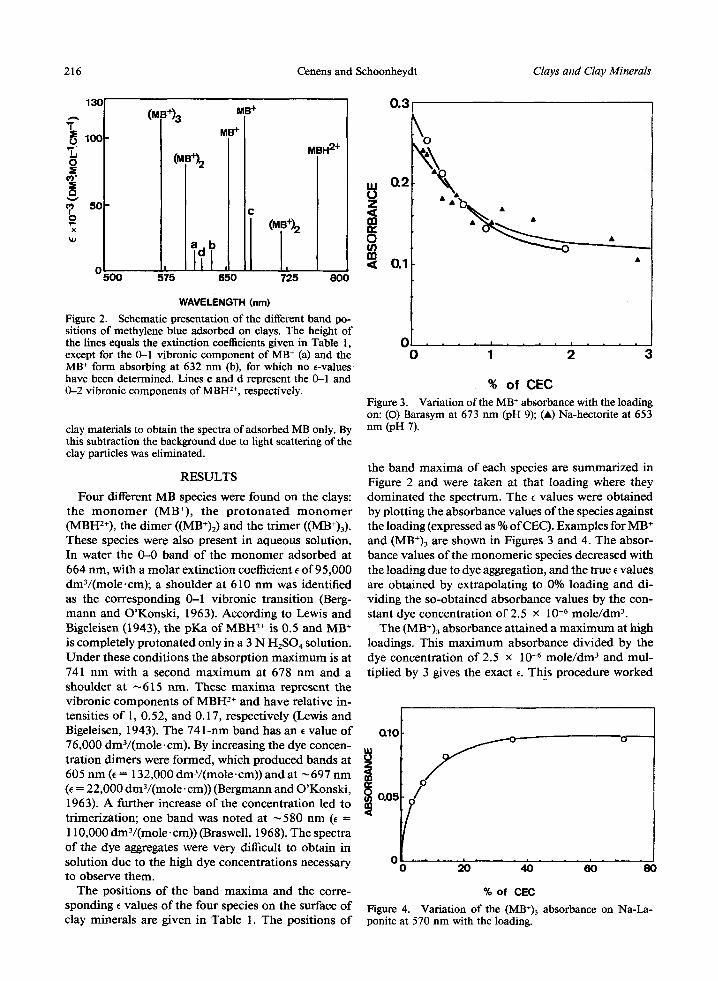
the band maxima of each species are summarized in Figure 2 and were taken at that loading where they dominated the spectrum. The E values were obtained by plotting the absorbance values of the species against the loading (expressed as % of CEC). Examples for MB § and (MB+)3 are shown in Figures 3 and 4. The absor- bance values of the monomeric species decreased with the loading due to dye aggregation, and the true ~ values are obtained by extrapolating to 0% loading and di- viding the so-obtained absorbance values by the con- stant dye concentration of 2.5 x 10 -6 mole/din 3.
The (MB+)3 absorbance attained a maximum at high loadings. This maximum absorbance divided by the dye concentration of 2.5 x 10 -6 mole/din 3 and mul- tiplied by 3 gives the exact ~. This procedure worked
% of CEC Figure 4. Variation of the (MB+)3 absorbance on Na-La- ponite at 570 nm with the loading.
except for the 0-1 vibronic component of MB § (a) and the MB + form absorbing at 632 nm (b), for which no e-values have been determined. Lines c and d represent the 0-1 and 0-2 vibronic components of MBH 2§ respectively.
Vol. 36, No. 3, 1988 Adsorption of methylene blue on clays 217
0.30
0.20 Z
m
0.1o
0 5 0 0
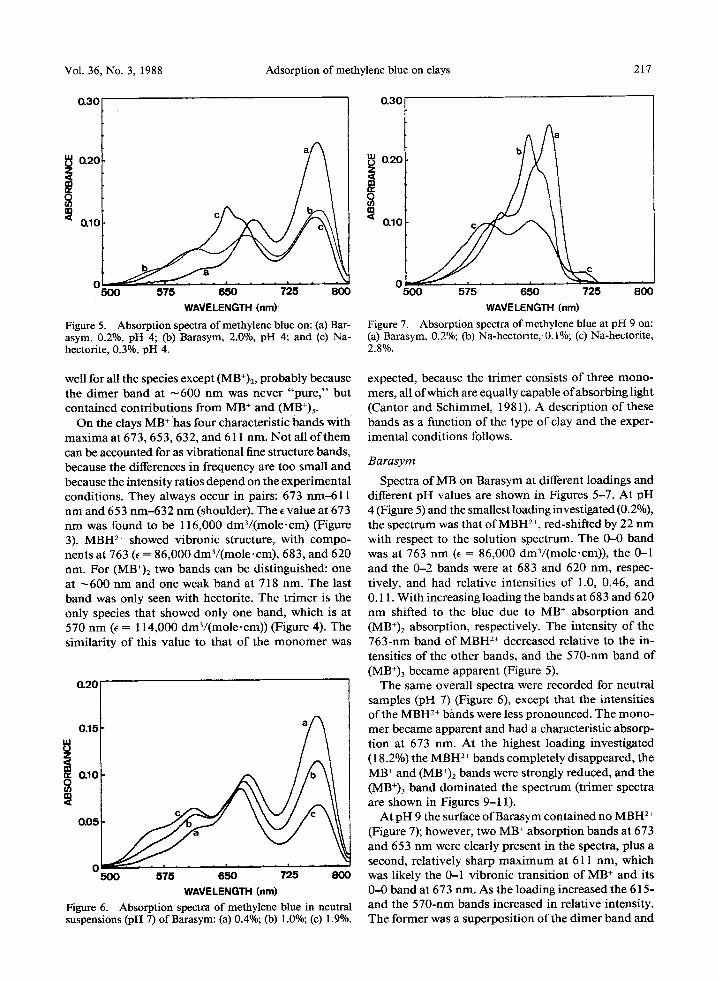
Figure 5. Absorption spectra of methylene blue on: (a) Bar- asym, 0.2%, pH 4; Co) Barasym, 2.00/0, pH 4; and (c) Na- hectorite, 0.3%, pH 4.
Figure 7. Absorption spectra of methylene blue at pH 9 on: (a) Barasym, 0.2%; (b) Na-hectorite, 0.1%; (c) Na-hectorite, 2.8%.
well for all the species except (MB+)2, probably because the dimer band at ~ 600 nm was never "pure," but contained contributions from MB + and (MB+)3.
On the clays MB + has four characteristic bands with maxima at 673,653, 632, and 611 nm. Not all of them can be accounted for as vibrational fine structure bands, because the differences in frequency are too small and because the intensity ratios depend on the experimental conditions. They always occur in pairs: 673 nm-611 nm and 653 nm-632 nm (shoulder). The e value at 673 nm was found to be 116,000 dm3/(mole.cm) (Figure 3). MBH 2+ showed vibronic structure, with compo- nents at 763 (e = 86,000 dmV(mole.cm), 683, and 620 nm. For (MB+)2 two bands can be distinguished: one at ~600 nm and one weak band at 718 nm. The last band was only seen with hectorite. The trimer is the only species that showed only one band, which is at 570 nm (e = 114,000 dmV(mole-cm)) (Figure 4). The similarity of this value to that of the monomer was
0.20
0.15
i O.10
c a
500 575 650 725 8OO WAVELENGTH (nm)
Figure 6. Absorption spectra of methylene blue in neutral suspensions (pH 7) ofBarasym: (a) 0.4%; (b) 1.0%; (c) 1.9%.
expected, because the trimer consists of three mono- mers, all of which are equally capable of absorbing light (Cantor and Schimmel, 1981). A description of these bands as a function of the type of clay and the exper- imental conditions follows.
Barasym
Spectra of MB on Barasym at different loadings and different pH values are shown in Figures 5-7. At pH 4 (Figure 5) and the smallest loading investigated (0.2%), the spectrum was that of MBH 2+, red-shifted by 22 nm with respect to the solution spectrum. The 0-0 band was at 763 nm (e = 86,000 dm3/(mole.cm)), the 0-1 and the 0-2 bands were at 683 and 620 nm, respec- tively, and had relative intensities of 1.0, 0.46, and 0.11. With increasing loading the bands at 683 and 620 nm shifted to the blue due to MB + absorption and (MB+)2 absorption, respectively. The intensity of the 763-nm band of MBH 2+ decreased relative to the in- tensities of the other bands, and the 570-nm band of (MB+)3 became apparent (Figure 5).
The same overall spectra were recorded for neutral samples (pH 7) (Figure 6), except that the intensities of the MBH 2+ bands were less pronounced. The mono- mer became apparent and had a characteristic absorp- tion at 673 nm. At the highest loading investigated (18.2%) the MBH 2+ bands completely disappeared, the MB + and (MB+)2 bands were strongly reduced, and the (MB+)3 band dominated the spectrum (trimer spectra are shown in Figures 9-11).
At pH 9 the surface of Barasym contained no MBH 2+ (Figure 7); however, two MB + absorption bands at 673 and 653 nm were clearly present in the spectra, plus a second, relatively sharp maximum at 611 nm, which was likely the 0-1 vibronic transition of MB + and its 0-0 band at 673 nm. As the loading increased the 615- and the 570-nm bands increased in relative intensity. The former was a superposition of the dimer band and
218 Cenens and Schoonheydt Clays and Clay Minerals
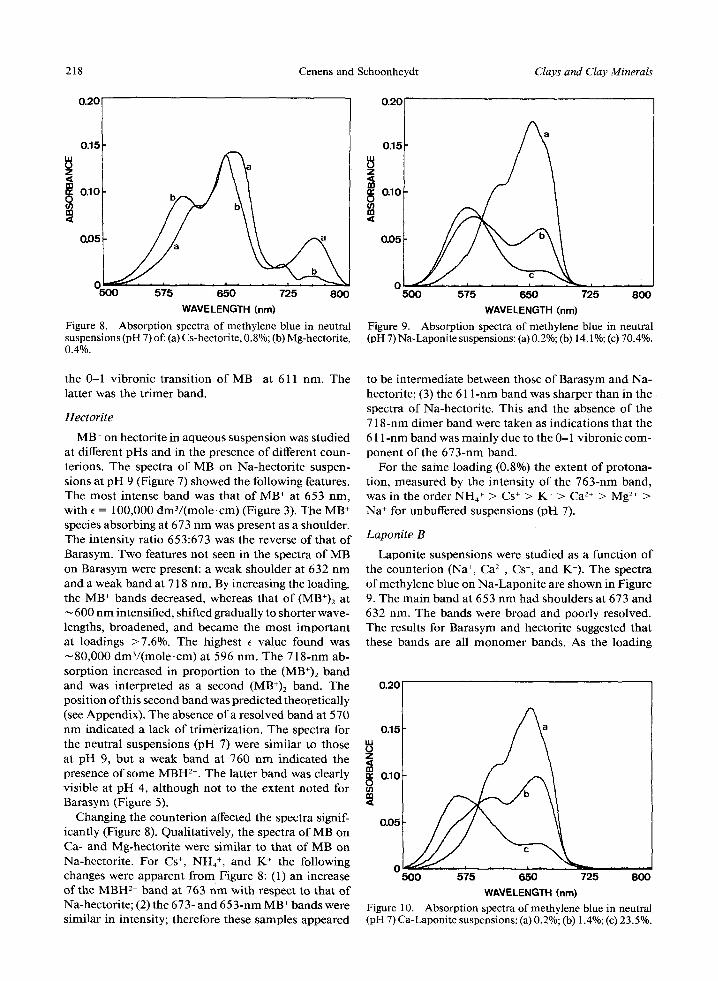
Figure 8. Absorption spectra of methylene blue in neutral suspensions (pH 7) of: (a) Cs-hectorite, 0.8%; (b) Mg-hectorite, 0.4%.
0.20
0.15 a
0.10
<
o.o5
o ~,~ 500 575 650 725 800
WAVELENGTH (nm)
Figure 9. Absorption spectra of methylene blue in neutral (pH 7) Na-Laponite suspensions: (a) 0.2%; (b) 14.1%; (c) 70.4%.
the 0-1 v ibronic t ransi t ion o f MB + at 611 nm. The latter was the t r imer band.
Hectorite
MB + on hectori te in aqueous suspension was s tudied at different pHs and in the presence o f different coun- terions. The spectra o f MB on Na-hec tor i te suspen- sions at p H 9 (Figure 7) showed the fol lowing features. The mos t intense band was that o f MB § at 653 nm, with e = 100,000 dm3/ (mole . cm) (Figure 3). The MB § species absorbing at 673 n m was present as a shoulder. The intensi ty ratio 653:673 was the reverse o f that o f Barasym. Two features no t seen in the spectra o f MB on Barasym were present: a weak shoulder at 632 n m and a weak band at 718 rim. By increasing the loading, the MB + bands decreased, whereas that o f (MB+)2 at
600 n m intensified, shifted gradually to shorter wave- lengths, broadened, and became the mos t impor tan t at loadings >7.6%. The highest e va lue found was ~80 ,000 dm3/ (mole . cm) at 596 nm. The 718-nm ab- sorpt ion increased in p ropor t ion to the (MB§ band and was interpreted as a second (MB+)2 band. The posi t ion o f this second band was predic ted theoret ical ly (see Appendix) . The absence of a reso lved band at 570 n m indicated a lack o f t r imerizat ion. The spectra for the neutral suspensions (pH 7) were s imilar to those at pH 9, but a weak band at 760 n m indica ted the presence o f some M B H 2+. The lat ter band was clearly visible at p H 4, a l though not to the extent no ted for Barasym (Figure 5).
Changing the counter ion affected the spectra signif- icantly (Figure 8). Qual i ta t ively, the spectra o f MB on Ca- and Mg-hector i te were s imilar to that o f M B on Na-hector i te . For Cs +, NH4 +, and K § the fol lowing changes were apparent f rom Figure 8: (1) an increase o f the M B H :+ band at 763 n m with respect to that o f Na-hector i te ; (2) the 673- and 653-nm MB § bands were s imilar in intensity; therefore these samples appeared
to be in te rmedia te be tween those o f Barasym and Na- hectorite; (3) the 611 -nm band was sharper than in the spectra o f Na-hector i te . This and the absence o f the 718-nm d imer band were taken as indicat ions that the 611 -nm band was main ly due to the 0-1 v ibronic com- ponent o f the 673-nm band.
For the same loading (0.8%) the extent o f pro tona- tion, measured by the intensi ty o f the 763-nm band, was in the order NH4 + > Cs + > K + > Ca 2+ > Mg 2+ > Na § for unbuffered suspensions (pH 7).
Laponite B
Laponi te suspensions were s tudied as a funct ion o f the counter ion (Na § Ca 2§ Cs § and K§ The spectra of methylene blue on Na-Lapon i t e are shown in Figure 9. The main band at 653 n m had shoulders at 673 and 632 nm. The bands were broad and poorly resolved. The results for Barasym and hector i te suggested that these bands are all m o n o m e r bands. As the loading
0.20
0.15
~m 0.10
~t
0.05
500 575 650 725 800
WAVELENGTH (nm)
Figure l 0. Absorption spectra of methylene blue in neutral (pH 7) Ca-Laponite suspensions: (a) 0.2%; (b) 1.4%; (c) 23.5%.
Vol. 36, No. 3, 1988 Adsorption of methylene blue on clays 219
0.20
0.15 a
i 0.10 <
o.(15
0 500 575 650 725 800
WAVELENGTH (nm)
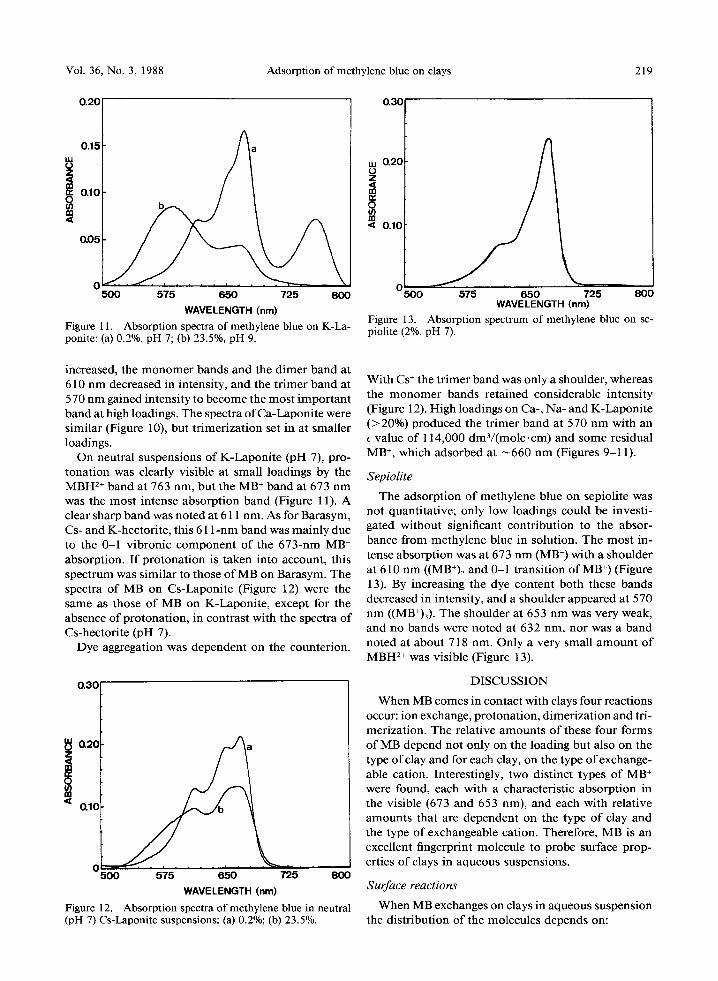
Figure l 1. Absorption spectra of methylene blue on K-La- ponite: (a) 0.2%, pH 7; (b) 23.5%, pH 9.
0.30
~ 0.20
< 0.10
0 ioo 575 650 725 800 WAVELENGTH (nm)
Figure 13. Absorption spectrum of methylene blue on se- piolite (2%, pH 7).
increased, the monomer bands and the dimer band at 610 nm decreased in intensity, and the trimer band at 570 nm gained intensity to become the most important band at high loadings. The spectra of Ca-Laponite were similar (Figure 10), but trimerization set in at smaller loadings.
On neutral suspensions of K-Laponite (pH 7), pro- tonation was clearly visible at small loadings by the MBH 2+ band at 763 nm, but the MB + band at 673 nm was the most intense absorption band (Figure 11). A clear sharp band was noted at 611 nm. As for Barasym, Cs- and K-hectorite, this 611-nm band was mainly due to the 0-1 vibronic component of the 673-nm MB + absorption. If protonation is taken into account, this spectrum was similar to those of MB on Barasym. The spectra of MB on Cs-Laponite (Figure 12) were the same as those of MB on K-Laponite, except for the absence of protonation, in contrast with the spectra of Cs-hectorite (pH 7).
Dye aggregation was dependent on the counterion.
0.30
~ 0.20
Ix
500 25 8O0
WAVELENGTH (nm)
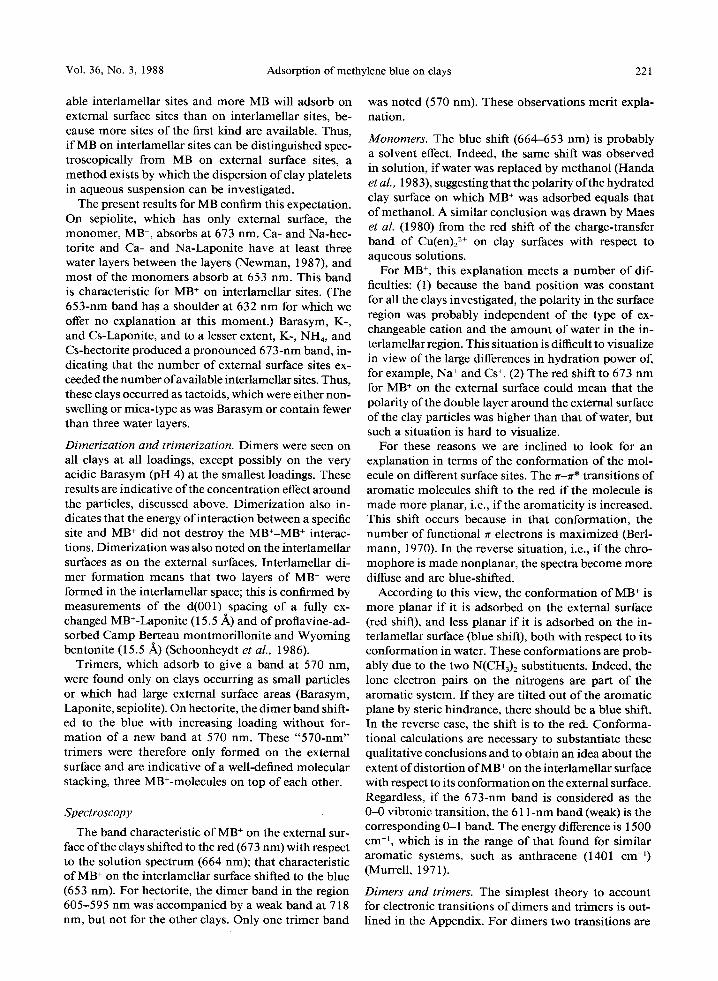
Figure 12. Absorption spectra of methylene blue in neutral (pH 7) Cs-Laponite suspensions: (a) 0.2%; (b) 23.5%.
With Cs + the trimer band was only a shoulder, whereas the monomer bands retained considerable intensity (Figure 12). High loadings on Ca-, Na- and K-Laponite (>20%) produced the trimer band at 570 nm with an
value of 114,000 dm3/(mole.cm) and some residual MB +, which adsorbed at ~660 nm (Figures 9-11).
Sepiolite
The adsorption of methylene blue on sepiolite was not quantitative; only low loadings could be investi- gated without significant contribution to the absor- bance from methylene blue in solution. The most in- tense absorption was at 673 nm (MB +) with a shoulder at 610 nm ((MB+)2 and 0-1 transition of MB +) (Figure 13). By increasing the dye content both these bands decreased in intensity, and a shoulder appeared at 570 nm ((MB+)3). The shoulder at 653 nm was very weak, and no bands were noted at 632 nm, nor was a band noted at about 718 nm. Only a very small amount of MBH 2+ was visible (Figure 13).
DISCUSSION
When MB comes in contact with clays four reactions occur: ion exchange, protonation, dimerization and tri- merization. The relative amounts of these four forms of MB depend not only on the loading but also on the type of clay and for each clay, on the type of exchange- able cation. Interestingly, two distinct types of MB + were found, each with a characteristic absorption in the visible (673 and 653 nm), and each with relative amounts that are dependent on the type of clay and the type of exchangeable cation. Therefore, MB is an excellent fingerprint molecule to probe surface prop- erties of clays in aqueous suspensions.
Surface reactions
When MB exchanges on clays in aqueous suspension the distribution of the molecules depends on:
220 Cenensand Schoonheydt
(1) The available surface area, which in turn, de- pends on three factors: particle size, the swelling of the clay, and the type of exchangeable cation. If the particle size decreases, the external surface area increases and so does the number of external surface sites for ad- sorption of MB. An extreme case is Laponite, however, Barasym also consists of small particles, at least as is indicated by the N2-BET surface area (Table 2). In water, clays are not completely swollen, but form tac- toids (Fripiat et al., 1984). The replacement of Na + with large monovalent cations such as K +, Cs +, and NH4 +, which have small hydration power, leads to larg- er tactoids (or the number of individual clay platelets per tactoid increases), and the spacing between the clay platelets in the tactoid becomes smaller (Rausell-Col- om and Serratosa, 1987). The spacings reported for these cations range from 12 ~ for Cs-montmorillonite (independent of the water content) to 15 ,~ for K-mont- morillonites (Newman, 1987). Clays saturated with di- valent cations (Ca 2§ Mg 2+) also form tactoids easily and allow three layer hydrates to be formed in the interlamellar space. Divalent cations all give a spacing of 19/~ when immersed in water but do not swell any further as Na- and Li-clays do (Newman, 1987).
(2) Finally, the distribution of MB over the clay surface depends on the properties of MB itself. In water it easily forms dimers even at concentrations as low as 10 5 mole/din 3. Our suspensions all had the constant concentrationof2.5 x 10-6mole/dm 3. Only the mono- mer MB + was then present in solution and exchanged on the clays. MB is concentrated on a clay in a small space around the clay particles. Whether it aggregates in that space or not, depends on the adsorptive power of the sites on the surface relative to the driving force for aggregation. If the complete surface area of 750 mV g is available and if MB is confined in a 10-~,-thick layer around the clay particles, MB is concentrated from solution into a volume which is 267 times small- er. The concentration increases from 2.5 • 10 6 to 6.67 x 10 -4 mole/dm 3, a value at which extensive di- merization occurs in aqueous solution. By analogy, ag- gregation should also occur on the surface.
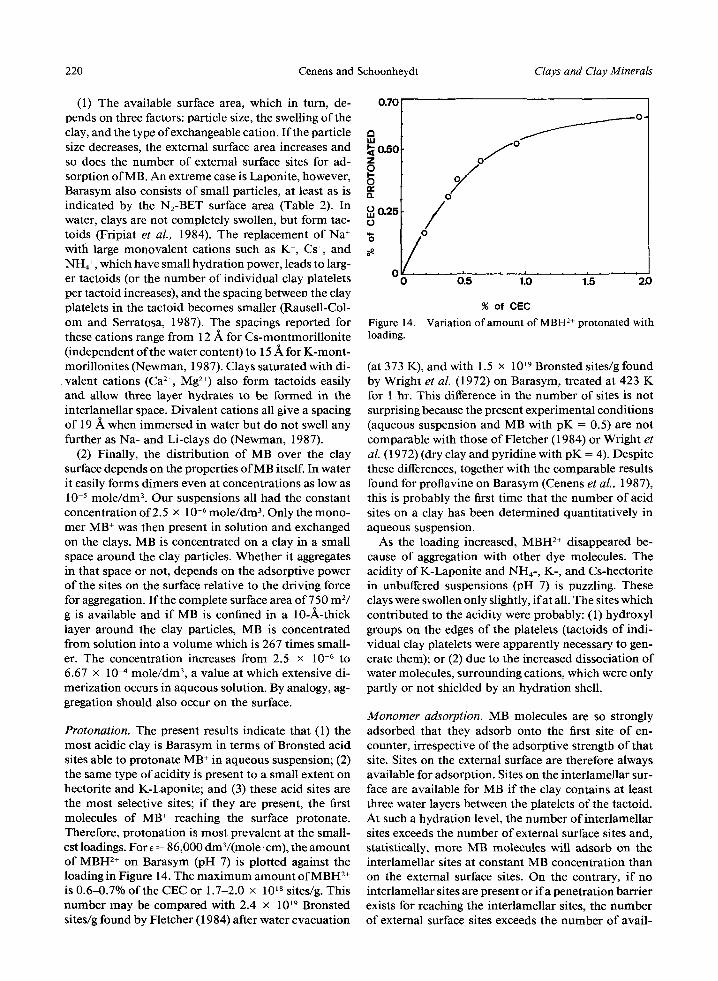
Protonation. The present results indicate that (1) the most acidic clay is Barasym in terms of Bronsted acid sites able to protonate MB + in aqueous suspension; (2) the same type of acidity is present to a small extent on hectorite and K-Laponite; and (3) these acid sites are the most selective sites; if they are present, the first molecules of MB + reaching the surface protonate. Therefore, protonation is most prevalent at the small- est loadings. For ~ = 86,000 dm3/(mole �9 cm), the amount of MBH 2+ on Barasym (pH 7) is plotted against the loading in Figure 14. The maximum amount of MBH 2+ is 0.6-0.7% of the CEC or 1.7-2.0 x 10¹⁸ sites/g. This number may be compared with 2.4 x 10¹⁹ Bronsted sites/g found by Fletcher (1984) after water evacuation
Clays and Clay Minerals
0.70
LU 0.50 Z
0 0 .25
0 . . . . I .
0 0.5
~ 0 -
/
~ f ~
Y 0 /
0 / �9 . . = . . . . . . . . .
1.0 1.5 2.0
Figure 14. loading.
% of CEC
Variation of amount of MBH 2+ protonated with
(at 373 K), and with 1.5 x 10¹⁹ Bronsted sites/g found by Wright et al. (1972) on Barasym, treated at 423 K for 1 hr. This difference in the number of sites is not surprising because the present experimental conditions (aqueous suspension and MB with pK -- 0.5) are not comparable with those of Fletcher (1984) or Wright et al. (1972) (dry clay and pyridine with pK = 4). Despite these differences, together with the comparable results found for proflavine on Barasym (Cenens et al., 1987), this is probably the first time that the number of acid sites on a clay has been determined quantitatively in aqueous suspension.
As the loading increased, MBH 2+ disappeared be- cause of aggregation with other dye molecules. The acidity of K-Laponite and NH4- , K-, and Cs-hectorite in unbuffered suspensions (pH 7) is puzzling. These clays were swollen only slightly, if at all. The sites which contributed to the acidity were probably: (1) hydroxyl groups on the edges of the platelets (tactoids of indi- vidual clay platelets were apparently necessary to gen- erate them); or (2) due to the increased dissociation of water molecules, surrounding cations, which were only partly or not shielded by an hydration shell.
M o n o m e r adsorption. MB molecules are so strongly adsorbed that they adsorb onto the first site of en- counter, irrespective of the adsorptive strength of that site. Sites on the external surface are therefore always available for adsorption. Sites on the interlamellar sur- face are available for MB if the clay contains at least three water layers between the platelets of the tactoid. At such a hydration level, the number of interlamellar sites exceeds the number of external surface sites and, statistically, more MB molecules will adsorb on the interlamellar sites at constant MB concentration than on the external surface sites. On the contrary, if no interlamellar sites are present or i ra penetration barrier exists for reaching the interlamellar sites, the number of external surface sites exceeds the number of avail-
Vol. 36, No. 3, 1988 Adsorption of methylene blue on clays 221
able interlamellar sites and more MB will adsorb on extemal surface sites than on interlamellar sites, be- cause more sites of the first kind are available. Thus, i f M B on interlamellar sites can be distinguished spec- troscopically from MB on external surface sites, a method exists by which the dispersion of clay platelets in aqueous suspension can be investigated.
The present results for MB confirm this expectation. On sepiolite, which has only external surface, the monomer, MB § absorbs at 673 nm. Ca- and Na-hec- torite and Ca- and Na-Laponite have at least three water layers between the layers (Newman, 1987), and most of the monomers absorb at 653 nm. This band is characteristic for MB § on interlamellar sites. (The 653-nm band has a shoulder at 632 nm for which we offer no explanation at this moment.) Barasym, K-, and Cs-Laponite, and to a lesser extent, K-, NH4, and Cs-hectorite produced a pronounced 673-nm band, in- dicating that the number of external surface sites ex- ceeded the number of available interlamellar sites. Thus, these clays occurred as tactoids, which were either non- swelling or mica-type as was Barasym or contain fewer than three water layers.
Dimerization and trimerization. Dimers were seen on all clays at all loadings, except possibly on the very acidic Barasym (pH 4) at the smallest loadings. These results are indicative of the concentration effect around the particles, discussed above. Dimerization also in- dicates that the energy of interaction between a specific site and MB § did not destroy the MB§ § interac- tions. Dimerization was also noted on the interlamellar surfaces as on the external surfaces. Interlamellar di- mer formation means that two layers of MB § were formed in the interlamellar space; this is confirmed by measurements of the d(001) spacing of a fully ex- changed MB§ (15.5 ~k) and ofproflavine-ad- sorbed Camp Berteau montmoril lonite and Wyoming bentonite (15.5 ~) (Schoonheydt et al., 1986).
Trimers, which adsorb to give a band at 570 nm, were found only on clays occurring as small particles or which had large external surface areas (Barasym, Laponite, sepiolite). On hectorite, the dimer band shift- ed to the blue with increasing loading without for- mation of a new band at 570 nm. These "570-nm" trimers were therefore only formed on the external surface and are indicative of a well-defined molecular stacking, three MB§ on top of each other.
Spectroscopy
The band characteristic of MB + on the external sur- face of the clays shifted to the red (673 nm) with respect to the solution spectrum (664 nm); that characteristic of MB § on the interlamellar surface shifted to the blue (653 nm). For hectorite, the dimer band in the region 605-595 nm was accompanied by a weak band at 718 nm, but not for the other clays. Only one trimer band
was noted (570 nm). These observations merit expla- nation.
Monomers. The blue shift (664-653 rim) is probably a solvent effect. Indeed, the same shift was observed in solution, i f water was replaced by methanol (Handa et al., 1983), suggesting that the polarity of the hydrated clay surface on which MB + was adsorbed equals that of methanol. A similar conclusion was drawn by Maes et al. (1980) from the red shift of the charge-transfer band of Cu(en)22+ on clay surfaces with respect to aqueous solutions.
For MB +, this explanation meets a number of dif- ficulties: (1) because the band position was constant for all the clays investigated, the polarity in the surface region was probably independent of the type of ex- changeable cation and the amount of water in the in- terlamellar region. This situation is difficult to visualize in view of the large differences in hydration power of, for example, Na + and Cs +. (2) The red shift to 673 nm for MB + on the external surface could mean that the polarity of the double layer around the external surface of the clay particles was higher than that of water, but such a situation is hard to visualize.
For these reasons we are inclined to look for an explanation in terms of the conformation of the mol- ecule on different surface sites. The 7r--~r* transitions of aromatic molecules shift to the red if the molecule is made more planar, i.e., i f the aromaticity is increased. This shift occurs because in that conformation, the number of functional lr electrons is maximized (Bed- mann, 1970). In the reverse situation, i.e., i f the chro- mophore is made nonplanar, the spectra become more diffuse and are blue-shifted.
According to this view, the conformation of MB + is more planar i f it is adsorbed on the external surface (red shift), and less planar i f it is adsorbed on the in- terlamellar surface (blue shift), both with respect to its conformation in water. These conformations are prob- ably due to the two N(CH3)/substituents. Indeed, the lone electron pairs on the nitrogens are part o f the aromatic system. If they are tilted out of the aromatic plane by steric hindrance, there should be a blue shift. In the reverse case, the shift is to the red. Conforma- tional calculations are necessary to substantiate these qualitative conclusions and to obtain an idea about the extent of distortion o f M B + on the interlamellar surface with respect to its conformation on the external surface. Regardless, i f the 673-nm band is considered as the 0-0 vibronic transition, the 611-nm band (weak) is the corresponding 0-1 band. The energy difference is 1500 cm -~, which is in the range of that found for similar aromatic systems, such as anthracene (1401 cm -1) (Murrell, 1971).
Dimers and trimers. The simplest theory to account for electronic transitions o fd imers and trimers is out- lined in the Appendix. For dimers two transitions are
222 Cenens and Schoonheydt Clays and Clay Minerals
expected, one at higher energy and the other at lower energy than that of the monomer transition, but the energy shifts are equal in both directions. Such shifts were found for MB § on hectorite: the weak 718-nm band was 1386 cm- ~ lower in energy than the monomer absorption at 653 nm. The intense high energy dimer band should then have been at 599 nm, in agreement with the experimental band position of 605-595 nm.
The intensity ratio of the two bands depends on the relative orientations of the transition dipole moments of the two chromophores in the dimer (Cantor and Schimmel, 1981). Because the transition moments lie in the plane of the aromatic ring system, the intensity ratio provides information about the orientation of the chromophores in the dimer. In the limit of exact par- allel orientation of the two identical chromophores in the dimer, the dimer has a center of symmetry, and the low energy band is forbidden. This parallel ori- entation can be destroyed by vibrational motion of the chromophores with respect to each other or by the existence of an unsymmetrical structure. Under such circumstances the low energy band is present in the spectrum and has an intensity proportional to the de- gree o f distortion (West and Pearce, 1965).
Thus, on the external surface where MB + has a planar conformation, a dimer can be formed wherein the two chromophores are identical, and the dipole moments are oriented in a parallel fashion with respect to each other. The 718-nm band has zero intensity. On the interlamellar surface where the MB § molecule is some- what distorted, an unsymmetrical dimer is formed, and the 718-nm band shows up in the spectrum.
The following relations exist between the dimer di- pole strengths (Doa + and D o a ) in terms of the monomer dipole strength (Do,) (Cantor and Schimmell, 1981):
and
Doa + = Doa + Doax cos 0
Doa- = Doa - Doax cos 0,
where 0 is the angle between the transition dipoles involved in the individual electronic absorptions of monomer 1 and monomer 2. As an approximation the absorbance values of the two bands involved at 718 and ~600 nm have been used to estimate the angle between the two transition dipoles Doa + and Doa-. The change in dimer conformation on the interlamellar sur- face with loading can be followed in Figure 15. The angle between the transition moments of the two monomers attains a value of about 60 ~ for interlamellar dimers on hectorite. Bergmann and O'Konski (1963) estimated a value of 13 ~ for the dimer in aqueous so- lution.
From the three transitions that are possible in tri- mers, only the highest energy band at 570 nm was noted. Trimers probably formed on the external sur- face only because the chromophores were oriented in
A O
w,
z
7 0
5 0
9 5
f O
/ O /
~ . . . . . . . . 2 . . . . 3 . . . . 4
% of CEC
Figure 15. Variation of the angle between the transition di- poles of the two monomers in the dimer with the loading.
an exactly parallel fashion. This is not the case on the interlamellar surface for slightly distorted MB + mole- cules. The energy difference between the transitions of the trimer and the monomer (673 nm or 14,859 cm -~) is 2685 cm-L According to the simple theory (Appen- dix), the dimer should then absorb at 14,859 cm ~ + (2685 c m x / v ~ ) = 16,758 cm -~ or 597 nm, again in good agreement with experiment.
Thus, the simple theory fully explains the meta- chromatic effect of dye adsorption on clays in terms of dimerization and trimerization on the surface, exactly as was explained for solution. Ascribing metachromasy to 7r-electron interactions o f M B + with the surface oxy- gens, as Yariv and Lurie (1971) did, cannot account for the richness of the spectra that were obtained.
S U M M A R Y A N D CONCLUSIONS
Methylene blue is a sensitive fingerprint molecule for probing the surface properties of clays in aqueous suspension. MBH 2+, two forms of MB +, (MB+)2, and (MB+)3 were found on the surface of clays. At small loadings the monomers (MB +, MBH 2+) were the dom- inant species, but at greater loadings, dimers and tri- mers were formed at the expense of the monomers. On Barasym at neutral pH, 0.7% of the 22Na-CEC were present as acid sites, which were able to protonate MB +. Acid sites were also present on Laponite and hectorite that had been exchanged with K + or Cs +.
On the external surface the MB + absorption spec- trum had a maximum at 673 nm, whereas on the in- terlamellar surface the MB + absorption maximum was at 673 nm. MB + was less planar, thus less aromatic on the interlamellar surface than on the external surface. At small loadings interlamellar adsorption was dom- inant on Na- and Ca-forms of hectorite and Laponite as determined from the relative intensities of the 653- and 673-nm bands. External surface adsorption was dominant for Barasym, Cs-Laponite and K-Laponite,
Vol. 36, No. 3, 1988 Adsorption of methylene blue on clays 223
whereas K-hec tor i t e and Cs-hector i te were in te rme- diate in behavior .
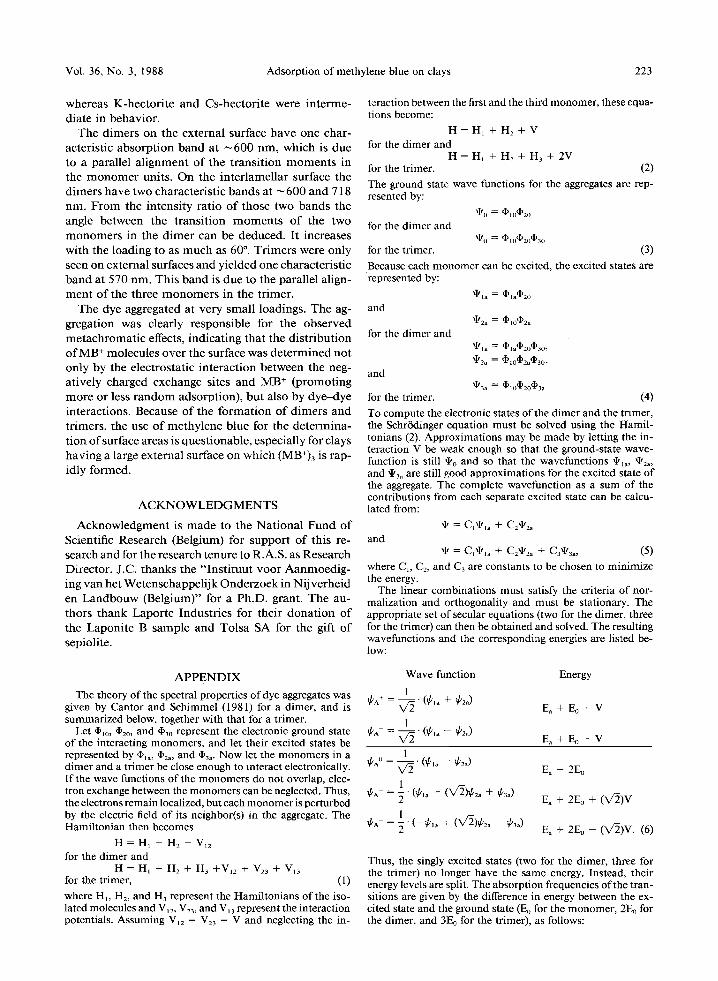
The d imers on the external surface have one char- acterist ic abso rp t ion b a n d at ~ 6 0 0 nm, which is due to a parallel a l ignment o f the t rans i t ion m o m e n t s in the m o n o m e r units. On the in ter lamel lar surface the d imer s have two character is t ic bands at ~ 600 and 718 nm. F r o m the in tens i ty rat io o f those two b a n d s the angle be tween the t rans i t ion m o m e n t s o f the two m o n o m e r s in the d i m e r can be deduced. It increases wi th the loading to as m u c h as 60 ~ Tr imers were only seen on external surfaces and yie lded one character is t ic b a n d at 570 nm. This b a n d is due to the parallel align- m e n t o f the three m o n o m e r s in the t r imer .
The dye aggregated at very small loadings. The ag- gregation was clearly respons ib le for the obse rved m e t a c h r o m a t i c effects, indicat ing that the d i s t r ibu t ion o f M B + molecules over the surface was d e t e r m i n e d no t only by the electrostat ic in terac t ion be tween the neg- at ively charged exchange sites and MB + (p romot ing more or less r a n d o m adsorpt ion) , but also by d y e - d y e interact ions. Because o f the fo rma t ion o f d imer s and t r imers , the use o f me thy lene blue for the de t e rmina - t ion o f surface areas is ques t ionable , especially for clays hav ing a large external surface on which (MB+)3 is rap- idly formed.
A C K N O W L E D G M E N T S
A c k n o w l e d g m e n t is m a d e to the Na t iona l F u n d o f Scientific Research (Belgium) for suppor t o f this re- search and for the research tenure to R.A.S. as Research Director . J.C. thanks the " Ins t i tuu t voor A a n m o e d i g - ing van het Wetenschappe l i jk Onde rzoek in Nij ve rhe id en L a n d b o u w (Belgium)" for a Ph .D. grant. The au- thors thank Lapor te Indust r ies for their d o n a t i o n o f the Laponi te B sample and Tolsa SA for the gift o f sepiolite.
teraction between the first and the third monomer, these equa- tions become:
H = H~ + H2 + V for the dimer and
H = H, + H2 + H 3 + 2V for the trimer. (2)
The ground state wave functions for the aggregates are rep- resented by:
�9 I% = O~oO2o for the dimer and
~II 0 = (I)1o(I)2o(I)3o for the trimer. (3)
Because each monomer can be excited, the excited states are represented by:
q~. = OuO2o and
for the dimer and
and
~12a = (]~10~)2a
~Itla = OlaqI~2oqI)30 ,
XI/2a = (1)10~2a(I)30 ,
~II3a = ~)10(1)2o(1)3a for the trimer. (4)
To compute the electronic states of the dimer and the trimer, the Schr6dinger equation must be solved using the Hamil- tonians (2). Approximations may be made by letting the in- teraction V be weak enough so that the ground-state wave- function is still 't' 0 and so that the wavefunctions ~ , , q~2~, and ~3~ are still good approximations for the excited state of the aggregate. The complete wavefunction as a sum of the contributions from each separate excited state can be calcu- lated from:
~ C i l i a ~- C2~tX/2a
and ~1~ = Cl~tI/la + C 2 ~ 2 a ~- C3~I/3a ' ( 5 )
where C~, C2, and C3 are constants to be chosen to minimize the energy.
The linear combinations must satisfy the criteria of nor- malization and orthogonality and must be stationary. The appropriate set of secular equations (two for the dimer, three for the trimer) can then be obtained and solved. The resulting wavefunctions and the corresponding energies are listed be- low:
A P P E N D I X
The theory of the spectral properties of dye aggregates was given by Cantor and Schimmel (1981) for a dimer, and is summarized below, together with that for a trimer.
L e t O1o , 020 , and 030 represent the electronic ground state of the interacting monomers, and let their excited states be represented by Ou, 02a, and 03,. Now let the monomers in a dimer and a trimer be close enough to interact electronically. If the wave functions of the monomers do not overlap, elec- tron exchange between the monomers can be neglected. Thus, the electrons remain localized, but each monomer is perturbed by the electric field of its neighbor(s) in the aggregate. The Hamiltonian then becomes
H = H l + H2 + V~2 for the dimer and
H = H 1 + H2 + H3 +Vl2 + V23 + V~3 for the trimer, (1)
where H,, H2, and H3 represent the Hamiltonians of the iso- lated molecules and V l2, V23, and V,3 represent the interaction potentials. Assuming V~2 = V23 = V and neglecting the in-
Wave function Energy
1
~ (r + r176 E. + Eo + V
1 CA ~ " ( ~ l a - - ~2a) g a q- g 0 - V
1 = _
1 Ca § = ~ ' (~,. + ('J2)r + G~)
1 r = g" ( - r + (x/5)r ~3.)
Ea + 2Eo
Ea + 2Eo + (xc/'2)V
Ea + 2Eo - (V/2)V. (6)
Thus, the singly excited states (two for the dimer, three for the trimer) no longer have the same energy. Instead, their energy levels are split. The absorption frequencies of the tran- sitions are given by the difference in energy between the ex- cited state and the ground state (Eo for the monomer, 2E0 for the dimer, and 3E0 for the trimer), as follows:
224 Cenens and Schoonheydt Clays and Clay Minerals
monomer hv = Ea - E0; dimer hv + = Ea - Eo + Ev and
hu = E a - E o - Ev; trimer hu ~ = Ea - Eo,
hv + = Ea - E0 + ('x/2)Ev, and hv-= E a - E 0 - (v~)Ev .
R E F E R E N C E S
Alvarez, A. (1984) Sepiolite: Properties and uses: Data ac- companying the samples of sepiolite, Tolsa SA, Spain.
Avery, R. G. and Ramsay, J. D. F. (1986) Colloidal prop- erties of synthetic hectorite clay dispersions: J. Colloid In- terface Science 109, 448-454.
Bergmann, K. and O'Konski, C. T. (1963) A spectroscopic study of methylene blue monomer, dimer, and complexes with montmoriUonite: J. Phys. Chem. 67, 2169-2177.
Berlmann, I.B. (1970) On the empirical correlation between nuclear conformation and certain fluorescence and absorp- tion characteristics of aromatic compounds: J. Phys. Chem. 74, 3085-3093.
Braswell, E. (1968) Evidence for the trimerisation in aqueous solutions of methylene blue: J. Phys. Chem. 72, 2477-2483.
Cantor, C. R. and Schimmel, P. R. (1981) Biophysical Chemistry, Part II: Freeman, San Francisco, 846 pp.
Cenens, J., Vliers, D. P., Schoonheydt, R. A., and De Schry- ver, F.C. (1987) Spectroscopic study ofthe surface chem- istry of proflavine on clay minerals: in Proc. Int. Clay Conf., Denver, 1985, L. G. Schultz, H. van Olphen, and F. A. Mumpton, eds., The Clay Minerals Society, Bloomington, Indiana, 352-358.
Cohen, R. and Yariv, S. (1984) Metachromasy in clay min- erals. Sorption of acridine orange by montmorillonite: J. Chem. Soc., Faraday Trans. 1 80, 1705-1715.
Fletcher, J. C. Q. (1984) The acidity of synthetic mica- montmorillonite and its activity for propene oligomeriza- tion: Ph.D. thesis, Dept. Chem. Eng., Univ. Cape Town, Republic of South Africa, 238 pp.
Fornili, S. L., Sgroi, G., and Izzo, V. (1981) Solvent isotope effect in the monomer-dimer equilibrium of methylene blue: J. Chem. Soc., Faraday Trans. 1 77, 3049-3053.
Fripiat, J. J., Letellier, M., and Levitz, P. (1984) Interaction of water with clay surfaces: in Clay Minerals: Their Struc- ture, Behavior and Use, L. Fowden, R. M. Barrer, and P. B. Tinker, eds., The Royal Society, London, 67-79.
Grauer, Z., Avnir, D., and Yariv, S. (1984) Adsorption char- acteristics of rhodamine 6G on montmorillonite and La- ponite, elucidated from electronic absorption and emission spectra: Can. J. Chem. 62, 1889-1894.
Grim, R. E. (1953) Clay Mineralogy: McGraw-Hill, New York, 384 pp.
Handa, T., Ichihashi, C., Yamamoto, I., and Nakagaki, M. (1983) The location and microenvironment of dimerizing cationic dyes in lipid membranes as studied by means of their absorption spectra: Bull. Chem. Soc. Japan 56, 2548- 2554.
Kortum, G. (1969) Reflectance Spectroscopy. Principles, Methods, Applications: Springer-Verlag, Berlin, 366 pp.
Lewis, G. N. and Bigeleisen, J. (1943) Methylene blue and other indicators in general acids. The acidity function: J. Amer. Chem. Soc. 65, 1144-1150.
Maes, A., Schoonheydt, R. A., Cremers, A., and Uytterhoe- ven, J. B. (1980) Spectroscopy of Cu(en)22+ on clay sur- faces. Surface and charge-density effects: J. Phys. Chem. 84, 2795-2799.
Michaelis, L. andGranick, S. (1945) Metachromasyofbasic dyestuffs: J. Amer. Chem. Soc. 67, 1212-1219.
Murrell, J. N. (1971) The Theory of the Electronic Spectra of Organic Molecules: Chapman and Hall, London, 328 pp.
Newman, A. C.D. (1987) The interaction of water with clay mineral surfaces: in Chemistry of Clay and Clay Minerals, A. C. D. Newman, ed., Mineralogical Society, London, 237-274.
Peigneur, P., Maes, A., and Cremers, A. (1975) Heteroge- neity of charge density in montmorillonite as inferred from cobalt adsorption: Clays & Clay Minerals 23, 71-75.
PhamThiHangandBrindley, G.W. (1970) Methylene blue adsorption by clay minerals. Determination of surface areas and cation exchange capacities (Clay-organic studies XVIII): Clays & Clay Minerals 18, 203-212.
Rausell-Colom, J. A. and Serratosa, J. M. (1987) Reactions of clays with organic substances: in Chemistry of Clays and Clay Minerals, A. C. D. Newman, ed., Mineralogical So- ciety, London, 371-422.
Schoonheydt, R. A., Cenens, J., and De Schryver, F. C. (1986) Spectroscopy ofproflavine on clays: J. Chem. Soc., Faraday Trans. 1 82, 281-289.
Schoonheydt, R. A., De Pauw, P., Vliers, D. P., and De Schry- ver, F. C. (1984) Luminescence of Ru(2,2'bipy)32§ in aqueous clay minerals suspensions: J. Phys. Chem. 88, 5113- 5118.
Schubert, M. and Levine, A. (1955) A qualitative theory of metachromasy in solution: J. Amer. Chem. Soc. 77, 4197- 4201.
Taylor, R.K. (1985) Cation exchange in clays and mudrocks by methylene blue: J. Chem. Teeh. Biotechnol. 35A, 195- 207.
Thomas, J. K. (1984) The Chemistry of Excitation at In- terfaces: ACS Monograph 191; American Chemical Society: Washington, D.C., 320 pp.
Thomas, J.K. (1987) Characterization of surfaces by excited states: J. Phys. Chem. 91, 267-276.
van Olphen, H. and Fripiat, J .J . (1979) Data Handbook for Clay Minerals and Other Non -Metallic Minerals: Pergamon Press, New York, 346 pp.
Viaene, K., Cagui, J., Schoonheydt, R. A., and De Schryver, F.C. (1987) Study of the adsorption on clay particles by means of a fluorescent probe: Langmuir 3, 107-111.
West, W. and Pearce, S. (1965) The dimeric state ofcyanine dyes: J. Phys. Chem. 69, 1894-1903.
Wright, A. C., Granquist, W. T., and Kennedy, J. V. (1972) Catalysis by layer lattice silicates. I. The structure and ther- mal modification of a synthetic ammonium dioctahedral clay: J. Catalysis 25, 65-80.
Yariv, S. and Lurie, D. (1971) Metachromasy in clay min- erals. Part I. Sorption of methylene blue by montmorillon- ite: Israel J. Chem. 9, 537-552.
(Received 14 July 1987; accepted 24 December 1987; Ms. 1725)