Vision for Fire and Public Weather Services Digital Products. Douglas C. Young Fire and Public Weather Services Branch Office of Climate, Water, and Weather Services February 9, 2003. Session Outline. Public and Fire Weather Vision for Digital Products - PowerPoint PPT Presentation
28
1 Vision for Fire and Vision for Fire and Public Weather Services Public Weather Services Digital Products Digital Products Douglas C. Young Douglas C. Young Fire and Public Weather Services Branch Fire and Public Weather Services Branch Office of Climate, Water, and Weather Services Office of Climate, Water, and Weather Services February 9, 2003 February 9, 2003
Transcript
1
Vision for Fire and Public Vision for Fire and Public Weather Services Digital Weather Services Digital
ProductsProducts
Douglas C. YoungDouglas C. YoungFire and Public Weather Services BranchFire and Public Weather Services Branch
Office of Climate, Water, and Weather Office of Climate, Water, and Weather ServicesServices
February 9, 2003February 9, 2003
2
Session OutlineSession Outline
• Public and Fire Weather Vision for Digital Public and Fire Weather Vision for Digital ProductsProducts
• General Sensible Weather Elements in NDFDGeneral Sensible Weather Elements in NDFD• Fire Weather Elements in NDFDFire Weather Elements in NDFD• Derived Public and Fire Weather Elements Derived Public and Fire Weather Elements • Graphical Representations of Public and Fire Graphical Representations of Public and Fire
Weather Digital Data Weather Digital Data • Area/Point Forecast Matrices Area/Point Forecast Matrices • Experimental Web-based Interactive ForecastsExperimental Web-based Interactive Forecasts• Present and Future Examples of Public and Fire Present and Future Examples of Public and Fire
Public and Fire Weather Public and Fire Weather Services Services
Digital Data VisionDigital Data Vision• Standardized and meteorologically Standardized and meteorologically
consistent suite of products derived from consistent suite of products derived from the National Digital Forecast Database the National Digital Forecast Database
• Comprehensive, current, and high Comprehensive, current, and high resolution digital datasets provided so that resolution digital datasets provided so that private sector can build upon our servicesprivate sector can build upon our services
• Probabilistic products primarily for long Probabilistic products primarily for long duration outlooks, watches, warnings duration outlooks, watches, warnings
• Data allowing integration of forecast Data allowing integration of forecast information with existing GIS datasetsinformation with existing GIS datasets
4
General Sensible Weather General Sensible Weather Elements in NDFDElements in NDFD
• Maximum/Minimum TemperatureMaximum/Minimum Temperature• TemperatureTemperature• DewpointDewpoint• 12-hour Probability of Precipitation12-hour Probability of Precipitation• Sky CoverSky Cover• Wind Speed and DirectionWind Speed and Direction• Weather (type, intensity, Weather (type, intensity,
Fire Weather Fire Weather Elements in NDFD Elements in NDFD
• Max/Min Relative HumidityMax/Min Relative Humidity• Free Air Wind (i.e, ridgetop wind) Free Air Wind (i.e, ridgetop wind)
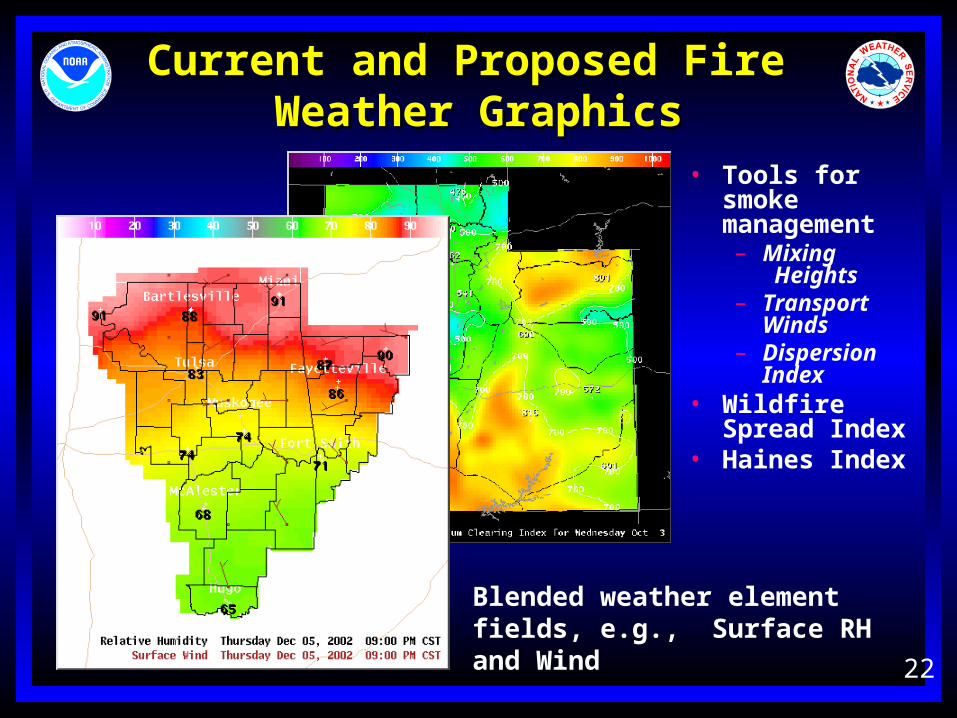
ProposedProposed
• Lightning Activity LevelLightning Activity Level• Mixing Height or StabilityMixing Height or Stability• Transport WindTransport Wind• Haines IndexHaines Index
6
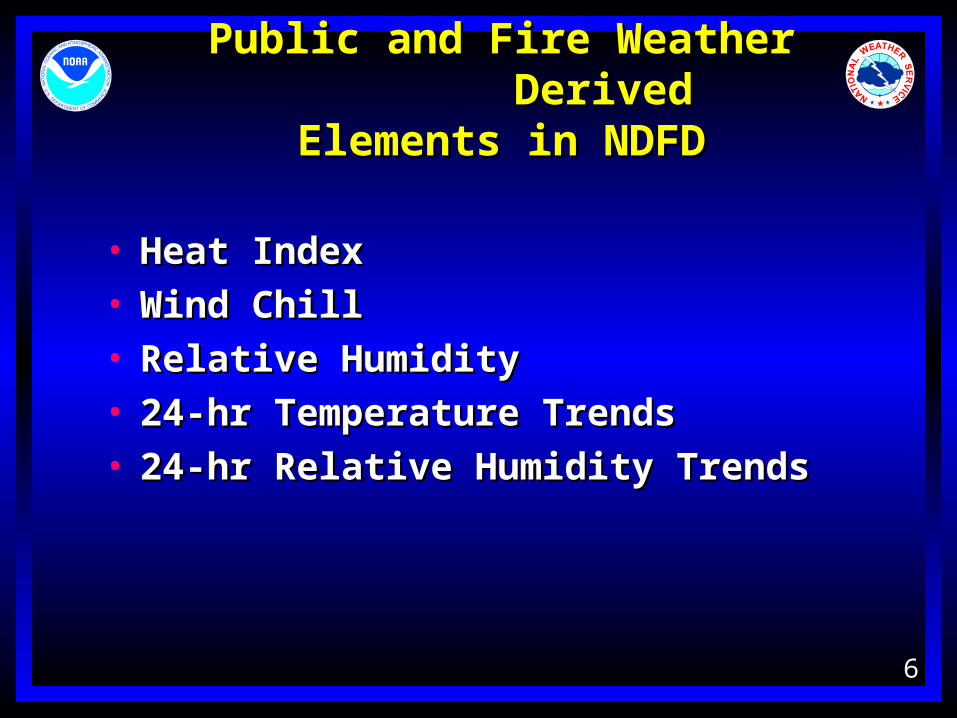
Public and Fire Weather Public and Fire Weather Derived Elements in Derived Elements in
Quantitative Precipitation and Quantitative Precipitation and SnowfallSnowfall
• Total amount of Total amount of liquid (in liquid (in hundredths of an hundredths of an inch) during the inch) during the indicated periodindicated period
• Total snowfall (in Total snowfall (in tenths of an inch) tenths of an inch) during the indicated during the indicated periodperiod
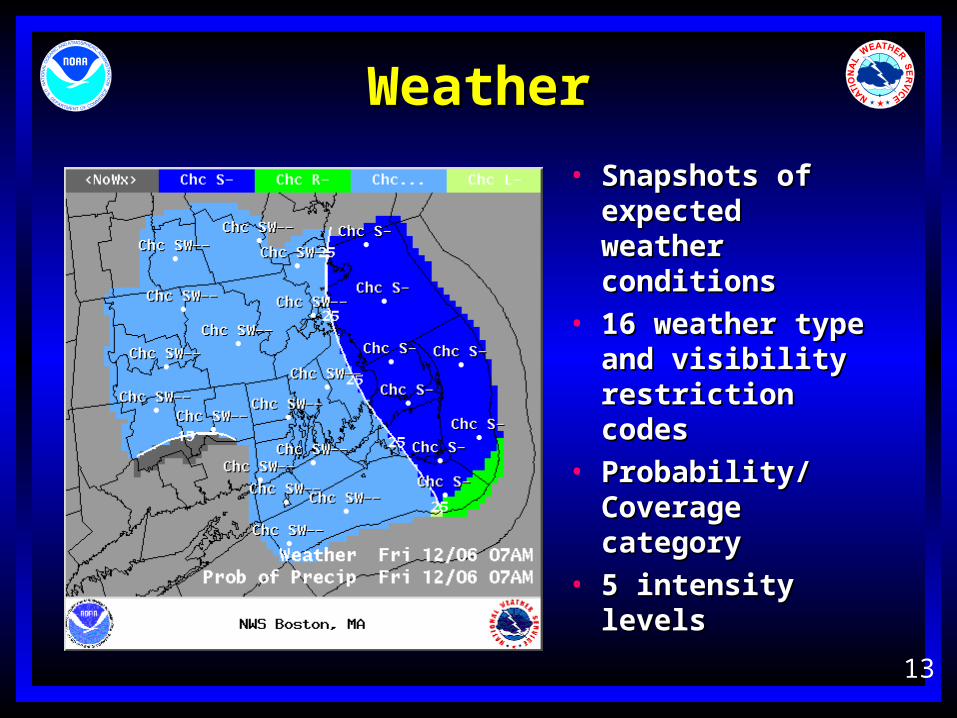
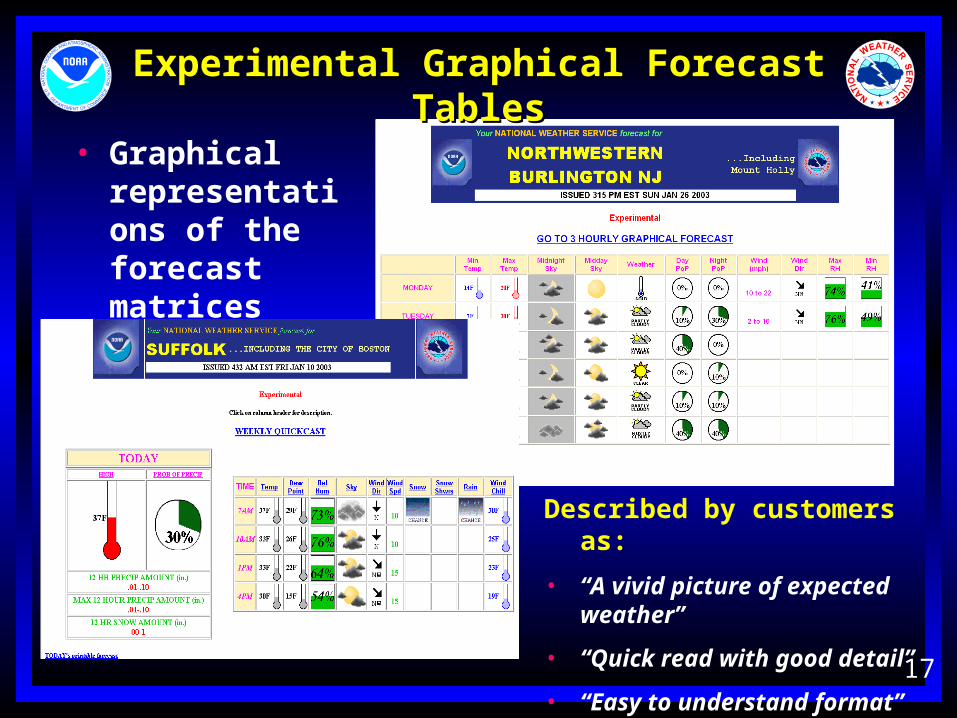
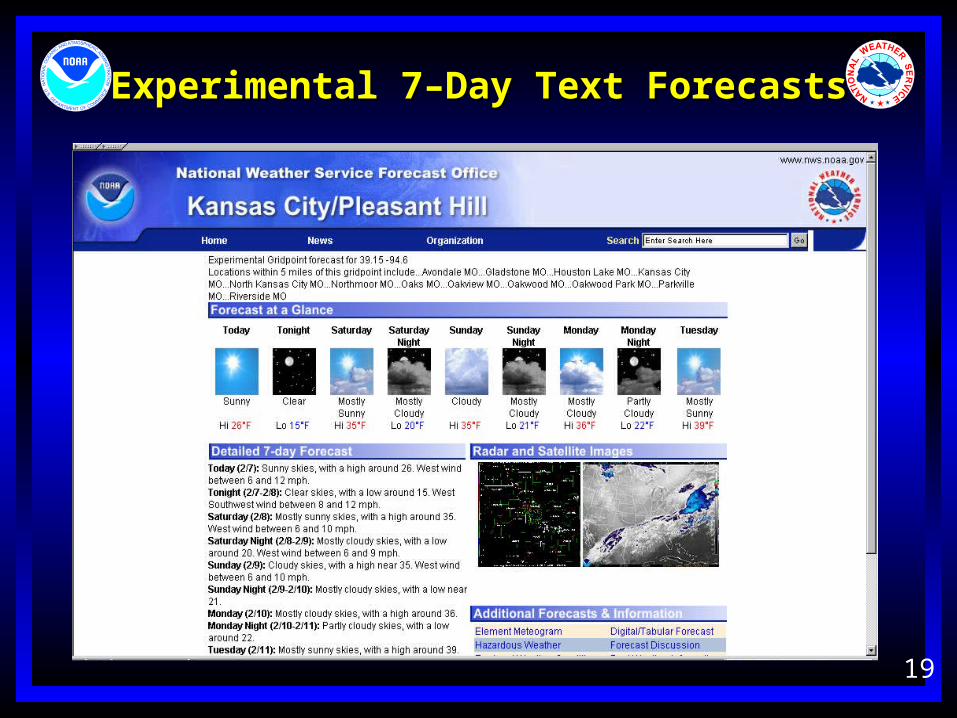
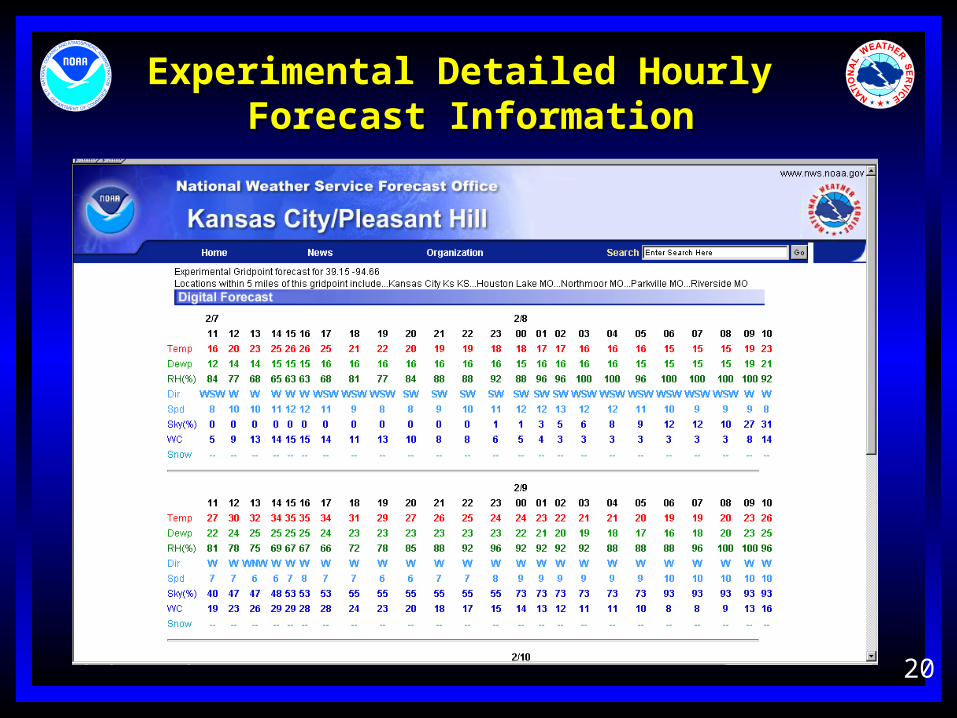
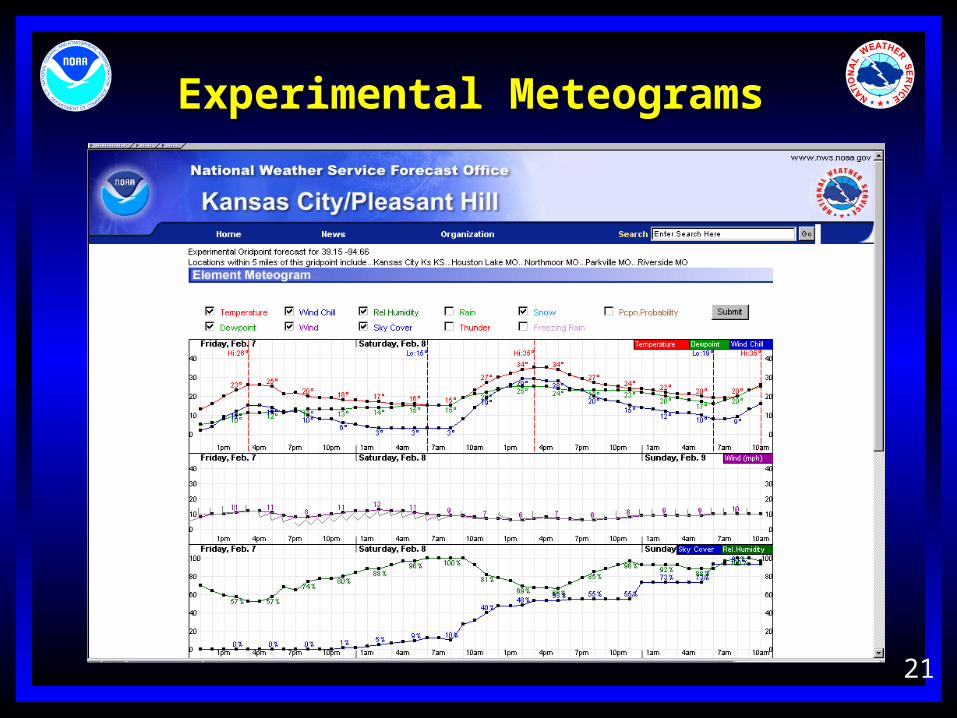
• Tabular displays of various forecasted weather parameters for defined areas (e.g., NWS zones), points, selected cities, climatologically significant locations
• Forecasted parameters available at 3-hour, 6-hour, and/or 12 hour intervals through Day 7
• Useful for visual scanning or Useful for visual scanning or automated retrieval of dataautomated retrieval of data
16
Point Forecast Point Forecast MatricesMatrices
(PFM)(PFM)
POINT FORECAST MATRICES (MND - NWS Product Name)NATIONAL WEATHER SERVICE city state (Issuing Office) 400 AM EST MON FEB 3 2003 (Issuance Time/Date)
stZ###-ddhhmm- (UGC Type: Zone)-(Exp. Time)point location-county st (Loc. in plain language-Cty/Zone Statell.lld lll.lld (Point latitude & longitude)400 AM EST MON FEB 3 2003 (Issuance Time/Date)
MAX/MIN 48 38 53 45 52TEMP 33 39 45 46 45 43 41 39 41 45 49 50 49 49 50 48 46 47 47 49 47DEWPT 15 17 20 22 25 29 33 34 36 38 40 42 42 43 44 44 44 46 46 43 39 RH 47 40 36 38 45 57 72 82 82 76 70 73 76 79 79 85 92 96 96 79 73 WIND DIR NW NW W W SW SW W W S S S S S S SW SW S SE SE SE SE WIND SPD 5 8 8 8 8 8 5 2 10 14 28 36 26 22 10 8 5 2 2 5 8 WIND GUST 22 25 42 56 52 34 20 CLOUDS OV OV OV OV BK BK SC BK BK BK BK BK OV OV OV OV OV OV BK BK BKPOP 12HR 10 10 20 70 50QPF 12HR 0 0 0 .25-.49 .10-.24SNOW 12HR 00-00 00-00 00-00 RAIN S S C L L L C C OBVIS K K F F F F F WIND CHILL 30 30MIN CHILL 24 HIGH WIND A A
DATE THU 02/06/03 FRI 02/07/03 SAT 02/08/03 SUN 02/09/03 UTC 6HRLY 05 11 17 23 05 11 17 23 05 11 17 23 05 11 17 23EST 6HRLY 00 06 12 18 00 06 12 18 00 06 12 18 00 06 12 18 MAX/MIN 35 46 34 41 24 33 18 30TEMP 41 39 44 43 40 36 39 34 29 24 29 26 22 19 28 24 DEWPT 38 36 36 38 37 34 34 32 26 22 21 18 16 16 20 21 PWIND DIR SE S SW NW N N SE SE WIND CHAR LT LT LT LT BZ WY LT LT AVG CLOUDS BK BK OV OV BK BK BK SC FW CL CL CL FW SC SC POP 12HR 10 40 40 20 10 10 40 60RAIN C C C L LRAIN SHWRS SC SC SC
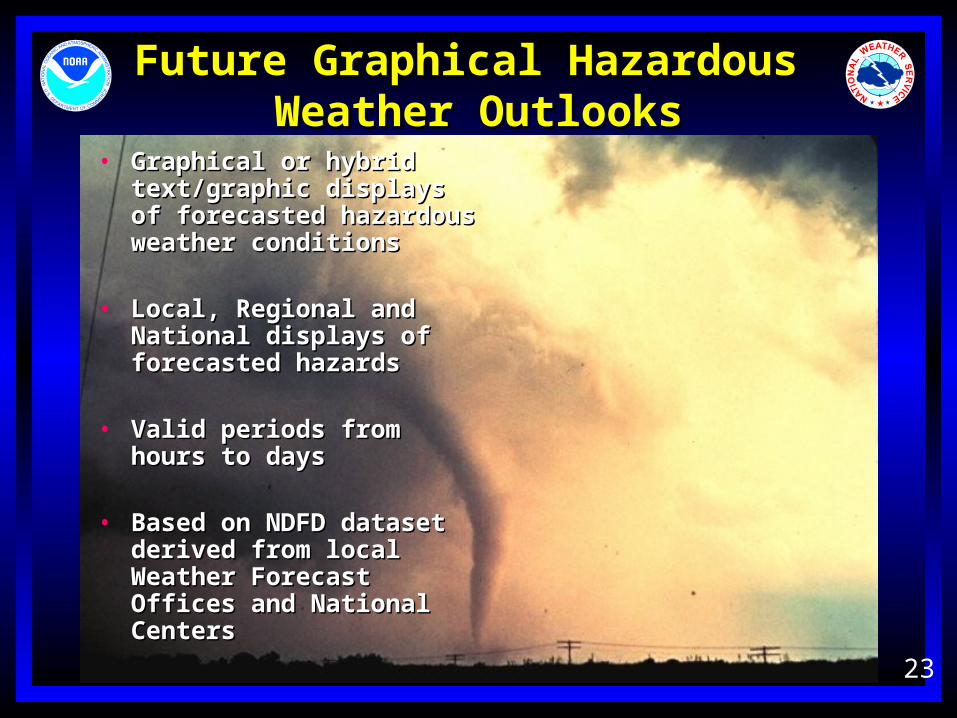
• Graphical or hybrid Graphical or hybrid text/graphic displays text/graphic displays of forecasted of forecasted hazardous weather hazardous weather conditionsconditions
• Local, Regional and Local, Regional and
National displays of National displays of forecasted hazards forecasted hazards
• Valid periods from Valid periods from
hours to dayshours to days
• Based on NDFD Based on NDFD dataset derived from dataset derived from local Weather Forecast local Weather Forecast Offices and National Offices and National CentersCenters
• Thunderstorms and Severe WeatherThunderstorms and Severe Weather• Critical Fire Weather PatternsCritical Fire Weather Patterns• Long Duration Outlooks/Watches/WarningsLong Duration Outlooks/Watches/Warnings• Public and Fire Weather Elements (e.g., precipitation Public and Fire Weather Elements (e.g., precipitation
type/intensity, QPF/coverage of weather, clouds, type/intensity, QPF/coverage of weather, clouds, visibility, lightning, volcanic ash) visibility, lightning, volcanic ash)
25
Expansion of GIS-based ProductsExpansion of GIS-based Products
Mock-up of a GIS-based Severe Thunderstorm Warning
26
Grid-based Forecasts Derived Grid-based Forecasts Derived for for
Geographic AreasGeographic Areas • Digital data Digital data
generated in generated in tailored formats tailored formats (e.g., graphical, (e.g., graphical, text, tabular, or text, tabular, or hybrid hybrid products)products)
• User-defined User-defined areal forecasts areal forecasts (e.g., radio (e.g., radio broadcast and broadcast and metropolitan metropolitan areas)areas)
U.S. Metropolitan Areas
27
SummarySummary
• Public and Fire Weather Digital Data Public and Fire Weather Digital Data derived from singular source—derived from singular source—meteorologically consistent and current meteorologically consistent and current
• Variety of formats (Gridded, Tabular, Variety of formats (Gridded, Tabular, Text Graphical, Graphic/Text Hybrids) to Text Graphical, Graphic/Text Hybrids) to meet customer and partner needsmeet customer and partner needs
• Probabilistic and GIS-compatible formatsProbabilistic and GIS-compatible formats• NWS will work with the private sector NWS will work with the private sector
and academia to translate public and fire and academia to translate public and fire weather digital data into improved weather digital data into improved products and services for America.products and services for America.