247
ANNUAL REPORT 2016
| Date post: | 09-Mar-2018 |
| Category: |
Documents |
| Upload: | truonghanh |
| View: | 217 times |
| Download: | 3 times |

ANNUAL REPORT 2016

VisionTo be an integrated financial services group
that consistently meets our customers’ needs
CorporateIntroduction 02Five Year Group Financial Highlights 04Simplified Group Statements of Financial Position 06Group Quarterly Financial Performance 07Segmental Information 08Hong Leong Financial Group Share Price 09Financial Calendar 10Significant Milestones 12Awards and Accolades 14Chairman’s Statement 16President & CEO’s Review 22Corporate Social Responsibility 28Corporate Information 34Board of Directors 36Key Senior Management 39Board Audit and Risk Management Committee Report 41Corporate Governance, Risk Management & Internal Control 44
FINaNCIaLSDirectors’ Report 57Statements of Financial Position 67Statements of Income 69Statements of Comprehensive Income 70Statements of Changes in Equity 71Consolidated Statements of Cash Flows 74Company Statements of Cash Flows 77Summary of Significant Accounting Policies 79Notes to the Financial Statements 104Statement by Directors 224Statutory Declaration 224Independent Auditors’ Report 225
aDDItIoNaL INForMatIoNNotice of Annual General Meeting 227Statement Accompanying Notice of Annual General Meeting 230Other Information 231• Form of Proxy
Contents
HONG LEONG FINANCIAL GROUP BERHAD ANNUAL REPORT 20162
INtroDUCtIoN
Hong Leong Financial Group Berhad, the holding company for Hong Leong Group’s banking and financial services, has advanced through the years guided by focused business strategies supported by strong management and financial discipline.
Hong Leong Financial Group Berhad’s (“HLFG” or “the Group”) integrated suite of conventional and Islamic financial products and services enables it to reach out and connect with its customers not only in Malaysia, but throughout the region.
Through Hong Leong Bank Berhad (“HLB”), the Group provides comprehensive offerings in personal financial services, business banking, treasury, transaction banking, and wealth management. With an extensive distribution network of approximately 300 branches and over 1,400 self-service terminals throughout Malaysia, HLB is well positioned to offer effective, sound and responsible financial solutions to Malaysians from all walks of life.
HLB’s regional footprint is marked by branches in Singapore and Hong Kong, wholly owned subsidiaries in Vietnam and Cambodia, as well as a representative office in Nanjing. Additionally, HLB has a 20% shareholding in the Bank of Chengdu Co., Ltd., in China and is also a joint venture partner with the Bank of Chengdu in operating a licensed consumer finance company in central and Western China.
Islamic banking and wealth management services are offered through Hong Leong Islamic Bank Berhad (“HLISB”), a full-fledged Islamic bank and wholly-owned subsidiary of HLB. By leveraging on HLB’s extensive network, as well as its own dedicated branches, HLISB provides easy access to customers seeking Shariah compliant alternatives to conventional banking products and services. A full suite of products on offer include investment banking, business banking, personal financial services and wealth management, the delivery of which encapsulates the tenets and principles of Shariah Law.
HL Bank Singapore (“HLBS”) transitioned from a pure private banking institution and has successfully extended its services to include consumer financing following its business transformation initiated two years ago. HLBS has today become a preferred banker within the health banking and auto financing niches in the country with a significant market share.

3Corporate / Financials / Additional Information
INtroDUCtIoN
HLA Holdings Sdn Bhd (“HLAH”) is the insurance holding company of the Group. HLAH’s subsidiary Hong Leong Assurance Berhad (“HLA”) is one of the country’s fastest growing life insurers and is also a leading Malaysian insurance company backed by a strong and competent agency force nationwide. To expand its influence, HLA merged its general insurance business with that of MSIG Insurance (Malaysia) Bhd in a strategic partnership. Today, General and Family Takaful is provided through Hong Leong MSIG Takaful Berhad. HLAH is also present in Hong Kong and Singapore through its subsidiaries, Hong Leong Insurance (Asia) Limited and HL Assurance Pte Ltd.
In addition to banking and insurance, HLFG provides stock broking, investment banking, capital market and fund management
services through Hong Leong Capital Berhad (“HLCB”) Group. Hong Leong Investment Bank Berhad, a subsidiary of HLCB, offers relevant and effective solutions to institutional clients seeking to generate value, access capital markets, as well as utilise innovative trading products and services across treasury, equities, derivatives and foreign exchange. Another key subsidiary, Hong Leong Asset Management Berhad (“HLAM”), was the result of a merger between HLG Unit Trust Berhad, a pioneer in the Malaysian unit trust industry, and HLG Asset Management Sdn Bhd. Today, HLAM offers a comprehensive range of managed solutions across equity and debt asset classes, along with efficient customer support and communications, to help its customers achieve superior long-term risk-adjusted returns.

HONG LEONG FINANCIAL GROUP BERHAD ANNUAL REPORT 20164
FIve Year GroUp FINaNCIaL HIGHLIGHtS
2012 2013 2014 2015 2016the Group rM’Million rM’Million rM’Million rM’Million rM’Million
Statements of Financial positionTotal assets 170,286 180,473 190,177 202,441 210,475 Net loans 89,513 96,275 103,665 113,112 120,445 Total liabilities 157,004 165,468 173,172 182,976 187,297 Deposits from customers 123,217 123,959 130,632 140,955 149,491 Shareholders' funds 8,899 10,076 11,474 13,111 15,341 Commitments and contingencies 154,326 167,126 199,881 157,622 159,473
Statements of IncomeRevenue 4,158 4,379 4,549 4,491 4,543 Profit before tax 2,394 2,630 3,009 3,023 2,565 Net profit 1,853 2,165 2,517 2,460 2,064 Profit attributable to owners of the parent 1,234 1,488 1,707 1,621 1,359
Key performance IndicatorsShare price (RM) 12.24 14.46 16.14 15.16 14.68 Book value per share (RM) 8.56 9.66 10.95 12.48 13.42 Basic earnings per share (sen) 118.6 142.7 162.9 154.3 123.2 Net dividend per share (sen) 25.0 36.0 38.0 38.0 38.0
Financial ratios (%)profitability ratiosReturn on equity 14.7% 15.7% 15.8% 13.2% 9.6%Return on average assets 0.8% 0.8% 0.9% 0.8% 0.7%Cost/income ratio 50.4% 46.5% 43.2% 44.5% 50.3%*
asset Quality/Loan ratiosGross loans to deposits ratio 74.3% 79.1% 80.6% 81.2% 81.3%Gross impaired loans ratio 1.7% 1.4% 1.2% 0.8% 0.8%
* Including HLB’s MSS expense. Excluding HLB’s MSS expense, cost/income ratio is 46.5%

5Corporate / Financials / Additional Information
FIve Year GroUp FINaNCIaL HIGHLIGHtSFive year performance chart (% growth)
Group total assets (RM’Million)
YoY +4.0%CaGr = 6.2%
‘12
170,
286
‘13
180,
473
‘14
190,
177
‘1520
2,44
1‘16
210,
475
Group profit before tax (RM’Million)
YoY -15.2%CaGr = 1.1%
‘13 ‘14 ‘15 ‘16‘12
2,39
4
3,00
9
3,02
3
2,63
0
2,56
5
Group Book value per Share (RM)
‘13 ‘14 ‘15 ‘16‘12
13.9
1
8.56
9.66
10.9
5
12.4
8
YoY +11.4%CaGr = 12.9 %
Group earnings per Share (Sen)
‘13 ‘14 ‘15 ‘16‘12
YoY -20.2%
142.
7
162.
9
154.
3
123.
2
118.
6Group profit attributable to owners of the parent (RM’Million)
‘13 ‘14 ‘15 ‘16‘12
YoY -16.2%CaGr = -4.1%
1,23
4
1,48
8
1,70
7
1,62
1
1,35
9
Group return on equity (%)
‘16
9.6
‘14
15.8
‘12
14.7
YoY -27.6%
‘1315
.7
‘15
13.2

HONG LEONG FINANCIAL GROUP BERHAD ANNUAL REPORT 20166
SIMpLIFIeD GroUp StateMeNtS oF FINaNCIaL poSItIoN
assets
a Loans, advances and financingb Cash and short-term fundsc Portfolio of securitiesd Securities purchased under resale agreements
e Deposits and placements with banks and other FIf Statutory deposits with Central Banksg Other assets (including goodwill)
Liabilities & equity
a Deposits from customersb Deposits and placements of banks and other FIc Obligations on securities sold under repurchase agreementsd Borrowings and subordinated obligationse Innovative and Non-Innovative Tier 1 securities
f Insurance fundsg Other liabilitiesh Share capitali Reserves (net of treasury shares for ESOS)j Non-controlling interests
71.0%69.6%
3.7% 3.1%
6.7% 6.0%0.5%0.5%
4.3% 4.8%
5.1%4.7%
0.2% 1.0%
2.9%4.1%
1.7%1.8%
3.9%4.4%
5.7%
57.2%
2.1%1.4%
1.9%
4.5%
27.2%
5.5%
55.9%
1.7%
2.1%
6.0%
4.2%
24.6%
a
a
b
c
de
f g
g
d
e
f
b
c
a
b
c
d
e f
g
h i
j
a
b
c
d
e
f
g
hi
j
20152016
20152016

7Corporate / Financials / Additional Information
GroUp QUarterLY FINaNCIaL perForMaNCe
2016rM’Million Q1 Q2 Q3 Q4 Year
Statements of IncomeRevenue 1,147 1,165 1,025 1,206 4,543 Profit before tax 697 487 592 789 2,565 Net profit 582 396 485 601 2,064 Profit attributable to owners of the parent 387 264 315 393 1,359
Key performance IndicatorsShare price (RM) 13.8 14.0 15.5 14.7 14.7 Book value per share (RM) 13.2 13.1 13.2 13.4 13.4Basic earnings per share (sen) 36.9 24.5 27.6 34.4 123.2 Dividend per share (sen) – 13.0 – 25.0 38.0
2015rM’Million Q1 Q2 Q3 Q4 Year
Statements of IncomeRevenue 1,083 1,143 1,046 1,219 4,491 Profit before tax 747 796 700 780 3,023 Net profit 591 630 549 690 2,460 Profit attributable to owners of the parent 392 425 363 441 1,621
Key performance IndicatorsShare price (RM) 17.0 16.5 17.0 15.2 15.2 Book value per share (RM) 11.3 11.6 12.0 12.5 12.5 Basic earnings per share (sen) 37.4 40.5 34.7 42.0 154.3 Dividend per share (sen) – 13.0 – 25.0 38.0

HONG LEONG FINANCIAL GROUP BERHAD ANNUAL REPORT 20168
SeGMeNtaL INForMatIoN
a Commercial Bankingb Insurancec Investment Bankingd Other Operations/Consolidation Adj
a Commercial Bankingb Insurancec Investment Bankingd Other Operations/Consolidation Adj
operatING reveNUeBy Business Segment
FY2015
7.0% 4.0%90.8%
-1.8%
proFIt BeFore taXBy Business Segment
FY2015
9.5% 2.6%90.8%
-2.9%
FY2016
5.9% 3.8%
-1.7%
92.0%
FY2016
7.7% 2.5%
-3.1%
92.9%
a b c a b c
d d
a b c
d
a b c
d

9Corporate / Financials / Additional Information
Dividend per Share
FY2016 38.0 senFY2015 38.0 sen
YoY SaMe
Share price
FY2016 rM14.68FY2015 RM15.16
YoY -3.2%
Market Capitalisation
FY2016 rM16.8 bilFY2015 RM16.0 bil
YoY 5.0%
earning per Share
FY2016 123.2 senFY2015 154.3 sen
YoY -20.2%
total Shareholder return
FY2016 9.6%FY2015 13.2%
YoY -3.6%
HoNG LeoNG FINaNCIaL GroUp SHare prICe
Hong Leong Financial Group Share price vs Benchmark FBMKLCI%
40
20
0
-20
-40Jun ‘11 Jun ‘12 Jun ‘13 Jun ‘14 Jun ‘15 Jun ‘16Dec‘11 Dec ‘12 Dec ‘13 Dec ‘14 Dec ‘15
HLFG FBMKLCI
Share Price Volume
Hong Leong Financial Group Share price & volume
Shar
e Pr
ice (R
M)
0
20
10
15
5
0MJun ‘11 Jun ‘12 Jun ‘13 Jun ‘14 Jun ‘15 Jun ‘16Dec‘11 Dec ‘12 Dec ‘13 Dec ‘14 Dec ‘15
Volu
me
3.0M
4.0M
2.0M
1.0M

HONG LEONG FINANCIAL GROUP BERHAD ANNUAL REPORT 201610
FINaNCIaL CaLeNDar
entitlement
1 December 2015payment
23 December 2015
Annual General Meeting27 October 2016 (Thursday)47th Annual General Meeting
Notice
17 November 2015
Notice
24 May 2016entitlement
13 June 2016payment
28 June 2016
1st Interim Single-tier Dividend of 13 sen per share
2nd Interim Single-tier Dividend of 25 sen per share
17 NOVEMBER 2015 TUESDAY
unaudited results for 1st quarter ended 30 September 2015
23 FEBRUARY 2016 TUESDAY
unaudited results for 2nd quarter ended31 December 2015
24 MAY 2016 TUESDAY
unaudited results for 3rd quarter ended 31 March 2016
29 AUGUST 2016MONDAY
unaudited results for 4th quarter and financial year ended 30 June 2016
DIvIDeNDS
aNNoUNCeMeNt oF CoNSoLIDateD
reSULtS

11Corporate / Financials / Additional Information
HONG LEONG FINANCIAL GROUP BERHAD ANNUAL REPORT 201612
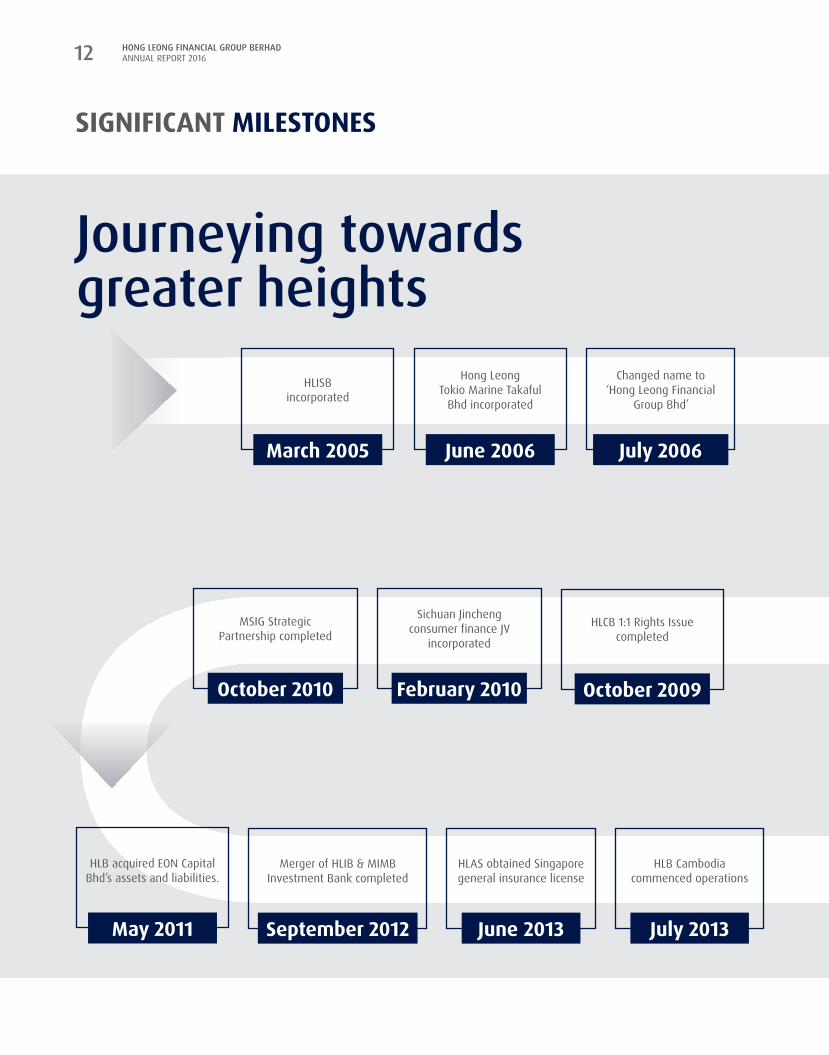
SIGNIFICaNt MILeStoNeS
HLISB incorporated
Hong Leong Tokio Marine Takaful
Bhd incorporated
June 2006
Changed name to ‘Hong Leong Financial
Group Bhd’
July 2006
HLCB 1:1 Rights Issue completed
october 2009
HLAS obtained Singapore general insurance license
June 2013
Sichuan Jincheng consumer finance JV
incorporated
February 2010
HLB Cambodia commenced operations
July 2013
MSIG Strategic Partnership completed
october 2010
HLB acquired EON Capital Bhd’s assets and liabilities.
May 2011
Merger of HLIB & MIMB Investment Bank completed
September 2012
March 2005
Journeying towards greater heights
13Corporate / Financials / Additional Information
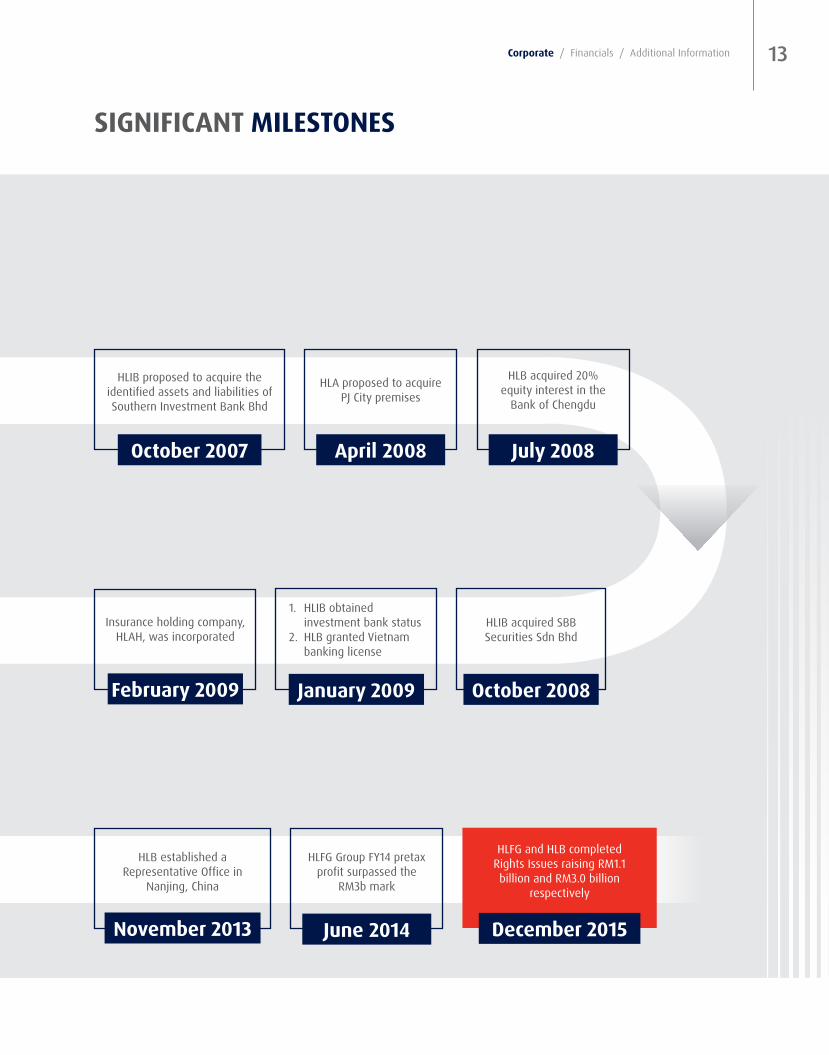
SIGNIFICaNt MILeStoNeS
HLIB proposed to acquire the identified assets and liabilities of Southern Investment Bank Bhd
october 2007
HLB established a Representative Office in
Nanjing, China
November 2013
HLA proposed to acquire PJ City premises
april 2008
HLFG Group FY14 pretax profit surpassed the
RM3b mark
June 2014
HLFG and HLB completed Rights Issues raising RM1.1 billion and RM3.0 billion
respectively
December 2015
HLB acquired 20% equity interest in the
Bank of Chengdu
July 2008
HLIB acquired SBB Securities Sdn Bhd
october 2008
1. HLIB obtained investment bank status
2. HLB granted Vietnam banking license
January 2009
Insurance holding company, HLAH, was incorporated
February 2009

HONG LEONG FINANCIAL GROUP BERHAD ANNUAL REPORT 201614
aWarDS & aCCoLaDeS
HONG LEONG FINANCIAL GROUP BERHAD ANNUAL REPORT 201614
World Brand Congress 2016Hong Leong Islamic Bank BerhadCategory: Most Influential Brand Leaders
the Brandlaureate Brand Icon Leadership awards 2015Hong Leong Islamic Bank BerhadCategory: Transformational Corporate Leader
the asian Banker achievement awards 2015Hong Leong Bank Berhad Category: Best Retail Payment Project
Sahabat Negara SMe award 2015Hong Leong Bank Berhad Category: Recognition Award
Cards & electronic payments International (CepI) asia awards 2015 Hong Leong Bank Berhad Category: Best Credit/Debit Card Product - Asia Pacific
Cards & electronic payments International (CepI) asia awards 2015 Hong Leong Bank Berhad Category: Best Debit Card Offering
the World Islamic Banking Conference 2015 Hong Leong Islamic Bank Berhad
Category: Best Performance Regional - Southeast Asia
the World Islamic Banking Conference 2015Hong Leong Islamic Bank Berhad
Category: Best Performance Country - Malaysia

15Corporate / Financials / Additional Information
aWarDS & aCCoLaDeS
the asset triple a asian awards 2015Hong Leong Bank Berhad Category: Best E-Bank Malaysia
the asset triple a asian awards 2016Hong Leong Investment Bank BerhadCategory: Best Islamic Equity-Linked Deal
the asset triple a asian awards 2016Hong Leong Investment Bank BerhadCategory: Best Securitisation Sukuk
15Corporate / Financials / Additional Information
asia pacific entrepreneurship awards 2015Hong Leong Assurance BerhadCategory: Certificate of Achievement For Outstanding & Exemplary Achievements in Entrepreneurship
raM League awards 2015Hong Leong Investment Bank Berhad
Category: Lead Manager Award 2015
raM League awards 2015Hong Leong Investment Bank Berhad
Category: Lead Manager Award Sukuk 2015
raM League awards 2015Hong Leong Investment Bank Berhad
Category: Blueprint Award 2015 - Structured Finance Landmark Deal RM450million Asset -
backed Sukuk Ijarah Programme
Islamic Finance News award 2015Hong Leong Investment Bank BerhadCategory: Ijarah Deal of The Year
Islamic Finance News award 2015Hong Leong Investment Bank BerhadCategory: Equity & IPO Deal of the year
Islamic Finance News award 2015Hong Leong Investment Bank BerhadCategory: Real Estate Deal of the Year

HONG LEONG FINANCIAL GROUP BERHAD ANNUAL REPORT 201616
CHaIrMaN’S StateMeNt
On behalf of the Board of Directors, I am pleased to present the Annual Report and Audited Financial Statements of Hong Leong Financial Group Berhad (“HLFG” or “the Group”) for the financial year (“FY”) ended 30 June 2016 (“FY16”).
Committed to riseabove challenges

17Corporate / Financials / Additional Information
CHaIrMaN’S StateMeNt
perForMaNCe revIeW
This year has been characterised by a number of adverse financial one-offs that have affected our core operating businesses. The compounding effect of slower economic growth, volatile commodity prices and currencies, and weaker consumer and business sentiment have impacted not just the financial sector, but also a number of other sectors which are important to our economy.
However, despite the challenging economic environment, business momentum within the Group remained intact. Hong Leong Bank Berhad’s (“HLB”) gross loans increased 6.3% year-on-year (“yoy”) to RM121 billion
whilst its customer deposits increased 5.9% yoy to RM149 billion. Hong Leong Assurance Berhad’s (“HLA”) gross premiums grew 7.5% yoy to RM2.79 billion and specifically, its new business regular premiums increased 17.2% yoy to RM540.8 million.
Just as important in these times, the Group’s key balance sheet and risk metrics remain strong. HLB’s gross impaired loan ratio improved to 0.79% whilst its loan impairment coverage remains prudent at 120%. HLB’s liquidity ratio remains conservative with a loan/deposit ratio of 81.2%. In addition, the Group’s capital position was bolstered by the completion of our respective rights issues in December 2015 for HLFG
(raising RM1.1 billion) and HLB (raising RM3 billion).
HLFG Group recorded a pretax profit of RM2,565 million for FY16, representing a decrease of 15.2% yoy from FY15’s RM3,023 million. Our financial results were however skewed by a number of non-recurring items this year, the largest of which was the RM172 million charge booked by HLB in relation to their Mutual Separation Scheme (“MSS”). If we were to strip out all the HLB and HLA non-recurring items from FY15 and FY16’s pretax profit, the ‘normalised’ HLFG Group pretax profit would amount to RM2,874 million, representing an improvement of 0.5% yoy over FY15’s normalised pretax profit of RM2,859 million.
However, despite the challenging economic environment, business momentum within the Group remained intact.

HONG LEONG FINANCIAL GROUP BERHAD ANNUAL REPORT 201618
We continue to build shareholders’ equity. Group Shareholders’ Equity grew by 17.0% yoy to RM15.34 billion.
CHaIrMaN’S StateMeNt
Profit Attributable to Owners of the Parent decreased by 16.2% yoy to RM1,359 million. Earnings per share decreased by a larger quantum of 20.2% yoy from 154.3 sen in FY15 to 123.2 sen in FY16, as our share base has increased pursuant to the completion of our 9-for-100 Rights Issue in December 2015.
We continue to build shareholders’ equity. Group Shareholders’ Equity grew by 17.0% yoy to RM15.34 billion as at 30 June 2016. Net assets per share rose from RM12.48 as at 30 June 2015 to RM13.42 as at 30 June 2016, despite the dilution which accompanied our Rights Issue. On a positive note, we have maintained our dividend per share at 38 sen in FY16 as we believe our fundamental franchise strength and long term plans remain sound and in place.
BaNKING
The Banking Division of the Group under HLB registered a profit before taxation of RM2,382 million for the financial year ended 30 June 2016 as compared to RM2,746 million in the previous year, reflecting a decrease of 13.3% yoy. If we were to strip out a number of non-recurring items, HLB’s normalised profit before taxation would be RM2,614 million, representing an increase of 1.9% yoy.
The main contributing factors to the normalised profit growth were:
• Higher non-interest income, which grew by RM175.3 million yoy, mainly due to higher forex gains.
• Higher Islamic Banking income, which grew by RM47.7 million yoy.
19Corporate / Financials / Additional Information
CHaIrMaN’S StateMeNt
Core business performance indicators remained positive, with gross loans growing by 6.3% yoy to RM121 billion as at 30 June 2016. Residential mortgages increased 13.7% yoy to RM51.5 billion. Loans to SMEs continued to grow at a healthy pace, increasing 8.2% yoy to RM19.2 billion. Customer deposits increased by 5.9% yoy to RM149 billion as at 30 June 2016, achieved amidst an increasingly competitive environment for deposits. This translates to a Loan/Deposit (“L/D”) ratio of 81.2%, which places HLB in a comfortable position against an industry backdrop of much higher L/D ratios.
Cost/Income ratio excluding MSS cost was 45.8% in FY16, at the lower end of the industry range. The positive effects of the MSS exercise have begun to show
in HLB’s cost structure in the second half of FY16.
Although economic growth has slowed, we have managed to improve our asset quality. Gross impaired loan ratio improved from 0.84% as at 30 June 2015 to 0.79% as at 30 June 2016. Loan impairment coverage remains ample at 120% as at 30 June 2016.
HLB’s capital position remained robust, especially after the recent completion of HLB’s RM3 billion Rights Issue, with Common Equity Tier 1, Tier 1 and Total Capital Ratios at 12.7%, 13.1% and 14.7% respectively as at 30 June 2016. HLB completed its Rights Issue, raising RM3 billion in December 2015, and this will position us well for the full implementation of the Basel lll capital adequacy framework in 2019.
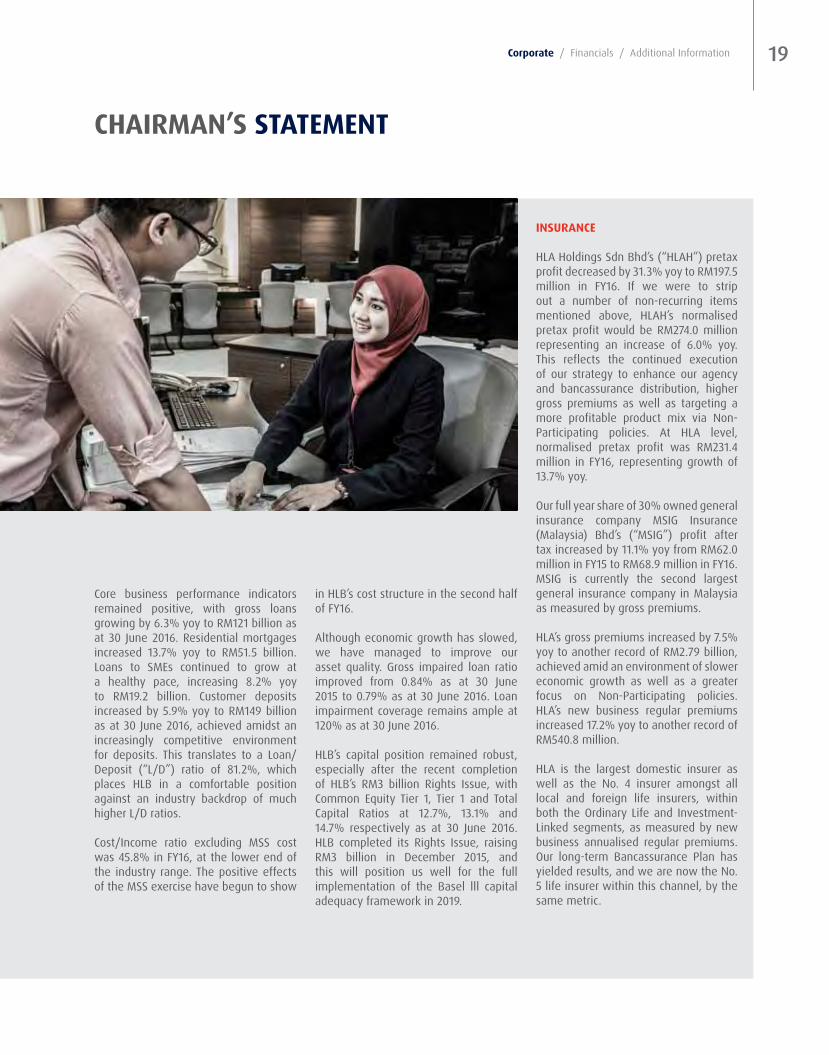
INSUraNCe
HLA Holdings Sdn Bhd’s (“HLAH”) pretax profit decreased by 31.3% yoy to RM197.5 million in FY16. If we were to strip out a number of non-recurring items mentioned above, HLAH’s normalised pretax profit would be RM274.0 million representing an increase of 6.0% yoy. This reflects the continued execution of our strategy to enhance our agency and bancassurance distribution, higher gross premiums as well as targeting a more profitable product mix via Non-Participating policies. At HLA level, normalised pretax profit was RM231.4 million in FY16, representing growth of 13.7% yoy.
Our full year share of 30% owned general insurance company MSIG Insurance (Malaysia) Bhd’s (“MSIG”) profit after tax increased by 11.1% yoy from RM62.0 million in FY15 to RM68.9 million in FY16. MSIG is currently the second largest general insurance company in Malaysia as measured by gross premiums.
HLA’s gross premiums increased by 7.5% yoy to another record of RM2.79 billion, achieved amid an environment of slower economic growth as well as a greater focus on Non-Participating policies. HLA’s new business regular premiums increased 17.2% yoy to another record of RM540.8 million.
HLA is the largest domestic insurer as well as the No. 4 insurer amongst all local and foreign life insurers, within both the Ordinary Life and Investment-Linked segments, as measured by new business annualised regular premiums. Our long-term Bancassurance Plan has yielded results, and we are now the No. 5 life insurer within this channel, by the same metric.

HONG LEONG FINANCIAL GROUP BERHAD ANNUAL REPORT 201620
CHaIrMaN’S StateMeNt
I also wish to share that Bank Negara Malaysia has, via its letters dated 23 and 29 June 2016, stated that it has no objection for HLFG and its wholly owned subsidiary, HLAH, to commence negotiations with certain parties for the possible acquisition by them of HLAH’s 70% equity interest in HLA and 65% equity interest in Hong Leong MSIG Takaful Berhad, subject to the negotiations being concluded within 6 months from 23 June 2016. We will keep you informed as needed on this matter.
HLA has also been awarded the prestigious Domestic Life Insurer of the Year by Asian Banking and Finance’s inaugural Insurance Asia Awards 2016. HLA is the first insurance company to be awarded the Domestic Life Insurer of the Year in Malaysia. This is an affirmation of all the hard work that the management team and staff have put in over the last ten years.
INveStMeNt BaNKING
Our Investment Banking Division under Hong Leong Capital Berhad witnessed a decrease in pretax profit of 17.8% yoy from RM78.5 million in FY15 to RM64.5 million. This was due to lower investment banking and stockbroking contribution, partially offset by a higher asset management contribution. Our asset management business achieved a turnaround this year although pretax contribution at RM2.2 million remains modest.
...an affirmation of all the hard work that the management team and staff have put in over the last ten years.

21Corporate / Financials / Additional Information
CHaIrMaN’S StateMeNt
proSpeCtS
FY16 was a challenging year in which our results were lower due to a slower economic environment and where we took a number of one-off charges against our profit and loss statement. In this respect, we are cautiously optimistic that growth in our earnings base will resume next year.
The completion of HLB’s MSS during the year has enabled us to right size our cost structure, in tandem with present economic conditions. We will invest some of the cost savings into digital initiatives, in line with our digital roadmap to keep the Group technologically relevant.
DIvIDeNDS
The Board of Directors, during the financial year under review had declared and paid a total net dividend per share of 38.0 sen, similar to last year’s payout.
This comprised:
• 1st interim single-tier dividend of 13.0 sen per share paid on 23 December 2015.
• 2nd interim single-tier dividend of 25.0 sen per share paid on 28 June 2016.
As with last year, the Board has decided not to recommend a final dividend for the financial year ended 30 June 2016.
appreCIatIoN
I would like to take this opportunity to express my appreciation and gratitude to the Board of Directors, management and staff of HLFG Group for their dedication and commitment. My sincere appreciation also goes out to our regulators, shareholders, customers and business partners.
QUeK LeNG CHaNChairman15 September 2016

HONG LEONG FINANCIAL GROUP BERHAD ANNUAL REPORT 201622
BUSINeSS MoMeNtUM reMaINS StroNG
Despite a challenging economic environment, we continued to grow the core business indicators within the Group. Some highlights are as follows:
• Hong Leong Bank Berhad’s (“HLB”) gross loans increased 6.3% year-on-year (“yoy”) to RM121 billion as at 30 June 2016.
• HLB’s customer deposits increased 5.9% yoy to RM149 billion.
• Hong Leong Assurance Bhd’s (“HLA”) gross premiums grew 7.5% yoy to another record of RM2.79 billion in FY16.
• HLA’s new business regular premiums increased 17.2% yoy to another record of RM540.8 million in FY16.
StreNGtH IN aDverSItY
Our Group’s risk performance indicators remained strong due to our business philosophy and approach. To note:
• HLB’s gross impaired loan ratio improved to 0.79% and its loan impairment coverage remains prudent at 120% as at 30 June 2016.
• HLB’s liquidity ratio remains conservative with a loan/deposit ratio of 81.2% as at 30 June 2016.
• Our Group’s capital positions were bolstered by the completion of our respective rights issues in December 2015 for HLFG (raising RM1.1 billion) and HLB (raising RM3 billion).
preSIDeNt & Ceo’S revIeW
We are pleased to present the President & CEO’s Review for the financial year (“FY”) ended 30 June 2016 (“FY16”). In this report, we would like to provide an update on where we are today and our plans moving forward.
A resilientUnderlyingPerformance

23Corporate / Financials / Additional Information
preSIDeNt & Ceo’S revIeW
FINaNCIaL revIeW
At the Group level, HLFG recorded a pretax profit of RM2,565 million for FY16, representing a decrease of 15.2% yoy from FY15’s RM3,023 million. Our financial results were however, skewed by a number of non-recurring items this year, the largest of which was the RM172 million charge booked by HLB in relation to their Mutual Separation Scheme (“MSS”). If we were to strip out all the HLB and HLA non-recurring items from FY15 and FY16’s pretax profit, the ‘normalised’ HLFG Group pretax profit would amount to RM2,874 million, representing an improvement of 0.5% y-o-y.
Profit Attributable to Owners of the Parent decreased by 16.2% yoy to RM1,359 million in FY16. Earnings per share decreased by a larger quantum of 20.2% yoy from 154.3 sen in FY15 to 123.2 sen in FY16, as our share base has increased pursuant to the completion of our Rights Issue in December 2015.
Net assets per share rose from RM12.48 as at 30 June 2015 to RM13.42 as at 30 June 2016, despite the dilution which accompanied our Rights Issue. On a positive note, we have maintained our dividend per share at 38 sen in FY16 as we believe our fundamental franchise strength and long-term plans remain sound and in place.
BUSINeSS aND operatIoNaL revIeW
We are pleased to report that we continue to make good progress in terms of growing our core businesses under the Group. For the financial year just ended, the salient points of our achievements are as detailed below.
BaNKING
• HLB’s profit before taxation decreased by 13.3% yoy to RM2,382 million in FY16 due to the MSS charge as well as a number of other non-recurring items. Excluding these non-recurring items, HLB’s normalised profit before taxation would be RM2,614 million, representing an increase of 1.9% yoy.
• HLB’s non-interest income expanded 25.0% yoy (after excluding the one-off gain on the sale of a building last year) to RM1,103 million for FY16, mainly due to improved foreign exchange gains, higher transactional fee income as well as higher investment income. Non-interest income ratio for FY16 was higher at 26.4% in FY16 compared to 21.9% in the prior year.
• Excluding the MSS costs, HLB’s operating expenses amounted to RM1,915 million with business as usual cost-to-income ratio of 45.8% for FY16, amidst higher personnel costs as well as increased costs arising from the government’s GST implementation.
• Loans to the retail segment expanded by 7.8% yoy in FY16, outpacing industry growth and contributed 69% of HLB’s total loans. Residential mortgages maintained its growth momentum with a strong 13.7% yoy expansion to RM51.5 billion in FY16, ahead of industry growth. Transport vehicle loans grew 2.4% yoy to RM18.4 billion whilst personal loans continued their growth trajectory with a 9.6% yoy expansion.
HONG LEONG FINANCIAL GROUP BERHAD ANNUAL REPORT 201624
preSIDeNt & Ceo’S revIeW
• Loans and financing to SMEs registered healthy growth of 8.2% yoy to RM19.2 billion in FY16 and comprised 15.9% of the loan base.
• HLB continues to maintain a prudent liquidity position with a loans-to-deposits ratio of 81.2% as at 30 June 2016.
• Customer deposits expanded 5.9% yoy to RM149 billion as at 30 June 2016 with a CASA ratio of 25.0%, similar to last year. HLB’s stable funding base was supported by an individual deposits mix ratio of 54.8% as at 30 June 2016, amongst the highest within the industry. This may be attributable to HLB’s strong retail franchise.
• HLB’s key asset quality metrics continued to be amongst the best in the industry as its gross impaired loan ratio improved further to a record low of 0.79% whilst the loan impairment coverage ratio stood at a prudent 120% as at 30 June 2016.
• In December 2015, HLB successfully raised RM3 billion via a Rights Issue, as part of our proactive capital management strategy to support continuous business growth whilst ensuring that we are well-positioned to meet and comply with continuing regulatory requirements under the Basel III capital framework. The Rights Issue was over-subscribed by 19%, reflecting our shareholders’ strong confidence in our future prospects.
• HLB’s capital position was strengthened by the Rights Issue, with Common Equity Tier 1, Tier 1 and Total Capital Ratios standing at 12.7%, 13.1% and 14.7% respectively as at 30 June 2016.

25Corporate / Financials / Additional Information
preSIDeNt & Ceo’S revIeW
• In recognition of our strong product offerings, service excellence and research capabilities, HLB’s Global Markets was voted one of the Best Domestic FX Providers in Malaysia in Asiamoney’s FX Poll for 2015. We also topped the Asset magazine’s 2016 Benchmark Research for our capabilities in Fixed Income with top three positions in the Local Currency Bond Sales, Bond Research and Investment categories.
• Following the business transformation initiated two years ago, from a pure private banking proposition, HL Bank Singapore (“HLBS”) has extended its services to consumer financing, and has now become a preferred banker within the health banking and auto financing niche in the country with a significant market share. For FY16, HLBS achieved a strong 33% yoy loan growth to RM4.7 billion.
• Since it started operations in 2013, Hong Leong Bank (Cambodia) PLC continued its strong growth achievement via its five branches strategically located across the central Phnom Penh business district. In FY16, deposit growth outperformed loan growth with a remarkable 162% increase to RM449 million whilst loans accelerated 98% yoy to RM526 million.
• Contribution from the Sichuan Jincheng Consumer Finance Limited Company joint venture increased from RM16.4 million in FY15 to RM21.2 million in FY16, up 29.4%
yoy. We are pleased that this joint venture is now contributing decent returns to the Group. Although contribution from this joint venture to the Group is relatively small, we believe that the long-term potential in the consumer finance segment in China is sizeable. Also, the expertise gained in the consumer finance segment is valuable experience for the wider Group.
• On Bridging the Digital divide, the Group is cognisant of the threat as well as the opportunities which technology offers. In recent years, we have continued to strive to remain relevant to our customers with the technology advances made in the financial sector.
• In recognition of HLB’s digital initiatives, the Bank was awarded the ‘Best E-Bank in Malaysia 2015’ by the Asset Digital Enterprise for the development of the Hong Leong Connect on-line banking platform.
• Investments were also made to enhance cross-border technology and seamless branch networking. As a result, cross-border cash withdrawal services at HLB’s ATM machines have been enabled and the Bank’s customers can now make withdrawals at any Hong Leong Bank branch across the region. This and our other efforts were recently acknowledged when we attained top spot for the Best ATM and Kiosk Project in the Technology Innovation Award category at the Asian Banker Achievement Awards 2016.
INSUraNCe
• Our insurance operations under HLA Holdings Sdn Bhd (“HLAH”) recorded a pretax profit of RM197.5 million in FY16, representing a decrease of 31.3% yoy. Again our insurance results had a number of non-recurring items incurred at HLA, which includes equity impairment provisions, changes in actuarial assumptions and lower interest rates, resulting in higher actuarial provisions. Excluding these non-recurring items, HLAH’s normalised profit before taxation would be RM274.0 million, representing an increase of 6.0% yoy.
• HLA’s pretax profit decreased by 33.5% yoy to RM154.8 million in FY16. Excluding the impact of interest rates movements as well as certain other non-recurring items from FY15 and FY16’s pretax profit, HLA’s normalised operating profit increased by 13.7% yoy to RM231.4 million in FY16. This reflects the continued execution of our strategy to enhance the agency and bancassurance distribution channels, higher gross premiums as well as targeting a more profitable product mix via growth in Non Participating/ Investment Linked policies.
• Amid slower economic growth as well as a higher premium base, HLA’s gross premiums grew a respectable 7.5% yoy to another record of RM2.79 billion in FY16.

HONG LEONG FINANCIAL GROUP BERHAD ANNUAL REPORT 201626
preSIDeNt & Ceo’S revIeW
• HLA’s new business regular premiums (“NBRP”) increased 17.2% yoy to RM540.8 million. Over the past 10 years, HLA’s NBRP has recorded a compounded annual growth rate of 23% per annum, a figure that has outperformed the industry’s 8% per annum growth rate achieved in the same period.
• HLA is the largest domestic life insurer and a top 4 insurer among all life insurance companies in Malaysia.
• After making significant headway in growing the volume of our business over the past five years, in recent years we have focused on growing the profitability of new business by improving our “Non-Participating” portion of new business.
• To this end, we have increased our market share of Investment-Linked NBRP by 4.6x in the last 4 years and now hold the No. 4 position in terms of Investment-Linked NBRP with a 9.2% market share.
• We continued to execute our Bancassurance Plan, which aims to leverage off the distribution network of sister company HLB’s circa 300 branches. Over the last 5 years, we have increased our Non-Agency (Bancassurance) market share of NBRP from 4.9% in 2010 to 8.7% in 2015 and now hold the No. 5 position within this distribution segment.
• Within the general insurance segment, HLA holds a 30% equity interest in MSIG Insurance (Malaysia) Bhd (“MSIG”), the No. 2 general insurer within Malaysia by gross premiums. MSIG’s contribution to HLFG’s profit after taxation increased from RM62.0 million in FY15 to RM68.9 million in FY16, up 11.1% yoy.
• We are pleased to have launched our HLA Customer 360 Portal in July 2016. Through this portal, all HLA customers will now have instant and seamless access to their policy information, at their convenience.
• HLA has also been awarded the prestigious Domestic Life Insurer of the Year award by Asian Banking and Finance’s inaugural Insurance Asia Awards 2016, making it the first insurance company in Malaysia to be awarded the Domestic Life Insurer of the Year. This award represents a significant milestone for both HLA as well as the local insurance industry and reinforces HLA’s position as the top domestic life insurer in Malaysia that offers innovative financial solutions to meet the varied needs of the market.
INveStMeNt BaNKING
• Our Investment Banking Division under Hong Leong Capital Bhd had a pretax profit of RM64.5 million in FY16, a decrease of 17.8% yoy. This was mainly due to lower contributions from our investment banking and stockbroking segments arising from slower capital and equity market activities.
• Our asset management business under Hong Leong Asset Management Bhd (“HLAM”) achieved a turnaround this year with a pretax contribution of RM2.2 million. Key for our business has been the drive to improve fund performance over the last few years. HLAM’s assets under management crossed the RM10 billion mark to close at RM11.3 billion as at 30 June 2016.

27Corporate / Financials / Additional Information
preSIDeNt & Ceo’S revIeW
LooKING aHeaD
Despite a subdued global economic environment, increased market volatilities and strong competitive challenges, we will continue to pursue our plans to grow our core businesses of Commercial Banking, Islamic Financial Services, Insurance, Investment Banking, Stock Broking and Asset Management whilst taking appropriate steps to control our expenses. We will also continue to seek suitable acquisition opportunities to complement our financial services group.
HLB will focus on judiciously growing its business within the communities in which it operates, whilst investing in its digitalisation strategy to advance and uplift its customer proposition. HLA will focus on continuing its product strategy and further leverage both its
bancassurance and agency distribution channels. HLA’s planned initiatives will encompass using digital technology to transform our business processes, improve customer experience and provide relevant product solutions for our customers’ evolving protection needs. Our investment banking division will strive towards expanding our market presence and positioning, as well as create more innovative products and solutions.
ratING
We are pleased to announce that the Malaysian Rating Corporation Berhad (“MARC”) in August 2016 affirmed the short-term and long-term credit ratings of HLFG’s Commercial Paper/ Medium Term Notes Programme at AA/MARC-1. The rating outlook is stable.
appreCIatIoN
Last but not least, we would like to take this opportunity to express our gratitude to the Board of Directors for their support and guidance, the management, colleagues and staff throughout the HLFG Group for their dedication and commitment.
Our sincere appreciation also goes out to the regulators, shareholders, customers and business partners as well as to the community we serve for their continued faith and confidence in Hong Leong Financial Group.
taN KoNG KHooNPresident & CEO15 September 2016

HONG LEONG FINANCIAL GROUP BERHAD ANNUAL REPORT 201628
Corporate SoCIaL reSpoNSIBILItY
Enriching lives for abrighter tomorrow

29Corporate / Financials / Additional Information
“As a group, we are committed to empowering the local underserved communities around us by providing them with knowledge and tools to be independent and sustainable, as a catalyst for delivering long-term value to society.”
The Hong Leong Financial Group (“HLFG”) is one of Malaysia’s leading banking and financial services companies. Over the years, we have grown in size and strength through sound and focused business strategies, aided by strong management and financial disciplines against a backdrop of a growing economy. We are also a group that prioritises the communities that we operate within and we believe that, whilst the bottom line is important, our role is to firstly cater to the business needs of these communities. Be it locally or across the geographies where the HLFG group of companies operate, from individuals, to small, medium enterprises (“SMEs”) to multinational (“MNC”) companies, HLFG is committed to ensuring that our group is guided by the core values of the Hong Leong Group (“the Group”) and remain cognisant of our social responsibility. From personal banking, investment services, financial advice, business banking and insurance solutions, we have over the past two decades made Corporate Social Responsibility (“CSR”) an increasingly large part of our identity. We have also taken the necessary steps to integrate sustainable practices into the core of the group’s businesses as we prepare to compete in an increasingly complex environment amidst more stringent regulatory requirements, increasingly sophisticated consumers and rapid technological advancements. As we move towards our long-term goal of embedding sustainability within the Group, let us take a look at the year that has passed to see how we have fared in our CSR journey.
WorKpLaCe As the group continues to grow and expand regionally, we believe it is vital to put in place a work environment where the rights and well-being of each employee is respected. This helps us attract good talent regardless of background. To this end, cross-cultural understanding is key and that is why we have a diversity and inclusion philosophy that is upheld by our Best Work Environment practices. We ensure all applicable laws pertaining to non-discrimination and equal opportunity are complied with and upheld.
Corporate SoCIaL reSpoNSIBILItY

HONG LEONG FINANCIAL GROUP BERHAD ANNUAL REPORT 201630
Corporate SoCIaL reSpoNSIBILItY
eNvIroNMeNt Each year, the group continues to improve on initiatives to minimise its operational impact on the environment. We have been careful with the consumption of resources such as water and energy, as well as having been conscious of reducing waste generation and carbon emissions. In line with the belief that sustainable change starts from within, we continue to build on the existing partnership between Hong Leong Foundation (“HLF”) and Science of Life Systems 247 Sdn Bhd (“SOLS Tech”) in the form of a group wide technology recycling programme called ‘Transform It’. Through ‘Transform It’, employees are invited to donate old electronic devices as a convenient means to recycle their electronic waste responsibly. Since it began in April 2016, a total of 76 usable electronic items have been re-created out of recycled parts. These items are refurbished and then delivered to underserved communities in Peninsular Malaysia. Nationwide, in Hong Leong Bank Berhad (“HLB”) branches, we look to reducing both paper usage and wastage where paper-based products continue to be recycled as part of our ongoing group recycling programme. We estimate that in the past year alone, we have had a savings of RM10,000 in just paper resource consumption.
MarKetpLaCe For many years now, the group has had in place internally generated best practices to ensure the economic sustainability of all its companies, such as: • Financial Management Disciplines which drive excellence in financial management
so that the quality of the business as an ongoing concern is both preserved, enhanced and sustained.
• Enterprise Risk Management structure to ensure that a systematic process and delegation of responsibility are clearly set out to guide management.

31Corporate / Financials / Additional Information
• A code of business conduct and ethics of financial reports, which contains disclosures that are true and fair.
• In choosing its directors, the Group seeks individuals of high integrity, with shareholder orientation and a genuine interest in the respective businesses of the respective companies. The Group also advocates gender equality at work.
CoMMUNItY Concerted efforts that channel direct help to our communities to address their needs are mostly done through HLF, the philanthropic arm of the Hong Leong Group. Incorporated in 1992, HLF is driven by issues that are close to the heart of the Group. HLF expended a total of RM6,834,370 for the financial year ended 30 June 2016 and has the following in place with our Community Partners: I) Community Welfare Programme that addresses the needs of homes, shelters and
community centres.
II) Education focused initiatives that comprise the following• Tertiary Scholarships• Reach Out and Rise Education Development Programme• The Hong Leong Masters Scholarship Programme• After School Care Programme
III) Community Partner Programmes that further the goal of achieving HLF’s mission
and vision including• Employment Development Programme to find good jobs for members of the
community• Welfare Home Transformation Programme to provide better homes for those
in need• Hong Leong Foundation NGO Accelerator Programme to provide a platform
that eases the process of establishing an NGO for different causes HLF’s contributions have benefitted 86 organisations, and brought positive impact directly to 3,430 individuals nationwide.
education remains key The Group sees grassroot initiatives and education as the road to empowering local underserved communities and the key to effecting real change. Recognising that there are gaps of opportunity along the entire spectrum of educational development, HLF has set up a comprehensive programme to empower their scholars, namely in the following forms: enrichment workshops, internships, mentorships, and other support to help the young excel in their formative university years, and beyond. Since 1997, HLF has awarded more than RM28.9 million in scholarships to 909 scholars via its scholarship programmes for diplomas, degrees or masters. During the past financial year, HLF disbursed RM2.5 million in scholarships to benefit 112 underprivileged Malaysian youths.
Corporate SoCIaL reSpoNSIBILItY
HLF’s contributionshave benefitted 86organisations, and
brought positiveimpact directly to3,430 individuals
nationwide.
HONG LEONG FINANCIAL GROUP BERHAD ANNUAL REPORT 201632
Apart from these programmes, the Group also provides opportunities for its employees to participate in activities and causes that they are passionate about, whilst channeling aid to various segments of the community. Along the year, various philanthropic endeavours, big and small, came to life through the concerted efforts of staff from diverse backgrounds across the group; who wanted to come together for a good cause.
Children remain a significant focus for us In demonstrating our focus on children, HLF embarked on an interactive community project involving 30 employee-volunteers from the Group that resulted in a total contribution of RM25,000. The aim of the project was to create a positive environment to cultivate a sense of creativity and imagination among kids from underprivileged homes. At the event, a total of 50 children from five different homes were given the opportunity to ink their thumbprints into original pieces of artwork, as well as to participate in mini workshops encouraging dancing and storytelling.
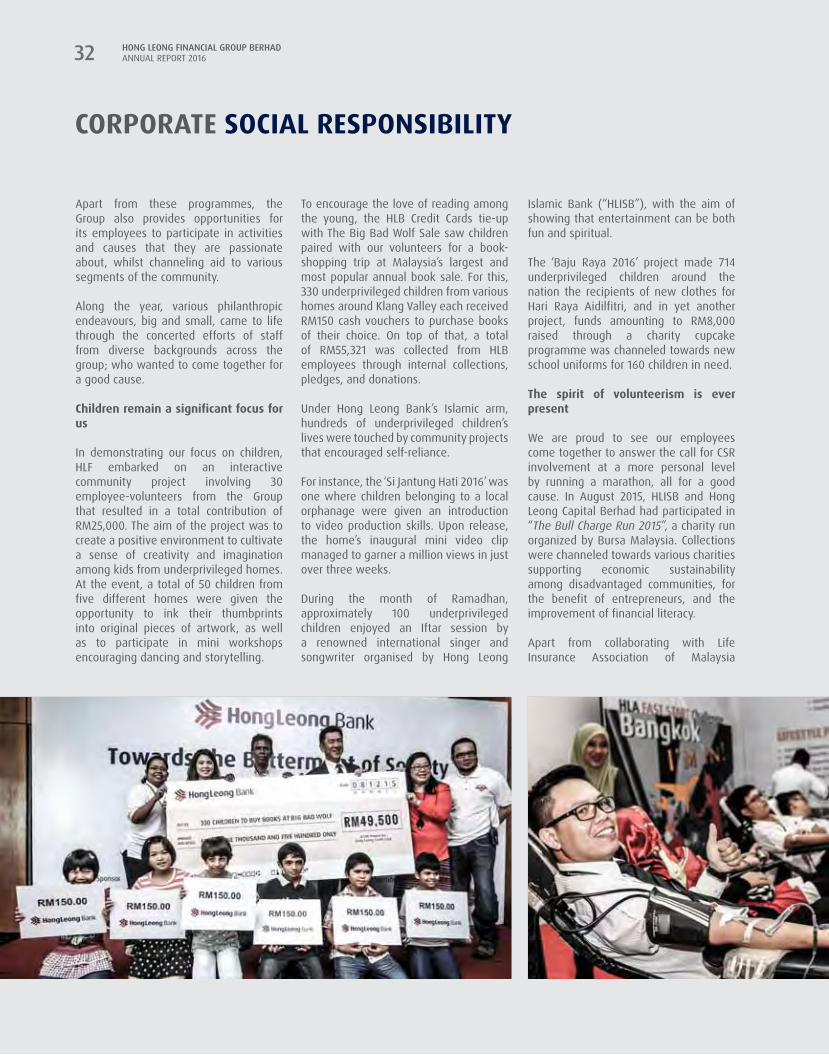
To encourage the love of reading among the young, the HLB Credit Cards tie-up with The Big Bad Wolf Sale saw children paired with our volunteers for a book-shopping trip at Malaysia’s largest and most popular annual book sale. For this, 330 underprivileged children from various homes around Klang Valley each received RM150 cash vouchers to purchase books of their choice. On top of that, a total of RM55,321 was collected from HLB employees through internal collections, pledges, and donations. Under Hong Leong Bank’s Islamic arm, hundreds of underprivileged children’s lives were touched by community projects that encouraged self-reliance. For instance, the ‘Si Jantung Hati 2016’ was one where children belonging to a local orphanage were given an introduction to video production skills. Upon release, the home’s inaugural mini video clip managed to garner a million views in just over three weeks. During the month of Ramadhan, approximately 100 underprivileged children enjoyed an Iftar session by a renowned international singer and songwriter organised by Hong Leong
Corporate SoCIaL reSpoNSIBILItY
HONG LEONG FINANCIAL GROUP BERHAD ANNUAL REPORT 201632
Islamic Bank (“HLISB”), with the aim of showing that entertainment can be both fun and spiritual. The ‘Baju Raya 2016’ project made 714 underprivileged children around the nation the recipients of new clothes for Hari Raya Aidilfitri, and in yet another project, funds amounting to RM8,000 raised through a charity cupcake programme was channeled towards new school uniforms for 160 children in need.
the spirit of volunteerism is ever present We are proud to see our employees come together to answer the call for CSR involvement at a more personal level by running a marathon, all for a good cause. In August 2015, HLISB and Hong Leong Capital Berhad had participated in “The Bull Charge Run 2015”, a charity run organized by Bursa Malaysia. Collections were channeled towards various charities supporting economic sustainability among disadvantaged communities, for the benefit of entrepreneurs, and the improvement of financial literacy. Apart from collaborating with Life Insurance Association of Malaysia

33Corporate / Financials / Additional Information
Corporate SoCIaL reSpoNSIBILItY
(“LIAM”) on blood donation drives, volunteers from HLA had also committed time and manpower to frequent visitation, clean-ups and community service work at selected old folks homes, children shelters, orphanages, and centers for the handicapped. Year-round, volunteers from HLA were involved in 10 separate initiatives under the CSR banner of ‘Do Good’, that focused on improving the same communities in which we serve. Over at HLISB, our staff can be seen volunteering, throughout the year, in established soup kitchens in Kuala Lumpur to provide food and other forms of aid for the homeless and hard-core poor. In addition to that, during the Muslim fasting month approximately 30 volunteers from HLISB Headquarters distributed 1,000 packets of ‘bubur lambuk’ to commuters at selected LRT stations, the headquarters of Polis DiRaja Malaysia, and Bomba. Other HLISB branches followed suit in a nationwide distribution effort to spread the spirit of Ramadhan.
Staying vigilant against forces larger than ourselves Flood victims from the massive 2014 floods that hit the East Coast region of Malaysia continue to be part of the bank’s community welfare focus. To help rebuild their lives, the Bank continued with its post flood rehabilitation initiatives.
We took proactive steps to ensure that aid could be collected and dispatched in a timely and managed manner, should a flood emergency be announced in any of the Malaysian states. With valuable input provided by seasoned volunteers who are continuously and actively involved in flood and other relief activities throughout the country, staff across various companies within the Group were guided on packing a useful mix of essential items with a reasonable shelf life into boxes that can easily be transported for distribution using land, air, or watercraft. Drop-off points and packing tips were formalized and communicated to facilitate contributors should the need arise.
Giving animals a better life Committed to the Group’s approach to social responsibility and betterment of society, animal rights have not been forgotten. The Group embarked on a collaboration with ‘Trap Neuter Release Manage Malaysia’ (“TNRM”) on an initiative that benefitted both the underprivileged community and animals alike. TNRM is an NGO that traps stray cats and dogs, neuters them, and later rehomes them with the objective to effectively and humanely manage stray populations in Malaysia.
A crossfit challenge dubbed STRAYFIT (Stay Fit for Strays) saw a total of 67 participants from across the Hong Leong Group and raised a total of RM14,137 for TNRM’s cause. It was an event that brought together elements of compassion, fund-raising, teamwork, fitness and fun. The crossfit challenge also raised a total of RM35,945 that benefitted 15 NGOs namely PERTIWI, Pusat Jagaan Rumah Kesayangan, Pusat Jagaan Qamara, Majlis Kebajikan dan Pembangunan Masyarakat Selangor, Pertubuhan Jagaan Kanak-Kanak Cacat Setia, Lighthouse Children Welfare, Pusat Kasih Sayang YMCA, Furry Friends Farm, Paws Animal Welfare Society, Fugee School, Rumah Siraman Kasih, Pertubuhan Kebajikan Ephratha Rawang Selangor, National Cancer Society of Malaysia, and Home of Peace and Association for the Mentally Handicapped.
LooKING ForWarD We will build upon and learn from our past CSR contributions and activities. This would naturally lead to higher expectations of ourselves as responsible corporate citizens, while we continue to explore new ideas and new ways of increasing actual and tangible improvements to our communities.
HONG LEONG FINANCIAL GROUP BERHAD ANNUAL REPORT 201634
Corporate INForMatIoN
aUDItorS
YBhg Tan Sri Quek Leng Chan (Chairman)
Ms Lim Tau Kien
Messrs PricewaterhouseCoopersChartered Accountants
Level 10, 1 Sentral Jalan Rakyat
Kuala Lumpur Sentral50470 Kuala Lumpur
Tel: 03-2173 1188 Fax: 03-2173 1288
reGIStereD oFFICe
Mr Saw Kok Wei
YBhg Tan Sri Dato’ Seri Khalid Ahmad bin Sulaiman
Level 8, Wisma Hong Leong18 Jalan Perak
50450 Kuala LumpurTel : 03-2164 8228Fax : 03-2164 2503
DIreCtorS
GroUp CoMpaNY SeCretarY
reGIStrar
WeBSIte
Mr Tan Kong Khoon(President & Chief Executive Officer)
Ms Lim Lean See
Ms Christine Moh Suat Moi MAICSA 7005095
Hong Leong Share Registration Services Sdn Bhd
Level 5, Wisma Hong Leong18 Jalan Perak
50450 Kuala LumpurTel : 03-2164 1818Fax : 03-2164 3703
www.hlfg.com.my

35Corporate / Financials / Additional Information
Corporate INForMatIoN

HONG LEONG FINANCIAL GROUP BERHAD ANNUAL REPORT 201636
BoarD oF DIreCtorS
Leading with vision and integrity

37Corporate / Financials / Additional Information
BoarD oF DIreCtorS
YBHG taN SrI QUeK LeNG CHaNChairman/Non-Executive/Non-IndependentAge 73, Male, Malaysian
YBhg Tan Sri Quek Leng Chan qualified as a Barrister-at-Law from Middle Temple, United Kingdom. He has extensive business experience in various business sectors, including financial services, manufacturing and real estate.
YBhg Tan Sri Quek is the Chairman of Hong Leong Financial Group Berhad (“HLFG”) and was appointed to the Board of Directors (“Board”) of HLFG on 6 September 1968. He is a member of the Remuneration Committee (“RC”) and Nominating Committee (“NC”) of HLFG.
He is the Chairman & Chief Executive Officer of Hong Leong Company (Malaysia) Berhad, a public company; Chairman of Hong Leong Bank Berhad (“HLB”), Hong Leong Capital Berhad (“HLCB”) and GuocoLand (Malaysia) Berhad, companies listed on the Main Market of Bursa Malaysia Securities Berhad (“Bursa Securities”); and Chairman of Hong Leong Assurance Berhad (“HLA”) and Hong Leong Foundation, both are public companies.
Mr taN KoNG KHooNPresident & Chief Executive Officer/Non-IndependentAge 59, Male, Singaporean
Mr Tan Kong Khoon holds a Bachelor of Business Administration degree from Bishop’s University, Canada and is an alumnus of the Harvard Business School Advance Management Program.
Mr Tan is currently the President & Chief Executive Officer of HLFG. He was the Group Managing Director/Chief Executive Officer of HLB from 1 July 2013 to 4 February 2016. Prior to joining HLB, Mr Tan was the Group Executive, Consumer Banking Group of the Development Bank of Singapore (“DBS”) from 1 December 2010 to 15 April 2013 where he led and managed strategy formulation and execution for consumer banking globally across the DBS Group.
Mr Tan began his banking career with DBS in 1981. Since then, he has successfully built consumer banking franchises across multiple markets in Asia for Citibank, Standard Chartered Bank and ANZ Bank.
From March 2007 to December 2009, Mr Tan was President and Chief Executive Officer of Bank of Ayudhya, the fifth largest bank in Thailand listed on the Thailand Stock Exchange.
Mr Tan was appointed to the Board of HLFG on 5 February 2016.
Mr Tan is a Director of HLB and HLCB, both companies listed on the Main Market of Bursa Securities. He is also the Chairman of Hong Leong Asset Management Bhd and a Director of HLA and Hong Leong MSIG Takaful Berhad, all public companies.
YBHG taN SrI Dato’ SerI KHaLID aHMaD BIN SULaIMaNNon-Executive Director/Non-IndependentAge 80, Male, Malaysian
YBhg Tan Sri Dato’ Seri Khalid Ahmad bin Sulaiman was educated in England and was called to the English Bar at Middle Temple in 1964. He is a Consultant in a legal firm in Penang in which he was a Senior Partner from 1969 till June 2008. He was the Chairman of the Advocates and Solicitors Disciplinary Board from 2005 to 2013. He was in the Penang State Executive Council from 1974 to 1982 and has served on various statutory boards.
YBhg Tan Sri Khalid was appointed to the Board of HLFG on 1 July 1982. YBhg Tan Sri Khalid is a member of the NC and RC of HLFG.
YBhg Tan Sri Khalid is also a Director of HLCB, a company listed on the Main Market of Bursa Securities, and the Chairman of Hong Leong Investment Bank Berhad, a public company.

HONG LEONG FINANCIAL GROUP BERHAD ANNUAL REPORT 201638
MS LIM taU KIeNNon-Executive Director/IndependentAge 60, Female, Malaysian
Ms Lim Tau Kien graduated with a Bachelor of Accountancy from the University of Glasgow Faculty of Law and is a Chartered Accountant registered with the Institute of Chartered Accountants of Scotland.
Ms Lim forged her early career with Ernst & Young, United Kingdom, before joining the Ministry of Finance and Prime Minister’s Department as a Federal Accountant. She subsequently moved to Shell where she held various senior financial positions over a period of 25 years, her last position being the Country Chief Financial Officer/Country Controller/Finance Director of Shell China.
Ms Lim was appointed to the Board of HLFG on 8 April 2010 and is the Chairman of the Board Audit and Risk Management Committee (“BARMC”) and a member of NC of HLFG.
Ms Lim is also a Director of Malaysian Pacific Industries Berhad, a company listed on the Main Market of Bursa Securities and UEM Group Berhad, a public company.
MS LIM LeaN SeeNon-Executive Director/IndependentAge 63, Female, Malaysian
Ms Lim Lean See holds an Associateship in Accounting and an Associateship in Secretarial and Administrative Practice both from the Curtin University, Australia. Her professional qualifications include being a Fellow of the Australian Society of Certified Practicing Accountants, Registered Accountant with the Malaysian Institute of Accountants, a Trade Member of Financial Planning Association of Malaysia and a member of the Asian Institute of Chartered Bankers.
Ms Lim has 33 years experience in the banking industry and has held various senior positions including the Head of Corporate Banking and Head of Business Banking Division, the last being the Chief Representative of a foreign bank Representative Office with the corporate rank of an Executive Director.
Ms Lim was appointed to the Board of HLFG on 22 August 2011 and she is the Chairman of the NC and RC and a member of BARMC of HLFG.
Ms Lim is also a Director of HLB, a company listed on the Main Market of Bursa Securities.
Mr SaW KoK WeINon-Executive Director/Independent Age 53, Male, Malaysian
Mr Saw Kok Wei holds a B.Sc (Hons) in Accounting and Finance degree from the University of Warwick, United Kingdom. Mr Saw is currently the Chief Financial Officer of Jurong Port Pte Ltd, a leading international multi-purpose port operator headquartered in Singapore. Prior to joining Jurong Port Pte Ltd, he was with Electrolux Major Appliances – Asia Pacific for nine years during which time he held the positions of Deputy Head of Strategy, Asia Pacific, based in Singapore from July 2011 to September 2013, Chief Financial Officer of Electrolux China, based in Shanghai from October 2008 to June 2011, General Manager of P.T. Electrolux Indonesia from January 2007 to September 2008 and before that from March 2004 to December 2006, he was the Vice President, Finance & Administration – East Asia.
Before joining Electrolux, Mr Saw was with Merck Sharp & Dohme (I.A.) Corp from 2001 to 2003 and Nike Southeast Asia from 1999 to 2001, where he held the position of Finance Director in both companies.
Mr Saw was appointed to the Board of HLFG on 22 August 2011 and is a member of the BARMC and NC of HLFG.
Notes:
1. Family relationship with Director and/or Major ShareholderYBhg Tan Sri Quek Leng Chan and Mr Quek Leng Chye, a deemed major shareholder of HLFG, are brothers. Save as disclosed herein, none of the Directors has any family relationship with any other Director and/or major shareholder of HLFG.
2. Conflict of InterestNone of the Directors has any conflict of interest with HLFG.
3. Conviction of offencesNone of the Directors has been convicted of any offences (excluding traffic offences) in the past 5 years and there were no public sanctions or penalties imposed by the relevant regulatory bodies during the financial year ended 30 June 2016.
4. attendance of DirectorsDetails of Board meeting attendance of each Director are disclosed in the Statement on Corporate Governance, Risk Management and Internal Control in the Annual Report.
BoarD oF DIreCtorS

39Corporate / Financials / Additional Information
KeY SeNIor MaNaGeMeNt
Mr DoMeNIC FUDa Group Managing Director/Chief Executive Officer of Hong Leong Bank Berhad (“HLB”), a subsidiary of HLFGAge 49, Male, Australian
Mr Domenic Fuda holds a Bachelor of Economics from Macquarie University, Sydney, as well as a Master of Business (Banking & Finance) and a Master of Business Administration (M.B.A.), both from University of Technology, Sydney.
Mr Domenic Fuda was appointed as the Group Managing Director/Chief Executive Officer of HLB on 5 February 2016.
Mr Domenic Fuda was the Managing Director and Deputy Group Head, Consumer Banking & Wealth Management of DBS Bank Ltd (“DBS”), Singapore. He joined DBS in March 2010 as Chief Financial Officer of Regional Consumer Banking & Wealth Management. During his tenure with DBS, Mr Domenic Fuda was responsible for the formulation and execution of a multi-year growth strategy for the 6 Asian markets in which DBS operates its consumer and wealth management businesses.
Prior to his position in DBS, he spent 16 years at Citigroup where he served in various senior management roles across Asia, the latest being Chief Operating Officer for South East Asia Pacific, Australia and New Zealand, where he helped to drive execution of Citi’s strategy across 10 countries, launched Citi’s Consumer Banking business in Vietnam and helped to manage the banking operations during the 2008/2009 financial crises.
Mr CHeW SeoNG aUN Chief Financial Officer of Hong LeongFinancial Group Berhad (“HLFG”) Age 52, Male, Malaysian
Mr Chew Seong Aun obtained a Bachelor of Science (Eng) in Civil Engineering (Honours) degree in 1986 from Imperial College, University of London and is an ICAEW qualified Chartered Accountant (FCA) which he obtained subsequently via training and working with KPMG London.
Mr Chew joined HLFG on 1 November 2006 as the Chief Financial Officer (“CFO”).
Mr Chew has over 30 years of experience in finance and banking. He spent 5½ years with KPMG London and then worked with Gulf International Bank in their London and Bahrain offices for approximately 6 years of which his last position was the Head of Financial Audit. Mr Chew then returned to Malaysia working in Citibank’s Consumer Business as its Business Controller before being its Consumer CFO. He spent 8 years with Citibank Malaysia. He then spent about a year as a General Manager at Vsource Asia Berhad, a business process outsourcing firm before returning to banking as UOB Malaysia’s CFO in September 2005.

HONG LEONG FINANCIAL GROUP BERHAD ANNUAL REPORT 201640
Notes:
1. Family relationship with Director and/or Major ShareholderNone of the Key Senior Management has any family relationship with any Director and/or major shareholder of HLFG.
2. Conflict of InterestNone of the Key Senior Management has any conflict of interest with HLFG.
3. Conviction of offencesNone of the Key Senior Management has been convicted of any offences (excluding traffic offences) in the past 5 years and there were no public sanctions or penalties imposed by the relevant regulatory bodies during the financial year ended 30 June 2016.
KeY SeNIor MaNaGeMeNt
MS Lee JIM LeNGGroup Managing Director/Chief Executive Officer of Hong Leong Investment Bank Berhad (“HLIB”), a subsidiary of HLFGAge 53, Female, Malaysian
Ms Lee Jim Leng obtained a Bachelor of Business Administration degree in 1984 from the Acadia University and a Master of Business Administration in 1987 from the Dalhousie University, Canada.
Ms Lee is the Group Managing Director/Chief Executive Officer of HLIB. She was appointed to the Board of Directors of HLIB on 24 November 2009.
Ms Lee has more than 20 years of experience in the financial industry, specialising mainly in investment banking. Prior to joining HLIB, she was the Managing Director of a local investment bank where she was responsible for the overall development of the bank’s investment business in Malaysia. From 1999 to 2007, she was attached to a Singapore based regional bank and was tasked to spearhead their investment banking division in Malaysia and the ASEAN region.
MS LoH GUat LaNGroup Managing Director/Chief Executive Officer of Hong Leong Assurance Berhad (“HLA”), a subsidiary of HLFGAge 51, Female, Malaysian
Ms Loh Guat Lan holds a Bachelor of Science in Nutrition Science and is the fellow member of Life Management Institute (FLMI), Customer Service Management (CSM) and Life Office Management (LOMA). She is also a Certified Financial Planner (CFP) and Registered Financial Planner (RFP).
Ms Loh joined HLA as the Chief Operating Officer (Life Division) on 6 August 2007 and was appointed as the Group Managing Director/Chief Executive Officer of HLA on 1 September 2009.
Ms Loh has extensive experience in the insurance industry, including agency management, branch management, and agency development and training. Prior to joining HLA, she was in the employment of American International Assurance Company Limited where her last position was Vice President & Senior Director of Agency (Malaysia).
Ms Loh is also a Director of Hong Leong MSIG Takaful Berhad and MSIG Insurance (Malaysia) Bhd, both public companies.

41Corporate / Financials / Additional Information
BoarD aUDIt & rISK MaNaGeMeNt CoMMIttee reportCoNStItUtIoN
The Board Audit Committee of Hong Leong Financial Group Berhad (“HLFG” or the “Company”) has been established since 23 March 1994 and has been re-designated as the Board Audit & Risk Management Committee (“BARMC”) on 29 August 2001.
CoMpoSItIoN
Ms Lim tau Kien(Chairman, Independent Non-Executive Director)
Mr Saw Kok Wei(Independent Non-Executive Director)
Ms Lim Lean See(Independent Non-Executive Director)
SeCretarY
The Secretary(ies) to the BARMC are the Company Secretary(ies) of the Company.
terMS oF reFereNCe
The terms of reference of BARMC are published on the Company’s website at www.hlfg.com.my.
aUtHorItY
The BARMC is authorised by the Board to review any activity of the Group within its Terms of Reference. It is authorised to seek any information it requires from any Director or member of management and all employees are directed to co-operate with any request made by the BARMC.
The BARMC is authorised by the Board to obtain independent legal or other professional advice if it considers necessary.
MeetINGS
The BARMC meets at least four (4) times a year and additional meetings may be called at any time as and when necessary. All meetings to review the quarterly reports and annual financial statements are held prior to such quarterly reports and annual financial statements being presented to the Board for approval.
The chief financial officer, Group risk and compliance officers and external auditors are invited to attend the BARMC meetings, whenever required. At least twice a year, the BARMC will have separate sessions with the external auditors without the presence of Executive Directors and management.
Issues raised, discussions, deliberations, decisions and conclusions made at the BARMC meetings are recorded in the minutes of the BARMC meetings. Where the BARMC is considering a matter in which a BARMC member has an interest, such member abstains from reviewing and deliberating on the subject matter.
Two (2) members of the BARMC, who shall be independent, shall constitute a quorum.
After each BARMC meeting, the BARMC shall report and update the Board on significant issues and concerns discussed during the BARMC meetings and where appropriate, make the necessary recommendations to the Board.
aCtIvItIeS
The BARMC carried out its duties in accordance with its Terms of Reference.
During the financial year ended 30 June 2016 (“FYE 2016”), four (4) BARMC meetings were held and the attendance of the BARMC members was as follows:-
Member attendanceMs Lim Tau Kien 4/4Mr Saw Kok Wei 4/4Ms Lim Lean See 4/4
HoW tHe BarMC DISCHarGeS tHeIr reSpoNSIBILItIeS
Financial reporting
The BARMC reviewed the quarterly reports and financial statements of the Company and of the Group focusing particularly on:-
(i) any changes in accounting policies and practices;(ii) significant adjustments arising from the audit;(iii) the going concern assumptions; and(iv) compliance with accounting standards and other legal
requirements.

HONG LEONG FINANCIAL GROUP BERHAD ANNUAL REPORT 201642
BoarD aUDIt & rISK MaNaGeMeNt CoMMIttee reportThe legal and regulatory environment was monitored and consideration given to changes in law, regulation, accounting policies and practices including the additional disclosure requirements under the amended Main Market Listing Requirements of Bursa Malaysia Securities Berhad.
external audit
The external auditors of the Group for the FYE 2016 is Messrs PricewaterhouseCoopers (“PwC”). The BARMC discussed and reviewed with the external auditors, before the audit commences for the financial year, the audit plan and timetable for the financial audit of the Group including the focus areas and approach to the current financial year’s audit and any significant issues that can be foreseen, either as a result of the past year’s experience or due to new accounting standards or other changes in statutory or listing requirements.
The BARMC reviewed the report and audit findings of the external auditors and considered management’s response to the external auditor’s audit findings. The BARMC also had two (2) separate sessions with the external auditors without the presence of Executive Directors and management whereby matters discussed include key reservations noted by the external auditors during the course of their audit; whilst the BARMC Chairman maintained regular contact with the audit partner throughout the year.
The BARMC reviewed the external audit fees and their scope of services. The fees paid to PwC for the FYE 2016 amounted to RM3,888,708 of which RM903,523 was payable in respect of non-audit services. Non-audit services accounted for 23.2% of the total fees payable. The BARMC assessed the objectivity and independence of the external auditors prior to the appointment of the external auditors for ad-hoc non-audit services.
The BARMC also evaluated the performance of PwC and considered PwC to be independent. PwC, in accordance with professional ethical standards, have provided the BARMC with confirmation of their independence for the duration of the FYE 2016 and the measures used to control the quality of their work.
The BARMC has therefore recommended to the Board that PwC be re-appointed as the auditors. Resolution concerning the re-appointment of PwC will be proposed to shareholders at the 2016 Annual General Meeting.
related parties transactions
The BARMC conducted quarterly review of the recurrent related party transactions (“RRPT”) entered into by the Group to ensure that such transactions are undertaken on commercial terms and on terms not more favourable to the related parties than those generally available to and/or from the public.
The Group had put in place procedures and processes to monitor, track and identify the RRPT as well as to ensure that the RRPT are conducted on commercial terms consistent with the Group’s usual business practices and policies and on terms not more favourable to the related parties than those generally available to and/or from the public, where applicable.
The BARMC reviewed the said procedures and processes on an annual basis and as and when required, to ensure that the said procedures are adequate to monitor, track and identify RRPT in a timely and orderly manner, and are sufficient to ensure that the RRPT will be carried out on commercial terms consistent with the Group’s usual business practices and policies and on terms not more favourable to the related parties than those generally available to and/or from the public.
Internal audit
The BARMC reviewed the adequacy of internal audit scope, internal audit plan and resources of the various internal audit functions within Group Internal Audit Division (“GIAD”).
During the financial year, BARMC noted that GIAD had effectively carried out internal audits to all business entities of the Group, and reviewed the GIAD’s reports on the audits performed on the banking business, investment banking business and insurance business as set out in the Internal Audit Function section of this report.
The review of BARMC on the audit findings and recommendations of the GIAD focusing on the adequacy and integrity of internal control systems, business and compliance audits on the respective Divisions. The management’s responses to GIAD’s findings were also presented for the BARMC’s consideration. The BARMC also reviewed at every BARMC meetings the status update of management’s corrective action plans for the resolution of internal audit’s findings and recommendations. Recommendations were made by BARMC to ensure that the root causes raised by GIAD in their audit reports were effectively resolved and that any outstanding audit findings be tracked for timely resolution.
43Corporate / Financials / Additional Information
risk Management
The BARMC considered reports on risk management for the purpose of overseeing and reporting to the Board, on the proper functioning of Risk Management as part of its responsibilities to monitor the Group’s compliance with the business objectives, policies, reporting standards and control procedures of the Group.
The Chief Risk Officers of the respective business units under the Group were invited to present to the BARMC their respective Risk Management Dashboards covering among others Credit Risk, Market Risk, Liquidity Risk, Operational Risk, IT Risk and Regulatory Risk.
The BARMC also considered and reviewed the processes put in place to identify, evaluate and manage significant risks encountered by the Group as well as the adequacy and integrity of internal control systems, including risk management and relevant management information system.
INterNaL aUDIt FUNCtIoN
The Group’s Internal Audit function is carried out by the GIAD. GIAD employs a risk-based assessment approach in auditing the Group business and operational activities. The high risk activities are given due attention and audited on a more regular basis while the rest are prioritised to the potential risk exposure and
impact. These audits are performed in line with the Bank Negara Malaysia Guidelines on Internal Audit Function.
During the FYE 2016, the GIAD carried out internal audit functions to all business entities of the Group, summarised as follows:
• Banking : audits on operations, information technology system, treasury, credit, head office, branches, business centre, mortgage sales centre, loan centre, overseas branches and subsidiaries, investigation and other assignments as required by regulatory bodies. Shariah audits were performed on Islamic banking business as well.
• Investment Banking : audits on operations, supervisory functions, information technology systems, treasury, investment banking, stockbroking, fund management, unit trusts, branches and other assignments as required by regulatory bodies.
• Insurance : audits on operations, compliance, actuarial, investment, financial, information technology system, branches, and other assignments as required by regulatory bodies.
The cost incurred for the Group Internal Audit function for the FYE 2016 was RM14.7 million.
This BARMC Report is made in accordance with the resolution of the Board.
BoarD aUDIt & rISK MaNaGeMeNt CoMMIttee report

HONG LEONG FINANCIAL GROUP BERHAD ANNUAL REPORT 201644
The Board of Directors (“Board”) has reviewed the manner in which the Malaysian Code on Corporate Governance 2012 (the “Code”) is applied in the Group as set out below. The Board is pleased to report compliance of the Group with the principles and recommendations as set out in the Code except where otherwise stated.
a. roLeS aND reSpoNSIBILItIeS oF tHe BoarD
The Board assumes responsibility for effective stewardship and control of the Company and has established terms of reference (“TOR”) to assist in the discharge of this responsibility.
In discharging its responsibilities, the Board established functions which are reserved for the Board and those which are delegated to management. The key roles and responsibilities of the Board are set out in the Board Charter, which is reviewed periodically by the Board and published on the Company’s website at ‘www.hlfg.com.my’. The key roles and responsibilities of the Board broadly cover formulation of corporate policies and strategies; overseeing and evaluating the conduct of the Group’s businesses; identifying principal risks and ensuring the implementation of appropriate systems to manage those risks; and reviewing and approving key matters such as financial results, investments and divestments, acquisitions and disposals, and major capital expenditure and such other responsibilities that are required of them by Bank Negara Malaysia (“BNM”) as specified in guidelines and circulars issued by BNM from time to time.
The day-to-day business of the Company is managed by the President & Chief Executive Officer (“CEO”) assisted by the management team. The CEO and his management team are accountable to the Board for the performance of the Company. In addition, the Board has established Board Committees which operate within clearly defined TOR primarily to support the Board in the execution of its duties and responsibilities. To discharge its oversight roles and responsibilities more effectively, the Board has delegated the independent oversight over, inter alia, internal and external audit functions and internal controls; and risk management to the Board Audit and Risk Management Committee (“BARMC”). The Nominating Committee (“NC”) is delegated the authority to inter alia, assess and review Board, Board Committees and CEO appointments and re-appointments and to oversee management succession planning. Although the Board has granted such authority to Board Committees, the ultimate responsibility and the final decision rest with the Board. The Chairmen of Board Committees report to the Board on matters dealt with at their respective Board Committee meetings. Minutes of Board Committee meetings are also tabled at Board meetings.
There is a clear division of responsibilities between the Chairman and the CEO, which are distinct and separate. This segregation of responsibilities between the Chairman and the CEO ensures an appropriate balance of roles, responsibilities and accountability.
The Chairman leads the Board and ensures its smooth and effective functioning.
“Corporate Governance is the process and structure used to direct and manage the business and affairs of the Company towards enhancing business prosperity and corporate accountability with the ultimate objective of realising long term shareholder value, whilst taking into account the interest of other stakeholders.”
~ Finance Committee on Corporate Governance
Corporate GoverNaNCe, rISK MaNaGeMeNt & INterNaL CoNtroL

45Corporate / Financials / Additional Information
a. roLeS aND reSpoNSIBILItIeS oF tHe BoarD (CoNtINUeD)
The CEO is responsible for the vision and strategic direction of the Group as well as to monitor progress on implementation of Key Performance Areas (“KPAs”) and strategic developments.
The CEO’s main responsibility is to work with the operating managers to develop strategic business plans and to set out the KPAs for the operating managers as well as to focus on creating value through deployment of the assets in the Group and to seek optimal use of the capital resources available to him.
Independent Non-Executive Directors (“INEDs”) are responsible for providing insights, unbiased and independent views, advice and judgment to the Board and bring impartiality to Board deliberations and decision-making. They also ensure effective checks and balances on the Board. INEDs do not participate in the day-to-day management of the Company and there are no relationships or circumstances that could interfere with or are likely to affect the exercise of their independent judgment or the ability to act in the best interest of the Company and its shareholders.
The Group continues to operate in a sustainable manner and seeks to contribute positively to the well-being of stakeholders. The Group’s key corporate social responsibility activities are set out in the Corporate Social Responsibility Statement in this Annual Report.
The Board observes the Company Directors’ Code of Ethics established by the Companies Commission of Malaysia (“CCM”) which is available at CCM’s website at ‘www.ssm.com.my’. In addition, the Company also has a Code of Conduct and Ethics that sets out sound principles and standards of good practice which are observed by the employees. The Group has in place procedures and rules for employees to raise responsibly, in confidence, concerns about serious misconduct and other possible improprieties which pose financial, legal, reputational or operational risks to the Group.
B. BoarD CoMpoSItIoN
The Board comprises six (6) directors, five (5) of whom are non-executive. Of the non-executive directors, three (3) are independent. The profiles of the members of the Board are provided in the Annual Report.
Corporate GoverNaNCe, rISK MaNaGeMeNt & INterNaL CoNtroL
BNM’s Guidelines on Corporate Governance for Licensed Institutions was superseded by BNM’s policy document on Corporate Governance (“BNM CG”) with effect from 3 August 2016.
The Company is guided by BNM CG and Main Market Listing Requirements (“MMLR”) of Bursa Malaysia Securities Berhad (“Bursa”) in determining its board composition. The Board shall determine the appropriate size of the Board to enable an efficient and effective conduct of Board deliberation. The Board shall have a balance of skills and experience commensurate with the complexity, size, scope and operations of the Company. Board members should have the ability to commit time and effort to carry out their duties and responsibilities effectively.
The Board recognises the merits of Board diversity in adding value to collective skills, perspectives and strengths to the Board. The Board will consider appropriate targets in Board diversity including gender balance on the Board and will take the necessary measures to meet these targets from time to time as appropriate.
The Board is of the view that the current size and composition of the Board are appropriate and effective for the control and direction of the Group’s strategy and business. The composition of the Board also fairly reflects the investment of shareholders in the Company.
C. BoarD CoMMItteeS
Board Committees have been established by the Board to assist in the discharge of its duties.
(a) BarMC
The composition of the BARMC and a summary of its activities in the discharge of its functions and duties for the financial year and explanation on how the BARMC had met its responsibilities are set out in the BARMC Report in this Annual Report.
The functions and responsibilities of the BARMC are set out in the TOR which are published on the Company’s website (‘www.hlfg.com.my’).

HONG LEONG FINANCIAL GROUP BERHAD ANNUAL REPORT 201646
C. BoarD CoMMItteeS (CoNtINUeD)
(b) NC
The NC has been established on 30 October 2008. The composition of the NC was reconstituted as follows:
Ms Lim Lean See(Chairman, Independent Non-Executive Director)
YBhg Tan Sri Quek Leng Chan (Non-Independent Non-Executive Director)
YBhg Tan Sri Dato’ Seri Khalid Ahmad bin Sulaiman (Non-Independent Non-Executive Director)
Ms Lim Tau Kien(Independent Non-Executive Director)
Mr Saw Kok Wei(Independent Non-Executive Director)
The NC’s functions and responsibilities are set out in the TOR which is published on the Company’s website (‘www.hlfg.com.my’).
The Company has in place Fit and Proper (“F&P”) Policy as a guide for the following process and procedure for assessment of (i) new appointment, re-appointment, re-election and retention of directors, (ii) the appointment of Board Committee members, and (iii) the appointment and re-appointment of CEO, and the criteria used for such assessments. Upon the approval of the Board, an application on the prescribed forms will be submitted to BNM for approval in respect of new appointments and re-appointments.
(i) New appointments
The nomination, assessment and approval process for new appointments is as follows:
Identification of candidates
Meeting with candidates
• Assessment against Assessment Criteria and BNM Guidelines
• F&P Declaration by candidates.• Relevant Credit Bureau Checks • CTOS (Bankruptcy) search.• Recommendation by the NC
Deliberation by the Board and decision thereof
In assessing the candidates, the NC will take into account, inter alia, the strategic and effective fit of the candidates for the Board, the overall desired composition and the mix of core competencies of the Board as a whole having regard to the candidates’ attributes, qualifications, management, leadership and business experience. In the case of CEO, the NC would take into account the candidate’s knowledge and experience in the industry, market and segment. The NC will also consider candidates’ F&P Declarations in line with the standards required under the relevant BNM Guidelines.
Corporate GoverNaNCe, rISK MaNaGeMeNt & INterNaL CoNtroL

47Corporate / Financials / Additional Information
C. BoarD CoMMItteeS (CoNtINUeD)
(b) NC (continued)
(ii) re-appointments
The assessment and approval process for re-appointments is as follows:
For re-appointments, the Directors/CEOs will be evaluated on their performance in the discharge of duties and responsibilities effectively, including, inter alia, contribution to board deliberations, commitment and for independent directors, their independence as well as the Annual Board Assessment results and F&P Declarations.
(iii) Board Committee appointments
The nomination, assessment and approval process for Board Committees Appointments shall be as follows:
The assessment for Board Committees Appointments will be based on the Directors’ potential contributions and value-add to the Board Committees with regards to Board Committees’ roles and responsibilities.
In addition, a formal evaluation process has been put in place to assess the effectiveness of the Board as a whole, the Board Committees and the contribution and performance of each individual director on an annual basis (“Board Annual Assessment”). For newly appointed director/CEO, the Board Annual Assessment will be conducted at the next annual assessment exercise following the completion of one year of service.
For management succession planning, it has been embedded in the Group’s process over the years to continuously identify, groom and develop key talents from within the Group. The Group also has a talent development programme to identify, retain and develop young high potential talents.
The NC meets at least once in each financial year and additional meetings may be called at any time as and when necessary.
Corporate GoverNaNCe, rISK MaNaGeMeNt & INterNaL CoNtroL
Identification of Directors for Board Committees membership
• Assessment against Assessment Criteria and BNM Guidelines
• Recommendation by the NC
Deliberation by the Board and decision thereof
CTOS (Bankruptcy search)
• Assessment against Assessment Criteria and BNM Guidelines
• F&P Declaration• Recommendation by the NC
Deliberation by the Board and decision thereof

HONG LEONG FINANCIAL GROUP BERHAD ANNUAL REPORT 201648
C. BoarD CoMMItteeS (CoNtINUeD)
(b) NC (continued)
During the financial year ended 30 June 2016 (“FYE 2016”), two (2) NC meetings were held and the attendance of the NC members was as follows:
Member attendance
Ms Lim Lean See 2/2YBhg Tan Sri Quek Leng Chan 2/2YBhg Tan Sri Dato’ Seri Khalid Ahmad bin Sulaiman 2/2Ms Lim Tau Kien 2/2Mr Saw Kok Wei 2/2
The NC carried out the following activities in the discharge of its duties in accordance with its TOR:
• Reviewed and recommended to the Board for consideration and approval new Board appointments and re-appointments;
• Considered and recommended to the Board for approval the appointment of the CEO;
• Considered and recommended to the Board for approval the appointment of the Chief Compliance Officer;
• Considered and recommended to the Board for approval the appointment of the Chief Internal Auditor;
• Carried out the Board Annual Assessment and was satisfied that the Board as a whole, Board Committees and individual directors have continued to effectively discharge their duties and responsibilities in accordance with their respective TORs, and that the current Board composition in terms of Board balance, size and mix of skills is appropriate and effective for the discharge of its functions;
• Considered and assessed the position of independent directors of the Company and was satisfied that the independent directors met the regulatory requirements for independent directors;
• Reviewed the F&P Declarations by directors in line with the BNM’s Policy Document on F&P criteria;
• Reviewed and recommended to the Board for adoption the revision to the Tenure Policy of independent directors of the Company wherein the tenure for independent directors was revised from 12 years to 9 years;
• Reviewed and recommended to the Board for adoption the revision to the F&P Policy on new appointments and re-appointment of directors and CEO; Board Committees appointments and Board Annual Assessment.
• Refined the assessment process for new Board appointments in the assessment process to include a credit bureau check to improve the effectiveness of the evaluation of Board candidates on financial probity.
Corporate GoverNaNCe, rISK MaNaGeMeNt & INterNaL CoNtroL

49Corporate / Financials / Additional Information
Corporate GoverNaNCe, rISK MaNaGeMeNt & INterNaL CoNtroLC. BoarD CoMMItteeS (CoNtINUeD)
(c) remuneration Committee (“rC”)
The RC has been established on 30 October 2008 and the members are as follows:-
Ms Lim Lean See(Chairman, Independent Non-Executive Director)
YBhg Tan Sri Quek Leng Chan(Non-Independent Non-Executive Director)
YBhg Tan Sri Dato’ Seri Khalid Ahmad bin Sulaiman (Non-Independent Non-Executive Director)
The RC’s functions and responsibilities are set out in the TOR, which are published on the Company’s website.
During the FYE 2016, one (1) RC meeting was held and the attendance of the RC members was as follows:
Member attendanceMs Lim Lean See 1/1YBhg Tan Sri Quek Leng Chan 1/1YBhg Tan Sri Dato’ Seri Khalid Ahmad bin Sulaiman 1/1
The Group’s remuneration scheme for executive directors is linked to performance, service seniority, experience and scope of responsibility and is periodically benchmarked to market/industry surveys conducted by human resource consultants. Performance is measured against profits and targets set in the Group’s annual plan and budget.
The level of remuneration of non-executive directors reflects the level of responsibilities undertaken by them.
The RC, in assessing and reviewing the remuneration packages of executive directors, ensures that a strong link is maintained between their rewards and individual performance, based on the provisions in the Group’s Human Resources Manual, which are reviewed from time to time to align with market/industry practices. The fees of directors are recommended and endorsed by the Board for approval by the shareholders of the Company at its Annual General Meeting (“AGM”).
The aggregate remuneration of director (including the director who had resigned during the financial year, and remuneration earned as directors of subsidiaries) for the FYE 2016 is as follows:
Fees (rM)
Salaries & other emoluments
(rM)total(rM)
Company Group Company Group Company GroupExecutive Directors – – 2,779,630 7,156,899 2,779,630 7,156,899Non-Executive Directors 400,000 799,721 188,000 372,000 588,000 1,171,721
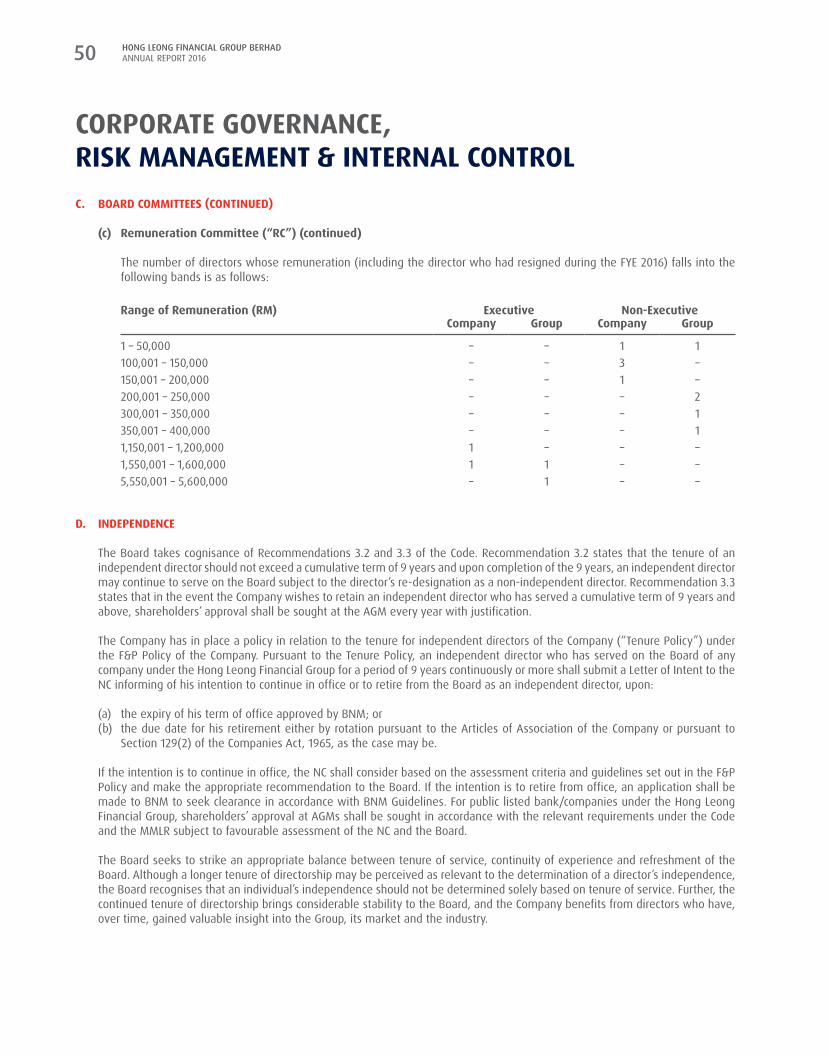
HONG LEONG FINANCIAL GROUP BERHAD ANNUAL REPORT 201650
Corporate GoverNaNCe, rISK MaNaGeMeNt & INterNaL CoNtroLC. BoarD CoMMItteeS (CoNtINUeD)
(c) remuneration Committee (“rC”) (continued)
The number of directors whose remuneration (including the director who had resigned during the FYE 2016) falls into the following bands is as follows:
range of remuneration (rM) executive Non-executiveCompany Group Company Group
1 – 50,000 – – 1 1100,001 – 150,000 – – 3 –150,001 – 200,000 – – 1 –200,001 – 250,000 – – – 2300,001 – 350,000 – – – 1350,001 – 400,000 – – – 11,150,001 – 1,200,000 1 – – –1,550,001 – 1,600,000 1 1 – –5,550,001 – 5,600,000 – 1 – –
D. INDepeNDeNCe
The Board takes cognisance of Recommendations 3.2 and 3.3 of the Code. Recommendation 3.2 states that the tenure of an independent director should not exceed a cumulative term of 9 years and upon completion of the 9 years, an independent director may continue to serve on the Board subject to the director’s re-designation as a non-independent director. Recommendation 3.3 states that in the event the Company wishes to retain an independent director who has served a cumulative term of 9 years and above, shareholders’ approval shall be sought at the AGM every year with justification.
The Company has in place a policy in relation to the tenure for independent directors of the Company (“Tenure Policy”) under the F&P Policy of the Company. Pursuant to the Tenure Policy, an independent director who has served on the Board of any company under the Hong Leong Financial Group for a period of 9 years continuously or more shall submit a Letter of Intent to the NC informing of his intention to continue in office or to retire from the Board as an independent director, upon:
(a) the expiry of his term of office approved by BNM; or(b) the due date for his retirement either by rotation pursuant to the Articles of Association of the Company or pursuant to
Section 129(2) of the Companies Act, 1965, as the case may be.
If the intention is to continue in office, the NC shall consider based on the assessment criteria and guidelines set out in the F&P Policy and make the appropriate recommendation to the Board. If the intention is to retire from office, an application shall be made to BNM to seek clearance in accordance with BNM Guidelines. For public listed bank/companies under the Hong Leong Financial Group, shareholders’ approval at AGMs shall be sought in accordance with the relevant requirements under the Code and the MMLR subject to favourable assessment of the NC and the Board.
The Board seeks to strike an appropriate balance between tenure of service, continuity of experience and refreshment of the Board. Although a longer tenure of directorship may be perceived as relevant to the determination of a director’s independence, the Board recognises that an individual’s independence should not be determined solely based on tenure of service. Further, the continued tenure of directorship brings considerable stability to the Board, and the Company benefits from directors who have, over time, gained valuable insight into the Group, its market and the industry.

51Corporate / Financials / Additional Information
Corporate GoverNaNCe, rISK MaNaGeMeNt & INterNaL CoNtroLD. INDepeNDeNCe (CoNtINUeD)
The independent directors have declared their independence, and the NC and the Board have determined, at the annual assessment carried out, that the independent directors have continued to bring independent and objective judgment to Board deliberations and decision making. The tenure of all the independent directors on the Board does not exceed 9 years.
e. CoMMItMeNt
The directors are aware of their responsibilities and devote sufficient time to carry out such responsibilities. In line with the MMLR, directors are required to comply with the restrictions on the number of directorships in public listed companies. Directors provide notifications to the Board for acceptance of any new Board appointments. This ensures that their commitment, resources and time are focused on the affairs of the Company to enable them to discharge their duties effectively. Board meetings are scheduled a year ahead in order to enable full attendance at Board meetings. Additional meetings may be convened on an adhoc basis as and when necessary. Where appropriate, decisions are also taken by way of Directors’ Circular Resolutions. Directors are required to attend at least 75% of Board meetings held in each financial year pursuant to the BNM CG.
All Board members are supplied with information in a timely manner. The Company has moved towards electronic Board reports. Board reports are circulated electronically prior to Board and Board Committee meetings and the reports provide, amongst others, financial and corporate information, significant operational, financial and corporate issues, updates on the performance of the Company and of the Group and management’s proposals which require the approval of the Board.
All directors have access to the advice and services of a qualified and competent Company Secretary to facilitate the discharge of their duties effectively. The Company Secretary is qualified to act under Section 139A of the Companies Act, 1965. She is responsible for providing support and guidance to the Board on policies and procedures, relevant rules, regulations and laws in relation to corporate governance. All directors also have access to the advice and services of the internal auditors and in addition, to independent professional advice, where necessary, at the Company’s expense, in consultation with the Chairman or the CEO of the Company.
At Board meetings, active deliberations of issues by Board members are encouraged and such deliberations, decisions and conclusions are recorded by the Company Secretary accordingly. Any director who has an interest in the subject matter to be deliberated shall abstain from deliberating and voting on the same during the meetings.
The Board met six (6) times for the FYE 2016 with timely notices of issues to be discussed. Details of attendance of each director are as follows:-
Director attendance
YBhg Tan Sri Quek Leng Chan 6/6Mr Tan Kong Khoon(1) 1/1Mr Quek Kon Sean(2) 6/6YBhg Tan Sri Dato’ Seri Khalid Ahmad bin
Sulaiman6/6
Ms Lim Tau Kien 6/6Ms Lim Lean See 6/6Mr Saw Kok Wei 6/6
Note:(1) One Board meeting was held since his appointment to
the Board on 5 February 2016(2) Resigned with effect from 9 July 2016
The Company recognises the importance of continuous professional development and training for its directors.
The Company is guided by a Directors’ Training Policy, which covers an Induction Programme and Continuing Professional Development (“CPD”) for directors of the Company. The Induction Programme is organised for newly appointed directors to assist them to familiarise and to get acquainted with the Company’s business, governance process, roles and responsibilities as director of the Company. The CPD encompasses areas related to the industry or business of the Company, governance, risk management and regulations through a combination of courses and conferences. A training budget is allocated for Directors’ training programmes.
All directors of the Company have completed the Mandatory Accreditation Programme.
The Company regularly organises in-house programmes, briefings and updates by its in-house professionals. The directors are also encouraged to attend seminars and briefings in order to keep themselves abreast with the latest developments in the business environment and to enhance their skills and knowledge. Directors are kept informed of available training programmes on a regular basis.

HONG LEONG FINANCIAL GROUP BERHAD ANNUAL REPORT 201652
Corporate GoverNaNCe, rISK MaNaGeMeNt & INterNaL CoNtroLe. CoMMItMeNt (CoNtINUeD)
The Company has prepared for the use of its directors, a Director Manual which highlights, amongst others, the major duties and responsibilities of a director vis-a-vis various laws, regulations and guidelines governing the same.
In assessing the training needs of directors, the Board has determined that appropriate training programmes covering matters on corporate governance, finance, legal, risk management and/or statutory/regulatory compliance, be recommended and arranged for the directors to enhance their contributions to the Board.
During the FYE 2016, the directors received regular briefings and updates on the Group’s businesses, operations, risk management, internal controls, corporate governance, finance and any changes to relevant legislation, rules and regulations from in-house professionals. The Company also organised an in-house programme for its directors and senior management.
The directors of the Company have also attended various programmes and forums facilitated by external professionals in accordance with their respective needs in discharging their duties as directors.
During the FYE 2016, the directors of the Company, collectively or on their own, attended various training programmes, seminars, briefings and/or workshops including:
• BNM – Financial Institutions Directors’ Education (“FIDE”) Elective Programme: Advanced Risk Governance and Risk Management Programme
• BNM – FIDE Forum – “Breakfast Series with Directors - The Board’s Response in Light of Rising Shareholder Engagements”
• BNM – FIDE Forum & Perbadanan Insurans Deposit Malaysia – Special Invite : Directors Register Focus Group Sessions
• BNM – FIDE Forum: A Dialogue on “The New and Revised Auditor Reporting Standards: Implications to Financial Institutions”
• BNM – FIDE Forum: Special Invitation to Industry Briefing on Directors Register Implementation
• BNM – FIDE Forum: Directors’ Remuneration Report 2015: Briefing Session for Directors. A special briefing on the implementation of the Recommendations
• BNM – FIDE Forum: Focus Group Discussion in Preparation for Dialogue with BNM’s Senior Management (for the Banking, Islamic Banking and Investment Banking Businesses)
• BNM – FIDE Forum: 1st Distinguished Board Leadership Series - “Cyber-Risk Oversight”
• BNM – FIDE Forum: 4th Distinguished Board Leadership Series: Board Leading Change : Organisational Transformation Strategy as Key to Sustainable Growth in Challenging Times”
• FIDE Forum - 6th Distinguished Board Leadership Series “Digital Transformation and Its Impact on Financial Services – Role of the Board in Maximising Potential”
• ICLIF & Bursa Malaysia – “Board Chairman Series Part 2: Leadership Excellence from the Chair”
• Bursa Malaysia - Sustainability Engagement Series for Directors/CEOs of Listed Issuers
• Securities Industry Development Corporation (“SIDC”) & Bursa Malaysia: “The Interplay Between CG, NFI and Investment Decision – What Boards of Listed Companies Need to Know”
• SIDC – Capital Market Director Programme (“CDMP”)
• SIDC - CMDP Alumni Event: Doing Business in a Responsible Way
• Federation of Public Listed Companies Bhd – Governance, Director Duties and Listing Requirement Updates for Directors of PLCs
• Thomson Reuters - Anti-Money Laundering and Countering Financing of Terrorism (“AML/CFT”) eLearning course
• Amanie Academy – The Essence of Shariah Compliance in Modern Islamic Financial Institutions – Shariah Standards
• Malaysian Economic Association – 2016 BNM Governor’s Address on the Malaysian Economy & Panel Discussion

53Corporate / Financials / Additional Information
Corporate GoverNaNCe, rISK MaNaGeMeNt & INterNaL CoNtroLe. CoMMItMeNt (CoNtINUeD)
• Audit Committee Conference 2016
• MIRA Seminar – “Is the economy in a crisis and have we learned from the past crisis?”
• Digital Banking & Current Challenges in Accounting (IFRS)
• The Most Innovative Companies – Four Factors that Differentiate Leaders
• AML/CFT – Recent Lessons Learnt from Industry
• BNM Concept Paper on Corporate Governance
• BNM Concept Paper on Shareholder Suitability
• Amendments to Bursa Malaysia Securities Berhad Main Market Listing Requirements
• Amendments to Capital Markets and Services Act 2007 and Securities Commission Act 1993
• Regulatory update session on recent changes in regulations, legislation and accounting standards
• Third Party Contracts (Rights of Third Parties) Ordinance
• New guidance on direct marketing provisions under the Personal Data (Privacy) Ordinance
• Guidelines for Submission of Complaints Statistics (Banking Institutions and Development Financial Institutions)
• Managing Unauthorised Trading and Market Manipulation
• Submission for Repurchase Agreement Transaction
• Financial Action Task Force Report: Emerging Terrorist Financing Risks
• Statements by the Financial Action Task Force on Money Laundering
• Capital Adequacy Framework (Capital Components)
• Capital Adequacy Framework (Basel II – Risk Weighted Asset)
• Observation Period Reporting (Capital Adequacy Ratios and Liquidity Coverage Ratio)
• Issues of Concern Noted on Trading Clerks and Third Party Receipts
• Guidelines for Registered Person – Registered Representative.
F. aCCoUNtaBILItY aND aUDIt
The Company has put in place a framework of processes whereby Board committees provide oversight on critical processes of the Company’s reporting of financial statements, in order to ensure that accountability and audit are integral components of the said processes.
I Financial reporting
The Board has a fiduciary responsibility to ensure the proper maintenance of accounting records of the Group. The Board receives the recommendation to adopt the financial statements from the BARMC, which assesses the integrity of financial statements with the assistance of the external auditors.
II risk Management and Internal Control
The Board has overall responsibility for maintaining a system of internal controls which covers financial and operational controls and risk management. This system provides reasonable but not absolute assurance against material misstatements, losses and fraud.
The BARMC is delegated with the responsibility to provide oversight on the Company’s management of critical risks that the Group faces, and to review the effectiveness of internal controls implemented in the Company.
The Statement on Risk Management and Internal Control as detailed under Section I of this Statement provides an overview of the system of internal controls and risk management framework of the Group.
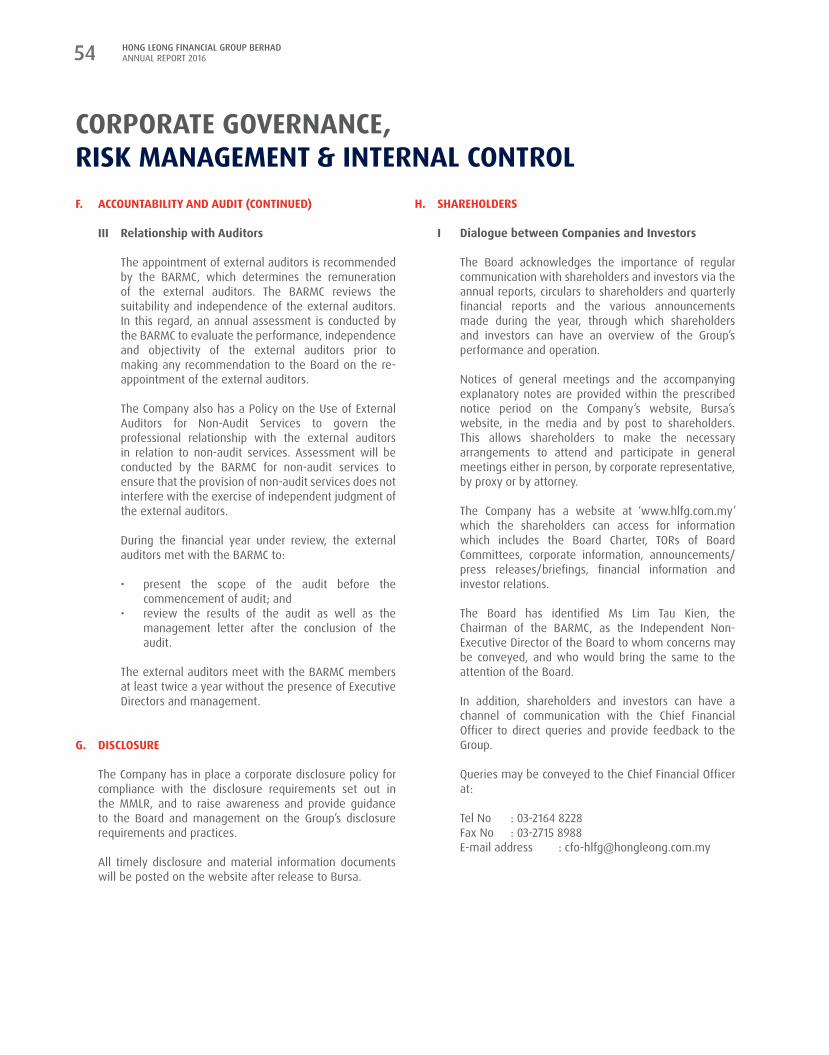
HONG LEONG FINANCIAL GROUP BERHAD ANNUAL REPORT 201654
Corporate GoverNaNCe, rISK MaNaGeMeNt & INterNaL CoNtroLF. aCCoUNtaBILItY aND aUDIt (CoNtINUeD)
III relationship with auditors
The appointment of external auditors is recommended by the BARMC, which determines the remuneration of the external auditors. The BARMC reviews the suitability and independence of the external auditors. In this regard, an annual assessment is conducted by the BARMC to evaluate the performance, independence and objectivity of the external auditors prior to making any recommendation to the Board on the re-appointment of the external auditors.
The Company also has a Policy on the Use of External Auditors for Non-Audit Services to govern the professional relationship with the external auditors in relation to non-audit services. Assessment will be conducted by the BARMC for non-audit services to ensure that the provision of non-audit services does not interfere with the exercise of independent judgment of the external auditors.
During the financial year under review, the external auditors met with the BARMC to:
• present the scope of the audit before the commencement of audit; and
• review the results of the audit as well as the management letter after the conclusion of the audit.
The external auditors meet with the BARMC members at least twice a year without the presence of Executive Directors and management.
G. DISCLoSUre
The Company has in place a corporate disclosure policy for compliance with the disclosure requirements set out in the MMLR, and to raise awareness and provide guidance to the Board and management on the Group’s disclosure requirements and practices.
All timely disclosure and material information documents will be posted on the website after release to Bursa.
H. SHareHoLDerS
I Dialogue between Companies and Investors
The Board acknowledges the importance of regular communication with shareholders and investors via the annual reports, circulars to shareholders and quarterly financial reports and the various announcements made during the year, through which shareholders and investors can have an overview of the Group’s performance and operation.
Notices of general meetings and the accompanying explanatory notes are provided within the prescribed notice period on the Company’s website, Bursa’s website, in the media and by post to shareholders. This allows shareholders to make the necessary arrangements to attend and participate in general meetings either in person, by corporate representative, by proxy or by attorney.
The Company has a website at ‘www.hlfg.com.my’ which the shareholders can access for information which includes the Board Charter, TORs of Board Committees, corporate information, announcements/press releases/briefings, financial information and investor relations.
The Board has identified Ms Lim Tau Kien, the Chairman of the BARMC, as the Independent Non-Executive Director of the Board to whom concerns may be conveyed, and who would bring the same to the attention of the Board.
In addition, shareholders and investors can have a channel of communication with the Chief Financial Officer to direct queries and provide feedback to the Group.
Queries may be conveyed to the Chief Financial Officer at:
Tel No : 03-2164 8228Fax No : 03-2715 8988E-mail address : [email protected]

55Corporate / Financials / Additional Information
Corporate GoverNaNCe, rISK MaNaGeMeNt & INterNaL CoNtroLH. SHareHoLDerS (CoNtINUeD)
II aGM
The AGM provides an opportunity for the shareholders to seek and clarify any issues and to have a better understanding of the Group’s performance. Shareholders are encouraged to meet and communicate with the Board at the AGM and to vote on all resolutions. Senior management and the external auditors are also available to respond to shareholders’ queries during the AGM.
Pursuant to Paragraph 8.29A(1) of the MMLR, all resolutions tabled at general meetings will be put to vote by way of a poll and the voting results will be announced at the meetings and through Bursa.
I. StateMeNt oN rISK MaNaGeMeNt aND INterNaL CoNtroL
I the responsibility of the Board
The Board recognises its responsibilities for the system of internal controls of the Group and for reviewing its adequacy and integrity. Accordingly, the Board has established and maintained a Risk Management Framework appropriate to the operations of the Group, including systems for compliance with applicable laws, regulations, rules, directives and guidelines.
The controls built into the Risk Management Framework of the Group are designed to ensure that all relevant and significant risks are identified and managed as part of the risk management process and are not intended to eliminate all risks of failure to achieve business objectives. It only provides a reasonable and not absolute assurance against material misstatements, losses or frauds that may affect the Group’s financial position or its operations.
The Board has received assurance from the President & Chief Executive Officer and Chief Financial Officer that the Group’s risk management and internal control system is operating adequately and effectively, in all material aspects, based on the risk management and internal control system of the Group.
Based on the outcome of these reviews as well as the assurance it has received from management, the Board is of the view that the Group’s risk management and internal control system is operating adequately and effectively for the financial year under review and up to the date of approval of this report.
II the risk Management Framework
The Risk Management Framework established by the Board is to assist it in:
• identifying the significant risks faced by the Group in the operating environment, as well as evaluating the impact of such risks;
• developing and approving the necessary measures to manage these risks; and
• monitoring the effectiveness of such measures and to develop, approve and monitor any corrective actions as may be deemed necessary.
These processes have been in place throughout the FYE 2016 and have continued up to the date this statement was approved.
The Board has entrusted the BARMC with the responsibility to oversee the implementation of the Risk Management Framework of the Group. The Group’s Risk Officers administer the Risk Management Framework of the Group. The primary responsibilities of the Group‘s Risk Officers are:
• periodically evaluate all identified risks for their relevance in the operating environment and inclusion in the Risk Management Framework;
• oversee and monitor the implementation of appropriate systems and controls to manage these risks;
• assess the adequacy of existing action plans and control systems developed to manage these risks;
• monitor the performance of management in executing the action plans and operating the control systems; and
• regularly report to the BARMC on the state of internal controls and the efficacy of management of risks throughout the Group.
In discharging the above responsibilities, the Group’s Risk Officers are guided by but are not limited to the Statement on Risk Management & Internal Control - Guidelines for Directors of Listed Issuers.

HONG LEONG FINANCIAL GROUP BERHAD ANNUAL REPORT 201656
Corporate GoverNaNCe, rISK MaNaGeMeNt & INterNaL CoNtroLI. StateMeNt oN rISK MaNaGeMeNt aND INterNaL
CoNtroL (CoNtINUeD)
III Internal Control review and regulatory Compliance procedures
The Group Internal Audit Division (“GIAD”), under the direction of the BARMC, provides the BARMC and the Board the assurance it requires regarding the adequacy and integrity of the system of internal controls.
The GIAD undertakes periodic and systematic reviews of internal control systems and the review of compliance with the business objectives, policies, reporting standards and control procedures of the Group. This is to provide reasonable assurance to the Board on the proper functioning of the Risk Management Framework.
The Group’s Compliance Officers monitor daily operations of licensed subsidiaries to ensure compliance with regulatory requirements and internal policies. All breaches and exceptions are brought to the attention of the BARMC and the BARMC is kept informed of the causes and the remedial measures taken.
Iv Management and Decision-Making processes
The Board has incorporated the Risk Management Framework as an integral component in the management and decision-making process of the Group.
The vision and mission statements of the Group form the basis of medium-term business plans and budgets. The key strategies to achieve these business plans and budgets are approved by the Board. The management performs monthly review to monitor the performance of all operating units against the business plans and budgets. The budget is monitored and major variances are followed-up by the management. These are then reported to the Board on a quarterly basis.
The Company’s financial system records business transactions to produce quarterly reports that allow management to focus on key areas of concern. The public release of quarterly financial reporting of the Group will only be made after being reviewed by the BARMC and approved by the Board.
The Group has a well-defined organisational structure with clearly defined authorities, accountability and segregation of duties. The respective heads of the
operating subsidiaries of the Group operate their respective units within the policies, functional, financial and operating reporting standards and control procedures developed by the Group. Such reporting standards and control procedures are supplemented by operating procedures developed by the operating units to suit the regulatory and business environment, in which they operate.
The Group has identified the major risks that has significant impact on its operations, namely; credit risk, market risk, liquidity risk, settlement risk, operational risk, and legal and compliance risk. Each operating unit has a number of functional departments and/or units that will be responsible for managing and monitoring these risks through limits, procedures and oversight. Where feasible and necessary, relevant group resources are focused to manage and monitor common risks on an integrated and Group-wide basis, using common tools, procedures and control systems as appropriate.
As required by Paragraph 15.23 of the MMLR, the external auditors have reviewed this Statement on Risk Management and Internal Control. Their limited assurance review was performed in accordance with Recommended Practice Guide (“RPG”) 5 (Revised) issued by the Malaysian Institute of Accountants. RPG 5 (Revised) does not require the external auditors to form an opinion on the adequacy and effectiveness of the risk management and internal control systems of the Group.
J. DIreCtorS’ reSpoNSIBILItY IN FINaNCIaL reportING
The MMLR requires the directors to prepare financial statements for each financial year which give a true and fair view of the financial position of the Group and of the Company as at the end of the financial year and of its financial performance and cash flows of the Group and of the Company for the financial year.
The directors are satisfied that in preparing the financial statements of the Group and of the Company for the FYE 2016, the Group has used the appropriate accounting policies and applied them consistently. The directors are also of the view that relevant approved accounting standards have been followed in the preparation of these financial statements.
This Statement on Corporate Governance, Risk Management and Internal Control is made in accordance with the resolution of the Board.
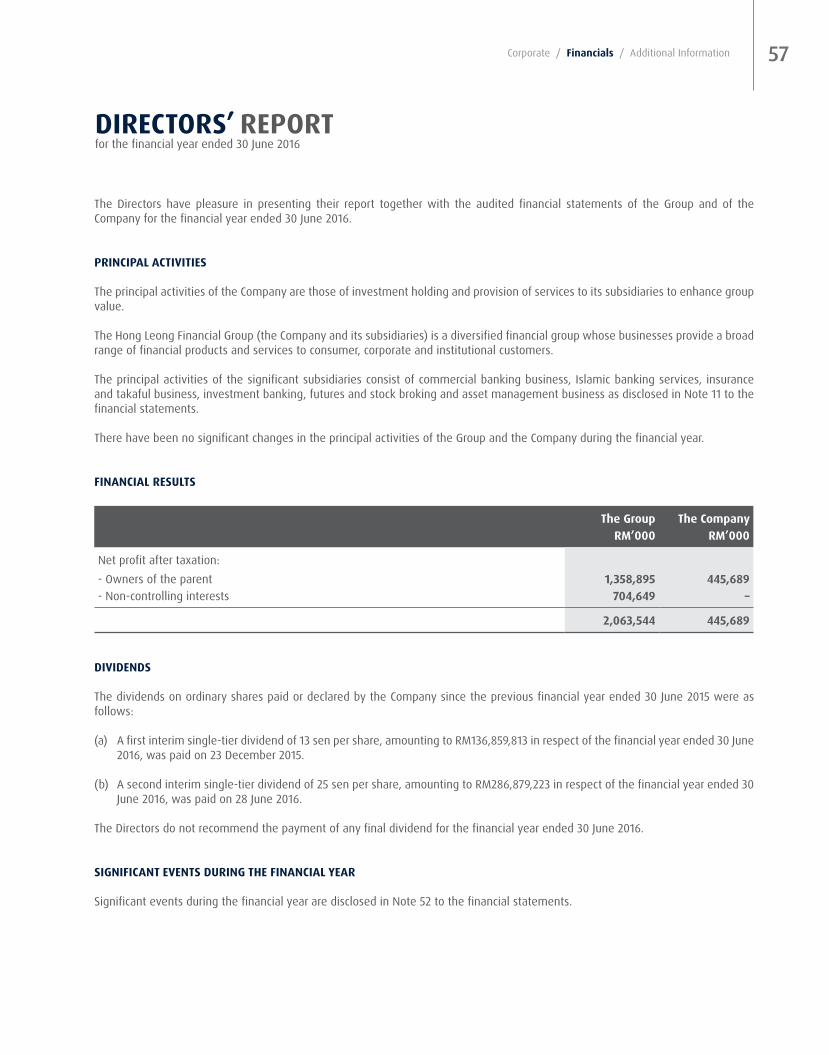
57Corporate / Financials / Additional Information
DIreCtorS’ report for the financial year ended 30 June 2016
The Directors have pleasure in presenting their report together with the audited financial statements of the Group and of the Company for the financial year ended 30 June 2016.
prINCIpaL aCtIvItIeS
The principal activities of the Company are those of investment holding and provision of services to its subsidiaries to enhance group value.
The Hong Leong Financial Group (the Company and its subsidiaries) is a diversified financial group whose businesses provide a broad range of financial products and services to consumer, corporate and institutional customers.
The principal activities of the significant subsidiaries consist of commercial banking business, Islamic banking services, insurance and takaful business, investment banking, futures and stock broking and asset management business as disclosed in Note 11 to the financial statements.
There have been no significant changes in the principal activities of the Group and the Company during the financial year.
FINaNCIaL reSULtS
the Group the CompanyrM’000 rM’000
Net profit after taxation:- Owners of the parent 1,358,895 445,689 - Non-controlling interests 704,649 –
2,063,544 445,689
DIvIDeNDS
The dividends on ordinary shares paid or declared by the Company since the previous financial year ended 30 June 2015 were as follows:
(a) A first interim single-tier dividend of 13 sen per share, amounting to RM136,859,813 in respect of the financial year ended 30 June 2016, was paid on 23 December 2015.
(b) A second interim single-tier dividend of 25 sen per share, amounting to RM286,879,223 in respect of the financial year ended 30 June 2016, was paid on 28 June 2016.
The Directors do not recommend the payment of any final dividend for the financial year ended 30 June 2016.
SIGNIFICaNt eveNtS DUrING tHe FINaNCIaL Year
Significant events during the financial year are disclosed in Note 52 to the financial statements.

HONG LEONG FINANCIAL GROUP BERHAD ANNUAL REPORT 201658
SUBSeQUeNt eveNtS aFter tHe FINaNCIaL Year
Significant events subsequent to the financial year are disclosed in Note 53 to the financial statements.
CreDIt ratING
On 23 August 2016, Malaysian Rating Corporation Berhad (“MARC”) has reaffirmed a MARC-1/AA ratings to Hong Leong Financial Group Berhad (“HLFG”)’s Commercial Paper and Medium Term Notes Programmes with a combined limit of RM1.8 billion. The rating outlook for the long-term rating is stable. The ratings are based on the continued ability of HLFG’s enlarged banking subsidiary, Hong Leong Bank Berhad, to generate strong earnings and the well-capitalised positions of both its banking and insurance subsidiaries.
Details of the ratings are as follows:
rM1,800 million Commercial paper and Medium term Notes programmes
Date accorded rating action rating classification Definition
August 2016 Affirmed Short-term rating: MARC-1 Highest category; indicates a very high likelihood that principal and interest will be paid on a timely basis.
August 2016 Affirmed Long-term rating: AA Indicates a very strong ability to repay principal and pay interest on a timely basis, with limited incremental risk compared to issues rated in the highest category.
reServeS aND provISIoNS
There were no material transfers to or from reserves or provisions during the financial year other than those disclosed in the financial statements.
DIreCtorS
The Directors who have held office since the date of the last report and at the date of this report are as follows:
YBhg Tan Sri Quek Leng Chan (Chairman, Non-Executive Non-Independent)Mr Tan Kong Khoon (Appointed with effect from 5 February 2016) (President & Chief Executive Officer, Non-Independent)YBhg Tan Sri Dato’ Seri Khalid Ahmad bin Sulaiman (Non-Independent Non-Executive Director)Ms Lim Tau Kien (Independent Non-Executive Director)Ms Lim Lean See (Independent Non-Executive Director)Mr Saw Kok Wei (Independent Non-Executive Director) Mr Quek Kon Sean (Resigned with effect from 9 July 2016) (Non-Independent Non-Executive Director)
DIreCtorS’ report for the financial year ended 30 June 2016

59Corporate / Financials / Additional Information
DIreCtorS’ INtereStS
According to the Register of Directors’ Shareholdings kept by the Company under Section 134 of the Companies Act, 1965, the Directors holding office at the end of the financial year who had beneficial interests in the ordinary shares and/or preference shares and/or options over ordinary shares of the Company and/or its related corporations during the financial year are as follows:
Shareholdings in which Directors have direct interestsNumber of ordinary shares/preference shares/ordinary shares issued
or to be issued or acquired arising from the exercise of options*/ conversion of redeemable convertible unsecured loan stocks** or
redeemable convertible cumulative preference shares***
Nominal value per
share
rM (unlessindicated)
as at 01.07.2015 acquired Sold
as at30.06.2016
Interests of YBhg tan Sri Quek Leng Chan in:Hong Leong Company (Malaysia) Berhad 1.00 390,000 – – 390,000Hong Leong Financial Group Berhad 1.00 4,989,600 449,064 (9) – 5,438,664Guoco Group Limited USD0.50 1,056,325 – – 1,056,325GuocoLand Limited (1) 13,333,333 – – 13,333,333GuocoLand (Malaysia) Berhad 0.50 19,506,780 – – 19,506,780GL Limited (formerly known as GuocoLeisure
Limited) USD0.20 735,000 – – 735,000
The Rank Group Plc GBP138/9p 285,207 – – 285,207
Interests of YBhg tan Sri Dato’ Seri Khalid ahmad bin Sulaiman in:
Hong Leong Financial Group Berhad 1.00 5,544,000 – – 5,544,000Hong Leong Bank Berhad 1.00 400,000 – – 400,000Hong Leong Industries Berhad 0.50 52,800 – – 52,800Malaysian Pacific Industries Berhad 0.50 20,800 – – 20,800Hume Industries Berhad 1.00 57,024 – – 57,024
Interest of Mr Quek Kon Sean (13) in:Hong Leong Financial Group Berhad 1.00 2,250,000 202,500 (9) – 2,452,500Hong Leong Company (Malaysia) Berhad 1.00 – 164,355 – 164,355Hong Leong Industries Berhad – 200,000 * – 200,000 *Hume Industries Berhad – 100,000 * – 100,000 *GuocoLand Limited – 100,000 * – 100,000 *GL Limited (formerly known as GuocoLeisure
Limited) – 100,000 * – 100,000 *
DIreCtorS’ report for the financial year ended 30 June 2016

HONG LEONG FINANCIAL GROUP BERHAD ANNUAL REPORT 201660
DIreCtorS’ INtereStS (CoNtINUeD)
Shareholdings in which Directors have indirect interestsNumber of ordinary shares/preference shares/ordinary shares issued
or to be issued or acquired arising from the exercise of options*/ conversion of redeemable convertible unsecured loan stocks** or
redeemable convertible cumulative preference shares***
Nominal value per
share
rM (unlessindicated)
as at 01.07.2015 acquired Sold
as at30.06.2016
Interests of YBhg tan Sri Quek Leng Chan in:Hong Leong Company (Malaysia) Berhad 1.00 13,069,100 164,355 (6) – 13,233,455Hong Leong Financial Group Berhad 1.00 824,437,300 73,999,432 (9) – 898,436,732Hong Leong Capital Berhad 1.00 200,805,058 – – 200,805,058Hong Leong Bank Berhad 1.00 1,160,549,285 185,687,884 (9) – 1,346,237,169Hong Leong MSIG Takaful Berhad 1.00 65,000,000 – – 65,000,000Hong Leong Assurance Berhad 1.00 140,000,000 – – 140,000,000Hong Leong Industries Berhad 0.50 245,435,003 (6) – – 245,435,003 (6)
– 200,000 *(6) – 200,000 *(6)
Hong Leong Yamaha Motor Sdn Bhd 1.00 17,352,872 – – 17,352,872Guocera Tile Industries (Meru) Sdn Bhd 1.00 19,600,000 – – 19,600,000Hong Leong Maruken Sdn Bhd (In members’ voluntary liquidation)
1.00 1,750,000 – – 1,750,000
Century Touch Sdn Bhd (In members’ voluntary liquidation)
1.00 6,545,001 – – 6,545,001
Varinet Sdn Bhd (In members’ voluntary liquidation)
1.00 10,560,627 – – 10,560,627
Malaysian Pacific Industries Berhad 0.50 112,217,857 (6) – – 112,217,857 (6)
Carter Resources Sdn Bhd (formerly known as Carter Realty Sdn Bhd)
1.00 5,640,607 – – 5,640,607
Carsem (M) Sdn Bhd 1.00 84,000,000 – – 84,000,000 100.00 22,400 (7) – – 22,400 (7)
Hume Industries Berhad 1.00 354,373,046 (6) – (925,559) (11) 353,447,487 (6)
– 100,000 *(6) – 100,000 *(6)
Guoco Group Limited USD0.50 237,124,930 – – 237,124,930GuocoLand Limited (1) 819,244,363 (6) – – 819,244,363 (6)
– 100,000 *(6) – 100,000 *(6)
Southern Steel Berhad (“SSB”) 1.00 299,541,202 – – 299,541,2021.00 141,627,296 ** – – 141,627,296 **
Southern Pipe Industry (Malaysia) Sdn Bhd 1.00 118,822,953 – – 118,822,9531.00 20,000,000 ***(8) – – 20,000,000 ***(8)
Belmeth Pte. Ltd. (1) 40,000,000 – – 40,000,000Guston Pte. Ltd. (1) 8,000,000 – – 8,000,000Perfect Eagle Pte. Ltd. (1) 24,000,000 – – 24,000,000First Garden Development Pte Ltd (In members’ voluntary liquidation)
(1) 63,000,000 – (63,000,000) (10) –
Sanctuary Land Pte Ltd (In members’ voluntary liquidation)
(1) 90,000 – (90,000) (10) –
DIreCtorS’ report for the financial year ended 30 June 2016

61Corporate / Financials / Additional Information
DIreCtorS’ INtereStS (CoNtINUeD)
Shareholdings in which Directors have indirect interests Number of ordinary shares/preference shares/ordinary shares issued
or to be issued or acquired arising from the exercise of options*/ conversion of redeemable convertible unsecured loan stocks** or
redeemable convertible cumulative preference shares***
Nominal value per
share
rM (unlessindicated)
as at 01.07.2015 acquired Sold
as at30.06.2016
Interests of YBhg tan Sri Quek Leng Chan in: (continued)Beijing Minghua Property Development Co., Ltd (In members’ voluntary liquidation)
(2) 150,000,000 – – 150,000,000
Shanghai Xinhaojia Property Development Co., Ltd
(2) 3,150,000,000 – – 3,150,000,000
Shanghai Xinhaozhong Property Development Co., Ltd
(3) 19,600,000 – – 19,600,000
Beijing Cheng Jian Dong Hua Real Estate Development Company Limited
(2) 50,000,000 – (50,000,000) –
Lam Soon (Hong Kong) Limited (5) 140,008,659 – – 140,008,659Kwok Wah Hong Flour Company Limited (5) 9,800 – (9,800) (10) – Guangzhou Lam Soon Food Products Limited (4) 6,570,000 – – 6,570,000GuocoLand (Malaysia) Berhad 0.50 455,698,596 – – 455,698,596Guoman Hotel & Resort Holdings Sdn Bhd 1.00 277,000,000 – – 277,000,000JB Parade Sdn Bhd 1.00 28,000,000 – – 28,000,000
0.01 68,594,000 (7) – – 68,594,000 (7)
Continental Estates Sdn Bhd 1.00 34,408,000 – – 34,408,000 0.01 123,502,605 (7) – – 123,502,605 (7)
GL Limited (formerly known as GuocoLeisure USD0.20 923,255,425 9,818,400 – 933,073,825Limited) – 100,000 *(6) – 100,000 *(6)
The Rank Group Plc GBP138/9p 219,282,221 – – 219,282,221
Interests of YBhg tan Sri Dato’ Seri Khalid ahmad bin Sulaiman in:Hong Leong Financial Group Berhad 1.00 3,600 (12) – – 3,600 (12)
Hong Leong Bank Berhad 1.00 – 68,000 (12) – 68,000 (12)
Interests of Mr Quek Kon Sean (13) in:Hong Leong Industries Berhad 0.50 750,000 – – 750,000Malaysian Pacific Industries Berhad 0.50 281,250 – – 281,250Hume Industries Berhad 1.00 810,000 – – 810,000
DIreCtorS’ report for the financial year ended 30 June 2016
HONG LEONG FINANCIAL GROUP BERHAD ANNUAL REPORT 201662
DIreCtorS’ INtereStS (CoNtINUeD)
Notes:(1) Concept of par value was abolished with effect from 30 January 2006 pursuant to the Singapore Companies (Amendment) Act,
2005 (2) Capital contribution in RMB(3) Capital contribution in USD(4) Capital contribution in HKD(5) Concept of par value was abolished with effect from 3 March 2014 pursuant to the New Companies Ordinance (Chapter 622),
Hong Kong(6) Inclusive of interest pursuant to Section 134(12)(c) of the Companies Act, 1965 in shares held by family member (7) Redeemable Preference Shares(8) The redeemable convertible cumulative preference shares (“RCCPS”) are convertible into ordinary shares of RM1.00 each at the
option of the holder of RCCPS on the basis of 400 ordinary shares of RM1.00 each for every RCCPS of RM1.00 nominal value(9) Shares acquired from rights issue(10) Dissolved during the financial year(11) Transfer of free ordinary shares of RM1.00 each in Hume Industries Berhad to the grant holders upon vesting(12) Interest pursuant to Section 134(12)(c) of the Companies Act, 1965 in shares held by family member (13) Resigned with effect from 9 July 2016
DIreCtorS’ BeNeFItS
Since the end of the previous financial year, none of the Directors of the Company received or became entitled to receive any benefit (other than a benefit included in the aggregate amount of emoluments received or due and receivable by the Directors as shown in the financial statements or as fixed salary of a full-time employee of the Company or of related corporations) by reason of a contract made by the Company or its related corporations with the Director or with a firm of which the Director is a member, or with a company in which the Director has a substantial financial interest except for YBhg Tan Sri Quek Leng Chan, who may be deemed to derive a benefit by virtue of those transactions, contracts and agreements for the acquisition and/or disposal of stocks and shares, stocks-in-trade, products, parts, accessories, plants, chattels, fixtures, buildings, land and other properties or any interest in any properties; and/or for the provision of services, including but not limited to project and sales management and any other management and consultancy services; and/or for construction, development, leases, tenancy, licensing, dealership and distributorship; and/or for the provision of treasury functions, advances in the conduct of normal trading, banking, insurance, investment, stockbroking and/or other businesses between the Company or its related corporations and corporations in which YBhg Tan Sri Quek Leng Chan is deemed to have interests.
Neither at the end of the financial year, nor at any time during the financial year, did there subsist any other arrangements to which the Company is a party, with the object or objects of enabling the Directors of the Company to acquire benefits by means of the acquisition of shares in, or debentures of, the Company or any other body corporate, other than the share options granted pursuant to the Executive Share Option Scheme and Executive Share Scheme.
eXeCUtIve SHare optIoN SCHeMe aND eXeCUtIve SHare SCHeMe
There are two share issuance schemes in place in the Company, namely Executive Share Option Scheme 2006/2016 and Executive Share Scheme. Executive Share Option Scheme 2006/2016 had expired on 23 January 2016.
(a) executive Share option Scheme 2006/2016 (“eSoS 2006/2016”)
The ESOS 2006/2016 of up to fifteen percent (15%) of the issued and paid-up ordinary share capital of the Company, which was approved by the shareholders of the Company on 8 November 2005, was established on 23 January 2006 and had been in force for a period of ten (10) years.
There were no options granted under the ESOS 2006/2016 of the Company during the financial year ended 30 June 2016.
DIreCtorS’ report for the financial year ended 30 June 2016

63Corporate / Financials / Additional Information
eXeCUtIve SHare optIoN SCHeMe aND eXeCUtIve SHare SCHeMe (CoNtINUeD)
(a) executive Share option Scheme 2006/2016 (“eSoS 2006/2016”) (continued)
As at 30 June 2016, a total of 20,451,000 options had been granted under ESOS 2006/2016, out of which 15,936,000 options had been exercised and there are no options remaining outstanding. The aggregate options granted to Directors and chief executives of the Group under the ESOS 2006/2016 amounted to 15,800,000, out of which 12,755,000 options had been exercised and there are no options outstanding.
Since the commencement of the ESOS 2006/2016, the maximum allocation applicable to Directors and senior management of the Group is 50% of the ESOS 2006/2016 Aggregate Maximum Allocation.
As at 30 June 2016, the actual percentage of total options granted to Directors and senior management of the Group under the ESOS 2006/2016 was 1.66% of the issued and paid up ordinary share capital of the Company.
The ESOS 2006/2016 had expired on 23 January 2016.
(b) executive Share Scheme (“eSS”)
The ESS of up to ten percent (10%) of the issued and paid-up ordinary share capital (excluding treasury shares) of the Company comprises the Executive Share Option Scheme 2013/2023 (“ESOS 2013/2023”) and the Executive Share Grant Scheme (“ESGS”).
(i) ESOS 2013/2023
The ESOS 2013/2023 which was approved by the shareholders of the Company on 30 October 2012, was established on 12 March 2013 and would be in force for a period of ten (10) years.
On 18 September 2012, the Company announced that Bursa Malaysia Securities Berhad had resolved to approve the listing of new ordinary shares of the Company to be issued pursuant to the exercise of options under the ESOS 2013/2023.
The ESOS 2013/2023 would provide an opportunity for eligible executives who had contributed to the growth and development of the Group to participate in the equity of the Company.
(ii) ESGS
The ESGS which was approved by the shareholders of the Company on 29 October 2013, was established on 28 February 2014 and would end on 11 March 2023.
On 6 September 2013, the Company announced that Bursa Malaysia Securities Berhad had resolved to approve-in-principle the listing of new ordinary shares of the Company to be issued pursuant to the ESGS.
The ESGS would provide the Company with the flexibility to reward the eligible executives of the Group for their contribution with awards of the Company’s shares without any consideration payable by the eligible executives.
At any point of time during the existence of the ESS, the aggregate number of shares comprised in the options and grants under the ESS and any other executive share schemes established by the Company which are still subsisting shall not exceed 10% of the issued and paid-up ordinary share capital (excluding treasury shares) of the Company at any one time (“Schemes Aggregate Maximum Allocation”).
There were 12,200,000 options granted at an exercise price of RM16.88 under the ESS of the Company on 2 April 2015.
DIreCtorS’ report for the financial year ended 30 June 2016

HONG LEONG FINANCIAL GROUP BERHAD ANNUAL REPORT 201664
eXeCUtIve SHare optIoN SCHeMe aND eXeCUtIve SHare SCHeMe (CoNtINUeD)
(b) executive Share Scheme (“eSS”) (continued)
Arising from the completion of the Company’s Rights Issue on 7 December 2015, the exercise price for the share options granted on 2 April 2015 under the ESS was adjusted from RM16.88 to RM16.61 and additional share options of 189,819 were allotted to the option holders, in accordance with the provisions of the Bye-Laws governing the ESS.
As at 30 June 2016, a total of 12,389,819 options had been granted under ESS, with 11,688,183 options remaining outstanding. The aggregate options granted to Directors and chief executives of the Group under the ESS amounted to 5,081,823, all of which remain outstanding.
Since the commencement of the ESS, the maximum allocation applicable to Directors and senior management of the Group is 50% of the Schemes Aggregate Maximum Allocation.
As at 30 June 2016, the actual percentage of total options granted to Directors and senior management of the Group under the ESS was 0.84% of the issued and paid up ordinary share capital of the Company, and the actual percentage of total options granted to Directors and senior management of the Group during the financial year ended 30 June 2016 was 0.01% of the issued and paid up ordinary share capital of the Company.
A trust has been set up for the ESOS 2006/2016 and ESS (collectively “Schemes”) and it is administered by an appointed trustee. This trustee will be entitled from time to time to accept financial assistance from the Company upon such terms and conditions as the Company and the trustee may agree to purchase the Company’s shares from the open market for the purposes of this trust. In accordance with MFRS 132, the shares purchased for the benefit of the Schemes holdings are recorded as “Treasury Shares for ESOS” in the shareholders’ equity on the Statements of Financial Position. The cost of operating the Schemes is charged to the statements of income.
For further details on the ESOS 2006/2016 and ESS, refer to Note 51 on Equity Compensation Benefits.
SHare CapItaL
During the financial year ended 30 June 2016, the Company increased its issued and paid-up capital from 1,052,767,789 to 1,147,516,890 via issuance of 94,749,101 new ordinary shares of RM1.00 each on the basis of 9 rights shares for every 100 existing shares held by HLFG entitled shareholders on 6 November 2015 at an issue price of RM11.60 per rights share.
StatUtorY INForMatIoN reGarDING tHe GroUp aND tHe CoMpaNY
(a) as at the end of the financial year
(i) Before the statements of income and statements of financial position of the Group and the Company were made out, the Directors took reasonable steps:
• to ascertain that proper action had been taken in relation to the writing off of bad debts and financing and the making of allowance for doubtful debts and financing and had satisfied themselves that all known bad debts and financing had been written off and that adequate allowance had been made for doubtful debts and financing; and
• to ensure that any current assets, other than debts and financing, which were unlikely to realise their book values in the ordinary course of business had been written down to their estimated realisable values.
(ii) In the opinion of the Directors, the results of the operations of the Group and the Company during the financial year had not been substantially affected by any item, transaction or event of a material and unusual nature.
DIreCtorS’ report for the financial year ended 30 June 2016

65Corporate / Financials / Additional Information
StatUtorY INForMatIoN reGarDING tHe GroUp aND tHe CoMpaNY (CoNtINUeD)
(b) From the end of the financial year to the date of this report
(i) The Directors are not aware of any circumstances:
• which would render the amount written off for bad debts and financing or the amount of the allowance for doubtful debts and financing in the financial statements of the Group and the Company, inadequate to any substantial extent;
• which would render the values attributed to current assets in the financial statements of the Group and the Company misleading; and
• which had arisen which would render adherence to the existing method of valuation of assets or liabilities of the Group and the Company misleading or inappropriate.
(ii) In the opinion of the Directors:
• the results of the operations of the Group and the Company for the financial year ended 30 June 2016 are not likely to be substantially affected by any item, transaction or event of a material and unusual nature which had arisen in the interval between the end of the financial year and the date of this report; and
• no contingent or other liability has become enforceable, or is likely to become enforceable, within the period of twelve months after the end of the financial year which will or may affect the ability of the Group and the Company to meet their obligations as and when they fall due.
(c) as at the date of this report
(i) There are no charges on the assets of the Group and the Company which had arisen since the end of the financial year to secure the liabilities of any other person.
(ii) There are no contingent liabilities which had arisen since the end of the financial year.
(iii) The Directors are not aware of any circumstances not otherwise dealt with in the report or financial statements of the Group and the Company which would render any amount stated in the financial statements misleading.
DISCLoSUre oF SHarIaH aDvISorY CoMMIttee
The Group’s Islamic banking and takaful business activities are subject to the Shariah compliance and confirmation by the Shariah Advisory Committee consisting of 5 scholars, at all times, appointed by the Board of Directors of Hong Leong Islamic Bank Berhad and Hong Leong MSIG Takaful Berhad, and approved by Bank Negara Malaysia.
The primary role of the Shariah Advisory Committee is mainly advising on matters relating to the business operations and products of the Group and providing support by attending regular meetings with the Group to ensure that they are in conformity with Shariah principles.
DIreCtorS’ report for the financial year ended 30 June 2016

HONG LEONG FINANCIAL GROUP BERHAD ANNUAL REPORT 201666
ULtIMate HoLDING CoMpaNY
The ultimate holding company is Hong Leong Company (Malaysia) Berhad, a company incorporated in Malaysia.
aUDItorS
The auditors, Messrs PricewaterhouseCoopers, have expressed their willingness to continue in office.
Signed on behalf of the Board of Directors in accordance with their resolution dated 15 September 2016.
tan Kong Khoon Lim tau KienDirector Director
Kuala Lumpur 15 September 2016
DIreCtorS’ report for the financial year ended 30 June 2016
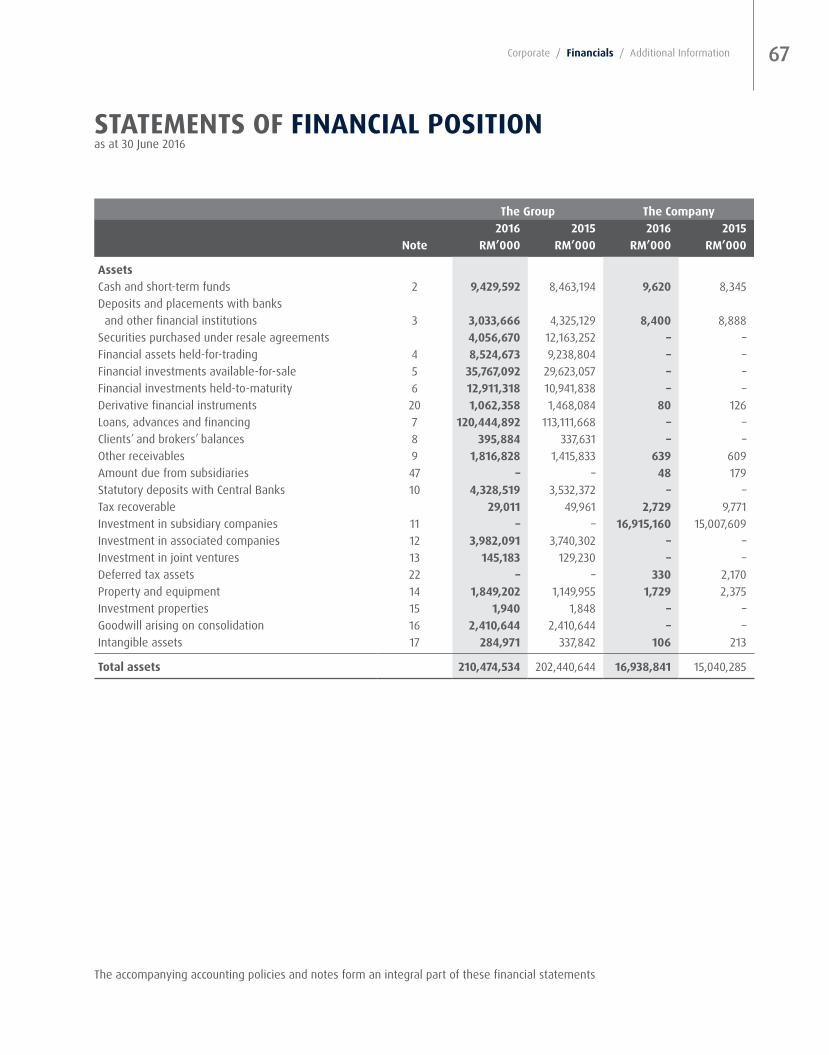
67Corporate / Financials / Additional Information
the Group the Company2016 2015 2016 2015
Note rM’000 rM’000 rM’000 rM’000
assetsCash and short-term funds 2 9,429,592 8,463,194 9,620 8,345 Deposits and placements with banks and other financial institutions 3 3,033,666 4,325,129 8,400 8,888 Securities purchased under resale agreements 4,056,670 12,163,252 – – Financial assets held-for-trading 4 8,524,673 9,238,804 – – Financial investments available-for-sale 5 35,767,092 29,623,057 – – Financial investments held-to-maturity 6 12,911,318 10,941,838 – – Derivative financial instruments 20 1,062,358 1,468,084 80 126 Loans, advances and financing 7 120,444,892 113,111,668 – – Clients’ and brokers’ balances 8 395,884 337,631 – – Other receivables 9 1,816,828 1,415,833 639 609 Amount due from subsidiaries 47 – – 48 179 Statutory deposits with Central Banks 10 4,328,519 3,532,372 – – Tax recoverable 29,011 49,961 2,729 9,771 Investment in subsidiary companies 11 – – 16,915,160 15,007,609 Investment in associated companies 12 3,982,091 3,740,302 – – Investment in joint ventures 13 145,183 129,230 – – Deferred tax assets 22 – – 330 2,170 Property and equipment 14 1,849,202 1,149,955 1,729 2,375 Investment properties 15 1,940 1,848 – – Goodwill arising on consolidation 16 2,410,644 2,410,644 – – Intangible assets 17 284,971 337,842 106 213
total assets 210,474,534 202,440,644 16,938,841 15,040,285
StateMeNtS oF FINaNCIaL poSItIoNas at 30 June 2016
The accompanying accounting policies and notes form an integral part of these financial statements
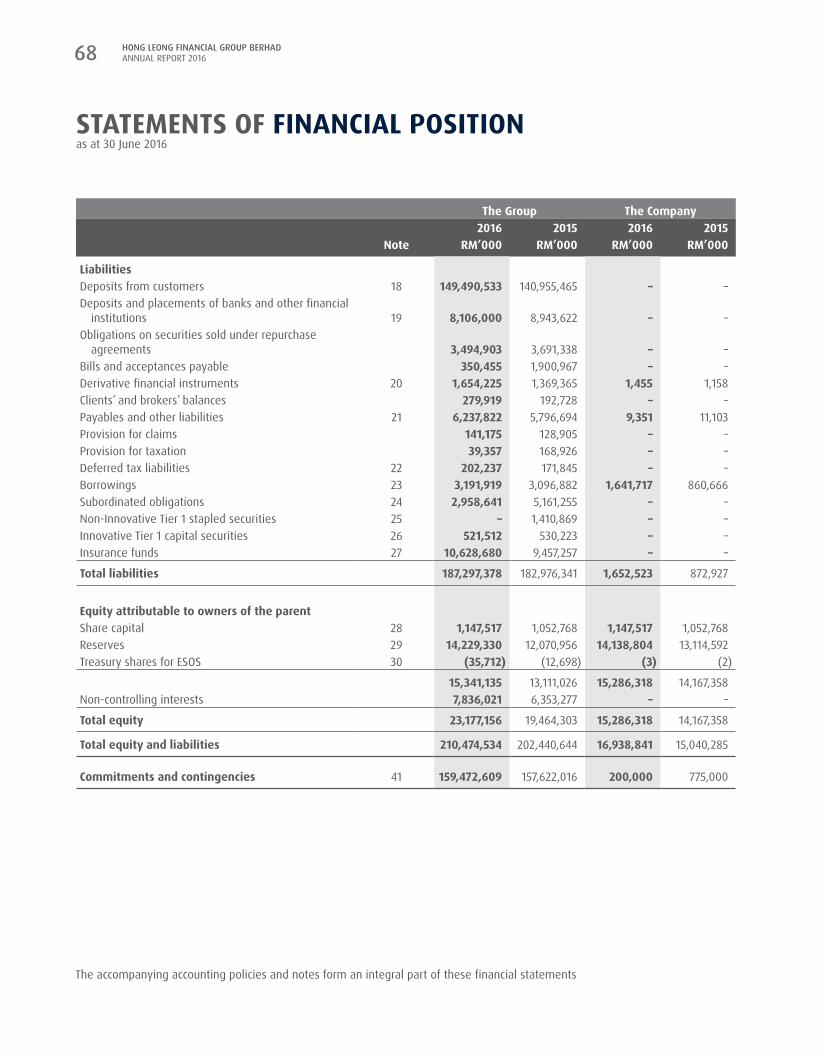
HONG LEONG FINANCIAL GROUP BERHAD ANNUAL REPORT 201668
the Group the Company2016 2015 2016 2015
Note rM’000 rM’000 rM’000 rM’000
LiabilitiesDeposits from customers 18 149,490,533 140,955,465 – – Deposits and placements of banks and other financial
institutions 19 8,106,000 8,943,622 – – Obligations on securities sold under repurchase
agreements 3,494,903 3,691,338 – – Bills and acceptances payable 350,455 1,900,967 – – Derivative financial instruments 20 1,654,225 1,369,365 1,455 1,158 Clients’ and brokers’ balances 279,919 192,728 – – Payables and other liabilities 21 6,237,822 5,796,694 9,351 11,103 Provision for claims 141,175 128,905 – – Provision for taxation 39,357 168,926 – – Deferred tax liabilities 22 202,237 171,845 – – Borrowings 23 3,191,919 3,096,882 1,641,717 860,666 Subordinated obligations 24 2,958,641 5,161,255 – – Non-Innovative Tier 1 stapled securities 25 – 1,410,869 – – Innovative Tier 1 capital securities 26 521,512 530,223 – – Insurance funds 27 10,628,680 9,457,257 – –
total liabilities 187,297,378 182,976,341 1,652,523 872,927
equity attributable to owners of the parentShare capital 28 1,147,517 1,052,768 1,147,517 1,052,768 Reserves 29 14,229,330 12,070,956 14,138,804 13,114,592 Treasury shares for ESOS 30 (35,712) (12,698) (3) (2)
15,341,135 13,111,026 15,286,318 14,167,358 Non-controlling interests 7,836,021 6,353,277 – –
total equity 23,177,156 19,464,303 15,286,318 14,167,358
total equity and liabilities 210,474,534 202,440,644 16,938,841 15,040,285
Commitments and contingencies 41 159,472,609 157,622,016 200,000 775,000
StateMeNtS oF FINaNCIaL poSItIoNas at 30 June 2016
The accompanying accounting policies and notes form an integral part of these financial statements
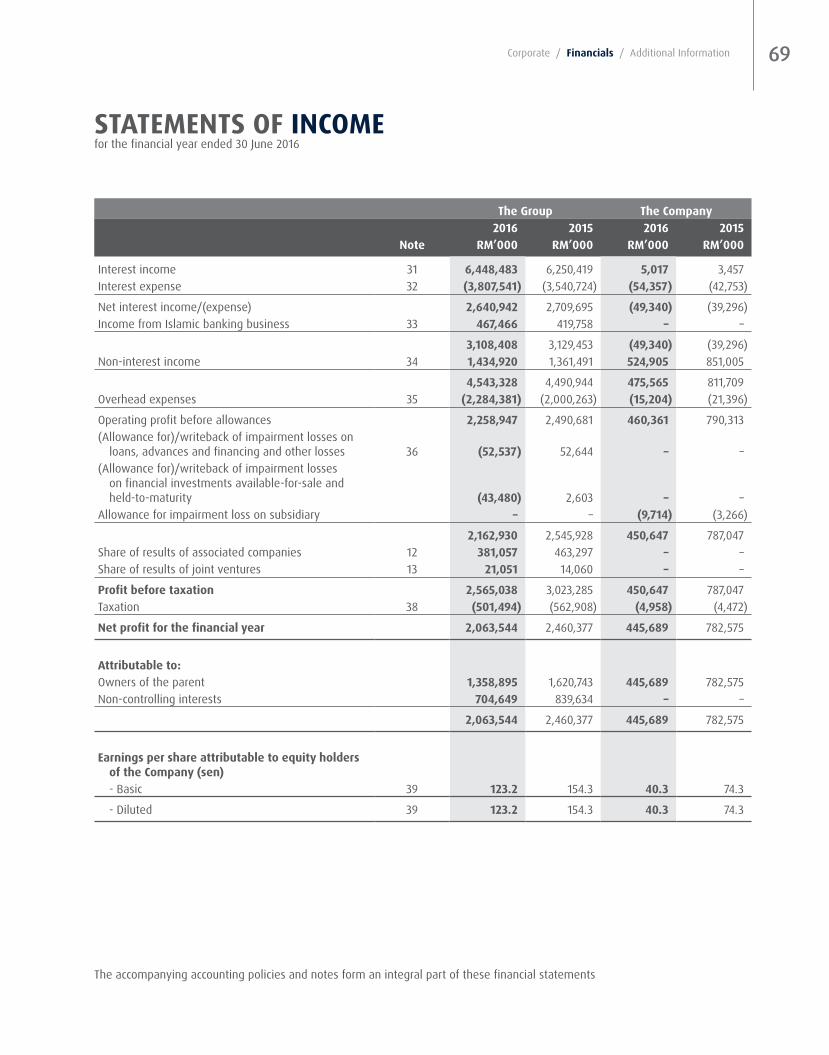
69Corporate / Financials / Additional Information
the Group the Company2016 2015 2016 2015
Note rM’000 rM’000 rM’000 rM’000
Interest income 31 6,448,483 6,250,419 5,017 3,457 Interest expense 32 (3,807,541) (3,540,724) (54,357) (42,753)
Net interest income/(expense) 2,640,942 2,709,695 (49,340) (39,296)Income from Islamic banking business 33 467,466 419,758 – –
3,108,408 3,129,453 (49,340) (39,296)Non-interest income 34 1,434,920 1,361,491 524,905 851,005
4,543,328 4,490,944 475,565 811,709 Overhead expenses 35 (2,284,381) (2,000,263) (15,204) (21,396)
Operating profit before allowances 2,258,947 2,490,681 460,361 790,313 (Allowance for)/writeback of impairment losses on
loans, advances and financing and other losses 36 (52,537) 52,644 – – (Allowance for)/writeback of impairment losses
on financial investments available-for-sale and held-to-maturity (43,480) 2,603 – –
Allowance for impairment loss on subsidiary – – (9,714) (3,266)
2,162,930 2,545,928 450,647 787,047 Share of results of associated companies 12 381,057 463,297 – – Share of results of joint ventures 13 21,051 14,060 – –
profit before taxation 2,565,038 3,023,285 450,647 787,047 Taxation 38 (501,494) (562,908) (4,958) (4,472)
Net profit for the financial year 2,063,544 2,460,377 445,689 782,575
attributable to:Owners of the parent 1,358,895 1,620,743 445,689 782,575 Non-controlling interests 704,649 839,634 – –
2,063,544 2,460,377 445,689 782,575
earnings per share attributable to equity holders of the Company (sen)- Basic 39 123.2 154.3 40.3 74.3
- Diluted 39 123.2 154.3 40.3 74.3
StateMeNtS oF INCoMefor the financial year ended 30 June 2016
The accompanying accounting policies and notes form an integral part of these financial statements
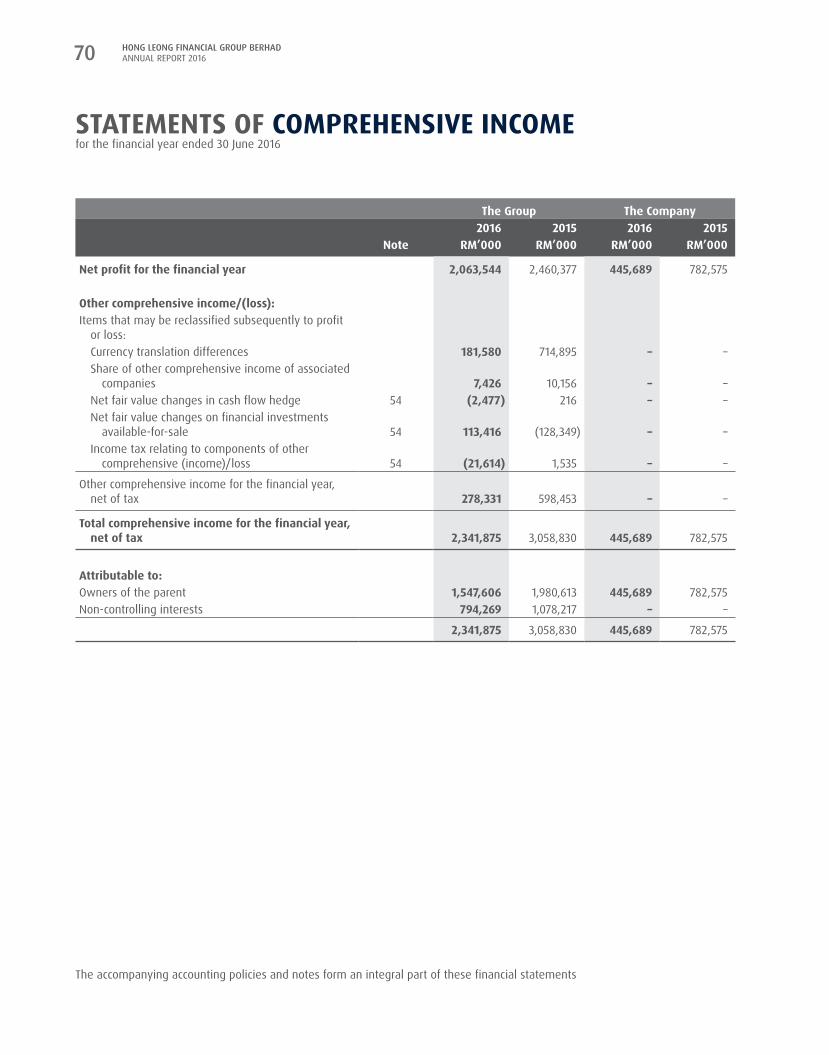
HONG LEONG FINANCIAL GROUP BERHAD ANNUAL REPORT 201670
the Group the Company2016 2015 2016 2015
Note rM’000 rM’000 rM’000 rM’000
Net profit for the financial year 2,063,544 2,460,377 445,689 782,575
other comprehensive income/(loss):Items that may be reclassified subsequently to profit
or loss:Currency translation differences 181,580 714,895 – – Share of other comprehensive income of associated
companies 7,426 10,156 – – Net fair value changes in cash flow hedge 54 (2,477) 216 – – Net fair value changes on financial investments
available-for-sale 54 113,416 (128,349) – – Income tax relating to components of other
comprehensive (income)/loss 54 (21,614) 1,535 – –
Other comprehensive income for the financial year, net of tax 278,331 598,453 – –
total comprehensive income for the financial year, net of tax 2,341,875 3,058,830 445,689 782,575
attributable to:Owners of the parent 1,547,606 1,980,613 445,689 782,575 Non-controlling interests 794,269 1,078,217 – –
2,341,875 3,058,830 445,689 782,575
StateMeNtS oF CoMpreHeNSIve INCoMe for the financial year ended 30 June 2016
The accompanying accounting policies and notes form an integral part of these financial statements
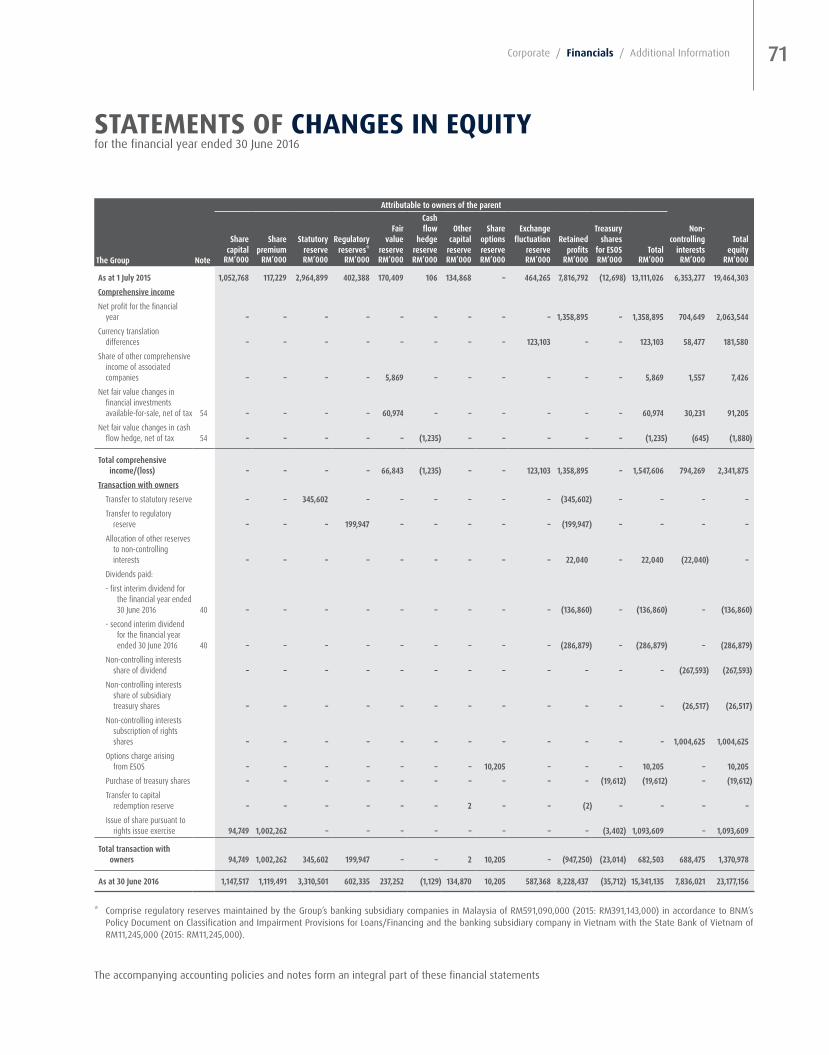
71Corporate / Financials / Additional Information
The accompanying accounting policies and notes form an integral part of these financial statements
attributable to owners of the parent
the Group Note
Share capital
Share premium
Statutory reserve
regulatory reserves*
Fair value
reserve
Cash flow
hedge reserve
other capital
reserve
Share options reserve
exchange fluctuation
reserve retained
profits
treasury
shares for eSoS total
Non- controlling
interests total
equity rM’000 rM’000 rM’000 rM’000 rM’000 rM’000 rM’000 rM’000 rM’000 rM’000 rM’000 rM’000 rM’000 rM’000
as at 1 July 2015 1,052,768 117,229 2,964,899 402,388 170,409 106 134,868 – 464,265 7,816,792 (12,698) 13,111,026 6,353,277 19,464,303
Comprehensive income
Net profit for the financial year – – – – – – – – – 1,358,895 – 1,358,895 704,649 2,063,544
Currency translation differences – – – – – – – – 123,103 – – 123,103 58,477 181,580
Share of other comprehensive income of associated companies – – – – 5,869 – – – – – – 5,869 1,557 7,426
Net fair value changes in financial investments available-for-sale, net of tax 54 – – – – 60,974 – – – – – – 60,974 30,231 91,205
Net fair value changes in cash flow hedge, net of tax 54 – – – – – (1,235) – – – – – (1,235) (645) (1,880)
total comprehensive income/(loss) – – – – 66,843 (1,235) – – 123,103 1,358,895 – 1,547,606 794,269 2,341,875
transaction with owners
Transfer to statutory reserve – – 345,602 – – – – – – (345,602) – – – –
Transfer to regulatory reserve – – – 199,947 – – – – – (199,947) – – – –
Allocation of other reserves to non-controlling interests – – – – – – – – – 22,040 – 22,040 (22,040) –
Dividends paid:
- first interim dividend for the financial year ended 30 June 2016 40 – – – – – – – – – (136,860) – (136,860) – (136,860)
- second interim dividend for the financial year ended 30 June 2016 40 – – – – – – – – – (286,879) – (286,879) – (286,879)
Non-controlling interests share of dividend – – – – – – – – – – – – (267,593) (267,593)
Non-controlling interests share of subsidiary treasury shares – – – – – – – – – – – – (26,517) (26,517)
Non-controlling interests subscription of rights shares – – – – – – – – – – – – 1,004,625 1,004,625
Options charge arising from ESOS – – – – – – – 10,205 – – – 10,205 – 10,205
Purchase of treasury shares – – – – – – – – – – (19,612) (19,612) – (19,612)
Transfer to capital redemption reserve – – – – – – 2 – – (2) – – – –
Issue of share pursuant to rights issue exercise 94,749 1,002,262 – – – – – – – – (3,402) 1,093,609 – 1,093,609
total transaction with owners 94,749 1,002,262 345,602 199,947 – – 2 10,205 – (947,250) (23,014) 682,503 688,475 1,370,978
as at 30 June 2016 1,147,517 1,119,491 3,310,501 602,335 237,252 (1,129) 134,870 10,205 587,368 8,228,437 (35,712) 15,341,135 7,836,021 23,177,156
* Comprise regulatory reserves maintained by the Group’s banking subsidiary companies in Malaysia of RM591,090,000 (2015: RM391,143,000) in accordance to BNM’s
Policy Document on Classification and Impairment Provisions for Loans/Financing and the banking subsidiary company in Vietnam with the State Bank of Vietnam of RM11,245,000 (2015: RM11,245,000).
StateMeNtS oF CHaNGeS IN eQUItYfor the financial year ended 30 June 2016

HONG LEONG FINANCIAL GROUP BERHAD ANNUAL REPORT 201672
StateMeNtS oF CHaNGeS IN eQUItYfor the financial year ended 30 June 2016
attributable to owners of the parent
the Group Note
Share capital
Share premium
Statutory reserve
regulatory reserves*
Fair value
reserve
Cash flow
hedge reserve
other capital
reserve
Share options reserve
exchange fluctuation
reserve retained
profits
treasury shares
for eSoS total
Non- controlling
interests total
equity rM’000 rM’000 rM’000 rM’000 rM’000 rM’000 rM’000 rM’000 rM’000 rM’000 rM’000 rM’000 rM’000 rM’000
as at 1 July 2014 1,052,768 117,229 2,454,525 10,266 287,257 – 134,848 7,806 (12,347) 7,447,552 (25,422) 11,474,482 5,530,249 17,004,731
Comprehensive income
Net profit for the financial year – – – – – – – – – 1,620,743 – 1,620,743 839,634 2,460,377
Currency translation differences – – – – – – – – 476,612 – – 476,612 238,283 714,895
Share of other comprehensive loss of associated companies – – – – 5,560 – – – – – – 5,560 4,596 10,156
Net fair value changes in financial investments available-for-sale, net of tax 54 – – – – (122,408) – – – – – – (122,408) (4,352) (126,760)
Net fair value changes in cash flow hedge, net of tax 54 – – – – – 106 – – – – – 106 56 162
total comprehensive (loss)/income – – – – (116,848) 106 – – 476,612 1,620,743 – 1,980,613 1,078,217 3,058,830
transaction with owners
Transfer to statutory reserve – – 510,374 – – – – – – (510,374) – – – –
Transfer to regulatory reserve – – – 392,122 – – – – – (392,122) – – – –
Allocation of other reserves to non-controlling interests – – – – – – – – – 17,427 – 17,427 29,183 46,610
Dividends paid:
- first interim dividend for the financial year ended 30 June 2015 40 – – – – – – – – – (136,470) – (136,470) – (136,470)
- second interim dividend for the financial year ended 30 June 2015 40 – – – – – – – – – (263,186) – (263,186) – (263,186)
Non-controlling interests share of dividend – – – – – – – – – – – – (283,254) (283,254)
Non-controlling interests share of subsidiary treasury shares – – – – – – – – – – – – (1,118) (1,118)
Options charge arising from ESOS – – – – – – – 2,108 – – – 2,108 – 2,108
Purchase of treasury shares – – – – – – – – – – (2,695) (2,695) – (2,695)
Exercise of ESOS – – – – – – – (9,914) – 33,242 15,419 38,747 – 38,747
Transfer to capital redemption reserve – – – – – – 20 – – (20) – – – –
total transaction with owners – – 510,374 392,122 – – 20 (7,806) – (1,251,503) 12,724 (344,069) (255,189) (599,258)
as at 30 June 2015 1,052,768 117,229 2,964,899 402,388 170,409 106 134,868 – 464,265 7,816,792 (12,698) 13,111,026 6,353,277 19,464,303
* Comprise regulatory reserves maintained by the Group’s banking subsidiary companies in Malaysia of RM391,143,000 in accordance to BNM’s Policy Document on Classification and Impairment Provisions for Loans/Financing and the banking subsidiary company in Vietnam with the State Bank of Vietnam of RM11,245,000.
The accompanying accounting policies and notes form an integral part of these financial statements

73Corporate / Financials / Additional Information 73Corporate / Financials / Additional Information
StateMeNtS oF CHaNGeS IN eQUItYfor the financial year ended 30 June 2016
The accompanying accounting policies and notes form an integral part of these financial statements
Non-distributable Distributable
Share capital
Share premium
other capital
reserve
Share options reserve
treasury shares
for eSoS retained
profits total
equity the Company Note rM’000 rM’000 rM’000 rM’000 rM’000 rM’000 rM’000
as at 1 July 2015 1,052,768 117,229 254,991 – (2) 12,742,372 14,167,358Net profit for the financial year – – – – – 445,689 445,689Dividends paid
- first interim dividend for the financial year ended 30 June 2016 40 – – – – – (136,860) (136,860)
- second interim dividend for the financial year ended 30 June 2016 40 – – – – – (286,879) (286,879)
Options charge arising from ESOS – – – – – – –Subscription of rights shares – – – – (1) – (1)Issue of share pursuant to rights
issue exercise 94,749 1,002,262 – – – – 1,097,011
as at 30 June 2016 1,147,517 1,119,491 254,991 – (3) 12,764,322 15,286,318
as at 1 July 2014 1,052,768 117,229 254,991 4,638 (15,181) 12,332,614 13,747,059Net profit for the financial year – – – – – 782,575 782,575Dividends paid
- first interim dividend for the financial year ended 30 June 2015 40 – – – – – (136,470) (136,470)
- second interim dividend for the financial year ended 30 June 2015 40 – – – – – (263,186) (263,186)
Options charge arising from ESOS – – – 2,070 – – 2,070Exercise of ESOS – – – (6,708) 15,179 26,839 35,310
as at 30 June 2015 1,052,768 117,229 254,991 – (2) 12,742,372 14,167,358

HONG LEONG FINANCIAL GROUP BERHAD ANNUAL REPORT 201674
CoNSoLIDateD StateMeNtS oF CaSH FLoWSfor the financial year ended 30 June 2016
the Group2016 2015
rM’000 rM’000
Cash flows from operating activitiesProfit before taxation 2,565,038 3,023,285 Adjustments for:
Unearned premium reserves 16,077 68 Life fund - underwriting surplus 1,350,914 1,333,631 Depreciation of property and equipment 93,119 77,507 Amortisation of intangible assets 78,308 73,249 Intangible assets written off 3,386 2,875 Property and equipment written off 834 209 Gain on sale of property and equipment (1,967) (6,947)Gain on revaluation of investment properties (92) (88)Gain from disposal of financial assets held-for-trading (54,224) (58,341)Gain from disposal of financial investments available-for-sale (103,435) (123,980)Gain from redemption of financial investments held-to-maturity (31) (350)Loss from disposal of derivative financial instruments 19,444 8,673 Net unrealised loss on revaluation of financial assets held-for-trading and derivative financial
instruments 100,450 49,333 Net realised loss on fair value changes arising from fair value hedges and amortisation of fair
value changes arising from terminated fair value hedges 519 3,279 Unrealised exchange loss 176,516 342,115 Allowance for/(writeback of) impairment losses on financial investments 43,480 (2,603)Allowances for impairment losses on loans, advances and financing and other losses 259,147 163,033 Impaired loans and financing written off 22,048 45,617 Interest expense on borrowings 126,718 140,938 Interest expense on subordinated obligations 171,079 226,515 Interest expense on Non-Innovative Tier 1 stapled securities 60,024 71,317 Interest expense on Innovative Tier 1 capital securities 32,652 30,516 Interest income from financial assets held-for-trading (554,361) (576,911)Interest income from financial investments available-for-sale (548,827) (458,054)Interest income from financial investments held-to-maturity (325,274) (274,044)Dividend income from financial assets held-for-trading and financial investments
available-for-sale (233,667) (181,235)Options charge arising from ESOS 10,205 2,108 Surplus transferred from life insurance business (185,586) (222,539)Share of results of associated companies (381,057) (463,297)Share of results of joint ventures (21,051) (14,060)
155,348 188,534
operating profit before working capital changes 2,720,386 3,211,819
The accompanying accounting policies and notes form an integral part of these financial statements
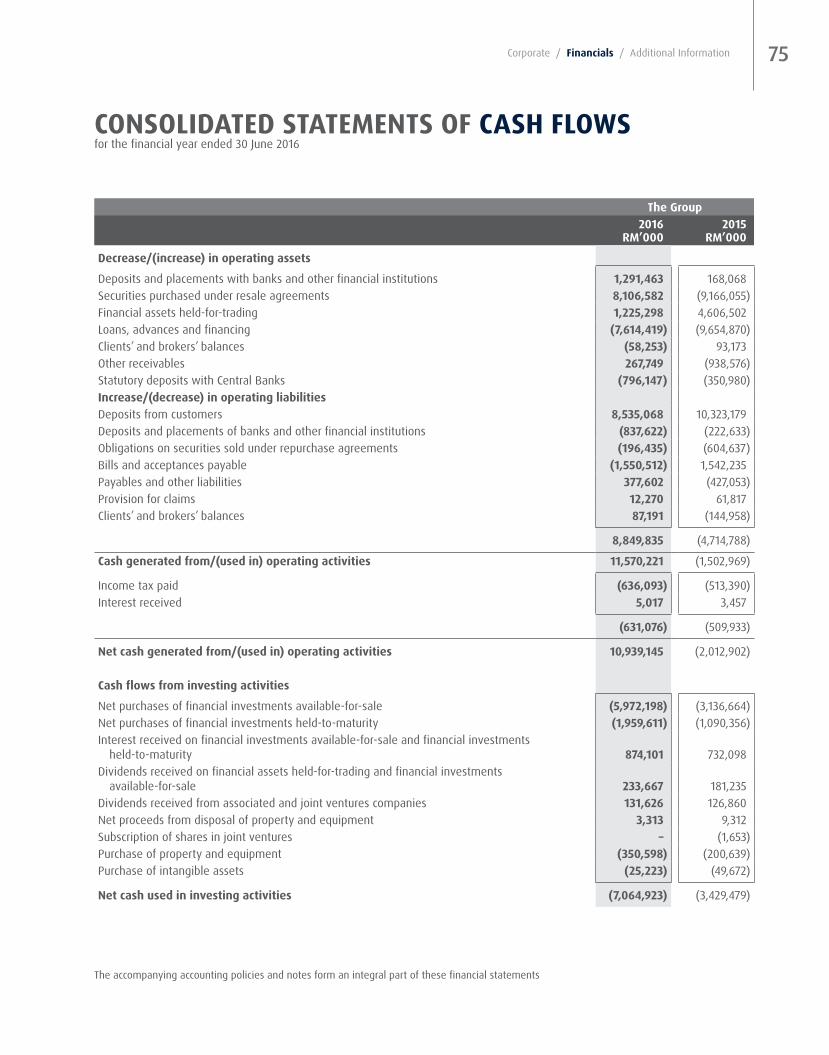
75Corporate / Financials / Additional Information
CoNSoLIDateD StateMeNtS oF CaSH FLoWSfor the financial year ended 30 June 2016
The accompanying accounting policies and notes form an integral part of these financial statements
the Group2016 2015
rM’000 rM’000
Decrease/(increase) in operating assets
Deposits and placements with banks and other financial institutions 1,291,463 168,068 Securities purchased under resale agreements 8,106,582 (9,166,055)Financial assets held-for-trading 1,225,298 4,606,502 Loans, advances and financing (7,614,419) (9,654,870)Clients’ and brokers’ balances (58,253) 93,173 Other receivables 267,749 (938,576)Statutory deposits with Central Banks (796,147) (350,980)Increase/(decrease) in operating liabilitiesDeposits from customers 8,535,068 10,323,179 Deposits and placements of banks and other financial institutions (837,622) (222,633)Obligations on securities sold under repurchase agreements (196,435) (604,637)Bills and acceptances payable (1,550,512) 1,542,235 Payables and other liabilities 377,602 (427,053)Provision for claims 12,270 61,817 Clients’ and brokers’ balances 87,191 (144,958)
8,849,835 (4,714,788)
Cash generated from/(used in) operating activities 11,570,221 (1,502,969)
Income tax paid (636,093) (513,390)Interest received 5,017 3,457
(631,076) (509,933)
Net cash generated from/(used in) operating activities 10,939,145 (2,012,902)
Cash flows from investing activities
Net purchases of financial investments available-for-sale (5,972,198) (3,136,664)Net purchases of financial investments held-to-maturity (1,959,611) (1,090,356)Interest received on financial investments available-for-sale and financial investments
held-to-maturity 874,101 732,098 Dividends received on financial assets held-for-trading and financial investments
available-for-sale 233,667 181,235 Dividends received from associated and joint ventures companies 131,626 126,860 Net proceeds from disposal of property and equipment 3,313 9,312 Subscription of shares in joint ventures – (1,653)Purchase of property and equipment (350,598) (200,639)Purchase of intangible assets (25,223) (49,672)
Net cash used in investing activities (7,064,923) (3,429,479)

HONG LEONG FINANCIAL GROUP BERHAD ANNUAL REPORT 201676
CoNSoLIDateD StateMeNtS oF CaSH FLoWSfor the financial year ended 30 June 2016
the Group2016 2015
Note rM’000 rM’000
Cash flows from financing activities
Interest paid on subordinated obligations (188,840) (224,517)Interest paid on borrowings (129,859) (196,661)Interest paid on Non-Innovative Tier 1 stapled securities (70,893) (70,700)Interest paid on Innovative Tier 1 capital securities (31,143) (29,137)Drawdown/(repayment) of revolving credit 305,000 (65,000)Issuance/(redemption) of medium term notes and commercial papers 375,000 (2,410,000)Drawdown of term loans 120,000 240,000 Repayment of term loans (25,000) (265,000)Repayment of senior bonds (1,241,100) – Repayment of Non-Innovative Tier 1 stapled securities (1,400,000) – Repayment of subordinated obligations (2,185,000) (200,000)Purchase of treasury shares (19,612) (2,695)Cash received from ESOS exercised – 38,747 Net proceeds from rights issue 1,093,609 – Non-controlling interests subscription of rights shares 1,004,625 – Dividends paid to - owners of the parent (423,739) (399,656) - non-controlling interest (267,593) (283,254)
Net cash used in financing activities (3,084,545) (3,867,873)
Net increase/(decrease) in cash and cash equivalents 789,677 (9,310,254)effects of exchange rate changes 176,721 688,188 Cash and cash equivalents at beginning of financial year 8,462,294 17,084,360
Cash and cash equivalents at end of financial year 2 9,428,692 8,462,294
analysis of cash and cash equivalentsCash and short-term funds 2 9,429,592 8,463,194 Less: restricted cash 2 (900) (900)
9,428,692 8,462,294
The accompanying accounting policies and notes form an integral part of these financial statements
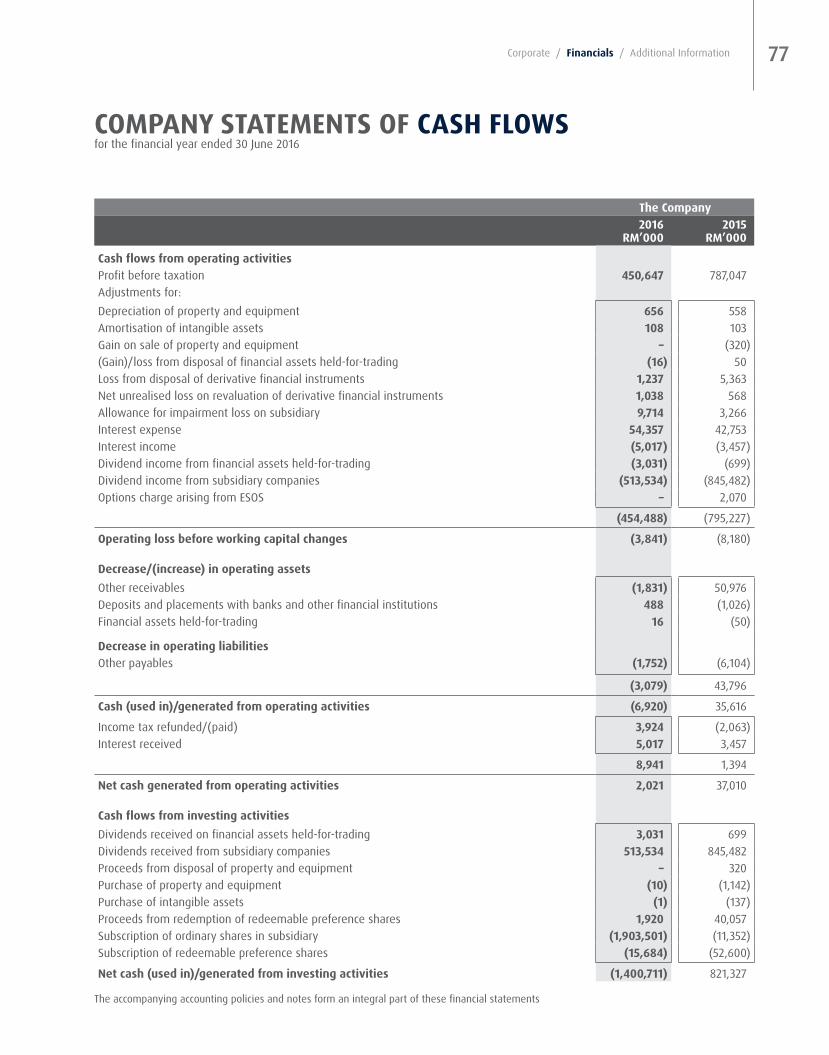
77Corporate / Financials / Additional Information
CoMpaNY StateMeNtS oF CaSH FLoWSfor the financial year ended 30 June 2016
The accompanying accounting policies and notes form an integral part of these financial statements
the Company2016 2015
rM’000 rM’000
Cash flows from operating activitiesProfit before taxation 450,647 787,047 Adjustments for:Depreciation of property and equipment 656 558 Amortisation of intangible assets 108 103 Gain on sale of property and equipment – (320)(Gain)/loss from disposal of financial assets held-for-trading (16) 50 Loss from disposal of derivative financial instruments 1,237 5,363 Net unrealised loss on revaluation of derivative financial instruments 1,038 568 Allowance for impairment loss on subsidiary 9,714 3,266 Interest expense 54,357 42,753 Interest income (5,017) (3,457)Dividend income from financial assets held-for-trading (3,031) (699)Dividend income from subsidiary companies (513,534) (845,482)Options charge arising from ESOS – 2,070
(454,488) (795,227)
operating loss before working capital changes (3,841) (8,180)
Decrease/(increase) in operating assetsOther receivables (1,831) 50,976 Deposits and placements with banks and other financial institutions 488 (1,026)Financial assets held-for-trading 16 (50)
Decrease in operating liabilitiesOther payables (1,752) (6,104)
(3,079) 43,796
Cash (used in)/generated from operating activities (6,920) 35,616
Income tax refunded/(paid) 3,924 (2,063)Interest received 5,017 3,457
8,941 1,394
Net cash generated from operating activities 2,021 37,010
Cash flows from investing activitiesDividends received on financial assets held-for-trading 3,031 699 Dividends received from subsidiary companies 513,534 845,482 Proceeds from disposal of property and equipment – 320 Purchase of property and equipment (10) (1,142)Purchase of intangible assets (1) (137)Proceeds from redemption of redeemable preference shares 1,920 40,057 Subscription of ordinary shares in subsidiary (1,903,501) (11,352)Subscription of redeemable preference shares (15,684) (52,600)
Net cash (used in)/generated from investing activities (1,400,711) 821,327

HONG LEONG FINANCIAL GROUP BERHAD ANNUAL REPORT 201678
CoMpaNY StateMeNtS oF CaSH FLoWSfor the financial year ended 30 June 2016
the Company2016 2015
Note rM’000 rM’000
Cash flows from financing activities
Interest paid on borrowings (48,306) (43,428)Drawdown/(repayment) of revolving credit 305,000 (65,000)Issuance/(redemption) of medium term notes and commercial papers 375,000 (360,000)Drawdown of term loans 120,000 240,000 Repayment of term loans (25,000) (265,000)Cash received from ESOS exercised – 35,310 Proceeds from issuance of rights issue 1,097,010 – Dividends paid to shareholders of the Company (423,739) (399,656)
Net cash generated from/(used in) financing activities 1,399,965 (857,774)
Net increase in cash and cash equivalents 1,275 563 Cash and cash equivalents at beginning of financial year 7,445 6,882
Cash and cash equivalents at end of financial year 8,720 7,445
analysis of cash and cash equivalentsCash and short-term funds 2 9,620 8,345 Less: restricted cash 2 (900) (900)
8,720 7,445
The accompanying accounting policies and notes form an integral part of these financial statements

79Corporate / Financials / Additional Information
The following accounting policies have been used consistently in dealing with items that are considered material in relation to the financial statements.
a BaSIS oF preparatIoN oF tHe FINaNCIaL StateMeNtS
The financial statements of the Group and the Company have been prepared in accordance with the Malaysian Financial Reporting Standards (“MFRS”), International Financial Reporting Standards and the requirements of the Companies Act, 1965 in Malaysia. The financial statements incorporate the activities relating to the Islamic banking and takaful businesses which have been undertaken by its subsidiaries, Hong Leong Islamic Bank Berhad (“HLISB”) and Hong Leong MSIG Takaful Berhad (“HLMT”) in compliance with Shariah principles. Islamic banking business refers generally to the acceptance of deposits and granting of financing under Shariah principles while takaful business refers generally to underwriting of Islamic insurance under the Shariah principles.
The financial statements have been prepared under the historical cost convention, as modified by the revaluation of financial investments available-for-sale and financial assets/financial liabilities at fair value through profit or loss (including derivative financial instruments).
The preparation of financial statements in conformity with MFRS requires the use of certain critical accounting estimates and assumptions that affect the reported amounts of assets and liabilities and disclosure of contingent assets and liabilities at the date of the financial statements, and the reported amounts of income and expenses during the reported period. It also requires Directors to exercise their judgement in the process of applying the Group’s and the Company’s accounting policies. Although these estimates and judgement are based on the management and Directors’ best knowledge of current events and actions, actual results may differ from those estimates.
The areas involving a higher degree of judgement or complexity, or areas where assumptions and estimates are significant to the financial statements are disclosed in Note 55.
(a) Standards, amendments to published standards and interpretations that are effective and applicable to the Group and the Company
There are no new accounting standards, amendments to published standards and interpretations that are effective for the first time for the financial year beginning on 1 July 2015.
(b) Standards, amendments to published standards and interpretations to existing standards that are applicable to the Group and the Company but not yet effective
A number of new standards and amendments to standards and interpretations are effective for financial year beginning after 1 July 2016. The Group and the Company will apply these standards, amendments to published standards and interpretations from:
(i) Financial year beginning on/after 1 July 2016
• Amendment to MFRS 11 “Joint Arrangements” (effective from 1 January 2016) requires an investor to apply the principles of MFRS 3 “Business Combination” when it acquires an interest in a joint operation that constitutes a business. The amendments are applicable to both the acquisition of the initial interest in a joint operation and the acquisition of additional interest in the same joint operation. However, a previously held interest is not re-measured when the acquisition of an additional interest in the same joint operation results in retaining joint control.
• Amendments to MFRS 116 “Property, Plant and Equipment” and MFRS 138 “Intangible Assets” (effective from 1 January 2016) clarify that the use of revenue-based methods to calculate the depreciation of an item of property, plant and equipment is not appropriate. This is because revenue generated by an activity that includes the use of an asset generally reflects factors other than the consumption of the economic benefits embodied in the asset.
SUMMarY oF SIGNIFICaNt aCCoUNtING poLICIeS for the financial year ended 30 June 2016
HONG LEONG FINANCIAL GROUP BERHAD ANNUAL REPORT 201680
a BaSIS oF preparatIoN oF tHe FINaNCIaL StateMeNtS (CoNtINUeD)
(b) Standards, amendments to published standards and interpretations to existing standards that are applicable to the Group and the Company but not yet effective (continued)
(i) Financial year beginning on/after 1 July 2016 (continued)
The amendments to MFRS 138 also clarify that revenue is generally presumed to be an inappropriate basis for measuring the consumption of the economic benefits embodied in an intangible asset. This presumption can be overcome only in the limited circumstances where the intangible asset is expressed as a measure of revenue or where it can be demonstrated that revenue and the consumption of the economic benefits of the intangible asset are highly correlated.
(ii) Financial year beginning on/after 1 July 2017
• Amendments to MFRS 107 “Statement of Cash Flows - Disclosure Initiative” (effective from 1 January 2017) introduce an additional disclosure on changes in liabilities arising from financing activities.
• Amendments to MFRS 112 “Income Taxes - Recognition of Deferred Tax Assets for Unrealised Losses” (effective from 1 January 2017) clarify the requirements for recognising deferred tax assets on unrealised losses arising from deductible temporary difference on asset carried at fair value.
In addition, in evaluating whether an entity will have sufficient taxable profits in future periods against which deductible temporary differences can be utilised, the amendments require an entity to compare the deductible temporary differences with future taxable profits that excludes tax deductions resulting from the reversal of those temporary differences.
The amendments shall be applied retrospectively.
(iii) Financial year beginning on/after 1 July 2018
• MFRS 9 “Financial Instruments” (effective from 1 January 2018) will replace MFRS 139 “Financial Instruments: Recognition and Measurement”.
MFRS 9 retains but simplifies the mixed measurement model in MFRS 139 and establishes three primary measurement categories for financial assets: amortised cost, fair value through profit or loss and fair value through other comprehensive income (“OCI”). The basis of classification depends on the entity’s business model and the cash flow characteristics of the financial asset. Investments in equity instruments are always measured at fair value through profit or loss with an irrevocable option at inception to present changes in fair value in OCI (provided the instrument is not held for trading). A debt instrument is measured at amortised cost only if the entity is holding it to collect contractual cash flows and the cash flows represent principal and interest.
For liabilities, the standard retains most of the MFRS 139 requirements. These include amortised cost accounting for most financial liabilities, with bifurcation of embedded derivatives. The main change is that, in cases where the fair value option is taken for financial liabilities, the part of a fair value change due to an entity’s own credit risk is recorded in other comprehensive income rather than the income statement, unless this creates an accounting mismatch.
MFRS 9 introduces an expected credit loss model on impairment that replaces the incurred loss impairment model used in MFRS 139. The expected credit loss model is forward-looking and eliminates the need for a trigger event to have occurred before credit losses are recognised.
SUMMarY oF SIGNIFICaNt aCCoUNtING poLICIeS for the financial year ended 30 June 2016

81Corporate / Financials / Additional Information
a BaSIS oF preparatIoN oF tHe FINaNCIaL StateMeNtS (CoNtINUeD)
(b) Standards, amendments to published standards and interpretations to existing standards that are applicable to the Group and the Company but not yet effective (continued)
(iii) Financial year beginning on/after 1 July 2018 (continued)
• MFRS 15 “Revenue from Contracts with Customers“ (effective from 1 January 2018) replaces MFRS 118 “Revenue“ and MFRS 111 “Construction contracts“ and related interpretations. The core principle in MFRS 15 is that an entity recognises revenue to depict the transfer of promised goods or services to the customer in an amount that reflects the consideration to which the entity expects to be entitled in exchange for those goods or services.
Revenue is recognised when a customer obtains control of goods or services, i.e. when the customer has the ability to direct the use of and obtain the benefits from the goods or services.
(iv) Financial year beginning on/after 1 July 2019
• MFRS 16 “Leases“ (effective from 1 January 2019) supersedes MFRS 117 “Leases“ and the related interpretations.
Under MFRS 16, a lease is a contract (or part of a contract) that conveys the right to control the use of an identified asset for a period of time in exchange for consideration.
MFRS 16 eliminates the classification of leases by the lessee as either finance leases (on balance sheet) or operating leases (off balance sheet). MFRS 16 requires a lessee to recognise a “right-of-use” of the underlying asset and a lease liability reflecting future lease payments for most leases.
The right-of-use asset is depreciated in accordance with the principle in MFRS 116 “Property, Plant and Equipment“ and the lease liability is accreted over time with interest expense recognised in the income statement.
For lessors, MFRS 16 retains most of the requirements in MFRS 117. Lessors continue to classify all leases as either operating leases or finance leases and account for them differently.
None of the standards, amendments and interpretations that are effective for the respective financial years is expected to have a significant effect on the financial statements of the Group and the Company, except for MFRS 15 and MFRS 9.
The Group and the Company is in the midst of reviewing the requirements of MFRS 9, as it introduces significant changes in the way the Group and the Company account for financial instruments. Due to the complexity of these standards and its proposed changes, the financial effects of its adoption are still being assessed by the Group and the Company.
B CoNSoLIDatIoN
(i) Subsidiaries
Subsidiaries are all entities (including structured entities) over which the Group has control. The Group controls an entity when the Group is exposed to, or has rights to, variable returns from its involvement with the entity and has the ability to affect those returns through its power to direct the relevant activities of the entity. Subsidiaries are fully consolidated from the date on which control is transferred to the Group. They are deconsolidated from the date that control ceases.
The consolidated financial statements include the financial statements of the Company and all its subsidiaries made up to the end of the financial year.
SUMMarY oF SIGNIFICaNt aCCoUNtING poLICIeS for the financial year ended 30 June 2016

HONG LEONG FINANCIAL GROUP BERHAD ANNUAL REPORT 201682
B CoNSoLIDatIoN (CoNtINUeD)
(i) Subsidiaries (continued)
The Group applies the acquisition method to account for business combinations.
The consideration transferred for the acquisition of a subsidiary is the fair values of the assets transferred, the liabilities incurred to the former owners of the acquiree and the equity interests issued by the Group. The consideration transferred includes the fair value of any asset or liability resulting from a contingent consideration arrangement and fair value of any pre-existing equity interest in the subsidiary. Identifiable assets acquired and liabilities and contingent liabilities assumed in a business combination are, with limited exceptions, measured initially at their fair values at the acquisition date. The Group recognises any non-controlling interest in the acquiree on an acquisition-by-acquisition basis, either at fair value or at the non-controlling interest’s proportionate share of the recognised amounts of acquiree’s identifiable net assets.
The excess of the consideration transferred the amount of any non-controlling interest in the acquiree and the acquisition-date fair value of any previous equity interest in the acquiree over the fair value of the identifiable net assets acquired is recognised as goodwill. If the total of consideration transferred, non-controlling interest recognised and previously held interest measured is less than the fair value of the net assets of the subsidiary acquired in the case of a bargain purchase, the difference is recognised directly in the statements of income.
Acquisition-related costs are expensed as incurred.
If the business combination is achieved in stages, the carrying value of the acquirer’s previously held equity interest in the acquiree is remeasured to fair value at the acquisition date any gains or losses arising from such remeasurement are recognised in statements of income.
Any contingent consideration to be transferred by the Group is recognised at fair value at the acquisition date. Subsequent changes to the fair value of the contingent consideration that is deemed to be an asset or liability is recognised in accordance with MFRS 139 in statements of income. Contingent consideration that is classified as equity is not remeasured, and its subsequent settlement is accounted for within equity.
The Group applies predecessor accounting to account for business combinations under common control. Under predecessor accounting, assets and liabilities acquired are not restated to their respective fair values. They are recognised at the carrying amounts from the consolidated financial statements of the ultimate holding company of the Group and adjusted to conform with the accounting policies adopted by the Group. The difference between any consideration given and the aggregate carrying amounts of the assets and liabilities (as of the date of the transaction) of the acquired entity is recognised as an adjustment to equity. No additional goodwill is recognised.
The acquirer only incorporates the acquired entity’s results and statements of financial position prospectively from the date on which the business combination between entities under common control occurred. Consequently, the consolidated financial statements do not reflect the results of the acquired entity for the period before the transaction occurred. The corresponding amounts for the previous financial year are also not restated.
Predecessor accounting may lead to a difference between the cost of the transaction and the carrying value of the net assets. The difference is recorded in retained profits.
Inter-company transactions, balances and unrealised gains on transactions between Group companies are eliminated. Unrealised losses are also eliminated unless the transaction provides evidence of an impairment of the transferred asset. When necessary, amounts reported by subsidiaries have been adjusted to conform with the Group’s accounting policies.
SUMMarY oF SIGNIFICaNt aCCoUNtING poLICIeS for the financial year ended 30 June 2016
83Corporate / Financials / Additional Information
B CoNSoLIDatIoN (CoNtINUeD)
(ii) Changes in ownership interests in subsidiaries without change of control
Transactions with non-controlling interests that do not result in loss of control are accounted for as equity transactions – that is, as transactions with the owners in their capacity as owners. The difference between fair value of any consideration paid and the relevant share acquired of the carrying value of net assets of the subsidiary is recorded in equity. Gains or losses on disposals to non-controlling interests are also recorded in equity.
(iii) Disposal of subsidiaries
When the Group ceases to consolidate because of a loss of control any retained interest in the entity is remeasured to its fair value, with the change in carrying amount recognised in statements of income. The fair value is the initial carrying amount for the purposes of subsequently accounting for the retained interest as an associate, joint venture or financial asset. In addition, any amounts previously recognised in other comprehensive income in respect of that entity are accounted for as if the Group had directly disposed of the related assets or liabilities. This may mean that amounts previously recognised in other comprehensive income are reclassified to statements of income.
Gains or losses on the disposal of subsidiaries include the carrying amount of goodwill relating to the subsidiaries sold.
(iv) Joint arrangements
A joint arrangement is an arrangement of which there is contractually agreed sharing of control by the Group with one or more parties, where decisions about the relevant activities relating to the joint arrangement require unanimous consent of the parties sharing control. The classification of a joint arrangement as a joint operation or a joint venture depends upon the rights and obligations of the parties to the arrangement. A joint venture is a joint arrangement whereby the joint venturers have rights to the net assets of the arrangement. A joint operation is a joint arrangement whereby the joint operators have rights to the assets and obligations for the liabilities, relating to the arrangement.
The Group’s interest in a joint venture is accounted for in the financial statements by the equity method of accounting. Under the equity method of accounting, interests in joint ventures are initially recognised at cost and adjusted thereafter to recognise the Group’s share of the post-acquisition profits or losses and movements in other comprehensive income. When the Group’s share of losses in a joint venture equals or exceeds its interests in the joint ventures (which includes any long-term interests that, in substance, form part of the Group’s net investment in the joint ventures), the Group does not recognise further losses, unless it has incurred obligations or made payments on behalf of the joint ventures.
Unrealised gains on transactions between the Group and its joint ventures are eliminated to the extent of the Group’s interest in the joint ventures. Unrealised losses are also eliminated unless the transaction provides evidence of an impairment of the asset transferred. Accounting policies of the joint ventures have been changed where necessary to ensure consistency with the policies adopted by the Group.
(v) associated companies
Associated companies are those corporations, partnerships or other entities over which the Group exercises significant influence, but which it does not control or joint control, generally accompanying a shareholding of between 20% and 50% of voting rights. Significant influence is power to participate in financial and operating policy decisions of associates but not power to exercise control over those policies.
Investments in associated companies are accounted for in the consolidated financial statements using equity method of accounting. Under the equity method, the investment is initially recognised at cost, and the carrying amount is increased or decreased to recognise the investor’s share of profit or loss of the investee after the date of acquisition. The Group’s investment in associates includes goodwill identified on acquisition.
SUMMarY oF SIGNIFICaNt aCCoUNtING poLICIeS for the financial year ended 30 June 2016

HONG LEONG FINANCIAL GROUP BERHAD ANNUAL REPORT 201684
B CoNSoLIDatIoN (CoNtINUeD)
(v) associated companies (continued)
The Group’s share of associated companies’ post-acquisition profits or losses is recognised in statements of income, and its share of post-acquisition movements in reserves is recognised in other comprehensive income. The cumulative post-acquisition movements are adjusted against the carrying amount of the investment. If the Group’s share of losses of an associated company equals or exceeds its interest in the associated company, the Group discontinues recognising its share of further losses.
The interest in an associated company is the carrying amount of the investment in the associated company under the equity method together with any long-term interests that, in substance, form part of the Group’s net investment in the associated company. After the Group’s interest is reduced to zero, additional losses are provided for, and a liability is recognised, only to the extent that the investor has incurred legal or constructive obligations or made payments on behalf of the associated company. If the associated company subsequently reports profits, the Group resumes recognising its share of those profits only after its share of the profits equals the share of losses not recognised.
Unrealised gains on transactions between the Group and its associated companies are eliminated to the extent of the Group’s interest in the associated companies; unrealised losses are also eliminated unless the transaction provides evidence on impairment of the asset transferred. Where necessary, in applying the equity method, adjustments are made to the financial statements of associated companies to ensure consistency of accounting policies with those of the Group.
The Group determines at each reporting date whether there is any objective evidence that the investment in the associated company is impaired. If this is the case, the Group calculates the amount of impairment as the difference between the recoverable amount of the associate and its carrying value and recognises the amount adjacent to ‘share of profit/(loss) of an associate’ in the statements of income.
If the ownership interest in an associated company is reduced but significant influence is retained, only a proportionate share of the amounts previously recognised in other comprehensive income is reclassified to statements of income where appropriate.
Dilution gains and losses arising in investments in associated companies are recognised in the statements of income.
(vi) Loss of significant influence or joint control
When the Group ceases to have joint control or significant influence, any retained interest in the entity is remeasured to its fair value with the change in carrying amount recognised in statements of income. This fair value is its fair value on initial recognition as a financial asset in accordance with MFRS 139. Any amounts previously recognised in other comprehensive income in respect of that entity are accounted for as if the Group had directly disposed of the related assets or liabilities.
(vii) Investments in subsidiaries, joint ventures and associated companies
In the Company’s separate financial statements, investment in subsidiaries, joint ventures and associated companies are carried at cost less any accumulated impairment losses. On disposal of investments in subsidiaries, joint ventures and associated companies, the difference between disposal proceeds and the carrying amount of investments are recognised in the statements of income.
The amounts due from subsidiaries of which the Group does not expect repayment in foreseeable future are considered as part of the Group’s investment in subsidiaries.
SUMMarY oF SIGNIFICaNt aCCoUNtING poLICIeS for the financial year ended 30 June 2016
85Corporate / Financials / Additional Information
C GooDWILL
Goodwill arises on the acquisition of subsidiaries and represents the excess of the aggregate of fair value consideration transferred, the amount of any non-controlling interest in the acquiree and the fair value of any previous equity interest in the acquiree over the fair value of the net identifiable assets acquired and liabilities assumed on the acquisition date. If the fair value of consideration transferred, the amount of non-controlling interest and the fair value of previously held interest in the acquiree are less than the fair value of the net identifiable assets of the acquiree, the resulting gain is recognised in the statements of income.
Goodwill is allocated to cash-generating units (“CGUs”) for the purpose of impairment testing. The allocation is made to those cash-generating units or groups of cash-generating units that are expected to benefit from the synergies of the business combination in which the goodwill arose. Each unit or group of units to which the goodwill is allocated represents the lowest level within the entity at which goodwill is monitored for internal management purposes. Goodwill is not amortised but is tested annually for impairment or more frequently if events or changes in circumstances indicate a potential impairment. The carrying value of goodwill is compared to the recoverable amount, which is the higher of value in use and the fair value less cost to sell. Any impairment is recognised immediately as an expense and is not subsequently reversed.
D propertY aND eQUIpMeNt aND DepreCIatIoN
Property and equipment are stated at cost less accumulated depreciation and any accumulated impairment losses. Cost includes expenditure that is directly attributable to the acquisition of the items. Subsequent costs are included in the asset’s carrying amount or recognised as a separate asset, as appropriate, only when it is probable that future economic benefits associated with the item will flow to the Group and the Company and the cost of the item can be measured reliably. The carrying amount of the replaced part is derecognised. All other repairs and maintenance are charged to the statements of income during the financial period in which they are incurred.
Freehold land and capital work-in-progress are not depreciated. Depreciation of other property and equipment is calculated to write off the cost of property and equipment to their residual values over the estimated useful lives, summarised as follows:
Leasehold land Over the remaining period of the lease or 100 years (1%) whichever is shorterBuildings on leasehold land Over the remaining period of the lease or 50 years (2%) whichever is shorterBuildings on freehold land 2%Office furniture, fittings, equipment and
renovations and computer equipment 10% - 33%Motor vehicles 20% - 25%
The assets’ residual values and useful lives are reviewed and adjusted if appropriate, at the end of each reporting period.
Depreciation on capital work-in-progress commences when the assets are ready for their intended use.
Property and equipment are reviewed for indication of impairment at each statements of financial position date and whenever events or changes in circumstances indicate that the carrying amount may not be recoverable. Where an indication of impairment exists, the carrying amount of the asset is greater than its estimated recoverable amount, it is written down immediately to its recoverable amount.
Gains and losses on disposals are determined by comparing proceeds with the carrying amount and are included in non-interest income.
SUMMarY oF SIGNIFICaNt aCCoUNtING poLICIeS for the financial year ended 30 June 2016

HONG LEONG FINANCIAL GROUP BERHAD ANNUAL REPORT 201686
e INveStMeNt propertIeS
Investment properties are properties which are held for long term rental yield or for capital appreciation or for both and are not occupied by the Group.
Investment properties are stated at fair value. Fair value is based on active market prices, adjusted, if necessary, for any difference in the nature, location or condition of the specific asset. If this information is not available, the Group uses alternative valuation methods such as recent prices on less active markets or discounted cash flow projections. The fair values of investment properties are reviewed annually, and a formal valuation by an independent professional valuer is carried out once in every three years. All gains or losses arising from a change in fair value of an investment property are recognised in the statements of income.
Investment properties are derecognised when either they have been disposed of or when the investment property is permanently withdrawn from use and no future economic benefit is expected from its disposal. Any gains or losses on the retirement or disposal of an investment property are recognised in the statements of income in the year in which they arise.
F INtaNGIBLe aSSetS
(i) Computer software
Acquired computer software licences are capitalised on the basis of the costs incurred to acquire and bring to use the specific software. These costs are amortised over their estimated useful lives of 3 years to 8 years.
(ii) other intangible assets
Other intangible assets include core deposits and customer relationships. These intangible assets were acquired in a business combination and are valued using income approach methodologies. These intangible assets are stated at cost less accumulated amortisation and any accumulated impairment losses. The useful lives of the intangible assets are as follows:
Core deposit: 7 yearsCustomer relationships: 10 years
G LeaSeS
(i) Finance Lease
Assets purchased under lease which in substance transfers the risks and benefits of ownership of the assets to the Group or the Company are capitalised under property and equipment. The assets and the corresponding lease obligations are recorded at the lower of the present value of the minimum lease payments or the fair value of the leased assets at the beginning of the lease term. Such leased assets are subject to depreciation on the same basis as other property and equipment.
Leases which do not meet such criteria are classified as operating lease and the related rentals are charged to statements of income.
SUMMarY oF SIGNIFICaNt aCCoUNtING poLICIeS for the financial year ended 30 June 2016
87Corporate / Financials / Additional Information
G LeaSeS (CoNtINUeD)
(ii) operating Lease
Leases of assets under which all the risks and rewards of ownership are retained by the lessor are classified as operating leases. Payments made under operating leases are charged to the statements of income on a straight line basis over the period of the lease.
When an operating lease is terminated before the lease period has expired, any payment required to be made to the lessor by way of penalty is recognised as an expense in the period in which termination takes place.
H FINaNCIaL aSSetS
(i) Classification
The Group and the Company classify their financial assets into the following categories: at fair value through profit or loss, loans and receivables, financial investments available-for-sale and financial investments held-to-maturity. Management determines the classifications at initial recognition and, in the case of assets classified as held-to-maturity, re-evaluates this designation at the end of each reporting period.
(a) Financial assets at fair value through profit or loss
Financial assets at fair value through profit or loss comprise of financial assets held-for-trading and other financial assets designated by the Group and the Company as fair value through profit or loss upon initial recognition.
A financial asset is classified as held-for-trading if it is acquired or incurred principally for the purpose of selling or repurchasing it in the near term or if it is part of a portfolio of identified financial instruments that are managed together and for which there is evidence of a recent actual pattern of short-term profit-taking. Derivatives are also categorised as held-for-trading unless they are designated and effective as hedging instruments.
(b) Loans and receivables
Loans and receivables are non-derivative financial assets with fixed or determinable payments that are not quoted in an active market.
(c) Financial investments held-to-maturity
Financial investments held-to-maturity are non-derivative instruments with fixed or determinable payments and fixed maturities that the Group and the Company’s management has the positive intent and ability to hold to maturity. If the Group or the Company sell other than an insignificant amount of financial investments held-to-maturity, the entire category will be tainted and reclassified as financial investments available-for-sale.
(d) Financial investments available-for-sale
Financial investments available-for-sale are those intended to be held for an indefinite period of time, which may be sold in response to needs for liquidity or changes in interest rates, exchange rates or equity prices or that are not classified as financial assets at fair value through profit or loss, loans and receivables and financial investments held-to-maturity.
SUMMarY oF SIGNIFICaNt aCCoUNtING poLICIeS for the financial year ended 30 June 2016

HONG LEONG FINANCIAL GROUP BERHAD ANNUAL REPORT 201688
H FINaNCIaL aSSetS (CoNtINUeD)
(ii) recognition and initial measurement
Financial assets are initially recognised at fair value plus transaction costs that are directly attributable to the acquisition of the financial asset for all financial assets not carried at fair value through profit or loss. Transaction costs for securities carried at fair value through profit or loss are taken directly to the statements of income.
(iii) Subsequent measurement
Financial assets at fair value through profit or loss and financial investments available-for-sale are subsequently carried at fair value, except for investments in equity instruments that do not have a quoted market price in an active market and whose fair value cannot be reliably measured in which case the investments are stated at cost. Gains and losses arising from changes in the fair value of the financial assets at fair value through profit or loss are included in the statements of income in the period which they arise. Gains and losses arising from changes in fair value of financial investments available-for-sale are recognised directly in other comprehensive income, until the securities are derecognised or impaired at which time the cumulative gains or loss previously recognised in other comprehensive income are recognised directly in the statements of income. Foreign exchange gains or losses of financial investments available-for-sale are recognised in the statements of income in the period it arises.
Financial investments held-to-maturity are subsequently measured at amortised cost using the effective interest method. Gains or losses arising from the de-recognition or impairment of the securities are recognised in the statements of income.
Interest from financial assets held at fair value through profit or loss, financial investments available-for-sale and financial investments held-to-maturity is calculated using the effective interest method and is recognised in the statements of income. Dividends from available-for-sale equity instruments are recognised in the profit or loss when the entity’s right to receive payment is established.
Loans and receivables are initially recognised at fair value – which is the cash consideration to originate or purchase the loan including the transaction costs, and measured subsequently at amortised cost using the effective interest rate method. Interest on loans is included in the statements of income. In the case of impairment, the impairment loss is reported as a deduction from the carrying value of the loan and recognised in the statements of income.
(iv) reclassification of financial assets
The Group and the Company may choose to reclassify a non-derivative financial assets held-for-trading out of the held-for-trading category if the financial asset is no longer held for the purposes of selling in the near term. Financial assets other than loan and receivables are permitted to be reclassified out of the held-for-trading category only in rare circumstances arising from a single event that is unusual and highly unlikely to recur in the near term. In addition, the Group and the Company may choose to reclassify financial assets that would meet the definition of loans and receivables out of the held-for-trading or available-for-sale categories if the Group and the Company have the intention and ability to hold these financial assets for the foreseeable future or until maturity at the date of reclassification.
Reclassifications are made at the fair value at the date of the reclassification. The fair values of the securities becomes the new cost or amortised cost as applicable, and no reversals of fair value gains or losses recorded before the reclassification date are subsequently made. The effective interest rates for the securities reclassified to held-to-maturity category are determined at the reclassification date. Further changes in estimates of future cash flows are recognised as an adjustment to the effective interest rates.
SUMMarY oF SIGNIFICaNt aCCoUNtING poLICIeS for the financial year ended 30 June 2016
89Corporate / Financials / Additional Information
I FINaNCIaL LIaBILItIeS
Financial liabilities are measured at amortised cost, except for trading liabilities and liabilities designated at fair value, which are held at fair value through profit or loss. Financial liabilities are initially recognised at fair value plus transaction costs for all financial liabilities not carried at fair value through profit or loss. Financial liabilities at fair value through profit or loss are initially recognised at fair value, and transaction costs are expensed in statements of income.
(i) Financial liabilities at fair value through profit or loss
This category comprises two sub-categories: financial liabilities classified as held-for-trading, and financial liabilities designated at fair value through profit or loss upon initial recognition.
A financial liability is classified as held-for-trading if it is acquired or incurred principally for the purpose of selling or repurchasing it in the near term or if it is part of a portfolio of identified financial instruments that are managed together and for which there is evidence of a recent actual pattern of short-term profit-taking. Derivatives are also categorised as held-for-trading unless they are designated and effective as hedging instruments.
The Group has also designated certain structured deposits at fair value through profit or loss as permitted under MFRS 139 “Financial Instruments: Recognition and Measurement” as it significantly reduces accounting mismatch that would otherwise arise from measuring the corresponding assets and liabilities of different basis.
(ii) Financial liabilities at amortised cost
Financial liabilities that are not classified as at fair value through profit or loss fall into this category and are measured at amortised cost.
J DereCoGNItIoN oF FINaNCIaL aSSetS aND FINaNCIaL LIaBILItIeS
Financial assets are derecognised when the contractual rights to receive the cash flows from these assets have ceased to exist or the assets have been transferred and substantially all the risks and rewards of ownership of the assets are also transferred. Financial liabilities are derecognised when they have been redeemed or otherwise extinguished.
Collateral furnished by the Group under standard repurchase agreements transactions is not derecognised because the Group retains substantially all the risks and rewards on the basis of the predetermined repurchase price, and the criteria for de-recognition are therefore not met.
K oFFSettING FINaNCIaL INStrUMeNtS
Financial assets and financial liabilities are offset and the net amount is presented in the statements of financial position where there is a legally enforceable right to offset the recognised amounts and there is intention to settle on a net basis, or realise the asset and settle the liability simultaneously. The legally enforceable right must not be contingent on future events and must be enforceable in the normal course of business and in the event of default, insolvency or bankruptcy.
L ForeCLoSeD propertIeS
Foreclosed properties are stated at the lower of carrying amount and fair value less costs to sell.
SUMMarY oF SIGNIFICaNt aCCoUNtING poLICIeS for the financial year ended 30 June 2016
HONG LEONG FINANCIAL GROUP BERHAD ANNUAL REPORT 201690
M DerIvatIve FINaNCIaL INStrUMeNtS aND HeDGe aCCoUNtING
Derivatives are initially recognised at fair value on the date on which a derivative contract is entered into and are subsequently remeasured at their fair value at the end of each reporting period. Fair values are obtained from quoted market prices in active markets, including recent market transactions, and valuation techniques, including discounted cash flow models and option pricing models, as appropriate. All derivatives are carried as assets when fair value is positive and as liabilities when fair value is negative. Changes in the fair value of any derivatives that do not qualify for hedge accounting are recognised immediately in the statements of income.
Cash collateral held in relation to derivative transactions are carried at amortised cost.
The best evidence of fair value of a derivative at initial recognition is the transaction price (i.e. the fair value of the consideration given or received) unless the fair value of the instrument is evidenced by comparison with other observable current market transactions in the same instrument (i.e. without modification or repackaging) or based on a valuation technique whose variables include only data from observable markets. When such evidence exists, the Group recognise profits immediately.
The method of recognising the resulting fair value gain or loss depends on whether the derivative is designated as a hedging instrument, and if so, the nature of the item being hedged. The Group designated certain derivatives as either: (1) hedges of the fair value of recognised assets or liabilities or firm commitments (fair value hedge) or (2) hedges of highly probable future cash flows attributable to a recognised asset or liability, or a forecasted transaction (cash flow hedge) or (3) hedges of a net investment in a foreign operation (net investment hedge). Hedge accounting is used for derivatives designated in this way provided certain criteria are met.
At the inception of the transaction, the Group document the relationship between hedging instruments and hedged items, as well as their risk management objective and strategy for undertaking various hedge transactions. The Group also document their assessment, both at hedge inception and on an ongoing basis, of whether the derivatives that are used in hedging transactions have been and will continue to be highly effective in offsetting changes in fair values or cash flows of hedged items.
(i) Fair value hedges
Changes in the fair value of derivatives that are designated and qualify as fair value hedges are recorded in the statements of income, together with any changes in the fair value of the hedged assets or liabilities that are attributable to the hedged risk.
If the hedge no longer meets the criteria for hedge accounting, the adjustment to the carrying amount of a hedged item for which the effective interest method is used is amortised to statements of income over the period to maturity using a recalculated effective interest rate.
(ii) Cash flow hedges
The effective portion of changes in the fair value of derivatives that are designated and qualify as cash flow hedges are recognised in equity. The gain and loss relating to the ineffective portion is recognised immediately in the statements of income. Amounts accumulated in equity are recycled to the statements of income in the periods in which the hedged item will affect statements of income.
When a hedging instrument expires or is sold or terminated, or when a hedge no longer meets the criteria for hedge accounting, any cumulative gain or loss existing in equity at that time remains in equity and is recognised when the forecast transaction is ultimately recognised in the statements of income. When a forecast transaction is no longer expected to occur, the cumulative gain or loss that was reported in equity is immediately reclassified the statements of income.
SUMMarY oF SIGNIFICaNt aCCoUNtING poLICIeS for the financial year ended 30 June 2016
91Corporate / Financials / Additional Information
M DerIvatIve FINaNCIaL INStrUMeNtS aND HeDGe aCCoUNtING (CoNtINUeD)
(iii) Net investment hedges
Hedges of net investments in foreign operations are accounted for similarly to cash flow hedges. Any gain or loss on the hedging instrument relating to the effective portion of the hedge is recognised in equity. The gain or loss relating to the ineffective portion is recognised immediately in the statements of income.
Gains and losses accumulated in the equity are reclassified to the statements of income when the foreign operation is partially disposed or sold.
(iv) Derivatives that do not qualify for hedge accounting
Certain derivative instruments do not qualify for hedge accounting. Changes in the fair value of any derivative instrument that does not qualify for hedge accounting are recognised immediately in the statements of income.
N BILLS aND aCCeptaNCeS paYaBLe
Bills and acceptances payable represent the banking subsidiaries’ own bills and acceptances rediscounted and outstanding in the market.
o provISIoNS
Provisions are recognised by the Group and the Company when all of the following conditions have been met:
(i) the Group and the Company have a present legal or constructive obligation as a result of past events;(ii) it is probable that an outflow of resources to settle the obligation will be required; and(iii) a reliable estimate of the amount of obligation can be made.
Where the Group and the Company expect a provision to be reimbursed, the reimbursement is recognised as a separate asset but only when the reimbursement is virtually certain. Provisions are not recognised for future operating losses.
Where there are a number of similar obligations, the likelihood that an outflow will be required in settlement is determined by considering the class of obligations as a whole. A provision is recognised even if the likelihood of an outflow with respect to any one item included in the same class of obligations may be small.
Provisions are measured at the present values of the expenditures expected to be required to settle the obligation using a pre-tax rate that reflects current market assessments of the time value of money and risks specific to the obligation. The increase in the provision due to passage of time is recognised as interest expense.
p BorroWINGS
Borrowings are recognised initially at fair value, net of transaction costs incurred. Borrowings are subsequently stated at amortised cost; any difference between the proceeds (net of transaction costs) and the redemption value is recognised in the statements of income over the period of the borrowings using the effective interest method.
All other borrowing costs are recognised in statements of income in the period in which they are incurred.
SUMMarY oF SIGNIFICaNt aCCoUNtING poLICIeS for the financial year ended 30 June 2016
HONG LEONG FINANCIAL GROUP BERHAD ANNUAL REPORT 201692
Q GeNeraL taKaFUL CoNtraCt LIaBILItIeS
(a) Contribution liabilities
Contribution liabilities refer to the higher of:
(i) the aggregate of the unearned contribution reserves (“UCR”); or(ii) the best estimate value of the takaful’s unexpired risk reserves (“URR”) at the valuation date and the provision of risk
margin for adverse deviation (“PRAD”) calculated at the overall takaful subsidiary level. The best estimate value is a prospective estimate of the expected future payments arising from future events insured under certificates in force as at the valuation date and also includes allowance for the takaful operator’s expense including overheads and cost of reinsurance, expected to be incurred during the unexpired period in administering these policies and settling the relevant claims, and allows for expected future contribution refunds.
UCR are calculated for direct and reinsurance inwards business. UCR represents the portion of the net contribution of takaful certificates written that relate to the unexpired periods of the certificates at the end of the financial year. In determining the UCR at the statement of financial position date, the method that most accurately reflects the actual unearned contribution is used, as follows:
(i) 25% method for marine and aviation cargo, and transit business;(ii) 1/365th method for all other classes of general takaful business within Malaysia except for non-annual policies in respect
of Malaysian policies, reduced by the percentage of accounted gross direct business commission to the corresponding premium, not exceeding limits specified by BNM; and
(iii) time apportionment method for non-annual policies (including long-term inwards treaty business) reduced by the percentage of accounted gross direct business commission to the corresponding premium, not exceeding limits specified by BNM.
(b) Claims liabilities
A liability for outstanding claims is recognised in respect of both direct insurance and inward reinsurance.
The amount of outstanding claims is the best estimate of the expenditure required together with related expenses less recoveries to settle the present obligation at the statements of financial position date.
Provision is also made for the cost of claims, together with related expenses, incurred but not reported at the balance sheet date, based on an actuarial valuation with a PRAD at a 75% confidence level as required by BNM, based on actuarial valuation.
r BeNeFItS, CLaIMS aND eXpeNSeS
Benefits and claims that are incurred during the financial year are recognised when a claimable event occurs and/or the insurer/takaful operator is notified.
Recoveries on reinsurance/retakaful claims are accounted for in the same financial year as the original claims are recognised.
SUMMarY oF SIGNIFICaNt aCCoUNtING poLICIeS for the financial year ended 30 June 2016

93Corporate / Financials / Additional Information
r BeNeFItS, CLaIMS aND eXpeNSeS (CoNtINUeD)
Benefits and claims for claims arising on life insurance policies including settlement costs, less reinsurance recoveries, are accounted for using the case basis method and for this purpose, the benefits payable under a life insurance policy are recognised as follows:
(a) maturity or other policy benefit payments due on specified dates are treated as claims payable on the due dates; and(b) death, surrender and other benefits without due dates are treated as claims payable, on the date of receipt of intimation of
death of the assured or occurrence of contingency covered.
S INSUraNCe CoNtraCt LIaBILItIeS
These liabilities comprise of claims liabilities, actuarial liabilities, unallocated surpluses, financial investments available-for-sale, fair value reserves and net asset value attributable to unitholders.
(i) actuarial liabilities
Actuarial liabilities are recognised when contracts are entered into and premiums are charged.
These liabilities are measured by a prospective actuarial valuation method. The liability is determined as the sum of the present value of future guaranteed and, in the case of a participating life policy, appropriate level of non-guaranteed benefits, and the expected future management and distribution expenses, less the present value of future gross considerations arising from the policy discounted at the appropriate risk discount rate. The liability is based on best estimate assumptions and with due regard to significant recent experience. An appropriate allowance for provision of risk margin for adverse deviation from expected experience is made in the valuation of non-participating life policies, the guaranteed benefits liabilities of participating life policies, and non-unit liabilities of investment-linked policies.
The liability in respect of policies of a participating insurance contract is taken as the higher of the guaranteed benefit liabilities or the total benefit liabilities at the fund level.
In the case of a life policy where a part of, or the whole of the premiums are accumulated in a fund, the accumulated amount, as declared to the policy owners, are set as the liabilities if the accumulated amount is higher than the figure as calculated using the prospective actuarial valuation method.
Where policies or extensions of a policy are collectively treated as an asset at the fund level under the valuation method adopted, the value of such asset is eliminated through zerorisation.
The liability is derecognised when the contract expires, is discharged or is cancelled.
(ii) Unallocated surplus
Surplus of contracts with DPF is distributable to policyholders and shareholders in accordance with the relevant terms under the insurance contracts. The insurance subsidiary, however, has discretion over the amount and timing of the distribution of these surpluses to policyholders and shareholders. Surplus of contracts without DPF is attributable wholly to the shareholders and is classified as equity of the Group and the insurance subsidiary. However, the amount and timing of the distribution of surplus of contracts without DPF to the shareholders is subject to the recommendation of the insurance subsidiary’s appointed actuary. Unallocated surpluses of DPF, where the amounts of surplus are yet to be allocated or distributed to either policyholders or shareholders by the end of the financial year, are held within the insurance contract liabilities.
SUMMarY oF SIGNIFICaNt aCCoUNtING poLICIeS for the financial year ended 30 June 2016
HONG LEONG FINANCIAL GROUP BERHAD ANNUAL REPORT 201694
S INSUraNCe CoNtraCt LIaBILItIeS (CoNtINUeD)
(iii) Fair value adjustment on aFS financial asset
Where unrealised gains or losses arise on AFS financial assets of DPF, the adjustment to the insurance contract liabilities, equals to the effect that the realisation of those gains or losses at the end of the reporting periods would have on those liabilities, is recognised directly in the other comprehensive income.
t LIFe INSUraNCe CoNtraCt
The valuation of the insurance liability arising from policy benefits made under life insurance contracts is the insurance subsidiary’s most critical accounting estimate. The assumptions in relation to mortality, morbidity, longevity, investment returns, expenses, lapse and surrender rates and discount rates are used for calculating the liabilities during the life of the contract. Such assumptions require a significant amount of professional judgement and therefore, actual experience may be materially different than the assumptions made by the insurance subsidiary. Actual experience is monitored to assess whether the assumptions remain appropriate and assumptions are changed as warranted. Any movement in the key assumptions will have an effect in determining the insurance contract liabilities.
An insurance contract is a contract under which the insurance subsidiary (the insurer) has accepted significant insurance risk from another party (the policyholders) by agreeing to compensate the policyholders if a specified uncertain future event (the insured event) adversely affects the policyholders. The insurance subsidiary defines insurance risk to be significant when the benefits payable on the occurrence of the insured event are 5% or more than the benefits payable if the insured event did not occur at any one point of the insurance contract. Based on this definition, all policy contracts issued by the insurance subsidiary are considered insurance contracts as at the date of this statement of financial position.
U INSUraNCe proDUCt CLaSSIFICatIoN
Investment contracts are those contracts that do not transfer significant insurance risk, but significant financial risk. Financial risk is the risk of a possible future change in one or more of a specified interest rate, financial instrument price, commodity price, foreign exchange rate, index of price or rate, credit rating or credit index or other variable, provided in the case of a non-financial variable that the variable is not specific to a party to the contract. Insurance risk is the risk other than financial risk.
Once a contract has been classified as an insurance contract, it remains an insurance contract for the remainder of its life-time, even if the insurance risk reduces significantly during this period, unless all rights and obligations are extinguished or expire. Investment contracts can, however, be reclassified as insurance contracts after inception if insurance risk becomes significant.
Insurance contracts are further classified as being either with or without DPF. DPF is a contractual right to receive, as a supplement to guaranteed benefits, additional benefits that are:
• likely to be a significant portion of the total contractual benefits;• whose amount or timing is contractually at the discretion of the issuer; and• that are contractually based on the:
- performance of a specified pool of contracts or a specified type of contract;- realised and/or unrealised investment returns on a specified pool of assets held by the issuer; or- profit or loss of the company, fund or other entity that issues the contract.
Contracts in the participating fund are classified as insurance contracts with DPF and contracts in the non-participating fund are classified as insurance contracts without DPF.
SUMMarY oF SIGNIFICaNt aCCoUNtING poLICIeS for the financial year ended 30 June 2016

95Corporate / Financials / Additional Information
U INSUraNCe proDUCt CLaSSIFICatIoN (CoNtINUeD)
For financial options and guarantees which are not closely related to the host insurance contract and/or investment contract with DPF, bifurcation is required to measure these embedded derivatives separately at fair value through profit or loss. However, bifurcation is not required if the embedded derivative is itself an insurance contract and/or investment contract with DPF, or if the host insurance contract and/or investment contract itself is measured at fair value through profit or loss.
v FaMILY taKaFUL FUND
The family takaful fund is maintained in accordance with the requirements of the Takaful Act, 1984 and includes the amount attributable to participants. The amount attributable to participants represents the accumulated surplus attributable in accordance with the terms and conditions prescribed by the Shariah Advisory Committee of Hong Leong MSIG Takaful Berhad (“HLMT”).
The family takaful fund surplus/deficit is determined by an annual actuarial valuation of the family takaful fund. Any actuarial deficit in the family takaful fund will be made good by the shareholder’s fund via a benevolent loan or Qardhul Hassan.
W GeNeraL taKaFUL FUND
The general takaful fund is maintained in accordance with the Takaful Act, 1984 and consists of unearned contribution reserves, and accumulated surplus attributable to participants which represents the participants’ share in the net surplus of the general takaful revenue account, distributable in accordance with the terms and conditions prescribed by the Shariah Advisory Committee of HLMT. The general takaful underwriting results are determined for each class of takaful business after taking into account retakaful, unearned contributions and claims incurred. Underwriting deficit will be made good by the shareholders’ fund via a benevolent loan or Qardhul Hassan.
X INCoMe aND DeFerreD taXeS
The tax expense for the period comprises current and deferred tax. The income tax expense or credit for the period is the tax payable on the current period’s taxable income based on the applicable income tax rate for each jurisdiction adjusted by changes in deferred tax assets and liabilities attributable to temporary differences and to unused tax losses. Tax is recognised in statements of income, except to the extent that it relates to items recognised in other comprehensive income or directly in equity. In this case, the tax is recognised in other comprehensive income or directly in equity, respectively.
Current income tax expense is determined according to the tax laws of each jurisdiction in which the Group operates and generates taxable income and includes all taxes based upon the taxable profits.
Management periodically evaluates positions taken in tax returns with respect to situations in which applicable tax regulation is subject to interpretation. It establishes provisions where appropriate on the basis of amounts expected to be paid to the tax authorities. This liability is measured using the single best estimate of the most likely outcome.
Deferred income tax is provided in full, using the liability method, on temporary differences arising between the tax bases of assets and liabilities and their carrying amounts in the financial statements. However, deferred tax liabilities are not recognised if they arise from the initial recognition of goodwill. Deferred tax is not accounted for if it arises from initial recognition of an asset or liability in a transaction other than a business combination that at the time of the transaction affects neither accounting nor taxable profit or loss.
Deferred tax assets are recognised to the extent that it is probable that future taxable profits will be available against which the temporary differences can be utilised.
SUMMarY oF SIGNIFICaNt aCCoUNtING poLICIeS for the financial year ended 30 June 2016
HONG LEONG FINANCIAL GROUP BERHAD ANNUAL REPORT 201696
X INCoMe aND DeFerreD taXeS (CoNtINUeD)
Deferred tax liability is recognised on temporary differences arising on investments in subsidiaries, associates and joint ventures except where the timing of the reversal of the temporary difference can be controlled by the Group and it is probable that the temporary difference will not reverse in the foreseeable future.
Deferred income tax related to fair value remeasurement of financial investments available-for-sale, which are charged or credited directly to equity, is also credited or charged directly to equity and is subsequently recognised in the statements of income together with the deferred gain or loss.
Deferred income tax is determined using tax rates (and tax laws) that have been enacted or substantively enacted by the end of the reporting period and are expected to apply when the related deferred tax asset is realised or the deferred tax liability is settled.
Deferred and income tax assets and liabilities are offset when there is a legally enforceable right to offset current tax assets against current tax liabilities and when the deferred income tax assets and liabilities relate to taxes levied by the same taxation authority on either the taxable entity or different taxable entities where there is an intention to settle the balances on a net basis.
Y reCoGNItIoN oF INtereSt/proFIt INCoMe aND INtereSt/proFIt eXpeNSe
Interest income and expense for all interest-bearing financial instruments are recognised within “interest income” and “interest expense” in the statements of income using the effective interest method.
The effective interest method is a method of calculating the amortised cost of a financial asset or a financial liability and of allocating the interest income or interest expense over the relevant period. The effective interest rate is the rate that exactly discounts estimated future cash payments or receipts through the expected life of the financial instruments or, when appropriate, a shorter period to the net carrying amount of the financial asset or financial liability. When calculating the effective interest rate, the Group takes into account all contractual terms of the financial instrument and includes any fees or incremental costs that are directly attributable to the instrument and are an integral part of the effective interest rate, but not future credit losses.
Interest on impaired financial assets is recognised using the rate of interest used to discount the future cash flows for the purpose of measuring the impairment loss. A financial asset or a group of financial assets is deemed to be impaired if, and only if, there is objective evidence of impairment as a result of one or more events that has occurred after the initial recognition of the asset (an incurred ‘loss event’) and that loss event (or events) has an impact on the estimated future cash flows of the financial asset or the group of financial assets that can be reliably estimated.
When a loan receivable is impaired, the Group reduces the carrying amount to its recoverable amount, being the estimated future cash flow discounted at the original effective interest rate of the instrument, and continues unwinding the discount as interest income. Interest income on impaired loan and receivable are recognised during the original effective interest rate.
Income from Islamic banking business is recognised on an accrual basis in accordance with the principles of Shariah.
Z reCoGNItIoN oF FeeS aND otHer INCoMe
(i) Loan arrangement fees and commissions are recognised as income when all conditions precedent are fulfilled. Guarantee fees which are material are recognised as income based on time apportionment. Service charges and other fee income are recognised as income when the services are rendered.
(ii) Commitment fees for loans, advances and financing that are likely to be drawn down and deferred (together with direct costs) and income which forms an integral part of the effective interest rate of a financial instrument is regarded as an adjustment to the effective interest rate of the financial instrument.
SUMMarY oF SIGNIFICaNt aCCoUNtING poLICIeS for the financial year ended 30 June 2016

97Corporate / Financials / Additional Information
Z reCoGNItIoN oF FeeS aND otHer INCoMe (CoNtINUeD)
(iii) Dividends from financial assets held-for-trading, financial investments available-for-sale and subsidiary companies are recognised when the rights to receive payment is established.
(iv) Net profit from financial assets held-for-trading and financial investments available-for-sale are recognised upon disposal of the securities, as the difference between net disposal proceeds and the carrying amount of the securities.
(v) Net brokerage income, margin income, rollover fees, nominees service and handling charges are recognised on an accrual basis.
(vi) Corporate advisory fees are recognised as income on completion of each stage of the engagement and issuance of invoice.
(vii) Rental income is recognised on an accrual basis.
(viii) Management expenses, commission expenses and wakalah fees.
Acquisition costs, commissions and management fees are borne by the family takaful and general takaful funds respectively in the revenue accounts of Hong Leong MSIG Takaful (“HLMT”) at an agreed percentage of the gross contribution, in accordance with the principles of Wakalah as approved by HLMT’s Shariah Advisory Committee and agreed between the participants and HLMT.
These are transferred to the shareholders’ fund via upfront wakalah fee and deferred wakalah fee.
(ix) Contribution - general takaful fund
Contributions are recognised in a financial year in respect of risks assumed during that particular financial year. Contributions from direct business are recognised during the financial year upon the issuance of debit notes. Contributions in respect of risks incepted for which debit notes have not been raised as of the statements of financial position date are accrued at that date.
(x) Premium/contribution - life insurance and family takaful fund
Premiums/contributions are recognised as soon as the amount of premiums/contributions can be reliably measured. First premium premium/contribution is recognised from inception date and subsequent premiums/contributions are recognised on due dates.
Inward treaty reinsurance premiums/retakaful contributions are recognised on the basis of periodic advices received from ceding companies.
Outward reinsurance premiums/retakaful contributions are recognised in the same accounting period as the original policies certificates to which the reinsurance/retakaful relates.
aa INSUraNCe CoMMISSIoN aND aGeNCY eXpeNSeS
Commission and agency expenses, which costs directly incurred in securing premium on insurance policies, net of income derived from reinsurers in the course of ceding of premium to reinsurers, are charged to the revenue account in the financial year in which they are incurred.
SUMMarY oF SIGNIFICaNt aCCoUNtING poLICIeS for the financial year ended 30 June 2016

HONG LEONG FINANCIAL GROUP BERHAD ANNUAL REPORT 201698
aB IMpaIrMeNt oF FINaNCIaL aSSetS
(i) assets carried at amortised cost
A financial asset or a group of financial assets is deemed to be impaired if, and only if, there is objective evidence of impairment as a result of one or more events that has occurred after the initial recognition of the asset (an incurred “loss event”) and that loss event (or events) has an impact on the estimated future cash flows of the financial asset or the group of financial assets that can be reliably estimated.
The criteria the Group and the Company use to determine that there is objective evidence of impairment loss include indications that the borrower or a group of borrowers is experiencing significant financial difficulty, the probability that they will enter bankruptcy or other financial reorganisation, default of delinquency in interest or principal payments and where observable data indicates that there is a measurable decrease in the estimated future cash flows, such as changes in arrears or economic conditions that correlate with defaults.
The Group and the Company first assess whether objective evidence of impairment exists individually for financial assets that are individually significant, and individually or collectively for financial assets that are not individually significant. If the Group and the Company determine that no objective evidence of impairment exists for an individually assessed financial asset, whether significant or not, it includes the asset in a group of financial assets with similar credit risk characteristics and collectively assesses them for impairment.
The amount of the loss is measured as the difference between the asset’s carrying amount and the present value of estimated future cash flows discounted at the financial assets’ original effective interest rate. The carrying amount of the asset is reduced through the use of an allowance account and the amount of the loss is recognised in the statements of income. If a loan or financial investments held-to-maturity have a variable interest rate, the discount rate for measuring any impairment loss is the current effective interest rate determined under the contract.
Financial assets that have not been individually assessed are grouped together for portfolio impairment assessment. These financial assets are grouped according to their credit risk characteristics for the purposes of calculating an estimated collective loss. These characteristics are relevant to the estimation of future cash flows for groups of such assets by being indicative of the debtors’ ability to pay all amounts due according to the contractual terms of the assets being assessed. Future cash flows on a group of financial assets that are collectively assessed for impairment are estimated on the basis of historical loss experience for assets with credit risk characteristics similar to those in the group.
The methodology and assumptions used for estimating future cash flows are reviewed regularly by the Group and the Company to reduce any differences between loss estimates and actual loss experience.
When a loan is uncollectible, it is written off against the related allowance for loan impairment and any shortfall will be recognised to income statement. Such loans are written-off after taking into consideration the realisable value of collateral, if any, when in the judgement of the management, there is no prospect of recovery.
If in a subsequent period, the amount of impairment losses decreases and the decrease can be related objectively to an event occurring after the impairment was recognised (such as an improvement in the debtor’s credit rating), the previously recognised impairment loss is reversed by adjusting the allowance account. The amount of the reversal is recognised in the statements of income.
On 6 April 2015, BNM issued a revised Policy Document on Classification and Impairment Provisions for Loans/Financing. The banking subsidiaries have complied with the requirements of loans/financing classification as rescheduled and restructured and have maintained, in aggregate, collective impairment allowance and regulatory reserves of no less than 1.2% of total outstanding loans/financing, net of individual impairment allowance. The regulatory reserve is maintained in addition to the collective impairment allowance required under the MFRS 139 Financial Instruments: Recognition and Measurement, and it will be set aside from the retained profits to a separate reserve within equity as an additional credit risk absorbent. The regulatory reserve is not qualified as Common Equity Tier 1 capital under BNM’s Capital Adequacy Framework (Capital Components).
SUMMarY oF SIGNIFICaNt aCCoUNtING poLICIeS for the financial year ended 30 June 2016
99Corporate / Financials / Additional Information
aB IMpaIrMeNt oF FINaNCIaL aSSetS (CoNtINUeD)
(ii) assets classified as available-for-sale
The Group and the Company assess at each date of the statements of financial position whether there is objective evidence that a financial investment or a group of financial investment is impaired. The criteria the Group and the Company use to determine that there is objective evidence of impairment loss include indications that the issuer is experiencing significant financial difficulty, the probability that the issuer will enter bankruptcy or other financial reorganisation, default or delinquency in interest or principal payments and where observable data indicates that there is a measurable decrease in the estimated future cash flows, such as changes in the market or economic conditions that correlate with defaults on the assets. In the case of equity investments classified as available-for-sale, a significant or prolonged decline in the fair value of the security below its cost is objective evidence of impairment resulting in the recognition of an impairment loss.
If any such evidence exists for available-for-sale assets, the cumulative loss measured as the difference between the acquisition cost and the current fair value, less any impairment loss on that financial asset previously recognised in equity is removed from other comprehensive income and recognised in the statements of income. Impairment losses recognised in the statements of income on equity instruments are not reversed through the statements of income. If, in a subsequent period, the fair value of a debt instrument classified as available-for-sale increases and the increase can be objectively related to an event occurring after the impairment loss was recognised in statements of income, the impairment loss is reversed through the statements of income in subsequent periods.
aC eMpLoYee BeNeFItS
(i) Short-term employee benefits
Wages, salaries, paid annual leave and sick leave, bonuses, and non-monetary benefits that are expected to be settled wholly within 12 months after the end of the period in which the employees render the related service are recognised in respect of employees’ services up to the end of the reporting period and are measured at the amounts expected to be paid when the liabilities are settled.
The Group and the Company recognise a liability and an expense for bonuses. The Group and the Company recognise a provision where contractually obliged or where there is a past practice that has created constructive obligation.
(ii) Defined contribution plans
A defined contribution plan is a pension plan under which the Group and the Company pays fixed contributions into a separate entity (fund) on a mandatory, contractual or voluntary basis and the Group and the Company have no legal or constructive obligations to pay further contributions if the fund does not hold sufficient assets to pay all employees benefits relating to employee service in the current and prior financial periods.
The Group and the Company contributes to a national defined contribution plan (the Employee Provident Fund) on a mandatory basis and the amounts contributed to the plan are charged to the statements of income in the period to which they relate. Once the contributions have been paid, the Group and the Company has no further payment obligations.
Prepaid contributions are recognised as an asset to the extent that a cash refund or a reduction in the future payments is available.
(iii) Share-based compensation
The Company and certain of its subsidiaries operate equity-settled, share-based compensation plans for their employees. The fair value of the employee services received in exchange for the grant of the share options is recognised as an expense in the statements of income over the vesting periods of the grant with a corresponding increase in equity.
SUMMarY oF SIGNIFICaNt aCCoUNtING poLICIeS for the financial year ended 30 June 2016

HONG LEONG FINANCIAL GROUP BERHAD ANNUAL REPORT 2016100
aC eMpLoYee BeNeFItS (CoNtINUeD)
(iii) Share-based compensation (continued)
The total amount to be expensed over the vesting period is determined by reference to the fair value of the share options granted, excluding the impact of any non-market vesting conditions. Non-market vesting conditions are included in assumptions about the number of options that are expected to vest. At each statements of financial position date, the Company revises its estimates of the number of share options that are expected to vest. It recognises the impact of the revision of original estimates, if any, in the statements of income, with a corresponding adjustment to share options reserve in equity.
A trust has been set up for the Employee Share Option Scheme (“ESOS”) and is administered by an appointed trustee. The trustee will be entitled from time to time to accept financial assistance from the Company upon such terms and conditions as the Company and the trustee may agree to purchase the Company’s stocks from the open market for the purposes of this trust.
In accordance with MFRS 132, the shares purchased for the benefit of the ESOS holders are recorded as “Treasury Shares for ESOS” in equity on the statements of financial position. The cost of operating the ESOS would be charged to the statements of income when incurred in accordance with accounting standards.
When the options are exercised, the Group transfers the Treasury Shares for ESOS to the ESOS holder. The treasury shares and share options reserve would be adjusted against the retailed profits.
When the options are exercised, the Company and certain of its subsidiaries issue new shares. The proceeds received net of any directly attributable transaction costs are credited to share capital and share premium.
When options are not exercised and lapsed, the share options reserve is transferred to retained profits.
aD CUrreNCY traNSLatIoNS
(i) Functional and presentation currency
Items included in the financial statements of each of the Group’s entities are measured using the currency of the primary economic environment in which the entity operates (“the functional currency”). The consolidated financial statements are presented in Ringgit Malaysia, which is the Company’s functional and presentation currency.
(ii) Foreign currency transactions and balances
Foreign currency transactions are translated into the functional currency using the exchange rates prevailing at the dates of the transactions. Foreign exchange gains and losses resulting from the settlement of such transactions and from the translation at year-end exchange rates of monetary assets and liabilities denominated in foreign currencies are recognised in the statements of income, except when deferred in equity as qualifying cash flow hedges and qualifying net investment hedges.
Changes in the fair value of monetary securities denominated in foreign currency classified as financial investments available-for-sale are analysed between translation differences resulting from changes in the amortised cost of the security and other changes in the carrying amount of the security. Translation differences related to changes in the amortised cost are recognised in the statement of income, and other changes in the carrying amount are recognised in other comprehensive income.
Non-monetary items that are measured at fair value in a foreign currency are translated using the exchange rates at the date when the fair value was determined. Translation differences on non-monetary financial assets and liabilities are reported as part of the fair value gain or loss. Translation differences on non-monetary financial assets are recognised in income as part of the fair value gain or loss. Translation differences on non-monetary financial assets such as equities classified as available-for-sale are included in the fair value reserve in other comprehensive income.
SUMMarY oF SIGNIFICaNt aCCoUNtING poLICIeS for the financial year ended 30 June 2016

101Corporate / Financials / Additional Information
aD CUrreNCY traNSLatIoNS (CoNtINUeD)
(iii) Group companies
The results and financial position of all the group entities (none of which has the currency of a hyperinflationary economy) that have a functional currency different from the presentation currency are translated into the presentation currency as follows:
• assets and liabilities for each statements of financial position presented are translated at the closing rate at the date of the statements of financial position;
• income and expenses for each statements of income are translated at average exchange rates (unless this average is not a reasonable approximation of the cumulative effect of the rates prevailing on the transaction dates, in which case income and expenses are translated at the rate on the dates of the transactions); and
• all resulting exchange differences are recognised as a separate component of statements of comprehensive income.
On consolidation, exchange differences arising from the translation of the net investment in foreign operations, and of borrowings and other currency instruments designated as hedges of such investments, are recognised in statements of comprehensive income. When a foreign operation is partially disposed of or sold, exchange differences that were recorded in equity are recognised in the statements of income as part of the gain or loss on sale.
On the disposal of a foreign operation (that is, a disposal of the Group’s entire interest in a foreign operation, or a disposal involving loss of control over a subsidiary that includes a foreign operation, a disposal involving loss of joint control over a jointly controlled entity that includes a foreign operation, or a disposal involving loss of significant influence over an associate that includes a foreign operation), all of the exchange differences relating to that foreign operation recognised in other comprehensive income and accumulated in the separate component of equity are reclassified to statements of income. In the case of a partial disposal that does not result in the Group losing control over a subsidiary that includes a foreign operation, the proportionate share of accumulated exchange differences are re-attributed to non-controlling interests and are not recognised in statements of income. For all other partial disposals (that is, reductions in the Group’s ownership interest in associates or jointly controlled entities that do not result in the Group losing significant influence or joint control) the proportionate share of the accumulated exchange difference is reclassified to statements of income.
Goodwill and fair value adjustments arising on the acquisition of a foreign entity are treated as assets and liabilities of the foreign entity and translated at the closing rate. Exchange differences arising are recognised in other comprehensive income.
ae CaSH aND CaSH eQUIvaLeNtS
Cash and cash equivalents are consist of cash and bank balances and short-term funds.
aF IMpaIrMeNt oF NoN-FINaNCIaL aSSetS
Assets that have an indefinite useful life are not subject to amortisation and are tested annually for impairment. Assets that are subject to amortisation are reviewed for impairment whenever events or changes in circumstances indicate that the carrying amount may not be recoverable. An impairment loss is recognised for the amount by which the carrying amount of the asset exceeds its recoverable amount. The recoverable amount is the higher of an asset’s fair value less costs of disposal and value-in-use. For the purposes of assessing impairment, assets are grouped at the lowest levels for which there are separately identifiable cash flows which are largely independent of the cash inflows from other assets or groups of assets (cash-generating units). Non financial assets other than goodwill that suffered impairment are reviewed for possible reversal of the impairment at each reporting date.
The impairment loss is charged to the statements of income unless it reverses a previous revaluation in which case it is charged to the revaluation surplus. Any subsequent increase in recoverable amount of non-financial assets (other than goodwill) is recognised in the statements of income unless it reverses an impairment loss on a revalued asset in which case it is taken to revaluation surplus.
SUMMarY oF SIGNIFICaNt aCCoUNtING poLICIeS for the financial year ended 30 June 2016

HONG LEONG FINANCIAL GROUP BERHAD ANNUAL REPORT 2016102
aG SeGMeNt reportING
Operating segments are reported in a manner consistent with the internal reporting provided to the chief operating decision-maker. The chief operating decision-maker is the person or group that allocates resources to and assesses the performance of the operating segments of an entity. The Group has determined the Board of Directors as the collective body of chief operating decision makers.
Segment revenue, expense, assets and liabilities are those amount resulting from the operating activities of a segment that are directly attributable to the segment and the relevant portion that can be allocated on a reasonable basis to the segment. Segment revenue, expense, assets and liabilities are determined before intra-group balances and intra-group transactions are eliminated as part of the consolidation process, except to the extent that such intra-group balances and transactions are between group enterprises within a single segment.
aH FINaNCIaL GUaraNtee CoNtraCtS
Financial guarantee contracts are contracts that require the issuer to make specified payments to reimburse the holder for a loss it incurs because a specified debtor fails to make payments when due, in accordance with the terms of a debt instrument. Such financial guarantees are given to banks, financial institutions and other bodies on behalf of customers to secure loans, overdrafts and other banking facilities.
Financial guarantees are initially recognised in the financial statements at fair value on the date the guarantee was given. The fair value of a financial guarantee at the time of signature is zero because all guarantees are agreed on arm’s length terms and the value of the premium agreed corresponds to the value of the guarantee obligation. No receivable for the future premiums is recognised. Subsequent to initial recognition, the Group’s liabilities under such guarantees are measured at the higher of the initial amount, less amortisation of fees recognised in accordance with MFRS 137 “Provision, Contingent Liabilities and Contingent Assets”, and the best estimate of the amount required to settle the guarantee. These estimates are determined based on experience of similar transactions and history of past losses, supplemented by the judgement of management. The fee income earned is recognised on a straight-line basis over the life of the guarantee. Any increase in the liability relating to guarantees is reported in the statements of income.
aI SHare CapItaL
(i) Classification
Ordinary shares are classified as equity. Other shares are classified as equity and/or liability according to the substance of the particular instrument. Distributions to holders of a financial instrument classified as an equity instrument are charged directly to equity.
(ii) Share issue costs
Incremental external costs directly attributable to the issue of new shares or options are shown in equity as a deduction, net of tax, from the proceeds.
(iii) Dividends
Liability is recognised for the amount of any dividend declared, being appropriately authorised and no longer at the discretion of the Group, on or before the end of the reporting period but not distributed at the end of the reporting period.
SUMMarY oF SIGNIFICaNt aCCoUNtING poLICIeS for the financial year ended 30 June 2016

103Corporate / Financials / Additional Information
aI SHare CapItaL (CoNtINUeD)
(iv) purchase of own shares
Where the Company purchases the Company’s equity share capital (treasury shares), the consideration paid, including any directly attributable incremental external costs, net of tax, is included in equity attributable to the Company’s equity holders as treasury shares until they are cancelled, reissued or disposed of. Where such shares are subsequently sold or reissued, any consideration received, net of any directly attributable incremental transaction costs and the related tax effects, is adjusted against treasury shares and share premium.
aJ SaLe aND repUrCHaSe aGreeMeNtS
Securities purchased under resale agreements (“reverse repurchase agreements”) are securities which the Group had purchased with a commitment to re-sell at future dates. The commitment to re-sell the securities is reflected as an asset on the statements of financial position.
Conversely, obligations on securities sold under repurchase agreements (“repurchase agreements”) are securities which the Group had sold from its portfolio, with a commitment to repurchase at future dates. Such financing transactions and the obligation to repurchase the securities are reflected as a liability on the statements of financial position.
The difference between sale and repurchase price as well as purchase and resale price is treated as interest and accrued over the life of the resale/repurchase agreement using the effective yield method.
aK CoNtINGeNt aSSetS aND CoNtINGeNt LIaBILItIeS
The Group does not recognise contingent assets and liabilities, but discloses its existence in the financial statements. A contingent liability is a possible obligation that arises from past events whose existence will be confirmed by the occurrence or non-occurrence of one or more uncertain future events beyond the control of the Group or a present obligation that is not recognised because it is not probable that an outflow of resources will be required to settle the obligation. A contingent liability also arises in the extremely rare case where there is a liability that cannot be recognised because it cannot be measured reliably. However, contingent liabilities do not include financial guarantee contracts. A contingent asset is a possible asset that arises from past events whose existence will be confirmed by the occurrence or non-occurrence of one or more uncertain future events beyond the control of the Group. The Group does not recognise contingent assets but discloses its existence where inflows of economic benefits are probable, but not virtually certain.
aL trUSt aCtIvItIeS
The Group acts as trustees in other fiduciary capabilities that result in holding or placing of assets on behalf of individuals, trust and other institutions. These assets and income arising thereon are excluded from the financial statements, as they are not assets of the Group.
SUMMarY oF SIGNIFICaNt aCCoUNtING poLICIeS for the financial year ended 30 June 2016
HONG LEONG FINANCIAL GROUP BERHAD ANNUAL REPORT 2016104
1 GeNeraL INForMatIoN
The principal activities of the Company are those of investment holding and provision of services to its subsidiaries to enhance group value.
The Hong Leong Financial Group (the Company and its subsidiaries) is a diversified financial group whose businesses provide a broad range of financial products and services to consumer, corporate and institutional customers.
The principal activities of the subsidiary companies are disclosed in Note 11 to the financial statements. There were no significant changes in the nature of the activities of the Company and its subsidiaries during the financial year.
The Company is a public limited liability company, incorporated and domiciled in Malaysia, and listed on the Main Market of Bursa Malaysia Securities Berhad.
The address of the registered office and principal place of business of the Company is Level 8, Wisma Hong Leong, 18 Jalan Perak, 50450 Kuala Lumpur.
2 CaSH aND SHort-terM FUNDS
the Group the Company2016 2015 2016 2015
rM’000 rM’000 rM’000 rM’000
Cash and balances with banks and other financial institutions 1,791,237 2,078,122 24 2,645 Money at call and deposit placements maturing within one month 7,638,355 6,385,072 9,596 5,700
9,429,592 8,463,194 9,620 8,345
Inclusive in cash and short-term funds of the Group are accounts held in trust for dealer’s representative amounting to RM12,998,000 (2015: RM13,544,000).
The Company has placed a fixed deposit of RM900,000 (2015: RM900,000) with a bank for the RM150 million short-term loan facility. The Company has agreed not to withdraw the fixed deposits during the tenure of the facility. The bank has a right to set-off any sums placed by the Company in the fixed deposit account.
3 DepoSItS aND pLaCeMeNtS WItH BaNKS aND otHer FINaNCIaL INStItUtIoNS
the Group the Company2016 2015 2016 2015
rM’000 rM’000 rM’000 rM’000
Bank Negara Malaysia (“BNM”) – 1,893 – – Licensed banks 2,487,772 3,205,230 8,400 8,888 Licensed investment banks – 251,006 – – Other financial institutions 545,894 867,000 – –
3,033,666 4,325,129 8,400 8,888
As at 30 June 2016, the Company has placed a fixed deposit of RM8,400,000 (2015: RM8,400,000) with a bank for the RM100 million revolving credit facility and RM200 million term loan facility. The Company has agreed not to withdraw the fixed deposits during the tenure of the facility. The bank has a right to set-off any sums placed by the Company in the fixed deposit account.
NoteS to tHe FINaNCIaL StateMeNtSfor the financial year ended 30 June 2016

105Corporate / Financials / Additional Information
4 FINaNCIaL aSSetS HeLD-For-traDING
the Group2016 2015
rM’000 rM’000
Money market instrumentsBank Negara Malaysia bills – 383,325 Government treasury bills 119,332 78,632 Malaysian Government securities 239,083 120,509 Malaysian Government Investment Certificates 320,952 609,725 Bankers’ acceptances and Islamic accepted bills – 457,179 Negotiable instruments of deposit 4,848,396 5,485,337 Cagamas bonds 55,474 36,450 Other government securities 158,666 33,035
5,741,903 7,204,192
Quoted securitiesShares in Malaysia 478,460 515,312 Shares outside Malaysia 66,899 92,789 Unit trust investments 241,851 189,412 Foreign currency bonds in Malaysia 488,718 375,822 Warrants quoted in Malaysia – 129
1,275,928 1,173,464
Unquoted securitiesForeign currency bonds in Malaysia 53,001 – Foreign currency bonds outside Malaysia 134,406 65,864 Corporate bonds and sukuk 1,319,435 795,284
1,506,842 861,148
Total financial assets held-for-trading 8,524,673 9,238,804
Included in the financial assets held-for-trading are foreign currency bonds, which are pledged as collateral for obligations on securities sold under repurchase agreements amounting to RM7,929,000 (2015: RM Nil).
NoteS to tHe FINaNCIaL StateMeNtSfor the financial year ended 30 June 2016

HONG LEONG FINANCIAL GROUP BERHAD ANNUAL REPORT 2016106
5 FINaNCIaL INveStMeNtS avaILaBLe-For-SaLe
the Group2016 2015
rM’000 rM’000 Money market instrumentsGovernment treasury bills 69,206 168,553 Malaysia Government securities 1,040,565 486,964 Malaysia Government Investment Certificates 3,547,351 3,541,575 Other Government securities 1,790,368 1,580,814 Khazanah bonds 334,686 345,140 Cagamas bonds 1,019,398 905,342
7,801,574 7,028,388
Quoted securitiesShares in Malaysia 1,513,057 1,349,547 Shares outside Malaysia 146,706 273,333 Foreign currency bonds in Malaysia 3,606,238 4,380,452 Foreign currency bonds outside Malaysia 1,954,369 1,452,826 Unit trust investments 7,079,657 3,591,062
14,300,027 11,047,220
Unquoted securitiesShares in Malaysia 427,399 395,225 Shares outside Malaysia 16,301 4,134 Malaysia Government sukuk 820,552 –Corporate bonds and sukuk 11,004,921 10,512,322 Foreign currency bonds in Malaysia 1,125,156 358,364 Foreign currency bonds outside Malaysia 468,925 419,344 Investment-linked funds 300 300
13,863,554 11,689,689
35,965,155 29,765,297 Allowance for impairment losses (198,063) (142,240)
Total financial investments available-for-sale 35,767,092 29,623,057
NoteS to tHe FINaNCIaL StateMeNtSfor the financial year ended 30 June 2016

107Corporate / Financials / Additional Information
5 FINaNCIaL INveStMeNtS avaILaBLe-For-SaLe (CoNtINUeD)
The table below shows the movements in allowance for impairment losses during the financial year for the Group:
the Group2016 2015
rM’000 rM’000
As at 1 July 142,240 68,062 Allowance made during the financial year 141,488 74,122 Amount written back in respect of recoveries – (5,218)Amount written off (88,231) – Amount transferred from individual assessment impairment allowance of
loans, advances and financing 2,566 5,274
As at 30 June 198,063 142,240
Included in the financial investments available-for-sale are foreign currency bonds, which are pledged as collateral for obligations on securities sold under repurchase agreements amounting to RM1,950,947,000 (2015: RM1,073,047,000).
6 FINaNCIaL INveStMeNtS HeLD-to-MatUrItY
the Group2016 2015
rM’000 rM’000
Money market instrumentsGovernment treasury bills 54,922 – Malaysian Government securities 3,403,858 3,003,596 Malaysian Government Investment Certificates 7,731,720 6,549,704 Cagamas bonds 30,356 30,454 Negotiable instruments of deposit – 2,338 Other Government securities 395,513 335,159
11,616,369 9,921,251
Unquoted securitiesLoan stocks 5,923 6,404 Malaysia Government sukuk 470,220 –Corporate bonds and sukuk 777,763 838,113Foreign currency bonds in Malaysia – 98,029 Foreign currency bonds outside Malaysia 125,456 150,358 Investment in preference shares 32,066 54,000
1,411,428 1,146,904
13,027,797 11,068,155 Allowance for impairment losses (116,479) (126,317)
Total financial investments held-to-maturity 12,911,318 10,941,838
NoteS to tHe FINaNCIaL StateMeNtSfor the financial year ended 30 June 2016

HONG LEONG FINANCIAL GROUP BERHAD ANNUAL REPORT 2016108
6 FINaNCIaL INveStMeNtS HeLD-to-MatUrItY (CoNtINUeD)
The table below shows the movements in allowance for impairment losses during the financial year for the Group:
the Group2016 2015
rM’000 rM’000
As at 1 July 126,317 140,985 Amount written back in respect of recoveries (9,838) (14,668)
As at 30 June 116,479 126,317
Included in the financial investments held-to-maturity are Malaysian Government securities, which are pledged as collateral for obligations on securities sold under repurchase agreements amounting to RM1,304,265,000 (2015: RM2,313,740,000). The fair value of the Malaysian Government securities as at 30 June 2016 is RM1,306,625,000 (2015: RM2,315,336,000).
7 LoaNS, aDvaNCeS aND FINaNCING
the Group2016 2015
rM’000 rM’000
Overdrafts 3,857,485 4,005,025 Term loans/financing
- Housing and shop loans/financing 60,462,347 53,828,770 - Syndicated term loans/financing 9,339,212 9,038,647 - Hire purchase receivables 18,682,098 18,099,246 - Other term loans/financing 8,605,184 9,002,712
Credit/charge card receivables 3,755,348 3,889,314 Bills receivable 1,107,690 1,166,833 Trust receipts 381,531 322,780 Policy and premium loans 614,679 661,576 Claims on customers under acceptance credits 7,439,144 7,369,680 Block discounting – 14 Revolving credits 6,757,003 6,549,079 Staff loans/financing 164,914 167,557 Other loans/financing 425,856 305,619
Gross loans, advances and financing 121,592,491 114,406,852 Unamortised fair value changes arising from terminated fair value hedges (784) (2,188)Allowance for impaired loans, advances and financing
- Collective assessment allowance (856,971) (969,925)- Individual assessment allowance (289,844) (323,071)
Total net loans, advances and financing 120,444,892 113,111,668
NoteS to tHe FINaNCIaL StateMeNtSfor the financial year ended 30 June 2016

109Corporate / Financials / Additional Information
7 LoaNS, aDvaNCeS aND FINaNCING (CoNtINUeD)
(a) The maturity structure of loans, advances and financing is as follows:
the Group2016 2015
rM’000 rM’000
Maturing within:- one year 27,848,217 29,502,698 - one year to three years 5,434,573 7,851,837 - three years to five years 10,710,736 10,277,792 - over five years 77,598,965 66,774,525
Gross loans, advances and financing 121,592,491 114,406,852
(b) The loans, advances and financing are disbursed to the following types of customers:
the Group2016 2015
rM’000 rM’000
Domestic financial institutions 47 – Domestic non-bank financial institutions other than stockbroking companies 600,249 638,549 Domestic business enterprises
- small medium enterprises 19,246,622 17,816,923 - others 17,099,287 18,531,751
Government and statutory bodies 24,804 24,448 Individuals 77,670,558 71,743,193 Other domestic entities 75,714 171,386 Foreign entities 6,875,210 5,480,602
Gross loans, advances and financing 121,592,491 114,406,852
(c) Loans, advances and financing analysed by their interest rate/profit rate sensitivity are as follows:
the Group2016 2015
rM’000 rM’000
Fixed rate- Housing and shop loans/financing 2,604,404 2,738,272 - Hire purchase receivables 18,200,640 17,779,388 - Credit card 3,755,348 3,889,314 - Other fixed rate loan/financing 4,328,490 3,909,814
variable rate- Base rate/base lending rate plus 75,993,221 69,749,552 - Cost plus 16,322,812 16,021,109 - Other variable rates 387,576 319,403
Gross loans, advances and financing 121,592,491 114,406,852
NoteS to tHe FINaNCIaL StateMeNtSfor the financial year ended 30 June 2016

HONG LEONG FINANCIAL GROUP BERHAD ANNUAL REPORT 2016110
7 LoaNS, aDvaNCeS aND FINaNCING (CoNtINUeD)
(d) Loans, advances and financing analysed by their economic purposes are as follows:
the Group2016 2015
rM’000 rM’000
Purchase of securities 856,080 927,652 Purchase of transport vehicles 18,445,657 18,020,608 Residential property (housing) 51,510,277 45,307,229 Non-residential property 14,986,782 14,231,669 Purchase of fixed assets (excluding landed properties) 434,041 462,979 Personal use 3,766,429 3,523,573 Credit card 3,755,348 3,889,314 Purchase of consumer durables 387 418 Construction 1,386,003 1,257,882 Mergers and acquisition 233,364 258,988 Working capital 23,529,783 23,536,346 Other purposes 2,688,340 2,990,194
Gross loans, advances and financing 121,592,491 114,406,852
(e) Loans, advances and financing analysed by their geographical distribution are as follows:
the Group2016 2015
rM’000 rM’000
In Malaysia 115,965,819 110,271,571 Outside Malaysia
- Singapore 4,678,961 3,529,821 - Hong Kong 34,168 20,063 - Vietnam 387,576 319,403 - Cambodia 525,967 265,994
Gross loans, advances and financing 121,592,491 114,406,852
NoteS to tHe FINaNCIaL StateMeNtSfor the financial year ended 30 June 2016

111Corporate / Financials / Additional Information
7 LoaNS, aDvaNCeS aND FINaNCING (CoNtINUeD)
(f) Impaired loans, advances and financing analysed by their economic purposes are as follows:
the Group2016 2015
rM’000 rM’000
Purchase of securities 225 235 Purchase of transport vehicles 145,528 184,180 Residential property (housing) 233,566 207,744 Non-residential property 99,145 46,190 Purchase of fixed assets (excluding landed properties) 22,872 34,188 Personal use 36,909 34,714 Credit card 44,308 42,907 Purchase of consumer durables – 4 Construction 9,138 4,114 Working capital 346,555 365,444 Other purposes 18,907 28,863
Gross impaired loans, advances and financing 957,153 948,583
(g) Movements in the impaired loans, advances and financing are as follows:
the Group2016 2015
rM’000 rM’000
As at 1 July 948,583 1,232,588 Impaired during the financial year 1,572,187 1,525,362 Performing during the financial year (798,443) (792,443)Amount written back in respect of recoveries (338,880) (480,823)Amount written off (426,490) (541,798)Exchange differences 196 5,697
As at 30 June 957,153 948,583
Gross impaired loans as a % of gross loans, advances and financing 0.8% 0.8%
NoteS to tHe FINaNCIaL StateMeNtSfor the financial year ended 30 June 2016
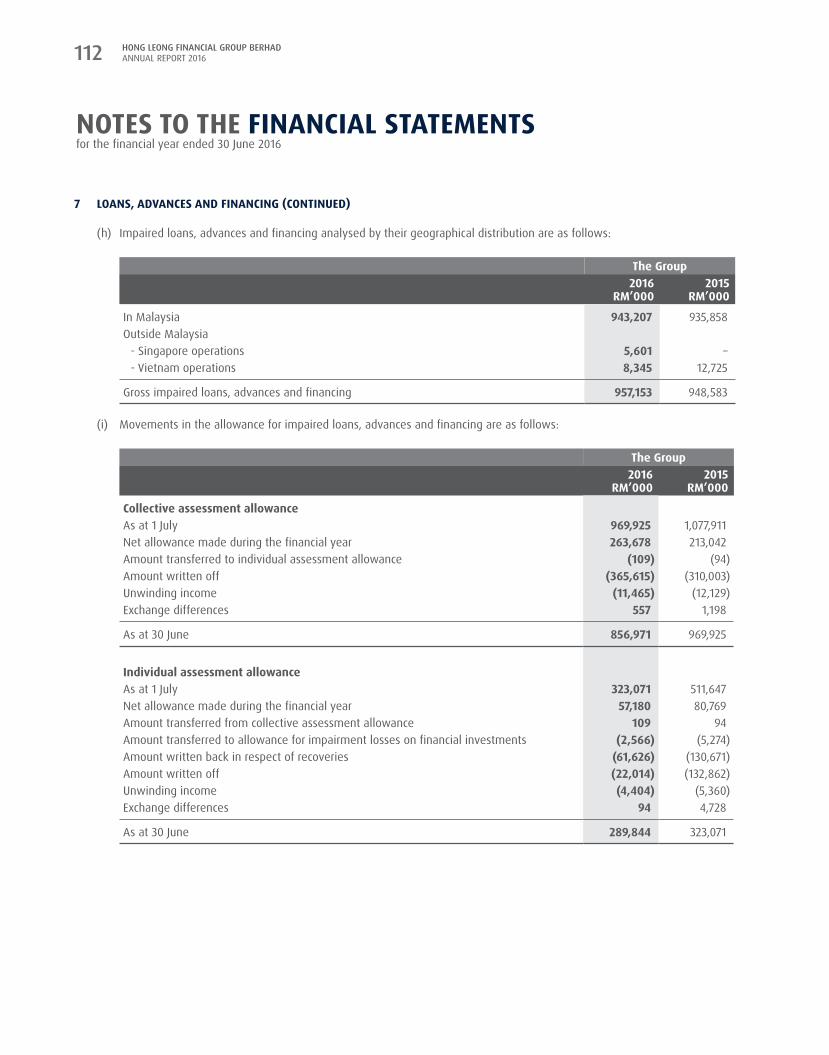
HONG LEONG FINANCIAL GROUP BERHAD ANNUAL REPORT 2016112
7 LoaNS, aDvaNCeS aND FINaNCING (CoNtINUeD)
(h) Impaired loans, advances and financing analysed by their geographical distribution are as follows:
the Group2016 2015
rM’000 rM’000
In Malaysia 943,207 935,858 Outside Malaysia
- Singapore operations 5,601 – - Vietnam operations 8,345 12,725
Gross impaired loans, advances and financing 957,153 948,583
(i) Movements in the allowance for impaired loans, advances and financing are as follows:
the Group2016 2015
rM’000 rM’000
Collective assessment allowanceAs at 1 July 969,925 1,077,911 Net allowance made during the financial year 263,678 213,042 Amount transferred to individual assessment allowance (109) (94)Amount written off (365,615) (310,003)Unwinding income (11,465) (12,129)Exchange differences 557 1,198
As at 30 June 856,971 969,925
Individual assessment allowanceAs at 1 July 323,071 511,647 Net allowance made during the financial year 57,180 80,769 Amount transferred from collective assessment allowance 109 94 Amount transferred to allowance for impairment losses on financial investments (2,566) (5,274)Amount written back in respect of recoveries (61,626) (130,671)Amount written off (22,014) (132,862)Unwinding income (4,404) (5,360)Exchange differences 94 4,728
As at 30 June 289,844 323,071
NoteS to tHe FINaNCIaL StateMeNtSfor the financial year ended 30 June 2016

113Corporate / Financials / Additional Information
8 CLIeNtS’ aND BroKerS’ BaLaNCeS
Clients’ and brokers’ balances represent amount receivable from outstanding purchase contracts in respect of the Group’s stockbroking and futures clients, amount due from brokers and contra losses and trade receivables from insurance clients.
the Group2016 2015
rM’000 rM’000
Performing accounts 394,793 336,483 Impaired accounts 1,390 1,532
396,183 338,015 Less: Allowances for bad and doubtful debts
- Individual assessment allowance (282) (361)- Collective assessment allowance (17) (23)
395,884 337,631
Movements of impaired accounts are as follows:
the Group2016 2015
rM’000 rM’000
As at 1 July 1,532 956 Impaired during the financial year 581 928 Written back during the financial year (723) (352)
As at 30 June 1,390 1,532
Movements in the allowances for losses on clients’ and brokers’ balances are as follows:
the Group2016 2015
rM’000 rM’000
Individual assessment allowanceAs at 1 July 361 370 Allowance made during the financial year 150 97 Allowance written back during the financial year (229) (106)
As at 30 June 282 361
Collective assessment allowanceAs at 1 July 23 15 Allowance (written back)/made during the financial year (6) 8
As at 30 June 17 23
NoteS to tHe FINaNCIaL StateMeNtSfor the financial year ended 30 June 2016

HONG LEONG FINANCIAL GROUP BERHAD ANNUAL REPORT 2016114
9 otHer reCeIvaBLeS
the Group the Company2016 2015 2016 2015
Note rM’000 rM’000 rM’000 rM’000
Foreclosed properties 46 1,023 – – Sundry debtors and other prepayments 337,397 268,330 410 381 Treasury related receivables 629,659 429,244 – – Cash collateral pledged for derivative transactions 684,890 518,448 – – Fee income receivables net of allowance for
impairment losses of RM28,000 (2015: RM28,000) (a) 7,743 7,123 – – Other receivables 157,093 191,665 229 228
1,816,828 1,415,833 639 609
(a) Movements of allowance for impairment losses on fee income receivables is as follows:
the Group the Company2016 2015 2016 2015
rM’000 rM’000 rM’000 rM’000
Individual assessment allowanceAs at 1 July 28 375 – – Allowance written back during the financial year – (106) – – Allowance written off during the financial year – (241) – –
As at 30 June 28 28 – –
10 StatUtorY DepoSItS WItH CeNtraL BaNKS
The non-interest bearing statutory deposits are maintained by certain banking subsidiaries with Bank Negara Malaysia in compliance with Section 26(2)(c) of the Central Bank of Malaysia Act, 2009, the amounts of which are determined at set percentages of total eligible liabilities. The non-interest bearing statutory deposits of a foreign banking subsidiary and the foreign branch of a banking subsidiary of the Group are maintained with respective central banks in compliance with the applicable legislation.
NoteS to tHe FINaNCIaL StateMeNtSfor the financial year ended 30 June 2016
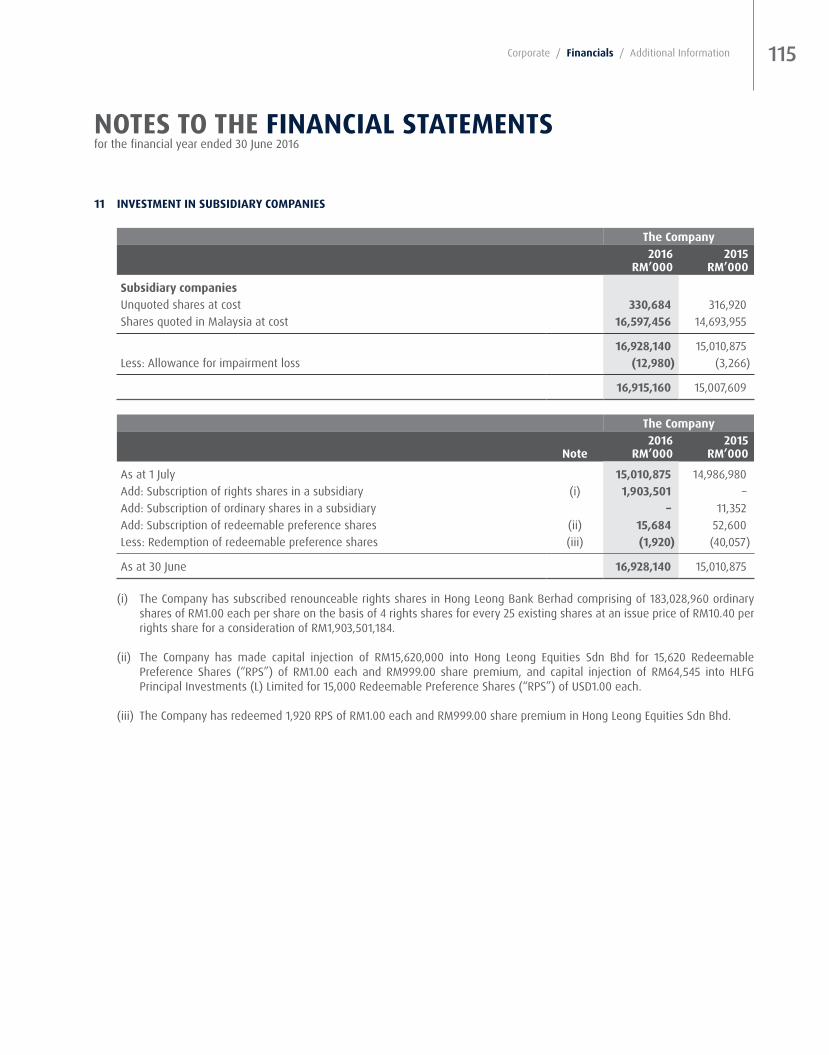
115Corporate / Financials / Additional Information
11 INveStMeNt IN SUBSIDIarY CoMpaNIeS
the Company2016 2015
rM’000 rM’000
Subsidiary companiesUnquoted shares at cost 330,684 316,920 Shares quoted in Malaysia at cost 16,597,456 14,693,955
16,928,140 15,010,875 Less: Allowance for impairment loss (12,980) (3,266)
16,915,160 15,007,609
the Company2016 2015
Note rM’000 rM’000
As at 1 July 15,010,875 14,986,980 Add: Subscription of rights shares in a subsidiary (i) 1,903,501 – Add: Subscription of ordinary shares in a subsidiary – 11,352 Add: Subscription of redeemable preference shares (ii) 15,684 52,600 Less: Redemption of redeemable preference shares (iii) (1,920) (40,057)
As at 30 June 16,928,140 15,010,875
(i) The Company has subscribed renounceable rights shares in Hong Leong Bank Berhad comprising of 183,028,960 ordinary shares of RM1.00 each per share on the basis of 4 rights shares for every 25 existing shares at an issue price of RM10.40 per rights share for a consideration of RM1,903,501,184.
(ii) The Company has made capital injection of RM15,620,000 into Hong Leong Equities Sdn Bhd for 15,620 Redeemable Preference Shares (“RPS”) of RM1.00 each and RM999.00 share premium, and capital injection of RM64,545 into HLFG Principal Investments (L) Limited for 15,000 Redeemable Preference Shares (“RPS”) of USD1.00 each.
(iii) The Company has redeemed 1,920 RPS of RM1.00 each and RM999.00 share premium in Hong Leong Equities Sdn Bhd.
NoteS to tHe FINaNCIaL StateMeNtSfor the financial year ended 30 June 2016

HONG LEONG FINANCIAL GROUP BERHAD ANNUAL REPORT 2016116
11 INveStMeNt IN SUBSIDIarY CoMpaNIeS (CoNtINUeD)
(i) Information about principal subsidiaries:
The subsidiary companies of the Company are as follows:
effective percentage of
ownership
Name of companiesplace of incorporation
2016 %
2015 % principal activities
(a) HLA Holdings Sdn Bhd and its subsidiary companies:
Malaysia 100.00 100.00 Investment holding
(i) Hong Leong Assurance Berhad Malaysia 70.00 70.00 Life insurance business- Unincorporated trust for ESOSΩ* Malaysia – – Special purpose vehicle for ESOS
(ii) Hong Leong Insurance (Asia) Limited* Hong Kong 100.00 100.00 General insurance business(iii) Hong Leong MSIG Takaful Berhad Malaysia 65.00 65.00 Takaful business(iv) RC Holdings Sdn Bhd Malaysia 100.00 100.00 Investment holding(v) HL Assurance Pte. Ltd. Singapore 100.00 100.00 General insurance business
(b) Hong Leong Equities Sdn Bhd Malaysia 100.00 100.00 Investment holding(c) HLFG Assets Sdn Bhd Malaysia 100.00 100.00 Investment dealing(d) Wing Trade Investments Limited* British Virgin
Islands – 100.00 Dissolved
(e) Unincorporated trust for ESOSΩ* Malaysia – – Special purpose vehicle for ESOS(f) HLFG Principal Investments (L) Limited Labuan 100.00 100.00 Investment holding(g) Hong Leong Capital Berhad and its subsidiary
companies:Malaysia 83.22 83.22 Investment holding
(i) HLG Securities Sdn Bhd Malaysia 83.22 83.22 Investment holding(ii) HLG Capital Markets Sdn Bhd and its
subsidiary company:Malaysia 83.22 83.22 Investment holding
- HLG Principal Investments (L) Limited Labuan 83.22 83.22 Dormant(iii) Hong Leong Investment Bank Berhad and
its subsidiary companies:Malaysia 83.22 83.22 Investment banking,
stockbroking business, futures broking and related financial services
- HLG Nominee (Tempatan) Sdn Bhd Malaysia 83.22 83.22 In member’s voluntary liquidation
- HLG Nominee (Asing) Sdn Bhd Malaysia 83.22 83.22 In member’s voluntary liquidation
- RC Research Sdn Bhd Malaysia – 83.22 Dissolved- ECS Jaya (1969) Sdn Bhd Malaysia – 83.22 Dissolved- SSSB Jaya (1987) Sdn Bhd Malaysia 83.22 83.22 In creditors’ voluntary liquidation- HLIB Nominees (Tempatan) Sdn Bhd Malaysia 83.22 83.22 Nominee and custodian services
for Malaysian clients- HLIB Nominees (Asing) Sdn Bhd Malaysia 83.22 83.22 Nominee and custodian services
for foreign clients
NoteS to tHe FINaNCIaL StateMeNtSfor the financial year ended 30 June 2016

117Corporate / Financials / Additional Information
11 INveStMeNt IN SUBSIDIarY CoMpaNIeS (CoNtINUeD)
(i) Information about principal subsidiaries: (continued)
The subsidiary companies of the Company are as follows: (continued)
effective percentage of
ownership
Name of companiesplace of incorporation
2016 %
2015 % principal activities
(iv) HLCB Assets Sdn Bhd (formerly known as HLG Futures Sdn Bhd)
Malaysia 83.22 83.22 Investment holding
(v) Hong Leong Asset Management Bhd Malaysia 83.22 83.22 Unit trust management, fund management and sale of unit trusts
(vi) Unincorporated trust for ESOSΩ* Malaysia – – Special purpose vehicle for ESOS(vii) Hong Leong Islamic Institutional Income
Management FundΩMalaysia 83.22 83.22 Unit trust funds
(viii) Hong Leong Islamic Cash FundΩ Malaysia 83.22 83.22 Unit trust funds(ix) Hong Leong Enhanced Cash FundΩ Malaysia 83.22 83.22 Unit trust funds(x) Hong Leong Islamic Enhanced Cash FundΩ Malaysia 83.22 83.22 Unit trust funds
(h) Hong Leong Bank Berhad and its subsidiary companies:
Malaysia 65.62 65.47 All aspects of commercial banking business and provision of related services
(i) Hong Leong Islamic Bank Berhad Malaysia 65.62 65.47 Islamic banking business and related financial services
(ii) DC Tower Sdn Bhd^ Malaysia 65.62 – Real property investment(iii) Hong Leong Bank Vietnam Limited* Vietnam 65.62 65.47 Commercial banking business(iv) Hong Leong Bank (Cambodia) PLC+ Cambodia 65.62 65.47 Commercial banking business(v) HLF Credit (Perak) Bhd and its subsidiary
companies:Malaysia 65.62 65.47 Investment holding
- Gensource Sdn Bhd and its subsidiary company:
Malaysia 65.62 65.47 Investment holding
- Pelita Terang Sdn Bhd Malaysia 65.62 65.47 Dormant- WTB Corporation Sdn Bhd and its
subsidiary companies:Malaysia 65.62 65.47 Investment holding
- Wah Tat Nominees (Tempatan) Sdn Bhd
Malaysia 65.62 65.47 In member’s voluntary liquidation
- Wah Tat Nominees (Asing) Sdn Bhd
Malaysia 65.62 65.47 In member’s voluntary liquidation
- Chew Geok Lin Finance Sdn Bhd Malaysia 65.62 65.47 Investment holding- Hong Leong Leasing Sdn Bhd* Malaysia 65.62 65.47 Investment holding- HL Leasing Sdn Bhd Malaysia 65.62 65.47 Investment holding- HLB Realty Sdn Bhd Malaysia 65.62 65.47 Real property investment and
investment holding
NoteS to tHe FINaNCIaL StateMeNtSfor the financial year ended 30 June 2016

HONG LEONG FINANCIAL GROUP BERHAD ANNUAL REPORT 2016118
11 INveStMeNt IN SUBSIDIarY CoMpaNIeS (CoNtINUeD)
(i) Information about principal subsidiaries: (continued)
The subsidiary companies of the Company are as follows: (continued)
effective percentage of
ownership
Name of companiesplace of incorporation
2016 %
2015 % principal activities
(vi) HLB Nominees (Tempatan) Sdn Bhd Malaysia 65.62 65.47 Agent and nominee for Malaysian clients
(vii) HLB Nominees (Asing) Sdn Bhd Malaysia 65.62 65.47 Agent and nominee for foreign clients
(viii) HL Bank Nominees (Singapore) Pte Ltd+ Singapore 65.62 65.47 Agent and nominee for clients(ix) HLB Trade Services (Hong Kong) Limited+ Hong Kong 65.62 65.47 Ceased operations(x) HLB Principal Investments (L) Limited and
its subsidiary company: Malaysia 65.62 65.47 Holding of or dealings in
offshore securities and investment holding
- Promino Sdn Bhd Malaysia 65.62 65.47 Ceased operations(xi) Prominic Berhad Malaysia 65.62 65.47 To issue Subordinated Notes
under a Stapled Securities structure and to on-lend the proceeds from the issuance to Hong Leong Bank Berhad, the issuer of the Capital Securities
(xii) Promitol Sdn Bhd Malaysia – 65.47 Dissolved(xiii) Promilia Berhad Malaysia 65.62 65.47 Dormant(xiv) EB Nominees (Tempatan) Sendirian
BerhadMalaysia 65.62 65.47 Nominee services
(xv) EB Nominees (Asing) Sendirian Berhad Malaysia 65.62 65.47 Nominee services(xvi) EB Realty Sendirian Berhad Malaysia 65.62 65.47 Property investment(xvii) OBB Realty Sdn Bhd Malaysia 65.62 65.47 Property investment(xviii) Unincorporated trust for ESOSΩ* Malaysia – – Special purpose vehicle for ESOS
(i) Cova Horizon Sdn BhdΩ* Malaysia – – Ceased control during the year(j) Halcyon Capital Sdn BhdΩ* Malaysia – – Special purpose vehicle(k) Balius Capital Sdn BhdΩ* Malaysia – – Special purpose vehicle(l) Hong Leong Wholesale Bond FundΩ Malaysia – – Unit trust funds
* Not audited by PricewaterhouseCoopers+ Audited by member firms of PricewaterhouseCoopers International which is a separate and independent legal entity
from PricewaterhouseCoopers MalaysiaΩ Deemed subsidiary companies pursuant to MFRS 10 “Consolidated Financial Statements”^ The details of acquisition of DC Tower Sdn Bhd by the subsidiary, Hong Leong Bank Berhad are as disclosed in Note 52
NoteS to tHe FINaNCIaL StateMeNtSfor the financial year ended 30 June 2016

119Corporate / Financials / Additional Information
11 INveStMeNt IN SUBSIDIarY CoMpaNIeS (CoNtINUeD)
(ii) Details of subsidiary companies that have material non-controlling interests:
Set out below are the Group’s subsidiary companies that have material non-controlling interests:
proportion of ownership interests and voting rights
held by non-controlling interests
profit allocated to non-controlling interests
accumulated non-controlling interests
2016 2015 2016 2015 2016 2015 % % rM’000 rM’000 rM’000 rM’000
Hong Leong Bank Berhad 34.38 34.53 655,873 770,900 7,260,075 5,831,696 Hong Leong Capital Berhad 16.78 16.78 11,345 11,805 116,559 92,582 Hong Leong Assurance
Berhad 30.00 30.00 40,093 57,069 431,726 398,682 Individually immaterial
subsidiaries with non-controlling interests (2,662) (140) 27,661 30,317
704,649 839,634 7,836,021 6,353,277
Summarised financial information for each subsidiary companies that has non-controlling interests that are material to the Group is set out below. The summarised financial information below represents amounts before inter-company eliminations.
Hong Leong assurance Berhad Hong Leong Bank Berhad Hong Leong Capital Berhad2016 2015 2016 2015 2016 2015
rM’000 rM’000 rM’000 rM’000 rM’000 rM’000
Total assets 14,820,940 14,228,759 189,828,215 184,019,735 4,149,057 3,711,683 Total liabilities (13,382,294) (12,900,263) (168,711,068) (167,230,143) (3,448,696) (3,063,786)
Net assets 1,438,646 1,328,496 21,117,147 16,789,592 700,361 647,897
Equity attributable to owners of the Company (1,006,920) (929,814) (13,857,072) (10,957,896) (583,802) (555,315)
Non-controlling interests (431,726) (398,682) (7,260,075) (5,831,696) (116,559) (92,582)
NoteS to tHe FINaNCIaL StateMeNtSfor the financial year ended 30 June 2016
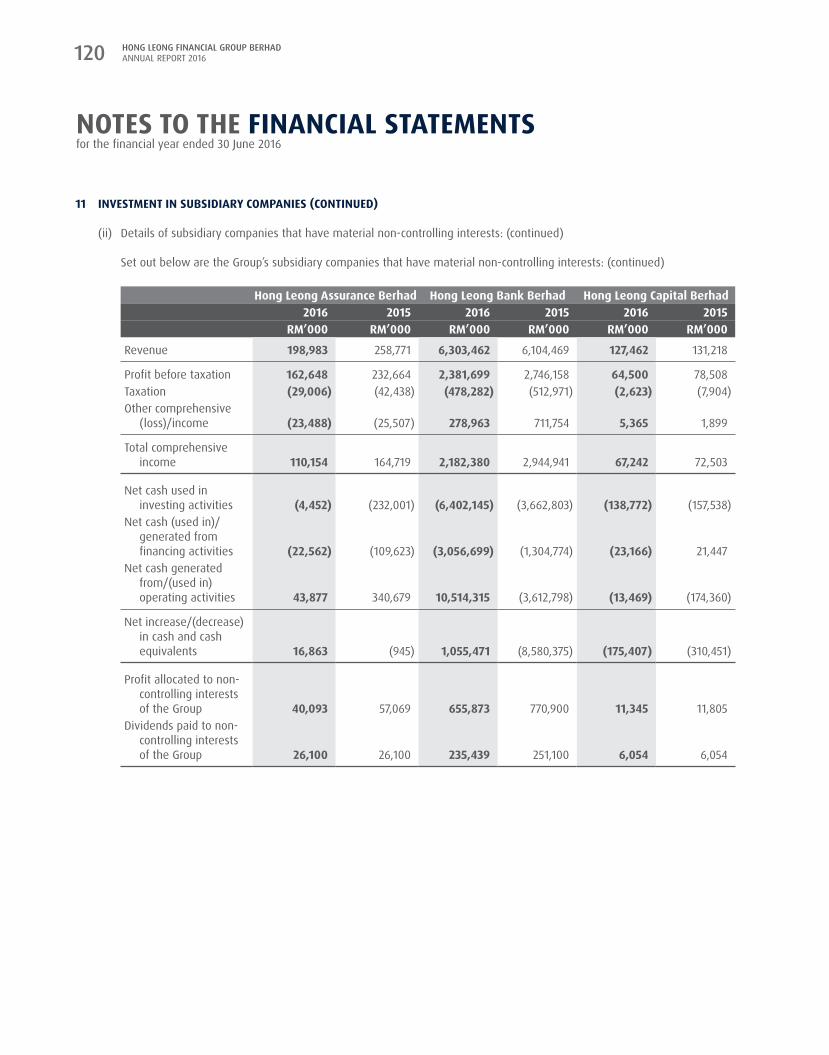
HONG LEONG FINANCIAL GROUP BERHAD ANNUAL REPORT 2016120
11 INveStMeNt IN SUBSIDIarY CoMpaNIeS (CoNtINUeD)
(ii) Details of subsidiary companies that have material non-controlling interests: (continued)
Set out below are the Group’s subsidiary companies that have material non-controlling interests: (continued)
Hong Leong assurance Berhad Hong Leong Bank Berhad Hong Leong Capital Berhad2016 2015 2016 2015 2016 2015
rM’000 rM’000 rM’000 rM’000 rM’000 rM’000
Revenue 198,983 258,771 6,303,462 6,104,469 127,462 131,218
Profit before taxation 162,648 232,664 2,381,699 2,746,158 64,500 78,508 Taxation (29,006) (42,438) (478,282) (512,971) (2,623) (7,904)Other comprehensive
(loss)/income (23,488) (25,507) 278,963 711,754 5,365 1,899
Total comprehensive income 110,154 164,719 2,182,380 2,944,941 67,242 72,503
Net cash used in investing activities (4,452) (232,001) (6,402,145) (3,662,803) (138,772) (157,538)
Net cash (used in)/ generated from financing activities (22,562) (109,623) (3,056,699) (1,304,774) (23,166) 21,447
Net cash generated from/(used in) operating activities 43,877 340,679 10,514,315 (3,612,798) (13,469) (174,360)
Net increase/(decrease) in cash and cash equivalents 16,863 (945) 1,055,471 (8,580,375) (175,407) (310,451)
Profit allocated to non- controlling interests of the Group 40,093 57,069 655,873 770,900 11,345 11,805
Dividends paid to non- controlling interests of the Group 26,100 26,100 235,439 251,100 6,054 6,054
NoteS to tHe FINaNCIaL StateMeNtSfor the financial year ended 30 June 2016

121Corporate / Financials / Additional Information
12 INveStMeNt IN aSSoCIateD CoMpaNIeS
the Group2016 2015
rM’000 rM’000
Unquoted shares, at cost- In Malaysia 618,666 618,666 - Outside Malaysia 946,505 946,505
Cumulative share of results, net of dividend received 1,855,269 1,602,083 Cumulative share of changes in other comprehensive income 13,711 6,285 Exchange fluctuation reserve 547,940 566,763
3,982,091 3,740,302
(a) Information about associated companies
the Grouppercentage (%) of equity held
Name Country of incorporation principal activities2016
% 2015
%
Bank of Chengdu Co., Ltd China Commercial banking 20 20
Community CSR Sdn Bhd Malaysia Investment holding 20 20
MSIG Insurance (Malaysia) Bhd Malaysia Insurance 30 30
Nature of relationship
(i) Bank of Chengdu Co., Ltd (“BoCD”)
On 25 October 2007, Hong Leong Bank Berhad (“HLB”) entered into a Share Subscription Agreement with Bank of Chengdu Co., Ltd (“BOCD”) to subscribe for new shares representing 19.99% equity interest of the Enlarged Capital in BOCD. BOCD is a leading commercial bank in Western and Central China with its base in Chengdu, the capital of Sichuan Province. The subscription enables HLB to enter into a strategic alliance with BOCD to tap the promising and growing financial services sector of China. It strengthens and diversifies the earning base of the Group.
(ii) Community CSr Sdn Bhd (“CCSr”)
In 2011, HLB subscribed to RM50 million Cumulative Redeemable Preference Shares (“CRPS”) in Jana Pendidikan Malaysia Sdn Bhd. For every RM1 million subscription of CRPS, HLB is entitled to subscribe for 1 Ordinary Share of RM1 each in CCSR. As such, HLB subscribed for 50 CCSR shares of RM1 each for cash at par which represent 20% equity interest of CCSR.
(iii) MSIG Insurance (Malaysia) Bhd (“MSIM”)
On 1 October 2010, HLA Holdings Sdn Bhd (“HLAH”) entered into a Strategic Partnership with Mitsui Sumitomo Insurance Company, Limited (“MSIJ”) to transfer the Non-Life Business of Hong Leong Assurance Berhad (“HLA”) to MSIG Insurance (Malaysia) Bhd (“MSIM”), a subsidiary of MSIJ and one of the largest general insurance in Malaysia, satisfied via the issuance of new shares 30% of the ordinary issued and paid-up capital of MSIM.
All associated companies are non-listed companies and there is no quoted market price available for their shares.
The Group deems BOCD and MSIM as material associated companies.
NoteS to tHe FINaNCIaL StateMeNtSfor the financial year ended 30 June 2016

HONG LEONG FINANCIAL GROUP BERHAD ANNUAL REPORT 2016122
12 INveStMeNt IN aSSoCIateD CoMpaNIeS (CoNtINUeD)
(b) The summarised financial information below represents amounts shown in the material associated companies financial statements which are accounted for using equity method is as follows:
(i) Bank of Chengdu Co., Ltd
the Group2016 2015
rM’000 rM’000
Total assets 210,788,236 192,679,002 Total liabilities (194,899,396) (177,790,122)
Net assets 15,888,840 14,888,880
Interest income 8,591,993 8,299,667 Interest expense (3,682,577) (3,622,526)Non-interest income 751,728 247,973 Profit before taxation 2,164,939 2,378,765 Profit after taxation 1,560,890 2,006,385 Dividends paid by the associated company during the financial year 489,440 334,470
Shares of results of associated company (%) 20% 20%Shares of results of associated company (RM’000) 312,178 401,277
(ii) MSIG Insurance (Malaysia) Bhd
the Group2016 2015
rM’000 rM’000
Total assets 4,916,992 4,760,931 Total liabilities (2,235,914) (2,219,177)
Net assets 2,681,078 2,541,754
Interest income 77,252 72,094 Non-interest income 436,204 406,255 Profit before taxation 285,013 272,731 Profit after taxation 229,597 206,733 Dividends paid by the associated company during the financial year 99,943 99,943
Shares of results of associated company (%) 30% 30%Shares of results of associated company (RM’000) 68,879 62,020
NoteS to tHe FINaNCIaL StateMeNtSfor the financial year ended 30 June 2016

123Corporate / Financials / Additional Information
12 INveStMeNt IN aSSoCIateD CoMpaNIeS (CoNtINUeD)
(c) Reconciliation of the summarised financial information to the carrying amount of the interest in the material associated companies recognised in the consolidated financial statements:
(i) Bank of Chengdu Co., Ltd
the Group2016 2015
rM’000 rM’000
Opening net assets as at 1 July 14,888,880 10,316,600 Profit for the financial year 1,560,890 2,006,385 Other comprehensive income for the financial year 22,625 66,550 Dividends (489,440) (334,470)Exchange fluctuation reserve (94,115) 2,833,815
Closing net assets as at 30 June 15,888,840 14,888,880
Interest in associated company (%) 20% 20%Interest in associated company (RM’000) 3,177,768 2,977,776
(ii) MSIG Insurance (Malaysia) Bhd
the Group2016 2015
rM’000 rM’000
Opening net assets as at 1 July 2,541,754 2,445,477 Profit for the financial year 229,597 206,733 Other comprehensive income/(loss) for the financial year 9,670 (10,513)Dividends (99,943) (99,943)
Closing net assets as at 30 June 2,681,078 2,541,754
Interest in associated company (%) 30% 30%Interest in associated company (RM’000) 804,323 762,526
The information presented above is based on the financial statements of the associated company after reflecting adjustments made by the Group when using the equity method, such as fair value adjustments made at the time of acquisition and differences in accounting policies between the Group and the associated companies.
The summarised financial information above represents amount shown in the material associate’s financial statements prepared in accordance with MFRSs (adjusted by the Group for equity accounting purposes).
NoteS to tHe FINaNCIaL StateMeNtSfor the financial year ended 30 June 2016

HONG LEONG FINANCIAL GROUP BERHAD ANNUAL REPORT 2016124
13 INveStMeNt IN JoINt veNtUreS
the Group2016 2015
rM’000 rM’000
Unquoted shares, at cost- In Malaysia 3,252 3,252 - Outside Malaysia 76,711 76,711
Cumulative share of results, net of dividend received 43,943 26,647 Exchange fluctuation reserve 21,277 22,620
145,183 129,230
(a) Information about joint ventures
the Grouppercentage (%) of equity held
Name Country of incorporation principal activities2016
% 2015
%
Sichuan Jincheng Consumer Finance Limited Company
China Consumer finance 49 49
Bangsar Capital Holdings (L) Limited (Incorporated in the Federal Territory of Labuan)
Malaysia In members’ voluntaryliquidation
50 50
Nature of relationship
(i) Sichuan Jincheng Consumer Finance Limited Company (“CFC”)
On 1 March 2010, HLB together with BOCD, obtained operation approval from China Banking Regulatory Commission (“CBRC”) for Sichuan Jincheng Consumer Finance Limited Company (“JV Co”), a joint venture company that is part of the first batch of approved companies, to start consumer finance operations in Central and Western China. This JV Co focuses primarily in the consumer financing business with HLB having a 49% equity interest and BOCD having a 51% equity interest in the JV Co. This strategic alliance between HLB and BOCD to tap into the promising and growing financial services sector in China further cements HLB’s strategic partnership in BOCD and affirms the Group’s vision and belief in the huge potential of China.
(ii) Bangsar Capital Holdings (L) Limited (“BCH”)
On 28 June 2014, HLFG Principal Investments (L) Limited (“HLFGPI”), a wholly-owned subsidiary of HLFG, had entered into a joint venture agreement with CIMB Strategic Assets Sdn Bhd (“CIMBSA”), a wholly-owned subsidiary of CIMB Group Holdings Berhad, to establish a joint venture investment holding company to be incorporated in Labuan (“Joint Venture Entity”), in which CIMBSA and HLFGPI would each hold 50% of the equity interests respectively. The Joint Venture Entity, BCH, has been incorporated to establish and manage a private equity fund. The Joint Venture Entity has commenced liquidation during the financial year.
All joint ventures companies are non-listed companies and there is no quoted market price available for their shares.
NoteS to tHe FINaNCIaL StateMeNtSfor the financial year ended 30 June 2016

125Corporate / Financials / Additional Information
13 INveStMeNt IN JoINt veNtUreS (CoNtINUeD)
(b) The summarised financial information below represents amounts shown in joint venture companies’ financial statements which are accounted for using equity method is as follows:
(i) Sichuan Jincheng Consumer Finance Limited Company
the Group2016 2015
rM’000 rM’000
Total assets 959,061 840,048 Total liabilities (663,398) (577,211)
Net assets 295,663 262,837
Interest income 114,510 106,593 Interest expenses (40,666) (27,254)Non-interest income 41,059 19,820 Profit before taxation 57,513 44,629 Profit after taxation 43,320 33,471 Dividend paid by the joint venture during the financial year 7,663 –
Shares of results of joint venture (%) 49% 49%Shares of results of joint venture (RM’000) 21,227 16,401
(ii) Bangsar Capital Holdings (L) Limited
the Group2016 2015
rM’000 rM’000
Total assets 788 5,151 Total liabilities (172) (4,271)
Net assets 616 880
Loss before taxation (352) (4,682)Loss after taxation (352) (4,682)
Shares of results of joint venture (%) 50% 50%Shares of results of joint venture (RM’000) (176) (2,341)
There are no commitments or contingent liabilities relating to the Group’s interest in the joint ventures.
NoteS to tHe FINaNCIaL StateMeNtSfor the financial year ended 30 June 2016
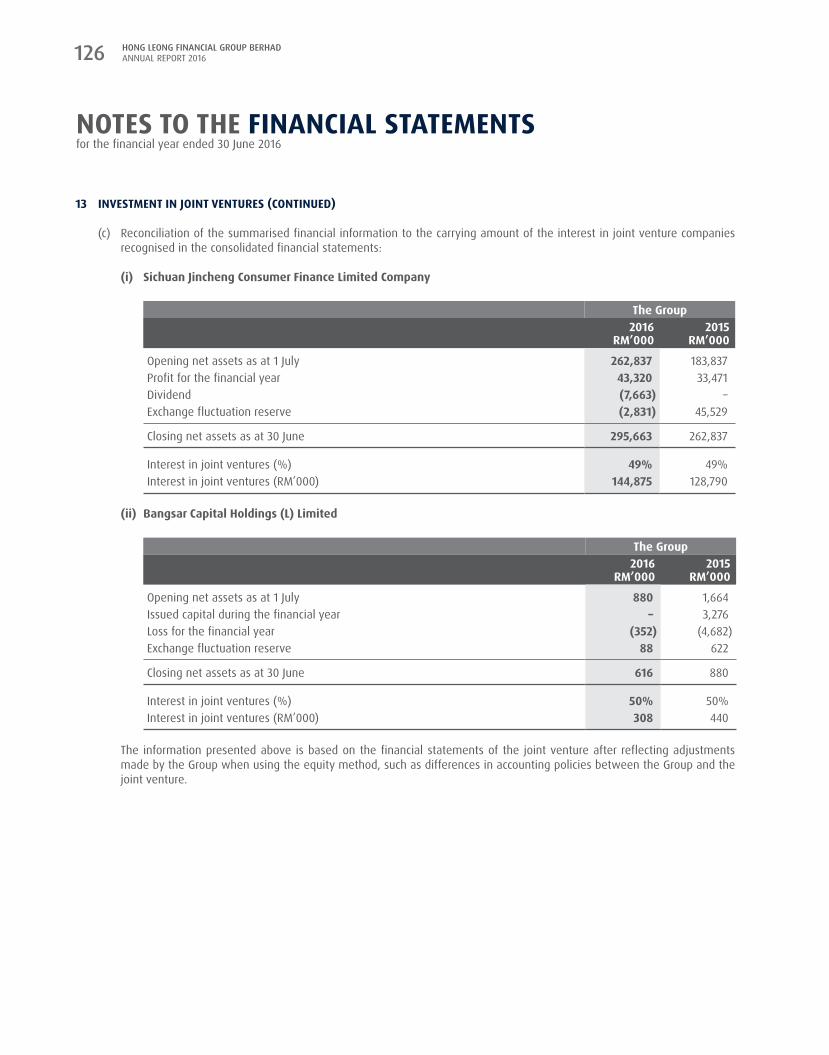
HONG LEONG FINANCIAL GROUP BERHAD ANNUAL REPORT 2016126
13 INveStMeNt IN JoINt veNtUreS (CoNtINUeD)
(c) Reconciliation of the summarised financial information to the carrying amount of the interest in joint venture companies recognised in the consolidated financial statements:
(i) Sichuan Jincheng Consumer Finance Limited Company
the Group2016 2015
rM’000 rM’000
Opening net assets as at 1 July 262,837 183,837 Profit for the financial year 43,320 33,471 Dividend (7,663) – Exchange fluctuation reserve (2,831) 45,529
Closing net assets as at 30 June 295,663 262,837
Interest in joint ventures (%) 49% 49%Interest in joint ventures (RM’000) 144,875 128,790
(ii) Bangsar Capital Holdings (L) Limited
the Group2016 2015
rM’000 rM’000
Opening net assets as at 1 July 880 1,664 Issued capital during the financial year – 3,276 Loss for the financial year (352) (4,682)Exchange fluctuation reserve 88 622
Closing net assets as at 30 June 616 880
Interest in joint ventures (%) 50% 50%Interest in joint ventures (RM’000) 308 440
The information presented above is based on the financial statements of the joint venture after reflecting adjustments made by the Group when using the equity method, such as differences in accounting policies between the Group and the joint venture.
NoteS to tHe FINaNCIaL StateMeNtSfor the financial year ended 30 June 2016

127Corporate / Financials / Additional Information
14 propertY aND eQUIpMeNt
the GroupLand and building*
office and computer
equipment
Furniture, fittings and renovation
Motor vehicles
Capital work-in- progress
property work-in- progress total
2016 Note rM’000 rM’000 rM’000 rM’000 rM’000 rM’000 rM’000
CostAs at 1 July 2015 753,955 969,908 432,748 13,076 88,813 – 2,258,500 Exchange differences 3,754 4,195 1,786 94 (1,173) – 8,656 Reclassification to intangible assets 17 – 1,172 – – (5,922) – (4,750)Additions 40,181 86,429 16,782 862 37,599 620,075 801,928 Disposals/write-off (1,445) (14,960) (11,389) (1,506) – – (29,300)
As at 30 June 2016 796,445 1,046,744 439,927 12,526 119,317 620,075 3,035,034
accumulated depreciationAs at 1 July 2015 114,940 679,830 305,866 7,909 – – 1,108,545 Exchange differences 376 2,492 557 75 – – 3,500 Reclassification to intangible assets 17 – 131 – – – – 131 Disposals/write-off (232) (14,602) (10,802) (1,484) – – (27,120)Charge during the financial year 16,628 58,179 24,342 1,627 – – 100,776
As at 30 June 2016 131,712 726,030 319,963 8,127 – – 1,185,832
Net book value as at 30 June 2016 664,733 320,714 119,964 4,399 119,317 620,075 1,849,202
* Land and building consists of the following:
Freehold Long-term leasehold Short-term leaseholdthe Group land building land building land building total 2016 rM’000 rM’000 rM’000 rM’000 rM’000 rM’000 rM’000
CostAs at 1 July 2015 159,815 317,898 33,249 238,811 3,450 732 753,955 Exchange differences – – – 3,754 – – 3,754 Additions 17,960 17,066 3,800 1,355 – – 40,181 Reclassification (11,945) 12,271 (15,361) 15,291 (1,757) 1,501 – Disposals (486) (293) (133) (533) – – (1,445)
As at 30 June 2016 165,344 346,942 21,555 258,678 1,693 2,233 796,445
accumulated depreciationAs at 1 July 2015 – 76,833 4,286 31,244 2,160 417 114,940 Exchange differences – – – 376 – – 376 Reclassification – (1,207) (1,659) 3,058 (763) 571 – Disposals – (95) (18) (119) – – (232)Charge during the financial year – 11,853 172 4,567 3 33 16,628
As at 30 June 2016 – 87,384 2,781 39,126 1,400 1,021 131,712
Net book value as at 30 June 2016 165,344 259,558 18,774 219,552 293 1,212 664,733
The addition of property work-in-progress arose from the acquisition of DC Tower Sdn Bhd as highlighted in Note 52. The Group has paid a total consideration of RM620.1 million, which comprises cash consideration of RM168.8 million, assumed borrowings of RM384.7 million (Note 23(c)(iii)) and assumed liabilities of RM66.6 million.
NoteS to tHe FINaNCIaL StateMeNtSfor the financial year ended 30 June 2016
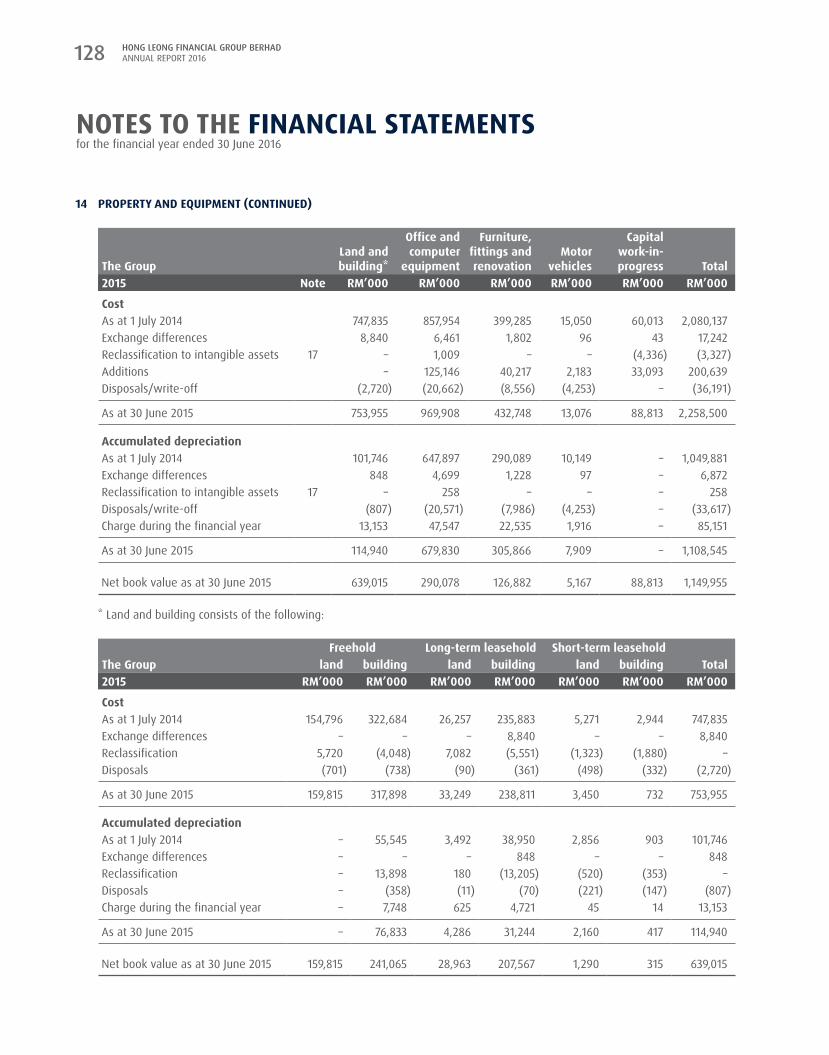
HONG LEONG FINANCIAL GROUP BERHAD ANNUAL REPORT 2016128
14 propertY aND eQUIpMeNt (CoNtINUeD)
the GroupLand andbuilding*
office andcomputer
equipment
Furniture,fittings and renovation
Motorvehicles
Capitalwork-in-progress total
2015 Note rM’000 rM’000 rM’000 rM’000 rM’000 rM’000
CostAs at 1 July 2014 747,835 857,954 399,285 15,050 60,013 2,080,137 Exchange differences 8,840 6,461 1,802 96 43 17,242 Reclassification to intangible assets 17 – 1,009 – – (4,336) (3,327)Additions – 125,146 40,217 2,183 33,093 200,639 Disposals/write-off (2,720) (20,662) (8,556) (4,253) – (36,191)
As at 30 June 2015 753,955 969,908 432,748 13,076 88,813 2,258,500
accumulated depreciationAs at 1 July 2014 101,746 647,897 290,089 10,149 – 1,049,881 Exchange differences 848 4,699 1,228 97 – 6,872 Reclassification to intangible assets 17 – 258 – – – 258 Disposals/write-off (807) (20,571) (7,986) (4,253) – (33,617)Charge during the financial year 13,153 47,547 22,535 1,916 – 85,151
As at 30 June 2015 114,940 679,830 305,866 7,909 – 1,108,545
Net book value as at 30 June 2015 639,015 290,078 126,882 5,167 88,813 1,149,955
* Land and building consists of the following:
Freehold Long-term leasehold Short-term leaseholdthe Group land building land building land building total 2015 rM’000 rM’000 rM’000 rM’000 rM’000 rM’000 rM’000
CostAs at 1 July 2014 154,796 322,684 26,257 235,883 5,271 2,944 747,835 Exchange differences – – – 8,840 – – 8,840 Reclassification 5,720 (4,048) 7,082 (5,551) (1,323) (1,880) – Disposals (701) (738) (90) (361) (498) (332) (2,720)
As at 30 June 2015 159,815 317,898 33,249 238,811 3,450 732 753,955
accumulated depreciationAs at 1 July 2014 – 55,545 3,492 38,950 2,856 903 101,746 Exchange differences – – – 848 – – 848 Reclassification – 13,898 180 (13,205) (520) (353) – Disposals – (358) (11) (70) (221) (147) (807)Charge during the financial year – 7,748 625 4,721 45 14 13,153
As at 30 June 2015 – 76,833 4,286 31,244 2,160 417 114,940
Net book value as at 30 June 2015 159,815 241,065 28,963 207,567 1,290 315 639,015
NoteS to tHe FINaNCIaL StateMeNtSfor the financial year ended 30 June 2016

129Corporate / Financials / Additional Information
14 propertY aND eQUIpMeNt (CoNtINUeD)
office and computer
equipment
Furniture, fittings and renovation
Motor vehicles total
the Company Note rM’000 rM’000 rM’000 rM’000
2016
CostAs at 1 July 2015 778 1,512 2,139 4,429 Additions 10 – – 10
As at 30 June 2016 788 1,512 2,139 4,439
accumulated depreciationAs at 1 July 2015 554 1,104 396 2,054 Charge during the financial year 103 126 427 656
As at 30 June 2016 657 1,230 823 2,710
Net book value as at 30 June 2016 131 282 1,316 1,729
2015
CostAs at 1 July 2014 726 1,497 3,453 5,676 Additions 59 15 1,068 1,142 Disposals/write-off – – (2,382) (2,382)Reclassification to intangible assets 17 (7) – – (7)
As at 30 June 2015 778 1,512 2,139 4,429
accumulated depreciationAs at 1 July 2014 484 978 2,416 3,878 Disposals/write-off – – (2,382) (2,382)Charge during the financial year 70 126 362 558
As at 30 June 2015 554 1,104 396 2,054
Net book value as at 30 June 2015 224 408 1,743 2,375
NoteS to tHe FINaNCIaL StateMeNtSfor the financial year ended 30 June 2016

HONG LEONG FINANCIAL GROUP BERHAD ANNUAL REPORT 2016130
15 INveStMeNt propertIeS
the Group2016 2015
rM’000 rM’000
Fair valueAs at 1 July 1,848 1,760 Fair value gain 92 88
As at 30 June 1,940 1,848
The analysis of investment properties is as follows:Leasehold land and building 1,940 1,848
The fair value of the properties was estimated at RM1,940,000 (2015: RM1,848,000) based on open market valuation by an independent professional valuer, Messrs Rahim & Co International Property Consultants.
The fair value of the properties is based on the highest and best use of the subject property and on the basis of Market Value as defined by the Malaysian Valuation Standards.
The fair value are within Level 2 of the fair value hierarchy.
The following amounts have been reflected in the statements of income:
the Group2016 2015
rM’000 rM’000
Rental income 91 102 Operating expenses arising from investment properties that generated the rental income 33 9
16 GooDWILL arISING oN CoNSoLIDatIoN
the Group2016 2015
rM’000 rM’000
As at 1 July/30 June 2,410,644 2,410,644
allocation of goodwill to cash-generating units
Goodwill has been allocated to the following cash-generating-units (“CGUs”):
the Group2016 2015
rM’000 rM’000
CGUCommercial banking 2,246,484 2,246,484 Investment banking and asset management 99,803 99,803 Insurance 64,357 64,357
2,410,644 2,410,644
NoteS to tHe FINaNCIaL StateMeNtSfor the financial year ended 30 June 2016
131Corporate / Financials / Additional Information
16 GooDWILL arISING oN CoNSoLIDatIoN (CoNtINUeD)
Impairment test for goodwill
The recoverable amount of CGUs is determined based on higher of fair value less costs to sell and value-in-use calculations. Fair value is the price that would be received to sell an asset or paid to transfer a liability in an orderly transaction between market participants, less costs of disposal. This estimate is mainly determined, on 30 June 2016, on the basis of available market information such as the fair value of the underlying assets and liabilities which have been marked-to-market.
(i) Commercial banking CGU and investment banking and asset management CGU
The recoverable amounts of the commercial banking CGU and investment banking and asset management CGU have been determined based on the respective value-in-use calculations. Value in use is the present value of the future cash flows expected to be derived from the CGU. This calculation uses pre-tax cash flow projection based on the budget for the financial year ending 2017, which is approved by the respective Board of Directors of Hong Leong Bank Berhad and Hong Leong Capital Berhad. There is a further projection of 3 years (2015: 3 years) based on the average historical Gross Domestic Product (“GDP”) growth of the country covering a 5 year (2015: 5 years) period, revised for current economic conditions. Cash flows beyond the 4 year period are extrapolated using an estimated growth rate of 3.60% (2015: 4.05%) representing the forecasted GDP growth rate of the country for all cash generating units. The cash flow projections are derived based on a number of key factors including past performance of these CGUs and management’s expectation of market developments.
The discount rate used in determining the recoverable amount of the commercial banking CGUs and investment banking and asset management CGUs are 10.20% (2015: 9.88%) and 10.69% (2015: 11.81%) respectively. The pre-tax discount rate reflects the specific risks relating to the CGUs.
(ii) Insurance CGU
The value-in-use of the insurance CGU is derived using the actuarial valuation for the Life insurance business. The actuarial valuation of the Life insurance fund is based on the latest position as at statements of financial position date, using the most recent available assumptions at the point of assessment. Such assumptions are derived from historical experience of the insurer and current industry trends and positions.
The value-in-use has been calculated based on the set of assumptions outlined below:
(a) The present value of future shareholders’ earnings is discounted at 9% (2015: 9%).(b) Future earnings are projected based on actuarial assumptions that are determined in accordance with generally
accepted actuarial best practice and are appropriate to the business and risk profile of the business.(c) Allowance for tax of 17% (2015: 18%) has been made on the assumptions that the application of current tax legislation
and tax rates will continue unchanged.(d) The current actuarial reserving methods and bases have been assumed to continue unaltered.(e) The current risk-based capital requirement has been assumed to continue unaltered.(f) Required risk-based capital are at the management’s capital adequacy ratio target level.(g) The cost of capital is the cost of holding the required capital at the internal capital adequacy ratio allowing for future
investment return on the capital held.
It should be recognised that the actual future results will differ from those stated above, from any future changes in the operations and economic environment and natural variation in experience. There is no warranty that the future experience will be in line with the assumptions made.
Management believes that any reasonably possible change in the key assumptions would not cause the carrying amount of the goodwill to exceed the recoverable amount of the CGUs, which could warrant any impairment to be recognised.
NoteS to tHe FINaNCIaL StateMeNtSfor the financial year ended 30 June 2016

HONG LEONG FINANCIAL GROUP BERHAD ANNUAL REPORT 2016132
17 INtaNGIBLe aSSetS
Core deposit
Customer relationship
Computer software total
the Group Note rM’000 rM’000 rM’000 rM’000
2016
Cost or valuationAs at 1 July 2015 152,434 127,426 585,516 865,376 Additions – – 25,223 25,223 Disposals/write-off – – (4,953) (4,953)Exchange fluctuation – – 1,669 1,669 Reclassification from property and equipment 14 – – 4,750 4,750
As at 30 June 2016 152,434 127,426 612,205 892,065
accumulated amortisation and impairmentAs at 1 July 2015 90,734 53,095 383,705 527,534 Amortisation during the financial year 21,776 12,743 46,114 80,633 Disposals/write-off – – (1,565) (1,565)Exchange fluctuation – – 623 623 Reclassification from property and equipment 14 – – (131) (131)
As at 30 June 2016 112,510 65,838 428,746 607,094
Net book value as at 30 June 2016 39,924 61,588 183,459 284,971
2015
Cost or valuationAs at 1 July 2014 152,434 127,426 537,620 817,480 Additions – – 49,672 49,672 Disposals/write-off – – (8,684) (8,684)Exchange fluctuation – – 3,581 3,581 Reclassification from property and equipment 14 – – 3,327 3,327
As at 30 June 2015 152,434 127,426 585,516 865,376
accumulated amortisation and impairmentAs at 1 July 2014 68,958 40,352 347,249 456,559 Amortisation during the financial year 21,776 12,743 40,746 75,265 Disposals/write-off – – (5,809) (5,809)Exchange fluctuation – – 1,777 1,777 Reclassification from property and equipment 14 – – (258) (258)
As at 30 June 2015 90,734 53,095 383,705 527,534
Net book value as at 30 June 2015 61,700 74,331 201,811 337,842
NoteS to tHe FINaNCIaL StateMeNtSfor the financial year ended 30 June 2016
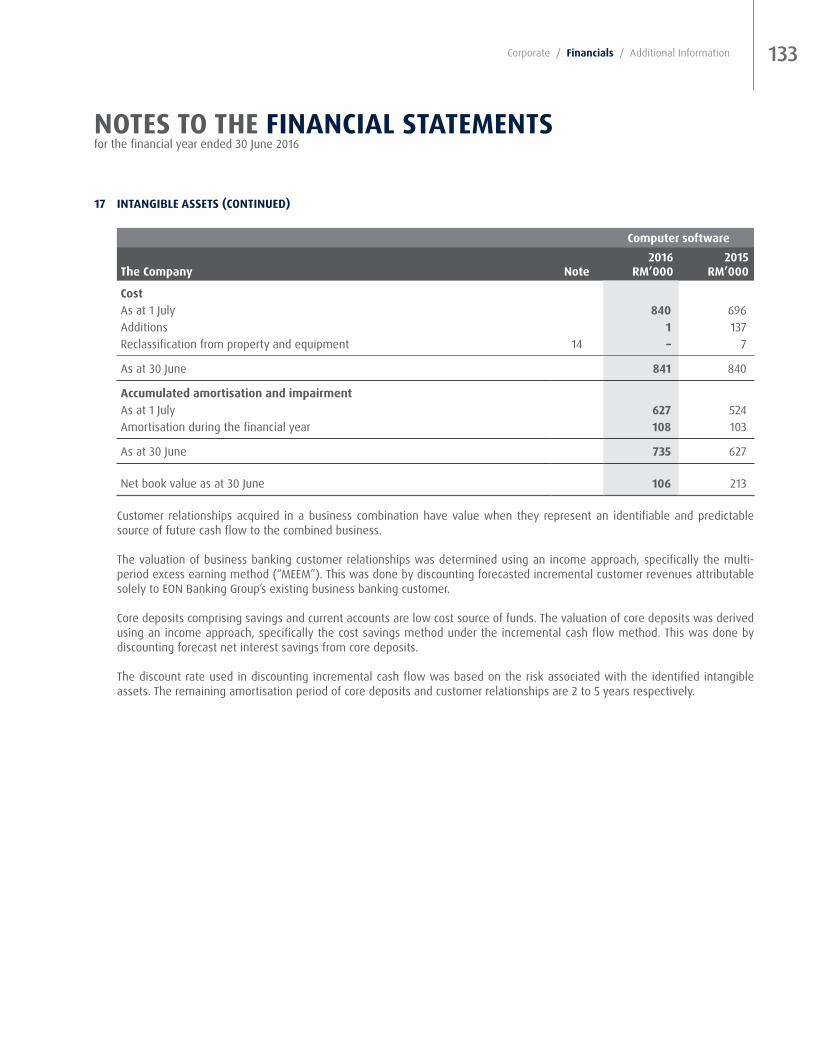
133Corporate / Financials / Additional Information
17 INtaNGIBLe aSSetS (CoNtINUeD)
Computer software2016 2015
the Company Note rM’000 rM’000
CostAs at 1 July 840 696 Additions 1 137 Reclassification from property and equipment 14 – 7
As at 30 June 841 840
accumulated amortisation and impairmentAs at 1 July 627 524 Amortisation during the financial year 108 103
As at 30 June 735 627
Net book value as at 30 June 106 213
Customer relationships acquired in a business combination have value when they represent an identifiable and predictable source of future cash flow to the combined business.
The valuation of business banking customer relationships was determined using an income approach, specifically the multi-period excess earning method (“MEEM”). This was done by discounting forecasted incremental customer revenues attributable solely to EON Banking Group’s existing business banking customer.
Core deposits comprising savings and current accounts are low cost source of funds. The valuation of core deposits was derived using an income approach, specifically the cost savings method under the incremental cash flow method. This was done by discounting forecast net interest savings from core deposits.
The discount rate used in discounting incremental cash flow was based on the risk associated with the identified intangible assets. The remaining amortisation period of core deposits and customer relationships are 2 to 5 years respectively.
NoteS to tHe FINaNCIaL StateMeNtSfor the financial year ended 30 June 2016

HONG LEONG FINANCIAL GROUP BERHAD ANNUAL REPORT 2016134
18 DepoSItS FroM CUStoMerS
the Group2016 2015
rM’000 rM’000 at amortised costFixed deposits 85,737,639 78,620,058 Negotiable instruments of deposits 7,816,740 11,257,419 Short-term placements 16,429,616 13,031,197
109,983,995 102,908,674 Demand deposits 20,559,745 20,030,167 Savings deposits 16,581,412 15,823,857 Others 943,462 640,821
Gross deposits from customers 148,068,614 139,403,519
at fair value through profit or lossCallable range accrual notes, at cost 1,442,912 1,621,641 Fair value changes arising from designation at fair value through profit or loss* (20,993) (69,695)
1,421,919 1,551,946
Total net deposits from customers 149,490,533 140,955,465
* The banking subsidiary has issued structured deposits (Callable Range Accrual Notes) and designated them at fair value through profit or loss. This designation is permitted under MFRS 139 “Financial Instruments: Recognition and Measurement” as it significantly reduces accounting mismatch. These instruments are managed by the Group on the basis of its fair value and includes terms that have substantive derivative characteristic.
The fair value changes of the structured deposits that are attributable to the changes in own credit risk are not significant.
The carrying amount of the structured deposits of the Group is RM12,771,000 (2015: RM60,254,000), which is lower than the contractual amount at maturity.
(a) The maturity structure of fixed deposits, negotiable instruments of deposits and short-term placements are as follows:
the Group2016 2015
rM’000 rM’000 Due within: - six months 90,130,671 79,310,112 - six months to one year 16,791,342 21,105,271 - one year to five years 3,044,069 2,493,291 - more than five years 17,913 –
109,983,995 102,908,674
(b) The deposits are sourced from the following customers:
the Group2016 2015
rM’000 rM’000 Government and statutory bodies 2,891,538 3,573,261 Business enterprises 62,776,728 65,130,000 Individuals 81,366,305 70,176,437 Others 2,455,962 2,075,767
149,490,533 140,955,465
NoteS to tHe FINaNCIaL StateMeNtSfor the financial year ended 30 June 2016

135Corporate / Financials / Additional Information
19 DepoSItS aND pLaCeMeNtS oF BaNKS aND otHer FINaNCIaL INStItUtIoNS
the Group2016 2015
rM’000 rM’000
Licensed banks and investment banks 6,842,865 7,007,161 Licensed Islamic bank – 49,004 Other financial institutions 1,263,135 1,887,457
8,106,000 8,943,622
20 DerIvatIve FINaNCIaL INStrUMeNtS
the Group the Company2016 2015 2016 2015
Note rM’000 rM’000 rM’000 rM’000
Derivatives at fair value through profit or loss- Interest rate swaps 307,063 229,592 80 126 - Cross currency swaps 415,859 331,513 – – - Foreign currency forwards 287,846 834,803 – – - Foreign currency options 23,091 60,914 – – - Foreign currency swaps 18,347 – – – - Futures 11 667 – – - Equity options 9,266 10,049 – – - Commodity swap 875 306 – –
Derivatives designated as cash flow hedge- Interest rate swaps (a) – 240 – –
Total derivative financial instruments assets 1,062,358 1,468,084 80 126
Derivatives at fair value through profit or loss- Interest rate swaps (435,849) (327,186) (1,455) (1,158)- Cross currency swaps (579,482) (460,329) – – - Foreign currency forwards (528,156) (482,679) – – - Foreign currency options (1 7,676) (58,420) – – - Foreign currency swaps (30,597) – – – - Futures (3,142) (6,952) – – - Equity options (7,995) (3,224) – – - Swaption (48,215) (30,268) – – - Commodity swap (852) (283) – –
Derivatives designated as cash flow hedge- Interest rate swaps (a) (2,261) (24) – –
Total derivative financial instruments liabilities (1,654,225) (1,369,365) (1,455) (1,158)
NoteS to tHe FINaNCIaL StateMeNtSfor the financial year ended 30 June 2016
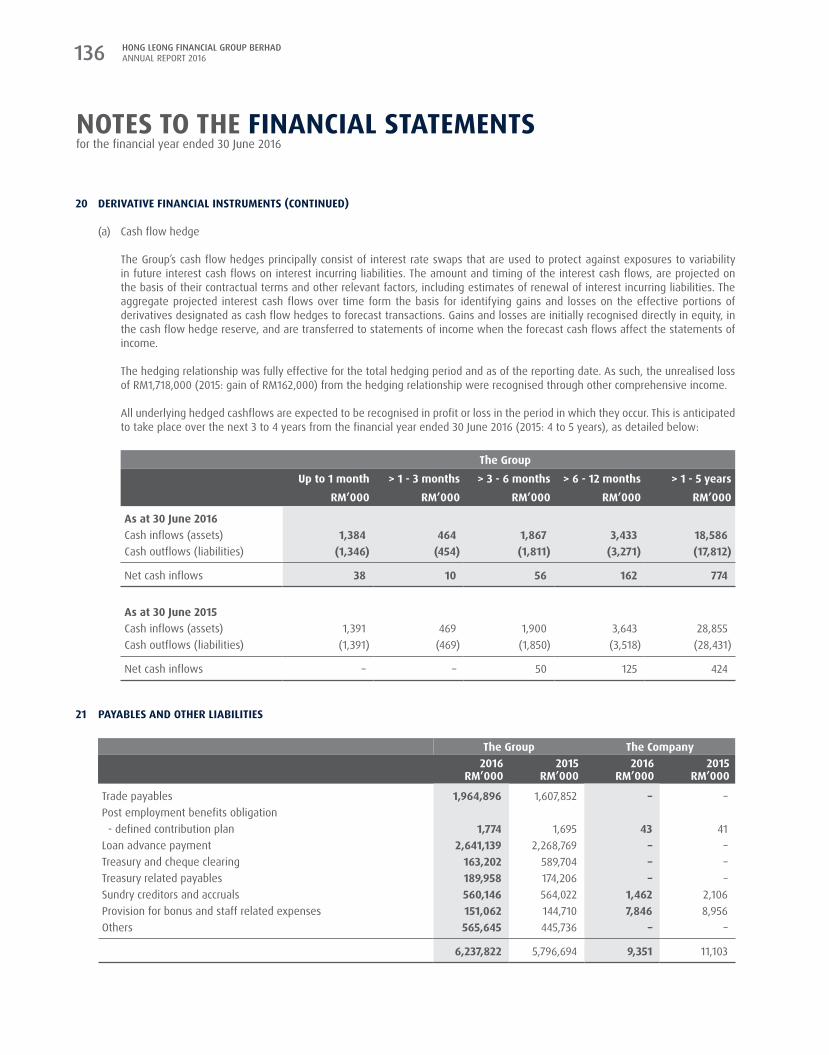
HONG LEONG FINANCIAL GROUP BERHAD ANNUAL REPORT 2016136
20 DerIvatIve FINaNCIaL INStrUMeNtS (CoNtINUeD)
(a) Cash flow hedge
The Group’s cash flow hedges principally consist of interest rate swaps that are used to protect against exposures to variability in future interest cash flows on interest incurring liabilities. The amount and timing of the interest cash flows, are projected on the basis of their contractual terms and other relevant factors, including estimates of renewal of interest incurring liabilities. The aggregate projected interest cash flows over time form the basis for identifying gains and losses on the effective portions of derivatives designated as cash flow hedges to forecast transactions. Gains and losses are initially recognised directly in equity, in the cash flow hedge reserve, and are transferred to statements of income when the forecast cash flows affect the statements of income.
The hedging relationship was fully effective for the total hedging period and as of the reporting date. As such, the unrealised loss of RM1,718,000 (2015: gain of RM162,000) from the hedging relationship were recognised through other comprehensive income.
All underlying hedged cashflows are expected to be recognised in profit or loss in the period in which they occur. This is anticipated to take place over the next 3 to 4 years from the financial year ended 30 June 2016 (2015: 4 to 5 years), as detailed below:
the Group
Up to 1 month > 1 - 3 months > 3 - 6 months > 6 - 12 months > 1 - 5 years
rM’000 rM’000 rM’000 rM’000 rM’000
as at 30 June 2016Cash inflows (assets) 1,384 464 1,867 3,433 18,586 Cash outflows (liabilities) (1,346) (454) (1,811) (3,271) (17,812)
Net cash inflows 38 10 56 162 774
as at 30 June 2015Cash inflows (assets) 1,391 469 1,900 3,643 28,855 Cash outflows (liabilities) (1,391) (469) (1,850) (3,518) (28,431)
Net cash inflows – – 50 125 424
21 paYaBLeS aND otHer LIaBILItIeS
the Group the Company2016 2015 2016 2015
rM’000 rM’000 rM’000 rM’000
Trade payables 1,964,896 1,607,852 – – Post employment benefits obligation - defined contribution plan 1,774 1,695 43 41 Loan advance payment 2,641,139 2,268,769 – – Treasury and cheque clearing 163,202 589,704 – – Treasury related payables 189,958 174,206 – – Sundry creditors and accruals 560,146 564,022 1,462 2,106 Provision for bonus and staff related expenses 151,062 144,710 7,846 8,956 Others 565,645 445,736 – –
6,237,822 5,796,694 9,351 11,103
NoteS to tHe FINaNCIaL StateMeNtSfor the financial year ended 30 June 2016

137Corporate / Financials / Additional Information
22 DeFerreD taXatIoN
Deferred tax assets and liabilities are offset when there is a legally enforceable right to set-off current tax assets against current tax liabilities and when the deferred taxes relate to the same tax authority. The following amounts, determined after appropriate offsetting, are shown in the statements of financial position:
the Group the Company2016 2015 2016 2015
rM’000 rM’000 rM’000 rM’000
Deferred tax assets/(liabilities) - to be recovered within 12 months 136,489 151,876 330 2,506 - to be recovered more than 12 months (338,726) (323,721) – (336)
(202,237) (171,845) 330 2,170
The analysis of deferred tax assets and deferred tax liabilities is as follows:
the Group the Company2016 2015 2016 2015
rM’000 rM’000 rM’000 rM’000
Deferred tax assets - Cash flow hedge reserve 543 – – – - Unabsorbed tax losses 89,692 83,554 – – - Senior bonds 69,732 108,938 – – - Provision for expenses 65,386 27,694 – 2,336 - Other temporary differences 10,645 1,731 330 252
235,998 221,917 330 2,588
Deferred tax liabilities - Property and equipment (108,957) (88,143) – (418) - Cash flow hedge reserve – (54) – – - Financial investments available-for-sale (147,978) (121,166) – – - Intangible assets (24,363) (34,008) – – - Unallocated surplus (156,937) (150,391) – –
(438,235) (393,762) – (418)
Deferred tax (liabilities)/assets net (202,237) (171,845) 330 2,170
NoteS to tHe FINaNCIaL StateMeNtSfor the financial year ended 30 June 2016

HONG LEONG FINANCIAL GROUP BERHAD ANNUAL REPORT 2016138
22 DeFerreD taXatIoN (CoNtINUeD)
The movements in deferred tax assets and liabilities during the financial year comprise the following:
property and
equipment
Financial investments
available-for-sale
Cash flowhedge
reserveIntangible
assetsUnutilisedtax credit
Seniorbonds
provision for
expensesUnallocated
surplus
othertemporary
differences totalthe Group Note rM’000 rM’000 rM’000 rM’000 rM’000 rM’000 rM’000 rM’000 rM’000 rM’000
2016As at 1 July (88,143) (121,166) (54) (34,008) 83,554 108,938 27,694 (150,391) 1,731 (171,845)Credited/
(charged) to statements of income 38 (20,814) (572) – 9,645 6,138 (39,206) 37,692 (6,546) 5,038 (8,625)
Charged to Life fund – (4,029) – – – – – – 3,876 (153)
(Charged)/credited to equity – (22,211) 597 – – – – – – (21,614)
As at 30 June (108,957) (147,978) 543 (24,363) 89,692 69,732 65,386 (156,937) 10,645 (202,237)
2015As at 1 July (103,739) (113,346) – (42,638) 89,182 22,688 82,881 (123,157) (21,888) (210,017)Credited/
(charged) to statements of income 38 15,956 (145) – 8,630 (5,628) 86,250 (55,187) (27,234) 7,963 30,605
Credited to Life fund – (9,264) – – – – – – 14,425 5,161
(Charged)/credited to equity (360) 1,589 (54) – – – – – 1,231 2,406
As at 30 June (88,143) (121,166) (54) (34,008) 83,554 108,938 27,694 (150,391) 1,731 (171,845)
NoteS to tHe FINaNCIaL StateMeNtSfor the financial year ended 30 June 2016

139Corporate / Financials / Additional Information
22 DeFerreD taXatIoN (CoNtINUeD)
The movements in deferred tax assets and liabilities during the financial year comprise the following: (continued)
property andequipment
provision for expenses
other temporary
differences totalthe Company Note rM’000 rM’000 rM’000 rM’000
2016As at 1 July (418) 2,336 252 2,170 Credited/(charged) to statements of income 38 418 (2,336) 78 (1,840)
As at 30 June – – 330 330
2015As at 1 July – 3,434 116 3,550 Credited/(charged) to statements of income 38 (418) (1,098) 136 (1,380)
As at 30 June (418) 2,336 252 2,170
23 BorroWINGS
the Group the Company
2016 2015 2016 2015 Note rM’000 rM’000 rM’000 rM’000
Revolving credit (a) 305,450 – 305,450 – Commercial papers (b) 349,347 374,236 349,347 374,236 Medium term notes (b) 756,286 351,194 806,457 401,358 Term loans/bridging loan (c) 565,193 85,072 180,463 85,072 Senior bonds (d) 1,215,643 2,286,380 – –
3,191,919 3,096,882 1,641,717 860,666
(a) The revolving credit facilities carried interest rates ranging from 3.64% to 3.92% (2015: ranging from 3.58% to 3.77%) per annum.
The revolving credit facilities are unsecured and repayable within 12 months.
(b) On 14 October 2011, the Company entered into RM1.8 billion CP/MTNs Programme comprising a seven (7) years Commercial Papers (CP) programmes and a twenty (20) years Medium Term Notes (MTNs) programmes which were constituted by a Trust Deed between the Company and Malaysian Trustees Berhad as trustee. The CPs are issued at a discount and the issue price is calculated in accordance with the Rules on Fully Automated System for Issuing/Tendering (“FAST”) issued by Bank Negara Malaysia at the tenure of one (1), two (2), three (3), six (6), nine (9) or twelve (12) months as the Company may select. The CPs carry interest rate ranging from 3.58% to 3.86% (2015: 3.58% to 3.82%).
The MTNs are issued at par and the issue price is calculated in accordance with the FAST Rules, at the tenure which shall be more than one (1) year as the Company may select. The MTNs carry interest rates ranging from 4.30% to 4.80% (2015: 4.05% to 4.50%) per annum.
The CP/MTNs are unsecured and the Company is required to maintain a debt to equity ratio for these facilities.
NoteS to tHe FINaNCIaL StateMeNtSfor the financial year ended 30 June 2016
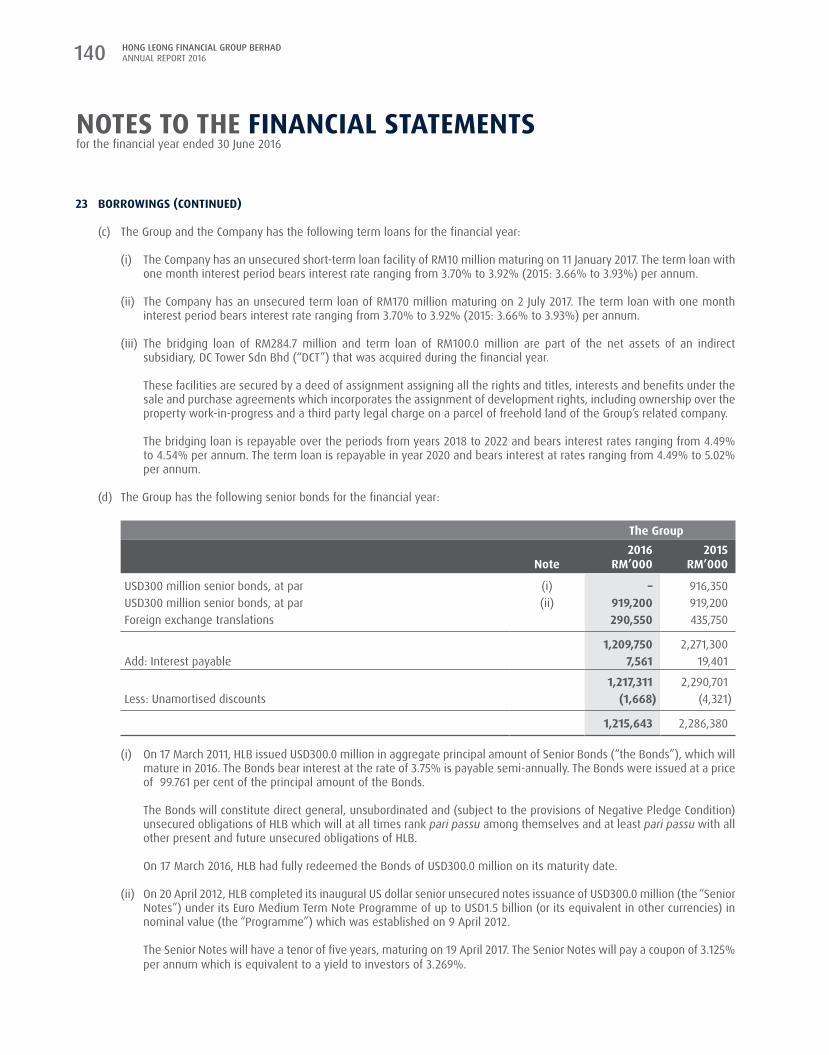
HONG LEONG FINANCIAL GROUP BERHAD ANNUAL REPORT 2016140
23 BorroWINGS (CoNtINUeD)
(c) The Group and the Company has the following term loans for the financial year:
(i) The Company has an unsecured short-term loan facility of RM10 million maturing on 11 January 2017. The term loan with one month interest period bears interest rate ranging from 3.70% to 3.92% (2015: 3.66% to 3.93%) per annum.
(ii) The Company has an unsecured term loan of RM170 million maturing on 2 July 2017. The term loan with one month interest period bears interest rate ranging from 3.70% to 3.92% (2015: 3.66% to 3.93%) per annum.
(iii) The bridging loan of RM284.7 million and term loan of RM100.0 million are part of the net assets of an indirect subsidiary, DC Tower Sdn Bhd (“DCT”) that was acquired during the financial year.
These facilities are secured by a deed of assignment assigning all the rights and titles, interests and benefits under the sale and purchase agreements which incorporates the assignment of development rights, including ownership over the property work-in-progress and a third party legal charge on a parcel of freehold land of the Group’s related company.
The bridging loan is repayable over the periods from years 2018 to 2022 and bears interest rates ranging from 4.49% to 4.54% per annum. The term loan is repayable in year 2020 and bears interest at rates ranging from 4.49% to 5.02% per annum.
(d) The Group has the following senior bonds for the financial year:
the Group2016 2015
Note rM’000 rM’000
USD300 million senior bonds, at par (i) – 916,350 USD300 million senior bonds, at par (ii) 919,200 919,200 Foreign exchange translations 290,550 435,750
1,209,750 2,271,300 Add: Interest payable 7,561 19,401
1,217,311 2,290,701 Less: Unamortised discounts (1,668) (4,321)
1,215,643 2,286,380
(i) On 17 March 2011, HLB issued USD300.0 million in aggregate principal amount of Senior Bonds (“the Bonds”), which will mature in 2016. The Bonds bear interest at the rate of 3.75% is payable semi-annually. The Bonds were issued at a price of 99.761 per cent of the principal amount of the Bonds.
The Bonds will constitute direct general, unsubordinated and (subject to the provisions of Negative Pledge Condition) unsecured obligations of HLB which will at all times rank pari passu among themselves and at least pari passu with all other present and future unsecured obligations of HLB.
On 17 March 2016, HLB had fully redeemed the Bonds of USD300.0 million on its maturity date.
(ii) On 20 April 2012, HLB completed its inaugural US dollar senior unsecured notes issuance of USD300.0 million (the “Senior Notes”) under its Euro Medium Term Note Programme of up to USD1.5 billion (or its equivalent in other currencies) in nominal value (the “Programme”) which was established on 9 April 2012.
The Senior Notes will have a tenor of five years, maturing on 19 April 2017. The Senior Notes will pay a coupon of 3.125% per annum which is equivalent to a yield to investors of 3.269%.
NoteS to tHe FINaNCIaL StateMeNtSfor the financial year ended 30 June 2016

141Corporate / Financials / Additional Information
24 SUBorDINateD oBLIGatIoNS
the Group2016 2015
Note rM’000 rM’000
RM700 million Tier 2 subordinated debt, at par (a) – 685,000 Add: Interest payable – 12,673
– 697,673 Less: Unamortised discounts – (2)
– 697,671
RM1.0 billion Tier 2 subordinated debt, at par (b) – 1,000,000 Add: Interest payable – 6,793
– 1,006,793 Less: Unamortised discounts – (124)
– 1,006,669
Subordinated medium term notes, at par (c) – 500,000 Add: Interest payable – 65
– 500,065 Less: Unamortised discounts – (350)Fair value adjustments on completion of business combination accounting – (147)
– 499,568
RM1.5 billion Tier 2 subordinated debt, at par (d) 1,500,000 1,500,000 Add: Interest payable 1,480 1,664
1,501,480 1,501,664 Less: Unamortised discounts (589) (1,027)
1,500,891 1,500,637
RM500 million Tier 2 subordinated debt, at par (e) 500,000 500,000 Add: Interest payable 8,692 6,895
508,692 506,895 Less: Unamortised discounts (1,620) (204)
507,072 506,691
RM400 million Tier 2 subordinated Sukuk Ijarah, at par (f) 400,000 400,000 Add: Profit payable 736 736
400,736 400,736 Less: Unamortised discounts (254) (431)
400,482 400,305
RM500 million Tier 2 subordinated notes, at par (g) 500,000 500,000 Add: Interest payable 526 526
500,526 500,526 Less: Unamortised discounts (577) (1,006)
499,949 499,520
RM50 million Tier 2 subordinated notes, at par (h) 50,000 50,000 Add: Interest payable 407 407
50,407 50,407 Less: Unamortised discounts (160) (213)
50,247 50,194
2,958,641 5,161,255
NoteS to tHe FINaNCIaL StateMeNtSfor the financial year ended 30 June 2016

HONG LEONG FINANCIAL GROUP BERHAD ANNUAL REPORT 2016142
24 SUBorDINateD oBLIGatIoNS (CoNtINUeD)
(a) On 10 August 2010, HLB had completed the first issuance of RM700.0 million nominal value of Tier 2 Subordinated Debt (“Sub Debt”) out of its RM1.7 billion Tier 2 Subordinated Notes Programme. The RM700.0 million Sub Debt will mature in 2020 and is callable at the end of year 5 and on each subsequent coupon payment dates thereafter subject to approval of BNM. The Sub Debt which bears interest of 4.85% per annum is payable semi-annually in arrears.
The Sub Debt constitute unsecured liabilities of HLB, and is subordinated in right of payment to the deposit liabilities and all other liabilities of HLB in accordance with the terms and conditions of the issue and qualify as Tier 2 capital for the purpose of determining the capital adequacy ratio of HLB.
On 10 August 2015, HLB had fully redeemed the RM700.0 million nominal value of the Tier 2 Subordinated Debt.
(b) On 5 May 2011, HLB issued the remaining RM1.0 billion nominal value of Sub Debt which will mature in 2021 and is callable at the end of year 5 and on each subsequent coupon payment dates thereafter subject to approval of BNM. The second issuance of Sub Debt bears interest at the rate of 4.35% per annum and is payable semi-annually in arrears.
The Sub Debt constitute unsecured liabilities of HLB, and is subordinated in right of payment to the deposit liabilities and all other liabilities of HLB in accordance with the terms and conditions of the issue and qualify as Tier 2 capital for the purpose of determining the capital adequacy ratio of HLB. On 5 May 2016, HLB had fully redeemed the RM1.0 billion nominal value of the Subordinated Debt.
(c) On 27 February 2009, Promino Sdn Bhd (“Promino”), a wholly owned subsidiary of HLB, has successfully issued the first tranche of RM410.0 million nominal value of the 10 non-callable 5 years Subordinated Medium Term Notes (“MTN”) callable on 27 February 2014 (and thereafter) and due on 27 February 2019 under the RM2.0 billion Subordinated MTN Programme. The coupon rate of the Subordinated MTN is 5.75% per annum, which is payable semi-annually in arrears from the date of the issue. Should Promino decide not to exercise its call option on the fifth (5) year from the issue date, the coupon rate will be revised to be equivalent to 7.75% or the then prevailing 5 years RM swap rate plus 3.70% per annum, whichever is higher, from the beginning of the sixth (6) year to the final maturity date.
Subsequently, on 2 December 2009, Promino issued a second tranche of RM250.0 million nominal value of the 10 non-callable 5 years Subordinated MTN callable on 2 December 2014 (and thereafter) and due on 2 December 2019 under the RM2.0 billion Subordinated MTN Programme. The coupon rate of this second tranche of the Subordinated MTN is 5.75% per annum, which is payable semi-annually in arrears from the date of the issue. Should Promino decide not to exercise its call option on the fifth (5) year from the issue date, the coupon rate of this second tranche will be revised to be equivalent to 7.75% or the then prevailing 5 years RM swap rate plus 3.70% per annum, whichever is higher, from the beginning of the sixth (6) year to the final maturity date; similar to the step-up rates in the first tranche.
Subsequently, on 30 December 2010, Promino issued a third tranche of RM500.0 million nominal value of the 10 non-callable 5 years Subordinated MTN callable on 30 December 2015 (and at each anniversary date thereafter) and due on 30 December 2020 under the RM2.0 billion Subordinated MTN Programme. The coupon rate of this third tranche of the Subordinated MTN is 4.75% per annum, which is payable semi-annually in arrears from the date of the issue. Should Promino decide not to exercise its call option on the fifth (5) year from the issue date, or at each anniversary date thereafter, the coupon rate of this third tranche will be remain at 4.75% per annum, from the beginning of the sixth (6) year to the final maturity date.
NoteS to tHe FINaNCIaL StateMeNtSfor the financial year ended 30 June 2016

143Corporate / Financials / Additional Information
24 SUBorDINateD oBLIGatIoNS (CoNtINUeD)
(c) On 1 July 2011, the above Subordinated MTN was vested to HLB. The above tranches of Subordinated MTNs constitute unsecured liabilities of HLB and are subordinated to all deposit liabilities and all other liabilities except those liabilities, which by their terms, rank equally in rights of payment with the Subordinated MTNs. The Subordinated MTNs qualify as Tier 2 capital for the purpose of determining the capital adequacy ratio of HLB.
On 27 February 2014, HLB had fully redeemed the first tranche of RM410.0 million nominal value of the 10 non-callable 5 years subordinated MTNs bearing coupon rate of 5.75% per annum.
On 2 December 2014, HLB had fully redeemed the second tranche of RM250.0 million nominal value of the 10 non-callable 5 years subordinated MTNs bearing coupon rate of 5.75% per annum.
On 30 December 2015, HLB had fully redeemed the third tranche of RM500.0 million nominal value of the 10 non-callable 5 years subordinated MTNs bearing coupon rate of 4.75% per annum.
(d) On 22 June 2012, HLB had completed the issuance of RM1.5 billion nominal value of Tier 2 Subordinated Notes (“Sub Notes”). The RM1.5 billion Sub Notes will mature in 2024 and are callable on any interest payment date falling on or after the 7th anniversary of the issue date subject to approval of BNM. The Sub Notes which bears interest of 4.50% per annum is payable semi-annually in arrears.
The Sub Notes constitute unsecured liabilities of HLB, and is subordinated in right of payment to the deposit liabilities and all other liabilities of HLB in accordance with the terms and conditions of the issue and qualify as Tier 2 capital for the purpose of determining the capital adequacy ratio of HLB.
(e) On 19 September 2012, HLA created and issued up to RM500.0 million in nominal value of Subordinated Notes (“Sub-Notes”) under a proposed Subordinated Notes Programme to raise funds for general working capital and/or business operations purpose.
On 20 March 2014, the Securities Commission approved the application subject to certain operational terms and conditions being fulfilled.
On 7 February 2014, the HLA completed its RM500.0 million Sub-Notes issuance. The Sub-Notes were issued for a period of 12 years on a 12 non-callable 7 basis with a coupon rate of 4.5% per annum.
The Sub-Notes are unsecured liabilities and classified as Tier 2 capital under Risk-Based Capital Framework for Insurers.
(f) On 17 June 2014, Hong Leong Islamic Bank Berhad (“HLISB”), a wholly owned subsidiary of HLB, had completed the first issuance of RM400.0 million nominal value of Tier 2 Subordinated Sukuk Ijarah (“Subordinated Sukuk Ijarah”) out of its RM1.0 billion Tier 2 Subordinated Sukuk Ijarah Programme. The RM400.0 million Subordinated Sukuk Ijarah will mature in 2024 and is callable at end of year 5 and on each subsequent coupon payment dates thereafter subject to approval of BNM. The Subordinated Sukuk Ijarah which bears profit rate of 4.80% per annum is payable semi-annually in arrears.
The Subordinated Sukuk Ijarah constitute direct, unconditional, subordinated and unsecured obligations of HLISB and subordinated in right and priority of payment, to the extend and in the manner provided in the Subordinated Sukuk Ijarah, ranking pari passu among themselves. The Subordinated Sukuk Ijarah is subordinated in right of payment to all deposit liabilities and other liabilities of HLISB, except to those liabilities, which by their terms, rank equally in right of payment with or are subordinated to the Subordinated Sukuk Ijarah. The Subordinated Sukuk Ijarah qualifies as Tier 2 capital for the purpose of determining the capital adequacy ratio of HLISB.
NoteS to tHe FINaNCIaL StateMeNtSfor the financial year ended 30 June 2016

HONG LEONG FINANCIAL GROUP BERHAD ANNUAL REPORT 2016144
24 SUBorDINateD oBLIGatIoNS (CoNtINUeD)
(g) On 23 June 2014, HLB had completed the first issuance of RM500.0 million nominal value of Tier 2 Subordinated Notes (“Sub-Notes”) out of its RM10.0 billion Multi-Currency Sub-Notes Programme. The RM500.0 million Sub-Notes will mature in 2024 and is callable on any coupon payment date falling on or after the 5th anniversary of the issue date. The Sub-Notes which bears interest rate of 4.80% per annum is payable semi-annually in arrears. The exercise of the call option on the Sub-Notes shall be subject to the approval of BNM.
The Sub-Notes constitute unsecured liabilities of the Group, and is subordinated in right of payment to the deposit liabilities and all other liabilities of the Group in accordance with the terms and conditions of the issue, except to those liabilities, which by their terms, rank equally in right of payment with or are subordinated to the Sub-Notes. The Sub-Notes may be written off, either fully or partially, at the discretion of BNM at the point of non-viability as determined by BNM or Perbadanan Insurans Deposit Malaysia. The Sub-Notes qualify as Tier 2 capital for the purpose of determining the capital adequacy ratio of the Group.
(h) On 6 November 2014, Hong Leong Investment Bank Berhad (“HLIB”), a wholly owned subsidiary of Hong Leong Capital Berhad and also an indirect subsidiary of HLFG, had completed the first issuance of RM50 million nominal value of Tier 2 Subordinated Notes (“Sub-Notes”) out of its RM1.0 billion Multi-Currency Sub-Notes Programme. The RM50.0 million Sub-Notes will mature in 2024 and is callable on any coupon payment date falling on or after the 5th anniversary of the issue date. The Sub-Notes which bears interest rate of 5.30% per annum is payable semi-annually in arrears. The exercise of the call option on the Sub-Notes shall be subject to the approval of BNM.
The Sub-Notes constitute unsecured liabilities of HLIB, and is subordinated in right of payment to the deposit liabilities and all other liabilities of HLIB in accordance with the terms and conditions of the issue, except to those liabilities, which by their terms, rank equally in right of payment with or are subordinated to the Sub-Notes. The Sub-Notes qualify as Tier 2 capital for the purpose of determining the capital adequacy ratio of HLIB.
25 NoN-INNovatIve tIer 1 StapLeD SeCUrItIeS
the Group2016 2015
rM’000 rM’000
RM1.4 billion Non-Innovative Tier 1 stapled securities, at par – 1,400,000 Add: Interest payable – 11,040
– 1,411,040 Less: Unamortised discounts – (171)
– 1,410,869
On 5 May 2011, HLB had completed its issuance of Non-Innovative Tier 1 Stapled Securities (“NIT-1 Stapled Securities”) of RM1.4 billion. The NIT-1 Stapled Securities which is perpetual in nature and callable at the end of year 5 and on each coupon payment date, pays a semi annual coupon of 5.05% per annum. The call option shall be subject to the approval of BNM.
The NIT-1 Stapled Securities constitute unsecured liabilities of HLB, and is subordinated in right of payment to the deposit liabilities and all other liabilities of HLB in accordance with the terms and conditions of the issue and qualify as Tier 1 capital for the purpose of determining the capital adequacy ratio of HLB.
On 5 May 2016, HLB had fully redeemed the RM1.4 billion Non-Innovative Tier 1 Stapled Securities.
NoteS to tHe FINaNCIaL StateMeNtSfor the financial year ended 30 June 2016

145Corporate / Financials / Additional Information
26 INNovatIve tIer 1 CapItaL SeCUrItIeS
the Group2016 2015
rM’000 rM’000
RM500 million Innovative Tier 1 capital securities, at par 500,000 500,000 Add: Interest payable 12,771 12,771
512,771 512,771 Less: Unamortised discounts (5,858) (7,367)Fair value adjustments on completion of business combination accounting 14,599 24,819
521,512 530,223
On 10 September 2009, Promino, an indirect subsidiary of the Company issued the first tranche of Innovative Tier 1 Capital Securities (“IT-1 Capital Securities”) amounting to RM500.0 million in nominal value, from its RM1.0 billion IT-1 Capital Securities Programme. The IT-1 Capital Securities is structured in accordance with the Risk-Weighted Capital Adequacy Framework (General Requirements and Capital Components) issued by BNM.
The RM500.0 million IT-1 Capital Securities has a tenor of 30 years and Promino has the option to redeem the RM500.0 million IT-1 Capital Securities at the 10th anniversary, subject to BNM approval. The RM500.0 million IT-1 Capital Securities has a coupon rate of 8.25% per annum, payable semi-annually. In the event the IT-1 Capital Securities is not redeemed at the 10th anniversary (the First Optional Redemption Date), the coupon rate will be revised to 9.25% per annum from the 11th year to the final maturity.
On 1 July 2011, the above IT-Capital Securities was vested to HLB. The IT-1 Capital Securities constitute unsecured and subordinated obligations of HLB and are subordinated to all deposit liabilities and all other liabilities except those liabilities which rank equally in, and/or junior to, the rights of payment of the IT-1 Capital Securities. The IT-1 Capital Securities qualify as Tier 1 capital for the purpose of computing the capital adequacy ratio of HLB.
27 INSUraNCe FUNDS
the Group2016 2015
rM’000 rM’000
Unearned premium reserves 41,282 25,205 Life policyholders’ fund 8,940,776 8,012,613 Fair value reserves - financial investments available-for-sale 251,637 208,122 Life investment-linked unitholders’ fund 1,394,985 1,211,317
10,628,680 9,457,257
The main insurance risks that the Group is exposed to are the following:
• Mortality risk – risk of loss arising due to policyholder’s death experience being different than expected.• Morbidity risk – risk of loss arising due to policyholder’s health experience being different than expected.• Longevity risk – risk of loss arising due to the annuitants living longer than expected.• Investment return/interest rate risk – risk of loss arising from actual returns being different than expected.• Expense risk – risk of loss arising from expense experience being different than expected.• Lapse risk – risk of loss arising due to policyholder surrender experience being different than expected.
The risks vary in relation to the location of the risk insured by the Group, type of risk insured or by industry.
NoteS to tHe FINaNCIaL StateMeNtSfor the financial year ended 30 June 2016

HONG LEONG FINANCIAL GROUP BERHAD ANNUAL REPORT 2016146
28 SHare CapItaL
the Group and the Company2016 2015
Note rM’000 rM’000
authorisedOrdinary shares of RM1.00 each 2,000,000 2,000,000
Issued and fully paid capitalOrdinary shares of RM1.00 eachAs at 1 July 1,052,768 1,052,768
Add: New ordinary shares issued during the financial year 52(a) 94,749 –
As at 30 June 1,147,517 1,052,768
29 reServeS
the Group the Company2016 2015 2016 2015
Note rM’000 rM’000 rM’000 rM’000
Retained profits (a) 8,228,437 7,816,792 12,764,322 12,742,372 Share premium (b) 1,119,491 117,229 1,119,491 117,229 Statutory reserve (c) 3,310,501 2,964,899 – – Regulatory reserves (d) 602,335 402,388 – – Share options reserve (e) 10,205 – – – Exchange fluctuation reserve (f) 587,368 464,265 – – Other capital reserve (g) 134,870 134,868 254,991 254,991 Fair value reserve (h) 237,252 170,409 – – Cash flow hedge reserve (i) (1,129) 106 – –
14,229,330 12,070,956 14,138,804 13,114,592
(a) The Company can distribute dividends out of its entire retained earnings under the single-tier system.
(b) Share premium is used to record premium arising from new shares issued by the Company.
(c) The statutory reserve are maintained by the banking subsidiaries in compliance with Section 47(2)(f) of the Financial Services Act, 2013 and the Islamic banking subsidiary in compliance with Section 57(2)(f) of the Islamic Financial Services Act, 2013 and is not distributable as cash dividends.
(d) The Group’s Malaysian banking subsidiaries are required to maintain in aggregate collective impairment allowances of no less than 1.2% of the total outstanding loans, advances and financing, net of individual impairment allowances, in accordance with BNM circular dated 6 April 2015 titled ‘Classification and Impairment Provisions for Loans/Financing – Maintenance of Regulatory Reserves’.
During the financial year, an additional amount of RM199.9 million (2015: RM392.1 million) at Group has been transferred from retained profits to regulatory reserves.
Included in the Group is the regulatory reserve maintained by the Group’s banking subsidiary company in Vietnam of RM11.3 million (2015: RM11.3 million) in line with the requirements of the State Bank of Vietnam.
NoteS to tHe FINaNCIaL StateMeNtSfor the financial year ended 30 June 2016

147Corporate / Financials / Additional Information
29 reServeS (CoNtINUeD)
(e) The share options reserve arose from the employee share option schemes granted to eligible executives of the Group. Terms of the share options and movements in the number of shares held by Trustee for ESOS are disclosed in Note 51 to the financial statements.
(f) Exchange differences arising from translation of the Group’s banking foreign branches, subsidiaries, associated companies and joint venture are shown under exchange fluctuation reserve.
(g) The other capital reserve of the Group arose from the capitalisation of bonus issue and gain on disposal of subsidiary company and assets in certain subsidiary companies and capital redemption reserve arising from redemption of RPS. The capital reserve of the Company arose from gain on disposal of a subsidiary company not recognised in the statements of income due to a common control transaction, and investments and proceeds on issuance of replacement warrants used for bond redemption in previous years.
(h) Movement of the fair value reserve is as follows:
the Group2016 2015
Note rM’000 rM’000
As at 1 July 170,409 287,257 Net gain/(loss) from change in fair value 172,843 (43,171)Reclassification adjustments to net profit on disposal and impairment (89,658) (80,826)Deferred taxation 22 (22,211) 1,589 Share of fair value reserve of associated companies 5,869 5,560 Net change in fair value reserve 66,843 (116,848)
As at 30 June 237,252 170,409
(i) Hedging reserve arises from cash flow hedge activities undertaken by HLB to hedge the changes in the cash flow hedged items arising from the movement of market interest rates. The reserve is non-distributable and is reversed to the statement of income when the hedged items affect the statement of income or termination of the cash flow hedge.
30 treaSUrY SHareS For eSoS
The Company has entered into a Trust for ESOS purposes established via the signing of a Trust Deed on 23 January 2006 with AmTrustee Berhad in conjunction with the establishment of Executive Share Option Schemes (“ESOS”). The trustee will be entitled from time to time to accept financial assistance from the Company upon such terms and conditions as the Company and the trustee may agree to purchase the Company’s shares from the open market for the purposes of this trust.
MFRS132 – Financial Instruments: Presentation requires that if an entity reacquires its own equity instruments, those instruments shall be deducted from equity and are not recognised as a financial asset regardless of the reason for which they are reacquired.
In accordance with MFRS 132 - Financial Instruments: Presentation, the shares purchased for the benefit of the ESOS holders are recorded as “Treasury Shares for ESOS” in the equity on the balance sheet. As at 30 June 2016, the number of shares held by the appointed trustee was 500 shares (2015: 408) at an average price of RM6.31 per share (2015: RM5.06). The total consideration paid, including transaction costs was RM3,156 (2015: RM2,089).
Pursuant to the insurance subsidiary company’s ESOS, the insurance subsidiary company also held 3,963,900 (2015: 2,281,492) units of the Company’s shares at an average price of RM9.01 (2015: RM5.56) per share with total consideration paid, including transaction costs of RM35,709,188 (2015: RM12,695,910), which have been classified as treasury shares held for ESOS at the Group level.
The main features of the ESOS are disclosed in the Director’s Report and details of the ESOS are disclosed in Note 51 to the financial statements.
NoteS to tHe FINaNCIaL StateMeNtSfor the financial year ended 30 June 2016

HONG LEONG FINANCIAL GROUP BERHAD ANNUAL REPORT 2016148
31 INtereSt INCoMe
the Group the Company2016 2015 2016 2015
rM’000 rM’000 rM’000 rM’000
Loans, advances and financing 4,665,092 4,435,221 – – Money at call and deposit placements with financial institutions 193,360 275,001 5,017 1,553 Securities purchased under resale agreements 145,767 218,068 – – Financial assets held-for-trading 554,361 576,911 – – Financial investments available-for-sale 548,827 458,054 – – Financial investments held-to-maturity 325,274 274,044 – – Others 15,802 13,120 – 1,904
6,448,483 6,250,419 5,017 3,457
Of which:Accretion of discount less amortisation of premium 241,921 221,283 – – Interest income earned on impaired loans, advances and financing 49,997 58,180 – –
32 INtereSt eXpeNSe
the Group the Company2016 2015 2016 2015
rM’000 rM’000 rM’000 rM’000
Deposits and placements of banks and other financial institutions 96,216 83,275 – – Deposits from other customers 3,000,705 2,744,262 – – Short-term placements 307,746 232,673 – – Borrowings 126,718 140,938 53,786 41,980 Subordinated obligations 171,079 226,515 – – Non-Innovative Tier 1 stapled securities 60,024 71,317 – – Innovative Tier 1 capital securities 32,652 30,516 – – Others 12,401 11,228 571 773
3,807,541 3,540,724 54,357 42,753
33 INCoMe FroM ISLaMIC BaNKING BUSINeSS
the Group2016 2015
rM’000 rM’000
Income derived from investment of depositors’ funds and others 986,299 903,576 Income derived from investment of shareholders’ funds 124,306 92,445
Total distributable income 1,110,605 996,021 Income attributable to depositors (643,139) (576,263)
467,466 419,758
Of which:Financing income earned on impaired financing and advances 7,995 7,596
NoteS to tHe FINaNCIaL StateMeNtSfor the financial year ended 30 June 2016

149Corporate / Financials / Additional Information
34 NoN-INtereSt INCoMe
the Group the Company2016 2015 2016 2015
rM’000 rM’000 rM’000 rM’000 Insurance income 214,705 248,361 – – Brokerage income 58,165 58,387 – –
Fee income
Commissions 139,557 154,417 – – Service charges and fees 51,963 48,501 – – Guarantee fees 17,219 20,120 – – Credit card related fees 256,917 234,464 – – Corporate advisory fees 7,212 14,183 – – Commitment fees 34,624 35,174 – – Fee on loans, advances and financing 56,944 53,896 – – Placement fees 9,001 8,544 – – Arranger fees 15,428 8,849 – – Unit trust fee income 20,750 16,299 – – Other fee income 80,057 88,468 10,410 10,436
689,672 682,915 10,410 10,436
Net income from securitiesNet realised gain/(loss) from sale/redemption
of financial assets:- financial assets held-for-trading 54,224 58,341 16 (50)- financial investments available-for-sale 103,435 123,980 – – - financial investments held-to-maturity 31 350 – – - derivative financial instruments (19,444) (8,673) (1,237) (5,363)
Gross dividend income from:- financial assets held-for-trading 7,151 1,600 3,031 699 - financial investments available-for-sale 226,516 179,635 – – - subsidiary companies – – 513,534 845,482
Net unrealised gain/(loss) on revaluation of:- financial assets held-for-trading (13,444) 2,401 – – - derivative financial instruments (87,006) (51,734) (1,038) (568)
Amortisation of fair value changes arising from terminated fair value hedges (519) (3,279) – –
270,944 302,621 514,306 840,200
other income
Foreign exchange gain 184,139 36,827 1 – Rental income 9,051 6,396 – – Gain on sale of property and equipment (net) 1,967 6,947 – 320 Other non-operating income 6,277 19,037 188 49
201,434 69,207 189 369
1,434,920 1,361,491 524,905 851,005
NoteS to tHe FINaNCIaL StateMeNtSfor the financial year ended 30 June 2016

HONG LEONG FINANCIAL GROUP BERHAD ANNUAL REPORT 2016150
35 overHeaD eXpeNSeS
the Group the Company2016 2015 2016 2015
Note rM’000 rM’000 rM’000 rM’000
Personnel costs (a) 1,359,453 1,131,941 9,831 15,005 Establishment costs (b) 478,147 451,152 2,213 1,873 Marketing expenses (c) 173,384 168,298 – – Administration and general expenses (d) 273,397 248,872 3,160 4,518
2,284,381 2,000,263 15,204 21,396
(a) Personnel costs comprise the following:
the Group the Company2016 2015 2016 2015
rM’000 rM’000 rM’000 rM’000
Salaries, bonus and allowances 1,065,972 1,048,898 8,721 11,644 Mutual separation scheme (MSS)* 172,064 – – – Medical expenses 31,672 27,441 96 170 Training and convention expenses 33,566 11,904 23 19 Staff welfare 7,995 10,843 397 303 Other employees benefits 48,184 32,855 594 2,869
1,359,453 1,131,941 9,831 15,005
(b) Establishment costs comprise the following:
the Group the Company2016 2015 2016 2015
rM’000 rM’000 rM’000 rM’000
Depreciation of property and equipment 93,119 77,507 656 558 Amortisation of intangible assets 78,308 73,249 108 103 Rental of premises 93,458 88,200 729 791 Information technology expenses 120,382 121,368 128 56 Security services 27,686 26,177 – – Electricity, water and sewerage 27,408 24,912 43 43 Hire of plant and machinery 15,472 13,875 36 34 Others 22,314 25,864 513 288
478,147 451,152 2,213 1,873
NoteS to tHe FINaNCIaL StateMeNtSfor the financial year ended 30 June 2016

151Corporate / Financials / Additional Information
35 overHeaD eXpeNSeS (CoNtINUeD)
(c) Marketing expenses comprise the following:
the Group the Company2016 2015 2016 2015
rM’000 rM’000 rM’000 rM’000
Advertisement and publicity 31,412 36,526 – – Credit card related fees 119,434 112,590 – – Others 22,538 19,182 – –
173,384 168,298 – –
(d) Administration and general expenses comprise the following:
the Group the Company2016 2015 2016 2015
rM’000 rM’000 rM’000 rM’000
Teletransmission expenses 14,665 15,329 31 24 Stationery and printing expenses 18,332 19,540 36 38 Professional fees 71,566 68,935 575 1,715 Insurance fees 38,125 36,217 – – Stamp, postage and courier 22,010 21,875 5 4 Credit card fees 36,587 31,910 – – Travelling and transport expenses 4,924 6,181 42 26 Registration and license fees 9,667 7,239 – – Brokerage and commission 6,897 6,844 – – Others 50,624 34,802 2,471 2,711
273,397 248,872 3,160 4,518
* Hong Leong Bank Berhad and Hong Leong Islamic Bank Berhad had implemented a MSS as part of its move to strengthen operational efficiencies. This scheme was offered to all permanent staff at all levels, functions and locations on a voluntary basis, which will create an opportunity for both the banking subsidiaries and employees to gain mutual benefits.
NoteS to tHe FINaNCIaL StateMeNtSfor the financial year ended 30 June 2016

HONG LEONG FINANCIAL GROUP BERHAD ANNUAL REPORT 2016152
35 overHeaD eXpeNSeS (CoNtINUeD)
The above expenditure includes the following statutory disclosures:
the Group the Company2016 2015 2016 2015
Note rM’000 rM’000 rM’000 rM’000
Directors’ remuneration 37 8,329 9,110 3,368 8,684 Hire of equipment 15,546 13,976 36 34 Auditors’ remuneration:(i) PwC Malaysia firm
- statutory audit 2,986 2,965 126 126 - regulatory related fees 828 1,046 32 132 - other services 89 574 – 13 - tax compliance 125 126 – – - other tax services 6 532 – –
(ii) PwC overseas affiliated firms- statutory audit 866 664 – – - regulatory related fees 143 75 – – - tax compliance 191 75 – – - other fees – 1,126 – –
(iii) Other overseas firm- statutory audit 63 67 – –
Property and equipment written off 834 209 – – Intangible assets written off 3,386 2,875 – – Options charge arising from ESOS 10,205 2,108 – 2,070
36 aLLoWaNCe For/(WrIteBaCK oF) IMpaIrMeNt LoSSeS oN LoaNS, aDvaNCeS aND FINaNCING aND otHer LoSSeS
the Group2016 2015
rM’000 rM’000
Allowance for/(writeback of) impairment losses on loans, advances and financing- collective assessment allowance 263,678 213,042 - individual assessment allowance (4,446) (49,902)
Allowance for/(writeback of) impairment losses on clients’ and brokers’ balances- collective assessment allowance (6) 8 - individual assessment allowance (79) (9)
Writeback of allowance for impairment losses on fee income receivables- individual assessment allowance – (106)
Impaired loans and financing- written off 22,048 45,617 - recovered (228,658) (261,294)
52,537 (52,644)
NoteS to tHe FINaNCIaL StateMeNtSfor the financial year ended 30 June 2016

153Corporate / Financials / Additional Information
37 DIreCtorS’ reMUNeratIoN
Forms of remuneration in aggregate for all Directors for the financial year are as follows:
the Group the Company
Salaries and other
remunerations Director
fees
estimated monetary
value for
benefits- in-kind total
Salaries and other
remunerations Director
fees
estimated monetary
value for
benefits- in-kind total
2016 rM’000 rM’000 rM’000 rM’000 rM’000 rM’000 rM’000 rM’000
executive DirectorsMr Tan Kong Khoon
(Appointed on 5 February 2016) 5,523 – 36 5,559 1,167 – 15 1,182
Mr Choong Yee How (Resigned on 1 September 2015) 1,592 – 6 1,598 1,592 – 6 1,598
7,115 – 42 7,157 2,759 – 21 2,780
Non-executive DirectorsMr Quek Kon Sean – – – – – – – – YBhg Tan Sri Quek
Leng Chan – – 28 28 – – 28 28 YBhg Tan Sri Dato’ Seri
Khalid Ahmad bin Sulaiman – 329 – 329 – 110 – 110
Ms Lim Lean See – 395 – 395 – 150 – 150 Mr Saw Kok Wei – 205 – 205 – 145 – 145 Ms Lim Tau Kien – 215 – 215 – 155 – 155
– 1,144 28 1,172 – 560 28 588
Total Directors’ remuneration 7,115 1,144 70 8,329 2,759 560 49 3,368
The movement and details of the Directors of the Company in office and interests in shares and share options are reported in the Directors’ Report.
Included in the Non-Executive Directors’ remunerations are amounts paid to Directors in their capacities as Executive Directors for certain subsidiary companies.
NoteS to tHe FINaNCIaL StateMeNtSfor the financial year ended 30 June 2016

HONG LEONG FINANCIAL GROUP BERHAD ANNUAL REPORT 2016154
37 DIreCtorS’ reMUNeratIoN (CoNtINUeD)
Forms of remuneration in aggregate for all Directors for the financial year are as follows: (continued)
the Group the Company
Salaries and other
remunerations Director
fees
estimated monetary
value for
benefits- in-kind total
Salaries and other
remunerations Director
fees
estimated monetary
value for
benefits- in-kind total
2015 rM’000 rM’000 rM’000 rM’000 rM’000 rM’000 rM’000 rM’000
executive DirectorsMr Choong Yee How 8,064 – 32 8,096 8,064 – 32 8,096
Non-executive DirectorsYBhg Tan Sri Quek Leng
Chan – – 28 28 – – 28 28 YBhg Tan Sri Dato’ Seri
Khalid Ahmad bin Sulaiman – 309 – 309 – 110 – 110
Ms Lim Lean See – 335 – 335 – 150 – 150 Mr Saw Kok Wei – 187 – 187 – 145 – 145 Ms Lim Tau Kien – 155 – 155 – 155 – 155
– 986 28 1,014 – 560 28 588
Total Directors’ remuneration 8,064 986 60 9,110 8,064 560 60 8,684
The movement and details of the Directors of the Company in office and interests in shares and share options are reported in the Directors’ Report.
Included in the Non-Executive Directors’ remunerations are amounts paid to Directors in their capacities as Executive Directors for certain subsidiary companies.
NoteS to tHe FINaNCIaL StateMeNtSfor the financial year ended 30 June 2016

155Corporate / Financials / Additional Information
38 taXatIoN
the Group the Company2016 2015 2016 2015
Note rM’000 rM’000 rM’000 rM’000
Income tax 484,693 633,930 3,200 3,092 Deferred taxation 22 8,625 (30,605) 1,840 1,380 Under/(over) accrual in prior years 8,176 (40,417) (82) –
Taxation 501,494 562,908 4,958 4,472
A reconciliation of income tax applicable to profit before taxation at the statutory income tax rate to income tax expenses of the Group and the Company is as follows:
the Group the Company2016 2015 2016 2015
rM’000 rM’000 rM’000 rM’000
Profit before taxation 2,565,038 3,023,285 450,647 787,047
Tax calculated at a rate of 24% (2015: 25%) 615,609 755,821 108,155 196,762
tax effects of: - Differences in tax rate of foreign inward and offshore insurance 1,266 354 – – - Income not subject to tax (91,921) (89,504) (123,508) (211,625) - Share of net income of associated companies and joint ventures (96,548) (119,925) – – - Expenses not deductible for tax purposes 80,045 65,930 20,393 19,335 - Under/(over) accrual in prior years 8,176 (40,417) (82) – - Origination of temporary differences previously not recognised (15,133) (9,351) – –
Taxation 501,494 562,908 4,958 4,472
the Group2016 2015
rM’000 rM’000
tax lossesTax losses for which the related tax credit has not been recognised in the financial statements 69,681 66,787
tax creditTax credit which has not been recognised in the financial statements 121,830 133,921
Capital allowanceDeductible temporary differences and unutilised capital allowances for which the related tax
credit has not been recognised in the financial statements 807 807
The above unabsorbed tax losses of the Group have not been recognised as future realisation is uncertain.
NoteS to tHe FINaNCIaL StateMeNtSfor the financial year ended 30 June 2016

HONG LEONG FINANCIAL GROUP BERHAD ANNUAL REPORT 2016156
39 earNINGS per SHare
Basic earnings per share
Basic earnings per share are calculated by dividing the net profit attributable to ordinary equity holders of the Company by the weighted average number of ordinary shares in issue during the financial year.
the Group the Company2016 2015 2016 2015
rM’000 rM’000 rM’000 rM’000
Weighted average number of ordinary shares (’000) 1,102,947 1,050,486 1,106,355 1,052,768 Net profit attributable to owners of the parent 1,358,895 1,620,743 445,689 782,575
Basic earnings per share (sen) 123.2 154.3 40.3 74.3
Diluted earnings per share
Diluted earnings per share is calculated by adjusting the weighted average number of ordinary shares outstanding to assume conversion of all potential ordinary shares. For the share options, calculation is done to determine the number of shares that could been acquired at fair value based on the monetary value of the subscription rights attached to outstanding share options. The Group’s dilutive potential ordinary shares is share option, of which the impact of dilution is as below:
the Group the Company2016 2015 2016 2015
rM’000 rM’000 rM’000 rM’000
Weighted average number of ordinary shares (’000) 1,102,947 1,050,486 1,106,355 1,052,768 Adjustment for ESOS shares (’000) – 142 – –
1,102,947 1,050,628 1,106,355 1,052,768 Net profit attributable to owners of the parent 1,358,895 1,620,743 445,689 782,575
Diluted earnings per share (sen) 123.2 154.3 40.3 74.3
40 DIvIDeNDS
Dividends recognised as distribution to ordinary equity holders of the Company:
the Group and the Company2016 2015
rM’000 rM’000
First interim single-tier dividend of 13 sen per share (2015: 13 sen per share (single-tier)) 136,860 136,470 Second interim single-tier dividend of 25 sen per share (2015: 25 sen per share (single-tier)) 286,879 263,186
423,739 399,656
NoteS to tHe FINaNCIaL StateMeNtSfor the financial year ended 30 June 2016

157Corporate / Financials / Additional Information
41 CoMMItMeNtS aND CoNtINGeNCIeS
(a) Group related commitments and contingencies
In the normal course of business, the Group make various commitments and incur certain contingent liabilities with legal recourse to their customers. No material losses are anticipated as a result of these transactions. These commitments and contingencies are also not secured over the assets of the Group.
The notional/principal amount of the commitments and contingencies constitute the following:
the Group the Company2016 2015 2016 2015
rM’000 rM’000 rM’000 rM’000
Direct credit substitutes* 121,679 220,983 – – Certain transaction related contingent items 1,621,014 1,606,465 – – Short-term self liquidating trade related contingencies 766,350 755,587 – – Any commitments that are unconditionally cancellable at any
time by the Group without prior notice- less than one year 686,780 722,877 – –
Irrevocable commitments to extend credit:- less than one year 17,515,111 17,264,715 – – - more than one year 16,125,773 18,161,494 – –
Foreign exchange related contracts^:- less than one year 30,866,808 33,596,962 – – - one year to less than five years 4,950,940 4,409,157 – – - five years and above 895,329 819,693 – –
Interest rate related contracts^:- less than one year 35,439,838 23,442,517 100,000 – - one year to less than five years 39,926,819 46,063,835 100,000 775,000 - five years and above 2,532,411 2,654,631 – –
Equity related contracts^:- less than one year 296,489 360,330 – – - one year to less than five years 219,299 111,437 – –
Commodity related contracts^:- less than one year 4,949 1,471 – – - one year to less than five years – 3,826 – –
Unutilised credit card lines 7,503,020 7,426,036 – –
159,472,609 157,622,016 200,000 775,000
* Included in direct credit substitutes are the financial guarantee contracts of RM112,451,135 (2015: RM207,714,163), of which fair value at the time of issuance is zero.
^ These derivatives are revalued at gross position basis and the unrealised gains or losses have been reflected in Note 20 to the financial statements as derivative assets or derivative liabilities.
NoteS to tHe FINaNCIaL StateMeNtSfor the financial year ended 30 June 2016

HONG LEONG FINANCIAL GROUP BERHAD ANNUAL REPORT 2016158
41 CoMMItMeNtS aND CoNtINGeNCIeS (CoNtINUeD)
(b) other commitments and contingencies - unsecured
Hong Leong Asset Management Bhd, a wholly owned subsidiary of company of Hong Leong Capital Berhad (“HLCB”), is the Manager of Hong Leong Consumer Products Sector Fund (“Funds”). HLCB provided a guarantee to Deutsche Trustees Malaysia Berhad, the trustee of the Funds, that if the funds falls below the minimum fund size of RM1 million, HLCB would invest cash, equivalent to the shortfall, into the relevant fund.
The size of each of the funds was above the minimum of RM1 million as at 30 June 2016 (2015: RM1 million).
42 CapItaL CoMMItMeNtS
the Group2016 2015
rM’000 rM’000
Approved and contracted for 98,858 46,094 Approved but not contracted for 63,802 320,920
162,660 367,014
The capital commitments are in respect of:- property and equipment- intangible assets
43 LeaSe CoMMItMeNtS
The Group has lease commitments in respect of rented premises and hired equipment, all of which are classified as operating leases. A summary of the future minimum lease payments, under non-cancellable operating lease commitment are as follows:
the Group2016 2015
rM’000 rM’000
Not more than one year 9,589 12,184 More than one year but less than five years 9,929 20,929 More than 5 years 2,113 4,148
21,631 37,261
44 ULtIMate HoLDING CoMpaNY
The ultimate holding company is Hong Leong Company (Malaysia) Berhad, a company incorporated in Malaysia.
NoteS to tHe FINaNCIaL StateMeNtSfor the financial year ended 30 June 2016
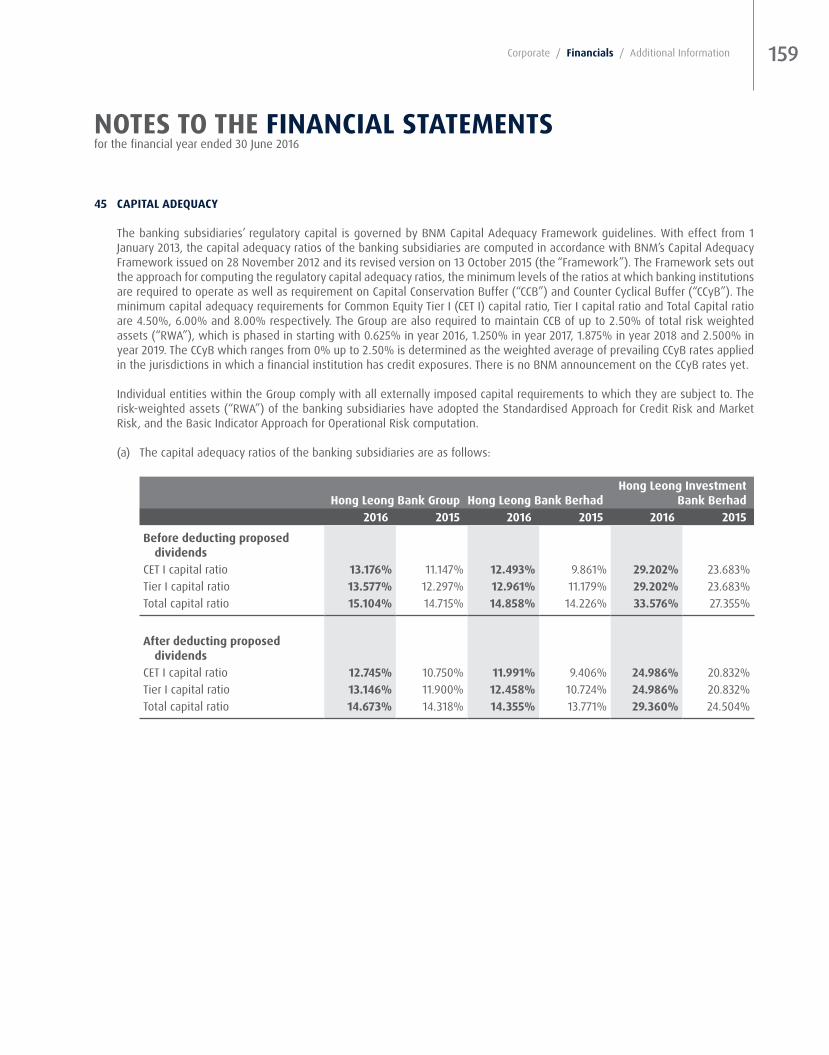
159Corporate / Financials / Additional Information
45 CapItaL aDeQUaCY
The banking subsidiaries’ regulatory capital is governed by BNM Capital Adequacy Framework guidelines. With effect from 1 January 2013, the capital adequacy ratios of the banking subsidiaries are computed in accordance with BNM’s Capital Adequacy Framework issued on 28 November 2012 and its revised version on 13 October 2015 (the “Framework”). The Framework sets out the approach for computing the regulatory capital adequacy ratios, the minimum levels of the ratios at which banking institutions are required to operate as well as requirement on Capital Conservation Buffer (“CCB”) and Counter Cyclical Buffer (“CCyB”). The minimum capital adequacy requirements for Common Equity Tier I (CET I) capital ratio, Tier I capital ratio and Total Capital ratio are 4.50%, 6.00% and 8.00% respectively. The Group are also required to maintain CCB of up to 2.50% of total risk weighted assets (“RWA”), which is phased in starting with 0.625% in year 2016, 1.250% in year 2017, 1.875% in year 2018 and 2.500% in year 2019. The CCyB which ranges from 0% up to 2.50% is determined as the weighted average of prevailing CCyB rates applied in the jurisdictions in which a financial institution has credit exposures. There is no BNM announcement on the CCyB rates yet.
Individual entities within the Group comply with all externally imposed capital requirements to which they are subject to. The risk-weighted assets (“RWA”) of the banking subsidiaries have adopted the Standardised Approach for Credit Risk and Market Risk, and the Basic Indicator Approach for Operational Risk computation.
(a) The capital adequacy ratios of the banking subsidiaries are as follows:
Hong Leong Bank Group Hong Leong Bank BerhadHong Leong Investment
Bank Berhad2016 2015 2016 2015 2016 2015
Before deducting proposed dividends
CET I capital ratio 13.176% 11.147% 12.493% 9.861% 29.202% 23.683%Tier I capital ratio 13.577% 12.297% 12.961% 11.179% 29.202% 23.683%Total capital ratio 15.104% 14.715% 14.858% 14.226% 33.576% 27.355%
after deducting proposed dividends
CET I capital ratio 12.745% 10.750% 11.991% 9.406% 24.986% 20.832%Tier I capital ratio 13.146% 11.900% 12.458% 10.724% 24.986% 20.832%Total capital ratio 14.673% 14.318% 14.355% 13.771% 29.360% 24.504%
NoteS to tHe FINaNCIaL StateMeNtSfor the financial year ended 30 June 2016
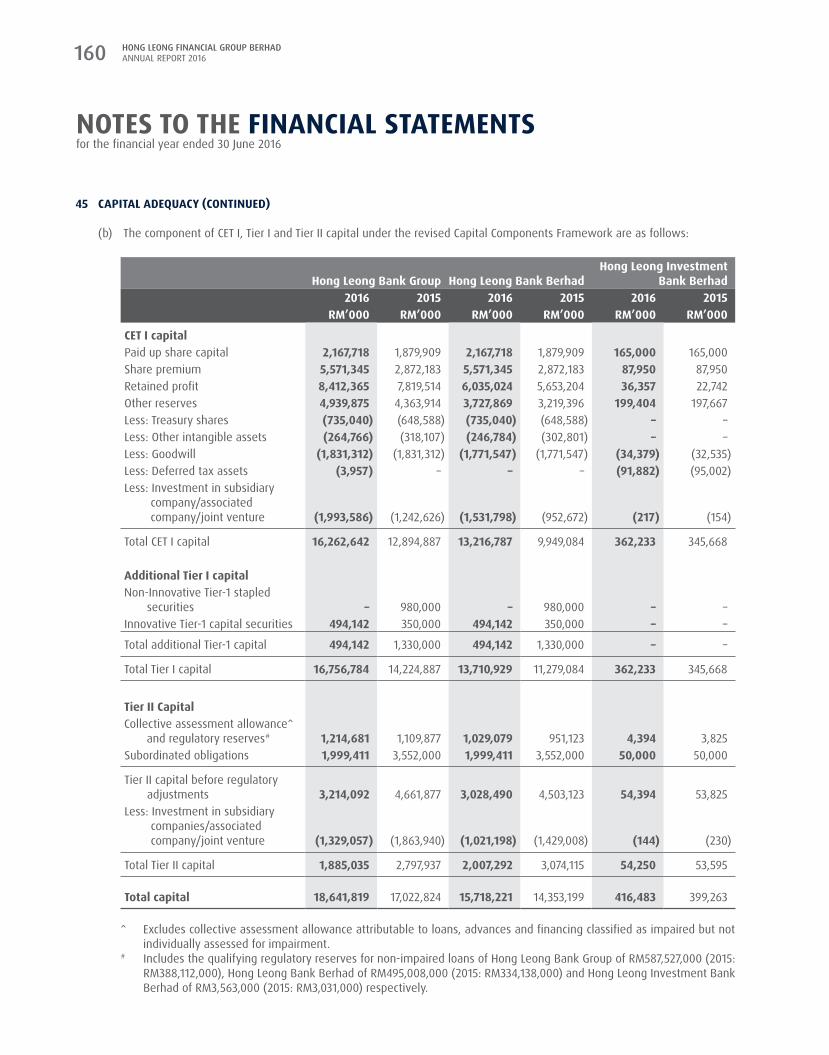
HONG LEONG FINANCIAL GROUP BERHAD ANNUAL REPORT 2016160
45 CapItaL aDeQUaCY (CoNtINUeD)
(b) The component of CET I, Tier I and Tier II capital under the revised Capital Components Framework are as follows:
Hong Leong Bank Group Hong Leong Bank BerhadHong Leong Investment
Bank Berhad2016 2015 2016 2015 2016 2015
rM’000 rM’000 rM’000 rM’000 rM’000 rM’000
Cet I capitalPaid up share capital 2,167,718 1,879,909 2,167,718 1,879,909 165,000 165,000 Share premium 5,571,345 2,872,183 5,571,345 2,872,183 87,950 87,950 Retained profit 8,412,365 7,819,514 6,035,024 5,653,204 36,357 22,742 Other reserves 4,939,875 4,363,914 3,727,869 3,219,396 199,404 197,667 Less: Treasury shares (735,040) (648,588) (735,040) (648,588) – – Less: Other intangible assets (264,766) (318,107) (246,784) (302,801) – – Less: Goodwill (1,831,312) (1,831,312) (1,771,547) (1,771,547) (34,379) (32,535)Less: Deferred tax assets (3,957) – – – (91,882) (95,002)Less: Investment in subsidiary
company/associated company/joint venture (1,993,586) (1,242,626) (1,531,798) (952,672) (217) (154)
Total CET I capital 16,262,642 12,894,887 13,216,787 9,949,084 362,233 345,668
additional tier I capitalNon-Innovative Tier-1 stapled
securities – 980,000 – 980,000 – – Innovative Tier-1 capital securities 494,142 350,000 494,142 350,000 – –
Total additional Tier-1 capital 494,142 1,330,000 494,142 1,330,000 – –
Total Tier I capital 16,756,784 14,224,887 13,710,929 11,279,084 362,233 345,668
tier II CapitalCollective assessment allowance^
and regulatory reserves# 1,214,681 1,109,877 1,029,079 951,123 4,394 3,825 Subordinated obligations 1,999,411 3,552,000 1,999,411 3,552,000 50,000 50,000
Tier II capital before regulatory adjustments 3,214,092 4,661,877 3,028,490 4,503,123 54,394 53,825
Less: Investment in subsidiary companies/associated company/joint venture (1,329,057) (1,863,940) (1,021,198) (1,429,008) (144) (230)
Total Tier II capital 1,885,035 2,797,937 2,007,292 3,074,115 54,250 53,595
total capital 18,641,819 17,022,824 15,718,221 14,353,199 416,483 399,263
^ Excludes collective assessment allowance attributable to loans, advances and financing classified as impaired but not individually assessed for impairment.
# Includes the qualifying regulatory reserves for non-impaired loans of Hong Leong Bank Group of RM587,527,000 (2015: RM388,112,000), Hong Leong Bank Berhad of RM495,008,000 (2015: RM334,138,000) and Hong Leong Investment Bank Berhad of RM3,563,000 (2015: RM3,031,000) respectively.
NoteS to tHe FINaNCIaL StateMeNtSfor the financial year ended 30 June 2016

161Corporate / Financials / Additional Information
45 CapItaL aDeQUaCY (CoNtINUeD)
(c) The breakdown of RWA by each major risk category is as follows:
Hong Leong Bank Group Hong Leong Bank BerhadHong Leong Investment
Bank Berhad2016 2015 2016 2015 2016 2015
rM’000 rM’000 rM’000 rM’000 rM’000 rM’000
Credit risk 111,838,090 105,009,787 95,233,431 91,202,163 520,091 678,033 Market risk 3,951,986 3,052,311 3,857,577 3,065,215 416,042 483,713 Operational risk 7,633,295 7,620,076 6,698,869 6,627,632 304,287 297,840
Total RWA 123,423,371 115,682,174 105,789,877 100,895,010 1,240,420 1,459,586
(d) The capital adequacy ratios of Hong Leong Bank Group’s subsidiary company are as follows:
Hong Leong Islamic Bank Berhad
2016 2015
Before deducting proposed dividendsCET I capital ratio 10.383% 11.323%Tier I capital ratio 10.383% 11.323%Total capital ratio 13.855% 15.240%
after deducting proposed dividendsCET I capital ratio 10.383% 11.253%Tier I capital ratio 10.383% 11.253%Total capital ratio 13.855% 15.170%
46 SeGMeNtaL INForMatIoN
Operating segments are reported in a manner consistent with the internal reporting provided to the chief operating decision-maker. The chief operating decision-maker is the person or group that allocates resources to and assesses the performance of the operating segments of an entity.
Inter-segment pricing is based on internally computed cost of funds.
Segment results, assets and liabilities include items directly attributable to the segment as well as those that can be allocated on a reasonable basis.
Segment capital expenditure is the total cost incurred during the period to acquire segment assets that are expected to be used during more than one period.
Business segments
The Group comprises the following main business segments:
Commercial banking - Commercial banking business Investment banking and asset management - Investment banking, futures and stock broking, fund and unit trust managementInsurance - Life and general insurance and takaful businessOther operations - Investment holding and provision of management services
NoteS to tHe FINaNCIaL StateMeNtSfor the financial year ended 30 June 2016
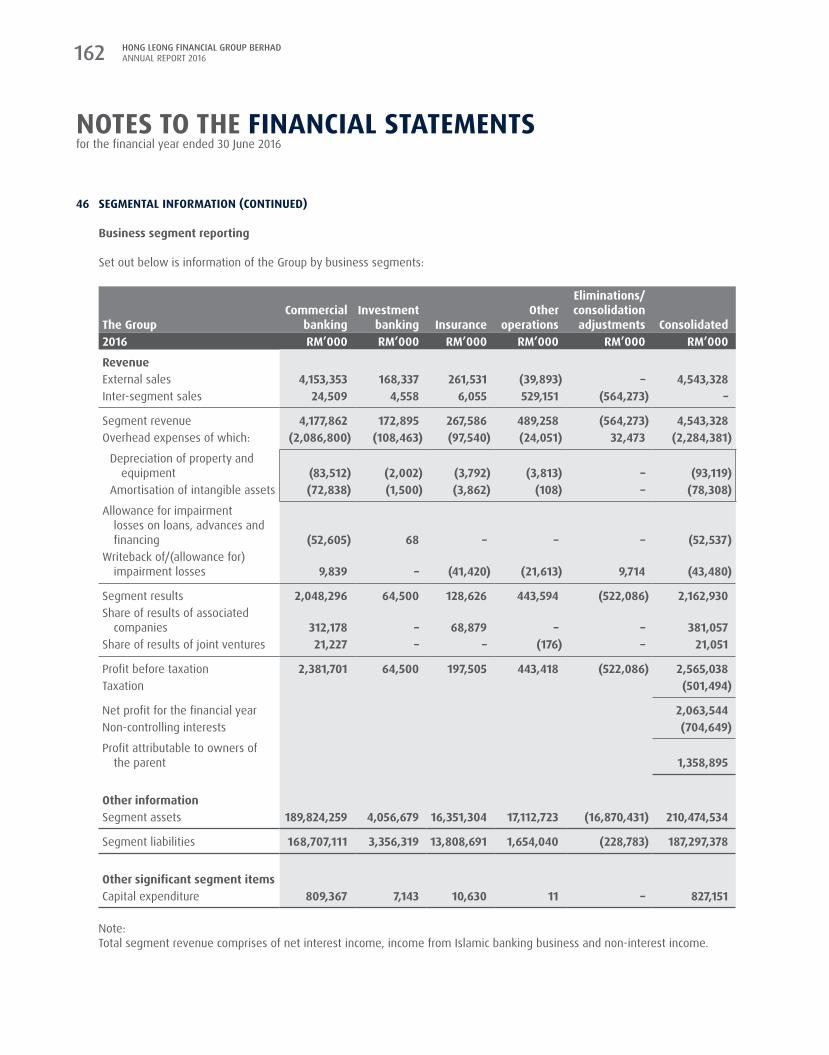
HONG LEONG FINANCIAL GROUP BERHAD ANNUAL REPORT 2016162
46 SeGMeNtaL INForMatIoN (CoNtINUeD)
Business segment reporting
Set out below is information of the Group by business segments:
the GroupCommercial
bankingInvestment
banking Insuranceother
operations
eliminations/consolidation adjustments Consolidated
2016 rM’000 rM’000 rM’000 rM’000 rM’000 rM’000
revenueExternal sales 4,153,353 168,337 261,531 (39,893) – 4,543,328 Inter-segment sales 24,509 4,558 6,055 529,151 (564,273) –
Segment revenue 4,177,862 172,895 267,586 489,258 (564,273) 4,543,328 Overhead expenses of which: (2,086,800) (108,463) (97,540) (24,051) 32,473 (2,284,381)
Depreciation of property and equipment (83,512) (2,002) (3,792) (3,813) – (93,119)
Amortisation of intangible assets (72,838) (1,500) (3,862) (108) – (78,308)
Allowance for impairment losses on loans, advances and financing (52,605) 68 – – – (52,537)
Writeback of/(allowance for) impairment losses 9,839 – (41,420) (21,613) 9,714 (43,480)
Segment results 2,048,296 64,500 128,626 443,594 (522,086) 2,162,930 Share of results of associated
companies 312,178 – 68,879 – – 381,057 Share of results of joint ventures 21,227 – – (176) – 21,051
Profit before taxation 2,381,701 64,500 197,505 443,418 (522,086) 2,565,038 Taxation (501,494)
Net profit for the financial year 2,063,544 Non-controlling interests (704,649)
Profit attributable to owners of the parent 1,358,895
other informationSegment assets 189,824,259 4,056,679 16,351,304 17,112,723 (16,870,431) 210,474,534
Segment liabilities 168,707,111 3,356,319 13,808,691 1,654,040 (228,783) 187,297,378
other significant segment itemsCapital expenditure 809,367 7,143 10,630 11 – 827,151
Note:Total segment revenue comprises of net interest income, income from Islamic banking business and non-interest income.
NoteS to tHe FINaNCIaL StateMeNtSfor the financial year ended 30 June 2016

163Corporate / Financials / Additional Information
46 SeGMeNtaL INForMatIoN (CoNtINUeD)
Business segment reporting (continued)
Set out below is information of the Group by business segments: (continued)
the GroupCommercial
bankingInvestment
banking Insuranceother
operations
eliminations/consolidation adjustments Consolidated
2015 rM’000 rM’000 rM’000 rM’000 rM’000 rM’000
revenueExternal sales 4,016,311 181,481 314,395 (21,243) – 4,490,944 Inter-segment sales 50,637 1,843 5,486 861,235 (919,201) –
Segment revenue 4,066,948 183,324 319,881 839,992 (919,201) 4,490,944 Overhead expenses of which: (1,813,859) (105,531) (73,733) (21,560) 14,420 (2,000,263)
Depreciation of property and equipment (70,819) (1,920) (3,683) (1,085) – (77,507)
Amortisation of intangible assets (69,487) (881) (2,778) (103) – (73,249)
Writeback of impairment losses on loans, advances and financing 51,929 715 – – – 52,644
Writeback of/(allowance for) impairment losses 23,462 – (20,859) (3,266) 3,266 2,603
Segment results 2,328,480 78,508 225,289 815,166 (901,515) 2,545,928 Share of results of associated
companies 401,277 – 62,020 – – 463,297 Share of results of joint ventures 16,401 – – (2,341) – 14,060
Profit before taxation 2,746,158 78,508 287,309 812,825 (901,515) 3,023,285 Taxation (562,908)
Net profit for the financial year 2,460,377 Non-controlling interests (839,634)
Profit attributable to owners of the parent 1,620,743
other informationSegment assets 184,019,735 3,621,963 14,618,735 15,202,651 (15,022,440) 202,440,644
Segment liabilities 167,230,143 2,974,065 12,241,548 872,517 (341,932) 182,976,341
other significant segment itemsCapital expenditure 232,829 5,079 11,124 1,279 – 250,311
Note:Total segment revenue comprises of net interest income, income from Islamic banking business and non-interest income.
NoteS to tHe FINaNCIaL StateMeNtSfor the financial year ended 30 June 2016

HONG LEONG FINANCIAL GROUP BERHAD ANNUAL REPORT 2016164
46 SeGMeNtaL INForMatIoN (CoNtINUeD)
The Group operates in two main geographical areas:
- Malaysia, the home country of the Group, which includes all the areas of operations in the primary business segments.
- Overseas operations, which includes branch, subsidiary, associate and joint ventures operations in Singapore, Hong Kong, China, Vietnam and Cambodia. The overseas operations are mainly in commercial banking and insurance business.
revenuetotal
assetstotal
liabilitiesCapital
expenditurethe Group rM’000 rM’000 rM’000 rM’000
2016Malaysia 4,293,149 198,962,327 176,794,597 803,329 Overseas operations 250,179 11,512,207 10,502,781 23,822
4,543,328 210,474,534 187,297,378 827,151
2015Malaysia 4,264,665 191,979,165 173,442,961 218,924 Overseas operations 226,279 10,461,479 9,533,380 31,387
4,490,944 202,440,644 182,976,341 250,311
47 SIGNIFICaNt reLateD partY traNSaCtIoNS
(a) related parties and relationship
The related parties of and their relationship with the Company are as follows:
related parties relationship
Hong Leong Company (Malaysia) Berhad (“HLCM”) Ultimate holding company
HLCM Capital Sdn Bhd, Hong Leong Share Registration Services Sdn Bhd, HL Management Co Sdn Bhd and GuoLine Capital Assets Limited (“HLCM Group”)
Subsidiary companies of ultimate holding company
Guardian Security Consultants Sdn Bhd (“GSC”) Associated company of ultimate holding company
Hong Leong Industries Berhad and its subsidiary and associated companies as disclosed in its financial statements (“HLI Group”)
Subsidiary and associated companies of ultimate holding company
Malaysian Pacific Industries Berhad and its subsidiary and associated companies as disclosed in its financial statements (“MPI Group”)
Subsidiary and associated companies of ultimate holding company
Hume Industries Berhad and its subsidiary and associated companies as disclosed in its financial statements (“Hume Group”)
Subsidiary and associated companies of ultimate holding company
NoteS to tHe FINaNCIaL StateMeNtSfor the financial year ended 30 June 2016
165Corporate / Financials / Additional Information
47 SIGNIFICaNt reLateD partY traNSaCtIoNS (CoNtINUeD)
(a) related parties and relationship (continued)
The related parties of and their relationship with the Company are as follows: (continued)
related parties relationship
HLMG Management Co Sdn Bhd (formerly known as HLI-Hume Management Co Sdn Bhd) (”HLMG”), Hume Cement Sdn Bhd, Hume Construction Sdn Bhd,Hume Plastics (Malaysia) Sdn Berhad, Hume Quarry (Sarawak) Sdn Bhd,Hongvilla Development Sdn Bhd, HIMB Overseas Limited, HIMB Trading Limited and Delta Touch Limited
Subsidiary companies of ultimate holding company
Guoco Group Limited and its subsidiary and associated companies as disclosed in its financial statements (“GGL Group”)
Subsidiary and associated companies of ultimate holding company
GuocoLand (Malaysia) Berhad and its subsidiary and associated companies as disclosed in its financial statements
Subsidiary and associated companies of ultimate holding company
Subsidiary companies of the Company as disclosed in Note 11
Subsidiary companies of the Company
Key management personnel The key management personnel of the Group and the Company consists of:- All Directors of the Company - Key management personnel of the Company who are
in charge of the HLFG Group
Related parties of key management personnel (deemed as related to the Company)
(i) Close family members and dependents of key management personnel
(ii) Entities that are controlled, jointly controlled or significant influenced by, or for which significant voting power in such entity resides with, directly or indirectly by key management personnel or its close family members
NoteS to tHe FINaNCIaL StateMeNtSfor the financial year ended 30 June 2016
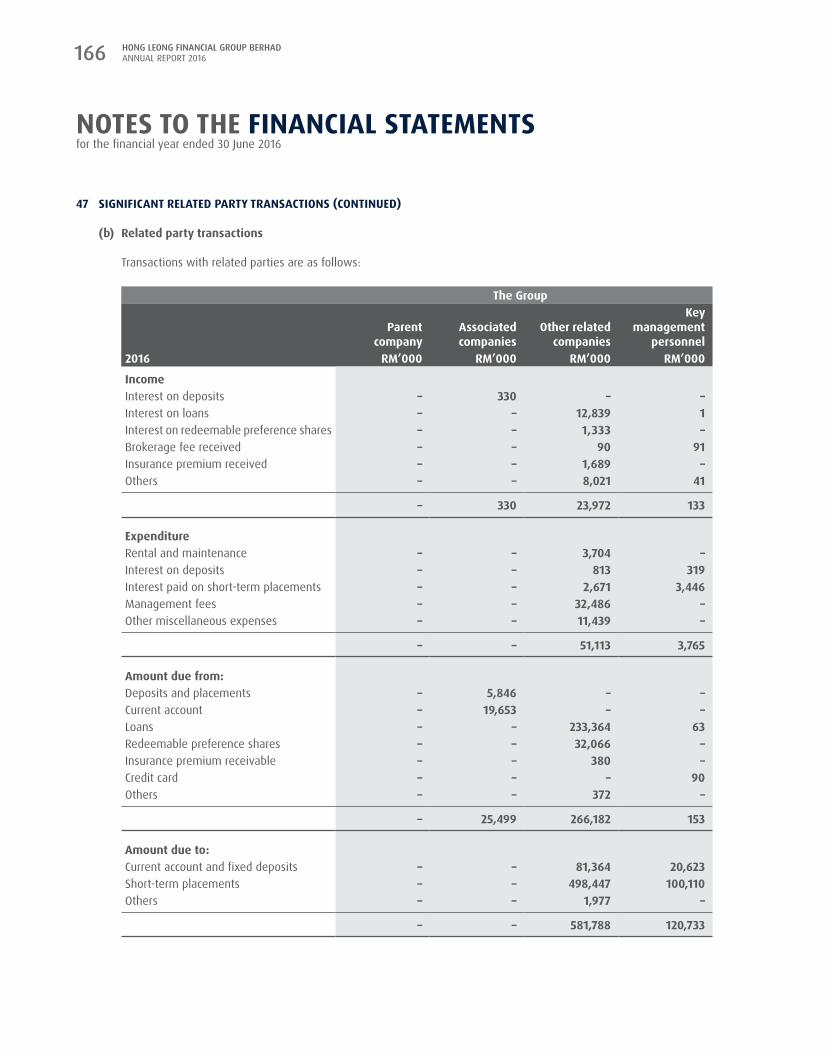
HONG LEONG FINANCIAL GROUP BERHAD ANNUAL REPORT 2016166
47 SIGNIFICaNt reLateD partY traNSaCtIoNS (CoNtINUeD)
(b) related party transactions
Transactions with related parties are as follows:
the Group
parent company
associated companies
other related companies
Key management
personnel2016 rM’000 rM’000 rM’000 rM’000
IncomeInterest on deposits – 330 – – Interest on loans – – 12,839 1 Interest on redeemable preference shares – – 1,333 –Brokerage fee received – – 90 91 Insurance premium received – – 1,689 – Others – – 8,021 41
– 330 23,972 133
expenditureRental and maintenance – – 3,704 – Interest on deposits – – 813 319 Interest paid on short-term placements – – 2,671 3,446 Management fees – – 32,486 – Other miscellaneous expenses – – 11,439 –
– – 51,113 3,765
amount due from:Deposits and placements – 5,846 – – Current account – 19,653 – – Loans – – 233,364 63 Redeemable preference shares – – 32,066 – Insurance premium receivable – – 380 – Credit card – – – 90 Others – – 372 –
– 25,499 266,182 153
amount due to:Current account and fixed deposits – – 81,364 20,623 Short-term placements – – 498,447 100,110 Others – – 1,977 –
– – 581,788 120,733
NoteS to tHe FINaNCIaL StateMeNtSfor the financial year ended 30 June 2016

167Corporate / Financials / Additional Information
47 SIGNIFICaNt reLateD partY traNSaCtIoNS (CoNtINUeD)
(b) related party transactions (continued)
Transactions with related parties are as follows: (continued)
the Group
parent company
associated companies
other related companies
Key management
personnel2015 rM’000 rM’000 rM’000 rM’000
IncomeInterest on loans – – 13,035 1Interest on redeemable preference shares – – 2,000 – Brokerage fee received – – 72 301Insurance premium received – – 687 – Others – – 4,975 40
– – 20,769 342
expenditureRental and maintenance – – 4,276 – Interest on deposits – – 2,120 316 Interest paid on short-term placements – – 1,512 2,859 Management fees – – 35,055 – Other miscellaneous expenses – – 3,955 –
– – 46,918 3,175
amount due from:Deposits and placements – 228,873 – –Current account – 19,453 – – Loans – – 256,012 70 Redeemable preference shares – – 54,000 – Insurance premium receivable – – 467 – Credit card – – – 189 Others – – 397 –
– 248,326 310,876 259
amount due to:Current account and fixed deposits 110 – 26,693 27,231 Short-term placements – – 539,620 130,502 Others – – 160,998 –
110 – 727,311 157,733
NoteS to tHe FINaNCIaL StateMeNtSfor the financial year ended 30 June 2016

HONG LEONG FINANCIAL GROUP BERHAD ANNUAL REPORT 2016168
47 SIGNIFICaNt reLateD partY traNSaCtIoNS (CoNtINUeD)
(b) related party transactions (continued)
Transactions with related parties are as follows: (continued)
the Company
parent company
Subsidiary companies
other related companies
Key management
personnel2016 rM’000 rM’000 rM’000 rM’000
IncomeDividend income – 513,534 – – Interest on deposit – 275 – – Management fee – 10,410 – –
– 524,219 – –
expenditureInsurance – 2 12 – Interest expense – 2,150 – – Interest on derivatives – 253 – – Management fee – – 2,171 – Rental and maintenance – 729 – – Other miscellaneous expenses – 73 101 –
– 3,207 2,284 –
amount due from:Money at call and deposit placements – 446 – – Others – 48 4 –
– 494 4 –
amount due to:Borrowings – 50,171 – – Others – 1,455 – –
– 51,626 – –
NoteS to tHe FINaNCIaL StateMeNtSfor the financial year ended 30 June 2016

169Corporate / Financials / Additional Information
47 SIGNIFICaNt reLateD partY traNSaCtIoNS (CoNtINUeD)
(b) related party transactions (continued)
Transactions with related parties are as follows: (continued)
the Company
parent company
Subsidiary companies
other related companies
Key management
personnel2015 rM’000 rM’000 rM’000 rM’000
IncomeDividend income – 845,482 – –Interest on deposit – 74 – – Interest on loan – 1,904 – – Management fee – 10,436 – –
– 857,896 – –
expenditureInsurance – 2 32 –Interest expense – 2,150 – – Interest on derivatives – 174 – – Management fee – – 2,258 – Rental and maintenance – 791 – – Other miscellaneous expenses – 56 93 –
– 3,173 2,383 –
amount due from:Money at call and deposit placements – 2,625 – –Others – 179 32 –
– 2,804 32 –
amount due to:Borrowings – 50,164 – –Others – 486 – –
– 50,650 – –
the Group2016 2015
rM’000 rM’000
The approved limit on loans, advances and financing for key management personnel 1,900 2,760
NoteS to tHe FINaNCIaL StateMeNtSfor the financial year ended 30 June 2016

HONG LEONG FINANCIAL GROUP BERHAD ANNUAL REPORT 2016170
47 SIGNIFICaNt reLateD partY traNSaCtIoNS (CoNtINUeD)
(c) Key management personnel
Key management compensation
the Group the Company2016 2015 2016 2015
rM’000 rM’000 rM’000 rM’000
Salaries and other short-term employee 10,162 11,372 5,201 10,946
Units Units Units Units ‘000 ‘000 ‘000 ‘000
Share options balance of the Company – – – –
Included in the above is the Directors’ compensation which is disclosed in Note 37.
Loans made to key management personnel of the Group is on similar terms and conditions generally available to other employees within the Group. No specific allowances were required in financial years 2016 and 2015 for loans made to key management personnel.
48 FINaNCIaL INStrUMeNtS
(a) risk management objectives and policies
The Group’s financial risk management policies are adopted from its main operating subsidiary companies which are involved in banking and finance, securities and insurance related business.
The Board of Directors (“The Board”) of each main operating subsidiary company has the overall responsibility to ensure there is proper oversight of the management of risks in each of the subsidiary company. The Board sets the risk appetite and tolerance level that are consistent with each subsidiary company’s overall business objectives and desired risk profile. A number of committees and dedicated risk management functions have been established to address and manage specific areas of risk and implement various risk management policies and procedures.
Specifically, a Board Audit & Risk Management Committee (“BARMC”) comprising members of the Directors, has been set up to oversee that risk management at all levels is being managed effectively. They, in turn, report all the risk management activities to the Directors.
Commercial Banking
Integrated risk Management (“IrM”)
The Banking Group has implemented an integrated risk management framework with the objective to ensure the overall financial soundness and stability of the Banking Group’s business operations. The Banking Group’s integrated risk management framework outlines the overall governance structure, aspiration, values and risk management strategies that balances between risk profiles and returns objectives. Appropriate methodologies and measurements have been developed to manage uncertainties such that deviations from intended strategic objectives are closely monitored and kept within tolerable levels.
From a governance perspective, the Board has the overall responsibility to define the Banking Group’s risk appetite and ensure that a robust risk management and compliance culture prevails. The Board is assisted by the Board Risk Management Committee (“BRMC”) in approving the Banking Group’s integrated risk management framework as well as the attendant capital management framework, risk appetite statement, risk management strategies and risk policies.
NoteS to tHe FINaNCIaL StateMeNtSfor the financial year ended 30 June 2016

171Corporate / Financials / Additional Information
48 FINaNCIaL INStrUMeNtS (CoNtINUeD)
(a) risk management objectives and policies (continued)
Commercial Banking (continued)
Integrated risk Management (“IrM”) (continued)
Dedicated management level committees are established by the Banking Group to oversee the development and the assessment of effectiveness of risk management policies, to review risk exposures and portfolio composition as well as to ensure appropriate infrastructures, resources and systems are put in place for effective risk management activities.
The BRMC is assisted by the Group Integrated Risk Management and Compliance (“GIRMC”) function, which has been established to provide independent oversight on the adequacy, effectiveness and integrity of risk management practices at all levels within the Banking Group. The core functions of the Banking Group’s risk management are to identify all key risks for the Banking Group, measure these risks, manage the risk positions and determine the optimum capital allocations. The Banking Group regularly reviews its risk management framework to reflect changes in markets, products, regulatory and emerging best market practice.
Credit risk Management
Credit risk is risk of financial loss due to a borrower or counterparty being unable or unwilling to deliver on its payment obligations to the Banking Group, which leads to a loss of revenue and the principal sum. It arises principally from lending, trade finance and treasury activities. The Banking Group has established a credit risk management framework to ensure that exposure to credit risk is kept within the Banking Group’s financial capacity to withstand potential future losses. Lending activities are guided by the internal credit policies and guidelines that are reviewed and concurred by the Management Credit Committee (“MCC”), endorsed by the BRMC and the Board Credit Supervisory Committee (“BCSC”), and approved by the Board. These policies are subject to review and enhancements, at least on an annual basis.
Credit portfolio strategies and significant exposures are reviewed by both the BRMC and the Board. These portfolio strategies are designed to achieve a desired portfolio risk tolerance level and sector distribution.
The Banking Group’s credit approving process encompasses pre-approval evaluation, approval and post-approval evaluation. While the business units are responsible for credit origination, the credit approving function rests mainly with the Credit Evaluation Departments, the MCC and the BCSC. The Board delegates approving and discretionary authority to the MCC and the various personnel of the Bank based on job function and designation.
For any new products, credit risk assessment also forms part of the new product sign-off processes to ensure that the new product complies with the appropriate policies and guidelines, prior to the introduction of the product.
The Banking Group’s exposure to credit risk is mainly from its retail customers, small and medium enterprise (“SME”), commercial and corporate customers. The credit assessment for retail customers is managed on a portfolio basis and the risk scoring models and lending templates are designed to assess the credit worthiness and the likelihood of the obligors to repay their debts. The SME, commercial and corporate customers are individually assessed and assigned with a credit rating, which is based on the assessment of relevant factors such as the customer’s financial position, industry outlook, types of facilities and collaterals offered.
In addition, the Banking Group also conducts periodic stress testing of its credit portfolios to ascertain credit risk impact to capital under the relevant stress scenarios.
Internal Audit conducts independent post approval reviews on sampling basis to ensure that quality of credit appraisals and approval standards are in accordance with the credit standards and the lending policies and directives established and approved by the Banking Group’s management.
NoteS to tHe FINaNCIaL StateMeNtSfor the financial year ended 30 June 2016

HONG LEONG FINANCIAL GROUP BERHAD ANNUAL REPORT 2016172
48 FINaNCIaL INStrUMeNtS (CoNtINUeD)
(a) risk management objectives and policies (continued)
Commercial Banking (continued)
Market risk Management
Market risk is the risk of financial loss arising from exposure to adverse changes in values of financial instruments caused by changes in market prices or rates, which include changes to interest rates.
The Banking Group adopts a systematic approach in managing such risks by types of instruments and nature of exposure. Market risk is primarily controlled via a series of cut-loss limits and potential loss limits, i.e. “Value at Risk” (“VaR”), set in accordance with the size of positions and risk tolerance appetites.
Portfolios held under the Banking Group’s trading books are tracked using daily mark-to-market positions, which are compared against preset limits. The daily tracking of positions is supplemented by sensitivity analysis and stress tests, using VaR and other measurements.
Foreign exchange risks arising from adverse exchange rate movements, is managed by the setting of preset limits, matching of open positions against these pre-set limits and imposition of cut-loss mechanisms.
Interest rate risk exposure is also identified, measured and controlled through limits and procedures, which includes regularly reviewing the interest rate outlook and developing strategies to protect total net interest income from changes in market interest rates. This applies to both interest rate risk exposure in the trading book and in the banking book. In managing the interest rate risk exposure in the banking book, the Banking Group adopts methodologies that measure exposure in both earnings at risk perspective and economic value or capital at risk perspective.
In addition, the Banking Group also conducts periodic and stress testing of its respective portfolios to ascertain market risk under abnormal market conditions.
Liquidity risk Management
Liquidity risk is the risk of financial loss arising from the inability to fund increases in assets and/or meet obligations as they fall due. Financial obligations arise from the withdrawal of deposits, funding of loans committed and repayment of borrowed funds. It is the Banking Group’s policy to ensure there is adequate liquidity across all business units to sustain ongoing operations, as well as sufficient liquidity to fund asset growth and strategic opportunities.
To manage liquidity risk, the Banking Group adopts the BNM’s New Liquidity Framework as one of the liquidity measurement methods. In addition to ensuring compliance with the New Liquidity Framework, the Banking Group maintains a liquidity compliance buffer to meet any unexpected cash outflows.
This is supplemented by the banking subsidiaries’ comprehensive liquidity risk management framework consisting of risk appetite, policies, triggers, limits and controls which are reviewed and concurred by the ALCO, endorsed by the BRMC and approved by the Board. The key elements of the framework cover proactive monitoring and management of cash flow, maintenance of high quality long-term and short-term marketable debt securities as well as diversification of funding base as well as maintains a liquidity compliance buffer to meet any unexpected cash outflows.
The banking subsidiaries’ have in place liquidity contingency funding plans and stress test programs to minimise the liquidity risk that may arise due to unforeseen adverse changes in the marketplace. Contingency funding plans set out the crisis escalation process and the various strategies to be employed to preserve liquidity including an orderly communication channel during liquidity crisis scenarios. Liquidity stress tests are conducted regularly to ensure there is adequate liquidity contingency fund to meet the shortfalls during liquidity crisis scenarios.
NoteS to tHe FINaNCIaL StateMeNtSfor the financial year ended 30 June 2016

173Corporate / Financials / Additional Information
48 FINaNCIaL INStrUMeNtS (CoNtINUeD)
(a) risk management objectives and policies (continued)
Commercial Banking (continued)
Liquidity risk Management (continued)
In addition, the banking subsidiaries’ also monitors the Net Stable Funding Ratio which is one of the key Basel III liquidity ratios in line with the observation period reporting to BNM.
Investment Banking
Risk management is one of the core activities of the Investment Banking Group to strike a balance between sound practices and risk-return. An effective risk management is therefore vital to ensure that the Investment Banking Group conducts its business in a prudent manner to ensure that the risk of potential losses is reduced.
Market risk
Market risk is the risk of loss arising from adverse fluctuation in market prices, such as interest rates, equity prices and foreign currency. The Investment Banking Group monitors all such exposures arising from trading activities of the treasury and stockbroking business activities on a daily basis and management is alerted on the financial impact of these risks. To mitigate market risk, the Investment Banking Group also uses derivative financial instruments.
The Investment Banking Group has in place a set of policies, guidelines, measurement methodologies and control limits which includes Value-at-Risk (“VaR”), Present-Value-Basis-Point (“PVBP”), Management Action Trigger (“MAT”), notional limits and concentration limits to mitigating market risk.
Stress testing is also employed to capture the potential market risk exposures from unexpected market movements. Concerns and significant findings are communicated to the senior management at the Assets and Liabilities Management Committee (“ALMCO”) and to the Board.
Liquidity risk
Liquidity risk is the risk of financial loss arising from the inability to fund increases in assets and/or meet obligations as they fall due. Financial obligations arises from the withdrawal of deposits, funding of loans committed and repayment of borrowed funds. It is the Investment Banking Group’s policy to ensure that there is adequate liquidity across all business units to sustain ongoing operations, as well as sufficient liquidity to fund asset growth and strategic opportunities.
Credit risk
Credit risk, or the risk of counterparties defaulting, is controlled by the application of credit approvals, credit limits and monitoring procedures. Credit risk includes settlement risk, default risk and concentration risk. Exposure to credit risk arises mainly from financing, underwriting, securities and derivative exposures of the Investment Banking Group.
The Investment Banking Group has set out Board approved policies and guidelines for the management of credit risk. To oversee all credit related matters of the Investment Banking Group, the Management Credit and Underwriting Committee (“MCUC”) was setup in 2011 in addition to an independent Credit Department.
The Board has delegated appropriate Delegation of Authority to the MCUC and senior management for the approval of credit facilities. Credit limit setting for Treasury activities are endorsed by the MCUC and approved by the Board at least annually. Adherence to established credit policies, guidelines and limits is monitored daily by the Credit Control Department, Credit Department and the Risk Management Department.
NoteS to tHe FINaNCIaL StateMeNtSfor the financial year ended 30 June 2016

HONG LEONG FINANCIAL GROUP BERHAD ANNUAL REPORT 2016174
48 FINaNCIaL INStrUMeNtS (CoNtINUeD)
(a) risk management objectives and policies (continued)
Insurance
Insurers have to comply with the Malaysian Insurance Act and Regulations, including guidelines on investments. The Board is responsible for formulating policies and overseeing the major risks including those risks associated with the Financial Instruments described below.
The responsibility for the formulation, establishment and approval of the Insurance Group’s investment policy rest with the Board as reported in the Corporate Governance Framework in the Directors’ Report. The deployment and execution of the investment policies is delegated to the Investment Committee (“IC”) in which the members are appointed by the Board. The IC oversees the formulation of investment and risk strategy and asset allocation to determine the optimum risk and return profile.
Risk limits are in place at various levels and monitored by a risk manager to ensure all investment securities are compatible with the Insurance Group’s investment principles and philosophy. Sensitivity and stress tests are carried out on a regular basis to assess the resilience of the investment portfolios and the impact on the Insurance Group’s solvency. An Asset and Liability Management (“ALM”) model is being deployed to address the Insurance Group’s assets and liabilities match. The ALM model will enable management to assess the long-term impact of the investment strategy, asset mix and product pricing strategy on the Insurance Group’s financial ability to meet its future obligations.
actuarial and underwriting risk
Actuarial risks relate to the adequacy of insurance premium rate levels to provide for insurance liabilities and solvency margin and takes into consideration the developments in mortality, morbidity, lapses and expenses.
Underwriting risk represents the risk that claims incurred are higher than anticipated. This is attributable to the nature of risk underwritten, random nature of claims frequency and severity of claims.
The Insurance Group manages the risks through strict underwriting guidelines, which include exclusions, cover limits, loadings and reinsurance programmes. New risks are carefully assessed before an insurance policy is underwritten and issued.
Credit risk
Credit risk is the risk of loss due to inability or unwillingness of an counterparty to service its debt obligations. The credit risk and investment activities is monitored regularly with respect to single customer limit, sectorial exposure, credit rating and residual maturity, in accordance with the investment guidelines and limits approved by the Board of Directors and the authorities.
At the date of the statement of financial position, the credit exposure is within the investment guidelines and limits approved by the Board of Directors and the authorities. The maximum exposure to credit risk is the carrying amount as stated in the financial statements.
Interest rate risk
Investment activities and insurance business are inherently exposed to interest rate risk. This risk arises from differences in pricing or tenure of investments and liabilities. Interest rate risk is managed by targeting a desired return, which is reviewed periodically, based on the Insurance Group’s long-term view on interest rates. Investment activities are managed by appropriate asset allocation, which is regularly reviewed and changed in relation to the investment climate to meet the Insurance Group’s desired return.
NoteS to tHe FINaNCIaL StateMeNtSfor the financial year ended 30 June 2016

175Corporate / Financials / Additional Information
48 FINaNCIaL INStrUMeNtS (CoNtINUeD)
(a) risk management objectives and policies (continued)
Insurance (continued)
Market risk
Adverse changes in the equity market impairs the carrying value of the equity portfolio which could affect the solvency of the Insurance Group. The Board has set internal limits for maximum equity exposure and individual stock exposure, which are consistent with BNM’s guidelines and has also imposed daily trading limits. The Insurance Group’s investment committee decides on the appropriate asset allocation for equities on a regular basis in line with the investment and economic conditions at time of review.
Liquidity risk
Liquidity risk arises due to inability of the Insurance Group to meet its financial obligations as and when they fall due. The risk is managed via a three-year planning process to ascertain operational cash flow requirements and maintaining a reasonable level of liquid assets to meet any unexpected cash flow.
(b) Market risk
Market risk sensitivity assessment is based on the changes in key variables, such as interest rates, foreign currency rates and equity risk, while all other variables remain unchanged. The sensitivity factors used are assumptions based on parallel shifts in the key variables to project the impact on the assets and liabilities position of the Group and the Company as at 30 June 2016.
The scenarios used are simplified whereby it is assumed that all key variables for all maturities move at the same time and by the same magnitude and do not incorporate actions that would be otherwise taken by the business units and risk management to mitigate the effect of this movement in key variables. In reality, the Group and the Company proactively seeks to ensure that the interest rate risk profile is managed to minimise losses and optimise net revenues.
(i) Interest/profit rate risk sensitivity analysis
The interest/profit rate sensitivity results below shows the impact on profit after tax and equity of financial assets or financial liabilities bearing floating interest/profit rates and fixed rate financial assets and financial liabilities.
the Group the CompanyIncrease/(decrease) Increase/(decrease)
Impact on profitafter tax
Impacton equity
Impact on profitafter tax
Impacton equity
rM’000 rM’000 rM’000 rM’000
2016
+100 basis points (‘bps’) 64,335 (352,867) 1,576 –
-100 bps (60,601) 361,346 (1,654) –
2015
+100 bps 79,983 (289,934) 3,974 –
-100 bps (78,301) 296,267 (3,357) –
NoteS to tHe FINaNCIaL StateMeNtSfor the financial year ended 30 June 2016

HONG LEONG FINANCIAL GROUP BERHAD ANNUAL REPORT 2016176
48 FINaNCIaL INStrUMeNtS (CoNtINUeD)
(b) Market risk (continued)
(ii) Foreign currency risk sensitivity analysis
The Group and the Company take on exposure to the effects of fluctuations in the prevailing foreign currency exchange rates on their financial position and cash flows.
The table below sets out the principal structure of foreign exchange exposures (net of investment hedges) of the Group and the Company:
the Group the CompanyNet receivable/(payable) exposure
2016 2015 2016 2015 rM’000 rM’000 rM’000 rM’000
United States Dollar (“USD”) 977,860 306,922 – 11,412 Euro (“EUR”) 50,356 8,801 – – Great Britain Pound (“GBP”) 4,980 85,558 – – Singapore Dollar (“SGD”) 48,269 49,923 – – Chinese Yuan Renminbi (“CNY”) 17,001 155,419 – – Hong Kong Dollar (“HKD”) (379,709) 18,651 – – Japanese Yen (“JPY”) 14,046 15,878 – – Australian Dollar (“AUD”) 20,440 25,432 – – Others 14,358 40,009 – –
767,601 706,593 – 11,412
NoteS to tHe FINaNCIaL StateMeNtSfor the financial year ended 30 June 2016

177Corporate / Financials / Additional Information
48 FINaNCIaL INStrUMeNtS (CoNtINUeD)
(b) Market risk (continued)
(ii) Foreign currency risk sensitivity analysis (continued)
An analysis of the exposures to assess the impact of a one per cent change in the RM exchange rates to the profit after tax are as follows:
the Group the CompanyIncrease/(decrease) Increase/(decrease)
2016 2015 2016 2015 rM’000 rM’000 rM’000 rM’000
+ 1%United States Dollar (“USD”) 4,944 291 – 114 Euro (“EUR”) 9 66 – – Great Britain Pound (“GBP”) 40 418 – – Singapore Dollar (“SGD”) (189) (169) – – Chinese Yuan Renminbi (“CNY”) 129 1,166 – – Hong Kong Dollar (“HKD”) (3,369) (614) – – Japanese Yen (“JPY”) – 1 – – Australian Dollar (“AUD”) 50 125 – – Others 101 143 – –
1,715 1,427 – 114
- 1%United States Dollar (“USD”) (4,944) (291) – (114)Euro (“EUR”) (9) (66) – – Great Britain Pound (“GBP”) (40) (418) – – Singapore Dollar (“SGD”) 189 169 – – Chinese Yuan Renminbi (“CNY”) (129) (1,166) – – Hong Kong Dollar (“HKD”) 3,369 614 – – Japanese Yen (“JPY”) – (1) – – Australian Dollar (“AUD”) (50) (125) – – Others (101) (143) – –
(1,715) (1,427) – (114)
NoteS to tHe FINaNCIaL StateMeNtSfor the financial year ended 30 June 2016

HONG LEONG FINANCIAL GROUP BERHAD ANNUAL REPORT 2016178
48 FINaNCIaL INStrUMeNtS (CoNtINUeD)
(b) Market risk (continued)
(iii) equity risk
Equity risk refers to the impact of change in equity positions held by the Group for yield purposes.
the GroupIncrease/(decrease)
Impact on profitafter tax
Impacton equity
rM’000 rM’000
2016
+ 20% change in equity market price 10,404 53,621
- 20% change in equity market price (10,404) (53,621)
2015
+ 20% change in equity market price 5,642 100,146
- 20% change in equity market price (5,642) (100,146)
NoteS to tHe FINaNCIaL StateMeNtSfor the financial year ended 30 June 2016
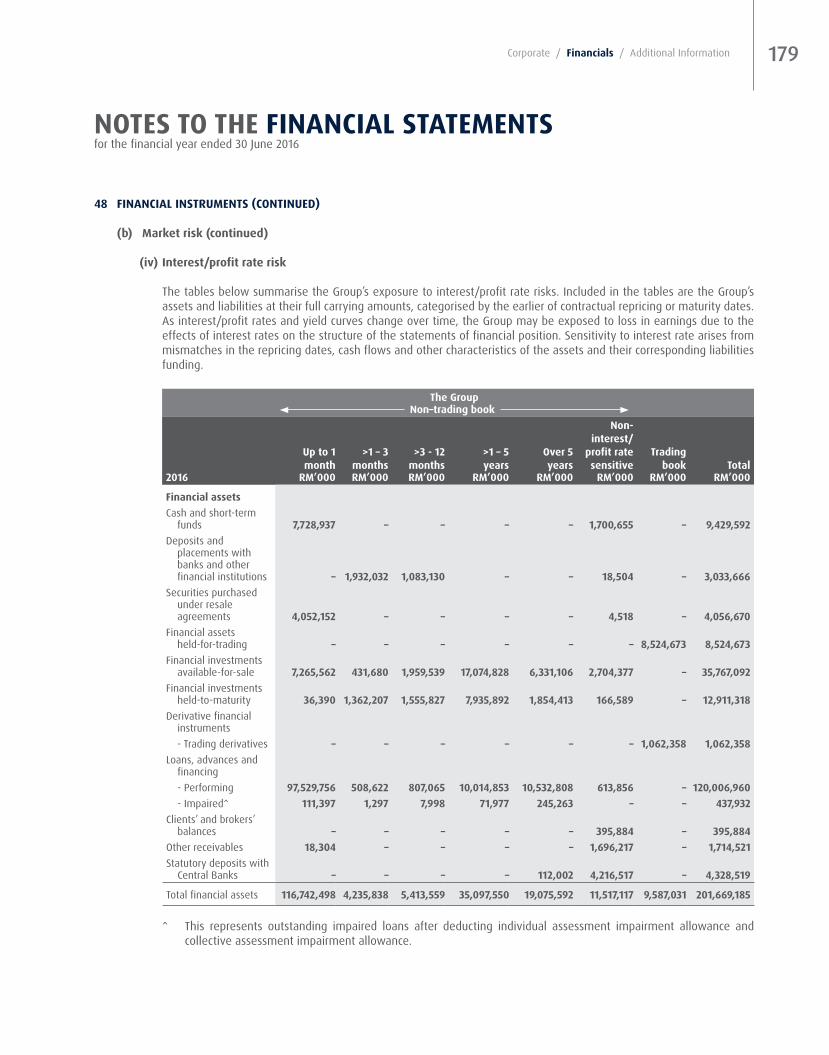
179Corporate / Financials / Additional Information
48 FINaNCIaL INStrUMeNtS (CoNtINUeD)
(b) Market risk (continued)
(iv) Interest/profit rate risk
The tables below summarise the Group’s exposure to interest/profit rate risks. Included in the tables are the Group’s assets and liabilities at their full carrying amounts, categorised by the earlier of contractual repricing or maturity dates. As interest/profit rates and yield curves change over time, the Group may be exposed to loss in earnings due to the effects of interest rates on the structure of the statements of financial position. Sensitivity to interest rate arises from mismatches in the repricing dates, cash flows and other characteristics of the assets and their corresponding liabilities funding.
the Group Non–trading book
Up to 1 month
>1 – 3 months
>3 - 12 months
>1 – 5 years
over 5 years
Non-interest/
profit rate sensitive
trading book total
2016 rM’000 rM’000 rM’000 rM’000 rM’000 rM’000 rM’000 rM’000
Financial assetsCash and short-term
funds 7,728,937 – – – – 1,700,655 – 9,429,592Deposits and
placements with banks and other financial institutions – 1,932,032 1,083,130 – – 18,504 – 3,033,666
Securities purchased under resale agreements 4,052,152 – – – – 4,518 – 4,056,670
Financial assets held-for-trading – – – – – – 8,524,673 8,524,673
Financial investments available-for-sale 7,265,562 431,680 1,959,539 17,074,828 6,331,106 2,704,377 – 35,767,092
Financial investments held-to-maturity 36,390 1,362,207 1,555,827 7,935,892 1,854,413 166,589 – 12,911,318
Derivative financial instruments- Trading derivatives – – – – – – 1,062,358 1,062,358
Loans, advances and financing- Performing 97,529,756 508,622 807,065 10,014,853 10,532,808 613,856 – 120,006,960- Impaired^ 111,397 1,297 7,998 71,977 245,263 – – 437,932
Clients’ and brokers’ balances – – – – – 395,884 – 395,884
Other receivables 18,304 – – – – 1,696,217 – 1,714,521 Statutory deposits with
Central Banks – – – – 112,002 4,216,517 – 4,328,519
Total financial assets 116,742,498 4,235,838 5,413,559 35,097,550 19,075,592 11,517,117 9,587,031 201,669,185
^ This represents outstanding impaired loans after deducting individual assessment impairment allowance and collective assessment impairment allowance.
NoteS to tHe FINaNCIaL StateMeNtSfor the financial year ended 30 June 2016

HONG LEONG FINANCIAL GROUP BERHAD ANNUAL REPORT 2016180
48 FINaNCIaL INStrUMeNtS (CoNtINUeD)
(b) Market risk (continued)
(iv) Interest/profit rate risk (continued)
The tables below summarise the Group’s exposure to interest/profit rate risks. Included in the tables are the Group’s assets and liabilities at their full carrying amounts, categorised by the earlier of contractual repricing or maturity dates. As interest/profit rates and yield curves change over time, the Group may be exposed to loss in earnings due to the effects of interest rates on the structure of the statements of financial position. Sensitivity to interest rate arises from mismatches in the repricing dates, cash flows and other characteristics of the assets and their corresponding liabilities funding. (continued)
the Group Non–trading book
Up to 1 month
>1 – 3 months
>3 - 12 months
>1 – 5 years
over 5 years
Non-interest/
profit rate sensitive
trading book total
2016 rM’000 rM’000 rM’000 rM’000 rM’000 rM’000 rM’000 rM’000
Financial liabilitiesDeposits from customers 64,260,295 23,993,880 36,842,186 3,741,330 514,452 20,138,390 – 149,490,533Deposits and placements of
banks and other financial institutions 4,934,009 2,974,993 188,879 – – 8,119 – 8,106,000
Obligations on securities sold under repurchase agreements 1,789,407 1,700,606 – – – 4,890 – 3,494,903
Bills and acceptance payable 51,034 26,062 15,159 – – 258,200 – 350,455Derivative financial
instruments- Trading derivatives – – – – – – 1,651,964 1,651,964- Hedging derivatives – – – 2,261 – – – 2,261
Clients’ and brokers’ balances – – – – – 279,919 – 279,919
Payables and other liabilities – – – – – 5,988,684 – 5,988,684Provision for claims – – – – – 141,175 – 141,175Borrowings 1,219,730 – 1,308,082 650,000 – 14,107 – 3,191,919Subordinated obligations – – – 2,398,581 548,220 11,840 – 2,958,641Innovative Tier 1 capital
securities – – – 508,741 – 12,771 – 521,512Insurance funds – – – – – 10,628,680 – 10,628,680
Total financial liabilities 72,254,475 28,695,541 38,354,306 7,300,913 1,062,672 37,486,775 1,651,964 186,806,646
Net interest sensitivity gap 44,488,023 (24,459,703) (32,940,747) 27,796,637 18,012,920
Financial guarantees – – – – – 541,524Credit related commitments
and contingencies – – – – – 41,830,685Treasury related
commitments and contingencies (hedging) – – – 200,000 – –
Net interest sensitivity gap – – – 200,000 – 42,372,209
NoteS to tHe FINaNCIaL StateMeNtSfor the financial year ended 30 June 2016
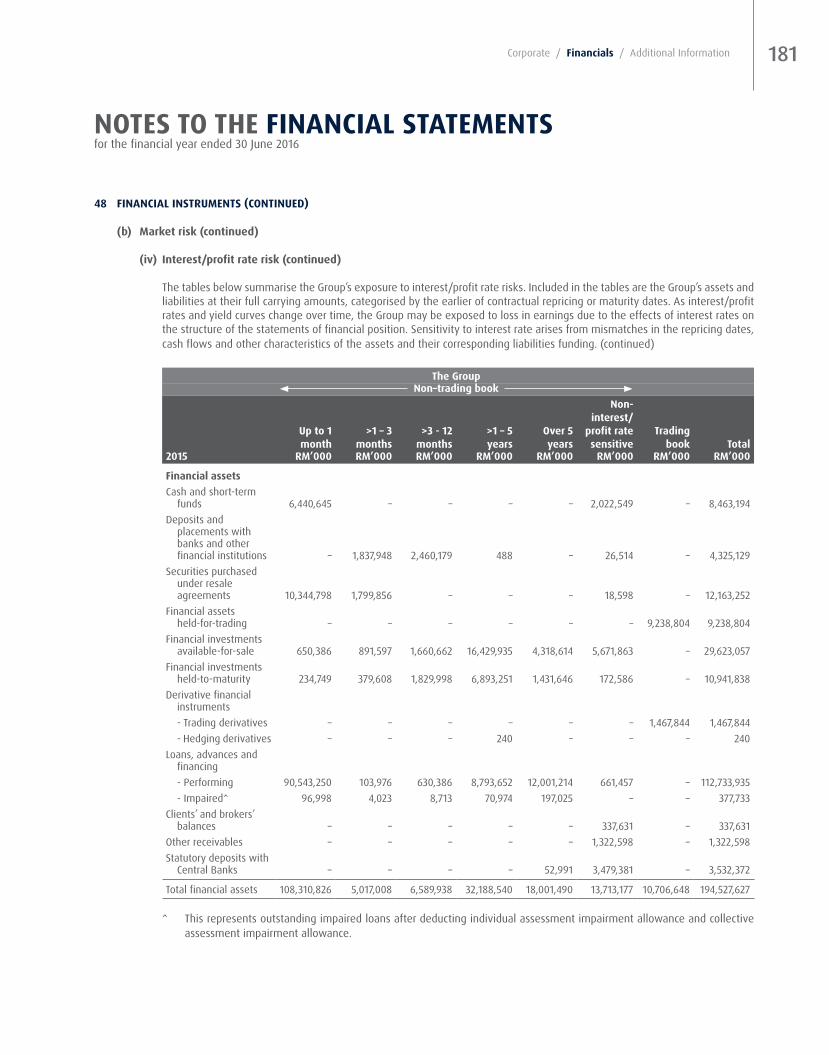
181Corporate / Financials / Additional Information
48 FINaNCIaL INStrUMeNtS (CoNtINUeD)
(b) Market risk (continued)
(iv) Interest/profit rate risk (continued)
The tables below summarise the Group’s exposure to interest/profit rate risks. Included in the tables are the Group’s assets and liabilities at their full carrying amounts, categorised by the earlier of contractual repricing or maturity dates. As interest/profit rates and yield curves change over time, the Group may be exposed to loss in earnings due to the effects of interest rates on the structure of the statements of financial position. Sensitivity to interest rate arises from mismatches in the repricing dates, cash flows and other characteristics of the assets and their corresponding liabilities funding. (continued)
the Group Non–trading book
Up to 1 month
>1 – 3 months
>3 - 12 months
>1 – 5 years
over 5 years
Non-interest/
profit rate sensitive
trading book total
2015 rM’000 rM’000 rM’000 rM’000 rM’000 rM’000 rM’000 rM’000
Financial assetsCash and short-term
funds 6,440,645 – – – – 2,022,549 – 8,463,194Deposits and
placements with banks and other financial institutions – 1,837,948 2,460,179 488 – 26,514 – 4,325,129
Securities purchased under resale agreements 10,344,798 1,799,856 – – – 18,598 – 12,163,252
Financial assets held-for-trading – – – – – – 9,238,804 9,238,804
Financial investments available-for-sale 650,386 891,597 1,660,662 16,429,935 4,318,614 5,671,863 – 29,623,057
Financial investments held-to-maturity 234,749 379,608 1,829,998 6,893,251 1,431,646 172,586 – 10,941,838
Derivative financial instruments- Trading derivatives – – – – – – 1,467,844 1,467,844- Hedging derivatives – – – 240 – – – 240
Loans, advances and financing- Performing 90,543,250 103,976 630,386 8,793,652 12,001,214 661,457 – 112,733,935- Impaired^ 96,998 4,023 8,713 70,974 197,025 – – 377,733
Clients’ and brokers’ balances – – – – – 337,631 – 337,631
Other receivables – – – – – 1,322,598 – 1,322,598 Statutory deposits with
Central Banks – – – – 52,991 3,479,381 – 3,532,372
Total financial assets 108,310,826 5,017,008 6,589,938 32,188,540 18,001,490 13,713,177 10,706,648 194,527,627
^ This represents outstanding impaired loans after deducting individual assessment impairment allowance and collective assessment impairment allowance.
NoteS to tHe FINaNCIaL StateMeNtSfor the financial year ended 30 June 2016

HONG LEONG FINANCIAL GROUP BERHAD ANNUAL REPORT 2016182
48 FINaNCIaL INStrUMeNtS (CoNtINUeD)
(b) Market risk (continued)
(iv) Interest/profit rate risk (continued)
The tables below summarise the Group’s exposure to interest/profit rate risks. Included in the tables are the Group’s assets and liabilities at their full carrying amounts, categorised by the earlier of contractual repricing or maturity dates. As interest/profit rates and yield curves change over time, the Group may be exposed to loss in earnings due to the effects of interest rates on the structure of the statements of financial position. Sensitivity to interest rate arises from mismatches in the repricing dates, cash flows and other characteristics of the assets and their corresponding liabilities funding. (continued)
the Group Non–trading book
Up to 1 month
>1 – 3 months
>3 - 12 months
>1 – 5 years
over 5 years
Non-interest/
profit rate sensitive
trading book total
2015 rM’000 rM’000 rM’000 rM’000 rM’000 rM’000 rM’000 rM’000
Financial liabilitiesDeposits from customers 54,355,313 24,881,619 37,491,841 3,330,179 679,024 20,217,489 – 140,955,465Deposits and placements of
banks and other financial institutions 6,455,660 1,992,226 487,421 – – 8,315 – 8,943,622
Obligations on securities sold under repurchase agreements 1,274,795 1,992,378 421,285 – – 2,880 – 3,691,338
Bills and acceptance payable 1,077,780 517,585 16,960 – – 288,642 – 1,900,967Derivative financial
instruments- Trading derivatives – – – – – – 1,369,341 1,369,341- Hedging derivatives – – – 24 – – – 24
Clients’ and brokers’ balances – – – – – 192,728 – 192,728Payables and other liabilities – – – – – 5,645,173 – 5,645,173Provision for claims – – – – – 128,905 – 128,905Borrowings 460,000 – 1,131,329 1,485,650 – 19,903 – 3,096,882Subordinated obligations – 699,998 1,499,379 2,397,536 532,344 31,998 – 5,161,255Non-Innovative Tier 1
stapled securities – – 1,399,828 – – 11,041 – 1,410,869Innovative Tier 1 capital
securities – – – 517,452 – 12,771 – 530,223Insurance funds – – – – – 9,457,257 – 9,457,257
Total financial liabilities 63,623,548 30,083,806 42,448,043 7,730,841 1,211,368 36,017,102 1,369,341 182,484,049
Net interest sensitivity gap 44,687,278 (25,066,798) (35,858,105) 24,457,699 16,790,122
Financial guarantees – – – – – 620,341Credit related commitments
and contingencies – – – – – 43,575,122Treasury related
commitments and contingencies (hedging) – – – 200,000 – –
Net interest sensitivity gap – – – 200,000 – 44,195,463
NoteS to tHe FINaNCIaL StateMeNtSfor the financial year ended 30 June 2016
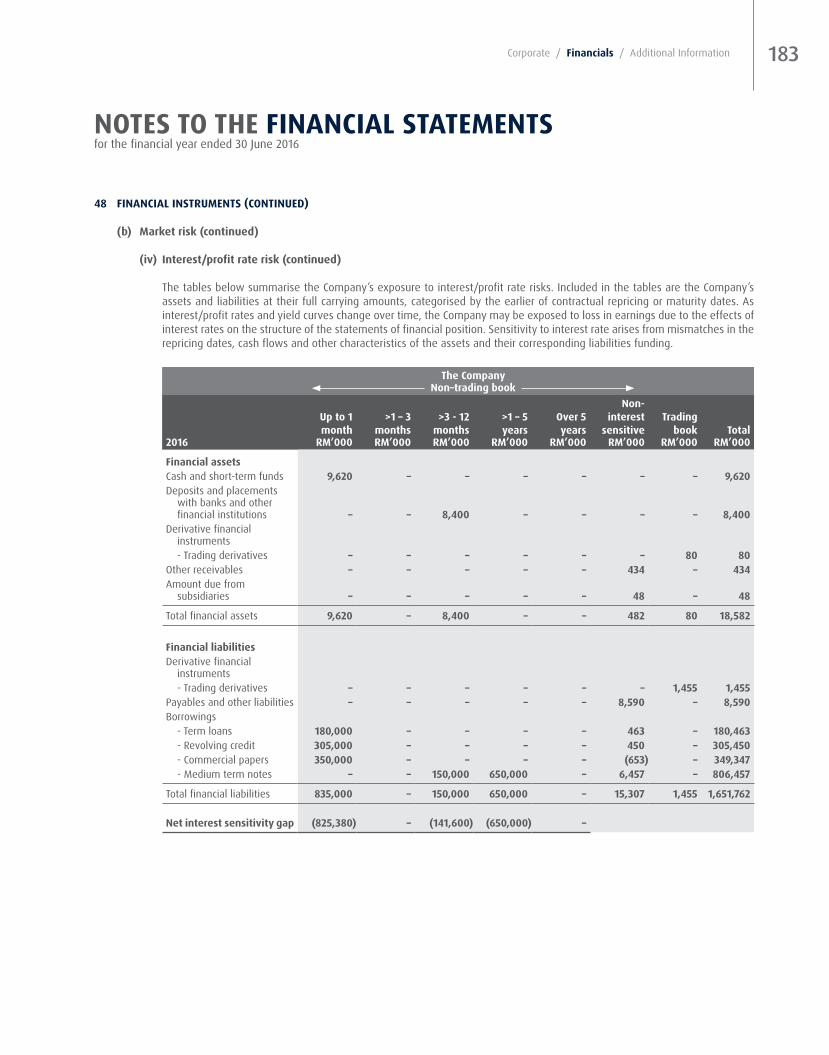
183Corporate / Financials / Additional Information
48 FINaNCIaL INStrUMeNtS (CoNtINUeD)
(b) Market risk (continued)
(iv) Interest/profit rate risk (continued)
The tables below summarise the Company’s exposure to interest/profit rate risks. Included in the tables are the Company’s assets and liabilities at their full carrying amounts, categorised by the earlier of contractual repricing or maturity dates. As interest/profit rates and yield curves change over time, the Company may be exposed to loss in earnings due to the effects of interest rates on the structure of the statements of financial position. Sensitivity to interest rate arises from mismatches in the repricing dates, cash flows and other characteristics of the assets and their corresponding liabilities funding.
the Company Non–trading book
Up to 1 month
>1 – 3 months
>3 - 12 months
>1 – 5 years
over 5 years
Non-interest
sensitive trading
book total 2016 rM’000 rM’000 rM’000 rM’000 rM’000 rM’000 rM’000 rM’000
Financial assetsCash and short-term funds 9,620 – – – – – – 9,620 Deposits and placements
with banks and other financial institutions – – 8,400 – – – – 8,400
Derivative financial instruments- Trading derivatives – – – – – – 80 80
Other receivables – – – – – 434 – 434Amount due from
subsidiaries – – – – – 48 – 48
Total financial assets 9,620 – 8,400 – – 482 80 18,582
Financial liabilitiesDerivative financial
instruments- Trading derivatives – – – – – – 1,455 1,455
Payables and other liabilities – – – – – 8,590 – 8,590 Borrowings
- Term loans 180,000 – – – – 463 – 180,463 - Revolving credit 305,000 – – – – 450 – 305,450 - Commercial papers 350,000 – – – – (653) – 349,347 - Medium term notes – – 150,000 650,000 – 6,457 – 806,457
Total financial liabilities 835,000 – 150,000 650,000 – 15,307 1,455 1,651,762
Net interest sensitivity gap (825,380) – (141,600) (650,000) –
NoteS to tHe FINaNCIaL StateMeNtSfor the financial year ended 30 June 2016

HONG LEONG FINANCIAL GROUP BERHAD ANNUAL REPORT 2016184
48 FINaNCIaL INStrUMeNtS (CoNtINUeD)
(b) Market risk (continued)
(iv) Interest/profit rate risk (continued)
The tables below summarise the Company’s exposure to interest/profit rate risks. Included in the tables are the Company’s assets and liabilities at their full carrying amounts, categorised by the earlier of contractual repricing or maturity dates. As interest/profit rates and yield curves change over time, the Company may be exposed to loss in earnings due to the effects of interest rates on the structure of the statements of financial position. Sensitivity to interest rate arises from mismatches in the repricing dates, cash flows and other characteristics of the assets and their corresponding liabilities funding. (continued)
the Company Non–trading book
Up to 1 month
>1 – 3 months
>3 - 12 months
>1 – 5 years
over 5 years
Non-interest
sensitive trading
book total 2015 rM’000 rM’000 rM’000 rM’000 rM’000 rM’000 rM’000 rM’000
Financial assetsCash and short-term funds 8,345 – – – – – – 8,345 Deposits and placements
with banks and other financial institutions – – 8,400 488 – – – 8,888
Derivative financial instruments- Trading derivatives – – – – – – 126 126
Other receivables – – – – – 324 – 324 Amount due from
subsidiaries – – – – – 179 – 179
Total financial assets 8,345 – 8,400 488 – 503 126 17,862
Financial liabilitiesDerivative financial
instruments- Trading derivatives – – – – – – 1,158 1,158
Payables and other liabilities – – – – – 10,332 – 10,332 Borrowings
- Term loans 85,000 – – – – 72 – 85,072 - Revolving credit – – – – – – – – - Commercial papers 375,000 – – – – (764) – 374,236 - Medium term notes – – – 400,000 – 1,358 – 401,358
Total financial liabilities 460,000 – – 400,000 – 10,998 1,158 872,156
Net interest sensitivity gap (451,655) – 8,400 (399,512) –
NoteS to tHe FINaNCIaL StateMeNtSfor the financial year ended 30 June 2016

185Corporate / Financials / Additional Information
48 FINaNCIaL INStrUMeNtS (CoNtINUeD)
(c) Liquidity risk
Liquidity risk is defined as the current and prospective risk arising from the inability of the Group and the Company to meet its contractual or regulatory obligations when they become due without incurring substantial losses. The liquidity risk is identified based on concentration, volatility of source of fund and funding maturity structure and it is measured primarily using Bank Negara Malaysia’s New Liquidity Framework and depositor’s concentration ratios. The Group and the Company seek to project, monitor and manage its liquidity needs under normal as well as adverse circumstances.
The table below analyses the carrying amount of assets and liabilities (include non-financial instruments) as at 30 June 2016 based on the remaining contractual maturity:
the GroupUp to 1 week to 1 to 3 3 to 6 6 to 12 over 1 No specific
1 week 1 month months months months year maturity total2016 rM’000 rM’000 rM’000 rM’000 rM’000 rM’000 rM’000 rM’000
assetsCash and short-term funds 7,469,879 1,957,109 – – – – 2,604 9,429,592Deposits and placements with
banks and other financial institutions – – 1,934,961 859,301 239,404 – – 3,033,666
Securities purchased under resale agreements – 4,056,670 – – – – – 4,056,670
Financial assets held-for-trading 72,353 2,295,835 2,303,320 90,384 2,916 2,974,458 785,407 8,524,673
Financial investments available-for-sale 7,157,135 118,016 436,006 694,516 960,438 23,942,938 2,458,043 35,767,092
Financial investments held-to-maturity 16,435 20,373 1,379,218 923,763 640,976 9,930,553 – 12,911,318
Derivative financial instruments 110,402 85,251 79,217 70,124 48,698 668,666 – 1,062,358
Loans, advances and financing 11,256,845 6,148,011 5,812,698 2,813,164 1,299,092 93,115,082 – 120,444,892Clients’ and brokers’ balances 197,034 – – – 198,850 – – 395,884Other receivables 1,113,595 26,122 12,871 8,304 117,212 20,965 517,759 1,816,828Statutory deposits with
Central Banks – – – – – – 4,328,519 4,328,519Tax recoverable – – – – – – 29,011 29,011Investment in associated
companies – – – – – – 3,982,091 3,982,091Investment in joint ventures – – – – – – 145,183 145,183Property and equipment – – – – – – 1,849,202 1,849,202Investment properties – – – – – – 1,940 1,940Goodwill – – – – – – 2,410,644 2,410,644Intangible assets – – – – – – 284,971 284,971
Total assets 27,393,678 14,707,387 11,958,291 5,459,556 3,507,586 130,652,662 16,795,374 210,474,534
NoteS to tHe FINaNCIaL StateMeNtSfor the financial year ended 30 June 2016

HONG LEONG FINANCIAL GROUP BERHAD ANNUAL REPORT 2016186
48 FINaNCIaL INStrUMeNtS (CoNtINUeD)
(c) Liquidity risk (continued)
The table below analyses the carrying amount of assets and liabilities (include non-financial instruments) as at 30 June 2016 based on the remaining contractual maturity: (continued)
the GroupUp to 1 week to 1 to 3 3 to 6 6 to 12 over 1 No specific
1 week 1 month months months months year maturity total2016 rM’000 rM’000 rM’000 rM’000 rM’000 rM’000 rM’000 rM’000
LiabilitiesDeposits from
customers 48,810,978 35,338,385 23,852,338 20,155,934 16,842,166 4,490,732 – 149,490,533Deposits and
placements of banks and other financial institutions 2,930,267 1,848,668 3,018,108 212,022 96,935 – – 8,106,000
Obligations on securities sold under repurchase agreements 230,836 1,562,179 1,701,888 – – – – 3,494,903
Bills and acceptances payable 43,503 7,531 26,062 15,155 4 – 258,200 350,455
Derivative financial instruments 67,119 78,105 177,053 202,384 105,189 1,024,375 – 1,654,225
Clients’ and brokers’ balances 279,919 – – – – – – 279,919
Payables and other liabilities 3,664,225 1,679 2,270 766 2,395,114 197 173,571 6,237,822
Provision for claims – – – – 141,175 – – 141,175Provision for taxation – – – – 7,704 – 31,653 39,357Deferred tax liabilities – – – – 1,005 179,055 22,177 202,237Borrowings – 835,260 – 104,497 1,215,643 1,034,730 1,789 3,191,919Subordinated
obligations – – 8,692 – – 2,949,949 – 2,958,641Innovative Tier 1
capital securities – – – – – 521,512 – 521,512Insurance funds* – – – – 1,430,011 8,952,892 – 10,382,903
Total liabilities 56,026,847 39,671,807 28,786,411 20,690,758 22,234,946 19,153,442 487,390 187,051,601
Total equity – – – – – – 23,177,156 23,177,156
Total liabilities and equity 56,026,847 39,671,807 28,786,411 20,690,758 22,234,946 19,153,442
23,664,546
210,228,757
Net liquidity gap (28,633,169) (24,964,420) (16,828,120) (15,231,202) (18,727,360) 111,499,220
* Excluding AFS Reserve
NoteS to tHe FINaNCIaL StateMeNtSfor the financial year ended 30 June 2016
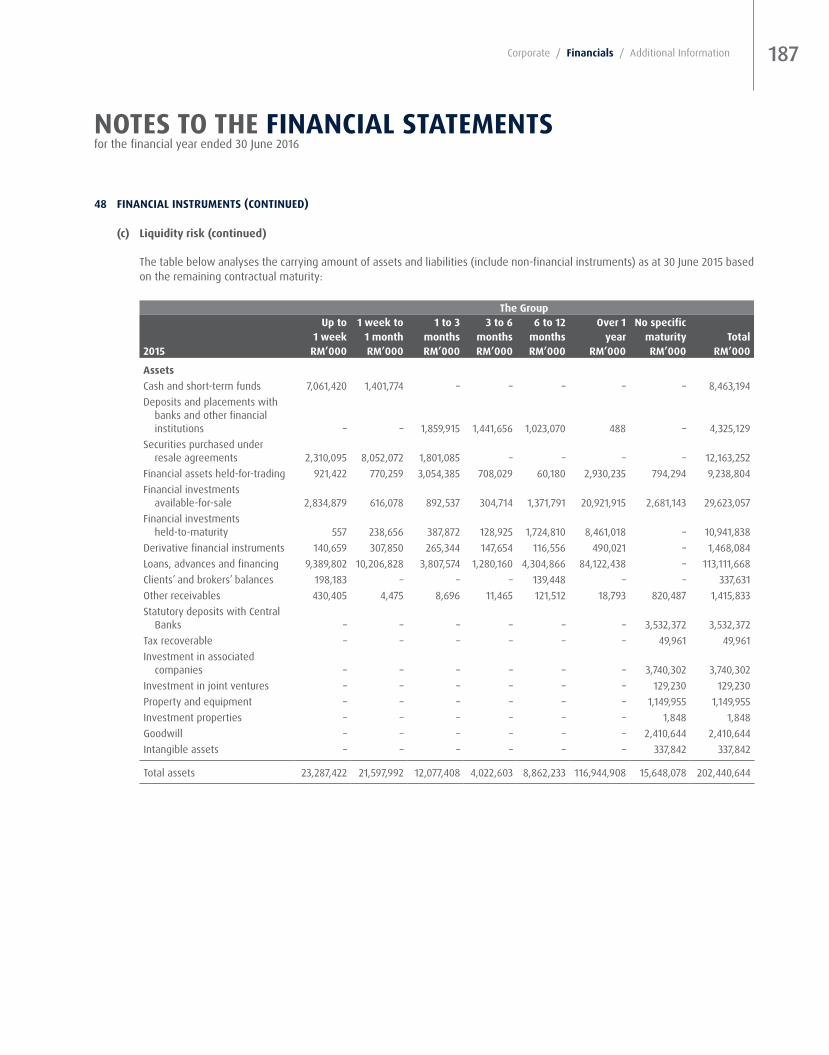
187Corporate / Financials / Additional Information
48 FINaNCIaL INStrUMeNtS (CoNtINUeD)
(c) Liquidity risk (continued)
The table below analyses the carrying amount of assets and liabilities (include non-financial instruments) as at 30 June 2015 based on the remaining contractual maturity:
the GroupUp to 1 week to 1 to 3 3 to 6 6 to 12 over 1 No specific
1 week 1 month months months months year maturity total2015 rM’000 rM’000 rM’000 rM’000 rM’000 rM’000 rM’000 rM’000
assetsCash and short-term funds 7,061,420 1,401,774 – – – – – 8,463,194 Deposits and placements with
banks and other financial institutions – – 1,859,915 1,441,656 1,023,070 488 – 4,325,129
Securities purchased under resale agreements 2,310,095 8,052,072 1,801,085 – – – – 12,163,252
Financial assets held-for-trading 921,422 770,259 3,054,385 708,029 60,180 2,930,235 794,294 9,238,804 Financial investments
available-for-sale 2,834,879 616,078 892,537 304,714 1,371,791 20,921,915 2,681,143 29,623,057 Financial investments
held-to-maturity 557 238,656 387,872 128,925 1,724,810 8,461,018 – 10,941,838 Derivative financial instruments 140,659 307,850 265,344 147,654 116,556 490,021 – 1,468,084 Loans, advances and financing 9,389,802 10,206,828 3,807,574 1,280,160 4,304,866 84,122,438 – 113,111,668 Clients’ and brokers’ balances 198,183 – – – 139,448 – – 337,631 Other receivables 430,405 4,475 8,696 11,465 121,512 18,793 820,487 1,415,833 Statutory deposits with Central
Banks – – – – – – 3,532,372 3,532,372 Tax recoverable – – – – – – 49,961 49,961 Investment in associated
companies – – – – – – 3,740,302 3,740,302 Investment in joint ventures – – – – – – 129,230 129,230 Property and equipment – – – – – – 1,149,955 1,149,955 Investment properties – – – – – – 1,848 1,848 Goodwill – – – – – – 2,410,644 2,410,644 Intangible assets – – – – – – 337,842 337,842
Total assets 23,287,422 21,597,992 12,077,408 4,022,603 8,862,233 116,944,908 15,648,078 202,440,644
NoteS to tHe FINaNCIaL StateMeNtSfor the financial year ended 30 June 2016
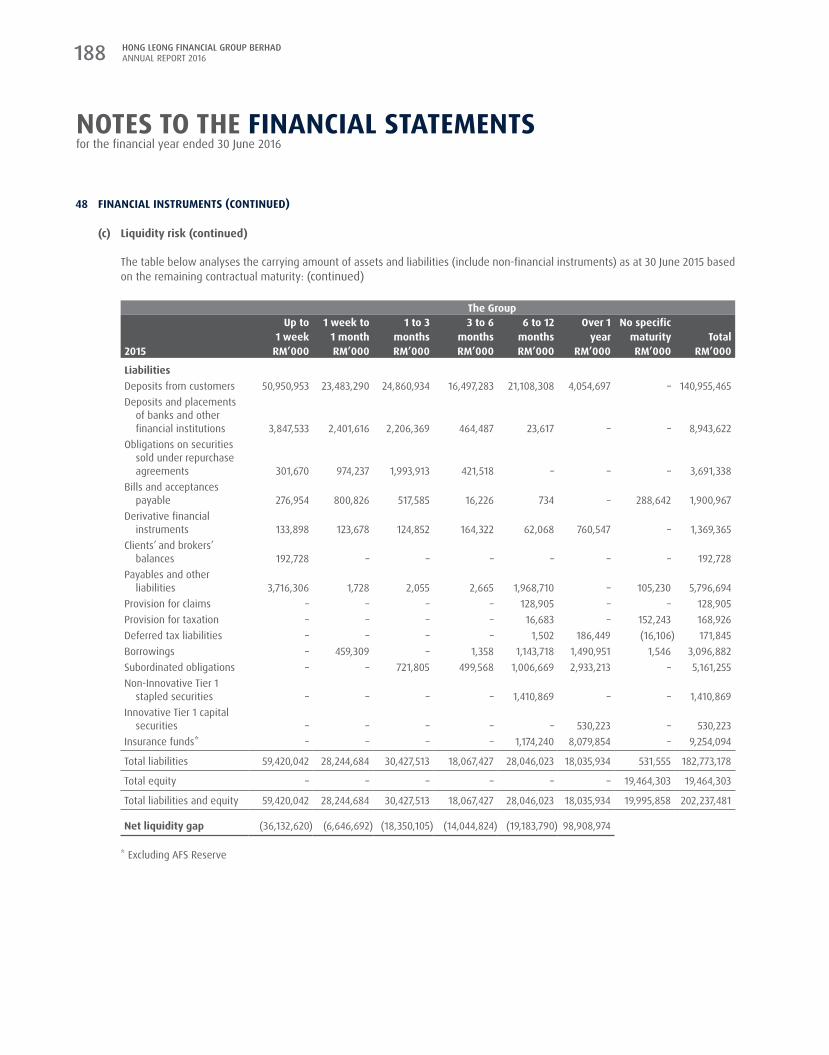
HONG LEONG FINANCIAL GROUP BERHAD ANNUAL REPORT 2016188
48 FINaNCIaL INStrUMeNtS (CoNtINUeD)
(c) Liquidity risk (continued)
The table below analyses the carrying amount of assets and liabilities (include non-financial instruments) as at 30 June 2015 based on the remaining contractual maturity: (continued)
the GroupUp to 1 week to 1 to 3 3 to 6 6 to 12 over 1 No specific
1 week 1 month months months months year maturity total2015 rM’000 rM’000 rM’000 rM’000 rM’000 rM’000 rM’000 rM’000
LiabilitiesDeposits from customers 50,950,953 23,483,290 24,860,934 16,497,283 21,108,308 4,054,697 – 140,955,465Deposits and placements
of banks and other financial institutions 3,847,533 2,401,616 2,206,369 464,487 23,617 – – 8,943,622
Obligations on securities sold under repurchase agreements 301,670 974,237 1,993,913 421,518 – – – 3,691,338
Bills and acceptances payable 276,954 800,826 517,585 16,226 734 – 288,642 1,900,967
Derivative financial instruments 133,898 123,678 124,852 164,322 62,068 760,547 – 1,369,365
Clients’ and brokers’ balances 192,728 – – – – – – 192,728
Payables and other liabilities 3,716,306 1,728 2,055 2,665 1,968,710 – 105,230 5,796,694
Provision for claims – – – – 128,905 – – 128,905Provision for taxation – – – – 16,683 – 152,243 168,926Deferred tax liabilities – – – – 1,502 186,449 (16,106) 171,845Borrowings – 459,309 – 1,358 1,143,718 1,490,951 1,546 3,096,882Subordinated obligations – – 721,805 499,568 1,006,669 2,933,213 – 5,161,255Non-Innovative Tier 1
stapled securities – – – – 1,410,869 – – 1,410,869Innovative Tier 1 capital
securities – – – – – 530,223 – 530,223Insurance funds* – – – – 1,174,240 8,079,854 – 9,254,094
Total liabilities 59,420,042 28,244,684 30,427,513 18,067,427 28,046,023 18,035,934 531,555 182,773,178
Total equity – – – – – – 19,464,303 19,464,303
Total liabilities and equity 59,420,042 28,244,684 30,427,513 18,067,427 28,046,023 18,035,934 19,995,858 202,237,481
Net liquidity gap (36,132,620) (6,646,692) (18,350,105) (14,044,824) (19,183,790) 98,908,974
* Excluding AFS Reserve
NoteS to tHe FINaNCIaL StateMeNtSfor the financial year ended 30 June 2016

189Corporate / Financials / Additional Information
48 FINaNCIaL INStrUMeNtS (CoNtINUeD)
(c) Liquidity risk (continued)
The table below analyses the carrying amount of assets and liabilities (include non-financial instruments) as at 30 June 2016 based on the remaining contractual maturity:
the Company
Up to 1 week to 1 to 3 3 to 6 6 to 12 over 1No
specific1 week 1 month months months months year maturity total
2016 rM’000 rM’000 rM’000 rM’000 rM’000 rM’000 rM’000 rM’000
assetsCash and short-term funds 9,620 – – – – – – 9,620 Deposits and placements with
banks and other financial institutions – – – 8,400 – – – 8,400
Derivative financial instruments – – – – – 80 – 80 Other receivables – – – – – – 639 639 Amount due from subsidiaries – – – – – – 48 48 Tax recoverable – – – – – – 2,729 2,729 Investment in subsidiary
companies – – – – – – 16,915,160 16,915,160 Deferred tax assets – – – – – – 330 330 Property and equipment – – – – – – 1,729 1,729 Intangible assets – – – – – – 106 106
Total assets 9,620 – – 8,400 – 80 16,920,741 16,938,841
LiabilitiesDerivative financial instruments – – – – – 1,455 – 1,455 Payables and other liabilities – – – – – – 9,351 9,351 Borrowings
- Term loans – 180,463 – – – – – 180,463 - Revolving credits – 305,450 – – – – – 305,450 - Commercial papers – 349,347 – – – – – 349,347 - Medium term notes – – – 156,457 – 650,000 – 806,457
Total liabilities – 835,260 – 156,457 – 651,455 9,351 1,652,523
Net liquidity gap 9,620 (835,260) – (148,057) – (651,375)
NoteS to tHe FINaNCIaL StateMeNtSfor the financial year ended 30 June 2016

HONG LEONG FINANCIAL GROUP BERHAD ANNUAL REPORT 2016190
48 FINaNCIaL INStrUMeNtS (CoNtINUeD)
(c) Liquidity risk (continued)
The table below analyses the carrying amount of assets and liabilities (include non-financial instruments) as at 30 June 2015 based on the remaining contractual maturity:
the Company
Up to 1 week to 1 to 3 3 to 6 6 to 12 over 1No
specific1 week 1 month months months months year maturity total
2015 rM’000 rM’000 rM’000 rM’000 rM’000 rM’000 rM’000 rM’000
assetsCash and short-term funds 7,445 900 – – – – – 8,345 Deposits and placements with banks
and other financial institutions – – – 8,400 – 488 – 8,888 Derivative financial instruments – – – – – 126 – 126 Other receivables – – – – – – 609 609 Amount due from subsidiaries – – – – – – 179 179 Tax recoverable – – – – – – 9,771 9,771 Investment in subsidiary companies – – – – – – 15,007,609 15,007,609 Deferred tax assets – – – – – – 2,170 2,170 Property and equipment – – – – – – 2,375 2,375 Intangible asset – – – – – – 213 213
Total assets 7,445 900 – 8,400 – 614 15,022,926 15,040,285
LiabilitiesDerivative financial instruments – – – – – 1,158 – 1,158 Payables and other liabilities – – – – – – 11,103 11,103 Amount due to subsidiaries – – – – – – – – Borrowings
- Term loans – 85,072 – – – – – 85,072 - Revolving credits – – – – – – – – - Commercial papers – 374,236 – – – – – 374,236 - Medium term notes – – – 1,358 – 400,000 – 401,358
Total liabilities – 459,308 – 1,358 – 401,158 11,103 872,927
Net liquidity gap 7,445 (458,408) – 7,042 – (400,544)
NoteS to tHe FINaNCIaL StateMeNtSfor the financial year ended 30 June 2016
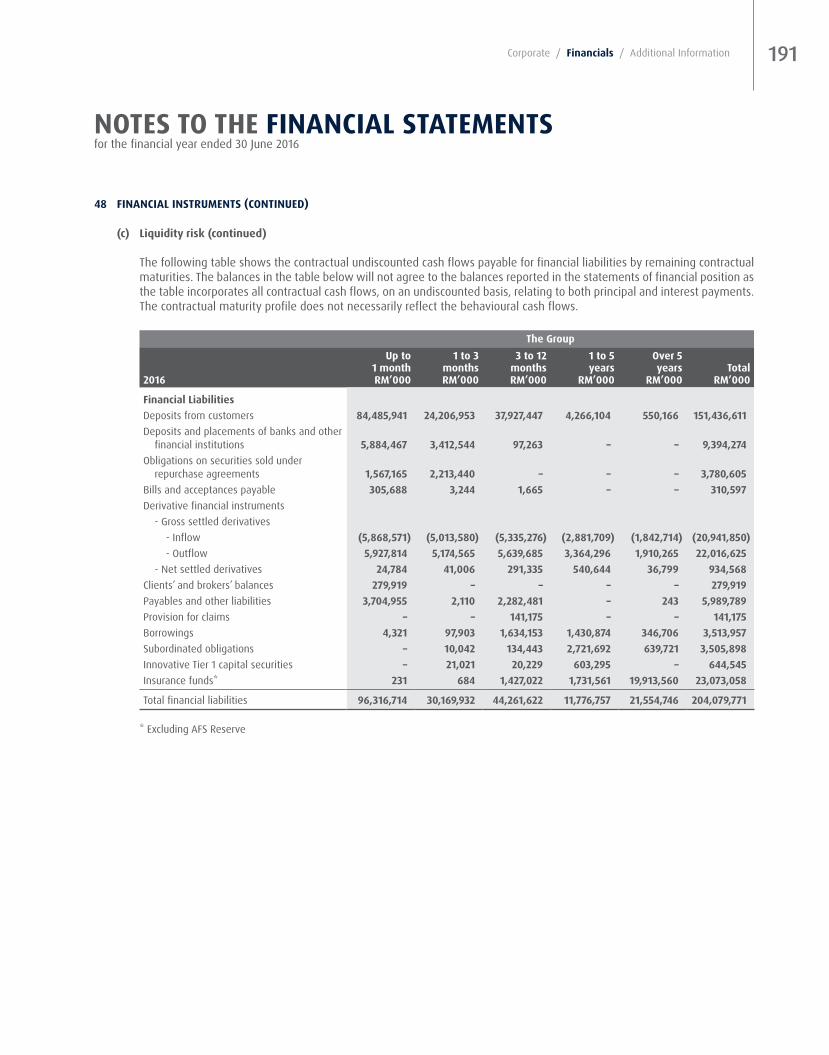
191Corporate / Financials / Additional Information
48 FINaNCIaL INStrUMeNtS (CoNtINUeD)
(c) Liquidity risk (continued)
The following table shows the contractual undiscounted cash flows payable for financial liabilities by remaining contractual maturities. The balances in the table below will not agree to the balances reported in the statements of financial position as the table incorporates all contractual cash flows, on an undiscounted basis, relating to both principal and interest payments. The contractual maturity profile does not necessarily reflect the behavioural cash flows.
the GroupUp to 1 to 3 3 to 12 1 to 5 over 5
1 month months months years years total2016 rM’000 rM’000 rM’000 rM’000 rM’000 rM’000
Financial LiabilitiesDeposits from customers 84,485,941 24,206,953 37,927,447 4,266,104 550,166 151,436,611 Deposits and placements of banks and other
financial institutions 5,884,467 3,412,544 97,263 – – 9,394,274 Obligations on securities sold under
repurchase agreements 1,567,165 2,213,440 – – – 3,780,605 Bills and acceptances payable 305,688 3,244 1,665 – – 310,597 Derivative financial instruments
- Gross settled derivatives- Inflow (5,868,571) (5,013,580) (5,335,276) (2,881,709) (1,842,714) (20,941,850)- Outflow 5,927,814 5,174,565 5,639,685 3,364,296 1,910,265 22,016,625
- Net settled derivatives 24,784 41,006 291,335 540,644 36,799 934,568 Clients’ and brokers’ balances 279,919 – – – – 279,919 Payables and other liabilities 3,704,955 2,110 2,282,481 – 243 5,989,789 Provision for claims – – 141,175 – – 141,175 Borrowings 4,321 97,903 1,634,153 1,430,874 346,706 3,513,957Subordinated obligations – 10,042 134,443 2,721,692 639,721 3,505,898 Innovative Tier 1 capital securities – 21,021 20,229 603,295 – 644,545 Insurance funds* 231 684 1,427,022 1,731,561 19,913,560 23,073,058
Total financial liabilities 96,316,714 30,169,932 44,261,622 11,776,757 21,554,746 204,079,771
* Excluding AFS Reserve
NoteS to tHe FINaNCIaL StateMeNtSfor the financial year ended 30 June 2016

HONG LEONG FINANCIAL GROUP BERHAD ANNUAL REPORT 2016192
48 FINaNCIaL INStrUMeNtS (CoNtINUeD)
(c) Liquidity risk (continued)
The following table shows the contractual undiscounted cash flows payable for financial liabilities by remaining contractual maturities. The balances in the table below will not agree to the balances reported in the statements of financial position as the table incorporates all contractual cash flows, on an undiscounted basis, relating to both principal and interest payments. The contractual maturity profile does not necessarily reflect the behavioural cash flows. (continued)
the GroupUp to 1 to 3 3 to 12 1 to 5 over 5
1 month months months years years total2015 rM’000 rM’000 rM’000 rM’000 rM’000 rM’000
Financial LiabilitiesDeposits from customers 74,686,638 25,778,413 38,442,677 4,207,897 788,250 143,903,875 Deposits and placements of banks and other
financial institutions 7,575,862 3,681,890 398,006 – – 11,655,758 Obligations on securities sold under
repurchase agreements 974,431 2,297,078 422,363 – – 3,693,872 Bills and acceptances payable 1,363,567 499,991 – – – 1,863,558 Derivative financial instruments
- Gross settled derivatives - Inflow (975,245) (10,001,836) (2,773,745) (160,842) (2,501,210) (16,412,878) - Outflow 972,945 9,815,141 2,654,104 152,778 2,561,772 16,156,740 - Net settled derivatives 11,835 44,614 83,823 153,660 54,057 347,989
Clients’ and brokers’ balances 192,728 – – – – 192,728 Payables and other liabilities 3,769,181 4,720 1,874,283 130 (3,138) 5,645,176 Provision for claims – – 128,905 – – 128,905 Borrowings 1,457 24,321 1,232,562 2,033,131 1,660 3,293,131 Subordinated obligations – 726,870 1,690,237 2,832,497 649,232 5,898,836 Non-Innovative Tier 1 stapled securities – – 1,470,894 – – 1,470,894 Innovative Tier 1 capital securities – 20,795 20,568 644,545 – 685,908 Insurance funds* – – 1,170,144 1,392,202 19,561,795 22,124,141
Total financial liabilities 88,573,399 32,891,997 46,814,821 11,255,998 21,112,418 200,648,633
* Excluding AFS Reserve
NoteS to tHe FINaNCIaL StateMeNtSfor the financial year ended 30 June 2016
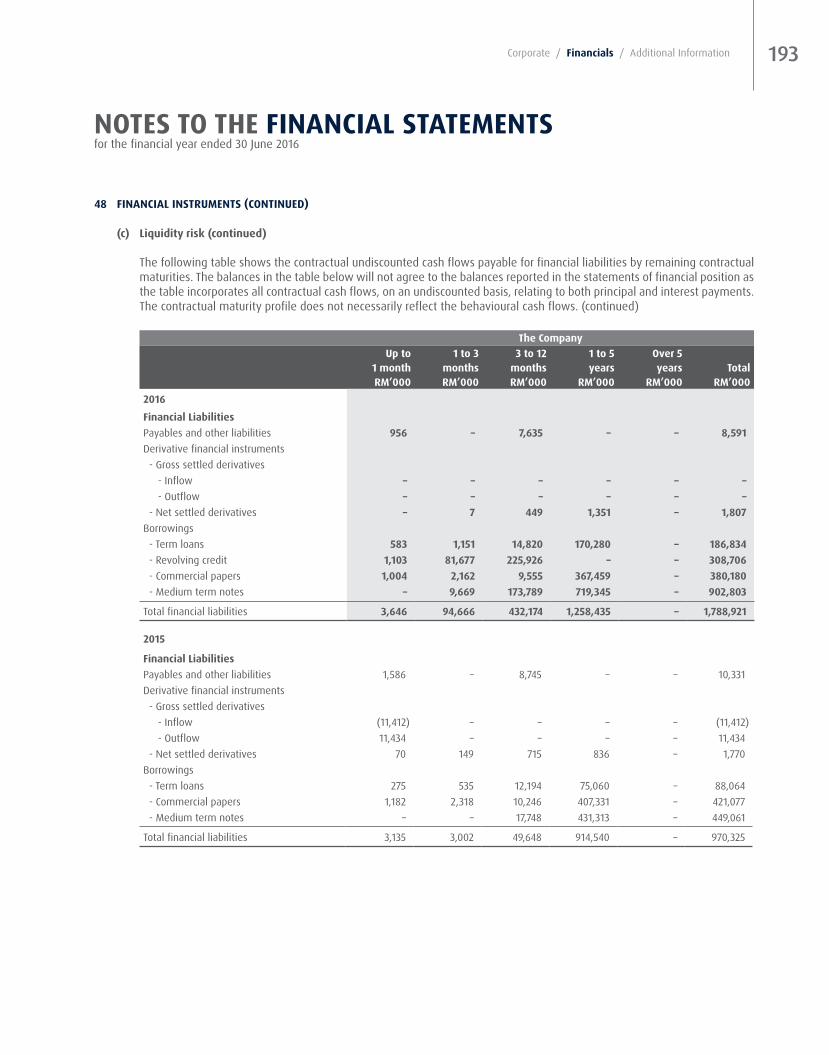
193Corporate / Financials / Additional Information
48 FINaNCIaL INStrUMeNtS (CoNtINUeD)
(c) Liquidity risk (continued)
The following table shows the contractual undiscounted cash flows payable for financial liabilities by remaining contractual maturities. The balances in the table below will not agree to the balances reported in the statements of financial position as the table incorporates all contractual cash flows, on an undiscounted basis, relating to both principal and interest payments. The contractual maturity profile does not necessarily reflect the behavioural cash flows. (continued)
the CompanyUp to 1 to 3 3 to 12 1 to 5 over 5
1 month months months years years totalrM’000 rM’000 rM’000 rM’000 rM’000 rM’000
2016
Financial LiabilitiesPayables and other liabilities 956 – 7,635 – – 8,591Derivative financial instruments - Gross settled derivatives - Inflow – – – – – – - Outflow – – – – – – - Net settled derivatives – 7 449 1,351 – 1,807 Borrowings - Term loans 583 1,151 14,820 170,280 – 186,834 - Revolving credit 1,103 81,677 225,926 – – 308,706 - Commercial papers 1,004 2,162 9,555 367,459 – 380,180 - Medium term notes – 9,669 173,789 719,345 – 902,803
Total financial liabilities 3,646 94,666 432,174 1,258,435 – 1,788,921
2015
Financial LiabilitiesPayables and other liabilities 1,586 – 8,745 – – 10,331 Derivative financial instruments - Gross settled derivatives - Inflow (11,412) – – – – (11,412) - Outflow 11,434 – – – – 11,434 - Net settled derivatives 70 149 715 836 – 1,770 Borrowings - Term loans 275 535 12,194 75,060 – 88,064 - Commercial papers 1,182 2,318 10,246 407,331 – 421,077 - Medium term notes – – 17,748 431,313 – 449,061
Total financial liabilities 3,135 3,002 49,648 914,540 – 970,325
NoteS to tHe FINaNCIaL StateMeNtSfor the financial year ended 30 June 2016

HONG LEONG FINANCIAL GROUP BERHAD ANNUAL REPORT 2016194
48 FINaNCIaL INStrUMeNtS (CoNtINUeD)
(c) Liquidity risk (continued)
The following table presents the contractual expiry by maturity of the Group’s commitments and contingencies:
the Group Less than over
1 year 1 year totalrM’000 rM’000 rM’000
2016Direct credit substitutes 120,526 1,153 121,679 Any commitment that are unconditionally cancelled at anytime by the
Group without prior notice 686,780 – 686,780 Short-term self liquidating trade related contingencies 370,876 48,970 419,846 Irrevocable commitments to extend credit 17,515,111 16,125,773 33,640,884 Unutilised credit card lines 7,503,020 – 7,503,020
Total commitments and contingencies 26,196,313 16,175,896 42,372,209
2015Direct credit substitutes 118,309 102,674 220,983 Any commitment that are unconditionally cancelled at anytime by the
Group without prior notice 722,877 – 722,877 Short-term self liquidating trade related contingencies 390,349 9,009 399,358 Irrevocable commitments to extend credit 17,264,715 18,161,494 35,426,209 Unutilised credit card lines 7,426,036 – 7,426,036
Total commitments and contingencies 25,922,286 18,273,177 44,195,463
Undrawn loan commitments are recognised at activation stage and include commitments which are unconditionally cancellable by the Group. The Group expect that not all of the contingent liabilities and undrawn loan commitments will be drawn before expiry.
(d) Credit risk
(i) Maximum exposure to credit risk
The maximum exposure to credit risk for financial assets recognised in the statements of financial position is their carrying amounts. For contingent liabilities, the maximum exposure to credit risk is the maximum amount that the Group and the Company would have to pay if the obligations of the instruments issued are called upon. For credit commitments, the maximum exposure to credit risk is the full amount of the undrawn credit facilities granted to customers.
NoteS to tHe FINaNCIaL StateMeNtSfor the financial year ended 30 June 2016
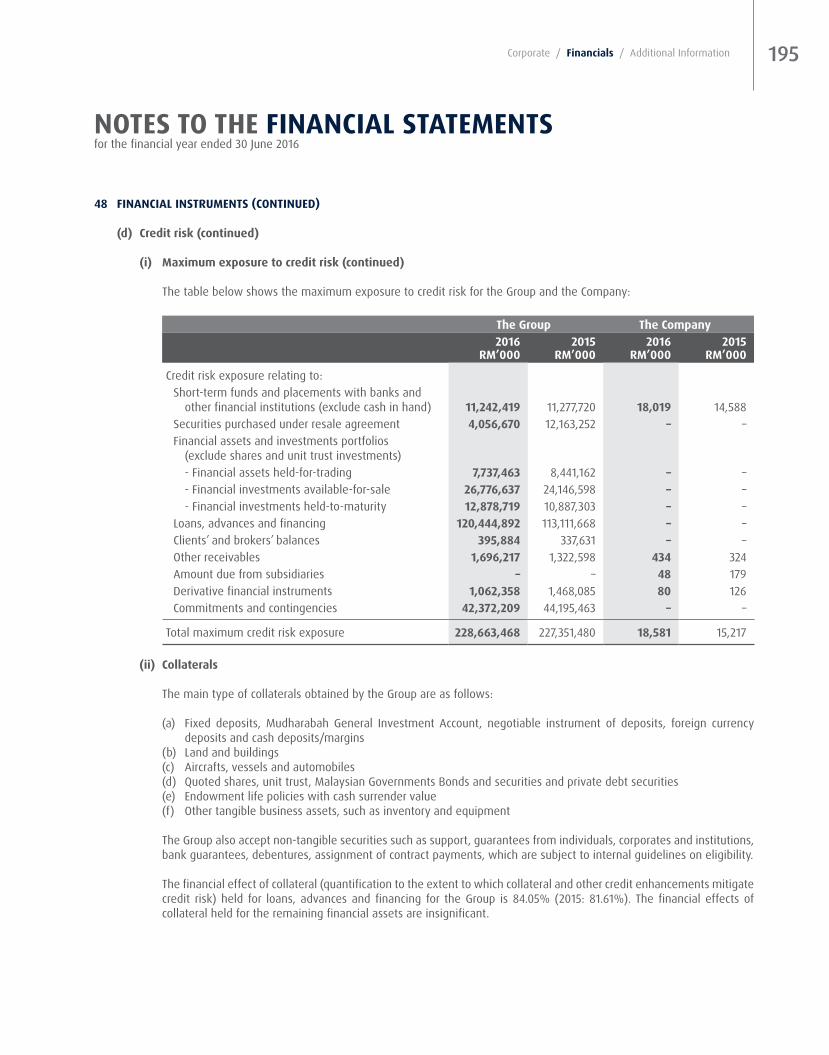
195Corporate / Financials / Additional Information
48 FINaNCIaL INStrUMeNtS (CoNtINUeD)
(d) Credit risk (continued)
(i) Maximum exposure to credit risk (continued)
The table below shows the maximum exposure to credit risk for the Group and the Company:
the Group the Company2016 2015 2016 2015
rM’000 rM’000 rM’000 rM’000
Credit risk exposure relating to:Short-term funds and placements with banks and
other financial institutions (exclude cash in hand) 11,242,419 11,277,720 18,019 14,588 Securities purchased under resale agreement 4,056,670 12,163,252 – – Financial assets and investments portfolios
(exclude shares and unit trust investments)- Financial assets held-for-trading 7,737,463 8,441,162 – – - Financial investments available-for-sale 26,776,637 24,146,598 – – - Financial investments held-to-maturity 12,878,719 10,887,303 – –
Loans, advances and financing 120,444,892 113,111,668 – – Clients’ and brokers’ balances 395,884 337,631 – – Other receivables 1,696,217 1,322,598 434 324Amount due from subsidiaries – – 48 179 Derivative financial instruments 1,062,358 1,468,085 80 126 Commitments and contingencies 42,372,209 44,195,463 – –
Total maximum credit risk exposure 228,663,468 227,351,480 18,581 15,217
(ii) Collaterals
The main type of collaterals obtained by the Group are as follows:
(a) Fixed deposits, Mudharabah General Investment Account, negotiable instrument of deposits, foreign currency deposits and cash deposits/margins
(b) Land and buildings(c) Aircrafts, vessels and automobiles(d) Quoted shares, unit trust, Malaysian Governments Bonds and securities and private debt securities(e) Endowment life policies with cash surrender value(f) Other tangible business assets, such as inventory and equipment
The Group also accept non-tangible securities such as support, guarantees from individuals, corporates and institutions, bank guarantees, debentures, assignment of contract payments, which are subject to internal guidelines on eligibility.
The financial effect of collateral (quantification to the extent to which collateral and other credit enhancements mitigate credit risk) held for loans, advances and financing for the Group is 84.05% (2015: 81.61%). The financial effects of collateral held for the remaining financial assets are insignificant.
NoteS to tHe FINaNCIaL StateMeNtSfor the financial year ended 30 June 2016

HONG LEONG FINANCIAL GROUP BERHAD ANNUAL REPORT 2016196
48 FINaNCIaL INStrUMeNtS (CoNtINUeD)
(d) Credit risk (continued)
(iii) Credit Quality
The Group assess credit quality of loans and advances using internal rating techniques tailored to the various categories of products and counterparties. These techniques have been developed internally and combine statistical analysis with credit officers judgement.
The credit quality of financial assets other than loans, advances and financing are determined based on the ratings of counterparties as defined by Moody’s or equivalent ratings of other internationals rating agencies as defined below:
- AAA to AA3- A1 to A3 - Baa1 to Baa3- P1 to P3
(a) Loans, advances and financing
Loans, advances and financing are summarised as follows:
the Group2016 2015
rM’000 rM’000
Neither past due nor impaired 113,200,312 105,601,617 Past due but not impaired 7,435,026 7,856,652 Individually impaired 957,153 948,583
Gross loans, advances and financing 121,592,491 114,406,852 Unamortised fair value changes arising from terminated fair value hedges (784) (2,188)Less : Allowance for impaired loans, advances and financing - individual assessment allowance (289,844) (323,071) - collective assessment allowance (856,971) (969,925)
Net loans, advances and financing 120,444,892 113,111,668
NoteS to tHe FINaNCIaL StateMeNtSfor the financial year ended 30 June 2016

197Corporate / Financials / Additional Information
48 FINaNCIaL INStrUMeNtS (CoNtINUeD)
(d) Credit risk (continued)
(iii) Credit Quality (continued)
(a) Loans, advances and financing (continued)
(i) Loans, advances and financing neither past due nor impaired
Analysis of loans, advances and financing that are neither past due nor impaired analysed based on the Group’s credit grading system is as follows:
the Group2016 2015
rM’000 rM’000
Hong Leong Bank GroupConsumer loans/financingRisk GradeGood 80,222,051 72,422,243 Weakest 382,298 587,566
80,604,349 73,009,809
Corporates loans/financing
Risk Grade Credit QualityA Exceptional 1,015,687 899,588 B+ Superior 2,829,101 3,723,977 B Excellent 5,361,051 5,945,468 B- Strong 5,921,342 5,119,426 C+ Good 5,945,392 5,484,968 C Satisfactory 7,046,394 6,670,357 C - Fair 2,575,544 2,575,284 D+ Adequate 509,732 734,607 D Marginal 88,609 45,745 Un-graded 315,830 404,449
31,608,682 31,603,869
Hong Leong Capital Group
Risk GradeGood 38,178 92,533 Satisfactory 46,349 50,533 Un-graded 288,075 183,297
372,602 326,363
HLa Holdings Group
Risk GradeUn-graded 614,679 661,576
The Group total neither past due nor impaired 113,200,312 105,601,617
NoteS to tHe FINaNCIaL StateMeNtSfor the financial year ended 30 June 2016

HONG LEONG FINANCIAL GROUP BERHAD ANNUAL REPORT 2016198
48 FINaNCIaL INStrUMeNtS (CoNtINUeD)
(d) Credit risk (continued)
(iii) Credit Quality (continued)
(a) Loans, advances and financing (continued)
(ii) Loans, advances and financing past due but not impaired
A financial asset is defined as “past due” when the counterparty has failed to make a principal or interest payment when contractually due.
Loans, advances and financing less than 90 days past due are not considered impaired, unless other information is available to indicate the contrary. Gross amount of loans, advances and financing by class to customers that were past due but not impaired were as follows:
the Group2016 2015
rM’000 rM’000
Past due less than 30 days 5,176,331 5,427,934 Past due 30 to less than 60 days 1,681,913 1,734,968 Past due 60 to less than 90 days 576,782 693,750
Past due but not impaired 7,435,026 7,856,652
(iii) Loans, advances and financing that are determined to be impaired as at 30 June 2016 and 30 June 2015 are as follows:
the Group2016 2015
rM’000 rM’000
Gross amount of impaired loans 957,153 948,583 Less: Individual assessment impairment allowance (289,844) (323,071)Less: Collective assessment impairment allowance (228,903) (247,267)
Total net amount of impaired loans 438,406 378,245
NoteS to tHe FINaNCIaL StateMeNtSfor the financial year ended 30 June 2016

199Corporate / Financials / Additional Information
48 FINaNCIaL INStrUMeNtS (CoNtINUeD)
(d) Credit risk (continued)
(iii) Credit Quality (continued)
(b) other financial assets
Analysis of other financial assets by rating agency designation (where applicable) as at 30 June 2016, based on Moody’s ratings or its equivalent are as follows:
the GroupShort-term funds and
deposits and placements with banks
and other financial
institutions*
Securities purchased
under resaleagreements^
Financialassets held-for-trading#
Financialinvestments
available-for-sale#
Financialinvestments
held-to-maturity#
Clients’ and
brokers’balances
otherreceivables
Derivativefinancial
instrumentsrM’000 rM’000 rM’000 rM’000 rM’000 rM’000 rM’000 rM’000
2016Neither past
due nor impaired
AAA to AA3 4,376,414 – 1,752,732 11,050,870 710,751 – 31,000 148,881 A1 to A3 3,513,616 – 780,204 4,742,491 63,902 – – 665,619 Baa1 to Baa3 23,364 – 155,005 1,033,616 61,553 – – 26,411 P1 to P3 – – 5,028 10,159 – – – – Non-rated 3,329,025 4,056,670 5,044,494 9,939,501 12,042,513 395,884 1,665,217 221,447
11,242,419 4,056,670 7,737,463 26,776,637 12,878,719 395,884 1,696,217 1,062,358 Individually
impaired – – – – – – – –
11,242,419 4,056,670 7,737,463 26,776,637 12,878,719 395,884 1,696,217 1,062,358
The amount of short-term funds, deposits and placements with banks and other financial institutions, securities purchased under resale agreements, financial assets and investment portfolios, other receivables, clients’ and brokers’ balances and derivative financial instruments that are past due but not impaired is not material.
* Placements with banks and other financial institutions with no ratings comprise of mainly placements with BNM.
^ Comprises of securities purchased under resale agreements with local financial institutions.# Securities with no ratings consists of government securities.
NoteS to tHe FINaNCIaL StateMeNtSfor the financial year ended 30 June 2016
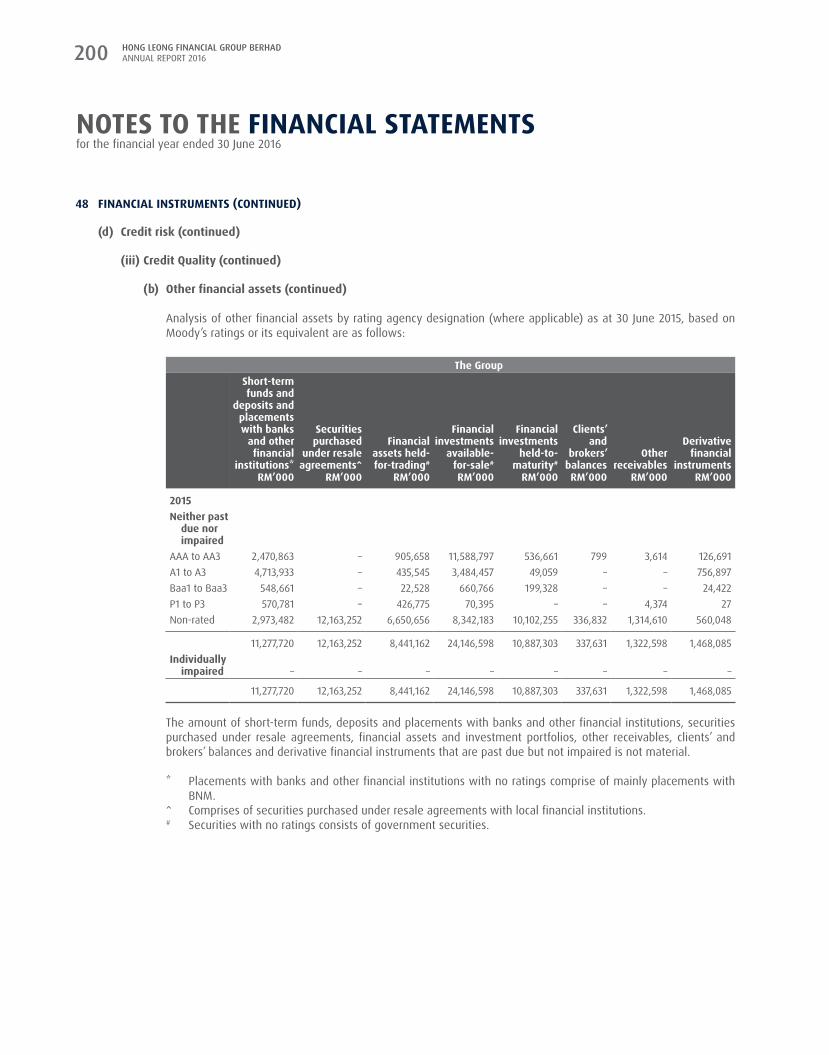
HONG LEONG FINANCIAL GROUP BERHAD ANNUAL REPORT 2016200
48 FINaNCIaL INStrUMeNtS (CoNtINUeD)
(d) Credit risk (continued)
(iii) Credit Quality (continued)
(b) other financial assets (continued)
Analysis of other financial assets by rating agency designation (where applicable) as at 30 June 2015, based on Moody’s ratings or its equivalent are as follows:
the GroupShort-term funds and
deposits and placements with banks
and other financial
institutions*
Securities purchased
under resaleagreements^
Financialassets held-for-trading#
Financialinvestments
available-for-sale#
Financialinvestments
held-to-maturity#
Clients’ and
brokers’balances
otherreceivables
Derivativefinancial
instrumentsrM’000 rM’000 rM’000 rM’000 rM’000 rM’000 rM’000 rM’000
2015Neither past
due nor impaired
AAA to AA3 2,470,863 – 905,658 11,588,797 536,661 799 3,614 126,691 A1 to A3 4,713,933 – 435,545 3,484,457 49,059 – – 756,897 Baa1 to Baa3 548,661 – 22,528 660,766 199,328 – – 24,422 P1 to P3 570,781 – 426,775 70,395 – – 4,374 27 Non-rated 2,973,482 12,163,252 6,650,656 8,342,183 10,102,255 336,832 1,314,610 560,048
11,277,720 12,163,252 8,441,162 24,146,598 10,887,303 337,631 1,322,598 1,468,085 Individually
impaired – – – – – – – –
11,277,720 12,163,252 8,441,162 24,146,598 10,887,303 337,631 1,322,598 1,468,085
The amount of short-term funds, deposits and placements with banks and other financial institutions, securities purchased under resale agreements, financial assets and investment portfolios, other receivables, clients’ and brokers’ balances and derivative financial instruments that are past due but not impaired is not material.
* Placements with banks and other financial institutions with no ratings comprise of mainly placements with BNM.
^ Comprises of securities purchased under resale agreements with local financial institutions.# Securities with no ratings consists of government securities.
NoteS to tHe FINaNCIaL StateMeNtSfor the financial year ended 30 June 2016
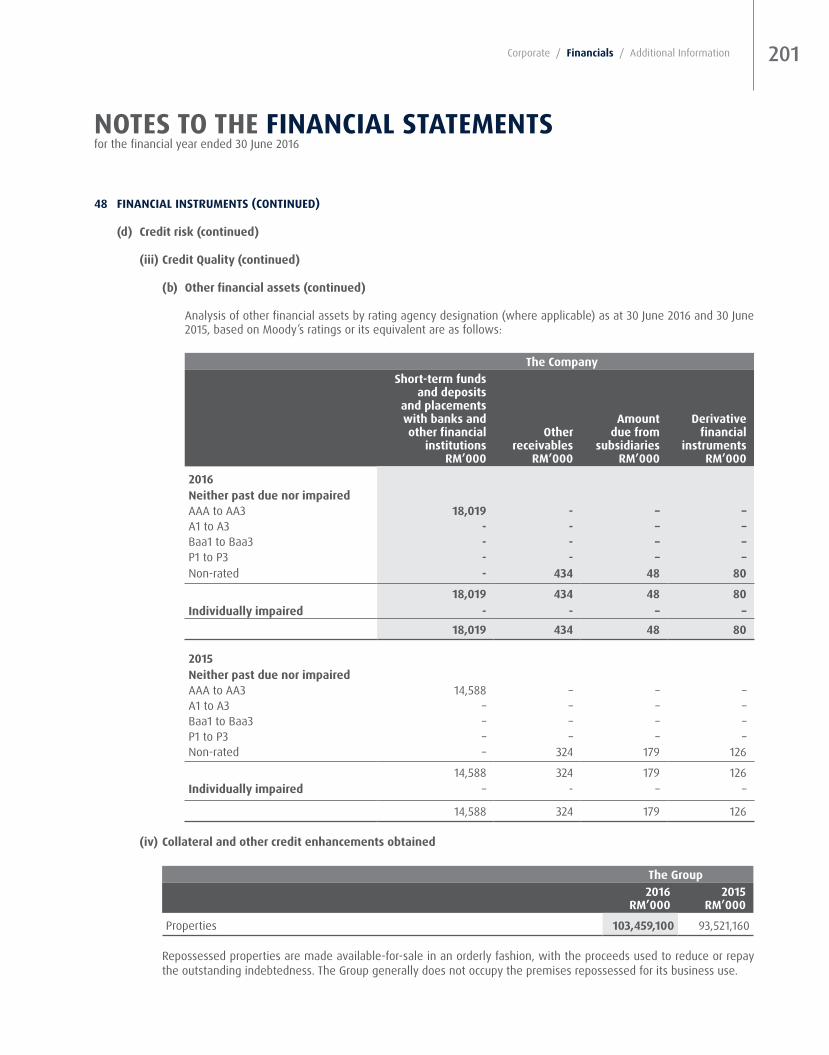
201Corporate / Financials / Additional Information
48 FINaNCIaL INStrUMeNtS (CoNtINUeD)
(d) Credit risk (continued)
(iii) Credit Quality (continued)
(b) other financial assets (continued)
Analysis of other financial assets by rating agency designation (where applicable) as at 30 June 2016 and 30 June 2015, based on Moody’s ratings or its equivalent are as follows:
the CompanyShort-term funds
and deposits and placements with banks and other financial
institutionsother
receivables
amount due from
subsidiaries
Derivative financial
instrumentsrM’000 rM’000 rM’000 rM’000
2016Neither past due nor impairedAAA to AA3 18,019 - – – A1 to A3 - - – – Baa1 to Baa3 - - – – P1 to P3 - - – – Non-rated - 434 48 80
18,019 434 48 80 Individually impaired - - – –
18,019 434 48 80
2015Neither past due nor impairedAAA to AA3 14,588 – – – A1 to A3 – – – – Baa1 to Baa3 – – – – P1 to P3 – – – – Non-rated – 324 179 126
14,588 324 179 126 Individually impaired – - – –
14,588 324 179 126
(iv) Collateral and other credit enhancements obtained
the Group2016 2015
rM’000 rM’000
Properties 103,459,100 93,521,160
Repossessed properties are made available-for-sale in an orderly fashion, with the proceeds used to reduce or repay the outstanding indebtedness. The Group generally does not occupy the premises repossessed for its business use.
NoteS to tHe FINaNCIaL StateMeNtSfor the financial year ended 30 June 2016

HONG LEONG FINANCIAL GROUP BERHAD ANNUAL REPORT 2016202
48
FIN
aNCI
aL IN
StrU
MeN
tS (C
oNtI
NUe
D)
(d)
Cred
it ris
k (c
ontin
ued)
(v)
Cred
it ris
k ex
posu
re a
naly
sed
by in
dust
ry in
resp
ect o
f the
Gro
up’s
finan
cial
ass
ets
are
set o
ut b
elow
:
the
Grou
pSh
ort-
term
fund
s an
dpl
acem
ents
with
ban
ks
and
othe
r fin
anci
alin
stitu
tions
Secu
ritie
spu
rcha
sed
unde
r res
ale
agre
emen
ts
Fina
ncia
las
sets
held
-for
-tr
adin
g
Fina
ncia
lin
vest
men
tsav
aila
ble-
for-
sale
Fina
ncia
lin
vest
men
tshe
ld-t
o-m
atur
ity
Loan
s,ad
vanc
es
and
finan
cing
Clie
nts’
and
brok
ers’
bala
nces
othe
rre
ceiv
able
s
Deriv
ativ
e fin
anci
alin
stru
men
ts
tota
l cr
edit
risk
expo
sure
s
Cred
it re
late
d co
mm
itmen
ts
and
cont
inge
ncie
s
Undr
awn
loan
com
mitm
ents
and
othe
rfa
cilit
ies
Guar
ante
es,
endo
rsem
ents
and
othe
rco
ntin
gent
ite
ms
rM’0
00rM
’000
rM’0
00rM
’000
rM’0
00rM
’000
rM’0
00rM
’000
rM’0
00rM
’000
rM’0
00rM
’000
rM’0
00
2016
Agric
ultu
re–
–50
,191
60,5
75–
2,80
0,19
5–
––
2,91
0,96
1–
896,
679
1,18
4M
inin
g an
d qu
arry
ing
––
–41
,383
–34
7,776
––
–38
9,15
9–
186,
823
–M
anuf
actu
ring
––
–48
,842
–8,
939,
890
–60
4–
8,98
9,33
6–
6,49
7,89
514
5,38
8El
ectr
icity
, gas
and
w
ater
––
118,
749
2,6
20,6
21
–16
7,40
2–
32–
2,9
06,8
04
–18
3,60
3–
Cons
truc
tion
––
87,8
58 8
66,8
19
–2,
293,
560
–4,
296
– 3
,252
,533
1,
000
1,56
8,44
615
,391
Who
lesa
le a
nd
reta
il–
––
83,
758
–10
,027
,519
–55
5–
10,1
11,8
32–
6,15
8,63
720
2,72
7Tr
ansp
ort,
stor
age
and
co
mm
unic
atio
ns–
–47
1,93
260
7,139
–2,
418,
559
––
–3,
497,
630
–50
5,00
15,
408
Fina
nce,
insu
ranc
e,
real
est
ate
and
busi
ness
se
rvice
s 9
,324
,642
–
5
,890
,914
1
3,91
2,89
9 3
79,4
80
9,4
02,7
04
198
,850
1
,629
,360
1
,062
,358
4
1,80
1,20
7 2
,754
3
,724
,008
16
4,97
1Go
vern
men
t and
go
vern
men
t ag
enci
es1,
917,7
774,
056,
670
681,
952
6,66
2,83
112
,056
,234
––
20,2
99–
25,3
95,7
63–
–20
2Ed
ucat
ion,
hea
lth
and
othe
rs–
––
––
2,11
3,46
2–
35–
2,11
3,49
7–
468,
984
–Ho
useh
old
––
––
–79
,874
,894
––
–79
,874
,894
–20
,522
,701
1,38
7Pu
rcha
se o
f se
curit
ies
––
––
–28
7,88
819
7,03
4–
–48
4,92
268
6,78
0–
–Ot
hers
––
435,
867
1,87
1,77
044
3,00
51,
771,
043
–41
,036
–4,
562,
721
–42
8,37
43,
866
11,
242,
419
4,0
56,6
70
7,7
37,4
63
26,
776,
637
12,
878,
719
120
,444
,892
3
95,8
84
1,6
96,2
17
1,0
62,3
58 1
86,2
91,2
59
690
,534
4
1,14
1,15
1 54
0,52
4
Not
eS t
o tH
e FI
NaN
CIaL
Sta
teM
eNtS
for t
he fi
nanc
ial y
ear e
nded
30
June
201
6
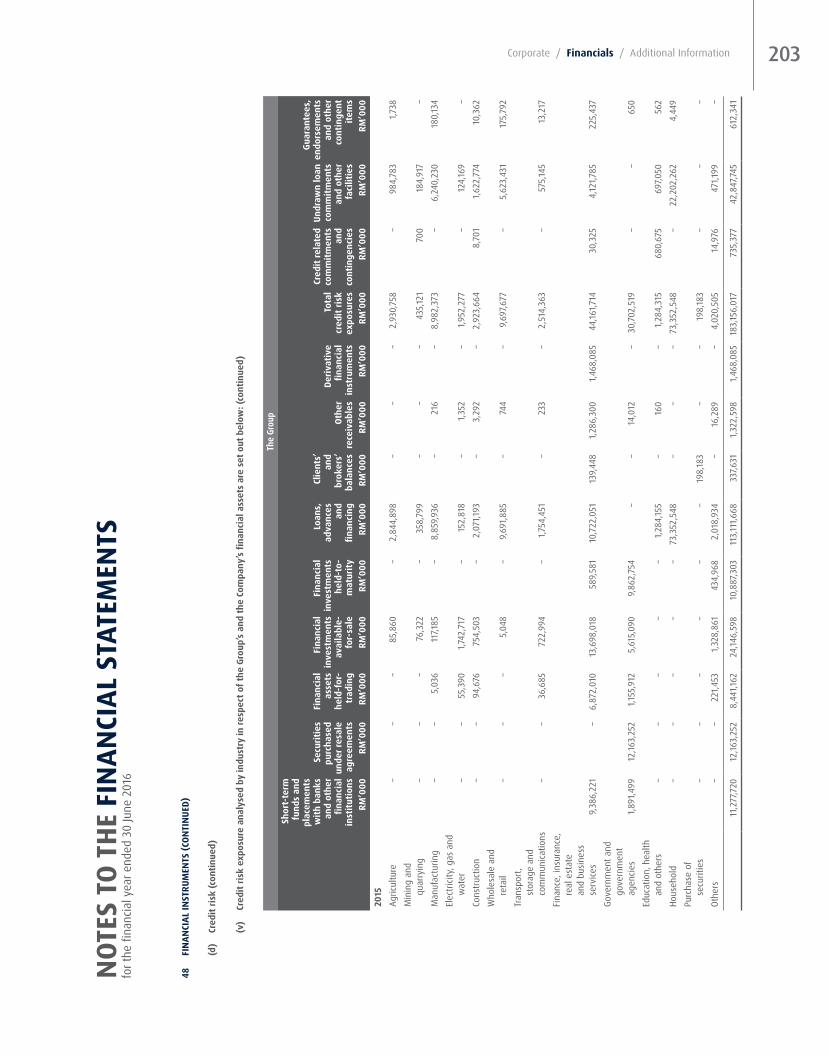
203Corporate / Financials / Additional Information
48
FIN
aNCI
aL IN
StrU
MeN
tS (C
oNtI
NUe
D)
(d)
Cred
it ris
k (c
ontin
ued)
(v)
Cred
it ris
k ex
posu
re a
naly
sed
by in
dust
ry in
resp
ect o
f the
Gro
up’s
and
the
Com
pany
’s fin
anci
al a
sset
s ar
e se
t out
bel
ow: (
cont
inue
d)
the
Grou
pSh
ort-
term
fund
s an
dpl
acem
ents
with
ban
ks
and
othe
r fin
anci
alin
stitu
tions
Secu
ritie
spu
rcha
sed
unde
r res
ale
agre
emen
ts
Fina
ncia
las
sets
held
-for
-tr
adin
g
Fina
ncia
lin
vest
men
tsav
aila
ble-
for-
sale
Fina
ncia
lin
vest
men
tshe
ld-t
o-m
atur
ity
Loan
s,ad
vanc
es
and
finan
cing
Clie
nts’
and
brok
ers’
bala
nces
othe
rre
ceiv
able
s
Deriv
ativ
e fin
anci
alin
stru
men
ts
tota
l cr
edit
risk
expo
sure
s
Cred
it re
late
d co
mm
itmen
ts
and
cont
inge
ncie
s
Undr
awn
loan
com
mitm
ents
and
othe
rfa
cilit
ies
Guar
ante
es,
endo
rsem
ents
and
othe
rco
ntin
gent
ite
ms
rM’0
00rM
’000
rM’0
00rM
’000
rM’0
00rM
’000
rM’0
00rM
’000
rM’0
00rM
’000
rM’0
00rM
’000
rM’0
00
2015
Agric
ultu
re –
–
–
8
5,86
0 –
2
,844
,898
–
–
–
2
,930
,758
–
9
84,7
83
1,7
38
Min
ing
and
quar
ryin
g –
–
–
7
6,32
2 –
3
58,7
99
–
–
–
435
,121
700
1
84,9
17
–
Man
ufac
turin
g –
–
5
,036
1
17,18
5 –
8
,859
,936
–
2
16
–
8,9
82,3
73
–
6,2
40,2
30
180
,134
Elec
tric
ity, g
as a
nd
wat
er –
–
5
5,39
0 1
,742,
717
–
152
,818
–
1
,352
–
1
,952
,277
–
1
24,16
9 –
Co
nstr
uctio
n –
–
9
4,67
6 7
54,5
03
–
2,0
71,19
3 –
3
,292
–
2
,923
,664
8
,701
1
,622
,774
1
0,36
2 W
hole
sale
and
re
tail
–
–
–
5,0
48
–
9,6
91,8
85
–
744
–
9
,697
,677
–
5
,623
,431
1
75,7
92
Tran
spor
t, st
orag
e an
d
com
mun
icat
ions
–
–
36,
685
722
,994
–
1
,754
,451
–
2
33
–
2,5
14,3
63
–
575
,145
13,
217
Fina
nce,
insu
ranc
e,
real
est
ate
and
busi
ness
se
rvice
s 9
,386
,221
–
6
,872
,010
1
3,69
8,01
8 5
89,5
81
10,
722,
051
139
,448
1
,286
,300
1,4
68,0
85
44,
161,7
14 3
0,32
5 4
,121,7
85
225
,437
Go
vern
men
t and
go
vern
men
t ag
enci
es 1
,891
,499
1
2,16
3,25
2 1
,155,
912
5,6
15,0
90
9,8
62,7
54
–
–
14,
012
–
30,
702,
519
–
–
650
Ed
ucat
ion,
hea
lth
and
othe
rs –
–
–
–
–
1
,284
,155
–
160
–
1
,284
,315
6
80,6
75
697
,050
5
62
Hous
ehol
d –
–
–
–
–
7
3,35
2,54
8 –
–
–
7
3,35
2,54
8 –
2
2,20
2,26
2 4
,449
Pu
rcha
se o
f se
curit
ies
–
–
–
–
–
–
198
,183
–
–
198
,183
–
–
–
Othe
rs –
–
2
21,4
53
1,3
28,8
61
434
,968
2
,018
,934
–
1
6,28
9 –
4
,020
,505
1
4,97
6 4
71,19
9 –
11,
277,7
20
12,
163,
252
8,4
41,16
2 2
4,14
6,59
8 1
0,88
7,303
1
13,11
1,668
3
37,6
31
1,3
22,5
98 1
,468
,085
18
3,15
6,01
7 7
35,3
77
42,
847,7
45
612
,341
Not
eS t
o tH
e FI
NaN
CIaL
Sta
teM
eNtS
for t
he fi
nanc
ial y
ear e
nded
30
June
201
6

HONG LEONG FINANCIAL GROUP BERHAD ANNUAL REPORT 2016204
48 FINaNCIaL INStrUMeNtS (CoNtINUeD)
(d) Credit risk (continued)
(v) Credit risk exposure analysed by industry in respect of the Group’s and the Company’s financial assets are set out below: (continued)
the Company Short-term funds and
placements with banks
and other financial
institutions other
receivables
amount due from
subsidiaries
Derivative financial
instruments
total credit risk exposures
rM’000 rM’000 rM’000 rM’000 rM’000
2016Finance, insurance, real estate and
business services 18,019 434 48 80 18,581
2015Finance, insurance, real estate and
business services 14,588 324 179 126 15,217
49 FaIr vaLUe oF FINaNCIaL INStrUMeNtS
Financial instruments comprise financial assets and financial liabilities. Fair value is the price that would be received to sell an asset or paid to transfer a liability in an orderly transaction between market participants at the measurement date. The information presented herein represents the estimates of fair values as at the statement of financial position date.
Where available, quoted and observable market prices are used as the measure of fair values. Where such quoted and observable market prices are not available, fair values are estimated based on a range of methodologies and assumptions regarding risk characteristics of various financial instruments, discount rates, estimates of future cash flows and other factors. Changes in the uncertainties and assumptions could materially affect these estimates and the resulting fair value estimates.
(a) Determination of fair value and fair value hierarchy
The Group and the Company measure fair values using the following fair value hierarchy that reflects the significance of the inputs used in making the measurements:
Level 1: Quoted prices (unadjusted) in active markets for identical assets or liabilities.Level 2: Quoted prices for identical or similar instruments in markets that are not active; and model-derived valuations in
which inputs other than quoted prices included within Level 1 that are observable for the asset or liability, either directly or indirectly.
Level 3: Valuations derived from valuation techniques in which one or more significant inputs are not based on observable market data.
NoteS to tHe FINaNCIaL StateMeNtSfor the financial year ended 30 June 2016

205Corporate / Financials / Additional Information
49 FaIr vaLUe oF FINaNCIaL INStrUMeNtS (CoNtINUeD)
(a) Determination of fair value and fair value hierarchy (continued)
Financial instruments are classified as Level 1 if their value is observable in an active market. Such instruments are valued by reference to unadjusted quoted prices for identical assets or liabilities in active markets where the quoted prices is readily available, and the price represents actual and regularly occurring market transactions. An active market is one in which transactions occur with sufficient volume and frequency to provide pricing information on an on-going basis. These would include actively traded listed equities and actively exchange-traded derivatives.
Where fair value is determined using unquoted market prices in less active markets or quoted prices for similar assets and liabilities, such instrument are generally classified as Level 2.
In cases where quoted prices are generally not available, the Group then determines fair value based upon valuation techniques that use as inputs, market parameters including but not limited to yield curves, volatilities and foreign exchange rates. The majority of valuation techniques employ only observable market data and so reliability of the fair value measurement is high.
Financial instruments are classified as Level 3 if their valuation incorporates significant inputs that are not based on observable market data (unobservable inputs). Such inputs are generally determined based on observable inputs of a similar nature, historical observations on the level of the input or other analytical techniques.
The table below analyses financial instruments carried at fair value analysed by level within the fair value hierarchy:
the Group Fair value
Level 1 Level 2 Level 3 total 2016 rM’000 rM’000 rM’000 rM’000
Recurring fair value measurementsFinancial assetsFinancial assets held-for-trading
- Money market instruments – 5,741,903 – 5,741,903 - Quoted securities 1,275,928 – – 1,275,928 - Unquoted securities – 1,506,842 – 1,506,842
Financial investments available-for-sale- Money market instruments – 7,801,574 – 7,801,574 - Quoted securities 14,121,041 – – 14,121,041 - Unquoted securities – 13,414,757 429,720 13,844,477
Derivative financial instruments 11 1,054,352 7,995 1,062,358
15,396,980 29,519,428 437,715 45,354,123
Financial liabilitiesDerivative financial instruments 1,564 1,644,666 7,995 1,654,225 Financial liabilities designated at fair value
- Callable range accrual notes – 1,421,919 – 1,421,919
1,564 3,066,585 7,995 3,076,144
NoteS to tHe FINaNCIaL StateMeNtSfor the financial year ended 30 June 2016
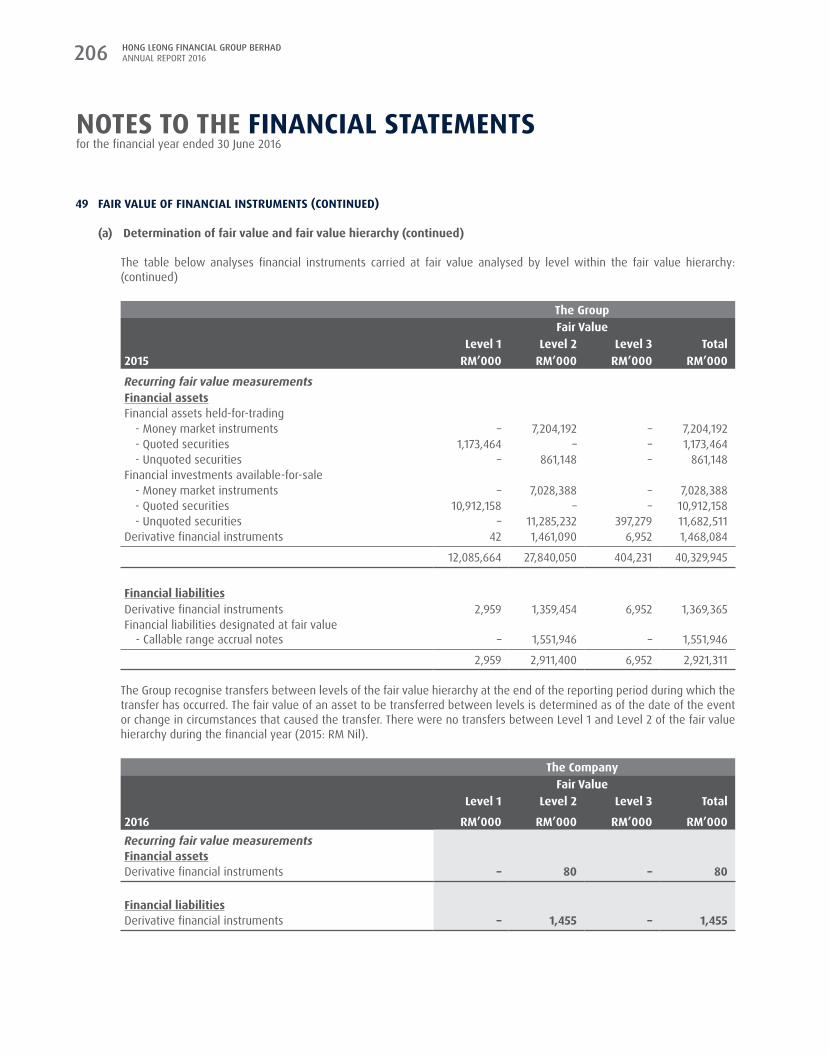
HONG LEONG FINANCIAL GROUP BERHAD ANNUAL REPORT 2016206
49 FaIr vaLUe oF FINaNCIaL INStrUMeNtS (CoNtINUeD)
(a) Determination of fair value and fair value hierarchy (continued)
The table below analyses financial instruments carried at fair value analysed by level within the fair value hierarchy: (continued)
the Group Fair value
Level 1 Level 2 Level 3 total 2015 rM’000 rM’000 rM’000 rM’000
Recurring fair value measurementsFinancial assetsFinancial assets held-for-trading
- Money market instruments – 7,204,192 – 7,204,192 - Quoted securities 1,173,464 – – 1,173,464 - Unquoted securities – 861,148 – 861,148
Financial investments available-for-sale - Money market instruments – 7,028,388 – 7,028,388 - Quoted securities 10,912,158 – – 10,912,158 - Unquoted securities – 11,285,232 397,279 11,682,511
Derivative financial instruments 42 1,461,090 6,952 1,468,084
12,085,664 27,840,050 404,231 40,329,945
Financial liabilitiesDerivative financial instruments 2,959 1,359,454 6,952 1,369,365 Financial liabilities designated at fair value
- Callable range accrual notes – 1,551,946 – 1,551,946
2,959 2,911,400 6,952 2,921,311
The Group recognise transfers between levels of the fair value hierarchy at the end of the reporting period during which the transfer has occurred. The fair value of an asset to be transferred between levels is determined as of the date of the event or change in circumstances that caused the transfer. There were no transfers between Level 1 and Level 2 of the fair value hierarchy during the financial year (2015: RM Nil).
the Company Fair value
Level 1 Level 2 Level 3 total
2016 rM’000 rM’000 rM’000 rM’000 Recurring fair value measurementsFinancial assetsDerivative financial instruments – 80 – 80
Financial liabilitiesDerivative financial instruments – 1,455 – 1,455
NoteS to tHe FINaNCIaL StateMeNtSfor the financial year ended 30 June 2016

207Corporate / Financials / Additional Information
49 FaIr vaLUe oF FINaNCIaL INStrUMeNtS (CoNtINUeD)
(a) Determination of fair value and fair value hierarchy (continued)
The table below analyses financial instruments carried at fair value analysed by level within the fair value hierarchy: (continued)
the Company Fair value
Level 1 Level 2 Level 3 total 2015 rM’000 rM’000 rM’000 rM’000
Recurring fair value measurementsFinancial assetsDerivative financial instruments – 126 – 126
Financial liabilitiesDerivative financial instruments – 1,158 – 1,158
The Company recognise transfers between levels of the fair value hierarchy at the end of the reporting period during which the transfer has occurred. The fair value of an asset to be transferred between levels is determined as of the date of the event or change in circumstances that caused the transfer. There were no transfers between Level 1 and Level 2 of the fair value hierarchy during the financial year (2015: RM Nil).
Reconciliation of fair value measurements in Level 3 of the fair value hierarchy, as below:
the Group
Financial assetsFinancial Liability
Financial investments
available-for-sale
Derivative financial
instruments
Derivative
financial instruments
2016 rM’000 rM’000 rM’000
As at 1 July 397,279 6,952 6,952 Fair value changes recognised in statements of income – (3,023) (3,023)Net fair value changes recognised in other comprehensive income 32,441 – – Purchases – 4,171 4,171 Disposal – (105) (105)
As at 30 June 429,720 7,995 7,995
Fair value changes recognised in statements of income relating to assets/liability held on 30 June 2016 – (3,023) (3,023)
Total gain recognised in other comprehensive income relating to assets held on 30 June 2016 32,441 – –
NoteS to tHe FINaNCIaL StateMeNtSfor the financial year ended 30 June 2016
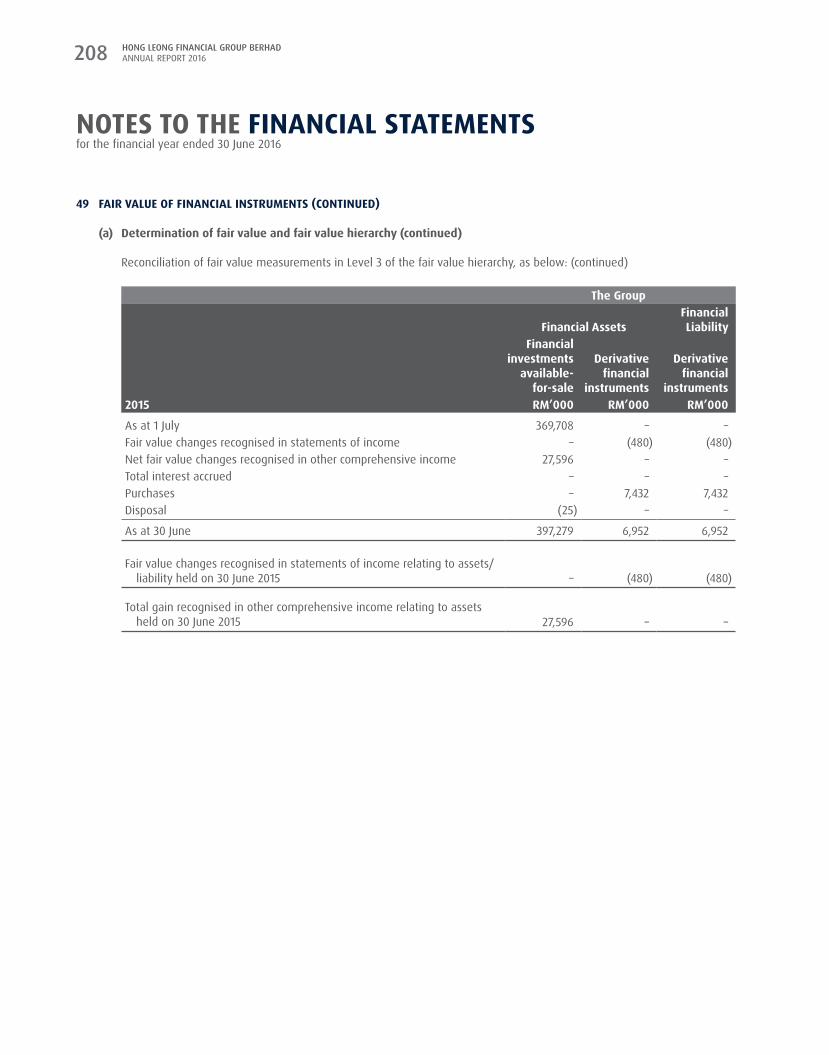
HONG LEONG FINANCIAL GROUP BERHAD ANNUAL REPORT 2016208
49 FaIr vaLUe oF FINaNCIaL INStrUMeNtS (CoNtINUeD)
(a) Determination of fair value and fair value hierarchy (continued)
Reconciliation of fair value measurements in Level 3 of the fair value hierarchy, as below: (continued)
the Group
Financial assetsFinancial Liability
Financial investments
available-for-sale
Derivative financial
instruments
Derivative
financial instruments
2015 rM’000 rM’000 rM’000
As at 1 July 369,708 – – Fair value changes recognised in statements of income – (480) (480)Net fair value changes recognised in other comprehensive income 27,596 – – Total interest accrued – – – Purchases – 7,432 7,432 Disposal (25) – –
As at 30 June 397,279 6,952 6,952
Fair value changes recognised in statements of income relating to assets/liability held on 30 June 2015 – (480) (480)
Total gain recognised in other comprehensive income relating to assets held on 30 June 2015 27,596 – –
NoteS to tHe FINaNCIaL StateMeNtSfor the financial year ended 30 June 2016
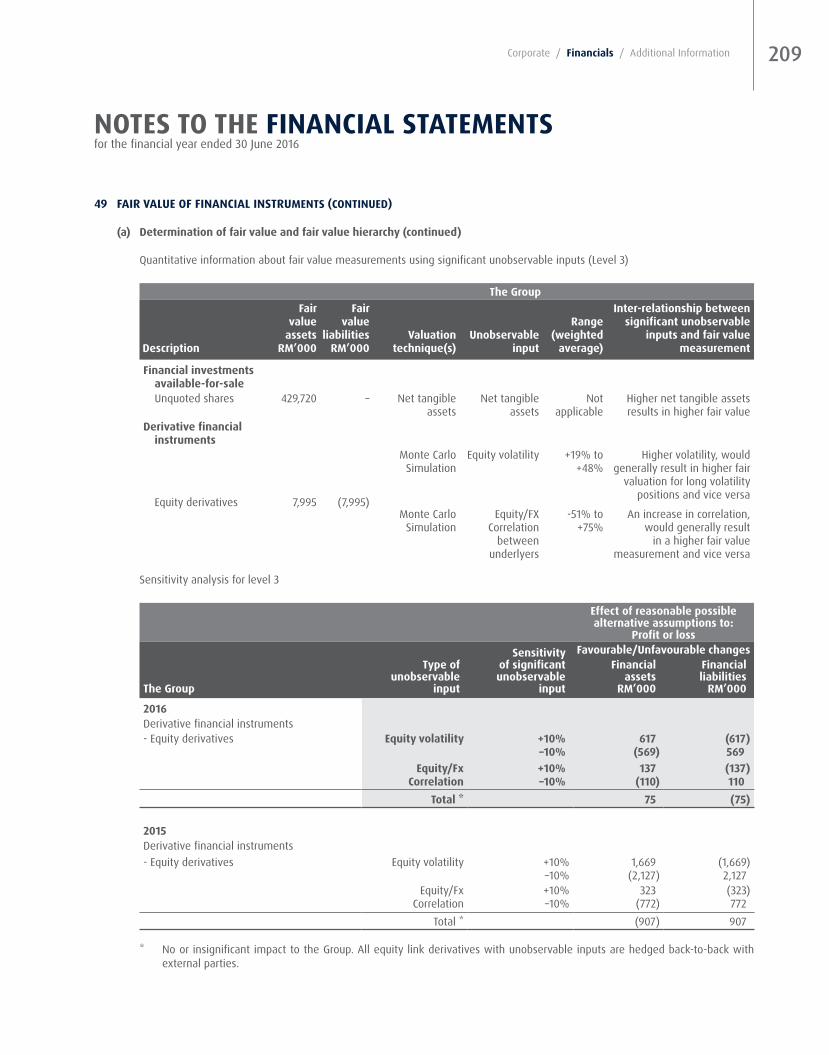
209Corporate / Financials / Additional Information
49 FaIr vaLUe oF FINaNCIaL INStrUMeNtS (CoNtINUeD)
(a) Determination of fair value and fair value hierarchy (continued)
Quantitative information about fair value measurements using significant unobservable inputs (Level 3)
the Group
Description
Fair value
assets rM’000
Fair value
liabilities rM’000
valuation technique(s)
Unobservable input
range (weighted average)
Inter-relationship between significant unobservable
inputs and fair value measurement
Financial investments available-for-saleUnquoted shares 429,720 – Net tangible
assets Net tangible
assetsNot
applicable Higher net tangible assets results in higher fair value
Derivative financial instruments
Equity derivatives 7,995 (7,995)
Monte Carlo Simulation
Equity volatility +19% to +48%
Higher volatility, would generally result in higher fair
valuation for long volatility positions and vice versa
Monte Carlo Simulation
Equity/FX Correlation
between underlyers
-51% to +75%
An increase in correlation, would generally result
in a higher fair value measurement and vice versa
Sensitivity analysis for level 3
effect of reasonable possible alternative assumptions to:
profit or loss
the Group
type of unobservable
input
Sensitivity of significant unobservable
input
Favourable/Unfavourable changesFinancial
assets rM’000
Financial liabilities rM’000
2016Derivative financial instruments- Equity derivatives equity volatility +10%
–10%617
(569)(617) 569
equity/Fx Correlation
+10%–10%
137 (110)
(137) 110
total * 75 (75)
2015Derivative financial instruments- Equity derivatives Equity volatility +10%
–10%1,669
(2,127)(1,669) 2,127
Equity/Fx Correlation
+10%–10%
323 (772)
(323) 772
Total * (907) 907
* No or insignificant impact to the Group. All equity link derivatives with unobservable inputs are hedged back-to-back with external parties.
NoteS to tHe FINaNCIaL StateMeNtSfor the financial year ended 30 June 2016
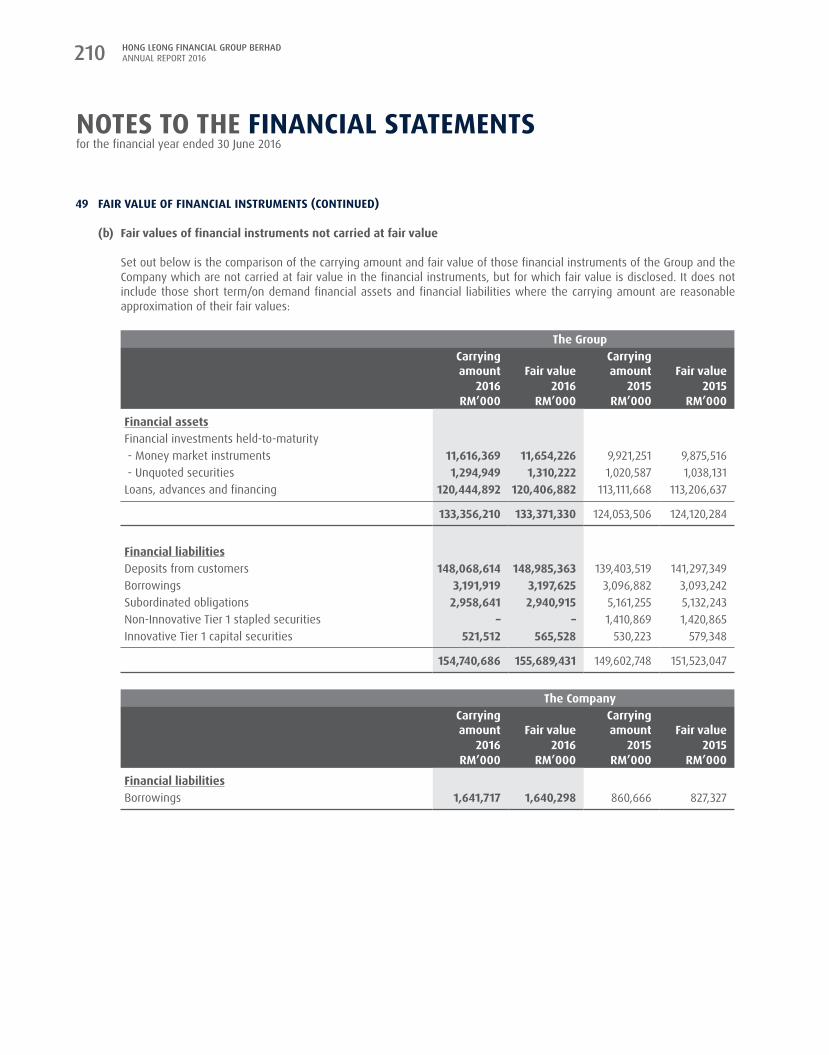
HONG LEONG FINANCIAL GROUP BERHAD ANNUAL REPORT 2016210
49 FaIr vaLUe oF FINaNCIaL INStrUMeNtS (CoNtINUeD)
(b) Fair values of financial instruments not carried at fair value
Set out below is the comparison of the carrying amount and fair value of those financial instruments of the Group and the Company which are not carried at fair value in the financial instruments, but for which fair value is disclosed. It does not include those short term/on demand financial assets and financial liabilities where the carrying amount are reasonable approximation of their fair values:
the Group Carrying amount Fair value
Carrying amount Fair value
2016 2016 2015 2015 rM’000 rM’000 rM’000 rM’000
Financial assetsFinancial investments held-to-maturity - Money market instruments 11,616,369 11,654,226 9,921,251 9,875,516 - Unquoted securities 1,294,949 1,310,222 1,020,587 1,038,131 Loans, advances and financing 120,444,892 120,406,882 113,111,668 113,206,637
133,356,210 133,371,330 124,053,506 124,120,284
Financial liabilitiesDeposits from customers 148,068,614 148,985,363 139,403,519 141,297,349 Borrowings 3,191,919 3,197,625 3,096,882 3,093,242 Subordinated obligations 2,958,641 2,940,915 5,161,255 5,132,243 Non-Innovative Tier 1 stapled securities – – 1,410,869 1,420,865 Innovative Tier 1 capital securities 521,512 565,528 530,223 579,348
154,740,686 155,689,431 149,602,748 151,523,047
the Company Carrying amount Fair value
Carrying amount Fair value
2016 2016 2015 2015 rM’000 rM’000 rM’000 rM’000
Financial liabilitiesBorrowings 1,641,717 1,640,298 860,666 827,327
NoteS to tHe FINaNCIaL StateMeNtSfor the financial year ended 30 June 2016

211Corporate / Financials / Additional Information
49 FaIr vaLUe oF FINaNCIaL INStrUMeNtS (CoNtINUeD)
(b) Fair values of financial instruments not carried at fair value (continued)
The following table analyses within the fair value hierarchy of the Group’s and the Company’s assets and liabilities not measured at fair value at 30 June 2016 and 30 June 2015 but for which fair value is disclosed:
the Group Carrying Fair valueamount Level 1 Level 2 Level 3 total rM’000 rM’000 rM’000 rM’000 rM’000
2016
Financial assetsFinancial investments held-to-maturity- Money market instruments 11,616,369 – 11,654,226 – 11,654,226 - Unquoted securities 1,294,949 – 1,309,687 535 1,310,222 Loans, advances and financing 120,444,892 – 120,406,882 – 120,406,882
133,356,210 – 133,370,795 535 133,371,330
Financial liabilitiesDeposits from customers 148,068,614 – 148,985,363 – 148,985,363 Borrowings 3,191,919 – 3,197,625 – 3,197,625 Subordinated obligations 2,958,641 – 2,940,915 – 2,940,915 Innovative Tier 1 capital securities 521,512 – 565,528 – 565,528
154,740,686 – 155,689,431 – 155,689,431
2015
Financial assetsFinancial investments held-to-maturity- Money market instruments 9,921,251 – 9,875,516 – 9,875,516 - Unquoted securities 1,020,587 – 1,037,647 484 1,038,131 Loans, advances and financing 113,111,668 – 113,206,637 – 113,206,637
124,053,506 – 124,119,800 484 124,120,284
Financial liabilitiesDeposits from customers 139,403,519 – 141,297,349 – 141,297,349 Borrowings 3,096,882 – 3,093,242 – 3,093,242 Subordinated obligations 5,161,255 – 5,132,243 – 5,132,243 Non-Innovative Tier 1 stapled securities 1,410,869 – 1,420,865 – 1,420,865 Innovative Tier 1 capital securities 530,223 – 579,348 – 579,348
149,602,748 – 151,523,047 – 151,523,047
NoteS to tHe FINaNCIaL StateMeNtSfor the financial year ended 30 June 2016
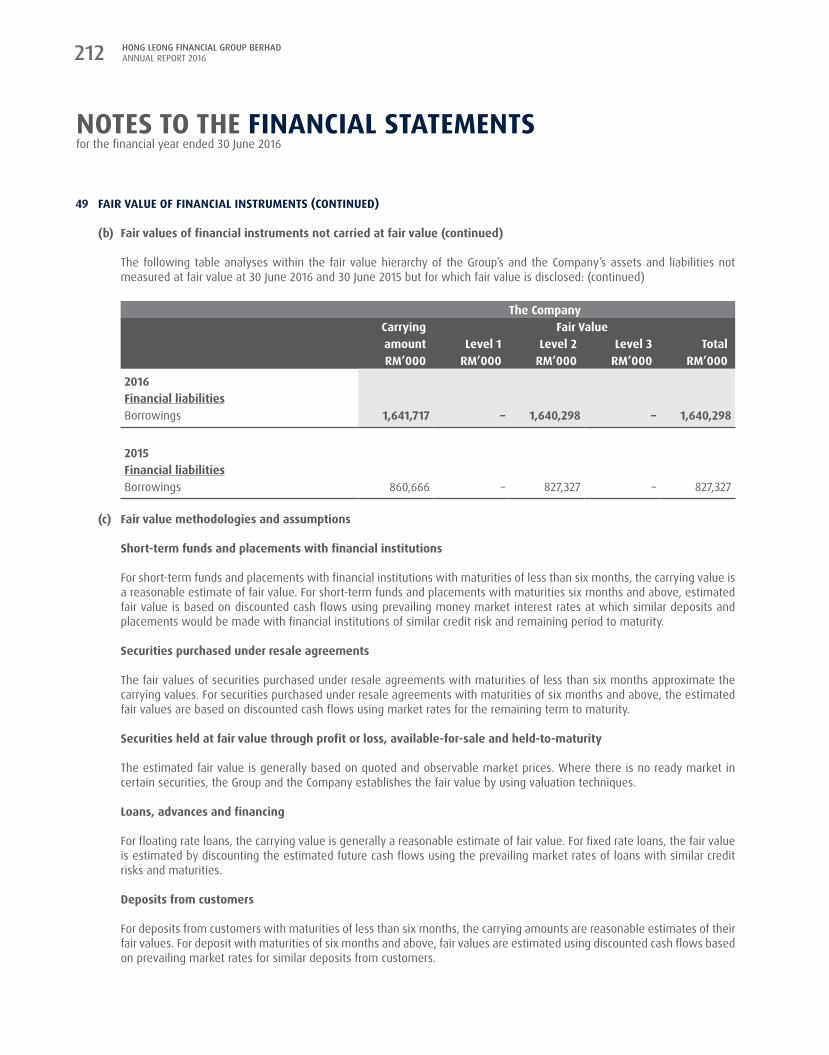
HONG LEONG FINANCIAL GROUP BERHAD ANNUAL REPORT 2016212
49 FaIr vaLUe oF FINaNCIaL INStrUMeNtS (CoNtINUeD)
(b) Fair values of financial instruments not carried at fair value (continued)
The following table analyses within the fair value hierarchy of the Group’s and the Company’s assets and liabilities not measured at fair value at 30 June 2016 and 30 June 2015 but for which fair value is disclosed: (continued)
the Company Carrying Fair valueamount Level 1 Level 2 Level 3 total rM’000 rM’000 rM’000 rM’000 rM’000
2016Financial liabilitiesBorrowings 1,641,717 – 1,640,298 – 1,640,298
2015Financial liabilitiesBorrowings 860,666 – 827,327 – 827,327
(c) Fair value methodologies and assumptions
Short-term funds and placements with financial institutions
For short-term funds and placements with financial institutions with maturities of less than six months, the carrying value is a reasonable estimate of fair value. For short-term funds and placements with maturities six months and above, estimated fair value is based on discounted cash flows using prevailing money market interest rates at which similar deposits and placements would be made with financial institutions of similar credit risk and remaining period to maturity.
Securities purchased under resale agreements
The fair values of securities purchased under resale agreements with maturities of less than six months approximate the carrying values. For securities purchased under resale agreements with maturities of six months and above, the estimated fair values are based on discounted cash flows using market rates for the remaining term to maturity.
Securities held at fair value through profit or loss, available-for-sale and held-to-maturity
The estimated fair value is generally based on quoted and observable market prices. Where there is no ready market in certain securities, the Group and the Company establishes the fair value by using valuation techniques.
Loans, advances and financing
For floating rate loans, the carrying value is generally a reasonable estimate of fair value. For fixed rate loans, the fair value is estimated by discounting the estimated future cash flows using the prevailing market rates of loans with similar credit risks and maturities.
Deposits from customers
For deposits from customers with maturities of less than six months, the carrying amounts are reasonable estimates of their fair values. For deposit with maturities of six months and above, fair values are estimated using discounted cash flows based on prevailing market rates for similar deposits from customers.
NoteS to tHe FINaNCIaL StateMeNtSfor the financial year ended 30 June 2016

213Corporate / Financials / Additional Information
49 FaIr vaLUe oF FINaNCIaL INStrUMeNtS (CoNtINUeD)
(c) Fair value methodologies and assumptions (continued)
Deposits and placements of banks and other financial institutions, bills and acceptances payable
The estimated fair values of deposits and placements of banks and other financial institutions and bills and acceptances payable with maturities of less than six months approximate the carrying values. For the items with maturities six months and above, the fair values are estimated based on discounted cash flows using prevailing money market interest rates with similar remaining period to maturities.
Subordinated obligations, senior bonds, stapled securities and capital securities
The fair value of subordinated obligations, senior bonds, stapled securities and capital securities are based on quoted market prices where available.
other financial assets and liabilities
The carrying value less any estimated allowance for financial assets and liabilities included in “other assets and liabilities” are assumed to approximate their fair values as these items are not materially sensitive to the shift in market interest rates.
Borrowings
The estimated fair values of borrowings with maturities of less than six months approximate the carrying values. For other borrowings with maturities six months or more, the fair values are estimated based on discounted cash flows using prevailing market rates for borrowings with similar risk profile.
Credit related commitment and contingencies
The net fair value of these items was not calculated as estimated fair values are not readily ascertainable. These financial instruments generally relate to credit risks and attract fees in line with market prices for similar arrangements. They are not presently sold nor traded. The fair value may be represented by the present value of fees expected to be received, less associated costs.
Foreign exchange and interest rate related contracts
The fair values of foreign exchange and interest rate related contracts are the estimated amounts the Group or the Company would receive or pay to transfer the contracts at the statements of financial position date.
NoteS to tHe FINaNCIaL StateMeNtSfor the financial year ended 30 June 2016
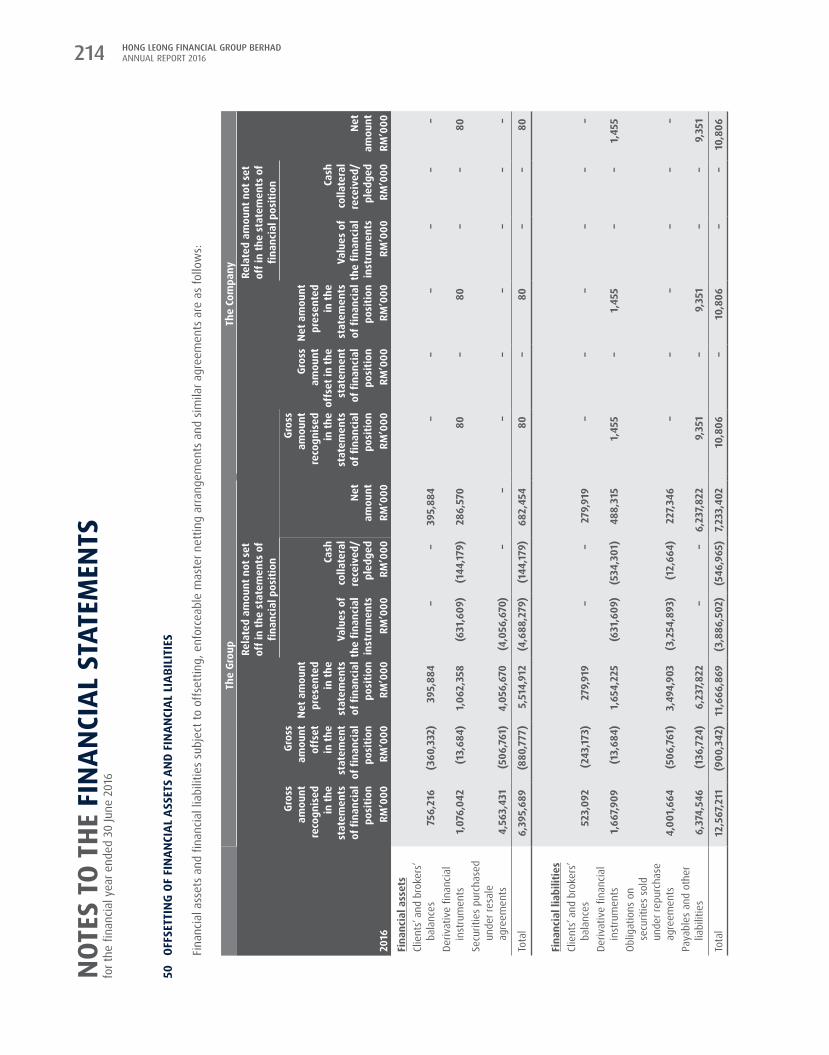
HONG LEONG FINANCIAL GROUP BERHAD ANNUAL REPORT 2016214
50
oFFS
ettI
NG
oF F
INaN
CIaL
aSS
etS
aND
FIN
aNCI
aL L
IaBI
LItI
eS
Fina
ncia
l ass
ets
and
finan
cial
liab
ilitie
s su
bjec
t to
offs
ettin
g, e
nfor
ceab
le m
aste
r net
ting
arra
ngem
ents
and
sim
ilar a
gree
men
ts a
re a
s fo
llow
s:
the
Grou
pth
e Co
mpa
nyre
late
d am
ount
not
set
of
f in
the
stat
emen
ts o
f fin
anci
al p
ositi
on
rela
ted
amou
nt n
ot s
et
off i
n th
e st
atem
ents
of
finan
cial
pos
ition
Gros
s am
ount
re
cogn
ised
in
the
stat
emen
ts
of fi
nanc
ial
posi
tion
Gros
s am
ount
of
fset
in
the
stat
emen
t of
fina
ncia
l po
sitio
n
Net
am
ount
pr
esen
ted
in th
e st
atem
ents
of
fina
ncia
l po
sitio
n
valu
es o
f th
e fin
anci
al
inst
rum
ents
Cash
co
llate
ral
rece
ived
/ pl
edge
dN
et
amou
nt
Gros
s am
ount
re
cogn
ised
in
the
stat
emen
ts
of fi
nanc
ial
posi
tion
Gros
s am
ount
of
fset
in th
e st
atem
ent
of fi
nanc
ial
posi
tion
Net
am
ount
pr
esen
ted
in th
e st
atem
ents
of
fina
ncia
l po
sitio
n
valu
es o
f th
e fin
anci
al
inst
rum
ents
Cash
co
llate
ral
rece
ived
/ pl
edge
dN
et
amou
nt20
16rM
’000
rM’0
00rM
’000
rM’0
00rM
’000
rM’0
00rM
’000
rM’0
00rM
’000
rM’0
00rM
’000
rM’0
00
Fina
ncia
l ass
ets
Clie
nts’
and
brok
ers’
bala
nces
756,
216
(36
0,33
2) 3
95,8
84
–
–
395
,884
–
–
–
–
–
–
De
rivat
ive
finan
cial
in
stru
men
ts 1
,076
,042
(1
3,68
4) 1
,062
,358
(6
31,6
09)
(144
,179
) 2
86,5
70
80
–
80
–
–
80
Secu
ritie
s pu
rcha
sed
unde
r res
ale
agre
emen
ts 4
,563
,431
(5
06,7
61)
4,0
56,6
70
(4,0
56,6
70)
–
–
–
–
–
–
–
–
Tota
l6,
395,
689
(880
,777
)5,
514,
912
(4,6
88,2
79)
(144
,179
)68
2,45
480
–
80 –
–
80
Fina
ncia
l lia
bilit
ies
Clie
nts’
and
brok
ers’
bala
nces
523
,092
(
243,
173)
279
,919
–
–
2
79,9
19
–
–
–
–
–
–
Deriv
ativ
e fin
anci
al
inst
rum
ents
1,6
67,9
09
(13,
684)
1,6
54,2
25
(631
,609
) (5
34,3
01)
488
,315
1
,455
–
1
,455
–
–
1
,455
Ob
ligat
ions
on
secu
ritie
s so
ld
unde
r rep
urch
ase
agre
emen
ts 4
,001
,664
(5
06,7
61)
3,4
94,9
03
(3,
254,
893)
(12,
664)
227
,346
–
–
–
–
–
–
Pa
yabl
es a
nd o
ther
lia
bilit
ies
6,37
4,54
6(1
36,7
24)
6,2
37,8
22
–
–
6,2
37,8
22
9,3
51
–
9,3
51
–
–
9,3
51
Tota
l12
,567
,211
(900
,342
) 1
1,66
6,86
9 (
3,88
6,50
2) (5
46,9
65)
7,2
33,4
02
10,
806
–
10,
806
–
–
10,
806
Not
eS t
o tH
e FI
NaN
CIaL
Sta
teM
eNtS
for t
he fi
nanc
ial y
ear e
nded
30
June
201
6

215Corporate / Financials / Additional Information
50
oFFS
ettI
NG
oF F
INaN
CIaL
aSS
etS
aND
FIN
aNCI
aL L
IaBI
LItI
eS (C
oNtI
NUe
D)
Fina
ncia
l ass
ets
and
finan
cial
liab
ilitie
s su
bjec
t to
offs
ettin
g, e
nfor
ceab
le m
aste
r net
ting
arra
ngem
ents
and
sim
ilar a
gree
men
ts a
re a
s fo
llow
s: (c
ontin
ued)
the
Grou
pth
e Co
mpa
nyre
late
d am
ount
not
set
of
f in
the
stat
emen
ts o
f fin
anci
al p
ositi
on
rela
ted
amou
nt n
ot s
et
off i
n th
e st
atem
ents
of
finan
cial
pos
ition
Gros
s am
ount
re
cogn
ised
in
the
stat
emen
ts
of fi
nanc
ial
posi
tion
Gros
s am
ount
of
fset
in
the
stat
emen
t of
fina
ncia
l po
sitio
n
Net
am
ount
pr
esen
ted
in th
e st
atem
ents
of
fina
ncia
l po
sitio
n
valu
es o
f th
e fin
anci
al
inst
rum
ents
Cash
co
llate
ral
rece
ived
/ pl
edge
dN
et
amou
nt
Gros
s am
ount
re
cogn
ised
in
the
stat
emen
ts
of fi
nanc
ial
posi
tion
Gros
s am
ount
of
fset
in th
e st
atem
ent
of fi
nanc
ial
posi
tion
Net
am
ount
pr
esen
ted
in th
e st
atem
ents
of
fina
ncia
l po
sitio
n
valu
es o
f th
e fin
anci
al
inst
rum
ents
Cash
co
llate
ral
rece
ived
/ pl
edge
dN
et
amou
nt20
15rM
’000
rM’0
00rM
’000
rM’0
00rM
’000
rM’0
00rM
’000
rM’0
00rM
’000
rM’0
00rM
’000
rM’0
00
Fina
ncia
l ass
ets
Clie
nts’
and
brok
ers’
bala
nces
635,
412
(297
,781
) 3
37,6
31
–
–
337
,631
–
–
–
–
–
–
De
rivat
ive
finan
cial
in
stru
men
ts 1
,510
,926
(4
2,84
2) 1
,468
,084
(6
90,7
25)
(148
,534
) 6
28,8
25
770
(6
44)
126
–
–
1
26
Secu
ritie
s pu
rcha
sed
unde
r res
ale
agre
emen
ts 1
2,67
0,08
4 (5
06,8
32)
12,
163,
252
(12,
170,
922)
–
(7,6
70)
–
–
–
–
–
–
Tota
l14
,816
,422
(847
,455
)13
,968
,967
(12,
861,6
47)
(148
,534
)95
8,78
677
0 (6
44)
126
–
–
12
6
Fina
ncia
l lia
bilit
ies
Clie
nts’
and
brok
ers’
bala
nces
396
,141
(203
,413
) 1
92,7
28
–
–
192
,728
–
–
–
–
–
–
De
rivat
ive
finan
cial
in
stru
men
ts 1
,411
,563
(4
2,19
8) 1
,369
,365
(6
90,7
25)
(405
,142)
273
,498
1
,158
–
1,15
8 –
–
1
,158
Oblig
atio
ns o
n se
curit
ies
sold
und
er re
purc
hase
ag
reem
ents
4,19
8,17
0 (5
06,8
32)
3,6
91,3
38
(2,5
32,0
86)
(85,
799)
1,0
73,4
53
–
–
–
–
–
–
Paya
bles
and
oth
er
liabi
litie
s 5
,907
,631
(1
10,9
37)
5,7
96,6
94
–
–
5,7
96,6
94
11,1
03
–
11,1
03
–
–
11,1
03
Tota
l 1
1,913
,505
(8
63,3
80)
11,0
50,12
5 (3
,222
,811
) (4
90,9
41)
7,33
6,37
3 1
2,26
1 –
1
2,26
1 –
–
1
2,26
1
Not
eS t
o tH
e FI
NaN
CIaL
Sta
teM
eNtS
for t
he fi
nanc
ial y
ear e
nded
30
June
201
6

HONG LEONG FINANCIAL GROUP BERHAD ANNUAL REPORT 2016216
51 eQUItY CoMpeNSatIoN BeNeFItS
executive Share option Scheme and executive Share Scheme
The Company has concurrently established and implemented an Executive Share Option Scheme and an Executive Share Scheme.
(a) executive Share option Scheme 2006/2016 (“eSoS 2006/2016”)
The ESOS 2006/2016 of up to fifteen percent (15%) of the issued and paid-up ordinary share capital of the Company, which was approved by the shareholders of the Company on 8 November 2005, was established on 23 January 2006 and had been in force for a period of ten (10) years.
On 18 January 2006, the Company announced that Bursa Malaysia Securities Berhad had approved-in-principle the listing of new ordinary shares of the Company to be issued pursuant to the exercise of options under the ESOS 2006/2016 at any time during the existence of the ESOS 2006/2016.
The ESOS 2006/2016 would provide an opportunity for eligible executives who had contributed to the growth and development of the Company and its subsidiaries (“the Group”) to participate in the equity of the Company.
The main features of the ESOS 2006/2016 are, inter alia, as follows:
1. Eligible executives are persons as defined by the ESOS 2006/2016 Bye-Laws.
2. The maximum allowable allotments for the full time Executive Directors had been approved by the shareholders of the Company in a general meeting. The Board, as defined by the ESOS 2006/2016 Bye-Laws, may from time to time at its discretion select and identify suitable eligible executives to be offered options.
3. The aggregate number of shares to be issued under the ESOS 2006/2016 shall not exceed 15% of the issued and paid-up ordinary share capital of the Company for the time being.
4. The ESOS 2006/2016 shall be in force for a period of ten (10) years from 23 January 2006.
5. The option price shall not be at a discount of more than ten percent (10%) (or such discount as the relevant authorities shall permit) from the 5-day weighted average market price of the shares of the Company preceding the Date of Offer as defined by the ESOS 2006/2016 Bye-Laws, and shall in no event be less than the par value of the shares of the Company.
6. The options granted to an option holder under the ESOS 2006/2016 is exercisable by the option holder only during his employment with the Group and upon meeting the vesting conditions of each of the ESOS plan as stated in the following pages, subject to any maximum limit as may be determined by the Board under the Bye-Laws of the ESOS 2006/2016.
7. The exercise of the options may, at the absolute discretion of the Board, be satisfied by way of issuance of new shares; transfer of existing shares purchased by a trust established for the ESOS 2006/2016; or a combination of both new shares and existing shares.
The ESOS 2006/2016 had expired on 23 January 2016. There were no options granted and remaining outstanding under the ESOS 2006/2016 of the Company as at 30 June 2016.
There were no options granted during the financial year. The ESOS 2006/2016 had expired on 23 January 2016.
NoteS to tHe FINaNCIaL StateMeNtSfor the financial year ended 30 June 2016
217Corporate / Financials / Additional Information
51 eQUItY CoMpeNSatIoN BeNeFItS (CoNtINUeD)
executive Share option Scheme and executive Share Scheme (continued)
(b) executive Share Scheme (“eSS”)
The ESS of up to ten percent (10%) of the issued and paid-up ordinary share capital (excluding treasury shares) of the Company comprises the Executive Share Option Scheme 2013/2023 (“ESOS 2013/2023”) and the Executive Share Grant Scheme (“ESGS”).
(i) ESOS 2013/2023
The ESOS 2013/2023 which was approved by the shareholders of the Company on 30 October 2012, was established on 12 March 2013 and would be in force for a period of ten (10) years.
On 18 September 2012, the Company announced that Bursa Malaysia Securities Berhad had resolved to approve the listing of new ordinary shares of the Company to be issued pursuant to the exercise of options under the ESOS 2013/2023.
The ESOS 2013/2023 would provide an opportunity for eligible executives who had contributed to the growth and development of the Group to participate in the equity of the Company.
Arising from the completion of the Company’s Rights Issue on 7 December 2015, the exercise price for the share options granted on 2 April 2015 under the ESS was adjusted from RM16.88 to RM16.61 and additional share options of 189,819 were allotted to the option holders, in accordance with the provisions of the Bye-Laws governing the ESS.
(ii) ESGS
The ESGS which was approved by the shareholders of the Company on 29 October 2013, was established on 28 February 2014 and would end on 11 March 2023.
On 6 September 2013, the Company announced that Bursa Malaysia Securities Berhad had resolved to approve-in-principle the listing of new ordinary shares of the Company to be issued pursuant to the ESGS.
The ESGS would provide the Company with the flexibility to reward the eligible executives of the Group for their contribution with awards of the Company’s shares without any consideration payable by the eligible executives.
There are no share granted under the ESGS to date.
The main features of the ESS are, inter alia, as follows:
1. Eligible executives are persons as defined by the ESS Bye-Laws.
2. The maximum allowable allotments for the full time Executive Directors had been approved by the shareholders of the Company in a general meeting. The Board, as defined by the ESS Bye-Laws, may from time to time at its absolute discretion select and identify suitable eligible executives to be offered options or grants.
3. At any point of time during the existence of the ESS, the aggregate number of shares comprised in the options and grants under the ESS and any other executive share schemes established by the Company which are still subsisting shall not exceed 10% of the issued and paid-up ordinary share capital (excluding treasury shares) of the Company at any one time.
NoteS to tHe FINaNCIaL StateMeNtSfor the financial year ended 30 June 2016

HONG LEONG FINANCIAL GROUP BERHAD ANNUAL REPORT 2016218
51 eQUItY CoMpeNSatIoN BeNeFItS (CoNtINUeD)
executive Share option Scheme and executive Share Scheme (continued)
(b) executive Share Scheme (“eSS”) (continued)
The main features of the ESS are, inter alia, as follows: (continued)
4. The option price for the options to be granted under the ESOS 2013/2023 shall not be at a discount of more than ten percent (10%) (or such discount as the relevant authorities shall permit) from the 5-day weighted average market price of the shares of the Company preceding the Date of Offer as defined by the ESS Bye-Laws, and shall in no event be less than the par value of the shares of the Company.
5. The options granted to an option holder under the ESOS 2013/2023 is exercisable by the option holder during his employment or directorship with the Group and upon meeting the vesting conditions of each ESOS plan as stated in the following pages, subject to any maximum limit as may be determined by the Board under the Bye-Laws of the ESS.
6. The shares to be vested to a grant holder under the ESGS will be vested to the grant holder only during his employment or directorship with the Group and subject to any other terms and conditions as may be determined by the Board.
7. The exercise of the options under the ESOS 2013/2023 or the vesting of shares under the ESGS may, at the absolute discretion of the Board, be satisfied by way of issuance of new shares; transfer of existing shares purchased by a trust established for the ESS; or a combination of both new shares and existing shares.
The ESOS options granted have performance and/or service based vesting conditions. Generally, the share options granted can be classified into 2 categories:
(i) An award that is conditional upon achieving agreed key performance indicators and milestones; and/or(ii) An award for the recognition of material and positive accomplishments towards building a strong and sustainable underlying
business value, preserving and enhancing the quality of assets and for shareholders wealth creation.
A trust has been set up for the ESOS 2006/2016 and ESS (collectively “Schemes”) and it is administered by an appointed trustee. This trustee will be entitled from time to time to accept financial assistance from the Company upon such terms and conditions as the Company and the trustee may agree to purchase the Company’s shares from the open market for the purposes of this trust. In accordance with MFRS 132, the shares purchased for the benefit of the Schemes holdings are recorded as “Treasury Shares for ESOS” in the shareholders’ equity on the statements of financial position. The cost of operating the Schemes is charged to the statements of income.
The number and market values of the ordinary shares held by the Trustee are as follows:
the Group2016 2015
Number of trust
shares held unit
CostrM
Number of trust
shares held unit
CostrM
As at 1 July 2,281,900 12,698,172 5,154,700 25,421,501 Purchase of treasury shares 1,682,500 23,014,346 177,500 2,694,865 Exercise of ESOS – – (3,050,300) (15,418,194)
As at 30 June 3,964,400 35,712,518 2,281,900 12,698,172
NoteS to tHe FINaNCIaL StateMeNtSfor the financial year ended 30 June 2016

219Corporate / Financials / Additional Information
51 eQUItY CoMpeNSatIoN BeNeFItS (CoNtINUeD)
executive Share option Scheme and executive Share Scheme (continued)
The number and market values of the ordinary shares held by the Trustee are as follows: (continued)
the Company2016 2015
Number of trust
shares held unit
CostrM
Number of trust
shares held unit
CostrM
As at 1 July 408 2,089 3,000,408 15,181,189 Rights issue 92 1,067 – – Exercise of ESOS – – (3,000,000) (15,179,100)
As at 30 June 500 3,156 408 2,089
eSoS 2013/2023
There were 12,200,000 options granted at an exercise price of RM16.88 under the ESOS 2013/2023 of the Group on 2 April 2015.
Grant date expiry dateas at
1-Jul-15option
grantedadjustment for
rights issue Forfeited
outstanding as at
30-Jun-16
exercisableas at
30-Jun-16
20162-Apr-15 July 2019 12,200,000 – 189,819 (701,636) 11,688,183 –
12,200,000 – 189,819 (701,636) 11,688,183 –
20152-Apr-15 July 2019 – 12,200,000 – – 12,200,000 –
– 12,200,000 – – 12,200,000 –
On 6 November 2015 (“modified grant date”), the options exercise price was adjusted and additional options were granted due to the rights issue exercise pursuant to the ESS Bye-Laws.
NoteS to tHe FINaNCIaL StateMeNtSfor the financial year ended 30 June 2016

HONG LEONG FINANCIAL GROUP BERHAD ANNUAL REPORT 2016220
51 eQUItY CoMpeNSatIoN BeNeFItS (CoNtINUeD)
executive Share option Scheme and executive Share Scheme (continued)
eSoS 2013/2023 (continued)
adjustments on exercise price due to rights Issue
The fair value of share options granted on 2 April 2015 (“grant date”) and modified grant date was estimated using the Black-scholes model, taking into account the terms and conditions upon which the options are granted. On modified grant date, the incremental fair value was computed to incorporate the adjustments on exercise price due to rights issue. The value of share options and the key inputs for share options valuation before and after rights issue were as follows:
Before rights after rightsIssue Issue
Fair value of share options (RM) 0.73-1.47 0.80-1.55Share price at grant date/modified grant date (RM) 16.12 16.12Exercise price (RM) 16.88 16.61Weighted average option life at grant date/modified grant date (Years) 3.80 3.80Expected volatility (%) 20.37 20.37Weighted average dividend yield (%) 2.36 2.36Weighted average risk free rate (%) 3.30 3.30
The fair value of share options after the rights issue is inclusive of incremental fair value arising from adjusted exercise price pursuant to the ESS Bye-Laws. The expected volatility reflects the assumption that the historical volatility was indicative of future trends, which may not necessarily be the actual outcome.
The vesting conditions for the above share options are based on the achievement of pre-agreed key performance indicators and milestones, and service (time) based periods. The vesting period of the options range from 2.80 to 4.80 years from grant date. The weighted average remaining option life as at 30 June 2016 is 3.80 years.
adjustments on additional options due to rights Issue
For the additional options granted on modified grant date due to Rights Issue exercise,the fair value of share options was estimated using the Black-scholes model, taking into account the terms and conditions upon which the options are granted. The value of share options and the key inputs for share options valuation were as follows:
after rightsIssue
Fair value of share options (RM) 0.80-1.55Share price at grant date/modified grant date (RM) 16.12Exercise price (RM) 16.61 Weighted average option life at grant date (Years) 3.80Expected volatility (%) 20.37Weighted average dividend yield (%) 2.36Weighted average risk free rate (%) 3.30
The vesting conditions for the above share options are based on the achievement of pre-agreed key performance indicators and milestones, and service (time) based periods. The vesting period of the options range from 2.80 to 4.80 years from grant date. The weighted average remaining option life as at 30 June 2016 is 3.80 years.
NoteS to tHe FINaNCIaL StateMeNtSfor the financial year ended 30 June 2016
221Corporate / Financials / Additional Information
52 SIGNIFICaNt eveNtS DUrING tHe FINaNCIaL Year
(a) During the financial year, the Company increased its issued and paid-up capital from 1,052,767,789 to 1,147,516,890 via issuance of 94,749,101 new ordinary shares of RM1.00 each on the basis of 9 rights shares for every 100 existing HLFG shares held on 6 November 2015 at an issue price of RM11.60 per rights share (“HLFG Rights Issue”). The HLFG Rights Issue was completed on 7 December 2015.
(b) During the financial year, HLB increased its issued and paid up capital from 1,879,909,100 to 2,167,718,284 via issuance of 287,809,184 new ordinary shares of RM1.00 each on the basis of 4 rights shares for every 25 existing HLB shares held on 27 November 2015 at an issue price of RM10.40 per rights share (“HLB Rights Issue”). The HLB Rights Issue was completed on 28 December 2015.
(c) On 3 July 2015, HLB announced that it had on 3 July 2015 entered into a conditional share sale agreement (“SSA”) with Hong Leong Real Estate Holdings Sdn Bhd (“HLREH”) for the acquisition of the entire issued and paid-up share capital of DC Tower Sdn Bhd (“DCT”) for an indicative cash consideration of RM189.3 million subject to adjustments (if any) pursuant to the terms of the SSA (“Acquisition”).
DCT is principally a property investment company, holding the development and ownership rights in respect of a 33-storey purpose-built stratified office building currently referred to as Office Tower A which is located within the on-going integrated development project known as Damansara City Kuala Lumpur.
On 30 June 2016, HLB announced that the Acquisition had been completed with the purchase price determined at RM168.78 million, subject to adjustment (if any) arising from the finalisation of the audit of DCT’s financial statements. Accordingly, DCT has become a wholly-owned subsidiary of HLB.
(d) On 10 August 2015, HLB had fully redeemed the RM700.0 million nominal value of the Tier 2 Subordinated Debt issued on 10 August 2010 bearing coupon rate of 4.85% per annum.
(e) On 30 December 2015, HLB had fully redeemed the RM500.0 million nominal value Subordinated Medium Term Notes bearing coupon rate of 4.75% per annum, which were previously issued by Promino Sdn Bhd (formerly known as EON Bank Berhad) and vested to HLB on 1 July 2011.
(f) On 17 March 2016, HLB had fully redeemed the USD300.0 million US Dollar Senior Unsecured Bonds on its maturity date.
(g) On 5 May 2016, HLB had fully redeemed the RM1.0 billion nominal value of the Subordinated Notes issued on 5 May 2011 bearing coupon rate of 4.35% per annum.
(h) On 5 May 2016, HLB had fully redeemed the RM1.4 billion Non-Innovative Tier 1 Capital Securities issued on 5 May 2011 bearing coupon rate of 5.05% per annum.
(i) On 30 June 2016, the Company announced that Bank Negara Malaysia has no objection for the Company and its wholly owned subsidiary, HLA Holdings Sdn Bhd (“HLAH”), to commence negotiations with certain parties for the possible acquisition by them of HLAH’s equity interest in Hong Leong Assurance Berhad, a 70% subsidiary of HLAH, and Hong Leong MSIG Takaful Berhad, a 65% subsidiary of HLAH, subject to the negotiations being concluded within 6 months from 23 June 2016.
Pursuant to the Financial Services Act 2013 and the Islamic Financial Services Act 2013, both the Company and HLAH and the relevant parties would be required to obtain the prior written approval from the Minister of Finance of Malaysia, on the recommendation of BNM, before entering into any agreement to effect the proposed transactions.
53 SUBSeQUeNt eveNtS aFter tHe FINaNCIaL Year
There were no material events subsequent to the financial year that require disclosure or adjustment to the financial statements.
NoteS to tHe FINaNCIaL StateMeNtSfor the financial year ended 30 June 2016

HONG LEONG FINANCIAL GROUP BERHAD ANNUAL REPORT 2016222
54 INCoMe taX reLatING to CoMpoNeNtS oF otHer CoMpreHeNSIve INCoMe
the GroupBefore tax Net of tax
tax benefits amountrM’000 rM’000 rM’000
2016Financial investments available-for-sale- net fair value gain/(loss) 113,416 (22,211) 91,205
Cash flow hedge- net fair value gain/(loss) (2,477) 597 (1,880)
2015Financial investments available-for-sale- net fair value gain/(loss) (128,349) 1,589 (126,760)
Cash flow hedge- net fair value gain/(loss) 216 (54) 162
55 CrItICaL aCCoUNtING eStIMateS aND JUDGeMeNtS IN appLYING aCCoUNtING poLICIeS
The Group and the Company make estimates and assumptions concerning the future. The resulting accounting estimates will, by definition, rarely equal the related actual results. To enhance the information content of the estimates, certain key variables that are anticipated to have material impact to the Group’s and the Company’s results and financial position are tested for sensitivity to changes in the underlying parameters. The estimates and assumptions that have a significant risk of causing a material adjustment to the carrying amount of assets and liabilities within the next financial year are outlined below:
(a) allowance for impairment losses on loans, advances and financing
The Group reviews their loan portfolios to assess impairment at least on a quarterly basis. It is the policy of the Group to establish, through charges against profit, individual and collective assessment impairment allowances in respect of estimated and inherent credit losses in their portfolio.
In determining individual assessment impairment allowances for loans/financing above the set threshold, management considers objective evidence of impairment and exercises judgement in estimating cash flows and collateral value. Whilst, management’s judgement is guided by the relevant BNM guidelines, judgement is made in estimation of the amount and timing of future cash flows in assessing allowance for impairment of financial assets. Among the factors considered are the net realisable value of the underlying collateral value, the viability of the customer’s business model and the capacity to generate sufficient cash flows to service debt obligations.
(b) Life policyholders’ fund
Material judgement is required in determining the liabilities and in the choice of assumptions.
Assumptions in use are based on the past experience, current internal data, external market indices and benchmarks which reflect current observable market prices and other published information.
NoteS to tHe FINaNCIaL StateMeNtSfor the financial year ended 30 June 2016

223Corporate / Financials / Additional Information
55 CrItICaL aCCoUNtING eStIMateS aND JUDGeMeNtS IN appLYING aCCoUNtING poLICIeS (CoNtINUeD)
(b) Life policyholders’ fund (continued)
Assumptions and prudent estimates are determined at the date of valuation and no credit is taken for possible beneficial effects of voluntary withdrawals.
Assumption are further evaluated on a continuous basis in order to ensure realistic and reasonable valuations.
56 approvaL oF FINaNCIaL StateMeNtS
The financial statements were authorised for issue by the Board of Directors of the Company in accordance with a resolution of the Directors on 15 September 2016.
57 reaLISeD aND UNreaLISeD proFIt
The determination of realised and unrealised profits is based on the Guidance of Special Matter No. 1, Determination of Realised and Unrealised Profits or Losses in the Context of Disclosure Pursuant to Bursa Malaysia Securities Berhad Listing Requirements, issued by the Malaysian Institute of Accountants on 20 December 2010 and the directive of Bursa Malaysia Securities Berhad.
The breakdown of the retained profits of the Group and the Company are as follows:
the Group the Company2016 2015 2016 2015
rM’000 rM’000 rM’000 rM’000
Total retained profits of the Group and subsidiaries- Realised 20,263,354 19,285,289 12,763,912 12,740,076 - Unrealised 908,372 1,161,592 410 2,296
Total share of retained profits from associated companies- Realised 2,356,783 1,976,541 – – - Unrealised 2,574 1,759 – –
Total share of retained profits from joint ventures- Realised 47,698 26,647 – –
23,578,781 22,451,828 12,764,322 12,742,372 Less : Consolidation adjustments (15,350,344) (14,635,036) – –
Total retained profits 8,228,437 7,816,792 12,764,322 12,742,372
The Group views translation gains or losses on monetary items as realised as it is incurred in the ordinary course of business.
The disclosure of realised and unrealised profits/(losses) above is solely for compliance with the directive issued by the Bursa Malaysia Securities Berhad and should not be used for any other purpose.
NoteS to tHe FINaNCIaL StateMeNtSfor the financial year ended 30 June 2016
HONG LEONG FINANCIAL GROUP BERHAD ANNUAL REPORT 2016224
We, Tan Kong Khoon and Lim Tau Kien, being two of the Directors of Hong Leong Financial Group Berhad, do hereby state that, in the opinion of the Directors, the financial statements set out on page 67 to 223 are drawn up so as to give a true and fair view of the state of affairs of the Group and of the Company as at 30 June 2016 and of the results and the cash flows of the Group and the Company for the year then ended on that date, in accordance with Malaysian Financial Reporting Standards, International Financial Reporting Standards and the requirements of the Companies Act, 1965 in Malaysia.
On behalf of the Board.
taN KoNG KHooN LIM taU KIeN Director Director Kuala Lumpur 15 September 2016
StatUtorY DeCLaratIoN pursuant to Section 169(16) of the Companies Act, 1965
I, Chew Seong Aun, the Officer primarily responsible for the financial management of Hong Leong Financial Group Berhad, do solemnly and sincerely declare that the financial statements set out on pages 67 to 223 are to the best of my knowledge and belief correct and I make this solemn declaration conscientiously believing the same to be true and by virtue of the provisions of the Statutory Declarations Act, 1960.
Subscribed and solemnly declared by ) the abovenamed Chew Seong Aun at ) Kuala Lumpur in Wilayah Persekutuan on ) 15 September 2016 ) CHeW SeoNG aUN Before me,
taN SeoK Kett Pesuruhjaya Sumpah Commissioner for Oaths
StateMeNt BY DIreCtorS pursuant to Section 169(15) of the Companies Act, 1965

225Corporate / Financials / Additional Information
report oN tHe FINaNCIaL StateMeNtS
We have audited the financial statements of Hong Leong Financial Group Berhad on pages 67 to 223, which comprise the statements of financial position as at 30 June 2016 of the Group and of the Company, and the statements of income, comprehensive income, changes in equity and cash flows of the Group and of the Company for the financial year then ended, and a summary of significant accounting policies and other explanatory notes, as set out on Notes 1 to 56.
DIreCtorS’ reSpoNSIBILItY For tHe FINaNCIaL StateMeNtS
The Directors of the Company are responsible for the preparation of financial statements that give a true and fair view in accordance with the Malaysian Financial Reporting Standards, International Financial Reporting Standards and the requirements of the Companies Act, 1965 in Malaysia. The Directors are also responsible for such internal control as the Directors determine is necessary to enable the preparation of financial statements that are free from material misstatement, whether due to fraud or error.
aUDItorS’ reSpoNSIBILItY
Our responsibility is to express an opinion on these financial statements based on our audit. We conducted our audit in accordance with approved standards on auditing in Malaysia. Those standards require that we comply with ethical requirements and plan and perform the audit to obtain reasonable assurance whether the financial statements are free from material misstatement.
An audit involves performing procedures to obtain audit evidence about the amounts and disclosures in the financial statements. The procedures selected depend on our judgement, including the assessment of risks of material misstatement of the financial statements, whether due to fraud or error. In making those risk assessments, we consider internal control relevant to the entity’s preparation of financial statements that give a true and fair view in order to design audit procedures that are appropriate in the circumstances, but not for the purpose of expressing an opinion on the effectiveness of the entity’s internal control. An audit also includes evaluating the appropriateness of accounting policies used and the reasonableness of accounting estimates made by the Directors, as well as evaluating the overall presentation of the financial statements.
We believe that the audit evidence we have obtained is sufficient and appropriate to provide a basis for our audit opinion.
opINIoN
In our opinion, the financial statements give a true and fair view of the financial position of the Group and of the Company as of 30 June 2016 and of their financial performance and cash flows for the financial year then ended in accordance with Malaysian Financial Reporting Standards, International Financial Reporting Standards and the requirements of the Companies Act, 1965 in Malaysia.
INDepeNDeNt aUDItorS’ reportto the members of Hong Leong Financial Group Berhad (Company no: 8024-W) (Incorporated in Malaysia)

HONG LEONG FINANCIAL GROUP BERHAD ANNUAL REPORT 2016226
report oN otHer LeGaL aND reGULatorY reQUIreMeNtS
In accordance with the requirements of the Companies Act, 1965, in Malaysia, we also report the following:
(a) In our opinion, the accounting and other records and the registers required by the Act to be kept by the Company and its subsidiaries of which we have acted as auditors have been properly kept in accordance with the provisions of the Act.
(b) We have considered the financial statements and the auditors’ reports of all the subsidiaries of which we have not acted as auditors, which are indicated in Note 11 to the financial statements.
(c) We are satisfied that the financial statements of the subsidiaries that have been consolidated with the Company’s financial statements are in form and content appropriate and proper for the purposes of the preparation of the financial statements of the Group and we have received satisfactory information and explanations required by us for those purposes.
(d) The audit reports on the financial statements of the subsidiaries did not contain any qualification or any adverse comment made under Section 174(3) of the Act.
otHer reportING reSpoNSIBILItIeS
The supplementary information set out in Note 57 is disclosed to meet the requirement of Bursa Malaysia Securities Berhad and is not part of the financial statements. The Directors are responsible for the preparation of the supplementary information in accordance with Guidance on Special Matter No. 1, Determination of Realised and Unrealised Profits or Losses in the Context of Disclosure Pursuant to Bursa Malaysia Securities Berhad Listing Requirements, as issued by the Malaysian Institute of Accountants (“MIA Guidance”) and the directive of Bursa Malaysia Securities Berhad. In our opinion, the supplementary information is prepared, in all material respects, in accordance with the MIA Guidance and the directive of Bursa Malaysia Securities Berhad.
otHer MatterS
This report is made solely to the members of the Company, as a body, in accordance with Section 174 of the Companies Act, 1965 in Malaysia and for no other purpose. We do not assume responsibility to any other person for the content of this report.
prICeWaterHoUSeCooperS NG Yee LING (No. AF: 1146) (No. 3032/01/17 ( J)) Chartered Accountants Chartered Accountant Kuala Lumpur 15 September 2016
INDepeNDeNt aUDItorS’ reportto the members of Hong Leong Financial Group Berhad (Company no: 8024-W) (Incorporated in Malaysia)
227Corporate / Financials / additional Information
NotICe oF aNNUaL GeNeraL MeetING
NotICe IS HereBY GIveN that the Forty-seventh Annual General Meeting of Hong Leong Financial Group Berhad (“Company”) will be held at the Theatrette, Level 1, Wisma Hong Leong, 18 Jalan Perak, 50450 Kuala Lumpur on Thursday, 27 October 2016 at 11.30 a.m. in order:
1. To lay before the meeting the audited financial statements together with the reports of the Directors and Auditors thereon for the financial year ended 30 June 2016.
2. To approve the payment of Director Fees of RM400,000 for the financial year ended 30 June 2016 (2015: RM400,000), to be divided amongst the Directors in such manner as the Directors may determine. (resolution 1)
3. To pass the following motions as ordinary resolutions:-
(a) “tHat Mr Tan Kong Khoon who retires pursuant to Article 94 of the Company’s Articles of Association, be and is hereby re-elected a Director of the Company.” (resolution 2)
(b) “tHat Mr Saw Kok Wei who retires by rotation pursuant to Article 115 of the Company’s Articles of Association, be and is hereby re-elected a Director of the Company.” (resolution 3)
(c) “tHat YBhg Tan Sri Quek Leng Chan who retires in compliance with Section 129 of the Companies Act, 1965, be and is hereby re-appointed a Director of the Company to hold office until the conclusion of the next Annual General Meeting.” (resolution 4)
(d) “tHat YBhg Tan Sri Dato’ Seri Khalid Ahmad bin Sulaiman who retires in compliance with Section 129 of the Companies Act, 1965, be and is hereby re-appointed a Director of the Company to hold office until the conclusion of the next Annual General Meeting.” (resolution 5)
4. To re-appoint Messrs PricewaterhouseCoopers as Auditors of the Company and authorise the Directors to fix their remuneration. (resolution 6)
SpeCIaL BUSINeSSAs special business, to pass the following motions as ordinary resolutions:-
5. ordinary resolutionauthority to Directors to Issue Shares
“tHat pursuant to Section 132D of the Companies Act, 1965, the Directors be and are hereby empowered to issue shares in the Company, at any time and from time to time, and upon such terms and conditions and for such purposes as the Directors may, in their absolute discretion, deem fit, provided that the aggregate number of shares issued pursuant to this resolution does not exceed 10% of the issued capital of the Company for the time being and that the Directors be and are also empowered to obtain approval for the listing of and quotation for the additional shares so issued on Bursa Malaysia Securities Berhad and that such authority shall continue in force until the conclusion of the next Annual General Meeting of the Company.” (resolution 7)
6. ordinary resolutionproposed renewal of Shareholders’ Mandate for recurrent related party transactions of a revenue or trading Nature with Hong Leong Company (Malaysia) Berhad (“HLCM”) and persons Connected with HLCM
“tHat approval be and is hereby given for the Company and/or its subsidiaries (excluding Hong Leong Bank Berhad and Hong Leong Capital Berhad and their respective subsidiaries) to enter into any of the transactions falling within the types of recurrent related party transactions of a revenue or trading nature as disclosed in Section 2.3(A) and (C) of the Company’s Circular to Shareholders dated 5 October 2016 (“the Circular”) with HLCM and persons connected with HLCM (“Hong Leong Group”), as set out in Appendix II of the Circular provided that such transactions are undertaken in the ordinary course of business, on arm’s length basis and on commercial terms which are not more favourable to Hong Leong Group than those generally available to and/or from the public and are not, in the Company’s opinion, detrimental to the minority shareholders;

HONG LEONG FINANCIAL GROUP BERHAD ANNUAL REPORT 2016228
aND tHat such approval shall continue to be in force until:
(a) the conclusion of the next Annual General Meeting (“AGM”) of the Company at which time it will lapse, unless by a resolution passed at the meeting, the authority is renewed; or
(b) the expiration of the period within which the next AGM of the Company after that date is required to be held pursuant to Section 143(1) of the Companies Act, 1965 (but shall not extend to such extension as may be allowed pursuant to Section 143(2) of the Companies Act, 1965); or
(c) revoked or varied by resolution passed by the shareholders in general meeting,
whichever is the earlier;
aND tHat the Directors of the Company be and are hereby authorised to complete and to do all such acts and things (including executing all such documents as may be required) as they may consider expedient or necessary to give effect to the transactions contemplated and/or authorised by this ordinary resolution.” (resolution 8)
7. ordinary resolutionproposed renewal of Shareholders’ Mandate for recurrent related party transactions of a revenue or trading Nature with tower real estate Investment trust (“tower reIt”)
“tHat approval be and is hereby given for the Company and/or its subsidiaries (excluding Hong Leong Bank Berhad and Hong Leong Capital Berhad and their respective subsidiaries) to enter into any of the transactions falling within the types of recurrent related party transactions of a revenue or trading nature as disclosed in Section 2.3(B) of the Company’s Circular to Shareholders dated 5 October 2016 with Tower REIT provided that such transactions are undertaken in the ordinary course of business, on arm’s length basis and on commercial terms which are not more favourable to Tower REIT than those generally available to and/or from the public and are not, in the Company’s opinion, detrimental to the minority shareholders;
aND tHat such approval shall continue to be in force until:
(a) the conclusion of the next Annual General Meeting (“AGM”) of the Company at which time it will lapse, unless by a resolution passed at the meeting, the authority is renewed; or
(b) the expiration of the period within which the next AGM of the Company after that date is required to be held pursuant to Section 143(1) of the Companies Act, 1965 (but shall not extend to such extension as may be allowed pursuant to Section 143(2) of the Companies Act, 1965); or
(c) revoked or varied by resolution passed by the shareholders in general meeting,
whichever is the earlier;
aND tHat the Directors of the Company be and are hereby authorised to complete and to do all such acts and things (including executing all such documents as may be required) as they may consider expedient or necessary to give effect to the transactions contemplated and/or authorised by this ordinary resolution.” (resolution 9)
8. ordinary resolutionproposed allocation of options and/or Grants to Mr tan Kong Khoon
“tHat authority be and is hereby given to the Directors of the Company, from time to time, to offer to Mr Tan Kong Khoon, the President & Chief Executive Officer of the Company, options to subscribe for/purchase such number of ordinary shares of RM1.00 each (unless otherwise adjusted) in the Company (“Shares”) and/or grants comprising such number of Shares under the Executive Share Scheme of the Company (“ESS”) as they shall deem fit PROVIDED THAT not more than 10% of the Maximum Aggregate, the “Maximum Aggregate” being defined in the bye-laws of the ESS (“Bye-Laws”) as an amount equivalent to 10% of the issued and paid-up ordinary share capital (excluding treasury shares) of the Company at any one time, are allotted to him if he, either singly or collectively through persons connected with him, holds 20% or more of the issued and paid-up ordinary share capital (excluding treasury shares) of the Company subject always to such terms and conditions and/or any adjustment which may be made in accordance with the provisions of the Bye-Laws.” (resolution 10)
NotICe oF aNNUaL GeNeraL MeetING

229Corporate / Financials / additional Information
NotICe oF aNNUaL GeNeraL MeetING
9. To consider any other business of which due notice shall have been given.
By Order of the Board
CHrIStINe MoH SUat MoI(MAICSA 7005095)Group Company Secretary
Kuala Lumpur5 October 2016
NoteS:
1. For the purpose of determining members’ eligibility to attend this meeting, only members whose names appear in the Record of Depositors as at 21 October 2016 shall be entitled to attend this meeting or appoint proxy(ies) to attend and vote on their behalf.
2. Save for a member who is an exempt authorised nominee, a member entitled to attend and vote at the meeting is entitled to appoint not more than two (2) proxies to attend and vote in his stead. A proxy may but need not be a member of the Company and the provisions of Section 149(1)(b) of the Companies Act, 1965 shall not apply to the Company. A member who is an authorised nominee may appoint not more than two (2) proxies in respect of each securities account it holds. A member who is an exempt authorised nominee for multiple beneficial owners in one securities account (“Omnibus Account”) may appoint any number of proxies in respect of the Omnibus Account.
3. Where two (2) or more proxies are appointed, the proportion of shareholdings to be represented by each proxy must be specified in the instrument appointing the proxies, failing which the appointment shall be invalid.
4. The Form of Proxy must be deposited at the Registered Office of the Company at Level 8, Wisma Hong Leong, 18 Jalan Perak, 50450 Kuala Lumpur not less than 48 hours before the time and date of the meeting or adjourned meeting.
5. Pursuant to Paragraph 8.29A(1) of the Main Market Listing Requirements of Bursa Malaysia Securities Berhad, all resolutions set out in this Notice will be put to vote by way of a poll.
eXpLaNatorY NoteS
1. resolution 7 on authority to Directors to Issue Shares
The proposed Ordinary Resolution, if passed, will give a renewed mandate to the Directors of the Company to issue ordinary shares of the Company from time to time provided that the aggregate number of shares issued pursuant to this resolution does not exceed 10% of the issued capital of the Company for the time being (“Renewed Mandate”). The Renewed Mandate, unless revoked or varied at a general meeting, will expire at the conclusion of the next Annual General Meeting (“AGM”) of the Company.
As at the date of this Notice, 94,749,101 new ordinary shares of RM1.00 each in the Company were issued by way of renounceable rights issue (“Rights Issue”) pursuant to the Specific Mandates granted to the Directors at the last AGM held on 28 October 2015. The proceeds of RM1,099,089,571.60 raised from the Rights Issue have been utilised for part subscription of the Company’s entitlement under the renounceable rights issue of Hong Leong Bank Berhad and expenses incidental to the Rights Issue. No new shares in the Company were issued pursuant to the General Mandate granted to the Directors at the last AGM held on 28 October 2015 and which will lapse at the conclusion of the Forty-seventh AGM.
The Renewed Mandate will enable the Directors to take swift action in case of, inter alia, a need for corporate exercises or in the event business opportunities or other circumstances arise which involve the issue of new shares and to avoid delay and cost in convening general meetings to approve such issue of shares.

HONG LEONG FINANCIAL GROUP BERHAD ANNUAL REPORT 2016230
eXpLaNatorY NoteS (CoNtINUeD)
2. resolutions 8 and 9 on recurrent related party transactions of a revenue or trading Nature
The proposed Ordinary Resolutions, if passed, will empower the Company and its subsidiaries (excluding Hong Leong Bank Berhad and Hong Leong Capital Berhad and their respective subsidiaries) (“HLFG Group”) to enter into recurrent related party transactions of a revenue or trading nature which are necessary for HLFG Group’s day-to-day operations, subject to the transactions being in the ordinary course of business and on terms which are not more favourable to the related parties than those generally available to the public and are not, in the Company’s opinion, detrimental to the minority shareholders of the Company (“Proposed Shareholders’ Mandate”).
Detailed information on the Proposed Shareholders’ Mandate is set out in the Circular to Shareholders dated 5 October 2016 which is despatched together with the Company’s 2016 Annual Report.
3. resolution 10 on proposed allocation of options and/or Grants to Mr tan Kong Khoon (“proposed allocation”)
The proposed Ordinary Resolution, if passed, will allow the Directors of the Company to offer to Mr Tan Kong Khoon, who was appointed as President & Chief Executive Officer of the Company on 5 February 2016, options to subscribe for/purchase such number of ordinary shares of RM1.00 each (unless otherwise adjusted) in the Company (‘‘Shares”) and/or grants comprising such number of Shares under the Executive Share Scheme of the Company (‘‘ESS”), as part of the Company’s efforts to retain, motivate and reward him with an equity stake in the success of the HLFG Group, provided that not more than 10% of the Maximum Aggregate, the Maximum Aggregate being defined in the bye-laws of the ESS (‘‘Bye-Laws”) as an amount equivalent to 10% of the issued and paid-up ordinary share capital (excluding treasury shares) of the Company at any one time, are allotted to him if he, either singly or collectively through persons connected with him, holds 20% or more of the issued and paid-up ordinary share capital (excluding treasury shares) of the Company over the period of the ESS.
The ESS, comprising an executive share option scheme (“ESOS”) and an executive share grant scheme (“ESGS”) which was implemented on 12 March 2013 and 28 February 2014 respectively, is governed by the Bye-Laws and will expire on 11 March 2023.
The option price to subscribe for/purchase such number of Shares under the ESOS to be determined shall not be more than 10% (or such discount as the relevant authorities shall permit) from the 5-day weighted average market price of the Shares preceding the offer date and shall in no event be less than the par value of the Shares. Shares offered under the ESGS will not require any consideration to be payable.
Mr Tan Kong Khoon is deemed interested in the Proposed Allocation. Accordingly, he will abstain from voting, in respect of his direct and/or indirect shareholdings in the Company, if any, on the proposed ordinary resolution in relation to the Proposed Allocation at the Forty-seventh Annual General Meeting of the Company. Mr Tan Kong Khoon will also ensure that persons connected with him will abstain from voting in respect of their direct and/or indirect shareholdings in the Company, if any, on the proposed ordinary resolution in relation to the Proposed Allocation. Save as disclosed, none of the Directors and major shareholders of the Company and/or persons connected with them, has any interest, direct or indirect, in the Proposed Allocation.
StateMeNt aCCoMpaNYING NotICe oF aNNUaL GeNeraL MeetING(Pursuant to Paragraph 8.27(2) of the Main Market Listing Requirements of Bursa Malaysia Securities Berhad)
• Details of individuals who are standing for election as Directors
No individual is seeking election as a Director at the forthcoming Forty-seventh Annual General Meeting of the Company. • Statement relating to general mandate for issue of securities in accordance with Paragraph 6.03(3) of the Main Market Listing
Requirements of Bursa Malaysia Securities Berhad
Details of the general mandate to issue securities in the Company pursuant to Section 132D of the Companies Act, 1965 are set out in Explanatory Note 1 of the Notice of Forty-seventh Annual General Meeting.
NotICe oF aNNUaL GeNeraL MeetING
231Corporate / Financials / additional Information
1. MaterIaL CoNtraCtS
Save as disclosed below, there were no material contracts (not being contracts entered into in the ordinary course of business) which had been entered into by the Company and its subsidiaries involving the interest of Directors and major shareholders, either still subsisting at the end of the financial year or entered into since the end of the previous financial year pursuant to Item 21, Part A, Appendix 9C of the Main Market Listing Requirements of Bursa Malaysia Securities Berhad:
(a) The letter of undertaking dated 14 July 2015 provided by Hong Leong Financial Group Berhad (“HLFG”) to Hong Leong Bank Berhad (“HLB”) to subscribe and/or procure the subscription in full for its entitlement to the new ordinary shares of RM1.00 in HLB (“HLB Shares”) issued pursuant to the renounceable rights issue of new HLB Shares to raise gross proceeds of up to RM3.0 billion (“HLB Rights Issue”);
(b) The letter of undertaking dated 14 July 2015 provided by Hong Leong Equities Sdn Bhd, a wholly-owned subsidiary of HLFG, to HLB to subscribe and/or procure the subscription in full for its entitlement to the new HLB Shares issued pursuant to the HLB Rights Issue;
(c) The letter of undertaking dated 14 July 2015 provided by Hong Leong Company (Malaysia) Berhad (“HLCM”) to HLFG to subscribe and/or procure the subscription in full for its entitlement to the new ordinary shares of RM1.00 in HLFG (“HLFG Shares”) issued pursuant to the renounceable rights issue of new HLFG Shares to raise gross proceeds of up to RM1.1 billion (“HLFG Rights Issue”); and
(d) The letter of undertaking dated 14 July 2015 provided by Guoco Assets Sdn Bhd to HLFG to subscribe and/or procure the subscription in full for its entitlement to the new HLFG Shares issued pursuant to the HLFG Rights Issue.
2. aNaLYSIS oF SHareHoLDINGS aS at 30 aUGUSt 2016
Authorised share capital : RM2,000,000,000Issued & paid-up capital : RM1,147,516,890Class of shares : Ordinary shares of RM1.00 eachVoting rights : 1 vote for each share held
Distribution Schedule of Shareholders as at 30 august 2016
Size of Holdings No. of Shareholders % No. of Shares %
Less than 100 312 8.12 6,916 0.00100 – 1,000 687 17.89 420,307 0.041,001 – 10,000 1,746 45.46 6,547,586 0.5710,001 – 100,000 831 21.63 26,043,113 2.27100,001 – less than 5% of issued shares 263 6.85 227,398,872 19.825% and above of issued shares 2 0.05 887,100,096 77.30
3,841 100.00 1,147,516,890 100.00
otHer INForMatIoN

HONG LEONG FINANCIAL GROUP BERHAD ANNUAL REPORT 2016232
2. aNaLYSIS oF SHareHoLDINGS aS at 30 aUGUSt 2016 (CoNtINUeD)
List of thirty Largest Shareholders as at 30 august 2016
Name of Shareholders No. of Shares %
1. Assets Nominees (Tempatan) Sdn Bhd- Hong Leong Company (Malaysia) Berhad 595,982,955 51.93
2. Assets Nominees (Asing) Sdn Bhd- Guoco Assets Sdn Bhd 291,117,141 25.37
3. Citigroup Nominees (Asing) Sdn Bhd- ING Bank N.V. 20,931,523 1.82
4. HSBC Nominees (Asing) Sdn Bhd- Exempt AN for The Bank Of Nova Scotia Asia Limited 9,009,177 0.79
5. Citigroup Nominees (Tempatan) Sdn Bhd - Employees Provident Fund Board 8,583,710 0.75
6. Assets Nominees (Tempatan) Sdn Bhd- Soft Portfolio Sdn Bhd 6,602,130 0.58
7. Citigroup Nominees (Asing) Sdn Bhd- CBNY for The Bank Of Nova Scotia 6,562,018 0.57
8. Cartaban Nominees (Asing) Sdn Bhd- Exempt AN for State Street Bank & Trust Company (West Clt OD67) 6,077,282 0.53
9. Cartaban Nominees (Tempatan) Sdn Bhd- Exempt AN for Eastspring Investments Berhad 5,597,150 0.49
10. Tan Sri Dato’ Seri Khalid Ahmad Bin Sulaiman 5,544,000 0.48
11. Tan Sri Quek Leng Chan 5,438,664 0.47
12. Chua Holdings Sdn Bhd 4,967,949 0.43
13. DB (Malaysia) Nominee (Asing) Sdn Bhd- Exempt AN for Bank of Singapore Limited 4,762,710 0.42
14. Hong Bee Hardware Company, Sdn. Berhad 4,730,506 0.41
15. HSBC Nominees (Asing) Sdn Bhd- BBH And Co Boston for Vanguard Emerging Markets Stock Index Fund 3,965,015 0.35
16. MTrustee Berhad- Exempt AN for Hong Leong Financial Group Berhad (HLA-ESOS) 3,963,900 0.35
otHer INForMatIoN

233Corporate / Financials / additional Information
otHer INForMatIoN
2. aNaLYSIS oF SHareHoLDINGS aS at 30 aUGUSt 2016 (CoNtINUeD)
List of thirty Largest Shareholders as at 30 august 2016 (continued)
Name of Shareholders No. of Shares %
17. Citigroup Nominees (Asing) Sdn Bhd- Exempt AN for Citibank New York (Norges Bank 9) 3,736,994 0.33
18. Pertubuhan Keselamatan Sosial 3,660,000 0.32
19. Citigroup Nominees (Tempatan) Sdn Bhd- Employees Provident Fund Board (Affin-Hwg) 3,555,199 0.31
20. AMSEC Nominees (Tempatan) Sdn Bhd- AmBank (M) Berhad (Hedging) 3,543,481 0.31
21. Cartaban Nominees (Asing) Sdn Bhd- GIC Private Limited for Government Of Singapore (C) 3,335,736 0.29
22. Citigroup Nominees (Tempatan) Sdn Bhd- Employees Provident Fund Board (Nomura) 3,289,152 0.29
23. Citigroup Nominees (Asing) Sdn Bhd- Exempt AN for Citibank New York (Norges Bank 14) 3,249,020 0.28
24. HSBC Nominees (Asing) Sdn Bhd- Exempt AN for JPMorgan Chase Bank, National Association (U.S.A.) 2,924,615 0.25
25. Citigroup Nominees (Asing) Sdn Bhd- CBNY for Dimensional Emerging Markets Value Fund 2,751,033 0.24
26. Citigroup Nominees (Tempatan) Sdn Bhd - Employees Provident Fund Board (F Templeton) 2,552,697 0.22
27. Quek Kon Sean 2,452,500 0.21
28. Kheng Lim Holdings Sdn Bhd 2,292,492 0.20
29. RHB Capital Nominees (Tempatan) Sdn Bhd- Pledged Securities Account for Poh Soon Sim (CEB) 2,164,086 0.19
30. RHB Capital Nominees (Tempatan) Sdn Bhd- Pledged Securities Account for Choong Yee How 2,071,000 0.18
1,025,413,835 89.36

HONG LEONG FINANCIAL GROUP BERHAD ANNUAL REPORT 2016234
2. aNaLYSIS oF SHareHoLDINGS aS at 30 aUGUSt 2016 (CoNtINUeD)
Substantial Shareholders
According to the Register of Substantial Shareholders, the substantial shareholders of the Company as at 30 August 2016 are as follows:-
Direct IndirectShareholders No. of shares % No. of shares %
Hong Leong Company (Malaysia) Berhad 595,982,955 51.94 291,121,141 25.37A
Tan Sri Quek Leng Chan 5,438,664 0.47 898,436,732 78.29B
HL Holdings Sdn Bhd – – 887,104,096 77.31C
Kwek Holdings Pte Ltd – – 891,834,602 77.72B
Kwek Leng Beng 1,315,841 0.11 891,834,602 77.72B
Hong Realty (Private) Limited – – 891,834,602 77.72B
Hong Leong Investment Holdings Pte Ltd – – 891,834,602 77.72B
Davos Investment Holdings Private Limited – – 891,834,602 77.72B
Kwek Leng Kee – – 891,834,602 77.72B
Quek Leng Chye 2,098,359 0.18 891,834,602 77.72B
Guoco Assets Sdn Bhd 291,117,141 25.37 – –GuoLine Overseas Limited – – 291,117,141 25.37D
Guoco Group Limited – – 291,117,141 25.37D
GuoLine Capital Assets Limited – – 291,117,141 25.37D
Notes:
A Held through subsidiary(ies) B Held through Hong Leong Company (Malaysia) Berhad (“HLCM”) and company(ies) in which the substantial shareholder has
interestC Held through HLCMD Held through Guoco Assets Sdn Bhd
3. DIreCtorS’ INtereStS aS at 30 aUGUSt 2016
Subsequent to the financial year end, there is no change, as at 30 August 2016, to the Directors’ interests in the ordinary shares, preference shares and/or options over ordinary shares or convertible bonds of the Company and/or its related corporations (other than wholly-owned subsidiaries), appearing in the Directors’ Report on pages 59 to 62 as recorded in the Register of Directors’ Shareholdings kept by the Company under Section 134 of the Companies Act, 1965 except for the changes set out below:
Indirect Interest No. of ordinary shares %
YBhg tan Sri Quek Leng Chan in:Hong Leong Financial Group Berhad 900,889,232(1) 78.51GL Limited (formerly known as GuocoLeisure Limited) 933,362,725 68.23
Note:(1) Inclusive of interest pursuant to Section 134(12)(c) of the Companies Act, 1965 in shares held by family member
otHer INForMatIoN
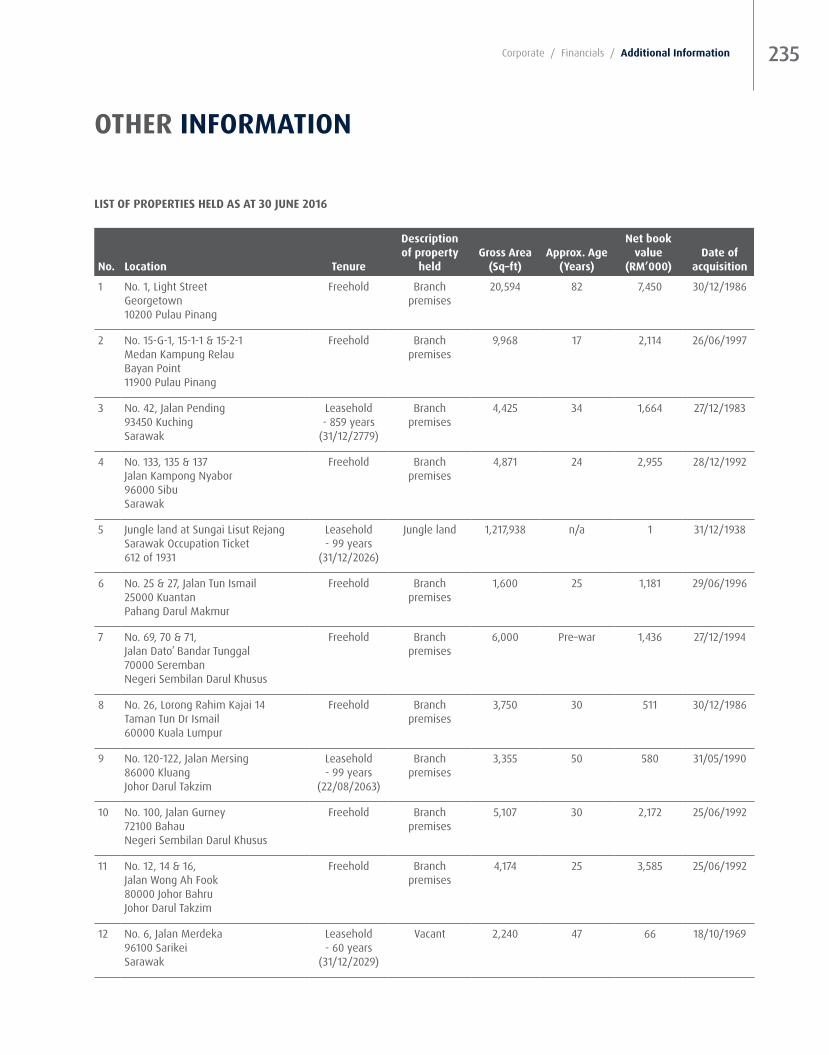
235Corporate / Financials / additional Information
otHer INForMatIoN
LISt oF propertIeS HeLD aS at 30 JUNe 2016
No. Location tenure
Descriptionof property
heldGross area
(Sq–ft)approx. age
(Years)
Net book value
(rM’000) Date of
acquisition
1 No. 1, Light StreetGeorgetown10200 Pulau Pinang
Freehold Branch premises
20,594 82 7,450 30/12/1986
2 No. 15-G-1, 15-1-1 & 15-2-1Medan Kampung RelauBayan Point11900 Pulau Pinang
Freehold Branch premises
9,968 17 2,114 26/06/1997
3 No. 42, Jalan Pending93450 KuchingSarawak
Leasehold- 859 years
(31/12/2779)
Branch premises
4,425 34 1,664 27/12/1983
4 No. 133, 135 & 137Jalan Kampong Nyabor96000 SibuSarawak
Freehold Branch premises
4,871 24 2,955 28/12/1992
5 Jungle land at Sungai Lisut RejangSarawak Occupation Ticket 612 of 1931
Leasehold - 99 years
(31/12/2026)
Jungle land 1,217,938 n/a 1 31/12/1938
6 No. 25 & 27, Jalan Tun Ismail 25000 KuantanPahang Darul Makmur
Freehold Branch premises
1,600 25 1,181 29/06/1996
7 No. 69, 70 & 71, Jalan Dato’ Bandar Tunggal70000 SerembanNegeri Sembilan Darul Khusus
Freehold Branch premises
6,000 Pre–war 1,436 27/12/1994
8 No. 26, Lorong Rahim Kajai 14 Taman Tun Dr Ismail60000 Kuala Lumpur
Freehold Branch premises
3,750 30 511 30/12/1986
9 No. 120-122, Jalan Mersing 86000 Kluang Johor Darul Takzim
Leasehold - 99 years
(22/08/2063)
Branch premises
3,355 50 580 31/05/1990
10 No. 100, Jalan Gurney 72100 BahauNegeri Sembilan Darul Khusus
Freehold Branch premises
5,107 30 2,172 25/06/1992
11 No. 12, 14 & 16,Jalan Wong Ah Fook 80000 Johor BahruJohor Darul Takzim
Freehold Branch premises
4,174 25 3,585 25/06/1992
12 No. 6, Jalan Merdeka 96100 Sarikei Sarawak
Leasehold - 60 years
(31/12/2029)
Vacant 2,240 47 66 18/10/1969

HONG LEONG FINANCIAL GROUP BERHAD ANNUAL REPORT 2016236
No. Location tenure
Descriptionof property
heldGross area
(Sq–ft)approx. age
(Years)
Net book value
(rM’000) Date of
acquisition
13 No. 63 & 65, Jalan SS 23/15 47400 Petaling JayaSelangor Darul Ehsan
Freehold Branch premises
4,760 21 3,238 28/04/1997
14 No. 24, Medan Taming 2 Taman Taming Jaya43300 BalakongSelangor Darul Ehsan
Freehold Branch premises
3,037 20 1,007 28/04/1997
15 No. 1, Jalan Takal 15/21 Seksyen 15 40000 Shah AlamSelangor Darul Ehsan
Leasehold - 99 years
(29/06/2086)
Branch premises
2,625 29 1,186 26/06/1997
16 Lots 3594 & 3595 Jalan Baru Pak Sabah 23000 Dungun Terengganu Darul Iman
Leasehold - 84 years
(02/02/2079)
Branch premises
3,199 22 204 26/06/1997
17 Lot 3073 & 3074,Jalan Abang Galau,97000 Bintulu, Sarawak
Leasehold- 60 years
(12/02/2056)
Branch premises
2,582 19 1,054 26/06/1997
18 Lot 34, Putra Industrial Park 47000 Sungai Buloh Selangor Darul Ehsan
Freehold Warehouse 96,219 20 2,649 26/01/1995
19 No. 1540, Jalan Sultan Badlishah 05000 Alor Setar Kedah Darul Aman
Leasehold - 60 years
(19/07/2030)
Vacant 10,619 41 32 30/06/1977
20 No. 9A & 9B, Jalan Kampong Baru08000 Sungai PetaniKedah Darul Aman
Freehold Branch premises
9,320 23 798 01/01/1994
21 No. 45, Jalan Burma 10500 Pulau Pinang
Freehold Branch premises
14,277 38 1,925 24/11/1978
22 No. 33A-C, Lintang Angsana Bandar Baru Air Hitam 11500 Pulau Pinang
Leasehold - 83 years
(08/04/2082)
Storage 4,394 21 373 26/12/1995
23 No. 55-57, Jalan Yang Kalsom 30250 IpohPerak Darul Ridzuan
Freehold Branch premises
11,720 37 1,010 01/10/1984
24 No. 27, Jalan Dewangsa 31000 Batu Gajah Perak Darul Ridzuan
Leasehold - 79 years
(26/02/2078)
Branch premises
4,694 21 257 24/11/1995
25 No. 75, Jalan Sultan Idris Shah 30000 IpohPerak Darul Ridzuan
Freehold Branch premises
1,900 19 616 15/06/1998
otHer INForMatIoN

237Corporate / Financials / additional Information
No. Location tenure
Descriptionof property
heldGross area
(Sq–ft)approx. age
(Years)
Net book value
(rM’000) Date of
acquisition
26 No. 80 & 82, Jalan Othman 1/14 46000 Petaling Jaya Selangor Darul Ehsan
Leasehold - 90 years
(15/06/2089)
Branch premises
9,062 26 918 01/06/1994
27 No. 19, Jalan 54, Desa Jaya 52100 Kepong Selangor Darul Ehsan
Leasehold - 99 years
(08/03/2081)
Branch premises
5,859 34 331 29/11/1985
28 No. 55, Jalan Pasar 55100 Kuala Lumpur
Freehold Branch premises
4,313 36 304 01/04/1980
29 Lot 111, Jalan Mega Mendung Kompleks Bandar Off Jalan Klang Lama 58200 Kuala Lumpur
Leasehold - 99 years
(11/10/2076)
Branch premises
4,978 36 426 31/07/1988
30 No. 161, Jalan Imbi 55100 Kuala Lumpur
Freehold Vacant 2,454 20 2,691 14/02/1996
31 No. 8A-C, Jalan Station 80000 Johor BahruJohor Darul Takzim
Freehold Branch premises
12,854 23 379 22/10/1977
32 No. 109, Main Road 83700 Yong PengJohor Darul Takzim
Freehold Branch premises
2,740 28 205 01/09/1988
33 No. 26 & 28, Jalan Mersing 80050 Johor BahruJohor Darul Takzim
Freehold Vacant 7,040 32 1,205 22/05/1995
34 No. 1, Bentong Heights 28700 BentongPahang Darul Makmur
Freehold Branch premises
5,432 48 33 30/06/1977
35 No. 36, Main Road Tanah Rata 39000 Cameron Highland Pahang Darul Makmur
Leasehold - 99 years
(24/11/2039)
Branch premises
1,728 76 106 30/08/1982
36 W-1-0, W-2-0 & W-1-1 Subang Square Business CentreJalan SS15/4G47500 Subang JayaSelangor Darul Ehsan
Freehold Branch premises
4,545 17 1,275 18/12/1999
37 No. 2828-G-02 & 2828-1-02 Jalan Bagan Luar12000 ButterworthPulau Pinang
Freehold Branch premises
12,173 17 2,424 18/12/1999
38 Lots 568-G-17 & 568-1-17 Kompleks Mutiara3 1/2 Mile Jalan Ipoh51200 Kuala Lumpur
Freehold Vacant 4,945 17 2,220 23/11/1999
otHer INForMatIoN
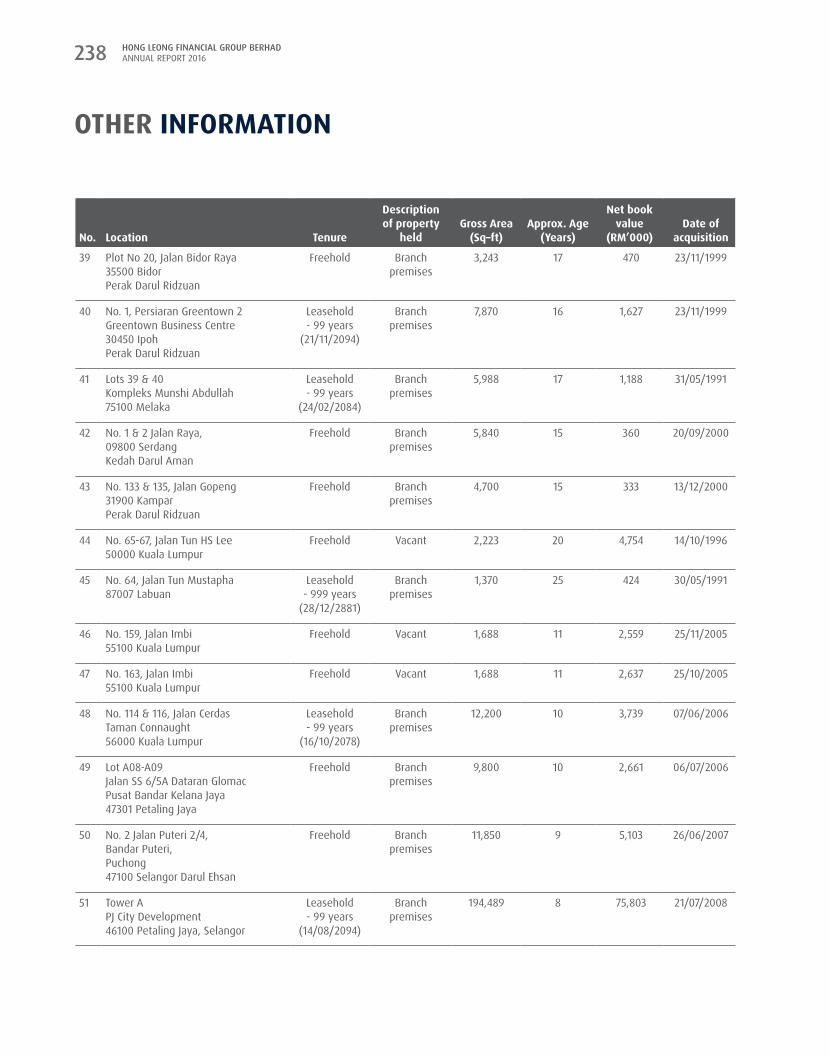
HONG LEONG FINANCIAL GROUP BERHAD ANNUAL REPORT 2016238
No. Location tenure
Descriptionof property
heldGross area
(Sq–ft)approx. age
(Years)
Net book value
(rM’000) Date of
acquisition
39 Plot No 20, Jalan Bidor Raya 35500 BidorPerak Darul Ridzuan
Freehold Branch premises
3,243 17 470 23/11/1999
40 No. 1, Persiaran Greentown 2 Greentown Business Centre 30450 Ipoh Perak Darul Ridzuan
Leasehold - 99 years
(21/11/2094)
Branch premises
7,870 16 1,627 23/11/1999
41 Lots 39 & 40 Kompleks Munshi Abdullah 75100 Melaka
Leasehold - 99 years
(24/02/2084)
Branch premises
5,988 17 1,188 31/05/1991
42 No. 1 & 2 Jalan Raya, 09800 SerdangKedah Darul Aman
Freehold Branch premises
5,840 15 360 20/09/2000
43 No. 133 & 135, Jalan Gopeng 31900 KamparPerak Darul Ridzuan
Freehold Branch premises
4,700 15 333 13/12/2000
44 No. 65-67, Jalan Tun HS Lee 50000 Kuala Lumpur
Freehold Vacant 2,223 20 4,754 14/10/1996
45 No. 64, Jalan Tun Mustapha 87007 Labuan
Leasehold - 999 years
(28/12/2881)
Branch premises
1,370 25 424 30/05/1991
46 No. 159, Jalan Imbi55100 Kuala Lumpur
Freehold Vacant 1,688 11 2,559 25/11/2005
47 No. 163, Jalan Imbi55100 Kuala Lumpur
Freehold Vacant 1,688 11 2,637 25/10/2005
48 No. 114 & 116, Jalan CerdasTaman Connaught 56000 Kuala Lumpur
Leasehold - 99 years
(16/10/2078)
Branch premises
12,200 10 3,739 07/06/2006
49 Lot A08-A09Jalan SS 6/5A Dataran GlomacPusat Bandar Kelana Jaya47301 Petaling Jaya
Freehold Branch premises
9,800 10 2,661 06/07/2006
50 No. 2 Jalan Puteri 2/4,Bandar Puteri,Puchong47100 Selangor Darul Ehsan
Freehold Branch premises
11,850 9 5,103 26/06/2007
51 Tower APJ City Development46100 Petaling Jaya, Selangor
Leasehold - 99 years
(14/08/2094)
Branch premises
194,489 8 75,803 21/07/2008
otHer INForMatIoN
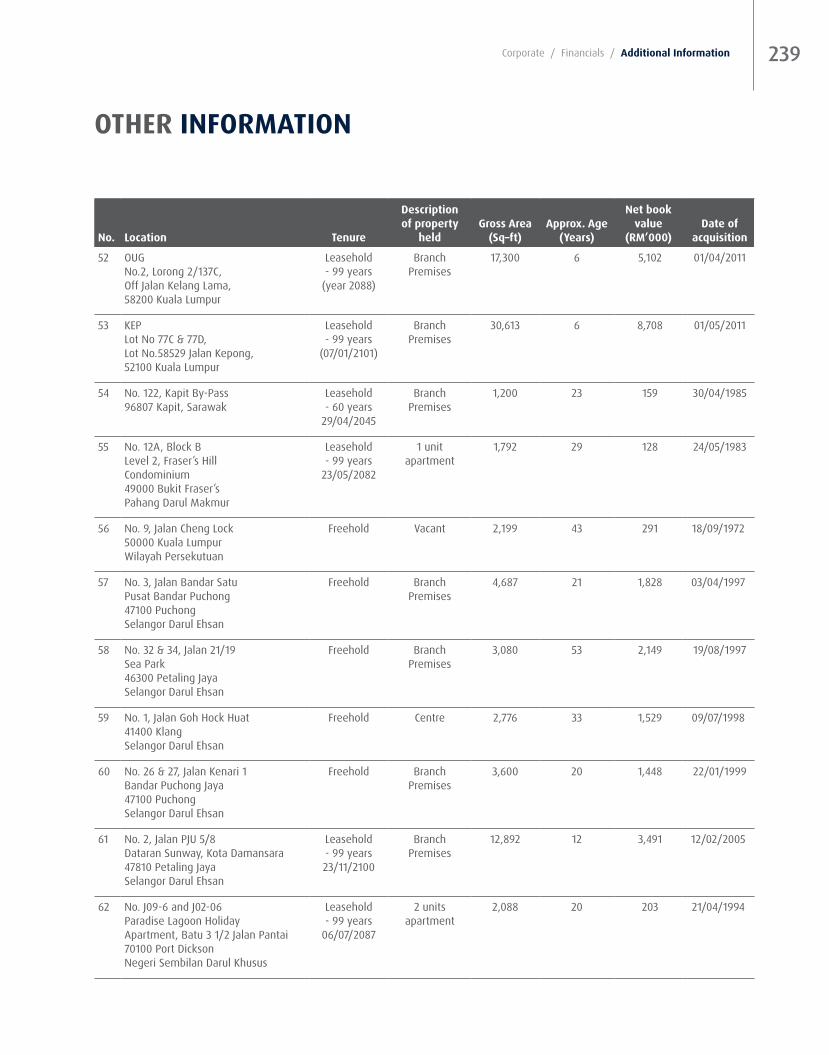
239Corporate / Financials / additional Information
No. Location tenure
Descriptionof property
heldGross area
(Sq–ft)approx. age
(Years)
Net book value
(rM’000) Date of
acquisition
52 OUGNo.2, Lorong 2/137C,Off Jalan Kelang Lama,58200 Kuala Lumpur
Leasehold- 99 years
(year 2088)
Branch Premises
17,300 6 5,102 01/04/2011
53 KEPLot No 77C & 77D, Lot No.58529 Jalan Kepong,52100 Kuala Lumpur
Leasehold- 99 years
(07/01/2101)
Branch Premises
30,613 6 8,708 01/05/2011
54 No. 122, Kapit By-Pass96807 Kapit, Sarawak
Leasehold- 60 years
29/04/2045
Branch Premises
1,200 23 159 30/04/1985
55 No. 12A, Block BLevel 2, Fraser’s HillCondominium49000 Bukit Fraser’sPahang Darul Makmur
Leasehold- 99 years
23/05/2082
1 unit apartment
1,792 29 128 24/05/1983
56 No. 9, Jalan Cheng Lock50000 Kuala LumpurWilayah Persekutuan
Freehold Vacant 2,199 43 291 18/09/1972
57 No. 3, Jalan Bandar SatuPusat Bandar Puchong47100 PuchongSelangor Darul Ehsan
Freehold Branch Premises
4,687 21 1,828 03/04/1997
58 No. 32 & 34, Jalan 21/19Sea Park46300 Petaling JayaSelangor Darul Ehsan
Freehold Branch Premises
3,080 53 2,149 19/08/1997
59 No. 1, Jalan Goh Hock Huat41400 KlangSelangor Darul Ehsan
Freehold Centre 2,776 33 1,529 09/07/1998
60 No. 26 & 27, Jalan Kenari 1Bandar Puchong Jaya47100 PuchongSelangor Darul Ehsan
Freehold Branch Premises
3,600 20 1,448 22/01/1999
61 No. 2, Jalan PJU 5/8Dataran Sunway, Kota Damansara47810 Petaling JayaSelangor Darul Ehsan
Leasehold- 99 years23/11/2100
Branch Premises
12,892 12 3,491 12/02/2005
62 No. J09-6 and J02-06Paradise Lagoon Holiday Apartment, Batu 3 1/2 Jalan Pantai70100 Port DicksonNegeri Sembilan Darul Khusus
Leasehold- 99 years
06/07/2087
2 units apartment
2,088 20 203 21/04/1994
otHer INForMatIoN

HONG LEONG FINANCIAL GROUP BERHAD ANNUAL REPORT 2016240
No. Location tenure
Descriptionof property
heldGross area
(Sq–ft)approx. age
(Years)
Net book value
(rM’000) Date of
acquisition
63 No. S-3, Kompleks NegeriJalan Dr. Krishnan70000 SerembanNegeri Sembilan Darul Khusus
Leasehold- 99 years
30/01/2078
Storage for branches
1,680 32 266 29/06/1981
64 Lot 4 & 5, Jalan TMR 1Taman Melaka Raya75000 Melaka
Leasehold- 99 years
20/03/2094
Vacant 3,132 20 530 17/04/1998
65 No. 67 & 69, Jalan Merdeka75000 Taman Merdeka RayaMelaka
Leasehold- 99 years07/07/2093
Branch Premises
3,080 21 674 15/08/1999
66 No. 21 & 23, Jalan Indah 15/1Bukit Indah, 81200 Johor BahruJohor Darul Takzim
Freehold Branch Premises
5,090 14 1,451 27/05/2002
67 No. 35, 37 & 39Jalan Johor SatuTaman Desa Cemerlang81800 Ulu TiramJohor Darul Takzim
Freehold Branch Premises
13,965 13 2,035 12/02/2003
68 No. 21, Jalan Permas 10/1Bandar Baru Permas Jaya81750 MasaiJohor Darul Takzim
Freehold Branch Premises
2,624 19 1,019 05/04/1999
69 No. C05-07Genting Permai Park & Resort6th Mile69000 Genting HighlandPahang Darul Makmur
Freehold 1 unit apartment
1,029 17 182 09/02/1996
70 No. B-278 & B-280Jalan Beserah25300 KuantanPahang Darul Makmur
Freehold Branch Premises
3,208 15 1,442 04/08/1999
71 No. 31, 33, 35 & 37Jalan Usahaniaga 1Taman Niagajaya14000 Bukit MertajamSeberang Perai Tengah, Penang
Freehold Branch Premises
15,844 13 1,163 10/07/2003
72 Lot 171, Jalan Council95000 Bandar Sri amanSarawak
Leasehold- 60 years
20/06/2050
Branch Premises
1,740 20 151 21/06/1990
73 Lot No. 2013, Jalan Pisang Barat93150 KuchingSarawak
Leasehold - 99 years31/12/2038
Storage 1,390 23 – 23/09/1992
otHer INForMatIoN

241Corporate / Financials / additional Information
No. Location tenure
Descriptionof property
heldGross area
(Sq–ft)approx. age
(Years)
Net book value
(rM’000) Date of
acquisition
74 No: 3/G14, 3/G15 & 3/G16Block 3, Lorong Api-Api 2Api-Api Centre88000 Kota KinabaluSabah
Leasehold- 99 years
31/12/2086
Branch Premises
4,141 21 1,817 04/02/1997
75 No. 177, Limbok Hill70000 Seremban, Negeri Sembilan Darul Khusus
Freehold Single-storey Detached
house
6,730 43 11 16/08/1972
76 No. 11, Jalan Emas 2Taman Emas Cheras43200 Cheras, Selangor
Freehold Storage 5,804 23 – 25/05/1993
77 No. 53 & 55, Jalan Sultan Ismail50250 Kuala Lumpur
Freehold Branch Premises
9,600 19 17,547 01/06/2015
78 No. 9, Jalan Kundang, Taman Bukit Pasir83000 Batu PahatJohor Darul Takzim
Freehold Branch Premises
7,060 34 2,677 01/06/2015
79 No. 300, Jalan Jelutong11600 Pulau Pinang
Freehold Branch Premises
16,652 14 14,603 23/06/2015
80 Lot 1, Block 35,Fajar Commercial ComplexJalan Lembaga91000 Tawau, Sabah
Leasehold - 998 years(31/12/2895)
Branch Premises
13,880 44 5,129 17/08/2015
81 Lot 942 Jalan Parry98000 MiriSarawak
Leasehold- 60 Years
(06/04/2057)
Branch premises
5,496 19 862 31/01/1997
82 Lot 1, 2 & 3, Block 18, Bandar IndahMile 4, North RoadBandar IndahSandakan, Sabah
Freehold Branch premises
6,760 16 1,940 08/11/2001
83 No 3 Persiaran Greentown 4GreentownBusiness Centre30450 Ipoh
Leasehold- 99 Years
(21/11/2094)
Branch premises
8,846 21 476 04/12/1995
84 Bangunan HLA7 Jalan Yayasan86000 Kluang
Leasehold- 99 Years
(23/03/2084)
Branch premises
6,019 27 403 30/12/1989
85 Wisma Hong Leong18 Jalan Perak50450 Kuala Lumpur
Freehold Office premises 333,594 15 262,800 13/11/2001
otHer INForMatIoN
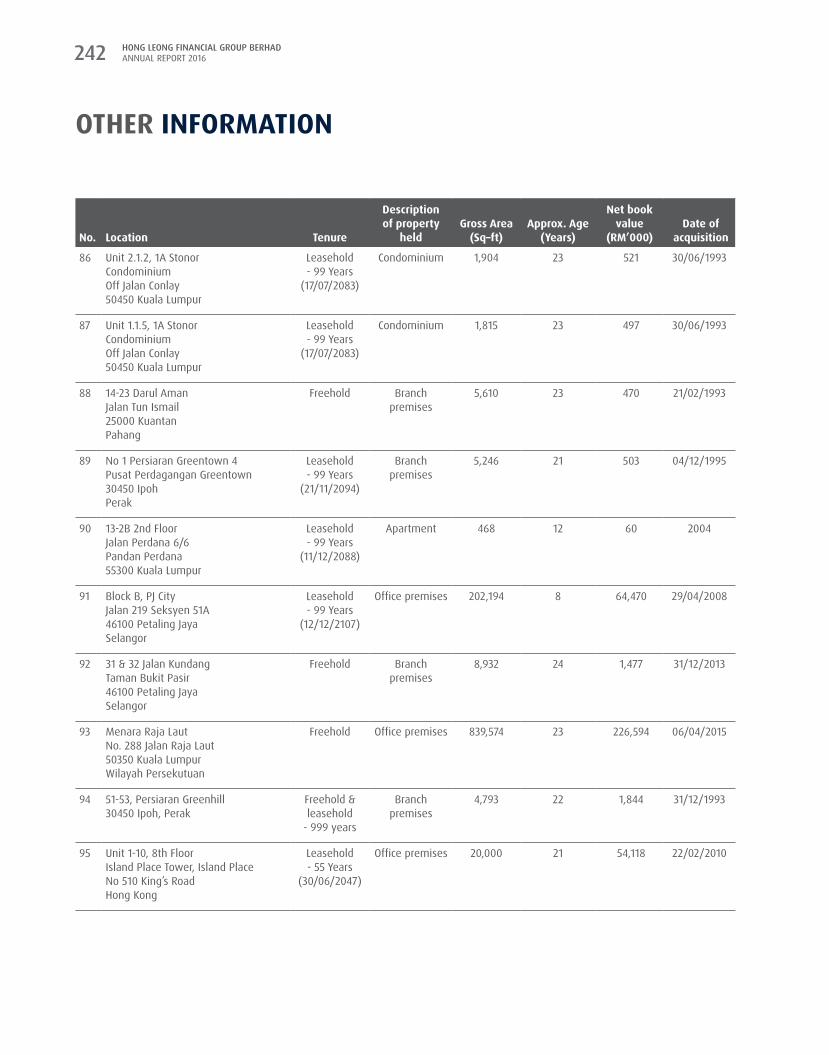
HONG LEONG FINANCIAL GROUP BERHAD ANNUAL REPORT 2016242
No. Location tenure
Descriptionof property
heldGross area
(Sq–ft)approx. age
(Years)
Net book value
(rM’000) Date of
acquisition
86 Unit 2.1.2, 1A StonorCondominiumOff Jalan Conlay50450 Kuala Lumpur
Leasehold- 99 Years
(17/07/2083)
Condominium 1,904 23 521 30/06/1993
87 Unit 1.1.5, 1A StonorCondominiumOff Jalan Conlay50450 Kuala Lumpur
Leasehold- 99 Years
(17/07/2083)
Condominium 1,815 23 497 30/06/1993
88 14-23 Darul AmanJalan Tun Ismail25000 KuantanPahang
Freehold Branch premises
5,610 23 470 21/02/1993
89 No 1 Persiaran Greentown 4Pusat Perdagangan Greentown30450 IpohPerak
Leasehold- 99 Years
(21/11/2094)
Branch premises
5,246 21 503 04/12/1995
90 13-2B 2nd FloorJalan Perdana 6/6Pandan Perdana55300 Kuala Lumpur
Leasehold- 99 Years
(11/12/2088)
Apartment 468 12 60 2004
91 Block B, PJ CityJalan 219 Seksyen 51A46100 Petaling JayaSelangor
Leasehold- 99 Years
(12/12/2107)
Office premises 202,194 8 64,470 29/04/2008
92 31 & 32 Jalan KundangTaman Bukit Pasir46100 Petaling JayaSelangor
Freehold Branch premises
8,932 24 1,477 31/12/2013
93 Menara Raja LautNo. 288 Jalan Raja Laut50350 Kuala LumpurWilayah Persekutuan
Freehold Office premises 839,574 23 226,594 06/04/2015
94 51-53, Persiaran Greenhill30450 Ipoh, Perak
Freehold &leasehold
- 999 years
Branch premises
4,793 22 1,844 31/12/1993
95 Unit 1-10, 8th FloorIsland Place Tower, Island PlaceNo 510 King’s RoadHong Kong
Leasehold- 55 Years
(30/06/2047)
Office premises 20,000 21 54,118 22/02/2010
otHer INForMatIoN

(8024-W)
I/We NRIC/Passport/Company No. of being a member of HONG LEONG FINANCIAL GROUP BERHAD (the “Company”), hereby appoint
NRIC/Passport No. of
or failing him/her
NRIC/Passport No. of
or failing him/her, the Chairman of the meeting as my/our proxy/proxies to vote for me/us on my/our behalf at the Forty-seventh Annual General Meeting of the Company to be held at the Theatrette, Level 1, Wisma Hong Leong, 18 Jalan Perak, 50450 Kuala Lumpur on Thursday, 27 October 2016 at 11.30 a.m. and at any adjournment thereof.
My/Our proxy/proxies is/are to vote as indicated below with an “X”:
reSoLUtIoNS For aGaINSt1. To approve the payment of Director Fees2. To re-elect Mr Tan Kong Khoon as a Director3. To re-elect Mr Saw Kok Wei as a Director4. To re-appoint YBhg Tan Sri Quek Leng Chan as a Director pursuant to Section 129 of the Companies Act, 19655. To re-appoint YBhg Tan Sri Dato’ Seri Khalid Ahmad bin Sulaiman as a Director pursuant to Section 129 of the
Companies Act, 19656. To re-appoint Messrs PricewaterhouseCoopers as Auditors of the Company and authorise the Directors to fix their
remuneration.Special Business7. To approve the ordinary resolution on Authority to Directors to Issue Shares8. To approve the ordinary resolution on the Proposed Renewal of Shareholders’ Mandate for Recurrent Related Party
Transactions of a Revenue or Trading Nature with Hong Leong Company (Malaysia) Berhad (“HLCM”) and Persons Connected with HLCM
9. To approve the ordinary resolution on the Proposed Renewal of Shareholders’ Mandate for Recurrent Related Party Transactions of a Revenue or Trading Nature with Tower Real Estate Investment Trust
10 To approve the ordinary resolution on the Proposed Allocation of Options and/or Grants to Mr Tan Kong Khoon
Dated this …………………… day of ………………….…. 2016
_______________________________________ _______________________________________Number of shares held Signature(s) of Member
Notes:1. For the purpose of determining members’ eligibility to attend this meeting, only members whose names appear in the Record of Depositors as at 21 October 2016 shall be entitled
to attend this meeting or appoint proxy(ies) to attend and vote on their behalf.2. If you wish to appoint other person(s) to be your proxy, insert the name(s) and address(es) of the person(s) desired in the space so provided.3. If there is no indication as to how you wish your vote(s) to be cast, the proxy will vote or abstain from voting at his/her discretion.4. A proxy may but need not be a member of the Company and the provisions of Section 149(1)(b) of the Companies Act, 1965 shall not apply to the Company.5. Save for a member who is an exempt authorised nominee, a member shall not be entitled to appoint more than two (2) proxies to attend and vote at the same meeting. Where a
member of the Company is an authorised nominee as defined under the Securities Industry (Central Depositories) Act, 1991, it may appoint not more than two (2) proxies in respect of each securities account it holds with ordinary shares of the Company standing to the credit of the said securities account. A member who is an exempt authorised nominee for multiple beneficial owners in one securities account (“Omnibus Account”) may appoint any number of proxies in respect of the Omnibus Account.
6. Where two (2) or more proxies are appointed, the proportion of shareholdings to be represented by each proxy must be specified in the instrument appointing the proxies, failing which the appointments shall be invalid (please see note 9 below).
7. In the case where a member is a corporation, this Form of Proxy must be executed under its Common Seal or under the hand of its Attorney.8. All Forms of Proxy must be duly executed and deposited at the Registered Office of the Company at Level 8, Wisma Hong Leong, 18 Jalan Perak, 50450 Kuala Lumpur not less than
48 hours before the time and date of the meeting or adjourned meeting.9. In the event two (2) or more proxies are appointed, please fill in the ensuing section:
Name of proxies % of shareholdings to be represented
10. Pursuant to Paragraph 8.29A(1) of the Main Market Listing Requirements of Bursa Malaysia Securities Berhad, all resolutions set out in the notice of the Annual General Meeting will be put to vote by way of a poll.
ForM oF proXY

Fold this flap for sealing
Then fold here
the Group Company Secretary
HoNG LeoNG FINaNCIaL GroUp BerHaD(Company No. 8024-W)
Level 8, Wisma Hong Leong18 Jalan Perak50450 Kuala LumpurMalaysia
1st fold here
AFFIXSTAMP

Hong Leong Financial Group Berhad (8024-W)
Level 8, Wisma Hong Leong18 Jalan Perak, 50450 Kuala LumpurTel : 03-2164 8228Fax : 03-2164 2503
www.hlfg.com.my


