27
Vision or division? What do National Energy and Climate Plans tell us about the EU power sector in 2030?

Vision or division?What do National Energy and Climate Plans tell us about the EU power sector in 2030?

AuthorCharles Moore (Ember)
ContributorsPete Tunbridge (Ember)Małgorzata Kasprzak (Ember)Euan Graham (Ember)
Published dateNovember 2020
DisclaimerThe information in this report is complete and accurate to the best of our knowledge, but if you spot an error, please email [email protected]
Creative CommonsThis report is published under a Creative Commons ShareAlike Attribution Licence (CC BY-SA 4.0). You are actively encouraged to share and adapt the report, but you must credit the authors and title, and you must share any material you create under the same licence.
Image credits:All graphs were created using Flourish.
Design by Wilf Lytton Cover icons by Olena Panasovska via The Noun Project
Copyright © Ember, 2020

iii
VISION OR DIVISION?
Executive summaryA rapid decarbonisation of electricity generation will be essential to limiting global warming to 1.5°C. In this report, we use the National Energy & Climate Plans (NECPs) of every EU country to assess the planned progress in the power sector over the coming decade.
Furthermore, we compare each EU country on a wide range of power sector metrics and identify which countries are the main barriers to reducing emissions from electricity generation in the EU.
Key findingsIn the next decade, renewable electricity generation will almost double to deliver nearly 60% of EU electricity by 2030. This growth is driven by wind and solar which will account for at least 40% of supply. Despite this progress, fossil fuels are still expected to generate about 25% of EU electricity by 2030, with coal power only halving over the next decade and no plan to reduce fossil gas.
As a result, the EU is not on track to deliver the EU Commission’s recommended 55% reduction in total emissions by 2030. To achieve this target, progress needs to be made in seven key countries and wind and solar deployment plans must increase by a third.
* Renewables and wind and solar share are rounded from 59.1% and 41.4% respectively.
Renewables SHARE OF ELECTRICITY CONSUMPTION
Wind & Solar SHARE OF ELECTRICITY CONSUMPTION
Emissions intensity gCO2/KWh
60%2030*
40%2030*
1502030
32%2018
15%2018
3002018

iv
VISION OR DIVISION?
Key countries blocking the EU electricity transition
• Limited or no progress: Belgium, Bulgaria, Czechia, Romania and Poland. Their NECPs indicate limited or no progress in the power sector over the entirety of the coming decade. Combined the countries account for 40% of 2030 power sector emissions.
• Slow progress: Germany and Italy. Their NECPs indicate progress in the power sector is slow over the next decade and this is a concern given the size of their economies and electricity demand. Combined the two countries account for 40% of 2030 power sector emissions.
With the EU expected to strengthen climate targets for 2030, national governments will need to revisit their plans for the electricity system and identify where further emissions savings can be made. Our analysis makes it clear that this task is especially urgent in Belgium, Bulgaria, Czechia, Germany, Italy, Poland and Romania.

Contents
Executive summary iii
Introduction 1
Methodology 2
Data quality 2
Key Conventions 3
Note on share of electricity production/consumption 3
Analysis Results 4
Renewables 4
All RES ambition 4
Wind and Solar 5
Bioenergy 7
Renewable Energy Sources (RES) Share 9
Nuclear 11
Fossil Fuels 12
Coal 12
Fossil Gas 13
Other Fossil Fuels 14
Total Fossil Fuels 14
Fossil fuel share of electricity production 14
Electricity Demand 16
Emissions 18
Emissions factors 18
Total Emissions 18
Emissions Intensity 19
Conclusion 20
References 21
VISION OR DIVISION?

1
VISION OR DIVISION?
IntroductionThe 2020s are a key decade for action on climate change. According to the UN Environment Program (UNEP), by 2030, emissions would need to be 55% lower than in 2018 to put the world on the least-cost pathway to limiting global warming to 1.5°C [1].
There are many different pathways we can take to meet the 1.5°C limit, however, in the scenarios modelled by the Intergovernmental Panel on Climate Change (IPCC) [2] all 1.5C pathways share certain features, including unabated coal use being largely phased out by mid-century, renewables meeting the majority of future electricity supplies and energy use being progressively electrified and made more efficient [3]. Rapid progress in the electricity sector is therefore essential to limiting global warming to 1.5°C.
The EU’s National Energy & Climate Plans (NECPs) provide us with a new tool to assess the planned progress in the electricity sector over the coming key decade. By the end of 2019, EU Member States needed to submit a final NECP to the EU Commission. The NECPs are a key tool in the Governance Regulation where each Member State has to describe, in an integrated manner, its climate and energy objectives, targets, policies and measures for the period from 2021 to 2030.
In this report we use the NECPs to identify the countries where major transformations to decarbonise the electricity sector are planned and, crucially, to highlight the countries that are falling behind. It is important to emphasise that while the NECPs describe a government’s ambition, this does not mean that the policies and measures to achieve that ambition are actually in place. An assessment of the credibility of the plans was outside of the scope of this report1. The European Commission has proposed that the EU steps up its climate ambition and delivers at least a 55% reduction in emissions by 2030 (compared to 1990 levels), and the EU Parliament recently voted for an even sharper cut of 60%. In this policy environment, we hope this report helps to identify the countries that urgently need to raise their ambition in the power sector to put the EU on track for its enhanced climate objectives.
1. Assessments of the NECPs of this nature can be found from the relevant industry trade bodies, for example, wind: https://windeurope.org/2030plans/ and solar: https://www.solarpowereurope.org/priorities/national-energy-and-climate-plans/

2
VISION OR DIVISION?
MethodologyWe have analysed the National Energy & Climate Plans (NECPs) and the associated national planning documents of each of the 27 EU countries and collected all relevant data and statements regarding the proposals for electricity generation. The analysis was completed in October 2020 through a combination of desk-based research and direct contact with the national government departments responsible for the NECPs.
Although the NECPs provide enough data to assess the trajectory of the electricity transition in each country to a reasonable degree of accuracy, data is not available for all fuel types and all countries. Where data is unavailable we have made an estimate based on other data in the NECPs or the associated national planning documents or historic data. Where approximations have been made, these are detailed as notes in the accompanying dataset. An overview of the data quality for the variables discussed in this analysis is given below.
Data quality
Data Type Confidence
Renewables - electricity generation by type.
High. Nearly all NECPs provide data for at least 2025 & 2030.
RES-E Share (of gross final electricity consumption).
High. Nearly all NECPs provide data for at least 2025 & 2030.
Nuclear - electricity generation.
Medium to high. Nearly all NECPs provide data for at least 2025 & 2030. France’s NECP only provides data for 2023 & 2028 and net rather than gross. Some approximations are therefore required.
Coal - electricity generation.
Medium to high. Nearly all NECPs provide data for at least 2025 & 2030, however there is insufficient data on the split between hard coal and lignite.
Fossil gas - electricity generation.
Medium to high. Nearly all the NECPs of the large fossil gas users provide data for at least 2025 & 2030. Data quality is worse for smaller users/countries, some approximations are therefore required.
Other fossil fuels (e.g. non-renewable waste, derived gases, oil, oil shale etc.) - electricity generation.
Medium to low. The data is patchy and often not disaggregated from the other fuel types (e.g. non-renewable waste gets combined with coal), many approximations required for smaller countries. However, the data is better for the larger users and so confidence in the EU-27 total figures is slightly higher.
Electricity consumption (gross).
Medium. Most countries provide data for 2025 & 2030 although some data is inconsistent with other parts of the NECP and some data is provided net rather than gross. Approximations are required for a number of countries.
Emissions intensity of electricity production.
Medium. Generation by fuel type data is mostly adequate for the calculation, however, the lack of disaggregation of coal into hard coal and lignite requires approximations which add uncertainty. We use standard emissions factors for each fuel type which will not capture the nuances of plant efficiency at a country level which is difficult to predict for 2030.
3
VISION OR DIVISION?
Key Conventions
The data in this analysis is displayed under the following conventions.
1. The electricity data is sourced preferentially from projections in the NECP which are modelled with additional measures (WAM). I.e. projections that include all currently implemented policies and measures and options that are under discussion that have a realistic chance of being adopted and implemented after the date of submission of the NECP. Where an NECP only provides electricity data for projections with existing measures (WEM) this is stated in the notes accompanying the data.
2. In this report we use the following fuel classifications:
a. Coal: sum of Eurostat fuel classification: Solid Fossil Fuels (which includes: Anthracite, Coking coal, Other bituminous coal, Sub-bituminous coal, Lignite, Coke oven coke, Gas coke, Patent fuel, Brown coal briquettes).
b. Fossil Gas: sum of Eurostat classification: Natural Gas
c. Other Fossil: sum of Eurostat classifications: Manufactured gases, Peat and peat products, Oil shale and oil sands, Oil and petroleum products (excluding biofuel proportion) and Non-renewable waste.
3. Electricity generation and consumption is stated gross.
4. 19 out of the 27 EU countries account for > 97% of total EU-27 electricity consumption. In the following analysis, where country-by-country data is displayed on a chart, for visual simplicity only these 19 countries are displayed. The data for all countries is available in the data download which accompanies the report.
Note on share of electricity production/consumption
Shares of renewable electricity sources (RES) in the electricity mix are displayed as share of electricity consumption. The RES share of gross final electricity consumption2 must be included in the NECPs according to the Governance Regulation and therefore data availability and quality is good. Similarly, data quality and availability of renewable electricity production by each source is good and so the RES share of gross final electricity consumption can be disaggregated into its component parts with high confidence.
Due to the lower availability and confidence in the electricity consumption data, and the normal conventions for displaying fuel mixes, the shares of fossil fuel sources (and nuclear) in the electricity mix are displayed as share of electricity production.
2. A definition is provided here: https://ec.europa.eu/knowledge4policy/dataset/jrc-nreaps-gfec-e_en
4
VISION OR DIVISION?
The shares of renewables in electricity production by country are also available in the attached dataset if required. It is worth noting that the EU share of renewables in production is notably lower than in consumption because the total EU-27 production figures imply large exports to the EU’s neighbours. We believe this is more likely due to overestimates of fossil fuel production in the NECPs due to inadequate modelling of electricity exchange between neighbours rather than a likely feature of the 2030 electricity market. For more detail please see the Total Fossil Fuels section in the main body of the analysis.
Analysis ResultsRenewablesAll RES ambition
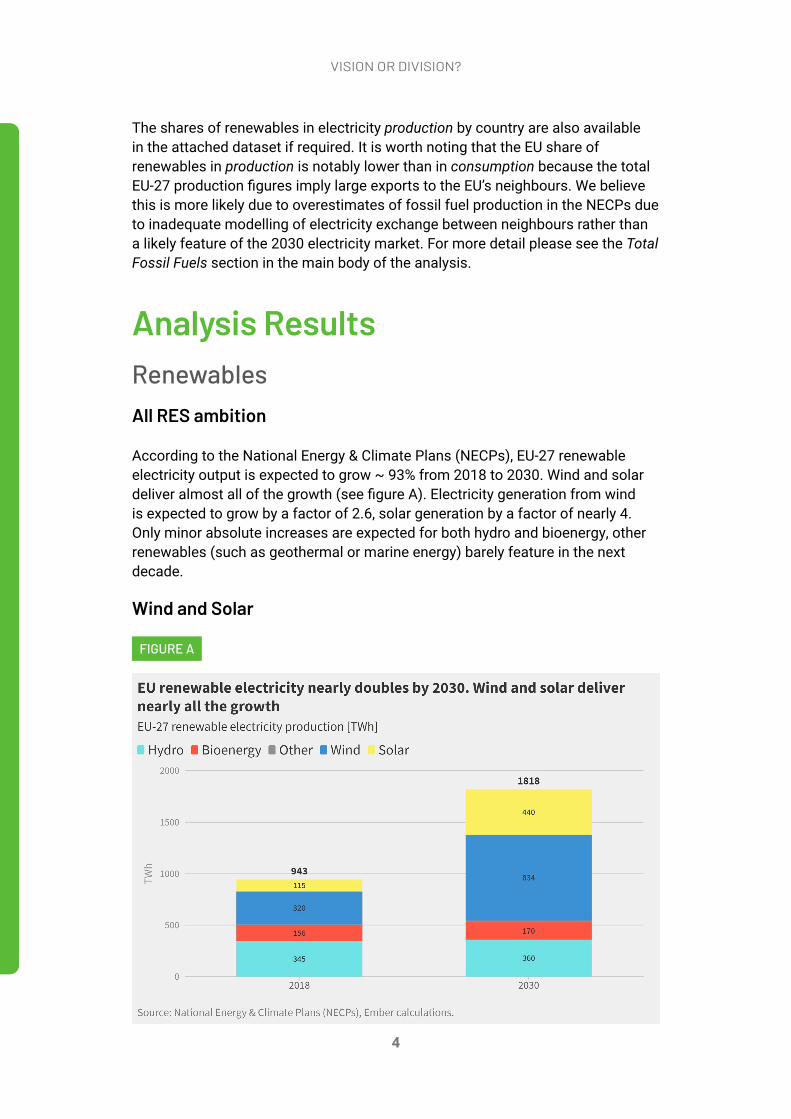
According to the National Energy & Climate Plans (NECPs), EU-27 renewable electricity output is expected to grow ~ 93% from 2018 to 2030. Wind and solar deliver almost all of the growth (see figure A). Electricity generation from wind is expected to grow by a factor of 2.6, solar generation by a factor of nearly 4. Only minor absolute increases are expected for both hydro and bioenergy, other renewables (such as geothermal or marine energy) barely feature in the next decade.
Wind and Solar
FIGURE A
5
VISION OR DIVISION?
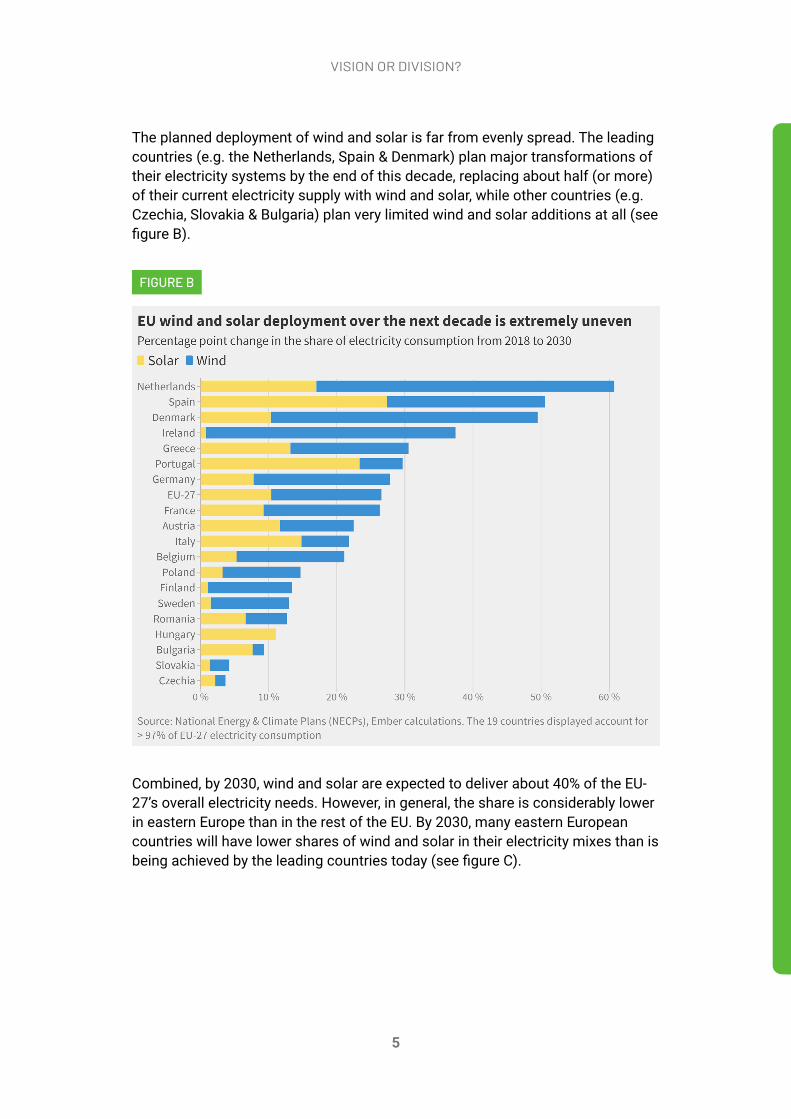
The planned deployment of wind and solar is far from evenly spread. The leading countries (e.g. the Netherlands, Spain & Denmark) plan major transformations of their electricity systems by the end of this decade, replacing about half (or more) of their current electricity supply with wind and solar, while other countries (e.g. Czechia, Slovakia & Bulgaria) plan very limited wind and solar additions at all (see figure B).
Combined, by 2030, wind and solar are expected to deliver about 40% of the EU-27’s overall electricity needs. However, in general, the share is considerably lower in eastern Europe than in the rest of the EU. By 2030, many eastern European countries will have lower shares of wind and solar in their electricity mixes than is being achieved by the leading countries today (see figure C).
FIGURE B

6
VISION OR DIVISION?
Accelerating the deployment of wind and solar is critical to achieving the EU’s commitments under the Paris Agreement. The EU Commission’s impact assessment on stepping up Europe's 2030 climate ambition [4] identified the need for ~ 1500TWh3 of electricity production from wind and solar by 2030 to deliver their recommended emissions reduction of 55% vs. 1990. Recent modelling by Climact [5] also arrived at a similar figure4. To deliver this increase, annual wind and solar deployment must triple vs. the average rate seen in the last decade. The NECPs so far commit to only a doubling of annual deployment (see figure D) delivering ~ 1250 TWh by 2030. Annual deployment of wind and solar therefore needs to be raised by a third (~25TWh/y) vs. the current plans.
For the EU to do its fair share under the Paris Agreement, which would mean climate neutrality before 20505, a more radical scale up of wind and solar deployment would be required.
3. The number is an average of the REG, MIX and CPRICE scenarios and is estimated from Figure 47.4. The “similar figure” is the two scenario average of the 55% Technology-focused scenario which assumes
considerably higher wind and solar additions than the EU Commission and the 55% Shared Effort scenario which assumes lower additions because it includes more action on lifestyle and socio-cultural changes.
5. The IPCC's 1.5°C report made it clear that in order to have a decent chance to limit dangerous temperature rise, global carbon emissions will need each net-zero by 2050. All countries need to contribute to this global challenge, but rich countries such as the EU are expected to do more and go faster. Both the United Nations Framework Convention on Climate Change and the Paris Agreement emphasise the need for countries to reduce their emissions based on their historical responsibility and their capacity to act.
FIGURE C

7
VISION OR DIVISION?
The PAC project consortium [6] have developed a scenario which investigated what it would take to deliver the following outcomes: 100% renewables in Europe by 2040 in all sectors; a 65% reduction in greenhouse gas emissions by 2030; and, crucially, net-zero greenhouse gas emissions by 2040. Annual wind and solar deployment needed over the next decade in the PAC scenario is more than triple the commitments currently made in the NECPs (252TWh/y vs. ~75TWh/y).
Bioenergy
Compared to wind and solar, bioenergy (especially woody biomass) is a higher risk source of renewable electricity, both in terms of whether real climate benefits are achieved once the full lifecycle emissions are accounted for and on wider concerns regarding the impacts on biodiversity and food production etc. In reality, only fast decaying, industrial or genuine forestry residues are likely to deliver climate benefits vs. fossil fuels over timescales relevant to meeting the commitments under the Paris Agreement [7].
FIGURE D

8
VISION OR DIVISION?
With the availability of such residues in short supply and renewable electricity from wind and solar now available at lower cost, burning bioenergy for electricity generation looks like a poor use of a limited and high risk resource6. The limited resource should be saved for the sectors that are much harder to decarbonise than electricity.
While the growth in electricity generation from bioenergy is quite small vs. wind and solar (see figure A in the previous section) it is still expected to grow ~ 10% between 2018 and 2030 and some larger changes at national level are hidden within the EU total (see figure E). Although data on the type of bioenergy used is more limited, it is clear that solid biomass will account for the large majority of the growth7.
6. The possible expectation is burning bioenergy for electricity generation with carbon capture and storage (BECCS) to deliver negative emissions, which would, in theory be a high value use of bioenergy. However, whether negative emissions could be delivered in reality at scale - and over relevant timescales - remains contentious (e.g. see: Chatham House: Net Zero and Beyond: What Role for Bioenergy with Carbon Capture and Storage?). Furthermore, where our NECP analysis identifies increases in electricity generated from bioenergy, the bioenergy is being burnt without CCS.
7. The breakdown of bioenergy growth by source (solid biomass / biogas) etc. is not provided in the data file attached with this report due to the lack of a consistent dataset across all EU countries. However, please do contact us if this would be useful for your work, we would be happy to share what we have.
FIGURE E

9
VISION OR DIVISION?
The NECPs identify Poland, Spain, Finland and Sweden and the largest growth regions for electricity generation from bioenergy. The largest declines over the same period are in Italy and Germany.
Renewable Energy Sources (RES) Share
Including all sources currently classified as renewable by the EU Commission, the NECPs indicate that RES will supply approximately 59% of EU-27 electricity demand by 2030. This is lower than the 64-65%8 that the EU Commission estimates will be required to deliver a 55% reduction in emissions vs. 1990 by 2030 [4].
The pattern of leading and lagging countries is broadly similar to that of wind and solar (see figure F), with all countries in eastern Europe below (Romania) or significantly below (Czechia, Hungary, Slovakia, Bulgaria & Poland) the EU average for RES share in electricity consumption. The Nordic countries fare better on this metric vs. wind and solar given their high shares of hydro and bioenergy.
8. In the main policy scenarios (REG, MIX, CPRICE). See figure 40 in the referenced document.
FIGURE F
10
VISION OR DIVISION?
Excluding bioenergy from the figures would reduce the RES share of total EU-27 electricity consumption to ~ 54% (from ~ 59%) but would not materially impact the overall story of the leading and lagging countries. Finland, Sweden, Denmark and Poland have the highest proportion of bioenergy in their projected total electricity generation from RES in 2030 and would therefore be most impacted by the change.
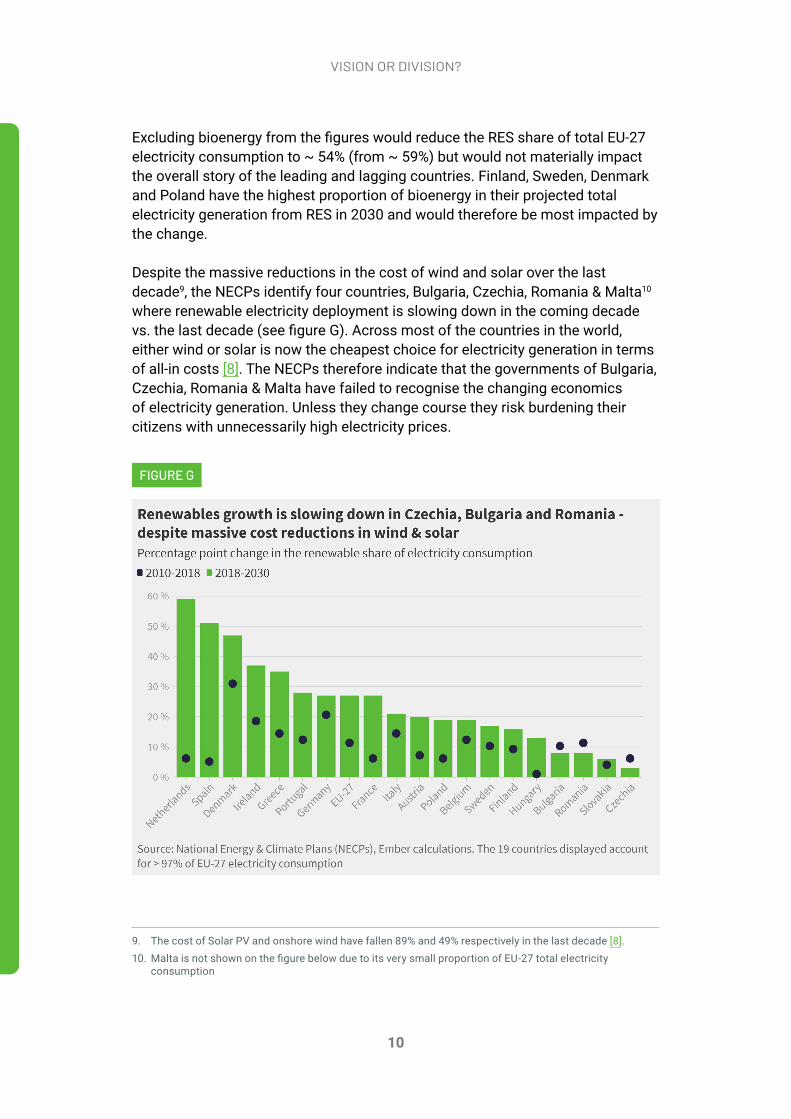
Despite the massive reductions in the cost of wind and solar over the last decade9, the NECPs identify four countries, Bulgaria, Czechia, Romania & Malta10 where renewable electricity deployment is slowing down in the coming decade vs. the last decade (see figure G). Across most of the countries in the world, either wind or solar is now the cheapest choice for electricity generation in terms of all-in costs [8]. The NECPs therefore indicate that the governments of Bulgaria, Czechia, Romania & Malta have failed to recognise the changing economics of electricity generation. Unless they change course they risk burdening their citizens with unnecessarily high electricity prices.
9. The cost of Solar PV and onshore wind have fallen 89% and 49% respectively in the last decade [8]. 10. Malta is not shown on the figure below due to its very small proportion of EU-27 total electricity
consumption
FIGURE G

11
VISION OR DIVISION?
NuclearNuclear power is a source of zero carbon electricity, however the NECPs indicate that total electricity generated from nuclear power plants in the EU-27 is expected to fall by ~19% by 2030, generating 619 TWh11, down from 762 TWh in 2018. The largest fall is in Germany where all nuclear power plants must be phased out by the end of 2022 under national law.
At a national level, a few countries are targeting an increase in nuclear output in the next decade. The largest rises are in Finland and Hungary (see figure H).
Finland expects to bring online the much delayed Olkiluoto 3 reactor this year with the further addition of the Hanhikivi nuclear power plant in the late 2020s. In Hungary two new nuclear power plant units are planned to start by 2030, each with a capacity of 1200 MW (the Paks 2 project).
New nuclear reactors are also planned in Bulgaria, Czechia and Poland but they will not commence operation before 2030 and so will not contribute to the reduction of carbon emissions in the coming decade.
11. N.b this is a little higher than the 585 TWh the EU Commission expects in their baseline scenario for 2030 in the impact assessment on stepping up Europe’s 2030 climate ambition. The cause of the discrepancy is unclear.
FIGURE H

12
VISION OR DIVISION?
Fossil FuelsTo reduce the threat of climate change it is essential that the EU phases-out the use of fossil fuels in electricity supply as quickly as possible. The following section identifies the EU countries which are planning electricity systems most reliant on fossil fuels in 2030.
Coal
Coal is the most carbon intensive fossil fuel. To meet the EU’s commitments under the Paris Agreement and limit global temperature rise to 1.5°C, all EU countries need to phase out coal by 2030 [9]. However, according to the NECPs, electricity generation from coal is expected to supply ~ 282TWh in 2030, a fall of just 53% vs. 2018.
Approximately 90% of the remaining electricity generation from coal is expected to be from three countries, Germany, Poland & Czechia. Furthermore, very limited reductions in coal generation are planned in Poland, Czechia, Bulgaria and Romania over the entirety of the next decade (see figure I).
FIGURE I
13
VISION OR DIVISION?
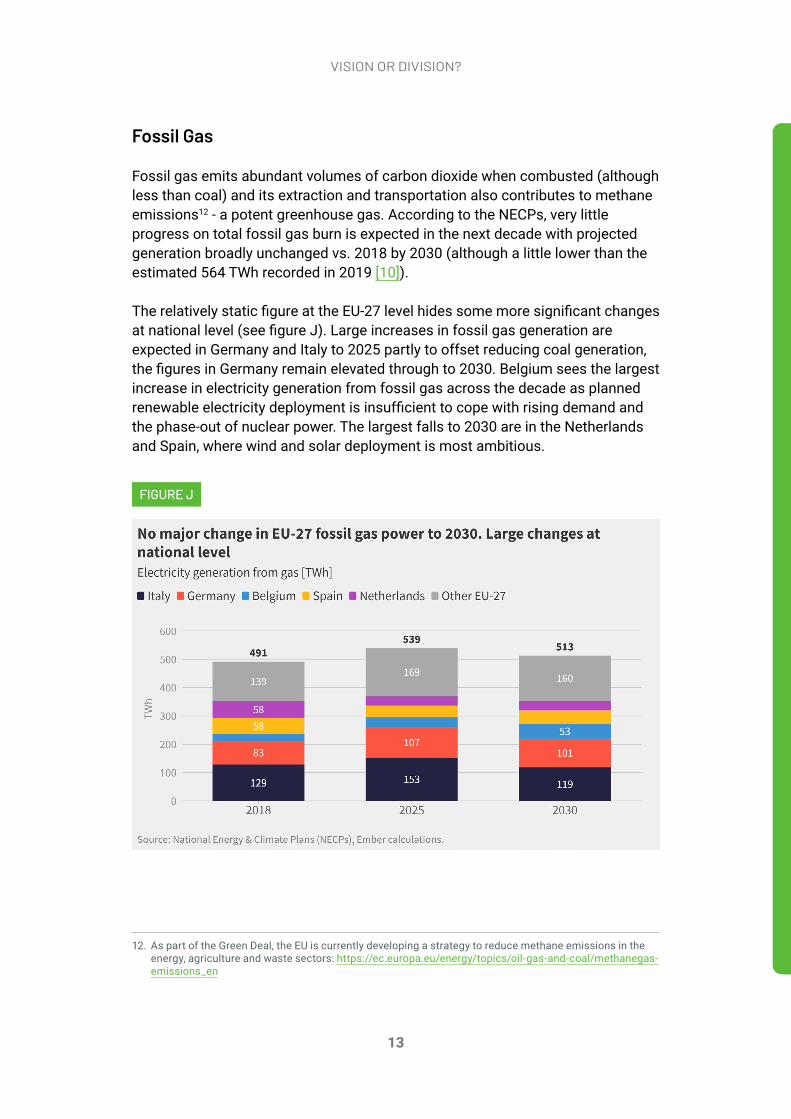
Fossil Gas
Fossil gas emits abundant volumes of carbon dioxide when combusted (although less than coal) and its extraction and transportation also contributes to methane emissions12 - a potent greenhouse gas. According to the NECPs, very little progress on total fossil gas burn is expected in the next decade with projected generation broadly unchanged vs. 2018 by 2030 (although a little lower than the estimated 564 TWh recorded in 2019 [10]).
The relatively static figure at the EU-27 level hides some more significant changes at national level (see figure J). Large increases in fossil gas generation are expected in Germany and Italy to 2025 partly to offset reducing coal generation, the figures in Germany remain elevated through to 2030. Belgium sees the largest increase in electricity generation from fossil gas across the decade as planned renewable electricity deployment is insufficient to cope with rising demand and the phase-out of nuclear power. The largest falls to 2030 are in the Netherlands and Spain, where wind and solar deployment is most ambitious.
12. As part of the Green Deal, the EU is currently developing a strategy to reduce methane emissions in the energy, agriculture and waste sectors: https://ec.europa.eu/energy/topics/oil-gas-and-coal/methanegas-emissions_en
FIGURE J

14
VISION OR DIVISION?
Other Fossil Fuels
We estimate that electricity generation from other fossil fuels (mostly oil, industrial gases & non-renewable waste) across the EU-27 is expected to fall ~ 40% (to c. 72TWh) between 2018 and 2030 on the plans currently set out in the NECPs. The reductions are primarily driven by the fall in the use of oil to generate electricity. Due to data quality and availability issues this is the figure we have the lowest confidence in (see the methodology section for more information).
Total Fossil Fuels
Overall, according to the figures set out in the NECPs, total electricity generation from fossil fuels is expected to fall ~ 30% by 2030 (vs. 2018) to ~ 870 TWh. Crucially this figure is over 100 TWh13 higher than the EU Commission expect in their baseline scenario [4] which models the impact of the existing 2030 climate and energy legislative framework, including the agreed climate and energy targets as well as the main policy tools to implement these. The figures suggest some EU countries may be overestimating the likely electricity production from fossil fuels. Using the data available in the EU Commission’s impact assessment [4] [11], we estimate that the large majority (~ 80 TWh14) of this discrepancy between the NECPs and the EU Commission’s modelling is due to higher estimates of coal generation in the NECPs.
Fossil fuel share of electricity production
Based on the data taken from the NECPs, approximately a quarter of total EU electricity production will still be generated from fossil fuels in 2030, down from 42% in 2018. The share by country varies wildly and is shown in figure K. Poland and Belgium are huge outliers with fossil fuels responsible for well over half of electricity generation in 2030. Belgium is the only country where the share of fossil fuels is increasing vs. 2018 (as a result of the nuclear phase-out). In Bulgaria and Czechia, the share of fossil fuels in 2030 is over 40% and little changed compared to 2018.
13. The EU Commission states that in the baseline scenario, the fossil fuel share in electricity generation falls to 24% in 2030, and that electricity generation increases to 3100 TWh in 2030. This yields a figure for electricity generation from fossil fuels of ~744 TWh.
14. We estimate that the baseline scenario in the EU Commission’s impact assessment on stepping up Europe's 2030 climate ambition includes ~ 200 TWh of electricity generation from coal in 2030. This is based on the baseline scenario projection of 2030 gross inland consumption of solid fossil fuels of ~ 96 Mtoe (pg.46, impact assessment pt.1), final energy demand of 12 Mtoe (pg.51, impact assessment pt.2) and a 19% reduction in other, non-power coal consumption (pg.80, impact assessment pt.2) by 2030 vs. 2015.

15
VISION OR DIVISION?
In 2030, coal will still account for at least a third of total electricity production in Bulgaria, Czechia and Poland (considerably more in Poland). The NECPs also indicate shares of coal above 15% in Germany, Romania & Slovenia (the latter is not displayed on the chart below due to its small size). In Italy and Belgium, the high share of fossil fuels in 2030 is nearly all fossil gas (see figure L).
FIGURE K

16
VISION OR DIVISION?
Electricity DemandTo deliver on climate objectives it is expected that electricity demand will need to grow over the next decades15. This is because sectors which are currently very reliant on fossil fuels for energy - such as transport and industry - are likely to directly or indirectly16 electrify to decarbonise. The faster electricity demand is growing, the more challenging it is to replace fossil fuels in the power sector as new zero emission electricity must meet the new demand before fossil fuels can be displaced. Electricity demand is therefore a key metric to track.
The figures in the NECPs indicate total EU-27 electricity consumption is expected to grow ~ 5% between 2018 and 2030. Broadly speaking, the projected demand growth is strongest in countries which currently have significantly below average electricity consumption per person (e.g. Bulgaria, Poland, Romania), here, economic growth is likely to be a key driver of the increase in electricity demand.
15. For example, the EU Commission’s impact assessment on stepping up Europe's 2030 climate ambition [4] (part 2) expects electricity production to more than double by 2050 vs. today in scenarios which achieve climate neutrality by 2050.
16. I.e. via green hydrogen made via electrolysis
FIGURE L

17
VISION OR DIVISION?
However, there are a number of large outliers (e.g. Denmark, Ireland and Portugal) and to a lesser extent (Belgium & Austria), where growth in electricity demand is likely to be due to a structural change in the way electricity is consumed (see figure M).
To avoid entrenching fossil fuels in the power sector, it is essential that electricity demand growth is minimised wherever possible, this can be achieved by ensuring energy efficiency is always considered as an alternative to new energy infrastructure - an objective enshrined in legislation as the “Energy Efficiency First” principle17. However, the EU Commission’s own analysis of the NECPs [12] highlights that the EU is not yet on track18 to meet the current 2030 energy efficiency targets, let alone the further energy savings that would be required to raise the EU’s 2030 climate ambition.
17. For more information please refer to the following EU Commission communication: https://ec.europa.eu/info/news/energy-efficiency-first-accelerating-towards-2030-objective-2019-sep-25_en
18. The assessment of the final plans shows that the energy efficiency aggregated ambition would amount to a reduction of 29.7% for primary energy consumption and 29.4% for final energy consumption, a gap of 2.8 percentage points for primary energy consumption and 3.1 percentage points for final energy consumption compared to the Union’s 2030 target of at least 32.5%
FIGURE M

18
VISION OR DIVISION?
EmissionsEmissions factors
For the emissions calculations in this section we use the following standard emissions factors in all countries. The standard emissions factors for each fuel type will not capture the full nuance of the range of power plant efficiencies at a country level - which is difficult to predict for 2030 - but are satisfactory for a good first order approximation.
N.b. the emissions factors on the left - and therefore the total emissions and emissions intensity calculations in the following section - do not include the upstream emissions released during the extraction and transportation of the fossil fuels before delivery to the power station. Depending on the source of the fossil fuels, methane leaks in particular can raise the lifecycle emissions of electricity production considerably.
Total Emissions
According to the data in the NECPs, by 2030, four countries (Germany, Poland, Italy & Czechia) will be responsible for ~ 70% of all the emissions from electricity generation in the EU (up from just over 60% in 2018 [10]). Germany and Poland account for over half of the EU total. (see figure N).
FIGURE N
Fuel used for electricity generation
Emissions intensity of electricity production in 2030 [gCO2/KWh]
Lignite 1,000
Hard Coal 850
Fossil Gas 380
Other Fossil Fuels 650
19
VISION OR DIVISION?
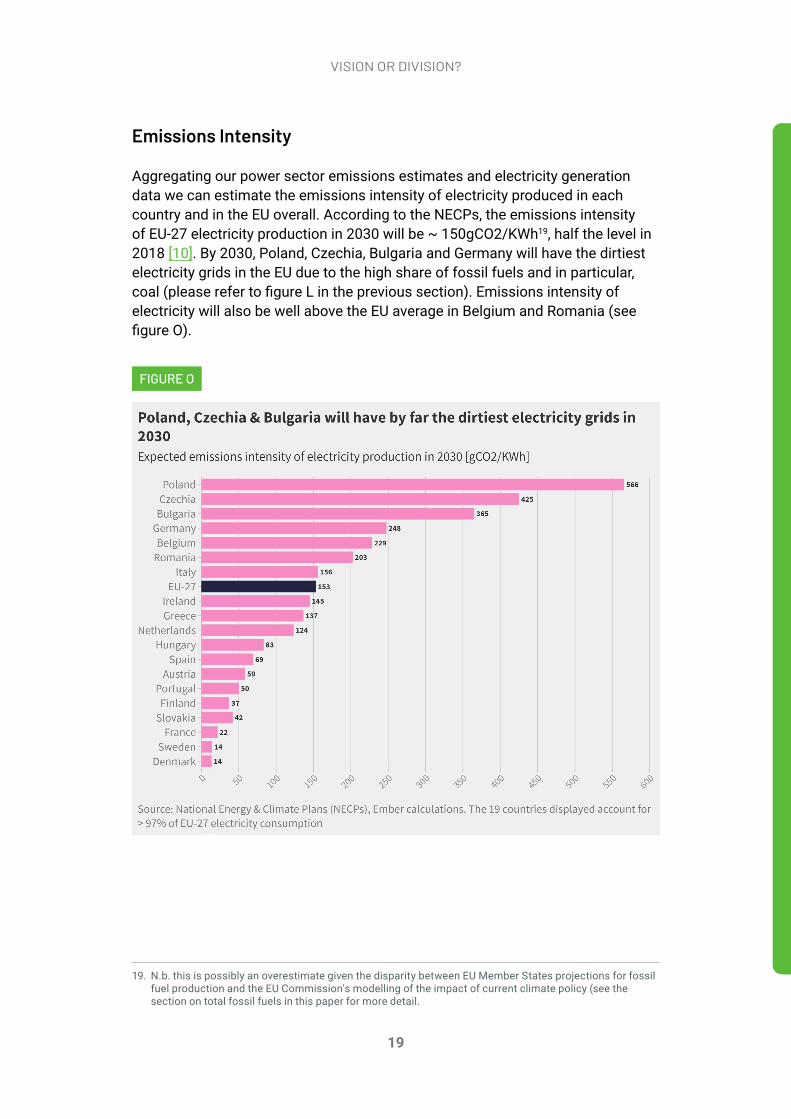
Emissions Intensity
Aggregating our power sector emissions estimates and electricity generation data we can estimate the emissions intensity of electricity produced in each country and in the EU overall. According to the NECPs, the emissions intensity of EU-27 electricity production in 2030 will be ~ 150gCO2/KWh19, half the level in 2018 [10]. By 2030, Poland, Czechia, Bulgaria and Germany will have the dirtiest electricity grids in the EU due to the high share of fossil fuels and in particular, coal (please refer to figure L in the previous section). Emissions intensity of electricity will also be well above the EU average in Belgium and Romania (see figure O).
19. N.b. this is possibly an overestimate given the disparity between EU Member States projections for fossil fuel production and the EU Commission's modelling of the impact of current climate policy (see the section on total fossil fuels in this paper for more detail.
FIGURE O

20
VISION OR DIVISION?
ConclusionFrom the preceding analysis of the NECP data we conclude that there are seven countries that are the key barriers to a rapid reduction in EU power sector emissions.
Limited or no progress: Belgium, Bulgaria, Czechia, Romania and Poland. Their NECPs indicate limited or no progress in the power sector over the entirety of the coming decade.
• Combined the countries account for 40% of 2030 power sector emissions (and each country counts for at least 3% of emissions individually).
• All have high shares of fossil fuels in their generation mixes in 2030.
• All have either modest (Poland, Belgium) or extremely limited (Czechia, Bulgaria & Romania) deployment of new wind and solar (or other RES). Furthermore, Czechia, Bulgaria & Romania all plan slower deployment of renewable electricity in the coming decade than in the last - despite large reductions in the costs of wind and solar in recent years.
• Three of the five countries plan no expansion in nuclear output by 2030 and Belgium is phasing out nuclear. Only Romania plans a small expansion.
• All five countries show moderate (Belgium and Czechia) or strong (Bulgaria, Poland and Romania) electricity demand growth.
Slow progress: Germany and Italy. Their NECPs indicate progress in the power sector is slow over the next decade and this is a concern given the size of their economies and electricity demand.
• Combined the countries account for approximately ~ 40% of projected 2030 power sector emissions.
• Both have relatively high shares of fossil fuels in their electricity mixes in 2030, with coal still expected to play a major role in Germany.
• Both see relatively modest reductions in the share of fossil fuels in their electricity mixes to 2030, Italy’s wind and solar deployment is modest, Germany’s more impressive planned deployment is partly offset by the nuclear phase-out, such that progress in both countries is broadly similar.

21
VISION OR DIVISION?
References[1] UN Environment Programme 2019, Emissions Gap Report 2019, https://www.
unenvironment.org/resources/emissions-gap-report-2019
[2] Intergovernmental Panel on Climate Change (IPCC) 2018, Special report on the impacts of global warming of 1.5 °C above pre-industrial levels and related global greenhouse gas emission pathways, https://www.ipcc.ch/sr15/
[3] CarbonBrief 2018, In-depth Q&A: The IPCC’s special report on climate change at 1.5°C, https://www.carbonbrief.org/in-depth-qa-ipccs-special-report-on-climate-change-at-one-point-five-c
[4] European Commission 2020, Impact Assessment on Stepping up Europe's 2030 Climate Ambition - part 2, https://ec.europa.eu/clima/sites/clima/files/eu-climate-action/docs/impact_en.pdf
[5] Climact 2020, Increasing the EU’s 2030 Emissions Reduction Target, How to cut EU GHG emissions by 55% or 65% by 2030, https://climact.com/wp-content/uploads/2020/06/Climact_Target_Emissions_report_FINAL.pdf
[6] Paris Agreement Compatible Scenarios for Energy Infrastructure 2020, https://www.pac-scenarios.eu/?L=0
[7] Chatham House 2017, Woody Biomass for Power and Heat, Impacts on the Global Climate, https://www.chathamhouse.org/2017/02/woody-biomass-power-and-heat
[8] BloombergNEF 2019, McCrone: Clean Energy’s Decade Nearly Gone, And Its Decade Ahead, https://about.bnef.com/blog/mccrone-clean-energys-decade-nearly-gone-and-its-decade-ahead/
[9] Climate Analytics 2019, Global and regional coal phase-out requirements of the Paris Agreement: Insights from the IPCC Special Report on 1.5°C, https://climateanalytics.org/media/report_coal_phase_out_2019.pdf
[10] Agora Energiewende and Ember 2020, The European Power Sector in 2019: Up-to-Date Analysis on the Electricity Transition, https://ember-climate.org/project/power-2019/
[11] European Commission 2020, Impact Assessment on Stepping up Europe's 2030 Climate Ambition - part 1, https://ec.europa.eu/clima/sites/clima/files/eu-climate-action/docs/impact_en.pdf
[12] European Commission 2020, An EU-wide assessment of National Energy and Climate Plans, https://eur-lex.europa.eu/legal-content/EN/TXT/HTML/?uri=CELEX:52020DC0564&from=EN