39
Visual Analytics Julian M. Kunkel 2017-05-31

Visual Analytics
Julian M Kunkel
2017-05-31
Scientific Method Gaining Insight with Analytics Visual Perception Designing Graphics Summary
Outline
1 Scientific Method
2 Gaining Insight with Analytics
3 Visual Perception
4 Designing Graphics
5 Summary
Julian Kunkel HAW 2017 2 38
Scientific Method Gaining Insight with Analytics Visual Perception Designing Graphics Summary
Scientific Method Start
Based on The Scientific Method as an Ongoing Process ArchonMagnus[1]
Start with either
Theory
Observation
Julian Kunkel HAW 2017 3 38
Scientific Method Gaining Insight with Analytics Visual Perception Designing Graphics Summary
Pillars of the Scientific Method
ScienceScience
The
ory
Exp
erim
enta
tion
Julian Kunkel HAW 2017 4 38
Scientific Method Gaining Insight with Analytics Visual Perception Designing Graphics Summary
Pillars of the Scientific Method Modern Perspective
ScienceScience
The
ory
Exp
erim
enta
tion
Sim
ulat
ion
Big
Dat
a A
naly
tics
Julian Kunkel HAW 2017 5 38
Scientific Method Gaining Insight with Analytics Visual Perception Designing Graphics Summary
Idea of Big Data Analytics
Big Data
Vast amounts of data are available
Many heterogene data sources
Raw data is of low value (fine grained)
Analytics
Analyzing data rArr Insight == value
For academia knowledgeFor industry business advantage and money
Levels of insight ndash primary abstraction levels of analytics
Exploration study data and identify (interesting) properties of (subsets) of dataInductionInference infer properties of the full population
Big data tools allow to construct a theory (model) and validate it with the data
Statistics and machine learning provide algorithms and models
Julian Kunkel HAW 2017 6 38
Scientific Method Gaining Insight with Analytics Visual Perception Designing Graphics Summary
Outline
1 Scientific Method
2 Gaining Insight with AnalyticsAbstraction Levels of AnalyticsExploratory Data AnalysisData Analysis WorkflowVisual AnalyticsDemoTools for Visual Analytics
3 Visual Perception
4 Designing Graphics
5 Summary
Julian Kunkel HAW 2017 7 38
Scientific Method Gaining Insight with Analytics Visual Perception Designing Graphics Summary
Abstraction Levels of Analytics and the Value of Data
1 Prescriptive analytics (Empfehlen)
ldquoWhat should we do and whyrdquo
2 Predictive analytics (Vorhersagen)
ldquoWhat will happenrdquo
3 Diagnostic analytics
ldquoWhat went wrongldquoldquoWhy did this happenrdquo
4 Descriptive analytics (Beschreiben)
ldquoWhat happenedrdquo
5 Raw (observed) data
Data valu
e
1 Raw data
PresentPast
An
aly
sis
2 Descriptive
3 Diagnostic
4 Predictive
5 Prescriptive
Time
Future
Julian Kunkel HAW 2017 8 38
Scientific Method Gaining Insight with Analytics Visual Perception Designing Graphics Summary
Analytics Abstraction Level
Source Forrester report Understanding The Business Intelligence Growth Opportunity 20-08-2011Julian Kunkel HAW 2017 9 38
Scientific Method Gaining Insight with Analytics Visual Perception Designing Graphics Summary
Exploratory Data Analysis (EDA) [15]
DefinitionThe approach of analyzing data sets to summarize their main characteristicoften with visual methods
Objectives
Suggest hypotheses about the causes of observed phenomena
Identify assumptions about the data to drive the statistical inference process
Support selection of appropriate statistical tools and techniques
Provide a basis for further data collection through surveys or experiments
Methods from EDA can also be used for analyzing model results outliers
Julian Kunkel HAW 2017 10 38
Scientific Method Gaining Insight with Analytics Visual Perception Designing Graphics Summary
Statistical Graphics [14]
Definition Graphics in the field of statistics used to visualize quantitative data
Objectives
The exploration of the content of a data set
The use to find structure in data
Checking assumptions in statistical models
Communicate the results of an analysis
Plots (Excerpt)
Scatter box histograms
Statistical maps
Probability plots
Spaghetti plots
Residual plots
Source William Playfairrsquos Time Series ofExports and Imports of Denmark andNorway [14]
Julian Kunkel HAW 2017 11 38
Scientific Method Gaining Insight with Analytics Visual Perception Designing Graphics Summary
Data Analysis Workflow
The traditional approach proceeds in phases
Source Gilbert Miller Peter Mork From Data to Decisions A Value Chain for Big Data
Limitation Interactivity only by browsing through prepared analytics results
Indirect feedback between visualization and analysis not driven by visualization
Julian Kunkel HAW 2017 12 38
Scientific Method Gaining Insight with Analytics Visual Perception Designing Graphics Summary
Visual Analytics [2]
Definition [3]
The science of analytical reasoning facilitated by interactive visual interfaces
Objective
Solve complex questionstime critical problems applying the scientific method
Present gained insight communicate it visually
Analytical tasks
Understanding past situations trends and events that caused current conditions
Monitoring events for indicators for an emergency
Identifying possible alternative future scenarios and their warning signs
Determining indicators of the intent of an action or an individual
Supporting decision makers in times of crisis
Julian Kunkel HAW 2017 13 38
Scientific Method Gaining Insight with Analytics Visual Perception Designing Graphics Summary
Visual Analytics Workflow
Data
Visualization
Knowledge
Models
Transformation
User Interaction
Parameter refinement
Data Mining
Mapping
Vis
ualiz
atio
n
Bui
ldin
g
Data Exploration
Automated Data Analysis
Feedback loop
Perception
Cognition
Cognition
Figure based on [18]
Motto Analyse First ndash Show the Important Zoom Filter and Analyse Further ndash Details on Demand[4]Julian Kunkel HAW 2017 14 38
Scientific Method Gaining Insight with Analytics Visual Perception Designing Graphics Summary
Fields of Visual Analytics
Source Visual analytics Scope and challenges [18]
Julian Kunkel HAW 2017 15 38
Scientific Method Gaining Insight with Analytics Visual Perception Designing Graphics Summary
Human-Computer Interaction
Why do we team humans and computers using a visual interface
Comparing capabilities of humans and computers
Human brain processing power is enormous
100 billion neurons linked together by many synapsesSynapses fire with 43 middot1015 spikess data rate of 11 middot1016 bitss = 125 TiBs 20 Watt [6]Fastest supercomputer in the world [7] Sunway TaihuLight 125 TFlops 15 MWEstimation Simulating one second of human brain activity requires 83k processors
Strength of humans and computers
Human Computer
Pattern recognition
Creative thinking
Processing new infos
Execution of algorithms
Accuracy
Visual perception and analysis capabilities exceed computers eg computer vision
Vision uses 30-50 of the brainrsquos capabilitiesrArr Visual representation and analytics is key for efficiency
Julian Kunkel HAW 2017 16 38
Scientific Method Gaining Insight with Analytics Visual Perception Designing Graphics Summary
Example Analysis Session Demo
Based on a real case [5]
1854 Broad Street London
Within a few days people died mysteriously
Dr John Snow investigated the cause to stop ldquodiseaserdquo
He analyzed data visually with the scientific method
We will follow his analysis steps
Using modern data analytics tools
Interactive lab notebook
Record noteshypothesis type code store it together with results
The notebook is prepared using Jupyter with Python
Julian Kunkel HAW 2017 17 38
Scientific Method Gaining Insight with Analytics Visual Perception Designing Graphics Summary
Analysis Results
John found the source of the Cholera The pump
He claimed the disease is spread by the waterJohn is one of the founders of our Germ theory
They unmounted the pump handle
But could not proof theory
Board of health did not believe his analysis
They believed ldquoMiasmardquo is the causerArr Convincing documentation is important
Original map made by John Snow in 1854Cholera cases are highlighted in black [5]
Julian Kunkel HAW 2017 18 38
Scientific Method Gaining Insight with Analytics Visual Perception Designing Graphics Summary
Tools for Visual Analytics
Mandatory features
Interactive
Rich set of visualizations data manipulations and algorithms
Real-time processing of big data
Requirements
Usability
Flexible
Performance
Tools (excerpt)
Closed source SAS Spotfire Domo Tableau QlikView
Open source R PythonJupyterBokeh GoogleVis
Other open source tools see [19]
Julian Kunkel HAW 2017 19 38
Scientific Method Gaining Insight with Analytics Visual Perception Designing Graphics Summary
Outline
1 Scientific Method
2 Gaining Insight with Analytics
3 Visual PerceptionCognitionVisual PerceptionOptical Illusions
4 Designing Graphics
5 Summary
Julian Kunkel HAW 2017 20 38
Scientific Method Gaining Insight with Analytics Visual Perception Designing Graphics Summary
CognitionDefinition The mental action or process of acquiring knowledge and understandingthrough thought experience and the senses [16]
Communicated information and interpretationis biased by humans due to
PerceptionInformation processingSubjective knowledge
Psychology knows many cognitive biases [10]
Categories of cognitive biases
Limits of memoryToo much informationNot enough meaningNeed to act fast
Categories serve as guidelines for visual analytics
We will focus on visual perception
Source Wikipediarsquos complete (as of 2016) list ofcognitive biases beautifully arranged and designedby John Manoogian III (jm3) Categories anddescriptions originally by Buster Benson [10]
Julian Kunkel HAW 2017 21 38
Scientific Method Gaining Insight with Analytics Visual Perception Designing Graphics Summary
Visual Perception Information Pipeline
Information Communication
Information is transformed several times from digital data to human
The retina and brain interprets visual information
Efficient communication requires to understand human perception
x y deathDate job gender262250 1854-08-21 merchant female298242 1854-08-24 other child295229 1854-08-30 craftsmen child270249 1854-08-31 service man273263 1854-08-31 craftsmen child234236 1854-09-01 service child252253 1854-09-01 service child305221 1854-09-01 scholar man275238 1854-09-01 service elderly251245 1854-09-01 scholar child282259 1854-09-01 other child263247 1854-09-01 military elderly237239 1854-09-01 service elderly273232 1854-09-01 other child290228 1854-09-01 scholar female
Computer Human
Data Display
gt gt gtRetina Brain
LightElectricElectricChemic
Visualization Perception Interpretation
Julian Kunkel HAW 2017 22 38
Scientific Method Gaining Insight with Analytics Visual Perception Designing Graphics Summary
Optical Illusions [8]
Definition visually perceived images thatdiffer from objective reality
They are caused by the visual system
They are many different types of illusions
Perceived colors and contrastsSize and shapes of objectsInterpretation of objectsDepth perceptionMoving of objectsAfterimages
Optic nerve
Crossed fibers
Uncrossed fibersOptic chiasma
Optic tractCommissure of Gudden
Pulvinar
Lateral geniculate body
Superior colliculus
Medial geniculate body
Nucleus of oculomotor nerve
Nucleus of trochlar nerve
Nucleus of abducent nerve
Cortex of occipital lobes
Sphere of the eye
Retina
Source Grayrsquos Anatomy depiction of theoptic nerves amp nuclei KDS444 [9]
Julian Kunkel HAW 2017 23 38
Scientific Method Gaining Insight with Analytics Visual Perception Designing Graphics Summary
Color Illusion
Field A and B have the same gray tone
Source The checker shadow illusion Edward HAdelson [8]
Proof Breaking the illusionSource Edward Adelson [8]
Julian Kunkel HAW 2017 24 38
Scientific Method Gaining Insight with Analytics Visual Perception Designing Graphics Summary
Color Illusion (2)
Form that seems to be filled in yellow instead of white
Source Blue-bordered cookie that misleadingly seems to be filled with light yellow water-colorJochen Burghardt [8]
Julian Kunkel HAW 2017 25 38
Scientific Method Gaining Insight with Analytics Visual Perception Designing Graphics Summary
Shapes of Objects
Both orange circles are the same size
Source Optical illusion The two orange circles are the same size [8]
Julian Kunkel HAW 2017 26 38
Scientific Method Gaining Insight with Analytics Visual Perception Designing Graphics Summary
Shapes of Objects (2)
Vertical and horizontal lines have the same length
Source Verticalndashhorizontal illusion S-kay [8]
Julian Kunkel HAW 2017 27 38
Scientific Method Gaining Insight with Analytics Visual Perception Designing Graphics Summary
Shapes of Objects (3)
Imaging a white triangle in the center
Source Kanizsa triangle Fibonacci [8]
Julian Kunkel HAW 2017 28 38
Scientific Method Gaining Insight with Analytics Visual Perception Designing Graphics Summary
Interpretation of Images
Vase or two faces
Source Two silhouette profiles or a white vase Brocken Inaglory [8]
Julian Kunkel HAW 2017 29 38
Scientific Method Gaining Insight with Analytics Visual Perception Designing Graphics Summary
Interpretation of Images (2)
Duck or rabbit
Source Jastrow J (1899) The mindrsquos eye Popular Science Monthly 54
Julian Kunkel HAW 2017 30 38
Scientific Method Gaining Insight with Analytics Visual Perception Designing Graphics Summary
Outline
1 Scientific Method
2 Gaining Insight with Analytics
3 Visual Perception
4 Designing GraphicsIntroductionGuidelinesInfographicsInteractive
5 Summary
Julian Kunkel HAW 2017 31 38
Scientific Method Gaining Insight with Analytics Visual Perception Designing Graphics Summary
Design of (Interactive) Graphics
Designing a good visualization is non-trivial
There exist many guidelines and languages to ldquoprogramrdquo graphics
Considerations limitations of the visual system and cognitive biasesLimits of memoryToo much informationNot enough meaningNeed to act fast
Graphics creation process
Raw Data Data Tables ViewsVisual
Data Visual Form
Structures
Data Transformation
Visual Mappings
ViewTransformations
Interactions
Julian Kunkel HAW 2017 32 38
Scientific Method Gaining Insight with Analytics Visual Perception Designing Graphics Summary
Components of Visual Mappings Encodings [13]
Spatial substrate mapping variables to space (and axes)
Depends on the type of data structured unstructuredValues nominal ordinal quantitative
Marks visible elements points (0D) lines areas volumes (3D)
Connection uses points and lines to show relationships
Enclosure boxes around elements useful to encode relationships
Retinal properties
Spatial Size orientationObject Gray scale color texture shape
Temporal encoding Animations
Julian Kunkel HAW 2017 33 38
Scientific Method Gaining Insight with Analytics Visual Perception Designing Graphics Summary
Guidelines
Goals of graphical displays according to [12]
show the data
induce the viewer to think about the substance rather than about methodologygraphic design the technology of graphic production or something else
avoid distorting what the data have to say
present many numbers in a small space
make large data sets coherent
encourage the eye to compare different pieces of data
reveal the data at several levels of detail from a broad overview to the fine structure
serve a reasonably clear purpose description exploration tabulation or decoration
be closely integrated with the statistical and verbal descriptions of a data set
Julian Kunkel HAW 2017 34 38
Scientific Method Gaining Insight with Analytics Visual Perception Designing Graphics Summary
Information Graphics (Infographics) [11]
Definition Graphic visual representations of information data or knowledge intended topresent information quickly and clearly
Source Gartner Hype Cycle for EmergingTechnologies Jeff McNeil [11]
Source Uganda Export Treemap from MIT HarvardEconomic Complexity Observatory R HaussmannCesar Hidalgo etal [11]
Julian Kunkel HAW 2017 35 38
Scientific Method Gaining Insight with Analytics Visual Perception Designing Graphics Summary
GuidelinesSimple rules
Use the right visualization for the for data types
Use building blocks for graphics (known plot styles)
Reduce information to the essential part to be communicated
Consistent use of building blocks and themes (retinal properties)
Promising concepts in expressing graphics
ggplot2 (for R)
Follows the ldquoGrammar of graphicsrdquoAesthetics define data used for the plotGeometry are visual elements organizing the dataFaceting generates multiple subplots based on properties
Vega httpsvegagithubiovega
Declarative language for interactive graphicsSpecified in JSON format suitable for browser visualization
Julian Kunkel HAW 2017 36 38
Scientific Method Gaining Insight with Analytics Visual Perception Designing Graphics Summary
Interactive Data Visualization
Typical interactions with a view [20]
Brushing selecting elements individuallywith a lasso
Painting create a group from selected elements
Allows to perform subsequent operations with the group
Identification cursormouse provides details about marked element(s)groups
Scaling navigate plots rescale zoom drill-updown aggregated data
Linking interactions are performed on all connected plots
An elementgroup marked in one plot is highlighted on other plotsScaling operations affect connected plots
Julian Kunkel HAW 2017 37 38
Scientific Method Gaining Insight with Analytics Visual Perception Designing Graphics Summary
Summary
Big data analytics is a pillar of science
Supports building of hypothesis and experimentation
Analytics Descriptive diagnostic predictive prescriptive
Visual analytics follows the scientific method
Interactive data exploration modeling amp experimentationExtends exploratory data analytics
Visual perception is efficient for communication of information
But beware of cognitive biases
Understanding limitations of the visual system is important
Optical illusions may lead to wrong conclusions
Graphics design follows principles
Reduce information to the essential part
Julian Kunkel HAW 2017 38 38
Bibliography
1 httpsenwikipediaorgwikiScientific_method2 httpsenwikipediaorgwikiVisual_Analytics3 James Thomas Kristin Cook 2005 Illuminating the Path The RampD Agenda for Visual Analytics National Visualization
and Analytics Center4 Keim D A Mansmann F Schneidewind J Thomas J Ziegler H 2008 Visual analytics Scope and challenges Visual Data
Mining5 httpsenwikipediaorgwiki1854_Broad_Street_cholera_outbreak6 Martins N Erlhagen W Freitas R 2011 Non-destructive Whole-brain Monitoring using Nanorobots7 httpwwwtop500org (Nov 2016)8 httpsenwikipediaorgwikiOptical_illusion9 httpsenwikipediaorgwikiVisual_system
10 httpsenwikipediaorgwikiList_of_cognitive_biases11 [httpsenwikipediaorgwikiInfographic]12 Edward Tufte 1983 The Visual Display of Quantitative Information13 Scott Card 2009 Information visualization In A Sears amp J A Jacko (Eds) Human-Computer Interaction Design Issues
Solutions and Applications14 httpsenwikipediaorgwikiStatistical_graphics15 httpsenwikipediaorgwikiExploratory_data_analysis16 httpsenoxforddictionariescomdefinitioncognition17 httpsdewikipediaorgwikiVisual_Analytics18 D A Keim F Mansmann J Schneidewind J Thomas H Ziegler 2008 Visual analytics Scope and challenges Visual
Data Mining19 Comparison of Open Source Visual Analytics Toolkits httpwwwsandiagov~pjcrosspapersPart1pdf20 httpsenwikipediaorgwikiInteractive_data_visualization
Julian Kunkel HAW 2017 39 38
Scientific Method Gaining Insight with Analytics Visual Perception Designing Graphics Summary
Outline
1 Scientific Method
2 Gaining Insight with Analytics
3 Visual Perception
4 Designing Graphics
5 Summary
Julian Kunkel HAW 2017 2 38
Scientific Method Gaining Insight with Analytics Visual Perception Designing Graphics Summary
Scientific Method Start
Based on The Scientific Method as an Ongoing Process ArchonMagnus[1]
Start with either
Theory
Observation
Julian Kunkel HAW 2017 3 38
Scientific Method Gaining Insight with Analytics Visual Perception Designing Graphics Summary
Pillars of the Scientific Method
ScienceScience
The
ory
Exp
erim
enta
tion
Julian Kunkel HAW 2017 4 38
Scientific Method Gaining Insight with Analytics Visual Perception Designing Graphics Summary
Pillars of the Scientific Method Modern Perspective
ScienceScience
The
ory
Exp
erim
enta
tion
Sim
ulat
ion
Big
Dat
a A
naly
tics
Julian Kunkel HAW 2017 5 38
Scientific Method Gaining Insight with Analytics Visual Perception Designing Graphics Summary
Idea of Big Data Analytics
Big Data
Vast amounts of data are available
Many heterogene data sources
Raw data is of low value (fine grained)
Analytics
Analyzing data rArr Insight == value
For academia knowledgeFor industry business advantage and money
Levels of insight ndash primary abstraction levels of analytics
Exploration study data and identify (interesting) properties of (subsets) of dataInductionInference infer properties of the full population
Big data tools allow to construct a theory (model) and validate it with the data
Statistics and machine learning provide algorithms and models
Julian Kunkel HAW 2017 6 38
Scientific Method Gaining Insight with Analytics Visual Perception Designing Graphics Summary
Outline
1 Scientific Method
2 Gaining Insight with AnalyticsAbstraction Levels of AnalyticsExploratory Data AnalysisData Analysis WorkflowVisual AnalyticsDemoTools for Visual Analytics
3 Visual Perception
4 Designing Graphics
5 Summary
Julian Kunkel HAW 2017 7 38
Scientific Method Gaining Insight with Analytics Visual Perception Designing Graphics Summary
Abstraction Levels of Analytics and the Value of Data
1 Prescriptive analytics (Empfehlen)
ldquoWhat should we do and whyrdquo
2 Predictive analytics (Vorhersagen)
ldquoWhat will happenrdquo
3 Diagnostic analytics
ldquoWhat went wrongldquoldquoWhy did this happenrdquo
4 Descriptive analytics (Beschreiben)
ldquoWhat happenedrdquo
5 Raw (observed) data
Data valu
e
1 Raw data
PresentPast
An
aly
sis
2 Descriptive
3 Diagnostic
4 Predictive
5 Prescriptive
Time
Future
Julian Kunkel HAW 2017 8 38
Scientific Method Gaining Insight with Analytics Visual Perception Designing Graphics Summary
Analytics Abstraction Level
Source Forrester report Understanding The Business Intelligence Growth Opportunity 20-08-2011Julian Kunkel HAW 2017 9 38
Scientific Method Gaining Insight with Analytics Visual Perception Designing Graphics Summary
Exploratory Data Analysis (EDA) [15]
DefinitionThe approach of analyzing data sets to summarize their main characteristicoften with visual methods
Objectives
Suggest hypotheses about the causes of observed phenomena
Identify assumptions about the data to drive the statistical inference process
Support selection of appropriate statistical tools and techniques
Provide a basis for further data collection through surveys or experiments
Methods from EDA can also be used for analyzing model results outliers
Julian Kunkel HAW 2017 10 38
Scientific Method Gaining Insight with Analytics Visual Perception Designing Graphics Summary
Statistical Graphics [14]
Definition Graphics in the field of statistics used to visualize quantitative data
Objectives
The exploration of the content of a data set
The use to find structure in data
Checking assumptions in statistical models
Communicate the results of an analysis
Plots (Excerpt)
Scatter box histograms
Statistical maps
Probability plots
Spaghetti plots
Residual plots
Source William Playfairrsquos Time Series ofExports and Imports of Denmark andNorway [14]
Julian Kunkel HAW 2017 11 38
Scientific Method Gaining Insight with Analytics Visual Perception Designing Graphics Summary
Data Analysis Workflow
The traditional approach proceeds in phases
Source Gilbert Miller Peter Mork From Data to Decisions A Value Chain for Big Data
Limitation Interactivity only by browsing through prepared analytics results
Indirect feedback between visualization and analysis not driven by visualization
Julian Kunkel HAW 2017 12 38
Scientific Method Gaining Insight with Analytics Visual Perception Designing Graphics Summary
Visual Analytics [2]
Definition [3]
The science of analytical reasoning facilitated by interactive visual interfaces
Objective
Solve complex questionstime critical problems applying the scientific method
Present gained insight communicate it visually
Analytical tasks
Understanding past situations trends and events that caused current conditions
Monitoring events for indicators for an emergency
Identifying possible alternative future scenarios and their warning signs
Determining indicators of the intent of an action or an individual
Supporting decision makers in times of crisis
Julian Kunkel HAW 2017 13 38
Scientific Method Gaining Insight with Analytics Visual Perception Designing Graphics Summary
Visual Analytics Workflow
Data
Visualization
Knowledge
Models
Transformation
User Interaction
Parameter refinement
Data Mining
Mapping
Vis
ualiz
atio
n
Bui
ldin
g
Data Exploration
Automated Data Analysis
Feedback loop
Perception
Cognition
Cognition
Figure based on [18]
Motto Analyse First ndash Show the Important Zoom Filter and Analyse Further ndash Details on Demand[4]Julian Kunkel HAW 2017 14 38
Scientific Method Gaining Insight with Analytics Visual Perception Designing Graphics Summary
Fields of Visual Analytics
Source Visual analytics Scope and challenges [18]
Julian Kunkel HAW 2017 15 38
Scientific Method Gaining Insight with Analytics Visual Perception Designing Graphics Summary
Human-Computer Interaction
Why do we team humans and computers using a visual interface
Comparing capabilities of humans and computers
Human brain processing power is enormous
100 billion neurons linked together by many synapsesSynapses fire with 43 middot1015 spikess data rate of 11 middot1016 bitss = 125 TiBs 20 Watt [6]Fastest supercomputer in the world [7] Sunway TaihuLight 125 TFlops 15 MWEstimation Simulating one second of human brain activity requires 83k processors
Strength of humans and computers
Human Computer
Pattern recognition
Creative thinking
Processing new infos
Execution of algorithms
Accuracy
Visual perception and analysis capabilities exceed computers eg computer vision
Vision uses 30-50 of the brainrsquos capabilitiesrArr Visual representation and analytics is key for efficiency
Julian Kunkel HAW 2017 16 38
Scientific Method Gaining Insight with Analytics Visual Perception Designing Graphics Summary
Example Analysis Session Demo
Based on a real case [5]
1854 Broad Street London
Within a few days people died mysteriously
Dr John Snow investigated the cause to stop ldquodiseaserdquo
He analyzed data visually with the scientific method
We will follow his analysis steps
Using modern data analytics tools
Interactive lab notebook
Record noteshypothesis type code store it together with results
The notebook is prepared using Jupyter with Python
Julian Kunkel HAW 2017 17 38
Scientific Method Gaining Insight with Analytics Visual Perception Designing Graphics Summary
Analysis Results
John found the source of the Cholera The pump
He claimed the disease is spread by the waterJohn is one of the founders of our Germ theory
They unmounted the pump handle
But could not proof theory
Board of health did not believe his analysis
They believed ldquoMiasmardquo is the causerArr Convincing documentation is important
Original map made by John Snow in 1854Cholera cases are highlighted in black [5]
Julian Kunkel HAW 2017 18 38
Scientific Method Gaining Insight with Analytics Visual Perception Designing Graphics Summary
Tools for Visual Analytics
Mandatory features
Interactive
Rich set of visualizations data manipulations and algorithms
Real-time processing of big data
Requirements
Usability
Flexible
Performance
Tools (excerpt)
Closed source SAS Spotfire Domo Tableau QlikView
Open source R PythonJupyterBokeh GoogleVis
Other open source tools see [19]
Julian Kunkel HAW 2017 19 38
Scientific Method Gaining Insight with Analytics Visual Perception Designing Graphics Summary
Outline
1 Scientific Method
2 Gaining Insight with Analytics
3 Visual PerceptionCognitionVisual PerceptionOptical Illusions
4 Designing Graphics
5 Summary
Julian Kunkel HAW 2017 20 38
Scientific Method Gaining Insight with Analytics Visual Perception Designing Graphics Summary
CognitionDefinition The mental action or process of acquiring knowledge and understandingthrough thought experience and the senses [16]
Communicated information and interpretationis biased by humans due to
PerceptionInformation processingSubjective knowledge
Psychology knows many cognitive biases [10]
Categories of cognitive biases
Limits of memoryToo much informationNot enough meaningNeed to act fast
Categories serve as guidelines for visual analytics
We will focus on visual perception
Source Wikipediarsquos complete (as of 2016) list ofcognitive biases beautifully arranged and designedby John Manoogian III (jm3) Categories anddescriptions originally by Buster Benson [10]
Julian Kunkel HAW 2017 21 38
Scientific Method Gaining Insight with Analytics Visual Perception Designing Graphics Summary
Visual Perception Information Pipeline
Information Communication
Information is transformed several times from digital data to human
The retina and brain interprets visual information
Efficient communication requires to understand human perception
x y deathDate job gender262250 1854-08-21 merchant female298242 1854-08-24 other child295229 1854-08-30 craftsmen child270249 1854-08-31 service man273263 1854-08-31 craftsmen child234236 1854-09-01 service child252253 1854-09-01 service child305221 1854-09-01 scholar man275238 1854-09-01 service elderly251245 1854-09-01 scholar child282259 1854-09-01 other child263247 1854-09-01 military elderly237239 1854-09-01 service elderly273232 1854-09-01 other child290228 1854-09-01 scholar female
Computer Human
Data Display
gt gt gtRetina Brain
LightElectricElectricChemic
Visualization Perception Interpretation
Julian Kunkel HAW 2017 22 38
Scientific Method Gaining Insight with Analytics Visual Perception Designing Graphics Summary
Optical Illusions [8]
Definition visually perceived images thatdiffer from objective reality
They are caused by the visual system
They are many different types of illusions
Perceived colors and contrastsSize and shapes of objectsInterpretation of objectsDepth perceptionMoving of objectsAfterimages
Optic nerve
Crossed fibers
Uncrossed fibersOptic chiasma
Optic tractCommissure of Gudden
Pulvinar
Lateral geniculate body
Superior colliculus
Medial geniculate body
Nucleus of oculomotor nerve
Nucleus of trochlar nerve
Nucleus of abducent nerve
Cortex of occipital lobes
Sphere of the eye
Retina
Source Grayrsquos Anatomy depiction of theoptic nerves amp nuclei KDS444 [9]
Julian Kunkel HAW 2017 23 38
Scientific Method Gaining Insight with Analytics Visual Perception Designing Graphics Summary
Color Illusion
Field A and B have the same gray tone
Source The checker shadow illusion Edward HAdelson [8]
Proof Breaking the illusionSource Edward Adelson [8]
Julian Kunkel HAW 2017 24 38
Scientific Method Gaining Insight with Analytics Visual Perception Designing Graphics Summary
Color Illusion (2)
Form that seems to be filled in yellow instead of white
Source Blue-bordered cookie that misleadingly seems to be filled with light yellow water-colorJochen Burghardt [8]
Julian Kunkel HAW 2017 25 38
Scientific Method Gaining Insight with Analytics Visual Perception Designing Graphics Summary
Shapes of Objects
Both orange circles are the same size
Source Optical illusion The two orange circles are the same size [8]
Julian Kunkel HAW 2017 26 38
Scientific Method Gaining Insight with Analytics Visual Perception Designing Graphics Summary
Shapes of Objects (2)
Vertical and horizontal lines have the same length
Source Verticalndashhorizontal illusion S-kay [8]
Julian Kunkel HAW 2017 27 38
Scientific Method Gaining Insight with Analytics Visual Perception Designing Graphics Summary
Shapes of Objects (3)
Imaging a white triangle in the center
Source Kanizsa triangle Fibonacci [8]
Julian Kunkel HAW 2017 28 38
Scientific Method Gaining Insight with Analytics Visual Perception Designing Graphics Summary
Interpretation of Images
Vase or two faces
Source Two silhouette profiles or a white vase Brocken Inaglory [8]
Julian Kunkel HAW 2017 29 38
Scientific Method Gaining Insight with Analytics Visual Perception Designing Graphics Summary
Interpretation of Images (2)
Duck or rabbit
Source Jastrow J (1899) The mindrsquos eye Popular Science Monthly 54
Julian Kunkel HAW 2017 30 38
Scientific Method Gaining Insight with Analytics Visual Perception Designing Graphics Summary
Outline
1 Scientific Method
2 Gaining Insight with Analytics
3 Visual Perception
4 Designing GraphicsIntroductionGuidelinesInfographicsInteractive
5 Summary
Julian Kunkel HAW 2017 31 38
Scientific Method Gaining Insight with Analytics Visual Perception Designing Graphics Summary
Design of (Interactive) Graphics
Designing a good visualization is non-trivial
There exist many guidelines and languages to ldquoprogramrdquo graphics
Considerations limitations of the visual system and cognitive biasesLimits of memoryToo much informationNot enough meaningNeed to act fast
Graphics creation process
Raw Data Data Tables ViewsVisual
Data Visual Form
Structures
Data Transformation
Visual Mappings
ViewTransformations
Interactions
Julian Kunkel HAW 2017 32 38
Scientific Method Gaining Insight with Analytics Visual Perception Designing Graphics Summary
Components of Visual Mappings Encodings [13]
Spatial substrate mapping variables to space (and axes)
Depends on the type of data structured unstructuredValues nominal ordinal quantitative
Marks visible elements points (0D) lines areas volumes (3D)
Connection uses points and lines to show relationships
Enclosure boxes around elements useful to encode relationships
Retinal properties
Spatial Size orientationObject Gray scale color texture shape
Temporal encoding Animations
Julian Kunkel HAW 2017 33 38
Scientific Method Gaining Insight with Analytics Visual Perception Designing Graphics Summary
Guidelines
Goals of graphical displays according to [12]
show the data
induce the viewer to think about the substance rather than about methodologygraphic design the technology of graphic production or something else
avoid distorting what the data have to say
present many numbers in a small space
make large data sets coherent
encourage the eye to compare different pieces of data
reveal the data at several levels of detail from a broad overview to the fine structure
serve a reasonably clear purpose description exploration tabulation or decoration
be closely integrated with the statistical and verbal descriptions of a data set
Julian Kunkel HAW 2017 34 38
Scientific Method Gaining Insight with Analytics Visual Perception Designing Graphics Summary
Information Graphics (Infographics) [11]
Definition Graphic visual representations of information data or knowledge intended topresent information quickly and clearly
Source Gartner Hype Cycle for EmergingTechnologies Jeff McNeil [11]
Source Uganda Export Treemap from MIT HarvardEconomic Complexity Observatory R HaussmannCesar Hidalgo etal [11]
Julian Kunkel HAW 2017 35 38
Scientific Method Gaining Insight with Analytics Visual Perception Designing Graphics Summary
GuidelinesSimple rules
Use the right visualization for the for data types
Use building blocks for graphics (known plot styles)
Reduce information to the essential part to be communicated
Consistent use of building blocks and themes (retinal properties)
Promising concepts in expressing graphics
ggplot2 (for R)
Follows the ldquoGrammar of graphicsrdquoAesthetics define data used for the plotGeometry are visual elements organizing the dataFaceting generates multiple subplots based on properties
Vega httpsvegagithubiovega
Declarative language for interactive graphicsSpecified in JSON format suitable for browser visualization
Julian Kunkel HAW 2017 36 38
Scientific Method Gaining Insight with Analytics Visual Perception Designing Graphics Summary
Interactive Data Visualization
Typical interactions with a view [20]
Brushing selecting elements individuallywith a lasso
Painting create a group from selected elements
Allows to perform subsequent operations with the group
Identification cursormouse provides details about marked element(s)groups
Scaling navigate plots rescale zoom drill-updown aggregated data
Linking interactions are performed on all connected plots
An elementgroup marked in one plot is highlighted on other plotsScaling operations affect connected plots
Julian Kunkel HAW 2017 37 38
Scientific Method Gaining Insight with Analytics Visual Perception Designing Graphics Summary
Summary
Big data analytics is a pillar of science
Supports building of hypothesis and experimentation
Analytics Descriptive diagnostic predictive prescriptive
Visual analytics follows the scientific method
Interactive data exploration modeling amp experimentationExtends exploratory data analytics
Visual perception is efficient for communication of information
But beware of cognitive biases
Understanding limitations of the visual system is important
Optical illusions may lead to wrong conclusions
Graphics design follows principles
Reduce information to the essential part
Julian Kunkel HAW 2017 38 38
Bibliography
1 httpsenwikipediaorgwikiScientific_method2 httpsenwikipediaorgwikiVisual_Analytics3 James Thomas Kristin Cook 2005 Illuminating the Path The RampD Agenda for Visual Analytics National Visualization
and Analytics Center4 Keim D A Mansmann F Schneidewind J Thomas J Ziegler H 2008 Visual analytics Scope and challenges Visual Data
Mining5 httpsenwikipediaorgwiki1854_Broad_Street_cholera_outbreak6 Martins N Erlhagen W Freitas R 2011 Non-destructive Whole-brain Monitoring using Nanorobots7 httpwwwtop500org (Nov 2016)8 httpsenwikipediaorgwikiOptical_illusion9 httpsenwikipediaorgwikiVisual_system
10 httpsenwikipediaorgwikiList_of_cognitive_biases11 [httpsenwikipediaorgwikiInfographic]12 Edward Tufte 1983 The Visual Display of Quantitative Information13 Scott Card 2009 Information visualization In A Sears amp J A Jacko (Eds) Human-Computer Interaction Design Issues
Solutions and Applications14 httpsenwikipediaorgwikiStatistical_graphics15 httpsenwikipediaorgwikiExploratory_data_analysis16 httpsenoxforddictionariescomdefinitioncognition17 httpsdewikipediaorgwikiVisual_Analytics18 D A Keim F Mansmann J Schneidewind J Thomas H Ziegler 2008 Visual analytics Scope and challenges Visual
Data Mining19 Comparison of Open Source Visual Analytics Toolkits httpwwwsandiagov~pjcrosspapersPart1pdf20 httpsenwikipediaorgwikiInteractive_data_visualization
Julian Kunkel HAW 2017 39 38

Scientific Method Gaining Insight with Analytics Visual Perception Designing Graphics Summary
Pillars of the Scientific Method
ScienceScience
The
ory
Exp
erim
enta
tion
Julian Kunkel HAW 2017 4 38
Scientific Method Gaining Insight with Analytics Visual Perception Designing Graphics Summary
Pillars of the Scientific Method Modern Perspective
ScienceScience
The
ory
Exp
erim
enta
tion
Sim
ulat
ion
Big
Dat
a A
naly
tics
Julian Kunkel HAW 2017 5 38
Scientific Method Gaining Insight with Analytics Visual Perception Designing Graphics Summary
Idea of Big Data Analytics
Big Data
Vast amounts of data are available
Many heterogene data sources
Raw data is of low value (fine grained)
Analytics
Analyzing data rArr Insight == value
For academia knowledgeFor industry business advantage and money
Levels of insight ndash primary abstraction levels of analytics
Exploration study data and identify (interesting) properties of (subsets) of dataInductionInference infer properties of the full population
Big data tools allow to construct a theory (model) and validate it with the data
Statistics and machine learning provide algorithms and models
Julian Kunkel HAW 2017 6 38
Scientific Method Gaining Insight with Analytics Visual Perception Designing Graphics Summary
Outline
1 Scientific Method
2 Gaining Insight with AnalyticsAbstraction Levels of AnalyticsExploratory Data AnalysisData Analysis WorkflowVisual AnalyticsDemoTools for Visual Analytics
3 Visual Perception
4 Designing Graphics
5 Summary
Julian Kunkel HAW 2017 7 38
Scientific Method Gaining Insight with Analytics Visual Perception Designing Graphics Summary
Abstraction Levels of Analytics and the Value of Data
1 Prescriptive analytics (Empfehlen)
ldquoWhat should we do and whyrdquo
2 Predictive analytics (Vorhersagen)
ldquoWhat will happenrdquo
3 Diagnostic analytics
ldquoWhat went wrongldquoldquoWhy did this happenrdquo
4 Descriptive analytics (Beschreiben)
ldquoWhat happenedrdquo
5 Raw (observed) data
Data valu
e
1 Raw data
PresentPast
An
aly
sis
2 Descriptive
3 Diagnostic
4 Predictive
5 Prescriptive
Time
Future
Julian Kunkel HAW 2017 8 38
Scientific Method Gaining Insight with Analytics Visual Perception Designing Graphics Summary
Analytics Abstraction Level
Source Forrester report Understanding The Business Intelligence Growth Opportunity 20-08-2011Julian Kunkel HAW 2017 9 38
Scientific Method Gaining Insight with Analytics Visual Perception Designing Graphics Summary
Exploratory Data Analysis (EDA) [15]
DefinitionThe approach of analyzing data sets to summarize their main characteristicoften with visual methods
Objectives
Suggest hypotheses about the causes of observed phenomena
Identify assumptions about the data to drive the statistical inference process
Support selection of appropriate statistical tools and techniques
Provide a basis for further data collection through surveys or experiments
Methods from EDA can also be used for analyzing model results outliers
Julian Kunkel HAW 2017 10 38
Scientific Method Gaining Insight with Analytics Visual Perception Designing Graphics Summary
Statistical Graphics [14]
Definition Graphics in the field of statistics used to visualize quantitative data
Objectives
The exploration of the content of a data set
The use to find structure in data
Checking assumptions in statistical models
Communicate the results of an analysis
Plots (Excerpt)
Scatter box histograms
Statistical maps
Probability plots
Spaghetti plots
Residual plots
Source William Playfairrsquos Time Series ofExports and Imports of Denmark andNorway [14]
Julian Kunkel HAW 2017 11 38
Scientific Method Gaining Insight with Analytics Visual Perception Designing Graphics Summary
Data Analysis Workflow
The traditional approach proceeds in phases
Source Gilbert Miller Peter Mork From Data to Decisions A Value Chain for Big Data
Limitation Interactivity only by browsing through prepared analytics results
Indirect feedback between visualization and analysis not driven by visualization
Julian Kunkel HAW 2017 12 38
Scientific Method Gaining Insight with Analytics Visual Perception Designing Graphics Summary
Visual Analytics [2]
Definition [3]
The science of analytical reasoning facilitated by interactive visual interfaces
Objective
Solve complex questionstime critical problems applying the scientific method
Present gained insight communicate it visually
Analytical tasks
Understanding past situations trends and events that caused current conditions
Monitoring events for indicators for an emergency
Identifying possible alternative future scenarios and their warning signs
Determining indicators of the intent of an action or an individual
Supporting decision makers in times of crisis
Julian Kunkel HAW 2017 13 38
Scientific Method Gaining Insight with Analytics Visual Perception Designing Graphics Summary
Visual Analytics Workflow
Data
Visualization
Knowledge
Models
Transformation
User Interaction
Parameter refinement
Data Mining
Mapping
Vis
ualiz
atio
n
Bui
ldin
g
Data Exploration
Automated Data Analysis
Feedback loop
Perception
Cognition
Cognition
Figure based on [18]
Motto Analyse First ndash Show the Important Zoom Filter and Analyse Further ndash Details on Demand[4]Julian Kunkel HAW 2017 14 38
Scientific Method Gaining Insight with Analytics Visual Perception Designing Graphics Summary
Fields of Visual Analytics
Source Visual analytics Scope and challenges [18]
Julian Kunkel HAW 2017 15 38
Scientific Method Gaining Insight with Analytics Visual Perception Designing Graphics Summary
Human-Computer Interaction
Why do we team humans and computers using a visual interface
Comparing capabilities of humans and computers
Human brain processing power is enormous
100 billion neurons linked together by many synapsesSynapses fire with 43 middot1015 spikess data rate of 11 middot1016 bitss = 125 TiBs 20 Watt [6]Fastest supercomputer in the world [7] Sunway TaihuLight 125 TFlops 15 MWEstimation Simulating one second of human brain activity requires 83k processors
Strength of humans and computers
Human Computer
Pattern recognition
Creative thinking
Processing new infos
Execution of algorithms
Accuracy
Visual perception and analysis capabilities exceed computers eg computer vision
Vision uses 30-50 of the brainrsquos capabilitiesrArr Visual representation and analytics is key for efficiency
Julian Kunkel HAW 2017 16 38
Scientific Method Gaining Insight with Analytics Visual Perception Designing Graphics Summary
Example Analysis Session Demo
Based on a real case [5]
1854 Broad Street London
Within a few days people died mysteriously
Dr John Snow investigated the cause to stop ldquodiseaserdquo
He analyzed data visually with the scientific method
We will follow his analysis steps
Using modern data analytics tools
Interactive lab notebook
Record noteshypothesis type code store it together with results
The notebook is prepared using Jupyter with Python
Julian Kunkel HAW 2017 17 38
Scientific Method Gaining Insight with Analytics Visual Perception Designing Graphics Summary
Analysis Results
John found the source of the Cholera The pump
He claimed the disease is spread by the waterJohn is one of the founders of our Germ theory
They unmounted the pump handle
But could not proof theory
Board of health did not believe his analysis
They believed ldquoMiasmardquo is the causerArr Convincing documentation is important
Original map made by John Snow in 1854Cholera cases are highlighted in black [5]
Julian Kunkel HAW 2017 18 38
Scientific Method Gaining Insight with Analytics Visual Perception Designing Graphics Summary
Tools for Visual Analytics
Mandatory features
Interactive
Rich set of visualizations data manipulations and algorithms
Real-time processing of big data
Requirements
Usability
Flexible
Performance
Tools (excerpt)
Closed source SAS Spotfire Domo Tableau QlikView
Open source R PythonJupyterBokeh GoogleVis
Other open source tools see [19]
Julian Kunkel HAW 2017 19 38
Scientific Method Gaining Insight with Analytics Visual Perception Designing Graphics Summary
Outline
1 Scientific Method
2 Gaining Insight with Analytics
3 Visual PerceptionCognitionVisual PerceptionOptical Illusions
4 Designing Graphics
5 Summary
Julian Kunkel HAW 2017 20 38
Scientific Method Gaining Insight with Analytics Visual Perception Designing Graphics Summary
CognitionDefinition The mental action or process of acquiring knowledge and understandingthrough thought experience and the senses [16]
Communicated information and interpretationis biased by humans due to
PerceptionInformation processingSubjective knowledge
Psychology knows many cognitive biases [10]
Categories of cognitive biases
Limits of memoryToo much informationNot enough meaningNeed to act fast
Categories serve as guidelines for visual analytics
We will focus on visual perception
Source Wikipediarsquos complete (as of 2016) list ofcognitive biases beautifully arranged and designedby John Manoogian III (jm3) Categories anddescriptions originally by Buster Benson [10]
Julian Kunkel HAW 2017 21 38
Scientific Method Gaining Insight with Analytics Visual Perception Designing Graphics Summary
Visual Perception Information Pipeline
Information Communication
Information is transformed several times from digital data to human
The retina and brain interprets visual information
Efficient communication requires to understand human perception
x y deathDate job gender262250 1854-08-21 merchant female298242 1854-08-24 other child295229 1854-08-30 craftsmen child270249 1854-08-31 service man273263 1854-08-31 craftsmen child234236 1854-09-01 service child252253 1854-09-01 service child305221 1854-09-01 scholar man275238 1854-09-01 service elderly251245 1854-09-01 scholar child282259 1854-09-01 other child263247 1854-09-01 military elderly237239 1854-09-01 service elderly273232 1854-09-01 other child290228 1854-09-01 scholar female
Computer Human
Data Display
gt gt gtRetina Brain
LightElectricElectricChemic
Visualization Perception Interpretation
Julian Kunkel HAW 2017 22 38
Scientific Method Gaining Insight with Analytics Visual Perception Designing Graphics Summary
Optical Illusions [8]
Definition visually perceived images thatdiffer from objective reality
They are caused by the visual system
They are many different types of illusions
Perceived colors and contrastsSize and shapes of objectsInterpretation of objectsDepth perceptionMoving of objectsAfterimages
Optic nerve
Crossed fibers
Uncrossed fibersOptic chiasma
Optic tractCommissure of Gudden
Pulvinar
Lateral geniculate body
Superior colliculus
Medial geniculate body
Nucleus of oculomotor nerve
Nucleus of trochlar nerve
Nucleus of abducent nerve
Cortex of occipital lobes
Sphere of the eye
Retina
Source Grayrsquos Anatomy depiction of theoptic nerves amp nuclei KDS444 [9]
Julian Kunkel HAW 2017 23 38
Scientific Method Gaining Insight with Analytics Visual Perception Designing Graphics Summary
Color Illusion
Field A and B have the same gray tone
Source The checker shadow illusion Edward HAdelson [8]
Proof Breaking the illusionSource Edward Adelson [8]
Julian Kunkel HAW 2017 24 38
Scientific Method Gaining Insight with Analytics Visual Perception Designing Graphics Summary
Color Illusion (2)
Form that seems to be filled in yellow instead of white
Source Blue-bordered cookie that misleadingly seems to be filled with light yellow water-colorJochen Burghardt [8]
Julian Kunkel HAW 2017 25 38
Scientific Method Gaining Insight with Analytics Visual Perception Designing Graphics Summary
Shapes of Objects
Both orange circles are the same size
Source Optical illusion The two orange circles are the same size [8]
Julian Kunkel HAW 2017 26 38
Scientific Method Gaining Insight with Analytics Visual Perception Designing Graphics Summary
Shapes of Objects (2)
Vertical and horizontal lines have the same length
Source Verticalndashhorizontal illusion S-kay [8]
Julian Kunkel HAW 2017 27 38
Scientific Method Gaining Insight with Analytics Visual Perception Designing Graphics Summary
Shapes of Objects (3)
Imaging a white triangle in the center
Source Kanizsa triangle Fibonacci [8]
Julian Kunkel HAW 2017 28 38
Scientific Method Gaining Insight with Analytics Visual Perception Designing Graphics Summary
Interpretation of Images
Vase or two faces
Source Two silhouette profiles or a white vase Brocken Inaglory [8]
Julian Kunkel HAW 2017 29 38
Scientific Method Gaining Insight with Analytics Visual Perception Designing Graphics Summary
Interpretation of Images (2)
Duck or rabbit
Source Jastrow J (1899) The mindrsquos eye Popular Science Monthly 54
Julian Kunkel HAW 2017 30 38
Scientific Method Gaining Insight with Analytics Visual Perception Designing Graphics Summary
Outline
1 Scientific Method
2 Gaining Insight with Analytics
3 Visual Perception
4 Designing GraphicsIntroductionGuidelinesInfographicsInteractive
5 Summary
Julian Kunkel HAW 2017 31 38
Scientific Method Gaining Insight with Analytics Visual Perception Designing Graphics Summary
Design of (Interactive) Graphics
Designing a good visualization is non-trivial
There exist many guidelines and languages to ldquoprogramrdquo graphics
Considerations limitations of the visual system and cognitive biasesLimits of memoryToo much informationNot enough meaningNeed to act fast
Graphics creation process
Raw Data Data Tables ViewsVisual
Data Visual Form
Structures
Data Transformation
Visual Mappings
ViewTransformations
Interactions
Julian Kunkel HAW 2017 32 38
Scientific Method Gaining Insight with Analytics Visual Perception Designing Graphics Summary
Components of Visual Mappings Encodings [13]
Spatial substrate mapping variables to space (and axes)
Depends on the type of data structured unstructuredValues nominal ordinal quantitative
Marks visible elements points (0D) lines areas volumes (3D)
Connection uses points and lines to show relationships
Enclosure boxes around elements useful to encode relationships
Retinal properties
Spatial Size orientationObject Gray scale color texture shape
Temporal encoding Animations
Julian Kunkel HAW 2017 33 38
Scientific Method Gaining Insight with Analytics Visual Perception Designing Graphics Summary
Guidelines
Goals of graphical displays according to [12]
show the data
induce the viewer to think about the substance rather than about methodologygraphic design the technology of graphic production or something else
avoid distorting what the data have to say
present many numbers in a small space
make large data sets coherent
encourage the eye to compare different pieces of data
reveal the data at several levels of detail from a broad overview to the fine structure
serve a reasonably clear purpose description exploration tabulation or decoration
be closely integrated with the statistical and verbal descriptions of a data set
Julian Kunkel HAW 2017 34 38
Scientific Method Gaining Insight with Analytics Visual Perception Designing Graphics Summary
Information Graphics (Infographics) [11]
Definition Graphic visual representations of information data or knowledge intended topresent information quickly and clearly
Source Gartner Hype Cycle for EmergingTechnologies Jeff McNeil [11]
Source Uganda Export Treemap from MIT HarvardEconomic Complexity Observatory R HaussmannCesar Hidalgo etal [11]
Julian Kunkel HAW 2017 35 38
Scientific Method Gaining Insight with Analytics Visual Perception Designing Graphics Summary
GuidelinesSimple rules
Use the right visualization for the for data types
Use building blocks for graphics (known plot styles)
Reduce information to the essential part to be communicated
Consistent use of building blocks and themes (retinal properties)
Promising concepts in expressing graphics
ggplot2 (for R)
Follows the ldquoGrammar of graphicsrdquoAesthetics define data used for the plotGeometry are visual elements organizing the dataFaceting generates multiple subplots based on properties
Vega httpsvegagithubiovega
Declarative language for interactive graphicsSpecified in JSON format suitable for browser visualization
Julian Kunkel HAW 2017 36 38
Scientific Method Gaining Insight with Analytics Visual Perception Designing Graphics Summary
Interactive Data Visualization
Typical interactions with a view [20]
Brushing selecting elements individuallywith a lasso
Painting create a group from selected elements
Allows to perform subsequent operations with the group
Identification cursormouse provides details about marked element(s)groups
Scaling navigate plots rescale zoom drill-updown aggregated data
Linking interactions are performed on all connected plots
An elementgroup marked in one plot is highlighted on other plotsScaling operations affect connected plots
Julian Kunkel HAW 2017 37 38
Scientific Method Gaining Insight with Analytics Visual Perception Designing Graphics Summary
Summary
Big data analytics is a pillar of science
Supports building of hypothesis and experimentation
Analytics Descriptive diagnostic predictive prescriptive
Visual analytics follows the scientific method
Interactive data exploration modeling amp experimentationExtends exploratory data analytics
Visual perception is efficient for communication of information
But beware of cognitive biases
Understanding limitations of the visual system is important
Optical illusions may lead to wrong conclusions
Graphics design follows principles
Reduce information to the essential part
Julian Kunkel HAW 2017 38 38
Bibliography
1 httpsenwikipediaorgwikiScientific_method2 httpsenwikipediaorgwikiVisual_Analytics3 James Thomas Kristin Cook 2005 Illuminating the Path The RampD Agenda for Visual Analytics National Visualization
and Analytics Center4 Keim D A Mansmann F Schneidewind J Thomas J Ziegler H 2008 Visual analytics Scope and challenges Visual Data
Mining5 httpsenwikipediaorgwiki1854_Broad_Street_cholera_outbreak6 Martins N Erlhagen W Freitas R 2011 Non-destructive Whole-brain Monitoring using Nanorobots7 httpwwwtop500org (Nov 2016)8 httpsenwikipediaorgwikiOptical_illusion9 httpsenwikipediaorgwikiVisual_system
10 httpsenwikipediaorgwikiList_of_cognitive_biases11 [httpsenwikipediaorgwikiInfographic]12 Edward Tufte 1983 The Visual Display of Quantitative Information13 Scott Card 2009 Information visualization In A Sears amp J A Jacko (Eds) Human-Computer Interaction Design Issues
Solutions and Applications14 httpsenwikipediaorgwikiStatistical_graphics15 httpsenwikipediaorgwikiExploratory_data_analysis16 httpsenoxforddictionariescomdefinitioncognition17 httpsdewikipediaorgwikiVisual_Analytics18 D A Keim F Mansmann J Schneidewind J Thomas H Ziegler 2008 Visual analytics Scope and challenges Visual
Data Mining19 Comparison of Open Source Visual Analytics Toolkits httpwwwsandiagov~pjcrosspapersPart1pdf20 httpsenwikipediaorgwikiInteractive_data_visualization
Julian Kunkel HAW 2017 39 38
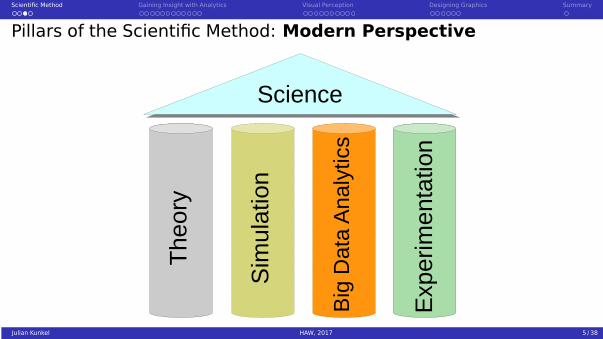
Scientific Method Gaining Insight with Analytics Visual Perception Designing Graphics Summary
Outline
1 Scientific Method
2 Gaining Insight with AnalyticsAbstraction Levels of AnalyticsExploratory Data AnalysisData Analysis WorkflowVisual AnalyticsDemoTools for Visual Analytics
3 Visual Perception
4 Designing Graphics
5 Summary
Julian Kunkel HAW 2017 7 38
Scientific Method Gaining Insight with Analytics Visual Perception Designing Graphics Summary
Abstraction Levels of Analytics and the Value of Data
1 Prescriptive analytics (Empfehlen)
ldquoWhat should we do and whyrdquo
2 Predictive analytics (Vorhersagen)
ldquoWhat will happenrdquo
3 Diagnostic analytics
ldquoWhat went wrongldquoldquoWhy did this happenrdquo
4 Descriptive analytics (Beschreiben)
ldquoWhat happenedrdquo
5 Raw (observed) data
Data valu
e
1 Raw data
PresentPast
An
aly
sis
2 Descriptive
3 Diagnostic
4 Predictive
5 Prescriptive
Time
Future
Julian Kunkel HAW 2017 8 38
Scientific Method Gaining Insight with Analytics Visual Perception Designing Graphics Summary
Analytics Abstraction Level
Source Forrester report Understanding The Business Intelligence Growth Opportunity 20-08-2011Julian Kunkel HAW 2017 9 38
Scientific Method Gaining Insight with Analytics Visual Perception Designing Graphics Summary
Exploratory Data Analysis (EDA) [15]
DefinitionThe approach of analyzing data sets to summarize their main characteristicoften with visual methods
Objectives
Suggest hypotheses about the causes of observed phenomena
Identify assumptions about the data to drive the statistical inference process
Support selection of appropriate statistical tools and techniques
Provide a basis for further data collection through surveys or experiments
Methods from EDA can also be used for analyzing model results outliers
Julian Kunkel HAW 2017 10 38
Scientific Method Gaining Insight with Analytics Visual Perception Designing Graphics Summary
Statistical Graphics [14]
Definition Graphics in the field of statistics used to visualize quantitative data
Objectives
The exploration of the content of a data set
The use to find structure in data
Checking assumptions in statistical models
Communicate the results of an analysis
Plots (Excerpt)
Scatter box histograms
Statistical maps
Probability plots
Spaghetti plots
Residual plots
Source William Playfairrsquos Time Series ofExports and Imports of Denmark andNorway [14]
Julian Kunkel HAW 2017 11 38
Scientific Method Gaining Insight with Analytics Visual Perception Designing Graphics Summary
Data Analysis Workflow
The traditional approach proceeds in phases
Source Gilbert Miller Peter Mork From Data to Decisions A Value Chain for Big Data
Limitation Interactivity only by browsing through prepared analytics results
Indirect feedback between visualization and analysis not driven by visualization
Julian Kunkel HAW 2017 12 38
Scientific Method Gaining Insight with Analytics Visual Perception Designing Graphics Summary
Visual Analytics [2]
Definition [3]
The science of analytical reasoning facilitated by interactive visual interfaces
Objective
Solve complex questionstime critical problems applying the scientific method
Present gained insight communicate it visually
Analytical tasks
Understanding past situations trends and events that caused current conditions
Monitoring events for indicators for an emergency
Identifying possible alternative future scenarios and their warning signs
Determining indicators of the intent of an action or an individual
Supporting decision makers in times of crisis
Julian Kunkel HAW 2017 13 38
Scientific Method Gaining Insight with Analytics Visual Perception Designing Graphics Summary
Visual Analytics Workflow
Data
Visualization
Knowledge
Models
Transformation
User Interaction
Parameter refinement
Data Mining
Mapping
Vis
ualiz
atio
n
Bui
ldin
g
Data Exploration
Automated Data Analysis
Feedback loop
Perception
Cognition
Cognition
Figure based on [18]
Motto Analyse First ndash Show the Important Zoom Filter and Analyse Further ndash Details on Demand[4]Julian Kunkel HAW 2017 14 38
Scientific Method Gaining Insight with Analytics Visual Perception Designing Graphics Summary
Fields of Visual Analytics
Source Visual analytics Scope and challenges [18]
Julian Kunkel HAW 2017 15 38
Scientific Method Gaining Insight with Analytics Visual Perception Designing Graphics Summary
Human-Computer Interaction
Why do we team humans and computers using a visual interface
Comparing capabilities of humans and computers
Human brain processing power is enormous
100 billion neurons linked together by many synapsesSynapses fire with 43 middot1015 spikess data rate of 11 middot1016 bitss = 125 TiBs 20 Watt [6]Fastest supercomputer in the world [7] Sunway TaihuLight 125 TFlops 15 MWEstimation Simulating one second of human brain activity requires 83k processors
Strength of humans and computers
Human Computer
Pattern recognition
Creative thinking
Processing new infos
Execution of algorithms
Accuracy
Visual perception and analysis capabilities exceed computers eg computer vision
Vision uses 30-50 of the brainrsquos capabilitiesrArr Visual representation and analytics is key for efficiency
Julian Kunkel HAW 2017 16 38
Scientific Method Gaining Insight with Analytics Visual Perception Designing Graphics Summary
Example Analysis Session Demo
Based on a real case [5]
1854 Broad Street London
Within a few days people died mysteriously
Dr John Snow investigated the cause to stop ldquodiseaserdquo
He analyzed data visually with the scientific method
We will follow his analysis steps
Using modern data analytics tools
Interactive lab notebook
Record noteshypothesis type code store it together with results
The notebook is prepared using Jupyter with Python
Julian Kunkel HAW 2017 17 38
Scientific Method Gaining Insight with Analytics Visual Perception Designing Graphics Summary
Analysis Results
John found the source of the Cholera The pump
He claimed the disease is spread by the waterJohn is one of the founders of our Germ theory
They unmounted the pump handle
But could not proof theory
Board of health did not believe his analysis
They believed ldquoMiasmardquo is the causerArr Convincing documentation is important
Original map made by John Snow in 1854Cholera cases are highlighted in black [5]
Julian Kunkel HAW 2017 18 38
Scientific Method Gaining Insight with Analytics Visual Perception Designing Graphics Summary
Tools for Visual Analytics
Mandatory features
Interactive
Rich set of visualizations data manipulations and algorithms
Real-time processing of big data
Requirements
Usability
Flexible
Performance
Tools (excerpt)
Closed source SAS Spotfire Domo Tableau QlikView
Open source R PythonJupyterBokeh GoogleVis
Other open source tools see [19]
Julian Kunkel HAW 2017 19 38
Scientific Method Gaining Insight with Analytics Visual Perception Designing Graphics Summary
Outline
1 Scientific Method
2 Gaining Insight with Analytics
3 Visual PerceptionCognitionVisual PerceptionOptical Illusions
4 Designing Graphics
5 Summary
Julian Kunkel HAW 2017 20 38
Scientific Method Gaining Insight with Analytics Visual Perception Designing Graphics Summary
CognitionDefinition The mental action or process of acquiring knowledge and understandingthrough thought experience and the senses [16]
Communicated information and interpretationis biased by humans due to
PerceptionInformation processingSubjective knowledge
Psychology knows many cognitive biases [10]
Categories of cognitive biases
Limits of memoryToo much informationNot enough meaningNeed to act fast
Categories serve as guidelines for visual analytics
We will focus on visual perception
Source Wikipediarsquos complete (as of 2016) list ofcognitive biases beautifully arranged and designedby John Manoogian III (jm3) Categories anddescriptions originally by Buster Benson [10]
Julian Kunkel HAW 2017 21 38
Scientific Method Gaining Insight with Analytics Visual Perception Designing Graphics Summary
Visual Perception Information Pipeline
Information Communication
Information is transformed several times from digital data to human
The retina and brain interprets visual information
Efficient communication requires to understand human perception
x y deathDate job gender262250 1854-08-21 merchant female298242 1854-08-24 other child295229 1854-08-30 craftsmen child270249 1854-08-31 service man273263 1854-08-31 craftsmen child234236 1854-09-01 service child252253 1854-09-01 service child305221 1854-09-01 scholar man275238 1854-09-01 service elderly251245 1854-09-01 scholar child282259 1854-09-01 other child263247 1854-09-01 military elderly237239 1854-09-01 service elderly273232 1854-09-01 other child290228 1854-09-01 scholar female
Computer Human
Data Display
gt gt gtRetina Brain
LightElectricElectricChemic
Visualization Perception Interpretation
Julian Kunkel HAW 2017 22 38
Scientific Method Gaining Insight with Analytics Visual Perception Designing Graphics Summary
Optical Illusions [8]
Definition visually perceived images thatdiffer from objective reality
They are caused by the visual system
They are many different types of illusions
Perceived colors and contrastsSize and shapes of objectsInterpretation of objectsDepth perceptionMoving of objectsAfterimages
Optic nerve
Crossed fibers
Uncrossed fibersOptic chiasma
Optic tractCommissure of Gudden
Pulvinar
Lateral geniculate body
Superior colliculus
Medial geniculate body
Nucleus of oculomotor nerve
Nucleus of trochlar nerve
Nucleus of abducent nerve
Cortex of occipital lobes
Sphere of the eye
Retina
Source Grayrsquos Anatomy depiction of theoptic nerves amp nuclei KDS444 [9]
Julian Kunkel HAW 2017 23 38
Scientific Method Gaining Insight with Analytics Visual Perception Designing Graphics Summary
Color Illusion
Field A and B have the same gray tone
Source The checker shadow illusion Edward HAdelson [8]
Proof Breaking the illusionSource Edward Adelson [8]
Julian Kunkel HAW 2017 24 38
Scientific Method Gaining Insight with Analytics Visual Perception Designing Graphics Summary
Color Illusion (2)
Form that seems to be filled in yellow instead of white
Source Blue-bordered cookie that misleadingly seems to be filled with light yellow water-colorJochen Burghardt [8]
Julian Kunkel HAW 2017 25 38
Scientific Method Gaining Insight with Analytics Visual Perception Designing Graphics Summary
Shapes of Objects
Both orange circles are the same size
Source Optical illusion The two orange circles are the same size [8]
Julian Kunkel HAW 2017 26 38
Scientific Method Gaining Insight with Analytics Visual Perception Designing Graphics Summary
Shapes of Objects (2)
Vertical and horizontal lines have the same length
Source Verticalndashhorizontal illusion S-kay [8]
Julian Kunkel HAW 2017 27 38
Scientific Method Gaining Insight with Analytics Visual Perception Designing Graphics Summary
Shapes of Objects (3)
Imaging a white triangle in the center
Source Kanizsa triangle Fibonacci [8]
Julian Kunkel HAW 2017 28 38
Scientific Method Gaining Insight with Analytics Visual Perception Designing Graphics Summary
Interpretation of Images
Vase or two faces
Source Two silhouette profiles or a white vase Brocken Inaglory [8]
Julian Kunkel HAW 2017 29 38
Scientific Method Gaining Insight with Analytics Visual Perception Designing Graphics Summary
Interpretation of Images (2)
Duck or rabbit
Source Jastrow J (1899) The mindrsquos eye Popular Science Monthly 54
Julian Kunkel HAW 2017 30 38
Scientific Method Gaining Insight with Analytics Visual Perception Designing Graphics Summary
Outline
1 Scientific Method
2 Gaining Insight with Analytics
3 Visual Perception
4 Designing GraphicsIntroductionGuidelinesInfographicsInteractive
5 Summary
Julian Kunkel HAW 2017 31 38
Scientific Method Gaining Insight with Analytics Visual Perception Designing Graphics Summary
Design of (Interactive) Graphics
Designing a good visualization is non-trivial
There exist many guidelines and languages to ldquoprogramrdquo graphics
Considerations limitations of the visual system and cognitive biasesLimits of memoryToo much informationNot enough meaningNeed to act fast
Graphics creation process
Raw Data Data Tables ViewsVisual
Data Visual Form
Structures
Data Transformation
Visual Mappings
ViewTransformations
Interactions
Julian Kunkel HAW 2017 32 38
Scientific Method Gaining Insight with Analytics Visual Perception Designing Graphics Summary
Components of Visual Mappings Encodings [13]
Spatial substrate mapping variables to space (and axes)
Depends on the type of data structured unstructuredValues nominal ordinal quantitative
Marks visible elements points (0D) lines areas volumes (3D)
Connection uses points and lines to show relationships
Enclosure boxes around elements useful to encode relationships
Retinal properties
Spatial Size orientationObject Gray scale color texture shape
Temporal encoding Animations
Julian Kunkel HAW 2017 33 38
Scientific Method Gaining Insight with Analytics Visual Perception Designing Graphics Summary
Guidelines
Goals of graphical displays according to [12]
show the data
induce the viewer to think about the substance rather than about methodologygraphic design the technology of graphic production or something else
avoid distorting what the data have to say
present many numbers in a small space
make large data sets coherent
encourage the eye to compare different pieces of data
reveal the data at several levels of detail from a broad overview to the fine structure
serve a reasonably clear purpose description exploration tabulation or decoration
be closely integrated with the statistical and verbal descriptions of a data set
Julian Kunkel HAW 2017 34 38
Scientific Method Gaining Insight with Analytics Visual Perception Designing Graphics Summary
Information Graphics (Infographics) [11]
Definition Graphic visual representations of information data or knowledge intended topresent information quickly and clearly
Source Gartner Hype Cycle for EmergingTechnologies Jeff McNeil [11]
Source Uganda Export Treemap from MIT HarvardEconomic Complexity Observatory R HaussmannCesar Hidalgo etal [11]
Julian Kunkel HAW 2017 35 38
Scientific Method Gaining Insight with Analytics Visual Perception Designing Graphics Summary
GuidelinesSimple rules
Use the right visualization for the for data types
Use building blocks for graphics (known plot styles)
Reduce information to the essential part to be communicated
Consistent use of building blocks and themes (retinal properties)
Promising concepts in expressing graphics
ggplot2 (for R)
Follows the ldquoGrammar of graphicsrdquoAesthetics define data used for the plotGeometry are visual elements organizing the dataFaceting generates multiple subplots based on properties
Vega httpsvegagithubiovega
Declarative language for interactive graphicsSpecified in JSON format suitable for browser visualization
Julian Kunkel HAW 2017 36 38
Scientific Method Gaining Insight with Analytics Visual Perception Designing Graphics Summary
Interactive Data Visualization
Typical interactions with a view [20]
Brushing selecting elements individuallywith a lasso
Painting create a group from selected elements
Allows to perform subsequent operations with the group
Identification cursormouse provides details about marked element(s)groups
Scaling navigate plots rescale zoom drill-updown aggregated data
Linking interactions are performed on all connected plots
An elementgroup marked in one plot is highlighted on other plotsScaling operations affect connected plots
Julian Kunkel HAW 2017 37 38
Scientific Method Gaining Insight with Analytics Visual Perception Designing Graphics Summary
Summary
Big data analytics is a pillar of science
Supports building of hypothesis and experimentation
Analytics Descriptive diagnostic predictive prescriptive
Visual analytics follows the scientific method
Interactive data exploration modeling amp experimentationExtends exploratory data analytics
Visual perception is efficient for communication of information
But beware of cognitive biases
Understanding limitations of the visual system is important
Optical illusions may lead to wrong conclusions
Graphics design follows principles
Reduce information to the essential part
Julian Kunkel HAW 2017 38 38
Bibliography
1 httpsenwikipediaorgwikiScientific_method2 httpsenwikipediaorgwikiVisual_Analytics3 James Thomas Kristin Cook 2005 Illuminating the Path The RampD Agenda for Visual Analytics National Visualization
and Analytics Center4 Keim D A Mansmann F Schneidewind J Thomas J Ziegler H 2008 Visual analytics Scope and challenges Visual Data
Mining5 httpsenwikipediaorgwiki1854_Broad_Street_cholera_outbreak6 Martins N Erlhagen W Freitas R 2011 Non-destructive Whole-brain Monitoring using Nanorobots7 httpwwwtop500org (Nov 2016)8 httpsenwikipediaorgwikiOptical_illusion9 httpsenwikipediaorgwikiVisual_system
10 httpsenwikipediaorgwikiList_of_cognitive_biases11 [httpsenwikipediaorgwikiInfographic]12 Edward Tufte 1983 The Visual Display of Quantitative Information13 Scott Card 2009 Information visualization In A Sears amp J A Jacko (Eds) Human-Computer Interaction Design Issues
Solutions and Applications14 httpsenwikipediaorgwikiStatistical_graphics15 httpsenwikipediaorgwikiExploratory_data_analysis16 httpsenoxforddictionariescomdefinitioncognition17 httpsdewikipediaorgwikiVisual_Analytics18 D A Keim F Mansmann J Schneidewind J Thomas H Ziegler 2008 Visual analytics Scope and challenges Visual
Data Mining19 Comparison of Open Source Visual Analytics Toolkits httpwwwsandiagov~pjcrosspapersPart1pdf20 httpsenwikipediaorgwikiInteractive_data_visualization
Julian Kunkel HAW 2017 39 38
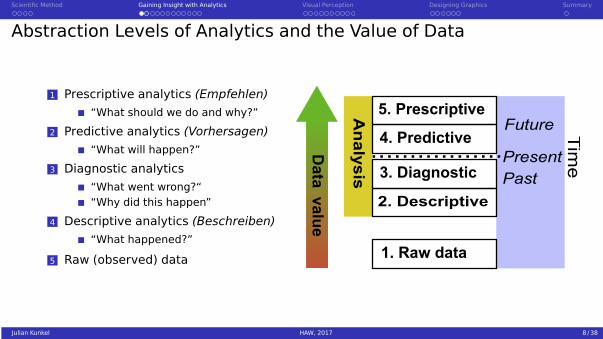
Scientific Method Gaining Insight with Analytics Visual Perception Designing Graphics Summary
Fields of Visual Analytics
Source Visual analytics Scope and challenges [18]
Julian Kunkel HAW 2017 15 38
Scientific Method Gaining Insight with Analytics Visual Perception Designing Graphics Summary
Human-Computer Interaction
Why do we team humans and computers using a visual interface
Comparing capabilities of humans and computers
Human brain processing power is enormous
100 billion neurons linked together by many synapsesSynapses fire with 43 middot1015 spikess data rate of 11 middot1016 bitss = 125 TiBs 20 Watt [6]Fastest supercomputer in the world [7] Sunway TaihuLight 125 TFlops 15 MWEstimation Simulating one second of human brain activity requires 83k processors
Strength of humans and computers
Human Computer
Pattern recognition
Creative thinking
Processing new infos
Execution of algorithms
Accuracy
Visual perception and analysis capabilities exceed computers eg computer vision
Vision uses 30-50 of the brainrsquos capabilitiesrArr Visual representation and analytics is key for efficiency
Julian Kunkel HAW 2017 16 38
Scientific Method Gaining Insight with Analytics Visual Perception Designing Graphics Summary
Example Analysis Session Demo
Based on a real case [5]
1854 Broad Street London
Within a few days people died mysteriously
Dr John Snow investigated the cause to stop ldquodiseaserdquo
He analyzed data visually with the scientific method
We will follow his analysis steps
Using modern data analytics tools
Interactive lab notebook
Record noteshypothesis type code store it together with results
The notebook is prepared using Jupyter with Python
Julian Kunkel HAW 2017 17 38
Scientific Method Gaining Insight with Analytics Visual Perception Designing Graphics Summary
Analysis Results
John found the source of the Cholera The pump
He claimed the disease is spread by the waterJohn is one of the founders of our Germ theory
They unmounted the pump handle
But could not proof theory
Board of health did not believe his analysis
They believed ldquoMiasmardquo is the causerArr Convincing documentation is important
Original map made by John Snow in 1854Cholera cases are highlighted in black [5]
Julian Kunkel HAW 2017 18 38
Scientific Method Gaining Insight with Analytics Visual Perception Designing Graphics Summary
Tools for Visual Analytics
Mandatory features
Interactive
Rich set of visualizations data manipulations and algorithms
Real-time processing of big data
Requirements
Usability
Flexible
Performance
Tools (excerpt)
Closed source SAS Spotfire Domo Tableau QlikView
Open source R PythonJupyterBokeh GoogleVis
Other open source tools see [19]
Julian Kunkel HAW 2017 19 38
Scientific Method Gaining Insight with Analytics Visual Perception Designing Graphics Summary
Outline
1 Scientific Method
2 Gaining Insight with Analytics
3 Visual PerceptionCognitionVisual PerceptionOptical Illusions
4 Designing Graphics
5 Summary
Julian Kunkel HAW 2017 20 38
Scientific Method Gaining Insight with Analytics Visual Perception Designing Graphics Summary
CognitionDefinition The mental action or process of acquiring knowledge and understandingthrough thought experience and the senses [16]
Communicated information and interpretationis biased by humans due to
PerceptionInformation processingSubjective knowledge
Psychology knows many cognitive biases [10]
Categories of cognitive biases
Limits of memoryToo much informationNot enough meaningNeed to act fast
Categories serve as guidelines for visual analytics
We will focus on visual perception
Source Wikipediarsquos complete (as of 2016) list ofcognitive biases beautifully arranged and designedby John Manoogian III (jm3) Categories anddescriptions originally by Buster Benson [10]
Julian Kunkel HAW 2017 21 38
Scientific Method Gaining Insight with Analytics Visual Perception Designing Graphics Summary
Visual Perception Information Pipeline
Information Communication
Information is transformed several times from digital data to human
The retina and brain interprets visual information
Efficient communication requires to understand human perception
x y deathDate job gender262250 1854-08-21 merchant female298242 1854-08-24 other child295229 1854-08-30 craftsmen child270249 1854-08-31 service man273263 1854-08-31 craftsmen child234236 1854-09-01 service child252253 1854-09-01 service child305221 1854-09-01 scholar man275238 1854-09-01 service elderly251245 1854-09-01 scholar child282259 1854-09-01 other child263247 1854-09-01 military elderly237239 1854-09-01 service elderly273232 1854-09-01 other child290228 1854-09-01 scholar female
Computer Human
Data Display
gt gt gtRetina Brain
LightElectricElectricChemic
Visualization Perception Interpretation
Julian Kunkel HAW 2017 22 38
Scientific Method Gaining Insight with Analytics Visual Perception Designing Graphics Summary
Optical Illusions [8]
Definition visually perceived images thatdiffer from objective reality
They are caused by the visual system
They are many different types of illusions
Perceived colors and contrastsSize and shapes of objectsInterpretation of objectsDepth perceptionMoving of objectsAfterimages
Optic nerve
Crossed fibers
Uncrossed fibersOptic chiasma
Optic tractCommissure of Gudden
Pulvinar
Lateral geniculate body
Superior colliculus
Medial geniculate body
Nucleus of oculomotor nerve
Nucleus of trochlar nerve
Nucleus of abducent nerve
Cortex of occipital lobes
Sphere of the eye
Retina
Source Grayrsquos Anatomy depiction of theoptic nerves amp nuclei KDS444 [9]
Julian Kunkel HAW 2017 23 38
Scientific Method Gaining Insight with Analytics Visual Perception Designing Graphics Summary
Color Illusion
Field A and B have the same gray tone
Source The checker shadow illusion Edward HAdelson [8]
Proof Breaking the illusionSource Edward Adelson [8]
Julian Kunkel HAW 2017 24 38
Scientific Method Gaining Insight with Analytics Visual Perception Designing Graphics Summary
Color Illusion (2)
Form that seems to be filled in yellow instead of white
Source Blue-bordered cookie that misleadingly seems to be filled with light yellow water-colorJochen Burghardt [8]
Julian Kunkel HAW 2017 25 38
Scientific Method Gaining Insight with Analytics Visual Perception Designing Graphics Summary
Shapes of Objects
Both orange circles are the same size
Source Optical illusion The two orange circles are the same size [8]
Julian Kunkel HAW 2017 26 38
Scientific Method Gaining Insight with Analytics Visual Perception Designing Graphics Summary
Shapes of Objects (2)
Vertical and horizontal lines have the same length
Source Verticalndashhorizontal illusion S-kay [8]
Julian Kunkel HAW 2017 27 38
Scientific Method Gaining Insight with Analytics Visual Perception Designing Graphics Summary
Shapes of Objects (3)
Imaging a white triangle in the center
Source Kanizsa triangle Fibonacci [8]
Julian Kunkel HAW 2017 28 38
Scientific Method Gaining Insight with Analytics Visual Perception Designing Graphics Summary
Interpretation of Images
Vase or two faces
Source Two silhouette profiles or a white vase Brocken Inaglory [8]
Julian Kunkel HAW 2017 29 38
Scientific Method Gaining Insight with Analytics Visual Perception Designing Graphics Summary
Interpretation of Images (2)
Duck or rabbit
Source Jastrow J (1899) The mindrsquos eye Popular Science Monthly 54
Julian Kunkel HAW 2017 30 38
Scientific Method Gaining Insight with Analytics Visual Perception Designing Graphics Summary
Outline
1 Scientific Method
2 Gaining Insight with Analytics
3 Visual Perception
4 Designing GraphicsIntroductionGuidelinesInfographicsInteractive
5 Summary
Julian Kunkel HAW 2017 31 38
Scientific Method Gaining Insight with Analytics Visual Perception Designing Graphics Summary
Design of (Interactive) Graphics
Designing a good visualization is non-trivial
There exist many guidelines and languages to ldquoprogramrdquo graphics
Considerations limitations of the visual system and cognitive biasesLimits of memoryToo much informationNot enough meaningNeed to act fast
Graphics creation process
Raw Data Data Tables ViewsVisual
Data Visual Form
Structures
Data Transformation
Visual Mappings
ViewTransformations
Interactions
Julian Kunkel HAW 2017 32 38
Scientific Method Gaining Insight with Analytics Visual Perception Designing Graphics Summary
Components of Visual Mappings Encodings [13]
Spatial substrate mapping variables to space (and axes)
Depends on the type of data structured unstructuredValues nominal ordinal quantitative
Marks visible elements points (0D) lines areas volumes (3D)
Connection uses points and lines to show relationships
Enclosure boxes around elements useful to encode relationships
Retinal properties
Spatial Size orientationObject Gray scale color texture shape
Temporal encoding Animations
Julian Kunkel HAW 2017 33 38
Scientific Method Gaining Insight with Analytics Visual Perception Designing Graphics Summary
Guidelines
Goals of graphical displays according to [12]
show the data
induce the viewer to think about the substance rather than about methodologygraphic design the technology of graphic production or something else
avoid distorting what the data have to say
present many numbers in a small space
make large data sets coherent
encourage the eye to compare different pieces of data
reveal the data at several levels of detail from a broad overview to the fine structure
serve a reasonably clear purpose description exploration tabulation or decoration
be closely integrated with the statistical and verbal descriptions of a data set
Julian Kunkel HAW 2017 34 38
Scientific Method Gaining Insight with Analytics Visual Perception Designing Graphics Summary
Information Graphics (Infographics) [11]
Definition Graphic visual representations of information data or knowledge intended topresent information quickly and clearly
Source Gartner Hype Cycle for EmergingTechnologies Jeff McNeil [11]
Source Uganda Export Treemap from MIT HarvardEconomic Complexity Observatory R HaussmannCesar Hidalgo etal [11]
Julian Kunkel HAW 2017 35 38
Scientific Method Gaining Insight with Analytics Visual Perception Designing Graphics Summary
GuidelinesSimple rules
Use the right visualization for the for data types
Use building blocks for graphics (known plot styles)
Reduce information to the essential part to be communicated
Consistent use of building blocks and themes (retinal properties)
Promising concepts in expressing graphics
ggplot2 (for R)
Follows the ldquoGrammar of graphicsrdquoAesthetics define data used for the plotGeometry are visual elements organizing the dataFaceting generates multiple subplots based on properties
Vega httpsvegagithubiovega
Declarative language for interactive graphicsSpecified in JSON format suitable for browser visualization
Julian Kunkel HAW 2017 36 38
Scientific Method Gaining Insight with Analytics Visual Perception Designing Graphics Summary
Interactive Data Visualization
Typical interactions with a view [20]
Brushing selecting elements individuallywith a lasso
Painting create a group from selected elements
Allows to perform subsequent operations with the group
Identification cursormouse provides details about marked element(s)groups
Scaling navigate plots rescale zoom drill-updown aggregated data
Linking interactions are performed on all connected plots
An elementgroup marked in one plot is highlighted on other plotsScaling operations affect connected plots
Julian Kunkel HAW 2017 37 38
Scientific Method Gaining Insight with Analytics Visual Perception Designing Graphics Summary
Summary
Big data analytics is a pillar of science
Supports building of hypothesis and experimentation
Analytics Descriptive diagnostic predictive prescriptive
Visual analytics follows the scientific method
Interactive data exploration modeling amp experimentationExtends exploratory data analytics
Visual perception is efficient for communication of information
But beware of cognitive biases
Understanding limitations of the visual system is important
Optical illusions may lead to wrong conclusions
Graphics design follows principles
Reduce information to the essential part
Julian Kunkel HAW 2017 38 38
Bibliography
1 httpsenwikipediaorgwikiScientific_method2 httpsenwikipediaorgwikiVisual_Analytics3 James Thomas Kristin Cook 2005 Illuminating the Path The RampD Agenda for Visual Analytics National Visualization
and Analytics Center4 Keim D A Mansmann F Schneidewind J Thomas J Ziegler H 2008 Visual analytics Scope and challenges Visual Data
Mining5 httpsenwikipediaorgwiki1854_Broad_Street_cholera_outbreak6 Martins N Erlhagen W Freitas R 2011 Non-destructive Whole-brain Monitoring using Nanorobots7 httpwwwtop500org (Nov 2016)8 httpsenwikipediaorgwikiOptical_illusion9 httpsenwikipediaorgwikiVisual_system
10 httpsenwikipediaorgwikiList_of_cognitive_biases11 [httpsenwikipediaorgwikiInfographic]12 Edward Tufte 1983 The Visual Display of Quantitative Information13 Scott Card 2009 Information visualization In A Sears amp J A Jacko (Eds) Human-Computer Interaction Design Issues
Solutions and Applications14 httpsenwikipediaorgwikiStatistical_graphics15 httpsenwikipediaorgwikiExploratory_data_analysis16 httpsenoxforddictionariescomdefinitioncognition17 httpsdewikipediaorgwikiVisual_Analytics18 D A Keim F Mansmann J Schneidewind J Thomas H Ziegler 2008 Visual analytics Scope and challenges Visual
Data Mining19 Comparison of Open Source Visual Analytics Toolkits httpwwwsandiagov~pjcrosspapersPart1pdf20 httpsenwikipediaorgwikiInteractive_data_visualization
Julian Kunkel HAW 2017 39 38
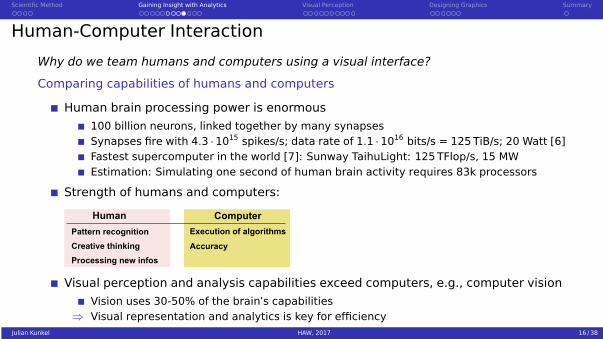
Scientific Method Gaining Insight with Analytics Visual Perception Designing Graphics Summary
Example Analysis Session Demo
Based on a real case [5]
1854 Broad Street London
Within a few days people died mysteriously
Dr John Snow investigated the cause to stop ldquodiseaserdquo
He analyzed data visually with the scientific method
We will follow his analysis steps
Using modern data analytics tools
Interactive lab notebook
Record noteshypothesis type code store it together with results
The notebook is prepared using Jupyter with Python
Julian Kunkel HAW 2017 17 38
Scientific Method Gaining Insight with Analytics Visual Perception Designing Graphics Summary
Analysis Results
John found the source of the Cholera The pump
He claimed the disease is spread by the waterJohn is one of the founders of our Germ theory
They unmounted the pump handle
But could not proof theory
Board of health did not believe his analysis
They believed ldquoMiasmardquo is the causerArr Convincing documentation is important
Original map made by John Snow in 1854Cholera cases are highlighted in black [5]
Julian Kunkel HAW 2017 18 38
Scientific Method Gaining Insight with Analytics Visual Perception Designing Graphics Summary
Tools for Visual Analytics
Mandatory features
Interactive
Rich set of visualizations data manipulations and algorithms
Real-time processing of big data
Requirements
Usability
Flexible
Performance
Tools (excerpt)
Closed source SAS Spotfire Domo Tableau QlikView
Open source R PythonJupyterBokeh GoogleVis
Other open source tools see [19]
Julian Kunkel HAW 2017 19 38
Scientific Method Gaining Insight with Analytics Visual Perception Designing Graphics Summary
Outline
1 Scientific Method
2 Gaining Insight with Analytics
3 Visual PerceptionCognitionVisual PerceptionOptical Illusions
4 Designing Graphics
5 Summary
Julian Kunkel HAW 2017 20 38
Scientific Method Gaining Insight with Analytics Visual Perception Designing Graphics Summary
CognitionDefinition The mental action or process of acquiring knowledge and understandingthrough thought experience and the senses [16]
Communicated information and interpretationis biased by humans due to
PerceptionInformation processingSubjective knowledge
Psychology knows many cognitive biases [10]
Categories of cognitive biases
Limits of memoryToo much informationNot enough meaningNeed to act fast
Categories serve as guidelines for visual analytics
We will focus on visual perception
Source Wikipediarsquos complete (as of 2016) list ofcognitive biases beautifully arranged and designedby John Manoogian III (jm3) Categories anddescriptions originally by Buster Benson [10]
Julian Kunkel HAW 2017 21 38
Scientific Method Gaining Insight with Analytics Visual Perception Designing Graphics Summary
Visual Perception Information Pipeline
Information Communication
Information is transformed several times from digital data to human
The retina and brain interprets visual information
Efficient communication requires to understand human perception
x y deathDate job gender262250 1854-08-21 merchant female298242 1854-08-24 other child295229 1854-08-30 craftsmen child270249 1854-08-31 service man273263 1854-08-31 craftsmen child234236 1854-09-01 service child252253 1854-09-01 service child305221 1854-09-01 scholar man275238 1854-09-01 service elderly251245 1854-09-01 scholar child282259 1854-09-01 other child263247 1854-09-01 military elderly237239 1854-09-01 service elderly273232 1854-09-01 other child290228 1854-09-01 scholar female
Computer Human
Data Display
gt gt gtRetina Brain
LightElectricElectricChemic
Visualization Perception Interpretation
Julian Kunkel HAW 2017 22 38
Scientific Method Gaining Insight with Analytics Visual Perception Designing Graphics Summary
Optical Illusions [8]
Definition visually perceived images thatdiffer from objective reality
They are caused by the visual system
They are many different types of illusions
Perceived colors and contrastsSize and shapes of objectsInterpretation of objectsDepth perceptionMoving of objectsAfterimages
Optic nerve
Crossed fibers
Uncrossed fibersOptic chiasma
Optic tractCommissure of Gudden
Pulvinar
Lateral geniculate body
Superior colliculus
Medial geniculate body
Nucleus of oculomotor nerve
Nucleus of trochlar nerve
Nucleus of abducent nerve
Cortex of occipital lobes
Sphere of the eye
Retina
Source Grayrsquos Anatomy depiction of theoptic nerves amp nuclei KDS444 [9]
Julian Kunkel HAW 2017 23 38
Scientific Method Gaining Insight with Analytics Visual Perception Designing Graphics Summary
Color Illusion
Field A and B have the same gray tone
Source The checker shadow illusion Edward HAdelson [8]
Proof Breaking the illusionSource Edward Adelson [8]
Julian Kunkel HAW 2017 24 38
Scientific Method Gaining Insight with Analytics Visual Perception Designing Graphics Summary
Color Illusion (2)
Form that seems to be filled in yellow instead of white
Source Blue-bordered cookie that misleadingly seems to be filled with light yellow water-colorJochen Burghardt [8]
Julian Kunkel HAW 2017 25 38
Scientific Method Gaining Insight with Analytics Visual Perception Designing Graphics Summary
Shapes of Objects
Both orange circles are the same size
Source Optical illusion The two orange circles are the same size [8]
Julian Kunkel HAW 2017 26 38
Scientific Method Gaining Insight with Analytics Visual Perception Designing Graphics Summary
Shapes of Objects (2)
Vertical and horizontal lines have the same length
Source Verticalndashhorizontal illusion S-kay [8]
Julian Kunkel HAW 2017 27 38
Scientific Method Gaining Insight with Analytics Visual Perception Designing Graphics Summary
Shapes of Objects (3)
Imaging a white triangle in the center
Source Kanizsa triangle Fibonacci [8]
Julian Kunkel HAW 2017 28 38
Scientific Method Gaining Insight with Analytics Visual Perception Designing Graphics Summary
Interpretation of Images
Vase or two faces
Source Two silhouette profiles or a white vase Brocken Inaglory [8]
Julian Kunkel HAW 2017 29 38
Scientific Method Gaining Insight with Analytics Visual Perception Designing Graphics Summary
Interpretation of Images (2)
Duck or rabbit
Source Jastrow J (1899) The mindrsquos eye Popular Science Monthly 54
Julian Kunkel HAW 2017 30 38
Scientific Method Gaining Insight with Analytics Visual Perception Designing Graphics Summary
Outline
1 Scientific Method
2 Gaining Insight with Analytics
3 Visual Perception
4 Designing GraphicsIntroductionGuidelinesInfographicsInteractive
5 Summary
Julian Kunkel HAW 2017 31 38
Scientific Method Gaining Insight with Analytics Visual Perception Designing Graphics Summary
Design of (Interactive) Graphics
Designing a good visualization is non-trivial
There exist many guidelines and languages to ldquoprogramrdquo graphics
Considerations limitations of the visual system and cognitive biasesLimits of memoryToo much informationNot enough meaningNeed to act fast
Graphics creation process
Raw Data Data Tables ViewsVisual
Data Visual Form
Structures
Data Transformation
Visual Mappings
ViewTransformations
Interactions
Julian Kunkel HAW 2017 32 38
Scientific Method Gaining Insight with Analytics Visual Perception Designing Graphics Summary
Components of Visual Mappings Encodings [13]
Spatial substrate mapping variables to space (and axes)
Depends on the type of data structured unstructuredValues nominal ordinal quantitative
Marks visible elements points (0D) lines areas volumes (3D)
Connection uses points and lines to show relationships
Enclosure boxes around elements useful to encode relationships
Retinal properties
Spatial Size orientationObject Gray scale color texture shape
Temporal encoding Animations
Julian Kunkel HAW 2017 33 38
Scientific Method Gaining Insight with Analytics Visual Perception Designing Graphics Summary
Guidelines
Goals of graphical displays according to [12]
show the data
induce the viewer to think about the substance rather than about methodologygraphic design the technology of graphic production or something else
avoid distorting what the data have to say
present many numbers in a small space
make large data sets coherent
encourage the eye to compare different pieces of data
reveal the data at several levels of detail from a broad overview to the fine structure
serve a reasonably clear purpose description exploration tabulation or decoration
be closely integrated with the statistical and verbal descriptions of a data set
Julian Kunkel HAW 2017 34 38
Scientific Method Gaining Insight with Analytics Visual Perception Designing Graphics Summary
Information Graphics (Infographics) [11]
Definition Graphic visual representations of information data or knowledge intended topresent information quickly and clearly
Source Gartner Hype Cycle for EmergingTechnologies Jeff McNeil [11]
Source Uganda Export Treemap from MIT HarvardEconomic Complexity Observatory R HaussmannCesar Hidalgo etal [11]
Julian Kunkel HAW 2017 35 38
Scientific Method Gaining Insight with Analytics Visual Perception Designing Graphics Summary
GuidelinesSimple rules
Use the right visualization for the for data types
Use building blocks for graphics (known plot styles)
Reduce information to the essential part to be communicated
Consistent use of building blocks and themes (retinal properties)
Promising concepts in expressing graphics
ggplot2 (for R)
Follows the ldquoGrammar of graphicsrdquoAesthetics define data used for the plotGeometry are visual elements organizing the dataFaceting generates multiple subplots based on properties
Vega httpsvegagithubiovega
Declarative language for interactive graphicsSpecified in JSON format suitable for browser visualization
Julian Kunkel HAW 2017 36 38
Scientific Method Gaining Insight with Analytics Visual Perception Designing Graphics Summary
Interactive Data Visualization
Typical interactions with a view [20]
Brushing selecting elements individuallywith a lasso
Painting create a group from selected elements
Allows to perform subsequent operations with the group
Identification cursormouse provides details about marked element(s)groups
Scaling navigate plots rescale zoom drill-updown aggregated data
Linking interactions are performed on all connected plots
An elementgroup marked in one plot is highlighted on other plotsScaling operations affect connected plots
Julian Kunkel HAW 2017 37 38
Scientific Method Gaining Insight with Analytics Visual Perception Designing Graphics Summary
Summary
Big data analytics is a pillar of science
Supports building of hypothesis and experimentation
Analytics Descriptive diagnostic predictive prescriptive
Visual analytics follows the scientific method
Interactive data exploration modeling amp experimentationExtends exploratory data analytics
Visual perception is efficient for communication of information
But beware of cognitive biases
Understanding limitations of the visual system is important
Optical illusions may lead to wrong conclusions
Graphics design follows principles
Reduce information to the essential part
Julian Kunkel HAW 2017 38 38
Bibliography
1 httpsenwikipediaorgwikiScientific_method2 httpsenwikipediaorgwikiVisual_Analytics3 James Thomas Kristin Cook 2005 Illuminating the Path The RampD Agenda for Visual Analytics National Visualization
and Analytics Center4 Keim D A Mansmann F Schneidewind J Thomas J Ziegler H 2008 Visual analytics Scope and challenges Visual Data
Mining5 httpsenwikipediaorgwiki1854_Broad_Street_cholera_outbreak6 Martins N Erlhagen W Freitas R 2011 Non-destructive Whole-brain Monitoring using Nanorobots7 httpwwwtop500org (Nov 2016)8 httpsenwikipediaorgwikiOptical_illusion9 httpsenwikipediaorgwikiVisual_system
10 httpsenwikipediaorgwikiList_of_cognitive_biases11 [httpsenwikipediaorgwikiInfographic]12 Edward Tufte 1983 The Visual Display of Quantitative Information13 Scott Card 2009 Information visualization In A Sears amp J A Jacko (Eds) Human-Computer Interaction Design Issues
Solutions and Applications14 httpsenwikipediaorgwikiStatistical_graphics15 httpsenwikipediaorgwikiExploratory_data_analysis16 httpsenoxforddictionariescomdefinitioncognition17 httpsdewikipediaorgwikiVisual_Analytics18 D A Keim F Mansmann J Schneidewind J Thomas H Ziegler 2008 Visual analytics Scope and challenges Visual
Data Mining19 Comparison of Open Source Visual Analytics Toolkits httpwwwsandiagov~pjcrosspapersPart1pdf20 httpsenwikipediaorgwikiInteractive_data_visualization
Julian Kunkel HAW 2017 39 38
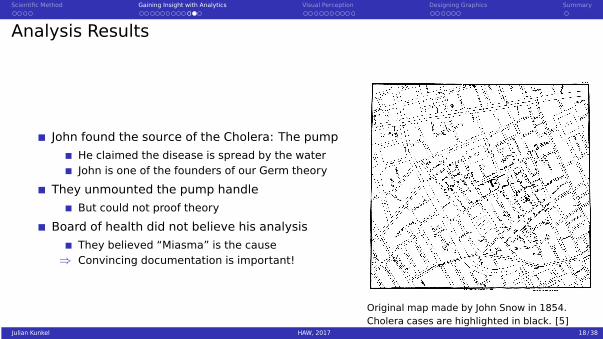
Scientific Method Gaining Insight with Analytics Visual Perception Designing Graphics Summary
Outline
1 Scientific Method
2 Gaining Insight with Analytics
3 Visual PerceptionCognitionVisual PerceptionOptical Illusions
4 Designing Graphics
5 Summary
Julian Kunkel HAW 2017 20 38
Scientific Method Gaining Insight with Analytics Visual Perception Designing Graphics Summary
CognitionDefinition The mental action or process of acquiring knowledge and understandingthrough thought experience and the senses [16]
Communicated information and interpretationis biased by humans due to
PerceptionInformation processingSubjective knowledge
Psychology knows many cognitive biases [10]
Categories of cognitive biases
Limits of memoryToo much informationNot enough meaningNeed to act fast
Categories serve as guidelines for visual analytics
We will focus on visual perception
Source Wikipediarsquos complete (as of 2016) list ofcognitive biases beautifully arranged and designedby John Manoogian III (jm3) Categories anddescriptions originally by Buster Benson [10]
Julian Kunkel HAW 2017 21 38
Scientific Method Gaining Insight with Analytics Visual Perception Designing Graphics Summary
Visual Perception Information Pipeline
Information Communication
Information is transformed several times from digital data to human
The retina and brain interprets visual information
Efficient communication requires to understand human perception
x y deathDate job gender262250 1854-08-21 merchant female298242 1854-08-24 other child295229 1854-08-30 craftsmen child270249 1854-08-31 service man273263 1854-08-31 craftsmen child234236 1854-09-01 service child252253 1854-09-01 service child305221 1854-09-01 scholar man275238 1854-09-01 service elderly251245 1854-09-01 scholar child282259 1854-09-01 other child263247 1854-09-01 military elderly237239 1854-09-01 service elderly273232 1854-09-01 other child290228 1854-09-01 scholar female
Computer Human
Data Display
gt gt gtRetina Brain
LightElectricElectricChemic
Visualization Perception Interpretation
Julian Kunkel HAW 2017 22 38
Scientific Method Gaining Insight with Analytics Visual Perception Designing Graphics Summary
Optical Illusions [8]
Definition visually perceived images thatdiffer from objective reality
They are caused by the visual system
They are many different types of illusions
Perceived colors and contrastsSize and shapes of objectsInterpretation of objectsDepth perceptionMoving of objectsAfterimages
Optic nerve
Crossed fibers
Uncrossed fibersOptic chiasma
Optic tractCommissure of Gudden
Pulvinar
Lateral geniculate body
Superior colliculus
Medial geniculate body
Nucleus of oculomotor nerve
Nucleus of trochlar nerve
Nucleus of abducent nerve
Cortex of occipital lobes
Sphere of the eye
Retina
Source Grayrsquos Anatomy depiction of theoptic nerves amp nuclei KDS444 [9]
Julian Kunkel HAW 2017 23 38
Scientific Method Gaining Insight with Analytics Visual Perception Designing Graphics Summary
Color Illusion
Field A and B have the same gray tone
Source The checker shadow illusion Edward HAdelson [8]
Proof Breaking the illusionSource Edward Adelson [8]
Julian Kunkel HAW 2017 24 38
Scientific Method Gaining Insight with Analytics Visual Perception Designing Graphics Summary
Color Illusion (2)
Form that seems to be filled in yellow instead of white
Source Blue-bordered cookie that misleadingly seems to be filled with light yellow water-colorJochen Burghardt [8]
Julian Kunkel HAW 2017 25 38
Scientific Method Gaining Insight with Analytics Visual Perception Designing Graphics Summary
Shapes of Objects
Both orange circles are the same size
Source Optical illusion The two orange circles are the same size [8]
Julian Kunkel HAW 2017 26 38
Scientific Method Gaining Insight with Analytics Visual Perception Designing Graphics Summary
Shapes of Objects (2)
Vertical and horizontal lines have the same length
Source Verticalndashhorizontal illusion S-kay [8]
Julian Kunkel HAW 2017 27 38
Scientific Method Gaining Insight with Analytics Visual Perception Designing Graphics Summary
Shapes of Objects (3)
Imaging a white triangle in the center
Source Kanizsa triangle Fibonacci [8]
Julian Kunkel HAW 2017 28 38
Scientific Method Gaining Insight with Analytics Visual Perception Designing Graphics Summary
Interpretation of Images
Vase or two faces
Source Two silhouette profiles or a white vase Brocken Inaglory [8]
Julian Kunkel HAW 2017 29 38
Scientific Method Gaining Insight with Analytics Visual Perception Designing Graphics Summary
Interpretation of Images (2)
Duck or rabbit
Source Jastrow J (1899) The mindrsquos eye Popular Science Monthly 54
Julian Kunkel HAW 2017 30 38
Scientific Method Gaining Insight with Analytics Visual Perception Designing Graphics Summary
Outline
1 Scientific Method
2 Gaining Insight with Analytics
3 Visual Perception
4 Designing GraphicsIntroductionGuidelinesInfographicsInteractive
5 Summary
Julian Kunkel HAW 2017 31 38
Scientific Method Gaining Insight with Analytics Visual Perception Designing Graphics Summary
Design of (Interactive) Graphics
Designing a good visualization is non-trivial
There exist many guidelines and languages to ldquoprogramrdquo graphics
Considerations limitations of the visual system and cognitive biasesLimits of memoryToo much informationNot enough meaningNeed to act fast
Graphics creation process
Raw Data Data Tables ViewsVisual
Data Visual Form
Structures
Data Transformation
Visual Mappings
ViewTransformations
Interactions
Julian Kunkel HAW 2017 32 38
Scientific Method Gaining Insight with Analytics Visual Perception Designing Graphics Summary
Components of Visual Mappings Encodings [13]
Spatial substrate mapping variables to space (and axes)
Depends on the type of data structured unstructuredValues nominal ordinal quantitative
Marks visible elements points (0D) lines areas volumes (3D)
Connection uses points and lines to show relationships
Enclosure boxes around elements useful to encode relationships
Retinal properties
Spatial Size orientationObject Gray scale color texture shape
Temporal encoding Animations
Julian Kunkel HAW 2017 33 38
Scientific Method Gaining Insight with Analytics Visual Perception Designing Graphics Summary
Guidelines
Goals of graphical displays according to [12]
show the data
induce the viewer to think about the substance rather than about methodologygraphic design the technology of graphic production or something else
avoid distorting what the data have to say
present many numbers in a small space
make large data sets coherent
encourage the eye to compare different pieces of data
reveal the data at several levels of detail from a broad overview to the fine structure
serve a reasonably clear purpose description exploration tabulation or decoration
be closely integrated with the statistical and verbal descriptions of a data set
Julian Kunkel HAW 2017 34 38
Scientific Method Gaining Insight with Analytics Visual Perception Designing Graphics Summary
Information Graphics (Infographics) [11]
Definition Graphic visual representations of information data or knowledge intended topresent information quickly and clearly
Source Gartner Hype Cycle for EmergingTechnologies Jeff McNeil [11]
Source Uganda Export Treemap from MIT HarvardEconomic Complexity Observatory R HaussmannCesar Hidalgo etal [11]
Julian Kunkel HAW 2017 35 38
Scientific Method Gaining Insight with Analytics Visual Perception Designing Graphics Summary
GuidelinesSimple rules
Use the right visualization for the for data types
Use building blocks for graphics (known plot styles)
Reduce information to the essential part to be communicated
Consistent use of building blocks and themes (retinal properties)
Promising concepts in expressing graphics
ggplot2 (for R)
Follows the ldquoGrammar of graphicsrdquoAesthetics define data used for the plotGeometry are visual elements organizing the dataFaceting generates multiple subplots based on properties
Vega httpsvegagithubiovega
Declarative language for interactive graphicsSpecified in JSON format suitable for browser visualization
Julian Kunkel HAW 2017 36 38
Scientific Method Gaining Insight with Analytics Visual Perception Designing Graphics Summary
Interactive Data Visualization
Typical interactions with a view [20]
Brushing selecting elements individuallywith a lasso
Painting create a group from selected elements
Allows to perform subsequent operations with the group
Identification cursormouse provides details about marked element(s)groups
Scaling navigate plots rescale zoom drill-updown aggregated data
Linking interactions are performed on all connected plots
An elementgroup marked in one plot is highlighted on other plotsScaling operations affect connected plots
Julian Kunkel HAW 2017 37 38
Scientific Method Gaining Insight with Analytics Visual Perception Designing Graphics Summary
Summary
Big data analytics is a pillar of science
Supports building of hypothesis and experimentation
Analytics Descriptive diagnostic predictive prescriptive
Visual analytics follows the scientific method
Interactive data exploration modeling amp experimentationExtends exploratory data analytics
Visual perception is efficient for communication of information
But beware of cognitive biases
Understanding limitations of the visual system is important
Optical illusions may lead to wrong conclusions
Graphics design follows principles
Reduce information to the essential part
Julian Kunkel HAW 2017 38 38
Bibliography
1 httpsenwikipediaorgwikiScientific_method2 httpsenwikipediaorgwikiVisual_Analytics3 James Thomas Kristin Cook 2005 Illuminating the Path The RampD Agenda for Visual Analytics National Visualization
and Analytics Center4 Keim D A Mansmann F Schneidewind J Thomas J Ziegler H 2008 Visual analytics Scope and challenges Visual Data
Mining5 httpsenwikipediaorgwiki1854_Broad_Street_cholera_outbreak6 Martins N Erlhagen W Freitas R 2011 Non-destructive Whole-brain Monitoring using Nanorobots7 httpwwwtop500org (Nov 2016)8 httpsenwikipediaorgwikiOptical_illusion9 httpsenwikipediaorgwikiVisual_system
10 httpsenwikipediaorgwikiList_of_cognitive_biases11 [httpsenwikipediaorgwikiInfographic]12 Edward Tufte 1983 The Visual Display of Quantitative Information13 Scott Card 2009 Information visualization In A Sears amp J A Jacko (Eds) Human-Computer Interaction Design Issues
Solutions and Applications14 httpsenwikipediaorgwikiStatistical_graphics15 httpsenwikipediaorgwikiExploratory_data_analysis16 httpsenoxforddictionariescomdefinitioncognition17 httpsdewikipediaorgwikiVisual_Analytics18 D A Keim F Mansmann J Schneidewind J Thomas H Ziegler 2008 Visual analytics Scope and challenges Visual
Data Mining19 Comparison of Open Source Visual Analytics Toolkits httpwwwsandiagov~pjcrosspapersPart1pdf20 httpsenwikipediaorgwikiInteractive_data_visualization
Julian Kunkel HAW 2017 39 38

Scientific Method Gaining Insight with Analytics Visual Perception Designing Graphics Summary
Shapes of Objects
Both orange circles are the same size
Source Optical illusion The two orange circles are the same size [8]
Julian Kunkel HAW 2017 26 38
Scientific Method Gaining Insight with Analytics Visual Perception Designing Graphics Summary
Shapes of Objects (2)
Vertical and horizontal lines have the same length
Source Verticalndashhorizontal illusion S-kay [8]
Julian Kunkel HAW 2017 27 38
Scientific Method Gaining Insight with Analytics Visual Perception Designing Graphics Summary
Shapes of Objects (3)
Imaging a white triangle in the center
Source Kanizsa triangle Fibonacci [8]
Julian Kunkel HAW 2017 28 38
Scientific Method Gaining Insight with Analytics Visual Perception Designing Graphics Summary
Interpretation of Images
Vase or two faces
Source Two silhouette profiles or a white vase Brocken Inaglory [8]
Julian Kunkel HAW 2017 29 38
Scientific Method Gaining Insight with Analytics Visual Perception Designing Graphics Summary
Interpretation of Images (2)
Duck or rabbit
Source Jastrow J (1899) The mindrsquos eye Popular Science Monthly 54
Julian Kunkel HAW 2017 30 38
Scientific Method Gaining Insight with Analytics Visual Perception Designing Graphics Summary
Outline
1 Scientific Method
2 Gaining Insight with Analytics
3 Visual Perception
4 Designing GraphicsIntroductionGuidelinesInfographicsInteractive
5 Summary
Julian Kunkel HAW 2017 31 38
Scientific Method Gaining Insight with Analytics Visual Perception Designing Graphics Summary
Design of (Interactive) Graphics
Designing a good visualization is non-trivial
There exist many guidelines and languages to ldquoprogramrdquo graphics
Considerations limitations of the visual system and cognitive biasesLimits of memoryToo much informationNot enough meaningNeed to act fast
Graphics creation process
Raw Data Data Tables ViewsVisual
Data Visual Form
Structures
Data Transformation
Visual Mappings
ViewTransformations
Interactions
Julian Kunkel HAW 2017 32 38
Scientific Method Gaining Insight with Analytics Visual Perception Designing Graphics Summary
Components of Visual Mappings Encodings [13]
Spatial substrate mapping variables to space (and axes)
Depends on the type of data structured unstructuredValues nominal ordinal quantitative
Marks visible elements points (0D) lines areas volumes (3D)
Connection uses points and lines to show relationships
Enclosure boxes around elements useful to encode relationships
Retinal properties
Spatial Size orientationObject Gray scale color texture shape
Temporal encoding Animations
Julian Kunkel HAW 2017 33 38
Scientific Method Gaining Insight with Analytics Visual Perception Designing Graphics Summary
Guidelines
Goals of graphical displays according to [12]
show the data
induce the viewer to think about the substance rather than about methodologygraphic design the technology of graphic production or something else
avoid distorting what the data have to say
present many numbers in a small space
make large data sets coherent
encourage the eye to compare different pieces of data
reveal the data at several levels of detail from a broad overview to the fine structure
serve a reasonably clear purpose description exploration tabulation or decoration
be closely integrated with the statistical and verbal descriptions of a data set
Julian Kunkel HAW 2017 34 38
Scientific Method Gaining Insight with Analytics Visual Perception Designing Graphics Summary
Information Graphics (Infographics) [11]
Definition Graphic visual representations of information data or knowledge intended topresent information quickly and clearly
Source Gartner Hype Cycle for EmergingTechnologies Jeff McNeil [11]
Source Uganda Export Treemap from MIT HarvardEconomic Complexity Observatory R HaussmannCesar Hidalgo etal [11]
Julian Kunkel HAW 2017 35 38
Scientific Method Gaining Insight with Analytics Visual Perception Designing Graphics Summary
GuidelinesSimple rules
Use the right visualization for the for data types
Use building blocks for graphics (known plot styles)
Reduce information to the essential part to be communicated
Consistent use of building blocks and themes (retinal properties)
Promising concepts in expressing graphics
ggplot2 (for R)
Follows the ldquoGrammar of graphicsrdquoAesthetics define data used for the plotGeometry are visual elements organizing the dataFaceting generates multiple subplots based on properties
Vega httpsvegagithubiovega
Declarative language for interactive graphicsSpecified in JSON format suitable for browser visualization
Julian Kunkel HAW 2017 36 38
Scientific Method Gaining Insight with Analytics Visual Perception Designing Graphics Summary
Interactive Data Visualization
Typical interactions with a view [20]
Brushing selecting elements individuallywith a lasso
Painting create a group from selected elements
Allows to perform subsequent operations with the group
Identification cursormouse provides details about marked element(s)groups
Scaling navigate plots rescale zoom drill-updown aggregated data
Linking interactions are performed on all connected plots
An elementgroup marked in one plot is highlighted on other plotsScaling operations affect connected plots
Julian Kunkel HAW 2017 37 38
Scientific Method Gaining Insight with Analytics Visual Perception Designing Graphics Summary
Summary
Big data analytics is a pillar of science
Supports building of hypothesis and experimentation
Analytics Descriptive diagnostic predictive prescriptive
Visual analytics follows the scientific method
Interactive data exploration modeling amp experimentationExtends exploratory data analytics
Visual perception is efficient for communication of information
But beware of cognitive biases
Understanding limitations of the visual system is important
Optical illusions may lead to wrong conclusions
Graphics design follows principles
Reduce information to the essential part
Julian Kunkel HAW 2017 38 38
Bibliography
1 httpsenwikipediaorgwikiScientific_method2 httpsenwikipediaorgwikiVisual_Analytics3 James Thomas Kristin Cook 2005 Illuminating the Path The RampD Agenda for Visual Analytics National Visualization
and Analytics Center4 Keim D A Mansmann F Schneidewind J Thomas J Ziegler H 2008 Visual analytics Scope and challenges Visual Data
Mining5 httpsenwikipediaorgwiki1854_Broad_Street_cholera_outbreak6 Martins N Erlhagen W Freitas R 2011 Non-destructive Whole-brain Monitoring using Nanorobots7 httpwwwtop500org (Nov 2016)8 httpsenwikipediaorgwikiOptical_illusion9 httpsenwikipediaorgwikiVisual_system
10 httpsenwikipediaorgwikiList_of_cognitive_biases11 [httpsenwikipediaorgwikiInfographic]12 Edward Tufte 1983 The Visual Display of Quantitative Information13 Scott Card 2009 Information visualization In A Sears amp J A Jacko (Eds) Human-Computer Interaction Design Issues
Solutions and Applications14 httpsenwikipediaorgwikiStatistical_graphics15 httpsenwikipediaorgwikiExploratory_data_analysis16 httpsenoxforddictionariescomdefinitioncognition17 httpsdewikipediaorgwikiVisual_Analytics18 D A Keim F Mansmann J Schneidewind J Thomas H Ziegler 2008 Visual analytics Scope and challenges Visual
Data Mining19 Comparison of Open Source Visual Analytics Toolkits httpwwwsandiagov~pjcrosspapersPart1pdf20 httpsenwikipediaorgwikiInteractive_data_visualization
Julian Kunkel HAW 2017 39 38
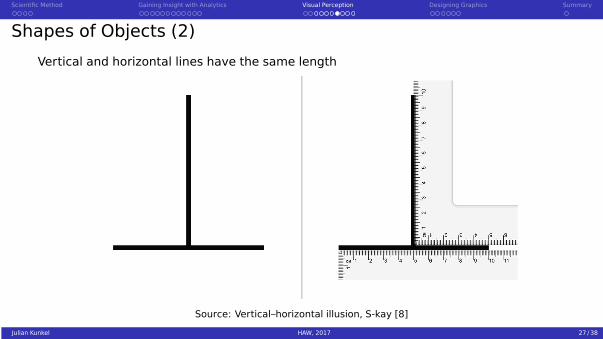
Scientific Method Gaining Insight with Analytics Visual Perception Designing Graphics Summary
Outline
1 Scientific Method
2 Gaining Insight with Analytics
3 Visual Perception
4 Designing GraphicsIntroductionGuidelinesInfographicsInteractive
5 Summary
Julian Kunkel HAW 2017 31 38
Scientific Method Gaining Insight with Analytics Visual Perception Designing Graphics Summary
Design of (Interactive) Graphics
Designing a good visualization is non-trivial
There exist many guidelines and languages to ldquoprogramrdquo graphics
Considerations limitations of the visual system and cognitive biasesLimits of memoryToo much informationNot enough meaningNeed to act fast
Graphics creation process
Raw Data Data Tables ViewsVisual
Data Visual Form
Structures
Data Transformation
Visual Mappings
ViewTransformations
Interactions
Julian Kunkel HAW 2017 32 38
Scientific Method Gaining Insight with Analytics Visual Perception Designing Graphics Summary
Components of Visual Mappings Encodings [13]
Spatial substrate mapping variables to space (and axes)
Depends on the type of data structured unstructuredValues nominal ordinal quantitative
Marks visible elements points (0D) lines areas volumes (3D)
Connection uses points and lines to show relationships
Enclosure boxes around elements useful to encode relationships
Retinal properties
Spatial Size orientationObject Gray scale color texture shape
Temporal encoding Animations
Julian Kunkel HAW 2017 33 38
Scientific Method Gaining Insight with Analytics Visual Perception Designing Graphics Summary
Guidelines
Goals of graphical displays according to [12]
show the data
induce the viewer to think about the substance rather than about methodologygraphic design the technology of graphic production or something else
avoid distorting what the data have to say
present many numbers in a small space
make large data sets coherent
encourage the eye to compare different pieces of data
reveal the data at several levels of detail from a broad overview to the fine structure
serve a reasonably clear purpose description exploration tabulation or decoration
be closely integrated with the statistical and verbal descriptions of a data set
Julian Kunkel HAW 2017 34 38
Scientific Method Gaining Insight with Analytics Visual Perception Designing Graphics Summary
Information Graphics (Infographics) [11]
Definition Graphic visual representations of information data or knowledge intended topresent information quickly and clearly
Source Gartner Hype Cycle for EmergingTechnologies Jeff McNeil [11]
Source Uganda Export Treemap from MIT HarvardEconomic Complexity Observatory R HaussmannCesar Hidalgo etal [11]
Julian Kunkel HAW 2017 35 38
Scientific Method Gaining Insight with Analytics Visual Perception Designing Graphics Summary
GuidelinesSimple rules
Use the right visualization for the for data types
Use building blocks for graphics (known plot styles)
Reduce information to the essential part to be communicated
Consistent use of building blocks and themes (retinal properties)
Promising concepts in expressing graphics
ggplot2 (for R)
Follows the ldquoGrammar of graphicsrdquoAesthetics define data used for the plotGeometry are visual elements organizing the dataFaceting generates multiple subplots based on properties
Vega httpsvegagithubiovega
Declarative language for interactive graphicsSpecified in JSON format suitable for browser visualization
Julian Kunkel HAW 2017 36 38
Scientific Method Gaining Insight with Analytics Visual Perception Designing Graphics Summary
Interactive Data Visualization
Typical interactions with a view [20]
Brushing selecting elements individuallywith a lasso
Painting create a group from selected elements
Allows to perform subsequent operations with the group
Identification cursormouse provides details about marked element(s)groups
Scaling navigate plots rescale zoom drill-updown aggregated data
Linking interactions are performed on all connected plots
An elementgroup marked in one plot is highlighted on other plotsScaling operations affect connected plots
Julian Kunkel HAW 2017 37 38
Scientific Method Gaining Insight with Analytics Visual Perception Designing Graphics Summary
Summary
Big data analytics is a pillar of science
Supports building of hypothesis and experimentation
Analytics Descriptive diagnostic predictive prescriptive
Visual analytics follows the scientific method
Interactive data exploration modeling amp experimentationExtends exploratory data analytics
Visual perception is efficient for communication of information
But beware of cognitive biases
Understanding limitations of the visual system is important
Optical illusions may lead to wrong conclusions
Graphics design follows principles
Reduce information to the essential part
Julian Kunkel HAW 2017 38 38
Bibliography
1 httpsenwikipediaorgwikiScientific_method2 httpsenwikipediaorgwikiVisual_Analytics3 James Thomas Kristin Cook 2005 Illuminating the Path The RampD Agenda for Visual Analytics National Visualization
and Analytics Center4 Keim D A Mansmann F Schneidewind J Thomas J Ziegler H 2008 Visual analytics Scope and challenges Visual Data
Mining5 httpsenwikipediaorgwiki1854_Broad_Street_cholera_outbreak6 Martins N Erlhagen W Freitas R 2011 Non-destructive Whole-brain Monitoring using Nanorobots7 httpwwwtop500org (Nov 2016)8 httpsenwikipediaorgwikiOptical_illusion9 httpsenwikipediaorgwikiVisual_system
10 httpsenwikipediaorgwikiList_of_cognitive_biases11 [httpsenwikipediaorgwikiInfographic]12 Edward Tufte 1983 The Visual Display of Quantitative Information13 Scott Card 2009 Information visualization In A Sears amp J A Jacko (Eds) Human-Computer Interaction Design Issues
Solutions and Applications14 httpsenwikipediaorgwikiStatistical_graphics15 httpsenwikipediaorgwikiExploratory_data_analysis16 httpsenoxforddictionariescomdefinitioncognition17 httpsdewikipediaorgwikiVisual_Analytics18 D A Keim F Mansmann J Schneidewind J Thomas H Ziegler 2008 Visual analytics Scope and challenges Visual
Data Mining19 Comparison of Open Source Visual Analytics Toolkits httpwwwsandiagov~pjcrosspapersPart1pdf20 httpsenwikipediaorgwikiInteractive_data_visualization
Julian Kunkel HAW 2017 39 38
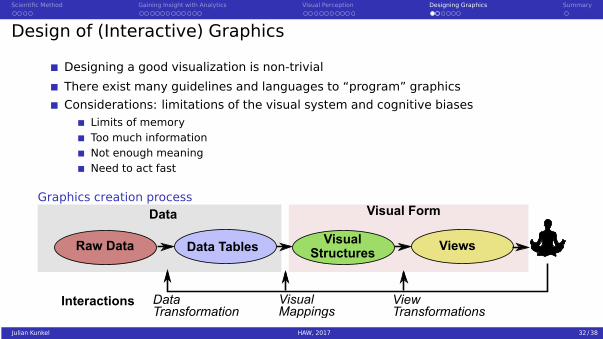
Scientific Method Gaining Insight with Analytics Visual Perception Designing Graphics Summary
Components of Visual Mappings Encodings [13]
Spatial substrate mapping variables to space (and axes)
Depends on the type of data structured unstructuredValues nominal ordinal quantitative
Marks visible elements points (0D) lines areas volumes (3D)
Connection uses points and lines to show relationships
Enclosure boxes around elements useful to encode relationships
Retinal properties
Spatial Size orientationObject Gray scale color texture shape
Temporal encoding Animations
Julian Kunkel HAW 2017 33 38
Scientific Method Gaining Insight with Analytics Visual Perception Designing Graphics Summary
Guidelines
Goals of graphical displays according to [12]
show the data
induce the viewer to think about the substance rather than about methodologygraphic design the technology of graphic production or something else
avoid distorting what the data have to say
present many numbers in a small space
make large data sets coherent
encourage the eye to compare different pieces of data
reveal the data at several levels of detail from a broad overview to the fine structure
serve a reasonably clear purpose description exploration tabulation or decoration
be closely integrated with the statistical and verbal descriptions of a data set
Julian Kunkel HAW 2017 34 38
Scientific Method Gaining Insight with Analytics Visual Perception Designing Graphics Summary
Information Graphics (Infographics) [11]
Definition Graphic visual representations of information data or knowledge intended topresent information quickly and clearly
Source Gartner Hype Cycle for EmergingTechnologies Jeff McNeil [11]
Source Uganda Export Treemap from MIT HarvardEconomic Complexity Observatory R HaussmannCesar Hidalgo etal [11]
Julian Kunkel HAW 2017 35 38
Scientific Method Gaining Insight with Analytics Visual Perception Designing Graphics Summary
GuidelinesSimple rules
Use the right visualization for the for data types
Use building blocks for graphics (known plot styles)
Reduce information to the essential part to be communicated
Consistent use of building blocks and themes (retinal properties)
Promising concepts in expressing graphics
ggplot2 (for R)
Follows the ldquoGrammar of graphicsrdquoAesthetics define data used for the plotGeometry are visual elements organizing the dataFaceting generates multiple subplots based on properties
Vega httpsvegagithubiovega
Declarative language for interactive graphicsSpecified in JSON format suitable for browser visualization
Julian Kunkel HAW 2017 36 38
Scientific Method Gaining Insight with Analytics Visual Perception Designing Graphics Summary
Interactive Data Visualization
Typical interactions with a view [20]
Brushing selecting elements individuallywith a lasso
Painting create a group from selected elements
Allows to perform subsequent operations with the group
Identification cursormouse provides details about marked element(s)groups
Scaling navigate plots rescale zoom drill-updown aggregated data
Linking interactions are performed on all connected plots
An elementgroup marked in one plot is highlighted on other plotsScaling operations affect connected plots
Julian Kunkel HAW 2017 37 38
Scientific Method Gaining Insight with Analytics Visual Perception Designing Graphics Summary
Summary
Big data analytics is a pillar of science
Supports building of hypothesis and experimentation
Analytics Descriptive diagnostic predictive prescriptive
Visual analytics follows the scientific method
Interactive data exploration modeling amp experimentationExtends exploratory data analytics
Visual perception is efficient for communication of information
But beware of cognitive biases
Understanding limitations of the visual system is important
Optical illusions may lead to wrong conclusions
Graphics design follows principles
Reduce information to the essential part
Julian Kunkel HAW 2017 38 38
Bibliography
1 httpsenwikipediaorgwikiScientific_method2 httpsenwikipediaorgwikiVisual_Analytics3 James Thomas Kristin Cook 2005 Illuminating the Path The RampD Agenda for Visual Analytics National Visualization
and Analytics Center4 Keim D A Mansmann F Schneidewind J Thomas J Ziegler H 2008 Visual analytics Scope and challenges Visual Data
Mining5 httpsenwikipediaorgwiki1854_Broad_Street_cholera_outbreak6 Martins N Erlhagen W Freitas R 2011 Non-destructive Whole-brain Monitoring using Nanorobots7 httpwwwtop500org (Nov 2016)8 httpsenwikipediaorgwikiOptical_illusion9 httpsenwikipediaorgwikiVisual_system
10 httpsenwikipediaorgwikiList_of_cognitive_biases11 [httpsenwikipediaorgwikiInfographic]12 Edward Tufte 1983 The Visual Display of Quantitative Information13 Scott Card 2009 Information visualization In A Sears amp J A Jacko (Eds) Human-Computer Interaction Design Issues
Solutions and Applications14 httpsenwikipediaorgwikiStatistical_graphics15 httpsenwikipediaorgwikiExploratory_data_analysis16 httpsenoxforddictionariescomdefinitioncognition17 httpsdewikipediaorgwikiVisual_Analytics18 D A Keim F Mansmann J Schneidewind J Thomas H Ziegler 2008 Visual analytics Scope and challenges Visual
Data Mining19 Comparison of Open Source Visual Analytics Toolkits httpwwwsandiagov~pjcrosspapersPart1pdf20 httpsenwikipediaorgwikiInteractive_data_visualization
Julian Kunkel HAW 2017 39 38
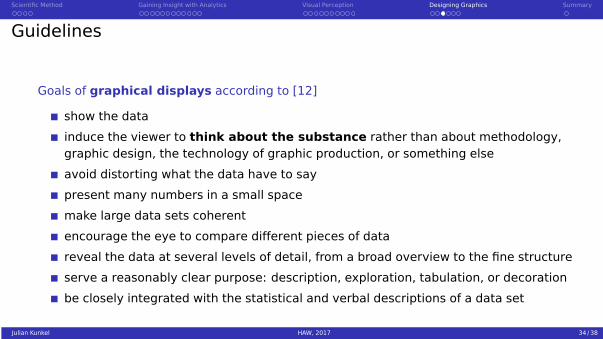
Scientific Method Gaining Insight with Analytics Visual Perception Designing Graphics Summary
Summary
Big data analytics is a pillar of science
Supports building of hypothesis and experimentation
Analytics Descriptive diagnostic predictive prescriptive
Visual analytics follows the scientific method
Interactive data exploration modeling amp experimentationExtends exploratory data analytics
Visual perception is efficient for communication of information
But beware of cognitive biases
Understanding limitations of the visual system is important
Optical illusions may lead to wrong conclusions
Graphics design follows principles
Reduce information to the essential part
Julian Kunkel HAW 2017 38 38
Bibliography
1 httpsenwikipediaorgwikiScientific_method2 httpsenwikipediaorgwikiVisual_Analytics3 James Thomas Kristin Cook 2005 Illuminating the Path The RampD Agenda for Visual Analytics National Visualization
and Analytics Center4 Keim D A Mansmann F Schneidewind J Thomas J Ziegler H 2008 Visual analytics Scope and challenges Visual Data
Mining5 httpsenwikipediaorgwiki1854_Broad_Street_cholera_outbreak6 Martins N Erlhagen W Freitas R 2011 Non-destructive Whole-brain Monitoring using Nanorobots7 httpwwwtop500org (Nov 2016)8 httpsenwikipediaorgwikiOptical_illusion9 httpsenwikipediaorgwikiVisual_system
10 httpsenwikipediaorgwikiList_of_cognitive_biases11 [httpsenwikipediaorgwikiInfographic]12 Edward Tufte 1983 The Visual Display of Quantitative Information13 Scott Card 2009 Information visualization In A Sears amp J A Jacko (Eds) Human-Computer Interaction Design Issues
Solutions and Applications14 httpsenwikipediaorgwikiStatistical_graphics15 httpsenwikipediaorgwikiExploratory_data_analysis16 httpsenoxforddictionariescomdefinitioncognition17 httpsdewikipediaorgwikiVisual_Analytics18 D A Keim F Mansmann J Schneidewind J Thomas H Ziegler 2008 Visual analytics Scope and challenges Visual
Data Mining19 Comparison of Open Source Visual Analytics Toolkits httpwwwsandiagov~pjcrosspapersPart1pdf20 httpsenwikipediaorgwikiInteractive_data_visualization
Julian Kunkel HAW 2017 39 38


