Page 1
Visual-based event mining in social media
Riadh Trad
To cite this version:
Riadh Trad. Visual-based event mining in social media. Information Retrieval [cs.IR]. TelecomParisTech, 2013. English. <NNT : 2013ENST0030>. <tel-01229527>
HAL Id: tel-01229527
https://pastel.archives-ouvertes.fr/tel-01229527
Submitted on 16 Nov 2015
HAL is a multi-disciplinary open accessarchive for the deposit and dissemination of sci-entific research documents, whether they are pub-lished or not. The documents may come fromteaching and research institutions in France orabroad, or from public or private research centers.
L’archive ouverte pluridisciplinaire HAL, estdestinee au depot et a la diffusion de documentsscientifiques de niveau recherche, publies ou non,emanant des etablissements d’enseignement et derecherche francais ou etrangers, des laboratoirespublics ou prives.
Page 2
�
�
�
�
�
2013-ENST-0030
EDITE - ED 130
Doctorat ParisTech
T H È S E
pour obtenir le grade de docteur délivré par
TELECOM ParisTech
Spécialité « Informatique et Réseaux »
présentée et soutenue publiquement par
Mohamed Riadh TRAD05/06/2013
Découverte d’événements par contenu visuel dans
les médias sociauxDirecteur de thèse : Nozha BOUJEMAACo-encadrement de la thèse : Alexis JOLY
JuryM. Nicu SEBE, Professeur, University of Trento RapporteurM. Frédéric PRECIOSO, Professeur (HDR), I3S, Université Sophia Antipolis RapporteurM. Matthieu CORD, Professeur (HDR), MALIRE, LIP6, UPMC ExaminateurM. Bernard MERIALDO, Professeur (HDR), Eurocom ExaminateurM. Denis TEYSSOU, Responsable du MEDIALAB de L’Agence France Presse ExaminateurMme Nozha BOUJEMAA, Docteur (HDR), INRIA Saclay Ile de France ExaminateurM. Alexis JOLY, Docteur, équipe ZENITH (LIRMM), INRIA Sophia-Antipolis Examinateur
TELECOM ParisTechécole de l’Institut Mines-Télécom - membre de ParisTech
46 rue Barrault 75013 Paris - (+33) 1 45 81 77 77 - www.telecom-paristech.fr
Page 4
ABSTRACT
Visual-based event mining in Social Media
Trad Mohamed Riadh
Broadly understood, events are things that happen, things such births, wed-
dings and deaths. Among these moments, are those we record and share with
friends. Social media sites, such as Flickr or Facebook, provide a platform for
people to promote social events and organize content in an event centric manner.
The ease of capturing and publishing on social media sites however, has led
to significant impact on the overall information available to the user. The number
of social media documents for each event is potentially very large and is often
disseminated between users. Defining new methods for organizing, searching and
browsing media according to real-life events is therefore of prime interest for main-
taining a high-quality user experience.
While earlier studies were based solely on text analysis and essentially focused
on news documents, more recent work has been able to take advantage of richer
multimedia content available, while having to cope with the challenges that such a
benefit entails. And as the amount of content grows, research will have to identify
robust ways to process, organize and filter that content. In this dissertation we
aim to provide scalable, cloud oriented techniques for organizing social media do-
cuments associated with events, notably in scalable and distributed environments.
To identify event content, we develop a visual-based method for retrieving
events in photo collections, typically in the context of User Generated Content.
Page 5
Given a query event record, represented by a set of photos, we aim at retrieving
other records of the same event, typically generated by distinct users.
Matching event records however, requires defining a similarity function that
captures the multi-facet similarity between event records. Although records of the
same event often exhibit similar facets, they may differ in several aspects. Records
of the same event, for instance, are not necessarily located at the same place (e.g.
an eclipse, tsunami) and can be recorded at different times (e.g. during a festival).
Importantly, we show how using visual content as complementary information
might overcome several limitations of state-of-the-art approaches that rely only
on metadata.
The number of social media documents for each event is potentially large.
While some of their content might be interesting and useful, a considerable amount
might be of little value to people interested in learning about the event itself. To
avoid overwhelming users with unmanageable volumes of event information, we
present a new collaborative content-based filtering technique for selecting relevant
documents for a given event. Specifically, we leverage the social context provided
by the social media to objectively detect moments of interest in social events.
Should a sufficient number of users take a large number of shots at a particular
moment, then we might consider this to be an objective evaluation of interest at
that moment.
With our record-based event retrieving paradigm, we provide novel approaches
for searching, browsing and organizing events in social media. Overall, the work
presented in this dissertation provides an essential methodology for organizing so-
cial media documents that reflect event information, with a view to improving
browsing and search for social media event data.
Page 6
Acknowledgements
First and foremost I would like to thank Dr. Nozha Boujemaa who gave me
the opportunity to join the iMedia team under her guidance.
I would also like to thank my advisor Alexis Joly for his consistent support,
continuous encouragement and the fruitful discussions we had. I appreciate all
his contributions of time and ideas to make my Ph.D. experience productive and
stimulating.
I am also grateful to the members of my oral defense committee : Matthieu
CORD, M. Bernard MERIALDO, Denis TEYSSOU, Frédéric PRECIOSO and
Nicu SEBE, for their time and insightful questions.
I would also like to thank my official reader Richard James for carefully reading
several drafts of this dissertation and providing helpful suggestions.
My time at iMedia was made enjoyable in large part due to the many friends
that became a part of my life. Apart from Alexis and James, I would like to thank
Asma REJEB, Esma ELGHOUL, Sofiene MOUINE, Souheil SELMI, Laurent
JOYEUX and Laurence BOURCIER, as well as former iMedia members : Mo-
hamed CHAOUCH and Raffi ENFICIAUD.
Lastly, I would like to thank my family for all their love and encouragement. For
my parents who raised me with a love of science and supported me in all my pur-
suits. And most of all for my loving, supportive, encouraging, and patient fiancee
Asma whose faithful support during the final stages of this Ph.D. is so appreciated.
Thank you.
Page 7
TRAD Mohamed Riadh
September 2013
Page 8
March on. Do not tarry. To go forward is to move toward perfection.
March on, and fear not the thorns, or the sharp stones on life’s path.
Gibran Khalil Gibran
Page 10
Résumé
1 Motivations
L’évolution du web, de ce qui était typiquement connu comme un moyen de
communication à sens unique en mode conversationnel, a radicalement changé
notre manière à traiter l’information.
Des sites de médias sociaux tels que Flickr et Facebook, offrent des espaces
d’échange et de diffusion de l’information. Une information de plus en plus riche,
abondante mais aussi personnelle, i.e. capturée par l’utilisateur, et qui s’organise,
le plus souvent, autour d’événements de la vie rélle.
Ainsi, un événement peut être perçu comme un ensemble de vues personnelles
et locales, capturées par les utilisateurs ayant pris part à l’événement. Identifier
ces différrentes instances permettrait, dès lors, de reconstituer une vue globale
de l’événement. Plus particulièrement, lier différentes instances d’un même événe-
ment profiterait à bon nombre d’applications tel que la recherche, la navigation
ou encore le filtrage et la suggestion de contenus.
vii
Page 11
2 Problématiques
L’objectif principal de cette thèse est l’identification du contenu multimédia,
associé à un événement dans de grandes collections d’images.
Plus particulièrement, on s’intéresse au contenu généré par l’utilisateur et pu-
blié dans les médias sociaux. Un tel contenu est le plus souvent, diffus, partagé par
différents utilisateurs, il peut être hétérogne, bruité et pour la plus part non annoté.
Pour mieux illustrer la motivation derrière l’identification du contenu d’événe-
ments dans les médias sociaux, considérons une personne souhaitant assister au
festival de musique "Rock en Seine" dans le parc du chaâteau de Saint-Cloud. Dans
ce sens, et avant de prendre sa décion, elle entreprend une recherche concernant
les éditions des années précédentes. Le site de l’événement contient des informa-
tions de base, le programme, la billetterie et même si il y figure des médias des
éditions précédentes, elle ne reflètent pas l’ambiance du festival. Cette couverture
large rend les sites de médias sociaux une source inestimable d’informations.
Après avoir assisté à l’événement, un utilisateur peut vouloir prolonger son
expérrance en visionnant des médias capturés par d’autres utilisateurs. En télé-
chargeant le contenu qu’il a capturé lors de l’événement un utilisateur peut avoir
accès au contenu généré par d’autre participants. L’utilisateur peut alors revivre
l’événement en naviguant dans les photos prises par d’autres utilisateurs, il peut
par ailleurs enrichir sa propre collections de médias ou encore contribuer à enrichir
le contenu global disponible sur le web.
Dans un contexte plus professionnel, détecter automatique le fait qu’un grand
nombre d’utilisateurs s’intéressent à un même événement peut être utile pour
orienter les journalistes vers des événements imprévus, ou encore approcher des
utilisateurs pour récupérer du contenu.
Page 12
Dans de tels scénarios, l’information spatiale et temporelle associée au contenu
a un rôle majeur. Cependant, dans ce qui suit, nous montrons que l’utilisation du
contenus visuel est indispensable. En effet, des instances distinctes d’un événement
ne sont pas nécessairement localisées au même endroit et peuvent être enregistrées
à des moments différents. Certains événement, naturels par example, on des éten-
dues spatiales vastes, dans ces cas, l’utilisations des métadonnées n’est pas assez
discriminante. Ceci est encore valable pour les événement colocalisés, typiquement
dans des lieux très fréquentés comme les gares, les centres commerciaux ou les
lieux touristiques. Dans de tels environnements, les médias générés portent les
même signatures temporelles et spatiales, nonobstant le fait qu’ils soient associés
à des événements distincts. Plus généralement, plusieurs instances d’un événement
peuvent être enregistrées à des moments différents. Enfin, les informations spatiales
et temporelles ne sont pas toujours disponibles ou pourraient être biaisées.
3 Contributions
3.1 Événement et instances d’événement
Dans le premier chapitre de cette thèse, nous dressons un état de l’art sur la
définition de la notion d’événement dans la littérature. Bien que la plus part de ces
définitions s’accordent sur les principales facettes pour la caractérisation d’événe-
ments (intervenants, lieux, temps, ...), elles ignorent le contexte social associé aux
médias décrivant un événement.
Ainsi, et partant de l’hypothèse cadre de cette thrse que chaque média dé-
crivant un événements est généré par un utilisateur, un événement peut être vu
comme l’ensemble de ces vues personnelles et locales, capturées par les différents
utilisateurs.
Dans ce qui suit, on désigne par enregistrement l’ensemble des médias générés
Page 13
par un utilisateur au cours d’un événement.
3.2 Recherche d’événements par similarité visuelle
Afin d’identifier les différentes instances d’un même événement, nous propo-
sons une méthode de recherche par similarité visuelle dans des collections d’images.
Étant donné un enregistrement requête d’images d’un événement, notre mé-
thode vise à identifier d’autres enregistrements du même événement, typiquement
générés par d’autres utilisateurs. L’appariement d’instances d’événements requiert
néansmoins la définition d’une mesure de simimilarité capable de capturer la si-
milarité multi-facette entre les enregistrements.
Cependant, bien que différents enregistrement d’un même événement présentent
le plus souvent des caractéristiques similaires, ils peuvent néansmoins être diffé-
rents sur certains aspects. Les enregistrements d’un même événement, par exemple,
ne sont pas nécessairement localisés au même endroit (e.g. une éclipse, un tsu-
nami) et peuvent être capturés à des moments différents (e.g. lors d’un festival).
Par ailleurs, les informations tel que les coordonnées spatiales ou temporelles sont,
le plus souvent manquante ou biaisées. Ceci limite leur utilisation.
Afin de palier à de telles limites, nous proposons une stratégie en deux étapes
combinant à la fois continu visuel et le contexte associé aux médias jusqu’alors
non exploités. Une première étape vise à identifier un premier ensemble d’enre-
gistrements, visuellement similaires à l’enregistrement constituant requête. Une
deuxième étape vise à filtrer et à reclasser les enregistrements via un recordage
spatio-temporel avec l’enregistrement requète.
Identifier les différentes instances d’un événement peut s’avérrer utile pour di-
verses applications notamment pour l’identification de contenu d’un événement
dans une collection d’images ou encore la génération automatique de contenu et
Page 14
nécessitent le plus souvent la construction de graphes de similarités entre les dif-
férents enregistrements.
3.3 Construction scalable et distribuée du graphe de similarité
visuelle
L’appariement d’enregistrements d’événements requiert l’appariement par contenu
visuel entre images appartenants à différents enregistrements.
Une solution naïve, serait de chercher les k-images les plus similaires visuelle-
ment à chaque image de l’enregistrement requête. Une telle approche peut s’avérer
coûteuse si l’on considérait la construction du graphe de similarité sur l’ensemble
des enregistrements d’une collection d’images.
Le principal problème de la construction d’un tel graphe est le temps de calcul.
La complexité de l’approche naïve est certes linéaire en nombre d’images, mais la
recherche reste coûteuse, à moins de fortement dégrader la qualité au profit de la
vitesse en effectuant des recherches approximatives. Là encore, le coût de la re-
cherche reste tributaire du choix des fonctions de hachages. Par ailleurs, de telles
approches restent difficilement distribuables du fait qu’elle requièrent la duplica-
tion des données sur les unités de traitement et le plus souvent leur chargement
en mémoire et donc, passent difficilement à l’échelle.
D’autres approchent sont alors envisageables. Dans [16] , Chen et al. proposent
de subdiviser l’ensemble des données puis de construire les graphes associés pour
enfin les combiner en une solution finale au problème. Ici, le problème réside dans
le choix des différentes partitions.
Dans [31], Dong et al. proposent de partir d’une solution aléatoire et partant
du principe qu’un plus proche voisin d’un plus proche voisin est potentiellement
un plus proche voisin, converger vers une solution au problème en un nombre faible
Page 15
d’itérations. Cependant, un tel algorithme reste difficilement distribuable.
La solution que nous proposons découle d’une analyse ascendante du problème.
Une solution à la fois distribuable et scalable exige de petites unités de traitement.
Par ailleurs, calculer la similarité entre les objets peut s’avérer coûteux. Ceci
est d’autant plus vrai lorsqu’il s’agit de traiter de très grandes collections d’objets.
Ici nous considérons que le nombre de fois que deux objets sont mappés dans une
même bucket est une estimation pertinente de la similarité entre ces deux objets.
3.4 Sélection de contenu
Le nombre de documents associés à un événement dans les médias sociaux est
potentiellement grand. Filtrer un tel contenu peut s’avérer bénéfique pour des ap-
plications tel que la recherche, la navigation ou encore l’organisation de contenus.
Plus particulièrement, nous nous intéressons à la sélection de contenus perti-
nents pour la génération automatique de résumés d’événements.
Plusieurs travaux se sont intéressés à définir des mesures capables de capturer
l’importance d’un document de manière objective. Plustôt que de s’attarder à la
définition et à l’évaluation d’une telle mesure, nous considérons que le nombre
de photos capturées, se rapportant à une même scènes, par différents utilisateurs
comme une mesure objective de son importance.
Une approche naïve consiste à compter le nombre d’images prises sur un inter-
valle de temps donné et localisées avec des coordonnées spatiales bien déterminése.
Cependant, les métadonnées associées au contenu sont souvent absentes ou biai-
sées. On pourrait par ailleurs compter le nombre d’images visuellement similaires.
Cependant le contenu visuel est le plus souvent non discriminant. Pour pallier
à cette limite, nous effectuons un recordage spatio-temporel des enregistrements
Page 16
d’un même événement, puis comptons le nombre d’image visuellement similaires
entre les différents enregistrements (i.e. qui contribuent à l’appariement de deux
enregistrements).
Génération automatique de résumé
Nous ramenons le problème de génération automatique de résumé à celui de
produire un classement sur les documents d’un événement. L’ensemble des images
sélectionnées est ensuite traité afin d’en éliminer les doublons.
Alternativement, l’ensemble des images est filtré pour produire des résumés
personnalisés en fonction de la qualité des images ou encore les droits associés.
Suggestion de contenu
Un contenu est dit intéressant, d’un point de vue utilisateur, s’il renseigne sur
des aspects de l’événement, autres que ceux capturés par l’utilisateur. Suggérer
du contenu, reviendrait, dès lors, à proposer du contenu pertinent, visuellement
différent du contenu capturé par l’utilisateur.
Organisation de la thèse
Cette thèse s’organise comme suit :
Dans le Chapitre 2, nous examinons différentes définitions de la notion d’évé-
nement dans la littérature, puis proposerons une définition alternative qui tient
compte à la fois du contenu visuel et du contexte.
Le Chapitre 3 présente notre méthode de recherche d’événements basée sur le
contenu visuel dans les collections d’images.
Le Chapitre 4 présente notre approche pour la construction scalable et distribuée
Page 17
des Graphe des K plus proches voisins et son implémentation dans le framework
Hadoop.
Dans le Chapitre 5, nous présentons notre méthode collaborative pour la sélection
de contenu pertinent dans de grandes collections d’images. Plus particuliérement,
nous nous intŕesserons aux problèmes de génŕation automatique de résumés d’évé-
nements et suggestion de contenus dans les médias sociaux.
Le Chapitre 6 dresse un état-de-l’art des problématiques abordées dans cette
thèse.
Le bilan des contributions, la conclusion et les perspectives sont présentés dans le
Chapitre 7.
Page 18
Table des matières
Résumé vii
1 Motivations . . . . . . . . . . . . . . . . . . . . . . . . . . . . . . . vii
2 Problématiques . . . . . . . . . . . . . . . . . . . . . . . . . . . . . viii
3 Contributions . . . . . . . . . . . . . . . . . . . . . . . . . . . . . . ix
3.1 Événement et instances d’événement . . . . . . . . . . . . . ix
3.2 Recherche d’événements par similarité visuelle . . . . . . . . x
3.3 Construction scalable et distribuée du graphe de similarité
visuelle . . . . . . . . . . . . . . . . . . . . . . . . . . . . . xi
3.4 Sélection de contenu . . . . . . . . . . . . . . . . . . . . . . xii
1 General Introduction 7
2 Events in Social Media 13
1 Events in the literature . . . . . . . . . . . . . . . . . . . . . . . . . 13
1.1 Topic Detection and Tracking . . . . . . . . . . . . . . . . . 14
1.2 Event Extraction . . . . . . . . . . . . . . . . . . . . . . . . 14
1.3 Multimedia Event Detection . . . . . . . . . . . . . . . . . . 16
1.4 Social Event Detection . . . . . . . . . . . . . . . . . . . . . 16
2 Events in social media . . . . . . . . . . . . . . . . . . . . . . . . . 17
3 Related tasks . . . . . . . . . . . . . . . . . . . . . . . . . . . . . . 19
3.1 Event matching . . . . . . . . . . . . . . . . . . . . . . . . . 19
3.2 Content Selection . . . . . . . . . . . . . . . . . . . . . . . . 20
1
Page 19
4 Conclusion . . . . . . . . . . . . . . . . . . . . . . . . . . . . . . . . 21
3 Event Identification in Social Media 23
1 Towards event centric content organization in social media . . . . . 24
2 Visual based Event Matching . . . . . . . . . . . . . . . . . . . . . 26
3 Enabling scalability . . . . . . . . . . . . . . . . . . . . . . . . . . . 29
3.1 Multi-Probe LSH . . . . . . . . . . . . . . . . . . . . . . . . 29
3.2 The MapReduce framework . . . . . . . . . . . . . . . . . . 30
3.3 Multi-Probe LSH in the MapReduce framework . . . . . . . 31
4 Experiments . . . . . . . . . . . . . . . . . . . . . . . . . . . . . . . 32
4.1 Experimental settings . . . . . . . . . . . . . . . . . . . . . 34
4.2 Results . . . . . . . . . . . . . . . . . . . . . . . . . . . . . 35
4.3 Dicussion . . . . . . . . . . . . . . . . . . . . . . . . . . . . 39
5 Conclusion . . . . . . . . . . . . . . . . . . . . . . . . . . . . . . . . 40
4 Distributed k-NN Graphs construction 41
1 Problem Statement . . . . . . . . . . . . . . . . . . . . . . . . . . . 42
2 Hashing-based K-NNG construction . . . . . . . . . . . . . . . . . 43
2.1 Notations . . . . . . . . . . . . . . . . . . . . . . . . . . . . 43
2.2 LSH based K-NNG approximation . . . . . . . . . . . . . . 44
2.3 Balancing issues of LSH-based K-NNG . . . . . . . . . . . . 45
3 Proposed method . . . . . . . . . . . . . . . . . . . . . . . . . . . . 46
3.1 Random Maximum Margin Hashing . . . . . . . . . . . . . 46
3.2 RMMH-based K-NNG approximation . . . . . . . . . . . . 48
3.3 Split local joins . . . . . . . . . . . . . . . . . . . . . . . . . 49
3.4 MapReduce Implementation . . . . . . . . . . . . . . . . . . 50
4 Experimental setup . . . . . . . . . . . . . . . . . . . . . . . . . . . 52
4.1 Datasets & Baselines . . . . . . . . . . . . . . . . . . . . . . 52
4.2 Performance measures . . . . . . . . . . . . . . . . . . . . . 53
4.3 System environment . . . . . . . . . . . . . . . . . . . . . . 54
5 Experimental results . . . . . . . . . . . . . . . . . . . . . . . . . . 55
Page 20
5.1 Hash functions evaluation . . . . . . . . . . . . . . . . . . . 55
5.2 Experiments in centralized settings . . . . . . . . . . . . . . 57
5.3 Performance evaluation in distributed settings . . . . . . . . 62
6 Conclusion . . . . . . . . . . . . . . . . . . . . . . . . . . . . . . . . 65
5 Content Suggestion and Summarization 67
1 Content suggestion and summarization in UGC . . . . . . . . . . . 68
1.1 Content Selection . . . . . . . . . . . . . . . . . . . . . . . . 68
1.2 Event Summarization . . . . . . . . . . . . . . . . . . . . . 71
1.3 Content Suggestion . . . . . . . . . . . . . . . . . . . . . . . 71
2 Building the Records Graph . . . . . . . . . . . . . . . . . . . . . . 72
3 Experiments . . . . . . . . . . . . . . . . . . . . . . . . . . . . . . . 73
3.1 Experimental setup . . . . . . . . . . . . . . . . . . . . . . . 74
3.2 Results . . . . . . . . . . . . . . . . . . . . . . . . . . . . . 75
4 Conclusion . . . . . . . . . . . . . . . . . . . . . . . . . . . . . . . . 82
6 Related Work 85
1 Event Identification in Social Media . . . . . . . . . . . . . . . . . 85
2 Event summarization . . . . . . . . . . . . . . . . . . . . . . . . . . 87
3 Large-scale k-NN Graph construction . . . . . . . . . . . . . . . . . 90
4 Nearest Neighbors search . . . . . . . . . . . . . . . . . . . . . . . 91
4.1 Curse of dimensionality . . . . . . . . . . . . . . . . . . . . 91
4.2 Approximate similarity search . . . . . . . . . . . . . . . . . 92
Bibliography 110
Index 111
Page 22
Table des figures
3.1 Two events records of an Alanis Morissette concert . . . . . . . . . 25
3.2 Two records of the event "a trip in Egypt" . . . . . . . . . . . . . . 26
3.3 Processing time per image according to query size . . . . . . . . . . 33
3.4 Influence of temporal error to tolerance θ . . . . . . . . . . . . . . 35
3.5 Influence of temporal offset thresholding (δmax) on MAP . . . . . . 36
3.6 Influence of temporal offset thresholding (δmax) classification rates 37
3.7 Precision and recall for increasing values of k . . . . . . . . . . . . 37
3.8 K-NN search time per image (k = 4000) . . . . . . . . . . . . . . . 39
4.1 Gini coefficient - RMMH-Based Hashing . . . . . . . . . . . . . . . 56
4.2 # of non empty buckets - RMMH-Based Hashing . . . . . . . . . . 56
4.3 Average maximum bucket size - RMMH-Based Hashing . . . . . . . 57
4.4 Total number of collisions . . . . . . . . . . . . . . . . . . . . . . . 58
4.5 Recall vs #number of hash tables used . . . . . . . . . . . . . . . . 59
4.6 Scan rate variation vs #number of hash tables used . . . . . . . . . 59
4.7 Running Time - RMMH . . . . . . . . . . . . . . . . . . . . . . . . 60
4.8 ROC curve corresponding to the recall-precision curve on 128 tables 64
4.9 ROC curve on Flickr dataset (M = 50) . . . . . . . . . . . . . . . . 64
4.10 Recall vs Scan-rate on Flickr dataset (M = 50) . . . . . . . . . . . 65
5.1 A k-NN record graph of 10 event records. . . . . . . . . . . . . . . 69
5.2 A photo collage of my 2012 ICMR photo album of co-located events. 70
5.3 Snapshot of the user-centric evaluation GUI . . . . . . . . . . . . . 75
5
Page 23
5.4 Score distribution of the suggested images . . . . . . . . . . . . . . 75
5.5 Pukkelpop Festival 2007 summary. The first image was rated at 3.33
on average whereas the remaining images rated at 4.33, 4.33, 4 and
4.33 on average, respectively. . . . . . . . . . . . . . . . . . . . . . 76
5.6 Haldern Pop Festival - August 13-19, 2009 Summary. All of the
images were rated at 4.5 on average. . . . . . . . . . . . . . . . . . 77
5.7 Event summary vs image-based score distribution. . . . . . . . . . 77
5.8 Radiohead @ Victoria Park - June 24, 2008 Summary. The event
summary was rated at 3 while the image based score was at 2. . . . 78
5.9 Average score per event cluster size . . . . . . . . . . . . . . . . . . 79
5.10 An event Summary without duplicate pictures removal filter . . . . 79
5.11 An event summary showing the impact of the duplicate pictures
removal filter . . . . . . . . . . . . . . . . . . . . . . . . . . . . . . 79
5.12 Mean Average Precision vs k . . . . . . . . . . . . . . . . . . . . . 80
5.13 Recall and Precision vs k . . . . . . . . . . . . . . . . . . . . . . . 80
5.14 Influence of the hash functions selectivity on the recall and precision 81
5.15 Recall and Precision vs Hash Size (M = 10) . . . . . . . . . . . . . 81
5.16 ROC curve for various collisions thresholds . . . . . . . . . . . . . 82
Page 24
Liste des tableaux
3.1 Test dataset Vs Original dataset . . . . . . . . . . . . . . . . . . . 33
3.2 Suggestion rates . . . . . . . . . . . . . . . . . . . . . . . . . . . . . 38
4.1 Balancing statistics of LSH vs. perfectly balanced hash function . . 46
4.2 Dataset summary . . . . . . . . . . . . . . . . . . . . . . . . . . . . 53
4.3 Bucket Balancing Statistics - LSH-Based Hashing . . . . . . . . . . 56
4.4 Total Running Time - LSH vs RMMH (M = 10) . . . . . . . . . . 60
4.5 Impact of the filtering parameter (M = 10, L = 128) . . . . . . . . 61
4.6 Comparison with State-of-the-art . . . . . . . . . . . . . . . . . . . 62
4.7 Recall for varying values of K . . . . . . . . . . . . . . . . . . . . . 62
4.8 Number of map tasks . . . . . . . . . . . . . . . . . . . . . . . . . . 63
4.9 Map running time (in seconds) . . . . . . . . . . . . . . . . . . . . 63
4.10 Recall for varying values of K . . . . . . . . . . . . . . . . . . . . . 64
5.1 User-centric evaluation of the image relevance scores . . . . . . . . 78
5.2 Suggestion rates . . . . . . . . . . . . . . . . . . . . . . . . . . . . . 82
7
Page 26
Chapitre 1
General Introduction
Problem Statement
Social Media sites such as Flickr and Facebook, have changed the way we share
and manage information within our social networks. The shift on the Web, from
what was typically a one-way communication, to a conversation style interaction
has led to many exciting new possibilities.
The ease of publishing content on social media sites brings to the Web an ever
increasing amount of user generated content captured during, and associated with,
real life events. Social media documents shared by users often reflect their perso-
nal experience of the event. Hence, an event can be seen as a set of personal and
local views, recorded by different users. These event records are likely to exhibit
similar facets of the event but also specific aspects. By linking different records of
the same event occurrence we can enable rich search and browsing of social media
events content. Specifically, linking all the occurrences of the same event would
provide a general overview of the event. In this dissertation we present a content-
based approach for leveraging the wealth of social media documents available on
the Web for event identification and characterization.
9
Page 27
To better illustrate the motivation behind event content identification in social
media, consider a person who is planning to attend the “Rock en Seine” annual mu-
sic Festival in Château de Saint-Cloud’s Park. Before buying a ticket, the person
could do some research upon which he will make an informed decision. The event’s
website contains basic information about the festival and the tickets available. Al-
though the event website contains stage pictures and videos of prior instances of
the event, they do not reflect the general atmosphere of the event. User-generated
content may, however, provide a better overview of prior occurrences of the event
from an attendee’s perspective. Such wide coverage makes social media sites an
invaluable source of event information.
After attending the event, the user may be interested in retrieving additio-
nal media associated to the event. By simply uploading his/her own set of event
pictures a user might for example access to the community of the other event’s
participants. The user can then revive the event by browsing or collecting new
data complementary to his/her own view of the event. If some previous event’s
pictures were already uploaded and annotated, the system might also automati-
cally annotate the set or suggest some relevant tags to the user.
In a more professional context, automatically detecting the fact that a large
number of amateur users did record data about the same event would be very help-
ful for professional journalists in order to cover breaking news. Finally, tracking
events across different media also has a big potential for historians, sociologists,
politicians, etc.
Of course, in such scenarios, time and geographic information provided with
the contents has a major role to play. Our claim is that using visual content
as complementary information might solve several limitations of approaches that
rely only on metadata. First of all, distinct instances of the same event are not
necessarily located in the same place or can be recorded at different times. Some
Page 28
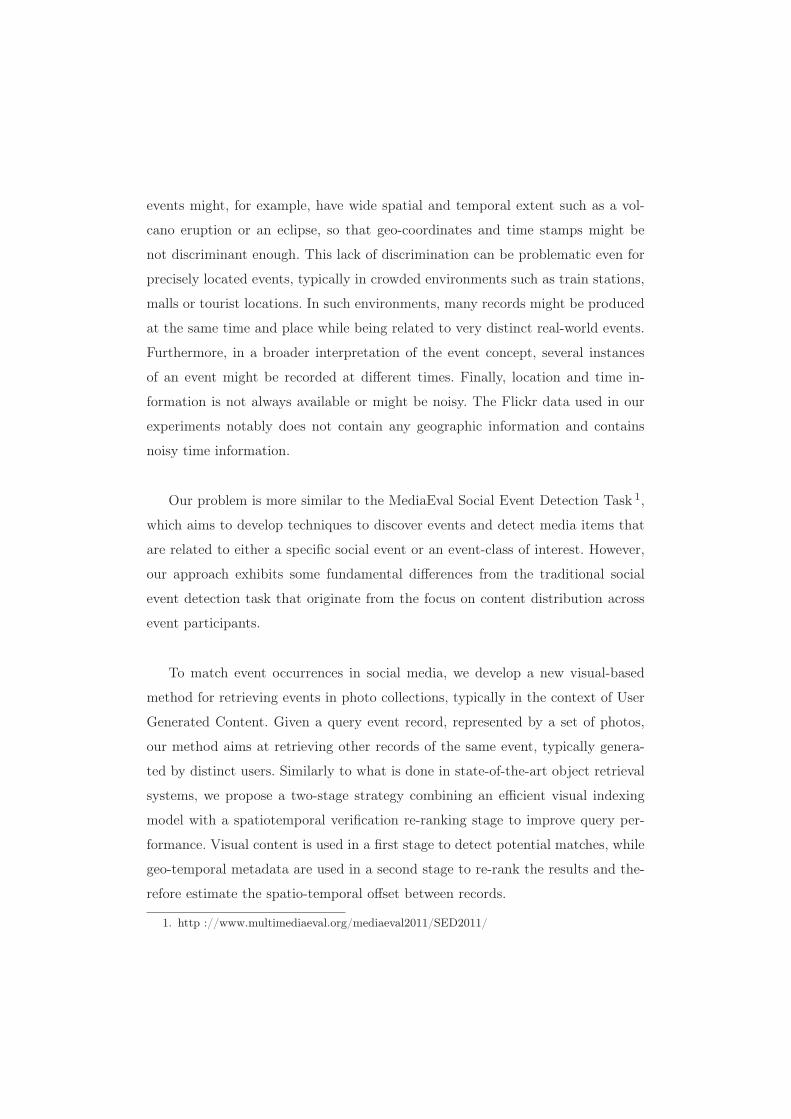
events might, for example, have wide spatial and temporal extent such as a vol-
cano eruption or an eclipse, so that geo-coordinates and time stamps might be
not discriminant enough. This lack of discrimination can be problematic even for
precisely located events, typically in crowded environments such as train stations,
malls or tourist locations. In such environments, many records might be produced
at the same time and place while being related to very distinct real-world events.
Furthermore, in a broader interpretation of the event concept, several instances
of an event might be recorded at different times. Finally, location and time in-
formation is not always available or might be noisy. The Flickr data used in our
experiments notably does not contain any geographic information and contains
noisy time information.
Our problem is more similar to the MediaEval Social Event Detection Task 1,
which aims to develop techniques to discover events and detect media items that
are related to either a specific social event or an event-class of interest. However,
our approach exhibits some fundamental differences from the traditional social
event detection task that originate from the focus on content distribution across
event participants.
To match event occurrences in social media, we develop a new visual-based
method for retrieving events in photo collections, typically in the context of User
Generated Content. Given a query event record, represented by a set of photos,
our method aims at retrieving other records of the same event, typically genera-
ted by distinct users. Similarly to what is done in state-of-the-art object retrieval
systems, we propose a two-stage strategy combining an efficient visual indexing
model with a spatiotemporal verification re-ranking stage to improve query per-
formance. Visual content is used in a first stage to detect potential matches, while
geo-temporal metadata are used in a second stage to re-rank the results and the-
refore estimate the spatio-temporal offset between records.
1. http ://www.multimediaeval.org/mediaeval2011/SED2011/
Page 29
The number of social media documents for each event is potentially very large.
While some of their content might be interesting and useful, a considerable amount
might be of little value to people interested in learning about the event itself. To
avoid overwhelming users with unmanageable volumes of event information, we
present a new collaborative content-based filtering technique for selecting relevant
documents for a given event. Specifically, we leverage the social context provided
by the social media to objectively detect moments of interest in social events.
Should a sufficient number of users take a large number of shots at a particular
moment, then we might consider this to be an objective evaluation of interest at
that moment.
As the amount of user generated content increases, research will have to develop
robust ways to process, organize and filter that content. In this dissertation we
present scalable techniques for organizing social media documents associated with
events, notably in distributed environments
Contributions
The research described in this thesis led to the following results :
1. A new visual-based method for retrieving events in photo collections.
2. A scalable and distributed framework for Nearest Neighbors Graph construc-
tion for high dimensional data.
3. A collaborative content-based filtering technique for selecting relevant so-
cial media documents for a given event.
Outline
This chapter informally introduces the questions investigated in this thesis.
The remaining part of this thesis is structured as follows :
Page 30
Chapter 2 discusses several alternative definitions of events in the literature and
provides the event definitions that we use in this dissertation.
Chapter 3 presents our new visual-based method for retrieving events in photo
collections.
Chapter 4 describes our large scale K-Nearest Neighbors Graph construction
technique that we considered for event graph construction.
Chapter 5 presents our collaborative content-based content selection technique.
Specifically, we address the problem of event summarization and content sugges-
tion in social media.
Chapter 6 reviews the literature that is relevant to this dissertation.
Chapter 7 presents our conclusions and discusses directions for future work.
Publications
The work presented in this manuscript has led to the following publications :
Conferences
— M. R. Trad, A. Joly, and N. Boujemaa. Large scale visual-based event
matching. In Proceedings of the 1st ACM International Conference on
Multimedia Retrieval, ICMR ’11, pages 53 :1–53 :7, New York, NY, USA,
2011. ACM.
— M. R. Trad, A. Joly, and N. Boujemaa. Distributed knn-graph approxima-
tion via hashing. In Proceedings of the 2nd ACM International Conference
on Multimedia Retrieval, ICMR ’12, pages 43 :1–43 :8, New York, NY, USA,
Page 31
2012. ACM.
— R. Trad, Mohamed, A. Joly, and N. Boujemaa. Distributed approximate
KNN Graph construction for high dimensional Data. In BDA - 28e journées
Bases de Données Avancées - 2012, Clermont-Ferrand, France, Oct. 2012.
— R. Trad, Mohamed, A. Joly, and B. Nozha. Large scale knn-graph approxi-
mation. In The 3rd International Workshop on Knowledge Discovery Using
Cloud and Distributed Computing Platforms (KDCloud, 2012) jointly held
with IEEE ICDM 2012, Brussels, Belgium, December 2012.
Page 32
Chapitre 2
Events in Social Media
Introduction
Broadly understood, events are things that happen, things such births and
deaths, celebrations and funerals, elections and impeachments, smiles, shows and
explosions. Yet although the definition and characterization of an “event” has re-
ceived substantial attention across various academic fields [105, 13], it is not clear
what precisely constitutes an event.
Often, an event is described as an abstract concept [13], or defined within the
context of a very specific domain. In this chapter, we survey a number of definitions
from various domains, particularly that of social media (Section 1) and draw on
them to define an event with respect to our work (Section 2).
1 Events in the literature
While previous research on events has focused solely on textual news docu-
ments [61, 63], more recent efforts have been concerned with a richer content
[66, 82, 90]. In this section, we look at various efforts to define events in the
context of social media through four different tasks : Topic Detection and Tra-
cking in news documents (Section 1.1), event extraction from unstructured text
15
Page 33
(Section 1.2), multimedia event detection (Section 1.3) and social event detection
(Section 1.4).
1.1 Topic Detection and Tracking
The Topic Detection and Tracking (TDT) initiative was first intended to ex-
plore techniques for identifying events and tracking their reappearance and evolu-
tion in a text document stream. Within the TDT context, an event was initially
defined as “some unique thing that happens at some point in time” [3]. This defi-
nition was further extended to include location as well [104], defining an event as
“something that happens at some specific time and place”.
Under this definition, the World Trade Center attacks that took place on Sep-
tember 11, 2001 is an event. However, the media also reported the subsequent
collapse of the World Trade Center towers. Here, it is unclear whether the events
should be considered as separate events or whether they form part of one single
event.
To address such an ambiguity, an amended definition was proposed in [2] sta-
ting that an event is “a specific thing that happens at a specific time and place
along with all necessary preconditions and unavoidable consequences”. Although
this definition makes some clarifications regarding event boundaries, it does not
cover all possible types of event, since some of the necessary preconditions and
unavoidable consequences may be ambiguous, unknown or subject to debate.
Although the TDT-inspired definitions of an event introduce some useful concepts,
they do not cover all possible types of events.
1.2 Event Extraction
Event extraction from unstructured data such as news messages is a task that
aims at identifying instances of specific types of events, and their associated attri-
butes [42].
Page 34
The Automatic Content Extraction 1 (ACE ), for instance, defines an event
“as a specific occurrence involving participants”. However, rather than defining
all possible events abstractly, events are defined according to their expression in
unstructured text and provides a set of corresponding predefined templates along
with their specific pre-defined attributes (time, place, participants, etc.). An event
is identified via a keyword trigger (i.e. the main word which most clearly expresses
an event’s occurrence) and detects the corresponding set of attributes. A tem-
plate of the “attack” event subtype applied to the sentence “A car bomb exploded
Thursday in a crowded outdoor market in the heart of Jerusalem, killing at least
two people, police said.” is presented in Table 2.1.
Attribute Description Example
Attacker The attacking/instigating agent demonstratorsTarget The target of the attack Israeli soldiers
Instrument The instrument used in the attack stones and empty bottlesTime When the attack takes place yesterdayPlace Where the attack takes place a Jewish holy site at the town’s entrance
Table 2.1 – Attack event template and sample extracted attributes 2.
The ACE event definition makes the implicit assumption that events should
have one or more participants. Yet, not all events have a clearly defined set of
participants, thus limiting its practical use. The same remark applies for the time
and place attributes. Although they were not mentioned in this definition, they
are also present in almost al of the predefined templates.
As opposed to the TDT inspired definitions, the ACE-inspired definition is
specific and restricted to a small class of events. Besides, this definition is only
applicable to supervised event detection tasks, where the classes of events are
known a priori. One drawback is that events such as Festivals and Concerts cannot
be represented since there are no corresponding templates.
1. http ://projects.ldc.upenn.edu/ace/docs/English-Events-Guidelines_v5.4.3.pdf2. http ://projects.ldc.upenn.edu/ace/docs/English-Events-Guidelines_v5.4.3.pdf
Page 35
1.3 Multimedia Event Detection
Multimedia Event Detection (MED) as part of the TREC Video Retrieval Eva-
luation 3 aims to develop event detection techniques to enable a quick and accurate
search for user-defined events in multimedia collections. An event, according to the
MED 4 2010, is “an activity-centered happening that involves people engaged in
process-driven actions with other people and/or objects at a specific place and
time”.
Contrarily to the above described event detection tasks, the use of media asso-
cisated human-annotated textual context features (e.g., title, tags) is not allowed.
Each event has a corresponding Òevent kitÓ consisting of a name, a definition, an
evidential description (Table 2.2) and a set of illustrative video examples.
Event Name Assembling a shelter
Definition One or more people construct a temporary or semi-permanentshelter for humans that could provide protection from theelements
Evidential Description primarily outdoor settings during the day ornight
SceneObjects/People cutting and digging tools, tent poles and flys, tents, stakes,
tree limbs, tree branchesActivities clearing land, cutting trees and branches, gathering flooring
material, assembling a tent, lashing limbs together, stakingdown poles
Exemplars
Table 2.2 – Example of an “event kit” for the MED task 5.
1.4 Social Event Detection
Similar to the MED event detection task, the Social Event Detection (SED)
task aims to discover events and their related media items. Extracting such events
from multimedia content has been the focus of numerous efforts as part of the
3. http ://trecvid.nist.gov/4. http ://www.nist.gov/itl/iad/mig/med10.cfm5. http ://projects.ldc.upenn.edu/havic/MED10/EventKits.html
Page 36
MediaEval 2011 Social Event Detection (SED) [75] task. The SED guidelines 6
define the social aspect of an event but do not provide a precise definition of the
event. According to SED, social events are “events planned by people and attended
by people”. It also requires the social media be “captured by people”.
Although the MediaEval 2011 Social Event Detection task did not provide a
precise event definition, the proposed methods only exploited some known event
features, namely, event title, venue and time. These attributes were also used in
[102, 91] to define an event according to its context, a set of facets (image, who,
when, where, what) that support the understanding of everyday events.
2 Events in social media
Going back to the September 11 example, according to some definitions, it
might be considered to be an event, but it is not an event in social media until it
has a corresponding realization in social media documents. Instead of providing
an abstract, ambiguous, or arguable definition of an event, we extend previous
definitions to include at least one single document. In our work, we focus solely
on user generated pictures of events. Formally, we define an event as :
Definition 1 An event in social media is a real world occurrence e with (1) an
associated time period Te, (2) a set of documents De about the occurrence, and (3)
one or more features that describe the occurrence.
The time period Te in our definition delimits the event occurrence in time.
Several records of the same event might however be time coded differently (i.e. time
shifts, wide and temporal extent of the event), and so time offsets should therefore
be tolerated. Moreover, documents related to an event could be produced before
or after its occurrence. For instance, in our “Rock in Rio Festival 2012” example, a
photograph of a participant at the Lisbon Portela Airport represents the author’s
experience in the context of the event and will, therefore, be associated with the
6. http ://www.multimediaeval.org/mediaeval2011/SED2011/
Page 37
event for our purposes. Here, it is worth noticing that upload time often differs
from the event time period and may not preserve the temporal coherence of the
documents.
The document set in our definition (Definition 1) refers to a set of social media
documents, which can be represented using a variety of associated context features
(e.g., title, tags, signatures, timestamp). Within the context of social media, each
document is typically associated to at least one user, the one who first uploaded the
picture. A single image, however, may tell different stories, with different people
through different events. Hence, we associate each image with the user who shared
the document, regardless of its provenance.
The features set in our definition may include information such as the event
title, location or the set of participants. As discussed above, such a definition is
prone to ambiguity as it does not include all possible types of events. However, we
believe that such attributes can be relaxed when considering visual information
about the event. Thus, according to our event definition, events in social media
include widely known occurrences such as earthquakes, and also local and private
events such as festivals and weddings.
Most often, images shared by users reflect their personal experience of the
event. In this connection, an event occurrence can be seen as a set of personal and
local views, recorded by different users. These event records are likely to exhibit
similar facets of the event but also specific aspects. Linking different records of
the same occurrence would provide a general overview of the event.
Definition 2 An event record is a set of images (1) shared by a user, (2) reflecting
his/her own experience of a given event.
Non-event content, of course, is prominent on social media sites. In our work,
we make the assumption that event-related documents are shared in separate
albums (i.e. records). However, our approach can generally be extended to handle
less structured content. In [82] for instance, the authors present an approach for
grouping photos that belong to the same event within Facebook albums using
Page 38
clustering algorithms on their upload time.
3 Related tasks
Considering the fact that event related documents are often distributed among
different users (i.e. event records), we extend existing tasks to support local expe-
riences of the event.
3.1 Event matching
Given a query event record, represented by a set of photos, the event matching
task aims to retrieve other records of the same event, typically generated by dis-
tinct users. Linking different occurrences of the same event would enable a number
of applications such as search, browsing and event identification.
Matching event records, requires defining a similarity function that measures
the multi-facet similarity between event records. Although records of the same
event often exhibit similar facets, they may differ in several aspects. Records of
the same event, for instance, are not necessarily located at the same place (eclipse,
tsunami) and can be recorded at different times (festival). This lack of discrimi-
nation can be problematic even for precisely located events, typically in crowded
environments such as train stations, shopping malls or touristic areas. In such envi-
ronments, many records might be produced at the same time and place while being
related to very distinct real-world events. Designing such a similarity function is,
thus, a tricky task.
In Chapter 3, we show how using visual content as complementary information
might solve several limitations of approaches that rely only on metadata. To the
best of our knowledge, none of the existing studies have addressed the problem of
linking different occurrences of the same real-word event. This is in contrast to the
literature which considers an event as a set of documents, regardless of their social
context. The state-of-the-art presented in Section 1 is related to the more general
problem of identifying documents of the same event, i.e. the different occurrences
Page 39
of the event.
According to our definition, event-related records can be seen as a connected
subgraph of the records Nearest Neighbors Graph, ideally a complete graph of the
event records. In Chapter 4, we present a distributed framework for approximate
K-NNG construction to address the more general problem of identifying documents
of the same event in very large scale contexts.
3.2 Content Selection
Events in social media are likely to have huge amounts of associated content.
For instance, as of October 2012, the 2012 Rock in Rio Festival has over 6,000
associated Flickr photos. This is not limited to world renowned events, but is also
true for smaller events that could feature up to dozens to hundreds of different
documents. Being able to rank and filter event content is crucial for a variety of
applications such as content suggestion and event summarization.
In this connection, the content selection task aims at selecting relevant docu-
ments for people who are seeking information about a given event. Nevertheless,
selecting the most interesting images often involves some decision-making, based
on various criteria.
Most state-of-the-art approaches reduce the problem of selecting images from
photo collections to an optimization problem under quality constraints. Choosing
the right combination of these criteria is a challenging problem in itself.
Most significantly, with a few exceptions, existing work often ignores the social
context of the images. Obviously, should a sufficient number of users take a large
number of shots at a particular moment, then we might consider this to be an
objective evaluation of interest at that moment.
In Chapter 5, we present a visual-context based approach for detecting mo-
ments of interest and subsequently, interesting shots (Section 1.1). We then address
the problem of content suggestion and event summarization separately.
Page 40
Content Suggestion
The content suggestion task is related to the content selection task, but instead
of selecting a set of potentially interesting documents, it aims to present a given
user only documents that provide additional information about the event.
Recently, there has been a body of work on content suggestion (Section 2) but
none has considered the use of the social context provided by the media sites. Here,
we link the content suggestion problem to the previously introduced event mat-
ching task to present a novel approach for suggesting and sharing complementary
information between people who attended or took part in the same event (Section
1.3).
Event Summarization
The event summarization task aims to construct a minimal yet global summary
of the event.
The problem of summarizing event-related documents has been extensively
addressed across different domains (Section 2), from free text documents (system
logs) to more richer data representations (images, sound and videos). Many com-
plex systems, for instance, employ sophisticated record-keeping mechanisms that
log all kinds of events that occurred in the systems.
Still, event related documents in social media are often produced and even
uploaded by distinct users resulting in data redundancy (London 2012 Olympic
Opening Ceremony shots shared by different people) and duplication (the same
picture shared by distinct users). In Section 1.2, we show how to leverage document
redundancy between distinct users to produce high quality event summaries.
4 Conclusion
Although information such as location and time eliminate ambiguity in event
definitions, they are also restrictive as they do not apply to all possible types of
Page 41
events. Our claim is that using visual content as complementary information might
relax some conditions on such attributes. This is particularly true in social media,
where textual data are very rare, and metadata noisy but where visual content is
abundant.
Page 42
Chapitre 3
Event Identification in Social
Media
Events are a natural way for referring to any observable occurrence grouping
people in a specific time and place. Events are also observable experiences that
are often documented by people through different media. This notion is poten-
tially useful for connecting individual facts and discovering complex relationships.
Defining new methods for organizing, searching and browsing media according to
real-life events is therefore of prime importance for ultimately improving the user
experience.
In this chapter we introduce a new visual-based method for retrieving events
in photo collections, typically in the context of User Generated Contents. Given
a query event record, represented by a set of photos, our method aims to retrieve
other records of the same event, typically generated by distinct users. In Section 1,
we first discuss the interest and implications of such a retrieval paradigm. Section 2
introduces our new visual-based event matching technique and its implementation
in the MapReduce framework (Section 3). Section 4 reports results on a large
dataset for distinct scenarios, including event retrieval, automatic annotation and
tags suggestion. The bulk of this chapter appeared in [94].
25
Page 43
1 Towards event centric content organization in social
media
Multimedia documents in User Generated Content (UGC) websites, as well
as in personal collections, are often organized into events. Users are usually more
likely to upload or gather pictures related to the same event, such as a given
holiday trip, a music concert, a wedding, etc. This also applies to professional
contents such as journalism or historical data that are even more systematically
organized according to hierarchies of events.
Given a query event record represented by a set of photos, our method aims to
retrieve other records of the same event, notably those generated by other actors
or witnesses of the same real-world event. An illustration of two matching event
records is presented in Figure 3.1. It shows how a small subset of visually similar
and temporally coherent pictures might be used to match the two records, even
if they include other distinct pictures covering different aspects of the event. Ap-
plication scenarios related to such a retrieval paradigm are numerous. By simply
uploading their own record of an event users might, for example, gain access to
the community of other participants. They can then revive the event by browsing
or collecting new data complementary to their own view of the event. If some
previous event’s records had already been uploaded and annotated, the system
might also automatically annotate a new record or suggest some relevant tags.
The proposed method might also have nice applications in the context of citizen
journalism. Automatically detecting the fact that a large number of amateur users
did indeed record data about the same event would be very helpful for professional
journalists in order to cover breaking news. Finally, tracking events across different
media has a big potential for historians, sociologists, politicians, etc.
Of course, in such scenarios, time and geographic information provided with
the contents has a major role to play. Our claim is that using visual content as
complementary information might overcome several limitations of approaches that
Page 44
Figure 3.1 – Two events records of an Alanis Morissette concert
rely only on metadata. First of all, distinct records of the same event are not ne-
cessarily located at the same place or can be recorded at different times. Some
events might, for example, have wide spatial and temporal coverage such as a vol-
cano eruption or an eclipse, so that geo-coordinates and time stamps might not be
sufficiently discriminant. This lack of discrimination can be problematic even for
precisely located events, typically in crowded environments such as train stations,
malls or tourist locations. In such environments, many records might be produced
at the same time and place while being related to very distinct real-world events.
Furthermore, in a wider meaning of the event concept, several instances of an
event might be recorded at different times, e.g. periodical events or events such as
“a trip to Egypt” illustrated in Figure 3.2. Finally, location and time information is
not always available or might be noisy. The Flickr dataset used in the experiments
reported in this chapter notably does not contain any geographic information and
contains noisy time information (as discussed in Section 4).
Finally, our work is, to some extent, related to object retrieval in picture col-
lections. Our method is indeed very similar to state-of-the-art large-scale object
retrieval methods combining efficient bag-of-words or indexing models with a spa-
tial verification re-ranking stage to improve query performance [79, 53]. We might
give the following analogy : images are replaced by event records (picture sets), lo-
cal visual features are replaced by global visual features describing each picture of
a record, spatial positions of the local features are replaced by the geo-coordinates
Page 45
Figure 3.2 – Two records of the event "a trip in Egypt"
and time stamps of the pictures. Matching spatially and temporally coherent event
records is finally equivalent to retrieving geometrically consistent visual objects.
2 Visual based Event Matching
We first describe the proposed method in the general context of event records
composed of a set of geo-tagged and time coded pictures. We further restrict our-
selves to time coded only pictures since our experimental dataset did not include
geo-tags.
We consider a set of N event records Ei, each record being composed of Ni
pictures Iij captured from the same real-world event. Each picture is associated
with a geo-coordinate xij and a time stamp tij resulting in a final geo-temporal
coordinate vector Pij = (xi
j , tij). The visual content of each image Iij is described
by a visual feature vector Fij ∈ R
d associated with a metric d : Rd× R
d→ R.
Now let Eq be a query event record represented by Nq pictures, with associated
Page 46
visual features Fqj and geo-temporal metadata Pq
j . Our retrieval method works as
follows :
STEP 1 - Visual Matching : Each query image feature Fqj is matched to the
full features dataset thanks to an efficient similarity search technique (see Section
3). It typically returns the approximate K-nearest neighbors according to the used
metric d (i.e the K most similar pictures). When multiple matches occur for a gi-
ven query image feature and a given retrieved record, we only keep the best match
according to the feature distance. The visual matching step finally returns a set
of candidate event records Ei, each being associated with M qi picture matches of
the form (Iqm, Iim).
STEP 2 - Stop List : Only the retrieved records with at least two image matches
are kept for the next step, i.e
{Ei | Mqi ≥ 2}1≤i≤N
STEP 3 - Geo-temporal consistency : For each remaining record, we com-
pute a geo-temporal consistency score by estimating a translation model between
the query record and the retrieved ones. The resulting scores Sq(Ei) are used to
produce the final records ranking returned for query Eq. The translation model
estimation is based on a robust regression and can be expressed as :
∆(Eq, Ei) = argmin∆
Mqi∑
m=1
ρθ(Pq
m − (Pim +∆)
)(3.1)
where Pqm and Pi
m are the geo-temporal coordinates of the m-th match (Iqm, Iim).
The cost function ρθ is typically a robust M -estimator allowing outliers to be
rejected with a tolerance θ (in our experiments we used Tukey’s robust estimator).
The estimated translation parameter ∆ should be understood as the spatial and
temporal offset required to register the query event record Eq with the retrieved
Page 47
event record Ei. Once this parameter has been estimated, the final score of an
event Ei is finally computed by counting the number of inliers, i.e the number of
visual matches that respect the estimated translation model :
Sq(Ei) =
Mqi∑
m=1
(∥∥∥Pqm − (Pi
m + ∆)∥∥∥ ≤ θ
)(3.2)
where θ is a tolerance error parameter, typically the same as the one used during
the estimation phase. In practice, we use a smooth counting operator to get a better
dynamic on resulting scores. When we restrict ourselves to temporal metadata (as
was done in the experiments), Equation 3.1 can be simplified to :
δ(Eq, Ei) = argminδ
Mqi∑
m=1
ρθ(tqm − (tim + δ)
)(3.3)
where δ represents the estimated temporal offset between Eq and Ei and θ is now
a temporal tolerance error whose value is discussed in the experiments. Since δ is a
single mono-dimensional parameter to be estimated, Equation 3.3 can be resolved
efficiently by a brute force approach testing all possible solutions δ.
Final scores then become :
Sq(Ei) =
Mqi∑
m=1
(∣∣∣tqm − (tim + δ)∣∣∣ ≤ θ
)(3.4)
STEP 4 - Prior constraints : Depending on the application context, major
improvements in effectiveness might be obtained by adding prior constraints on
the tolerated values for ∆. Rejecting events with too large spatial and/or temporal
offset from the query record is indeed a good way to reduce the probability of false
alarms. In our experiments we study the impact of such a constraint on the estima-
ted temporal offsets. Concretely, we reject from the result list all retrieved event
records which have an estimated offset above a given threshold δmax (regardless
of the matching score Sq(Ei)).
Page 48
3 Enabling scalability
To allow fast visual matching in large picture datasets, we implemented a
distributed similarity search framework based on Multi-Probe Locality Sensitive
Hashing [69, 53] and the MapReduce [28] programming model.
3.1 Multi-Probe LSH
To process the Nearest Neighbors search efficiently, we use an approximate
similarity search structure, namely Multi-Probe Locality Sensitive Hashing (MP-
LSH) [69, 53]. MP-LSH methods are built on the well-known LSH technique [24],
but they intelligently probe multiple buckets that are likely to contain results. Such
techniques have been proved to overcome the over-linear space cost drawback of
common LSH while preserving a similar sub-linear time cost (with complexity
O(Nλ)).
Now, let F be the dataset of all visual features F ∈ Rd (i.e. the one extracted
from the pictures of the N event records Ei). Each feature F is hashed with a hash
function g : Rd → Zk such that :
g(F) = (h1(F), ..., hk(F)) (3.5)
where individual hash functions hj are drawn from a given locality sensitive ha-
shing function family. In this work we used the following binary hash function
family which is known to be sensitive to the inner product :
h(F) = sgn (W.F) (3.6)
where W is a random variable distributed according to N (0, I). The hash codes
produced gi = g(Fi) are thus binary hash codes of size k.
At indexing time, each feature Fi is mapped into a single hash table T accor-
Page 49
ding to its hash code value gi. As a result, we obtain a hash table of Nb buckets
where Nb ≤ 2k.
At query time, the query vector Fq is also mapped onto the hash table T
according to its hash code value gq. The multi-probe algorithm then selects a set
of Np buckets {(bj)}j=1..Np as candidates that may contain objects similar to the
query according to :
dh(gq,bj) < δMP (3.7)
where dh is the hamming distance between two binary hash codes and δMP is the
multi-probe parameter (i.e. a radius of hamming space).
A final step is then performed to filter the features contained in the selected
buckets by computing their distance to the query and keeping the K Nearest
Neighbors.
3.2 The MapReduce framework
MapReduce is a programming model introduced by Google to support dis-
tributed batch processing on large data sets. A MapReduce job splits the input
dataset into independent chunks which are processed by the map tasks in a parallel
manner. The framework sorts the outputs of the maps, which are then input to the
reduce tasks. Chunks are processed based on key/value pairs. The map function
computes a set of intermediate key/value pairs and, for each intermediate key, the
reduce function iterates through the values that are associated with that key and
outputs 0 or more values. The map and Reduce tasks scheduling is performed by
the framework. In a distributed configuration, the framework assigns jobs to the
nodes as slots become available. The number of map and reduce slots as well as
chunk size can be specified for each job, depending on the cluster size. With such a
granularity, large data sets processing can be distributed efficiently on commodity
clusters.
Page 50
3.3 Multi-Probe LSH in the MapReduce framework
The hash table T in the MapReduce framework is stored in a text file where
each line corresponds to a single bucket. Each bucket is represented by a <
key, value > pair :
< b, ((id(F1),F1), (id(F2),F2), . . . ) > (3.8)
where b is the hash code of the bucket and id(F) the picture identifier associated
to feature F.
In order to be processed by the MapReduce framework, the table T has to be
divided into a set of splits. The number of splits is deduced by the MapReduce
framework according to a set of input parameters as the number of available slots
and the minimal input split size which is related to the file system block size.
However, in order to be entirely processed by a mapper, a bucket cannot spill over
different splits.
Since MapReduce is mainly dedicated to batch processing, setting up tasks
could be expensive due to process creation and data transfer. Therefore, our imple-
mentation processes multiple queries at a time, typically sets of pictures belonging
to the same records.
The hash codes of all query features are computed and passed to the map
instances to be executed on the different slots. The number of map instances is
computed by the MapReduce framework according to the number of input splits.
Each map process iterates over its assigned input split and for each query
selects the candidate buckets that are likely to contain similar features according
to Equ.3.7. It then computes the distance to each feature within the selected
buckets. For each visited feature Fi, the mapfunction outputs a < key, value >
Page 51
pair of the form :
< id(Fq), (dist(Fq,Fi), id(Fi)) > (3.9)
where dist(Fq,Fi) denotes the distance between Fq and Fi.
For each query identifier id(Fq) the reduce instance sorts the set of emitted
values for all map instances and filters the K-nearest neighbors.
Figure 3.3 gives the average response time per K-NN search according to the
total number of queries batched within the same MapReduce job. It shows that
the MapReduce framework becomes profitable from about 50 grouped queries.
The average response time becomes almost constant for more than 400 grouped
queries. In our experiments, the number of images per event record ranges from
about 5 to 200. That means that using the MapReduce framework is still reaso-
nable for the online processing of a single event record.
Finally, many MapReduce implementations materialize the entire output of each
map before it can be consumed by the reducer in order to ensure that all maps
successfully completed their tasks. In [22], Condel et al. propose a modified Ma-
pReduce architecture that allows data to be pipelined between operators. This
extends the MapReduce programming model beyond batch processing, and can
reduce completion times while improving system utilization for batch jobs as well.
4 Experiments
We evaluated our method on a Flickr image dataset using last.fm tags as
real-world events ground truth. It was constructed from the corpus introduced by
Troncy et al. [95] for the general evaluation of event-centric indexing approaches.
This corpus mainly contains events and media descriptions and was originally
created from three large public event directories (last.fm, eventful and upcoming).
In our case, we only used it to define a set of Flickr images labeled with last.fm
Page 52
Figure 3.3 – Processing time per image according to query size
tags, i.e. unique identifiers of music events such as concerts, festivals, etc. The
images themselves were not provided in the data and had to be crawled resulting
in some missing images. Unfortunately, in this corpus, only a small fraction had
geo-tags so that we evaluated our method using only temporal metadata. We used
the EXIF creation date field of the pictures to generate the time metadata used
in our method. Only about 50% of the crawled images had such a valid EXIF
(others had empty or null date fields). In Table 3.1, we report the statistics on
the original, crawled and filtered dataset. To gather the pictures in relevant event
records, we used both the last.fm identifier and the Flickr author field provided
with each picture. An event record is then defined as the set of pictures by a given
author having the same LastFM label. Our final dataset contains 41, 294 event
records related to 34, 034 distinct LastFM events.
Table 3.1 – Test dataset Vs Original dataset
Total Crawled Filtered
photos 1 667 317 1637585 828902
users 23 060 22676 10257
Page 53
4.1 Experimental settings
We used 6 global visual features to describe a picture’s visual content (including
HSV Histogram[34], Hough histogram[34], Fourier histogram[34], edge orientation
histogram[34]). Each feature was L2-normalized and hashed into a 1024 bits hash
code using the same hash function as the one used to construct the hash table
(see Equ.3.6). The 6 hash codes were then concatenated into a single hash code of
6144 bits. We used the Hamming distance on these hash code as visual similarity.
From the full set of 41, 294 event records in the dataset, the only queries we kept
were the records being tagged with last.fm events and having at least 7 records in
the dataset. We finally got 172 query records Eq. This procedure was motivated
by the fact that a very large fraction of events were represented by only one record
and therefore not suitable for experiments.
In all the experiments, we used a leave-one-out evaluation procedure and mea-
sured performances with 2 evaluation metrics : Mean Average Precision (MAP)
and Classification Rate (CR). MAP is used in most information retrieval evalua-
tions and measures the ability of our method to retrieve all the records related
to the same event as the query event. Classification rate is obtained by using our
method as a nearest neighbors classifier. The number of occurrences of retrieved
events is computed from the top 10 returned records and we keep the event with
the maximum score as the best prediction. It measures the ability of our method
to automatically label some unknown query event record. We extend this measure
to the case of multiple labels suggestion. In addition to the best retrieved event
we also return the following events by decreasing scores (i.e. decreasing number
of occurrences found within the top-10 returned records). In this case, the success
rate is measured by the percentage of query records where the correct event was
retrieved among all suggested event tags. It measures the performance of our me-
thod in the context of tags suggestion rather than automatic annotation.
Page 54
Finally, we used the Hadoop 1 MapReduce implementation on a 5-node cluster.
Nodes are equipped with Intel Xeon X5560 CPUs as well as 48Gb of RAM.
4.2 Results
Parameters discussion
In Figure 3.4, we report the mean average precision for varying values of the
θ parameter (Eq. 3.3) and different numbers of K-nearest neighbors used during
the visual matching step. The results show that MAP values are at their optimal
for θ ∈ [300, 1800] seconds. This optimal error tolerance value is coherent with
the nature of the events in the last.fm corpus. Picture records of concerts indeed
usually range from one to several hours. On the other hand, below 5 minutes,
real-world concert scenes are too ambiguous to be discriminated by their visual
content (or at least with the global visual features used in this study). In what
follows, we fix θ to 1800 as an optimal value.
Figure 3.4 – Influence of temporal error to tolerance θ
We now study the impact of adding a prior constraint δmax on the estimated
temporal offsets δ. Most events in last.fm dataset being music concerts, it is un-
1. http ://hadoop.apache.org/mapreduce/
Page 55
likely that the temporal offset between two records would reach high values. We
therefore study the impact of rejecting all retrieved records having a temporal off-
set higher than δmax. Figure 3.5 displays the new MAP curves for varying values of
δmax. It shows that the mean average precision can be consistently improved from
about 0.08 without any constraint to 0.18. The optimal value for δmax is about
86,400 seconds which is exactly 1 day. That means that the records of a single
real-word event might have a temporal offset of up to 1 day. The interpretation
is that the EXIF creation date field is noisy due to the different reference times
of the devices used (users from different countries, default device settings, etc.).
It is worth noting that our method is by its very nature robust to such tempo-
ral offsets since we mainly consider temporal coherence rather than absolute time
matching. On the other hand, rejecting records with temporal offsets higher than
1 day allows many visual false positives to be rejected.
Figure 3.5 – Influence of temporal offset thresholding (δmax) on MAP
Figure 3.6 displays the results of the same experiment but for the classification
rate (using a 10-NN classifier on retrieved records) rather than the mean average
precision. This evaluates the ability of our method to automatically annotate a
query event record rather than its ability to retrieve all records in the dataset.
Here again the optimal classification rates are obtained when δmax=1 day. Fur-
Page 56
Figure 3.6 – Influence of temporal offset thresholding (δmax) classification rates
thermore, we see that the classification rate always increases with the number K
of closest visual matches (returned for each query image). The interpretation is
that increasing K improves recall without degrading precision too much thanks
to the selectivity of our temporal consistency re-ranking step. We verified this by
studying the recall and the precision independently.
Figure 3.7 displays both precision and recall for increasing values of K. The
results confirm the above conclusion that increasing values of K improves recall wi-
thout compromising much of the precision. This shows the ability of our temporal
consistency re-ranking step to efficiently surface relevant records.
(a) Precision (b) Recall
Figure 3.7 – Precision and recall for increasing values of k
Page 57
Event suggestion in the MapReduce framework
All the previous experiments were made using an exhaustive search for the
k-NN search. In this section, we evaluate the performance of our full framework
using MapReduce and the Multi-Probe LSH. As parameters, we used the optimal
values discussed in the previous section (i.e. δmax=86.400, K=3000 and θ=1800).
Table 3.2 displays the class rates using an exhaustive search as seen in the
previous section as well as class rates using a Multi-Probe LSH-based similarity
search for different values of δMP .
Table 3.2 – Suggestion rates
# of suggested events tag 1 2 3 4 5 10
Exhaustive 0.60 0.66 0.69 0.71 0.72 0.73MP-Delta 0 0.39 0.48 0.50 0.51 0.52 0.54MP-Delta 1 0.45 0.55 0.57 0.58 0.59 0.63MP-Delta 2 0.48 0.59 0.61 0.65 0.66 0.69MP-Delta 4 0.51 0.61 0.63 0.67 0.67 0.70MP-Delta 8 0.61 0.67 0.70 0.72 0.72 0.74MP-Delta 16 0.59 0.66 0.69 0.71 0.72 0.73
As one might expect, all class rates values increase accordingly with the num-
ber of probes (i.e increasing δMP values) to surprisingly perform better than the
exhaustive search for δMP=8. Overall, in the best case, our method is able to
suggest the correct event tag over 5 suggestions with a 72% success rate. Such
performances are clearly acceptable from an application point of view.
Figure 3.8 displays the average search time per query for both distributed and
centralized search. We compare the K-NN processing time per image for a cen-
tralized setting (number of map slots = 1) to the processing time in a distributed
scheme (20 map slots available on the network) for both exact and approximate
similarity search. Although the multi-probe might reduce the effectiveness of our
Page 58
Figure 3.8 – K-NN search time per image (k = 4000)
method, it might significantly reduce the search time by an order of magnitude.
4.3 Dicussion
On event matching
From an application point of view, the identification rates achieved are clearly
acceptable for event search and identification. Yet, we believe that the identifica-
tion rate can be further improved with more information such as geotags and user
generated annotations (people tags, contextual annotations, etc).
Obviously, linking different records of the same event would also enable the
discovery of event related documents in social media. Furthermore, this would en-
able the discovery of more complex relationships and patterns between the event.
In order to handle such date sets effectively, our method should hence, scale ac-
cordingly.
On scalability
The performance gain achieved by Multi-Probe LSH over exhaustive search
is nonetheless still less than the one obtained in usual centralized settings. First,
in MapReduce approaches, probing multiple buckets generates more network ove-
Page 59
rhead in addition to data transfers across the network. The second reason is due to
bucket occupation. In fact, imbalanced buckets generate imbalanced map chunks
leading to disproportionate map execution times.
While recent efforts have overcome some of the Hadoop MapReduce Frame-
work limitations and more recently the Apache Hadoop NextGen MapReduce
(YARN) 2, computing the K-Nearest Neighbors for each image is time and space
consuming even if they are processed in a parallel and/or distributed manner since
it often implies distance computation or approximation.
In Chapter 4, we address the problem of computing the images K-Nearest
Neighbors in a fully decentralized, scalable and space-adaptive manner.
5 Conclusion
In this chapter we presented a new visual-based method for retrieving events in
photo collections, that might also be used for event tag suggestion or annotation.
Our method proved to be robust to temporal offsets since we mainly rely on
temporal coherence rather than absolute time matching. As one result, we are
able to suggest the correct event tag with a success rate of at least 60% and even
72% if we allow multiple suggestions.
The proposed method is scalable, since it relies on efficient approximate simi-
larity search techniques based on the MapReduce framework. We also investigated
multi-probe techniques trading accuracy for efficiency, which might lead to a loss
of 8.3% class rate compared to a gain of 58.6% in processing time.
2. http ://hadoop.apache.org/docs/r0.23.0/hadoop-yarn/hadoop-yarn-site/YARN.html
Page 60
Chapitre 4
A distributed Framework for
k-NN Graphs construction
Efficiently constructing the K-Nearest Neighbor Graph (K-NNG) of large and
high dimensional datasets is crucial for many applications with feature-rich ob-
jects, such as images or other multimedia content. In this chapter we investigate
the use of high dimensional hashing methods for efficiently approximating the K-
NNG in distributed environments. We first discuss the importance of balancing
issues on the performance of such approaches and show why the baseline approach
using Locality Sensitive Hashing does not perform well. Our new KNN-join me-
thod is based on RMMH, a recently introduced hash function family based on
randomly trained classifiers. We show that the resulting hash tables are much
more balanced and that the number of resulting collisions can be greatly reduced
without degrading quality. We further improve the load balancing of our distribu-
ted approach by designing a parallelized local join algorithm. We show that our
method outperforms state-of-the-art methods in centralized settings and that it
is efficiently scalable given its inherently distributed design. Finally, we present
a distributed implementation of our method using a MapReduce framework and
evaluate its performance on a large dataset.
43
Page 61
1 Problem Statement
Given a set X of N objects, the K-Nearest Neighbor Graph consists of the ver-
tex set X and the set of edges connecting each object from X to its K most similar
objects in X under a given metric or similarity measure. Efficiently constructing
the K-NNG of large datasets is crucial for many applications involving feature-rich
objects, such as images, text documents or other multimedia content. Examples in-
clude query suggestion in web search engines [85], collaborative filtering [1], visual
objects discovery [80] and event detection in multimedia User Generated Contents.
The K-NNG is also a key data structure for many established methods in data
mining [12], machine learning [10] and manifold learning [103]. Overall, efficient
K-NNG construction methods would extend a large pool of existing graph and
network analysis methods to large datasets without an explicit graph structure.
In this chapter we investigate the use of high dimensional hashing methods
for efficiently approximating the K-NNG, notably in distributed environments.
A decade after the first LSH [37], hashing methods have indeed attracted increa-
sing interest for efficiently solving Nearest Neighbors problems in high-dimensional
feature spaces. Embedding high-dimensional feature spaces in very compact hash
codes makes it possible to scale up many similarity search applications (from 10
to 1000 times larger datasets) [38, 55, 101]. One advantage of hashing methods
over trees or other structures is that they simultaneously allow efficient indexing
and data compression. Hash codes can indeed be used to gather features into
buckets but also to approximate exact similarity measures by efficient hash code
comparisons (typically a hamming distance on binary codes). Memory usage and
processing costs can therefore be drastically reduced.
Unfortunately, recent studies [107, 31] have shown that the performances of
usual hashing-based methods are not as good as expected when constructing the
full K-NNG (rather than only considering individual top-K queries). Recently,
Dong et al.[31] even show that LSH and other hashing scheme can be outperfor-
med by a radically different strategy purely based on query expansion operations
Page 62
[31], without relying on any indexing structure or partitioning method. Our work
provides evidence to support hashing based methods by showing that such obser-
vations might be mitigated when moving to more recent hash function families.
Our new KNN-join method is notably based on RMMH [55], a recent hash
function family based on randomly trained classifiers. In this chapter, we discuss
the importance of balancing issues on the performance of hashing-based similarity
joins and show why the baseline approach using Locality Sensitive Hashing (LSH)
and collisions frequencies does not perform well (Section 2). We then introduce
our new K-NNG method based on RMMH (Section 3). To further improve load
balancing in distributed environments, we finally propose a distributed local join
algorithm and describe its implementation within the MapReduce framework.
2 Hashing-based K-NNG construction
2.1 Notations
Let us first introduce some notations. We consider a dataset X of N feature
vectors x lying in a Hilbert space X. For any two points x,y ∈ X , we denote as
κ : X2 → R a symmetric kernel function satisfying Mercer’s theorem, so that κ
can be expressed as an inner product in some unknown Hilbert space through a
mapping function Φ such that κ(x,y) = Φ(x).Φ(y).
If we denote by NK(x) the set of the K nearest neighbors of x in X according
to κ, then the K-Nearest Neighbor Graph on X is a directed graph GK(X , E)
connecting each element to its K Nearest Neighbors, thus :
E = {(u,v),u ∈ X ,v ∈ NK(u)}
We generally denote by H, a family of binary hash functions h : X → {−1, 1}. If
we consider hash function families based on random hyperplanes we have :
h(x) = sgn (w.x + b)
Page 63
where w ∈ X is a random variable distributed according to pw and b is a scalar
random variable distributed according to pb. When working in the Euclidean space
X = Rd and choosing pw = N (0, I) and b = 0, we get the popular LSH function
family sensitive to the inner product [15, 60]. In this case, for any two points
q,v ∈ Rd we have :
Pr [h(q) = h(v)] = 1−1
π
cos−1
(
q.v
‖q‖ ‖v‖
)
Thus, the collision probability of any two items increases with their inner product
(κ(q,v) = q.v). More generally, any LSH function family has the property :
Pr [h(q) = h(v)] = f (κ(q,v)) (4.1)
where f(κ) is the sensitivity function, increasing with κ.
2.2 LSH based K-NNG approximation
Let us consider L hash tables, each constructed from the concatenation of p
hash functions built from an LSH family H. The collision probability of any two
items q,v in one table is :
Pr [h(q) = h(v)] = [f (κ(q,v))]p (4.2)
where h(q) and h(v) denote p-length binary hash codes.
The total number of collisions in any set of L hash tables, denoted as nq,v, is a
random variable distributed according to a binomial distribution with parameters
L (the number of experiments) and fp (the probability of success of each Bernouilli
experiment). The expected number of collisions in L hash tables is therefore :
nq,v = E[nq,v] = L. [f (κ(q,v))]p
Page 64
The empirical number of collisions in L tables, denoted as nq,v, can be seen as an
estimator of this value. And since the sensitivity function f is supposed to be an
increasing function with κ, it is easy to show that :
κ(q,v1) < κ(q,v2)⇔ E[nq,v1] < E[nq,v2
] (4.3)
The top-K neighbors of any item x ∈ X according to κ can therefore be approxi-
mated by the top-K items ranked according to their collision frequency with x (as
suggested in [64]). Consequently the whole K-NNG on X can be approximated
by simply counting the number of collisions of item pairs, without any distance
computation.
More formally, we define the hashing based approximation of a K-NNG GK(X , E),
as a new directed graph GK(X , E) where E is a set of edges connecting any item x
to its K most frequently colliding items in the L hash tables. In practice, since the
number of collisions is a discrete variable, more than K items might have the same
number of collisions and have to be kept in the graph produced. The hash-based
approximation of a K-NNG should therefore rather be seen as a filtering step of
the all-pairs graph. A brute-force refinement step can be applied on GK(X , E) to
get a more accurate approximation during a second stage.
2.3 Balancing issues of LSH-based K-NNG
The LSH-based K-NNG approximation is very attractive in the sense that it
does not require any kernel (or metric) computation. It simply requires building
L hash tables and post-processing all collisions occurring in these tables. Unfortu-
nately, balancing issues strongly affect the performance of this scheme in practice.
The cost of the method is, in fact, mainly determined by the total number of
collisions in all hash tables, i.e.
TH(X , L, p) =L∑
l=1
2p∑
b=1
nl,b.(nl,b − 1)
2(4.4)
Page 65
where nl,b is the number of items in the b-th bucket of the l-th table. For an ideally
balanced hash function and p ∼ log2(N), the cost complexity would be O(L.N).
But for highly unbalanced hash functions, the cost complexity tends rather to be
O(L.N2) because the most filled buckets concentrate a large fraction of the whole
dataset (i.e. nl,b = αN). To illustrate the potential impact of LSH balancing
issues, Table 4.1 provide some real statistics computed on one of the datasets used
in our experiments (see section 5), compared to a perfectly balanced hash function
(L=128, p=16). It shows that the number of collisions to be processed is 3 orders
of magnitude greater than the perfectly balanced hash function, resulting in an
intensive computing cost. The poor balancing performance is confirmed by a very
bad Gini coefficient and a low entropy. Overall, several authors have confirmed
that LSH-based methods for approximating K-NN Graphs are not very efficient
[31, 107]. Balancing however was not identified as being critical to improve the
efficiency of hash-based K-NNG approximations.
Hash function Perfect LSH
Nb of collisions TH(X , L, p) 4.82 ∗ 106 7.57 ∗ 109
Entropy 16 7.58
Gini coeff. 0 0.94
Max bucket size 12 100751
Nb of non empty buckets 65 536 11 070
Table 4.1 – Balancing statistics of LSH vs. perfectly balanced hash function
3 Proposed method
We now describe our K-NNG approximation method. It can be used either as a
filtering step (combined with a brute-force refinement step applied afterwards), or
as a direct approximation of the graph, depending on the quality of the application
required. The method holds for centralized settings as well as for distributed or
parallelized settings, as discussed below.
Page 66
3.1 Random Maximum Margin Hashing
Rather than using classical LSH functions, our method is based on Random
Maximum Margin Hashing (RMMH, [55]), an original hash function family in-
troduced recently and one that is suitable for any kernelized space (including the
classical inner product). In addition to its nice embedding properties, the main
strength of RMMH for our problem is its load balancing capabilities. The claim
of this method is actually that the lack of independence between hash functions
is the main issue affecting the performance of data dependent hashing methods
compared to data independent ones. Indeed, the basic requirement of any hashing
method is that the hash function provide a uniform distribution of hash values,
or at least one that is as uniform as possible. Non-uniform distributions increase
the overall expected number of collisions and therefore the cost of resolving them.
The uniformity constraint should therefore not be relaxed too much, even if we
aim to maximize the collision probability of close points.
The main originality of RMMH is to train purely random splits of the data, re-
gardless of the closeness of the training samples (i.e. without any supervision). The
authors showed that such a data scattering approach makes it possible to generate
consistently more independent hash functions than other data-dependent hashing
functions. Moreover, the use of large margin classifiers allows good generalization
performances to be maintained.
Concretely, the method works by learning a set of randomly trained classifiers
from a small fraction of the dataset. For each hash function, M training points are
selected at random from X and are then randomly labeled (half of the points
with −1 and the other half with 1). If we denote as x+j the resulting M2 positive
training samples and as x−
j the M2 negative training samples, each hash function
is then computed by training a binary classifier hθ(x) such that :
h(x) = argmaxhθ
M2∑
j=1
hθ(x+j )− hθ(x
−
j ) (4.5)
Page 67
Using a Support Vector Machine (SVM) as a binary classifier, we get :
h(x) = sgn
(
m∑
i=1
α∗
i κ(x∗
i ,x) + bm
)
(4.6)
where x∗i are the m support vectors selected by the SVM (x∗i ∈{
x+j ,x
−
j
}
).
In the linear case (κ = inner product), this simplifies to :
h(x) = sgn (w.x + b) (4.7)
with w =∑m
i=1 α∗
ix∗
i and the hash function is much faster to compute.
3.2 RMMH-based K-NNG approximation
Our K-NNG approximation algorithm now works in the following way :
— STEP1 - Hash tables construction : For each item x ∈ X , we compute
L p-length binary hash codes h(x) (using L.p distinct RMMH functions)
and insert them in L distinct hash tables.
— STEP2 - Local joins : Non-empty buckets of each hash table are pro-
cessed independently by a local join algorithm. For each non-empty bucket
b, the local join algorithm generates the nc = nb.(nb−1)2 possible pairs of
items computed from the nb items contained in the bucket. Notice that
this algorithm ensures that buckets can be processed separately and there-
fore facilitate the distribution of our method. Each emitted pair is simply
coded by a pair of integer identifiers (idi, idj) such that idi < idj (as a
coding convention) with 0 < i < nb − 1 and 0 < i.nb + j < nc − 1.
— STEP3 - Reduction : All pairs (idi, idj) are mapped onto an accumulator
in order to compute the occurrence of each pair (within the TH emitted
pairs). Notice that the occurrence matrix produced does not depend on the
mapping sequence so that each pair can be inserted independently from
the other ones, at any time during the algorithm. This ensures that this
reduction step can be easily distributed.
Page 68
— STEP4 - Filtering : Once the full occurrence matrix has been computed,
it is filtered in order to keep only the most similar items to each candidate
item and compute our approximate graph GK(X , E). This is done by scan-
ning each line of the occurrence matrix and maintaining a priority queue
according to the number of occurrences of each pair. Since the number of
occurrences is a discrete priority value, all items having the same frequency
are pulled together from the queue, so we finally get more than K most
similar items for each candidate item. Notice that each line of the matrix
can be processed independently from the other ones. This ensures that this
filtering step can be easily distributed.
We recall here that the hashing-based K-NNG produced by the above algorithms
could still be refined by a brute-force algorithm applied on the remaining pairs. We
use such a refinement step in some of our experiments so as to make comparisons
possible with the state-of-the-art results of [31].
3.3 Split local joins
Although local joins can be easily distributed, large buckets still affect the
overall performance. The local join algorithm has quadratic space complexity
(nc = nb.(nb−1)2 = O(n2
b)) and is therefore, likely to raise memory exceptions
as well as expensive swapping phases. Moreover, we want our distributed frame-
work to support a wide variety of hash functions, even those with lower balancing
capabilities such as LSH. In the following, we extend the local join algorithm to
process large buckets in parallel and/or distributed architectures with guarantees
on the runtime and memory occupation.
In practice, if the number of collisions generated by a given local join exceeds
a fixed threshold (i.e. nc > cmax), then the local join is split into ns = ⌈ nc
cmax⌉
sub-joins, each being in charge of at most cmax collisions.
Algorithm 1 shows the pseudo-code of the basic local join.
Since the number of generated pairs at iteration k is n − k, the number of
Page 69
Algorithm 1 Local Join
Require: bucket b = {idi}1<i<nb, start, end.
Ensure: local collisions set C.
1: C ← ∅2: for i← start, . . . , end do3: for j ← i+ 1 . . . , nb do4: C ← C ∪ (bi, bj)5: end for6: end for
generated pairs of an s-length iteration block starting at the ith iteration of the
external loop is :
s−1∑
k=0
(nb − i− k) =1
2∗ s2 + (nb − i−
1
2) ∗ s (4.8)
which must be less than or equal to cmax. The thus defined inequality has two
roots of opposite signs s1 and s2 (s1 > s2) ; we require s to be equal to ⌊s1⌋ as
long as s+ i remains less than or equal to s, nb − i otherwise.
Algorithm 2 gives the pseudo-code for the enhanced local-join with the split
strategy. It first computes the starting iteration of each iteration block (lines 3-10),
local joins are then spawned concurrently across processing units (lines 11-13).
3.4 MapReduce Implementation
As explained in the previous section, all the steps of our hashing-based K-NNG
approximation framework can be easily distributed. In this work, we implemented
it under the Hadoop MapReduce framework [27]. This is probably not the most
efficient implementation, but it is highly scalable and easily deployable into large
computing clouds. A first MapReduce job performs the hash tables construction
STEP1 and then, a second MapReduce job computes STEP2 and STEP3 (using
the split local join strategy). STEP4 was not implemented under MapReduce
within our experiment but this could be easily done by using the occurrence matrix
line numbers as input keys to a third job.
Page 70
Algorithm 2 Distributed and/or parallel Local Join
Require: bucket b = {idi}1<i<nb, capacity cmax
Ensure: distributed collisions set
1: l ← ∅ //starting iterations list2: k ← 1
3: while k < nb do
4: s1 ← ⌊12 − nb + k +√
(nb − k − 12)
2 + 2.cmax⌋
5: if s1 > nb − k then6: s1 ← nb − k7: end if8: l ← l ∪ s19: k ← k + s1
10: end while
11: for i ← 1 . . . , |l|− 1 do12: Local Join(b, l[i], l[i+ 1]− 1)13: end for
Hash table construction (STEP1)
The first MapReduce job splits the input dataset X into independent chunks
of equal sizes to be processed in parallel. A mapper iterates over the set of its
assigned object features and computes L.p hash values for each feature according
to Equation 4.6. Hash values are concatenated into L p-length hash codes corres-
ponding to L bucket identifiers for the L hash tables). Each hash code is then
emitted along with the table identifier (intermediate key) and the associated fea-
ture identifier (intermediate value).
The Reduce function merges all the emitted identifiers for a particular interme-
diate key (i.e. bucket identifier within a specific table). The resulting buckets are
provided as input to the second MapReduce job.
Occurrence matrix computation (STEP2 & 3)
The second job processes buckets separately. The map function generates all
possible pairs of identifiers of the processed bucket and issues each pair (interme-
Page 71
diate key), possibly with a null intermediate value. The reduce function counts
the number of intermediate values for each issued pair. For efficiency reasons,
map outputs are combined locally before being sent to the reducer. This requires
intermediate values to store the cumulated pair occurrences. With such an opti-
mization, the mapper issues each pair along with its initial occurrence. Combine
and reduce functions simply sum the intermediate values for each issued pair.
4 Experimental setup
This section provides details about the experimental setup, including datasets,
performance measures, default parameters and system environment. Experimental
results are reported in Section 5.
4.1 Datasets & Baselines
Our method was evaluated on 3 datasets of different dimensions and sizes :
Shape : a set of 544-dimensional feature vectors extracted from 28775 3D poly-
gonal models from various sources.
Audio : a set of 54387 192-dimensional feature vectors extracted from the DARPA
TIMIT collection.
Flickr : we use the same dataset as described in section 4.
All feature vectors were L2 normalized and compressed into 3072-dimensional
binary hash codes using RMMH and LSH. Table 4.2 summarizes the salient infor-
mation of these datasets.
The shape and audio datasets were first used in [32] to evaluate the LSH
method and more recently in [31] to evaluate the NN-Descent algorithm against
the Recursive Lanczos Bisection[17] and LSH. We rely on these datasets to evaluate
our method against the NN-Descent method [31] (which outperforms previous
approximate KNNG methods).
Finally, we use the Flickr dataset to study in more detail the performances of
Page 72
our method in the context of a larger dataset (in size and dimensionality), related
to the context of this dissertation (i.e. event mining).
Datasets # Objects Dimension
Shape 28 775 544
Audio 54 387 192
Flcikr 828 902 793
Table 4.2 – Dataset summary
4.2 Performance measures
We use recall and precision to measure the accuracy of our approximate KNN
Graphs against the exact KNN Graphs. The exact K-NN Graphs were computed
on each dataset using a brute-force exhaustive search to find the K-NN of each
node. The default K is fixed to 100. The default similarity measure between fea-
ture vectors is the inner product. Note that, since all features are L2-normalized,
the inner product K-NNG is equivalent to the Euclidean distance K-NNG. The
recall of an approximate K-NNG is computed as the number of correct Nearest
Neighbors retrieved, divided by the number of edges in the exact K-NNG. Simi-
larly, we define the precision of an approximate K-NNG as the number of exact
Nearest Neighbors retrieved, divided by the total number of edges in the approxi-
mate K-NNG.
The efficiency of our method is evaluated with the following metrics :
— Number of generated pairs : is used as an architecture-independent measure
of the cost of our method to study the impact of the different parameters
and hash functions used.
— Gini coefficient : is used to measure the load balancing of the hash tables
used. Low Gini coefficients reflect good bucket balancing, while high values
reveal large disparities in feature distribution. We should mention here that
a null value reflects a uniform distribution in the hash space. In [81], the
Page 73
authors show that the Gini coefficient is the most appropriate statistical
metric for measuring load balancing fairness. For a better understanding
of the impact of unfair feature balancing on the running time, we also
report some statistics on the average maximum bucket size and the average
number of non-empty buckets.
— Scan-Rate : is used as an architecture and method-independent measure of
the filtering capabilities of approximate KNNG construction methods. It is
defined in [31] as the ratio of the number of item pairs processed by the
algorithm to the total number of possible pairs (i.e N(N−1)2 ).
— CPU Time : is used to compare the overall efficiency of our method against
the NN-descent method.
— Min, Max and Average Map running times are used to evaluate the perfor-
mances that can be achieved on large clusters.
4.3 System environment
We implemented our approach on the Hadoop 1 MapReduce framework.
MapReduce-based experiments were conducted on a 6-node cluster, each node
being equipped with four 2.8 Ghz Quad Core Intel Xeon CPU and 48 Gbytes
of memory. The number of configured map, respectively reduce slots is hardware-
dependent and is limited by the amount of available memory as well as the number
of supported parallel threads per node. In order to avoid expensive context switches
and memory swaps, we require each node to host at most 8 map slots and 3 reduces
in parallel.
The NN-Descent code is the same as in [31] and was provided by the authors.
It is an openMp parallelized implementation and runs only in centralized settings.
To allow fair comparison, we used an openMp-based centralized version of our code
rather than the MapReduce implementation. It iteratively performs steps 1 to 4
(Section 3.1) and finally applies a brute-force refinement step on the remaining
pairs. Centralized experiments were conducted on an X5675 3.06 Ghz processor
1. http ://hadoop.apache.org/mapreduce/
Page 74
server with 96 Gbytes of memory.
5 Experimental results
We first evaluate the impact of the hash functions used on load distributions
(Section 5.1). We then evaluate the overall performance of our method in cen-
tralized settings (Section 5.2) and compare it against the NN-Descent algorithm
(Section 5.2).
The last part serves to validate our method in the MapReduce framework(Section
5.3).
5.1 Hash functions evaluation
We first evaluate the ability of RMMH to produce fair load distributions in
the hash tables. This was not addressed in the original work of Joly et al. [55].
In Figure 4.1, we report the Gini coefficient for different values of M , i.e. the
main parameter of RMMH (Section 3.1). The plots show that hash tables produ-
ced by RMMH quickly converge to fair load balancing when M increases. Gini
coefficients below 0.6 are, for instance, known to be a strong indicator of a fair
load distribution [44]. As a proof of concept, very high values of M even provide
near-perfect balancing. As we will see later, such values are not usable in practice
since too much scattering of the data also degrades the quality of the approximate
graph generated. The parameter M is actually aimed at tuning the compromise
between hash functions independence and the generalization capabilities of the
method [55].
In Table 4.3, we report some statistics for LSH based hashing. Although LSH
achieves correct balancing on the Shape and Audio datasets, it performs consis-
tently worse on the Flickr dataset. For typical values of M greater than 15, RMMH
Page 75
0.35
0.4
0.45
0.5
0.55
0.6
0.65
0.7
0.75
0.8
0 100 200 300 400 500 600
Ginico
efficien
t
M
RMMH-ShapeLSH-Shape
Figure 4.1 – Gini coefficient - RMMH-Based Hashing
outperforms LSH on the 3 datasets.
Shape Audio Flickr
Gini 0.60 0.63 0.94# non-empty buckets 6656 14917 11071Avg. Max. bucket size 594 468.039 100751
Table 4.3 – Bucket Balancing Statistics - LSH-Based Hashing
This can be further verified in Figures 4.2 and 4.3 as the maximal bucket size
per dataset decreases inversely to the number of non-empty buckets.
0
1
2
3
4
5
6
7
0 100 200 300 400 500 600
Number
ofnon
-empty
buck
ets(104)
M
RMMH-ShapeRMMH-AudioRMMH-Flickr
Figure 4.2 – # of non empty buckets - RMMH-Based Hashing
Figure 4.4 plots the number of collisions to be processed for increasing values of
L and different hash functions. The results show that the RMMH based approach
generates up to two orders of magnitude fewer collisions than the LSH-based ap-
Page 76
0.001
0.01
0.1
1
10
0 100 200 300 400 500 600
Ave
rage
max
imum
buck
etsize
(104)
M
RMMH-ShapeRMMH-AudioRMMH-Flickr
Shape-Perfect balancingAudio-Perfect balancingFlickr-Perfect balancing
Figure 4.3 – Average maximum bucket size - RMMH-Based Hashing
proach for typical values of M greater than 15. The number of generated pairs for
both the Shape and Audio datasets does not exceed 109 pairs and therefore, can
be processed in centralized settings. Conversely, the number of generated pairs for
the Flickr dataset for intermediate values of M is high and cannot be handled
in centralized settings. We recall here that the cost of storing one single pair is
10 bytes (2 integers for feature identifiers and 1 short for the collision frequency).
The cost of processing 109 pairs is about 9.5 Gbytes. As a consequence, the default
value of M for the Flickr dataset is fixed to 50. In the following, unless otherwise
stated, the default value of M is 10.
In the following section, we use the Shape and Audio datasets to compare
against the state-of-the-art technique applied in centralized settings. Results on
the Flickr datasets are reported in 5.3 to evaluate the ability of our method to
scale up in both dimensionality and dataset sizes.
5.2 Experiments in centralized settings
In this section, we first evaluate the overall performance of our method in cen-
tralized settings on only the Audio and Shape datasets (Section 5.2) to allow a
fair comparison with the NN-Descent algorithm (Section 5.2) that could not run
on the Flickr dataset.
Page 77
100000
1e+06
1e+07
1e+08
1e+09
1 10 100 1000
Tot
alnumber
ofco
llisions
Number of hash tables
LSHRMMH M = 20RMMH M = 50RMMH M = 70
(a) Shape
100000
1e+06
1e+07
1e+08
1e+09
1 10 100 1000
Tot
alnumber
ofco
llisions
Number of hash tables
LSHRMMH M = 20RMMH M = 50RMMH M = 70
(b) Audio
1e+06
1e+07
1e+08
1e+09
1e+10
1e+11
1e+12
1e+13
1 10 100 1000
Tot
alnumber
ofco
llisions
Number of hash tables
LSHRMMH M = 50RMMH M = 70
RMMH M = 600perfect distrib
(c) Flickr
Figure 4.4 – Total number of collisions
Overall performance of our method and parameter discussion
Figure 4.5 summarizes the recall of our method on both Shape and Audio da-
tasets for different hash functions and index sizes (i.e. the number L of hash tables
used). The best results are observed for small values of M . The results also show
high recall values even with a small number of hash tables (L = 16 and L = 20
respectively for 90% recall) whereas higher recall values require a higher number of
hash tables (128 hash tables for M = 10, whereas only 64 hash tables are required
for M = 10 for 99% recall).
Note that high recall values can be achieved using different values of M . As
discussed in 5.1, the higher M is, the fewer collisions are generated and the more
hash tables are needed. Figure 4.6 plots the scan rate for different hash functions
Page 78
0
0.1
0.2
0.3
0.4
0.5
0.6
0.7
0.8
0.9
1
0 20 40 60 80 100 120 140 160 180 200
Recall
M = 5M = 10M = 20M = 50M = 70
LSH
(a) Shape
0
0.1
0.2
0.3
0.4
0.5
0.6
0.7
0.8
0.9
1
0 20 40 60 80 100 120 140 160 180 200
Recall
M = 5M = 10M = 20M = 50M = 70
LSH
(b) Audio
Figure 4.5 – Recall vs #number of hash tables used
and index sizes. The results show that 99% recall can be achieved while conside-
ring less than 0.05 of the total N ∗ (N − 1)/2 comparisons (for M = 20) for both
datasets. It is worth noticing that even with small values of M , and therefore low
generalization properties (M = 5), the scan rate did not exceed several percent
of the total number of comparisons. This suggests that intermediate values of M
generate more accurate approximations of the KNN Graph as they require fewer
comparisons for the same degree of accuracy. In practice, intermediate values of
M with a high number of tables appears to be a reasonable trade-off between
accuracy and approximation cost. Conversely, very high values of M degrade the
accuracy of the KNNG approximation.
0
0.02
0.04
0.06
0.08
0.1
0.12
0.14
0.16
0.18
0.2
0 20 40 60 80 100 120 140 160 180 200
Sca
nRate
index size
M = 5M = 10M = 20M = 50M = 70
LSH
(a) Shape
0
0.02
0.04
0.06
0.08
0.1
0.12
0.14
0.16
0.18
0 20 40 60 80 100 120 140 160 180 200
Sca
nRate
index size
M = 5M = 10M = 20M = 50M = 70
LSH
(b) Audio
Figure 4.6 – Scan rate variation vs #number of hash tables used
Page 79
Figure 4.7 plots the total CPU time for different values of L (M = 10). For a
better understanding of processing costs, we also report the running time of the
different phases. The results show a correlation between the different phases. The
greater the number of hash tables, the more collisions are generated along with
irrelevant pairs.
0
0.5
1
1.5
2
2.5
3
3.5
4
0 20 40 60 80 100 120 140 160 180 200
CPU
Tim
e(inseco
nds)
Number of Hash Tables
LocalJoinsReductionF iltering
Total
(a) Shape
0
1
2
3
4
5
6
7
0 20 40 60 80 100 120 140 160 180 200
CPU
Tim
e(inseco
nds)
Number of Hash Tables
LocalJoinsReductionF iltering
Total
(b) Audio
Figure 4.7 – Running Time - RMMH
In Table 4.4, we compare RMMH against LSH in both efficiency and effecti-
veness. RMMH clearly outperforms LSH with fewer hash tables. Actually, none of
the LSH-based settings achieved better results than RMMH.
Shape Audio
L Recall Time Recall Time
RMMH 128 0.994 3.078 0.982 5.440
LSH 128 0.967 2.616 0.903 3.912LSH 144 0.973 2.715 0.914 4.234LSH 160 0.978 2.972 0.925 4.518LSH 176 0.982 3.042 0.934 4.942LSH 192 0.984 3.358 0.941 5.382
Table 4.4 – Total Running Time - LSH vs RMMH (M = 10)
Table 4.5 summarizes the Recall, Scan Rate and CPU time for different values
of the minimum collision frequency considered in the approximate graph. Note
that threshold values cannot exceed the number of hash tables used. The results
show that low collision thresholds saved more than 50% of feature comparisons on
Page 80
both datasets for less than a 4% recall loss.
Shape Audio
thresold Rec. SR CPU Rec SR CPU
1 0,995 0,087 3,078 0,983 0,069 5,4402 0,981 0,043 1,817 0,951 0,026 3,0514 0,929 0,022 1,271 0,861 0,009 2,0088 0,772 0,011 1,124 0,661 0,003 1,814
Table 4.5 – Impact of the filtering parameter (M = 10, L = 128)
Comparison with the State-of-the-art
The same datasets were used in [32] to evaluate the NN-Descent approach
against Recursive Lanczos Bisection and LSH. We used the same NN-Descent
settings in our set of experiments ((ρ = 0.5) for speed and (ρ = 1) for accuracy).
We use M = 10 and two different thresholds for the post-processing phase
(t = 1 (default) and t = 2) and up to 192 hash tables for high recall rates, as
discussed in Section 5.2. Table 4.6 summarizes the recall and CPU time of both
methods under those defined settings.
The results show that our approach yields similar results to the NN-Descent
algorithm for both recall rates and CPU costs using the default threshold (i.e.
a minimum collision frequency equal to 1). Although our method performs many
fewer comparisons than the NN-Descent approach, the results show similar running
times considering the Local Joins and Reduction costs. Higher threshold values are
likely to further reduce the scan rate and CPU costs accordingly.
By putting a threshold on the frequency collisions, our method achieves both
higher recall and faster speed (t = 2). Actually, our frequency-based approximation
beats the NN-Descent high-accuracy setting in all cases. Here again, the results
suggest that higher threshold values achieve better approximations of the KNN
Graph.
As a conclusion, our method achieves similar or better performances than
the most efficient state-of-the-art approximate K-NNG construction method in
Page 81
centralized architectures. And in contrast to this method, our method has the
advantage of being easily distributable and therefore much more scalable, as shown
in the next section.
Shape Audio
ρ Rec. CPU S.R. Rec. CPU S.R.
NND 1 0,978 2,044 0,096 0,942 3,387 0,054
NND 0.5 0,958 2,33 0,057 0,903 4,834 0,033
t L Rec. CPU S.R. Rec. CPU S.R.
Ours 1 64 0,976 1,943 0,060 0,943 3,288 0,044
Ours 1 128 0,995 3,078 0,087 0,983 5,440 0,069
Ours 1 144 0,996 3,278 0,093 0,986 5,874 0,073
Ours 1 160 0,997 3,630 0,097 0,989 6,162 0,078
Ours 1 176 0,998 3,696 0,102 0,991 6,703 0,083
Ours 1 192 0,998 3,943 0,107 0,992 6,854 0,087
Ours 2 64 0,925 1,026 0,027 0,857 1,591 0,013
Ours 2 128 0,981 1,817 0,043 0,951 3,051 0,026
Ours 2 144 0,986 2,054 0,047 0,959 3,225 0,028
Ours 2 160 0,989 2,173 0,050 0,966 3,683 0,031
Ours 2 176 0,991 2,351 0,053 0,972 4,116 0,034
Ours 2 192 0,993 2,597 0,057 0,976 4,335 0,036
Table 4.6 – Comparison with State-of-the-art
Table 4.7 shows the impact of varying K (i.e. the number of Nearest Neighbors
considered in the exact K-NNG) on both datasets (L = 128 and M = 10). It shows
that high recall values can be obtained on both smaller(K = 1) and larger graphs
(K = 20) whereas a sufficiently large K is needed for the NN-Descent to achieve
recall rates (> 90%) as stated in [31].
K 1 5 10 20 100 Scan-rate
Shape 0.999 0.998 0.997 0.994 0.978 0.086
Audio 0.996 0.991 0.988 0.982 0.957 0.069
Table 4.7 – Recall for varying values of K
5.3 Performance evaluation in distributed settings
We recall that the experiments described here were carried out on the Flickr
dataset (See Section 4.1).
Table 4.8, shows the impact of the split local join strategy on the number
of map tasks for different values of parameter M. Despite the bucket balancing
Page 82
achieved, the average maximum bucket size is still high. When the initial balancing
of the hash tables is weak, large buckets are split into small balanced ones that
fit the computational constraints resulting in a higher number of map tasks. On
the other hand, the number of additional map tasks decreases as M increases to
finally generate as many map tasks as the basic local join (i.e. the load balancing
achieved by RMMH is already near perfect).
M 10 40 70 100
Gini 0.87 0.71 0.63 0.56
Basic Join 1161 1229 1260 1279
Split Join 9310 1256 1261 1280
Table 4.8 – Number of map tasks
In Table 4.9, we report statistics on map running times. Given a sufficient
number of nodes, (i.e. map slots ≥ the number of map tasks), the total proces-
sing time for a K-NNG construction would be of the same order of magnitude as
the processing time of its longest map task.
M 10 40 70 100
Avg. 43 21 10 7
Worst 146 40 20 9
Table 4.9 – Map running time (in seconds)
Figure 4.8, displays the Recall/Precision curves for varying values of parame-
ter M . Once again, the best results are observed for intermediate values of M
between 15 and 70. This confirms the observations in [55] about the stability of
this parameter and its expected optimal values. Very high values of M are likely to
scatter similar objects and therefore, impact the recall. Conversely, low balanced
buckets would lead to low precision rates. In the following, we fix the training
parameter of RMMH to M = 50. In Figure 4.9, we report the Recall/Precision
curves for varying numbers of hash tables. The results show that precision and
recall rates increase along with the number of hash tables. In this experiment,
we do not use any refinement step after constructing our approximate K-NNG,
so relatively low precision could be drastically improved by a brute-force post-
Page 83
0
0.1
0.2
0.3
0.4
0.5
0.6
0.7
0.8
0.9
1
0 0.1 0.2 0.3 0.4 0.5 0.6 0.7 0.8 0.9 1
Recall
Precision
M = 10M = 20M = 30M = 40M = 50M = 70M = 100M = 200M = 300M = 600
Figure 4.8 – ROC curve corresponding to the recall-precision curve on 128 tables
processing. To better evaluate the filtering capacity of our method, Figure 4.10
0
0.1
0.2
0.3
0.4
0.5
0.6
0.7
0.8
0 0.1 0.2 0.3 0.4 0.5 0.6 0.7 0.8 0.9 1
Recall
Precision
1 table2 tables4 tables8 tables
16 tables32 tables64 tables
128 tables
Figure 4.9 – ROC curve on Flickr dataset (M = 50)
plots the Recall/Scan-rate curves for increasing L values. Once again, it shows that
increasing the number of tables always improve the trade-off between recall and
scan-rate. With L = 128, 72% recall can be achieved while considering only 0.014
of the all pairs graph. Higher recall values could be achieved with more tables. But
this is not required in many applications where approximate Nearest Neighbors
can be as good as exact Nearest Neighbors from the document’s content point of
view [55].
Table 4.10 shows the impact of varying K on the Flickr dataset (L = 128 and
M = 50). It shows that high recall values can be obtained on smaller graphs (e.g.
K=1) and that very large graphs (K=1000) can still be well approximated with
fair recall values about 50%.
Page 84
0
0.1
0.2
0.3
0.4
0.5
0.6
0.7
0.8
0 0.002 0.004 0.006 0.008 0.01 0.012 0.014
Recall
Scan Rate
128 tables64 tables32 tables16 tables8 tables
Figure 4.10 – Recall vs Scan-rate on Flickr dataset (M = 50)
K 1 5 10 40 100 1K Scan-rate
Flickr 0.93 0.88 0.86 0.79 0.72 0.51 0.012
Table 4.10 – Recall for varying values of K
6 Conclusion
This chapter introduced a new hashing-based K-NNG approximation tech-
nique, which is easily distributable and scalable to very large datasets. To the best
of our knowledge, no other work has reported full K-NN graphs results on such
large datasets. Our study provides some evidence that balancing issues explain the
low performances obtained with a classical LSH-based approach for approximating
K-NN graphs. It also shows that using alternative new hash functions that handle
hash table uniformity can definitely change those conclusions. Finally, we descri-
bed a distributable implementation of our method under a MapReduce framework
and improved the load balancing of this scheme through a split local join strategy
avoiding memory overlaps.
In the following chapter, we show how the presented framework can be used in
the context of event-based content suggestion through the construction of image
similarity graphs. More importantly, we show how the collision scheme used can
be leveraged to combine both the k-Nearest Neighbors Graph construction and
the filtering step needed for the event k-Nearest Neighbors Graph construction.
Page 86
Chapitre 5
Event-based Content Suggestion
and Summarization in Social
Media
Social media sites such as Flickr or Facebook contain large amounts of social
multimedia documents relating real-world events. While some of their content
might be interesting and useful, a considerable amount might be of little value
to people interested in learning about the event itself. Applications such as event
summarization, browsing and content suggestion would benefit from such identified
content, ultimately improving the user experience. Selecting the most salient social
media content for a particular event, however, is a challenging task, considering
the fact that such User Generated Content is often distributed between a large
number of different users. In this chapter, we address the general issue of selecting
high quality content for an event.
We first present a new collaborative content based filtering technique for se-
lecting quality documents for a given event (Section 1.1). We then extend our
technique to support the more specific problems of event summarization (Section
1.2) and content suggestion (Section 1.3) in social media. Section 2, introduces a
69
Page 87
scalable framework for building the event graph that we considered in this chapter.
Section 3.1 reports results on the LastFM dataset used in the previous chapters.
1 Content suggestion and summarization in UGC
Recent studies have addressed the general issue of selecting relevant content, or
summarizing an event. Very often, selecting the most interesting images involves
some decision-making, based on various criteria. Alternatively, the problem of se-
lecting relevant content can be reduced to an optimization problem under quality
constraints [6, 93]. Nevertheless, these constraints vary greatly with the summa-
rization context. Generally, state-of-the-art content selection and summarization
techniques exploit the metadata associated to media such as time, location, title
and description. In practice, such information is not always available or might be
noisy.
To address the limitations of existing approaches, we leverage the social context
provided by the social media to objectively detect moments of interest in social
events. Our work is based on the assumption that, should a sufficient number of
users take a large number of shots at a particular moment, then we might consider
this to be an objective evaluation of interest at that moment. Of course, in such
scenarios, location and time information provided with the contents have a major
role to play. In practice, however, location and time information are not always
available or might be noisy. In this chapter, we make use of the visual based event
matching technique presented in Chapter 3, to fill in for bad or missing metadata
associated to media.
1.1 Content Selection
For this content selection problem, we assume that we are given an event
and a corresponding set of social media documents that are associated with the
event, organized into records. Such identified record clusters can be obtained from
the event k-NN Graph (Figure 5.1) described in Section 2 or by using metadata
70
Page 88
associated to the media such as time, location and tags when available.
Figure 5.1 – A k-NN record graph of 10 event records.C1 = an event cluster of 4 event records related mostly to the social event E1 (U1@E1, U2@E1,U4@E1 and U3@E3). C2 = an event cluster of 2 event records related to the social event E3
(U1@E3 and U2@E3).
Event clusters may, however, be noisy and contain records associated with some
other events. This is particularly true in the case of co-located events where a set
of people may be interested in the same event but also share images of other local
events. Hence, records from different events are likely to share a subset of visually
similar images and thus, appear within the same cluster. Figure 5.1 illustrates the
situation described above. The event cluster C1 contains 4 records related mostly
to the social event E1, it also includes an occurrence (Record 3) of the social event
E3. Conversely, distinct records may reflect different aspects of the event and,
thus, be scattered between clusters. In our work, we assume that each record can
be associated at most, with one single social event. However, our approach can
generally be extended to handle less structured content.
Moreover, a single user record may relate to different events and thus, be
associated with various events. For instance, the “my ICMR 2012” event record
(Figure 5.2), containing images of my trip in the context of the International
Conference on Multimedia Retrieval in 2012, may also include images of the “2012
Tiananmen celebration in Hong Kong” and images of our "trip to Lantau Island"
Page 89
as well. Although these images relate to different events, they were taken in the
context of "my trip to the ICMR conference" and may be considered as part of
the same event. In this connection, images of the Tiananmen celebration might
be of little interest to people who are seeking information about the ICMR 2012
event. Similarly, the ICMR pictures are likely to be of little value to people who
are seeking information about the Tiananmen celebration ceremony.
Figure 5.2 – A photo collage of my 2012 ICMR photo album of co-located events.
Pictures of the ICMR banquet, however, are likely to interest people seeking
information about the event. We define the content selection problem as follows :
Definition 3 Given an event e and a set of associated social media documents De,
our goal is to select a subset of documents from De that are the most relevant to
the event, and which include useful details for people who are seeking information
about the event.
Our approach relies on the observation that widely covered moments are likely
to reflect key aspects of the event as they reflect a common interest. Should a
sufficient number of users take a large number of shots at a particular moment, then
we might consider this to be an objective evaluation of interest at that moment.
Given a cluster C of n identified event records and their associated set of media
documents Ic, our method counts, for each image I ∈ Ic, the number S(I) of
Page 90
temporally consistent visual matches with another image within a different record
of the same cluster (i.e. the number of times that I contributed to a link with a
record within the cluster). More formally, let G be the graph having elements from
Ic and whose edges link pairs of temporally and visually consistent images from
Ic. The S(I) score represents the in-degree centrality of I. The result is a ranked
subset of images of Ic.
1.2 Event Summarization
We formalize our event summarization problem as that of producing a ranking
on the event media documents. Specifically, given a cluster Ci (relating to an event
Ei) of n event records Uj@Ei and their associated set of media documents Ic, we
first compute the S(i) score for each element in Ic. We then select the top-K
documents accordingly as a candidate set for generating an event summary. In
our experiments, since the average number of images per event cluster is relatively
small (from tens to hundreds), we make K big enough to include all the images
in the event clusters. Going back to the record map illustrated in Figure 5.1, the
E1 summary is generated by ranking the images of C1 records in decreasing order
of their in-degree centrality.
Alternatively, the resulting set may be post-processed to produce customized
event summaries, thus, improving the user experience. In practice, we provide users
with a set of predefined filters, so that, for example, the removal of visually similar
images (possible using the images K-Nearest Neighbors Graph) or maximize the
time span (when temporal information is available) of the images for a wider
coverage of the event. Since the number of images retained may decrease, we refer
to the size of the pruned summary as Ssummary.
1.3 Content Suggestion
Here, the goal is to present a given user only documents that provide additional
information about the event. Given a set of Nq images (i.e. a record of a user), the
Page 91
recommendation system first identifies the corresponding event and then, returns
a ranked list of images from the repository.
In practice, the event record is submitted to the system and matched with
records from the repository using the visual-based event matching technique des-
cribed in Section 2. To suggest images to the user, we follow two possible scenarios.
In one scenario, we do not have any information about the retrieved records. In
this scenario, the set of suggested images is that of the first retrieved event record.
Depending on the system requirements, a threshold on the retrieved records can be
tuned to improve the overall precision, respectively recall, of the recommendation
system.
Alternatively, all event records in the repository are clustered in an offline
phase. Finally, the recommendation system, returns the list of images of the iden-
tified event records ordered by their score (Section 1.1).
To illustrate both scenarios, let us consider the record graph in Figure 5.1 and
a query record that matches with a record from C1. In the first scenario, the set
of suggested images is that of the matched record. In the second scenario, the
set of suggested images is expanded to include images from C1 ordered by their
decreasing score.
In both scenarios, images which are visually similar to the query images are
removed from the answer set, as they would not provide any additional informa-
tion.
2 Building the Records Graph
The experiments in Section 4.2 show that big values of k are needed to achieve
both good precision and recall. However, a large proportion of the records retrie-
ved are discarded while applying the spatio-temporal constraints the registered
records. Here, the idea is to discard records with large spatial and/or temporal
offset from the query record prior to the geo-temporal re-ranking step (Step 3)
hence, combining both the visual matching (Step 1) and prior filtering (Step 4)
Page 92
steps.
In Chapter 4, we presented a framework for large scale nearest neighbors graph
construction. Candidate pairs of visually similar images are first produced using
our hash-based Nearest Neighbors collision scheme (Step 2). A threshold of the
number of collisions is then used in order to keep only the most similar pairs
of images (Step 4). Eventually, a refinement step on the the remaining pairs is
performed to determine the k-nearest neighbors of each image using a distance-
based similarity function.
Although the number of generated pairs is relatively low, it is still has an
impact on the amount of data transferred. The idea here is to limit the set of
emitted pairs to those that fit the specified spatio/temporal constraints (Step 4)
and thereby also limiting the number of similarity computations performed in the
refinement step. Algorithm 3 gives the pseudo-code for the enhanced local-join.
Algorithm 3 V isual and temporal Local Join
Require: bucket b = {idi}1<i<nb, start, end.
Ensure: local collision set C.
1: C ← ∅2: for i ← start, . . . , end do3: for j ← i+ 1 . . . , nb do4: if Pbi −Pbj ≤ δmax then5: C ← C ∪ (bi, bj)6: end if7: end for8: end for
The approximate event Nearest Neighbors Graph is computed by applying
Step 2 and 3 on the approximate image k-Nearest Neighbors obtained using the
modified local join algorithm.
3 Experiments
We evaluated our content selection technique on an 828,902 Flickr images
dataset, the same as was used in [94]. We first describe the experimental settings
Page 93
(Section 3.1). Experimental results are reported in Section 3.2.
3.1 Experimental setup
Data
The KNN-Graph on the records set was built using the exact image’s Nearest
Neighbors on the global features and the default δ and θ parameters as in Section
4.2.
From the full set of 34,034 events, the only events we kept were those having
at least 2 related records in the dataset. The resulting graph contains 11,785 event
records from 4,525 different sub-events. We used the LastFM tags associated to the
images to build event records clusters and compute the S(i) score of the related
images.
Evaluation
We conducted a user-centric evaluation on 10 different subjects. Each user was
asked to evaluate a set of 20 event summaries chosen at random from a set of 168
events, each having at least 5 associated event records. A 1 to 5 scale was used
to score the overall quality of the summary, where a score of 5 signifies strong
relevance and clear usefulness, and a score of 1 signifies no relevance and no use-
fulness. Similarly, a 1 to 5 score was used to score the images of the summary
individually. The number of images displayed was limited to the top 7 ranked
images so that summaries could fit into web browsers. For each event, we report
the event summary and the average of the recommended images. Figure 5.3 illus-
trates the web-based application used for this purpose.
The KNN-Graph on the records is evaluated using the optimal values from
sections 4.2 and 5 (i.e. δmax=86.400, K=3000, θ=1800, M = 50) as described in
Section 4.1.
Page 94
Figure 5.3 – Snapshot of the user-centric evaluation GUI
3.2 Results
We first evaluate the ability of the proposed method to suggest relevant content.
Figure 5.4 shows the score distribution of the suggested images. The results show
that 39% of the suggested images were rated with the highest score while only 5%
had the lowest. Overall, 68% of the scored images were judged good enough to
represent the event they belonged to.
0
200
400
600
800
1000
1200
1400
0 1 2 3 4 5 6
num
ber
of ra
ted im
ages
score
Figure 5.4 – Score distribution of the suggested images
Looking at the results in more detail, we concluded that, without much sur-
prise, the worst rated images are generally those displaying only a few people
not directly participating in the main event itself (friends of the photographer, a
Page 95
lunch break, etc.) or images of very poor quality. On the other hand, the top-rated
images are usually good quality images where the artist(s) is(are) clearly visible
and/or where the scene presents a specific interest. This can be observed in Fi-
gures 5.5 and 5.6, where close-up photos of the artists rated considerably higher
than photos of the scene and the venue as well as these 3 events were co-located
in Hong-Kong at the same period. Although the Pukkelpop festival art work shot,
captured dining the event (Figure 5.5 first image with past events dates), seems to
have no particular interest at first glance, it rated 3,33 on average as it provides
information about the past events.
Figure 5.5 – Pukkelpop Festival 2007 summary. The first image was rated at3.33 on average whereas the remaining images rated at 4.33, 4.33, 4 and 4.33 onaverage, respectively.
In Figure 5.7, we compare the event summary score (given by users) to the
image-based event score (the average score of the suggested images). The results
show that the two scoring methods yield very similar results. None of the rated
events had a score of 1, while 65% to 73 % scored higher than 4. Although the
two reported scores were similar, the results show some variation. A higher image-
based score, for instance, reflects a limited event coverage despite the quality of
the suggested images (Figure 5.8). Conversely, a higher summary score reflects
wide coverage of the event (Figure 5.6). Still, the average summary score was
3.75, respectively 3.94, which reflects the effectiveness of our scoring approach and
Page 96
Figure 5.6 – Haldern Pop Festival - August 13-19, 2009 Summary. All of theimages were rated at 4.5 on average.
subsequently, the summarization technique.
0
20
40
60
80
100
120
1 2 3 4 5
num
ber
of ra
ted e
vents
score
Event summary scoreImages-based score
Figure 5.7 – Event summary vs image-based score distribution.
Detailed user statistics of the user study are presented in Table 5.1. The re-
sults show consistency between the images and the events score for each user.
Although the events scores ranged from 2 to 5 for most users, the average event
score was high. This suggests that our approach was able to present comprehensive
summaries for users, who may well have different requirements and expectations.
In Figure 5.9 we report the average scores for varying event cluster sizes. The
results show that the effectiveness of our technique increases with the size of event
Page 97
Figure 5.8 – Radiohead @ Victoria Park - June 24, 2008 Summary. The eventsummary was rated at 3 while the image based score was at 2.
Avg Image Avg Event Worst Event Best Event
score score rating rating
U1 4.06 4 2 5
U2 3.69 3.63 2 5
U3 3.97 3.85 3 5
U4 3.73 3.7 2 5
U5 4.38 4 2 5
U6 4.09 4 3 5
U7 3.66 3.72 2 5
U8 3.67 3.8 2 5
U9 3.34 3.31 2 5
U10 4.09 3.95 2 5
Mean 3.87 3.79 2.2 5
Table 5.1 – User-centric evaluation of the image relevance scores
clusters (i.e. the number of records) as more information is available. The results
also show that only a relatively small number of records is needed to generate a
representative summary of the event.
Figures 5.10 and 5.11 show the impact of the near duplicate pictures removal
step (Section 1.2). Duplicate images are removed within the summary and possibly
replaced by the next images in the ranked set of the selected images, thus providing
a wider and enhanced coverage of the event.
Page 98
2.8
2.9
3
3.1
3.2
3.3
3.4
3.5
6 7 8 9 Average
Avera
ge s
core
Event cluster size
Event summary scoreImages-based event score
Figure 5.9 – Average score per event cluster size
Figure 5.10 – An event Summary without duplicate pictures removal filter
Figure 5.11 – An event summary showing the impact of the duplicate picturesremoval filter
Building the Events K-NN Graph
In Figure 5.12, we report the mean average precision for varying values of k and
the number of hash functions used. The results show that MAP values increases
along with the number of hash functions used, as the number of generated collisions
increases. Similarly, the results show that the mean average precision increases
rapidly along with the number of Nearest Neighbors retrieved, to level out for
high values of k. In our experiments, the number of Nearest Neighbors retrieved
is relatively low resulting in a constant mean average precision for high values of
Page 99
k. In the following, unless otherwise stated, the number of hash tables used is 10.
0.015
0.02
0.025
0.03
0.035
0.04
0.045
0.05
0 50 100 150 200 250 300 350 400 450 500
Mea
nAve
rage
Precision
k
128 tables32 tables16 tables8 tables4 tables2 tables1 tables
Figure 5.12 – Mean Average Precision vs k
In Figure 5.13, we report the precision and recall curves for increasing values
of k. The results show that the recall increases rapidly along with the number
of Nearest Neighbors retrieved. Converserly, the overall precision decreases as the
number of retrieved neighbors increases. Overall, the reported results show a large
gap between precision and recall. Most importantly, Figure 5.13 show that the
recall increases twice as fast as the precision decreases. This suggests that higher
recall can be achieved without a significant loss in precision. In the following, we
study the impact of the selectivity of the hash functions used on both precision
and recall.
0.1
0.15
0.2
0.25
0.3
0.35
0.4
0.45
0.5
0.55
0.6
0 50 100 150 200 250 300 350 400 450 500k
RecallPrecision
Figure 5.13 – Recall and Precision vs k
Figure 5.14 shows the influence of the selectivity of the hash functions used on
the recall and precision. The results show that high recall values can be achieved
without a substantial loss in precision. Specifically, Figure 5.14a shows higher recall
Page 100
for decreasing values of M as as the selectivity of the hash functions decreases.
Similarly, Figure 5.15 shows higher recall for decreasing size of the hash functions
used as multiple buckets are merged.
0
0.1
0.2
0.3
0.4
0.5
0.6
0.7
0.8
10 20 30 40 50 60 70 80 90 100M
RecallPrecision
(a) Recall and Precision vs M parameter
0
0.1
0.2
0.3
0.4
0.5
0.6
0.7
0.8
12 13 14 15 16 17 18 19 20Hash Size
RecallPrecision
(b) Recall and Precision vs Hash Size(M = 50)
Figure 5.14 – Influence of the hash functions selectivity on the recall and precision
Figure 5.15, shows the combined effect on both recall and precision. Although
recall improved significantly, the achieved precision is sill low. In the following, we
fix the training parameter of RMMH to M = 10 and the Hash Size of the hash
functions used to 12 and study the impact of the filtering parameter on both recall
and precision.
0
0.1
0.2
0.3
0.4
0.5
0.6
0.7
0.8
12 13 14 15 16 17 18 19 20Hash Size
128 Recall128 Precision
Figure 5.15 – Recall and Precision vs Hash Size (M = 10)
Figure 5.16 shows the impact of the filtering parameter on both recall and
precision. By putting a threshold on the frequency collisions, our method achieves
higher precisions but at lower recall resulting in a better balance between precision
and recall.
Page 101
0
0.1
0.2
0.3
0.4
0.5
0.6
0.7
0.8
12 13 14 15 16 17 18 19 20taille du hach
128 Recall128 Precision
(a) t = 0
0
0.1
0.2
0.3
0.4
0.5
0.6
0.7
0.8
12 13 14 15 16 17 18 19 20taille du hach
RecallPrecision
(b) t = 1
0
0.1
0.2
0.3
0.4
0.5
0.6
0.7
0.8
12 13 14 15 16 17 18 19 20taille du hach
RecallPrecision
(c) t = 2
0.1
0.2
0.3
0.4
0.5
0.6
0.7
12 13 14 15 16 17 18 19 20taille du hach
RecallPrecision
(d) t = 4
0.1
0.15
0.2
0.25
0.3
0.35
0.4
0.45
0.5
0.55
12 13 14 15 16 17 18 19 20taille du hach
RecallPrecision
(e) t = 8
0
0.1
0.2
0.3
0.4
0.5
0.6
0.7
0.8
12 13 14 15 16 17 18 19 20
y
taille du hach
128 Recall128 Precision
(f) t = 16
Figure 5.16 – ROC curve for various collisions thresholds
Such performances are clearly acceptable from an application point of view as
shown in Figure 5.2. Overall, in the best case, our method is able to identify the
correct event with a 56% success rate and to suggest the correct event tag over 5
suggestions with a 92% success rate.
Table 5.2 – Suggestion rates
# of suggested events tag 1 2 3 4 5 6 7 8 9 10
Suggestion rate 0.56 0.75 0.84 0.88 0.89 0.9 0.91 0.9 0.91 0.92
4 Conclusion
Events in social media often have vast amounts of associated content. In order
to avoid overwhelming their users with too much information, social media sites
need to select and prioritize content.
In this chapter, we presented a new content-based filtering technique to select
high quality content. Unlike state-of-the-art methods, our record-based technique
provides an objective evaluation of moments of interest during social events. A
user-centric evaluation revealed that some users tend to prefer stage photos while
others see more value in more diversified content. Overall, the proposed technique
Page 102
has performed well, reporting the most captured moments for a set of users. We
argue that such information can be used to characterize communities of users, and
more generally, social networks.
Page 104
Chapitre 6
Related Work
This chapter reviews the literature that is relevant to this dissertation. Sec-
tion 1 describes efforts on event identification in social media related to the event
retrieval task presented in Chapter 3. Section 2 discusses related research on or-
ganizing and presenting social media content, including content suggestion and
summarization, which we addressed in Chapter 5. Section 3 and Section 4 res-
pectively, provide an overview of approximate nearest neighbors search techniques
and large-scale k-Nearest Neighbors Graph construction that we considered for
the event graph construction framework presented in Chapter 4.
1 Event Identification in Social Media
While earlier studies aiming at event discovery were based solely on text analy-
sis and essentially focused on news documents [61, 63], more recent work on social
media has been able to take advantage of richer multimedia content, while having
to cope with the challenges that such a benefit entails.
In [4], the authors present a clustering framework to group images based firstly
on geographical coordinates and then visual features to depict different views of
the same scene. Similarly, in [77], a framework to detect landmarks and events to
improve the user browsing and retrieval experience is proposed. The work presen-
87
Page 105
ted in [36] attempts to identify public events by using both the spatio-temporal
context and photo content. Although these methods performed well on real word
datasets, their scope remains conceptually limited due to the properties of the
EXIF data, which considerably restricts query formulation. Moreover, despite the
fact that such properties are becoming more widespread, they are far from being
universally available, notably in professional devices, or removed (such as for Fli-
ckr and Facebok).
Several recent studies have tried to compensate for such missing information. For
instance, [11] presents a classifier-based method, where items that are geotagged
are used to build a set of initial clusters that correspond to events. The items of
each identified cluster are then used to train a classifier that augments each cluster
with non-geotagged items. More recent work also extended item description with
information from user-supplied tags along with external data sources and APIs
such as the Google MAP API. In [82], the authors make the assumption that all
items that have been uploaded by the same user in the same day belong to the
same event. Such heuristics make sense. However, their use may introduce some
bias in return.
Other related efforts have used some online sources to retrieve structure infor-
mation that is related to an event. The work of [91] exploited the user context
to annotate the images according to four event related facets (where, when, who,
what) by a graph model that uses the Wordnet [71] ontology. In [99], a sequence of
clustering and filtering operations is applied. The textual, temporal and location
features are first used to cluster images. The resulting clusters are then filtered with
regard to the temporal, location and textual constraints. A visual classifier is then
used to filter clusters. This final step, however, requires manual labeling of images.
Similarly, in [66], the authors propose an approach that builds a classifier using
explicit event descriptions from online catalogues and performs post-processing
on the visual features to clean the classified data. In [76], the clustering step is
based solely on the location and temporal information. Each event produced by
the clustering step is then enriched by making use of the metadata of the photos
Page 106
associated with it, including pictures by the same users or within a fixed radius
of the venue. In [67], the description of events and their associated multimedia
items is retrieved from structured online sources and expressed using the LODE
[90] and Media Ontology respectively. Here, multimedia documents that contain
specific machine tags are used to train classifiers which are then used to prune
results from general textual queries. Although ontologies provide a common des-
cription of real world-events, their practical use is still limited by the number of
searchable properties as well as the lexical ambiguity of textual based queries. In
[82], the authors introduce an approach to detect photos belonging to the same
event which are distributed between several friends and albums in Facebook using
visual, tag-based, friendship-based and structural-based features.
In general, many of the approaches that have been proposed to tackle the problem
of event identification in multimedia collections have used some form of online
source to retrieve structured information that is related to either the event or
media. While this is acceptable if it leads to an enhancement of the results, it
may not always be possible as most social events do not have a formal description
in some online source. Therefore such methods should only be used for pruning
results. Although some of these efforts make use of certain visual properties, very
few rely primarily on visual features. Our work differs in that it essentially relies
on visual features to identify event-related items while incorporating additional
external information when such information is available.
2 Event summarization
In the computer vision community, [96] and [72] provide an extensive review
of key-frame extraction and video summarization. In [56], broadcasted videos of
a an entire basketball season in the USA and the corresponding metadata are
used to create summary videos from different aspects, like summaries of the whole
championship, of only one team or even a single player. In [33], the authors present
an approach for summarizing rushes video based on the detection of repetitive
Page 107
sequences, using a variant of the Smith-Waterman algorithm to find matching
subsequences.
Other recent efforts have addressed the problem of presenting and summarizing
web images. In [98], the authors create a “picture collage”, a bidimensional spatial
arrangement of the input that maximizes the visibility of salient regions. Rother
et al. [84] summarize a set of images with a “digital tapestry”. A large output
of images is produced, stitching together salient and spatially compatible blocks
from the input image set. In both cases, however, the set of images to appear has
already been selected, and the visual layout is to be determined.
In social media, early work focused on extracting quality Twitter messages
[25, 30] and summarizing or otherwise presenting Twitter event content [6], an
effort related to ours but using fundamentally different data. In [25, 30], the authors
analyzed Twitter messages corresponding to large-scale media events to improve
event analytics and visualization. In [6], Becker et al. address the problem of
selecting tweets with regard to quality, relevance and usefulness.
Selecting the most representative social media documents from large collections
of social media documents is becoming a prominent issue in the multimedia com-
munity. Early work focused solely on metadata associated to media [21, 47, 88, 59].
In [29], the authors make use of community annotations, such as ratings and the
number of views, to produce video summaries of social events using both video
and image content.
In [21] a hierarchy of images is constructed using only textual caption data, and
the concept of subsumption. Jaffe et al. [47] summarize a set of images using only
tags and geotags. Here, the authors use the correlations between geotags and tags
to produce "tag maps", where tags and related images are placed on a geographic
map at a scale corresponding to the range over which the tag appears. In [88], the
author, relies on Flickr tags, which are typically noisier and less informative than
captions. All of these approaches could be used to further organize our summaries.
However, none of them take advantage of the visual information in the images to
fill in for bad or missing metadata. Hence, in [59], the authors propose a method
Page 108
to generate representative views of landmarks by diversifying image features and
user tags.
Content summarization, however, turns out to be a very subjective process. In
[87], Savakis et al. show that selecting personal photos from a collection depends
greatly on user-preferences. In [93], Sinha et al. address the problem of summari-
zing personal photos present in web archives or personal storages with high qua-
lity, diversity and coverage constraints. Here, the authors reduce the problem of
selecting images from photo collections to an optimization problem under quality,
diversity and coverage constraints. A framework, based on spatial patterns, for
automatically selecting a summary set of photographs from a large collection of
geo-referenced photos is presented in [47]. Here, the authors make the assumption
that more photographs are taken at locations that provide views of some inter-
esting object or landmark by a large number of photographers. Although these
efforts make use of certain visual properties, very few make use of the social media
information associated to media, such as tags of individuals [82] and ownership
[94].
More generally, research on content selection, and event summarization has
benefited from recent work on event identification and retrieval in social media.
In a notable effort, Liu et al. present a method combining semantic inferencing
and visual analysis to automatically find media (photos and videos) illustrating
events. In [94] , we presented a new visual-based technique for retrieving events
in photo collections, typically in the context of User Generated Content. Given a
query event record, represented by a set of photos, the proposed method aims to
retrieve other records of the same event, typically generated by distinct users. One
advantage of this approach is that it essentially relies on visual features to match
records of the same event while incorporating additional external information when
such information is available.
Page 109
3 Large-scale k-NN Graph construction
Initially, the K-NNG problem can be seen as a nearest neighbors search pro-
blem where each data point itself is issued as a query. The brute-force approach,
consisting of N exhaustive scans of the whole dataset, has the cost O(N2). Its
practical usage is therefore limited to very small datasets. Building an index and
iteratively processing the N items in the dataset with approximate Nearest Neigh-
bors search techniques is an alternative option that might be more efficient (Section
4).
In addition to the usual approximate Nearest Neighbors search methods, some
recent studies focus more specifically on the K-NNG construction problem as a
whole, i.e. not by processing iteratively and independently the N top-K queries,
but by trying to exploit shared operations across all queries. In the text retrieval
community, recent studies [5, 107] focused on the ǫ-NNG construction in which one
is only interested in finding pairs whose similarity exceeds a predefined threshold.
In [107], the authors present a permutation based approach both to filter candi-
date pairs and to estimate the similarity between vectors. However, their approach
is only applicable on sparse vectors. Very recently, Dong et al. [31], proposed the
NN-Descent algorithm, an approximate K-NNG construction method purely ba-
sed on query expansion operations and applicable to any similarity measure. The
algorithm starts by picking an approximation of K-NN for each object, it itera-
tively improves that approximation by comparing each object against its current
neighbors’ neighbors, and then stops when no improvement can be made. Their
experiments show that their approach is more efficient than other state-of-the-art
approaches. However, designing an efficient distributed version of this method is
not trivial, limiting its practical scalability as it requires the entire dataset to be
loaded into a centralized memory. A comparison with their results was provided
in Chapter 4.
Page 110
4 Nearest Neighbors search
Early tree-based indexing methods for Nearest Neighbors (NN) search such as
R-tree [43], SR-tree [57], M-tree [20] or more recently cover-tree [9] return accurate
results, but they are not time efficient for data with high dimensionality [100].
4.1 Curse of dimensionality
A particular but well-studied case of the nearest neighbor search problem is in
the Euclidian space where the data lives in a d-dimensional space Rd under the
Euclidean distance function.
When d = 1, predecessors queries can be used to efficiently perform nearest
neighbour queries. A straightforward but efficient solution is to sort the data at
indexing time, and then, perform a binary search at query time. This achieves
linear spacey and polylograithmic time complexity.
The d = 2 case leads to one of the most classical structures in computational
geometry, the Voronoi diagram[26]. Here, the plane is partitioned into polygonal
regions, each representing the set of points that are closer to a point from the
dataset to any other point from the dataset. At query time, one just need to
locate the region containing a given query.
While the latter approach achieves O(n) and O(n log(n)) space and time com-
plexity, respectively, its generalisation have O(n[d/2]) space complexity. In practice,
such a space bound is impractical for datasets of a few million points for d ≥ 3.
Several data structures have been proposed for low values of d. Kd-trees, in-
troduced were first such structure in 1975 by Bentley et al. [8]. In [35], such a
structure is used to accelerate k-nearest neighbour queries using ball-rectangle in-
tersection tests. Ever since, many approximate NN methods were then proposed
including randomized kd-trees [92], hierarchical k-means [73] or approximate spill-
trees [65, 50]. Although these methods provided little improvement over a linear
time algorithm that compares a query to each point from the database, they are
Page 111
not time efficient for data with high dimensionality [100].
Since, several approaches have been proposed to overcome space and time
limitations using approximation. One of the most popular approximate nearest
neighbor is LSH. In that formulation, we are no longer interested in the exact
k-nearest neighbors trading accuracy for time and space efficiency.
4.2 Approximate similarity search
Approximate nearest-neighbor algorithms have been shown to be an interesting
way of dramatically improving the search speed, and are often a necessity [106, 19]
Locality-Sensitive Hashing
One of the most popular approximate nearest neighbor search algorithms used
in multimedia applications is Locality-Sensitive Hashing (LSH) [37, 46]. The basic
method uses a family of locality-sensitive hash functions composed of linear pro-
jections over randomly selected directions in the feature space. The principle is
that nearby objects are hashed into the same hash bucket with a high probability,
for at least one of the hash functions used. LSH has achieved very good time effi-
ciency for high dimensional features and has been successfully applied in several
multimedia applications including visual local features indexing [58], songs inter-
section [14] or 3D object indexing [70]. Following this success, hashing methods
have been gaining increasing interest.
Multi-Probe LSH
One drawback of the basic scheme is that, in practice, it requires a large num-
ber of hash tables (L) to achieve good search accuracy. In [74], Panigrahy et al.
proposed an entropy-based LSH scheme to reduce the number of hash tables requi-
red by using both the original query point and randomly perturbed nearby points
as additional queries.
Page 112
To make better use of a smaller number of hash tables, Lv, et al. [68] not
only considers the bucket pointed by the query point, but also examines “nearby”
buckets. Here, instead of perturbed query objects, the authors generates pertur-
bed hash tables. However, this method still suffers from the need of building hash
tables at different radiuses in order to achieve good search accuracy.
Whereas the latter are based on the simple likelihood criterion that a given bu-
cket contains query results, in [54], the authors define a more reliable a posteriori
probabilistic model taking account some prior about the queries and the searched
objects. This prior knowledge allows a more accurate selection of buckets to be
probed.
So far, hashing techniques are categorised into two groups : Data inde-
pendent hashing functions in which the hashing function family is defined
uniquely and independently from the data to be processed [18, 83, 89, 48] and more
recently in [52] and [51], and data dependent hashing functions in which the
hash functions rely on some features sampled in the dataset [101, 60, 78, 86, 55].
Efficiency improvements of data dependent methods over independent ones have
been shown in several studies [49, 101, 86, 55]. RMMH [55], the family used in
this work, was designed to overcome two limitations of previous data dependent
methods : (i) it is usable for any Mercer Kernel (ii) it produces more independent
hashing functions.
Whereas most of the latter approaches have tackled the approximate nea-
rest neighbours problem in the euclidian space some recent work addressed the
problem using x2 distance which is believed to achieve better results in image
retrieval context. In [41, 40], the authors present a new LSH scheme adapted to
x2 distance for approximate nearest neighbours search in high-dimensional spaces
that achieves better accuracy than euclidean scheme for an equivalent speed, or
Page 113
equivalent accuracy but with a high gain in terms of processing speed.
Recently, there have been several efforts to improve the load balancing of the
generated hash functions. For unsupervised hashing, principled linear projections
like PCA Hashing (PCAH) [97] and its rotational variant [39] were suggested for
better quantization rather than random projections. Nevertheless, only a few or-
thogonal projections are good for quantization as the variances of data usually de-
cay rapidly, as pointed out by [97]. In [45], the authors present a novel hypersphere-
based hashing function, spherical hashing, to map more spatially coherent data
points into a binary code compared to hyperplane-based hashing functions. In-
tuitively, hyperspheres provide much stronger power in defining a tighter closed
region in the original data space than hyperplanes. For example, while d + 1 hy-
perplanes are needed to define a closed region for a d-dimensional space, a single
hypersphere can form such a closed region even in an arbitrarily high dimensional
space.
Page 114
Conclusion
Summary of Contributions
As people continue to author and share event-related content in social media,
the opportunity for leveraging such information increases. Social media web sites
such as Flickr and Facebook, provide a playground not only for people to publish
their content but also for applications that build on these useful sources of infor-
mation. While some of event related content might be interesting and useful, a
considerable amount might be of little value to people, ultimately impacting the
user experience.
In this dissertation, we presented a visual-based event matching paradigm
which serves as a stepping stone for various applications that build on events,
and their associated documents, in social media. In Chapter 3, we addressed the
problem of identifying events in social media web sites. By linking different oc-
currences of the same event, we can annotate the query with tags from previously
identified and/or annotated occurrences. Ultimately, linking different occurrences
of the same event would enable rich search and browsing of social media events
content. Specifically, linking all the occurrences of the same event would provide
a general overview and description of the event.
To avoid overwhelming applications, or users, with unmanageable volumes of
event-related content, we presented a new collaborative content-based filtering
97
Page 115
technique for selecting quality documents for a given event (Chapter 5). Sub-
sequently, we addressed the more specific problems of event summarization and
content suggestion in social media.
To improve our content selection framework, we developed a scalable and dis-
tributed framework for k-Nearest Neighbors Graph construction (Chapter 4) based
on RMMH. Our work provides some evidence that balancing issues explain the
low performances obtained with a classical LSH-based approach for approximating
K-NN graphs. It also shows that using alternative new hash functions that handle
hash tables uniformity can definitely change those conclusions. We finally descri-
bed a distributable implementation of our method under a MapReduce framework
and further improved the load balancing of this scheme through a split local join
strategy to accommodate memory requirements.
Future Work
Identifying communities
By linking different occurrences of the same event, we can identify communities
of users who share a comment interest in a specific event or a particular group of
events, ultimately extending the event experience and allowing users to socialize
and share their experience.
Collaborative event recommendation
Obviously, people attending the same event are likely to have similar tastes
and preferences. By connecting users accordingly, we can discover more complex
relationships between users, as well as the events themselves. A user graph could
for instance be obtained straightforwardly from our event records graph.
Page 116
A dedicated framework for k-NN Graph Construction
The k-NN graph construction framework developed in this dissertation (Section
3) is at the core of our content suggestion and event identification techniques.
Although the technique presented is scalable, the Hadoop-based implemen-
tation suffers from some technical limitations. Most importantly, the C++ API
requires data to be serialized in order to be sent to and from the mappers res-
pectively, the reducers. A dedicated framework would allow data to be handled
natively, hence, improving the overall performance.
Further work remains to be carried out on automatic parameters tuning and
varying hash sizes through a rigorous theoretical analysis of our method. Other
perspectives include : query expansion strategies, hash functions evaluation and
metadata management.
Finally, the technique presented could extend a large pool of existing graph and
network analysis methods to large datasets without an explicit graph structure.
Further work will be carried out towards extending our framework to support
large-scale data mining techniques.
Distributed event records Graph construction
So far, we have presented a scalable framework for k-NN Graph Construc-
tion. However, the event records Graph construction, from the image similarity
graph, is still centralized. A short-term perspective of this work is to distribute
the construction of the event records Graph.
New record similarity metrics
So far, we have only considered the use of temporal meta-data, taking into
account the fact that spatial information is rarely available. Further work should
be carried out to include additional, more abundant meta-data such as textual
annotations.
Page 118
Bibliographie
[1] G. Adomavicius and A. Tuzhilin. Toward the next generation of recommen-
der systems : A survey of the state-of-the-art and possible extensions. IEEE
Trans. on Knowl. and Data Eng., 17 :734–749, June 2005.
[2] J. Allan, editor. Topic detection and tracking : event-based information or-
ganization. Kluwer Academic Publishers, Norwell, MA, USA, 2002.
[3] J. Allan, J. Carbonell, G. Doddington, J. Yamron, and Y. Yang. Topic
detection and tracking pilot study : Final report. In Proceedings of the
DARPA Broadcast News Transcription and Understanding Workshop, pages
194–218, Lansdowne, VA, USA, Feb. 1998. 007.
[4] Y. Avrithis, Y. Kalantidis, G. Tolias, and E. Spyrou. Retrieving landmark
and non-landmark images from community photo collections. In Proceedings
of the international conference on Multimedia, MM ’10, pages 153–162, New
York, NY, USA, 2010. ACM.
[5] R. J. Bayardo, Y. Ma, and R. Srikant. Scaling up all pairs similarity search.
In Proceedings of the 16th international conference on World Wide Web,
WWW ’07, pages 131–140, New York, NY, USA, 2007. ACM.
[6] H. Becker, M. Naaman, and L. Gravano. Selecting quality twitter content
for events. In L. A. Adamic, R. A. Baeza-Yates, and S. Counts, editors,
ICWSM. The AAAI Press, 2011.
[7] J. Benois-Pineau, F. Precioso, and M. Cord. Visual indexing and retrieval.
Springer, 2012.
101
Page 119
[8] J. L. Bentley. Multidimensional binary search trees used for associative
searching. Commun. ACM, 18(9) :509–517, Sept. 1975.
[9] A. Beygelzimer, S. Kakade, and J. Langford. Cover trees for nearest neigh-
bor. In conf. on Machine learning, pages 97–104, New York, NY, USA,
2006.
[10] O. Boiman, E. Shechtman, and M. Irani. In defense of nearest-neighbor
based image classification. Computer Vision and Pattern Recognition, IEEE
Computer Society Conference on, 0 :1–8, 2008.
[11] M. Brenner and E. Izquierdo. Mediaeval benchmark : Social event detection
in collaborative photo collections. In Larson et al. [62].
[12] M. R. Brito, E. L. Chávez, A. J. Quiroz, and J. E. Yukich. Connectivity
of the mutual k-nearest-neighbor graph in clustering and outlier detection.
Statistics & Probability Letters, 35(1) :33–42, Aug. 1997.
[13] R. Casati and A. Varzi. Events. In E. N. Zalta, editor, The Stanford Ency-
clopedia of Philosophy. Spring 2010 edition, 2010.
[14] M. Casey and M. Slaney. Song intersection by approximate nearest neigh-
bour search. In Proc. Int. Symp. on Music Information Retrieval, pages
2161–2168, 2006.
[15] M. S. Charikar. Similarity estimation techniques from rounding algorithms.
In Proceedings of the thiry-fourth annual ACM symposium on Theory of
computing, STOC ’02, pages 380–388, New York, NY, USA, 2002. ACM.
[16] J. Chen, H.-r. Fang, and Y. Saad. Fast approximate knn graph construction
for high dimensional data via recursive lanczos bisection. J. Mach. Learn.
Res., 10 :1989–2012, Dec. 2009.
[17] J. Chen, H. ren Fang, and Y. Saad. Fast approximate knn graph construction
for high dimensional data via recursive lanczos bisection. Journal of Machine
Learning Research, 10 :1989–2012, 2009.
[18] O. Chum, J. Philbin, and A. Zisserman. Near duplicate image detection :
min-hash and tf-idf weighting. In Proceedings of the British Machine Vision
Conference, 2008.
Page 120
[19] P. Ciaccia and M. Patella. Pac nearest neighbor queries : Approximate and
controlled search in high-dimensional and metric spaces. In Data Enginee-
ring, 2000. Proceedings. 16th International Conference on, pages 244 –255,
2000.
[20] P. Ciaccia, M. Patella, and P. Zezula. M-tree : An efficient access method for
similarity search in metric spaces. In Int. Conf. on Very Large Data Bases,
pages 426–435, 1997.
[21] P. Clough. Automatically organising images using concept hierarchies. In
Proc. SIGIR Workshop on Multimedia Information Retrieval, 2005.
[22] T. Condie, N. Conway, P. Alvaro, J. M. Hellerstein, K. Elmeleegy, and
R. Sears. MapReduce Online. Technical Report UCB/EECS-2009-136,
EECS Department, University of California, Berkeley, Oct 2009.
[23] P. Cunningham and M. Cord. Machine Learning Techniques for Multimedia.
Springer, 2008.
[24] M. Datar and P. Indyk. Locality-sensitive hashing scheme based on p-stable
distributions. In In SCG’04 : Proceedings of the twentieth annual symposium
on Computational geometry, pages 253–262. ACM Press, 2004.
[25] E. F. C. David A. Shamma, Lyndon Kennedy. Statler : Summarizing media
through short-messaging services. In CSCW’10, 2010.
[26] M. de Berg, M. van Kreveld, M. Overmars, and O. Schwarzkopf. Compu-
tational Geometry : Algorithms and Applications. Springer-Verlag, second
edition, 2000.
[27] J. Dean and S. Ghemawat. Mapreduce : simplified data processing on large
clusters. In Proceedings of the 6th conference on Symposium on Opearting
Systems Design & Implementation - Volume 6, pages 10–10, Berkeley, CA,
USA, 2004. USENIX Association.
[28] J. Dean and S. Ghemawat. Mapreduce : simplified data processing on large
clusters. Commun. ACM, 51 :107–113, January 2008.
[29] M. Del Fabro, A. Sobe, and L. Böszörmenyi. Summarization of real-life
events based on community-contributed content. In P. Davies and D. Newell,
Page 121
editors, Proceedings of the Fourth International Conferences on Advances in
Multimedia (MMEDIA 2012), pages 119–126, France, apr 2012. IARIA.
[30] N. Diakopoulos, M. Naaman, and F. Kivran-Swaine. Diamonds in the rough :
Social media visual analytics for journalistic inquiry. In Visual Analytics
Science and Technology (VAST), 2010 IEEE Symposium on, pages 115 –
122, oct. 2010.
[31] W. Dong, M. Charikar, and K. Li. Efficient k-nearest neighbor graph
construction for generic similarity measures. In Proceedings of the 20th in-
ternational conference on World wide web, WWW ’11, pages 577–586, New
York, NY, USA, 2011. ACM.
[32] W. Dong, Z. Wang, W. Josephson, M. Charikar, and K. Li. Modeling lsh
for performance tuning. In Proceedings of the 17th ACM conference on
Information and knowledge management, CIKM ’08, pages 669–678, New
York, NY, USA, 2008. ACM.
[33] E. Dumont and B. Merialdo. Rushes video summarization and evaluation.
Multimedia Tools and Applications, Springer, Vol.48, Ną1, May 2010, 05
2010.
[34] M. Ferecatu. Image retrieval with active relevance feedback using both visual
and keyword-based descriptors. PhD thesis, Université de Versailles Saint-
Quentin-en-Yvelines, jul 2005.
[35] J. H. Friedman, J. L. Bentley, and R. A. Finkel. An algorithm for finding best
matches in logarithmic expected time. ACM Trans. Math. Softw., 3(3) :209–
226, Sept. 1977.
[36] M. Gao, X.-S. Hua, and R. Jain. Wonderwhat : real-time event determination
from photos. In Proceedings of the 20th international conference companion
on World wide web, WWW ’11, pages 37–38, New York, NY, USA, 2011.
ACM.
[37] A. Gionis, P. Indyk, and R. Motwani. Similarity search in high dimensions
via hashing. In Int. Conf. on Very Large Data Bases, pages 518–529, 1999.
Page 122
[38] A. Gionis, P. Indyk, and R. Motwani. Similarity search in high dimensions
via hashing. In Proceedings of the 25th International Conference on Very
Large Data Bases, VLDB ’99, pages 518–529, San Francisco, CA, USA, 1999.
Morgan Kaufmann Publishers Inc.
[39] Y. Gong, S. Lazebnik, A. Gordo, and F. Perronnin. Iterative quantization :
A procrustean approach to learning binary codes for large-scale image re-
trieval. Pattern Analysis and Machine Intelligence, IEEE Transactions on,
PP(99) :1, 2012.
[40] D. Gorisse, M. Cord, and F. Precioso. Salsas : Sub-linear active learning
strategy with approximate k-nn search. Pattern Recognition, 44(10) :2343–
2357, 2011.
[41] D. Gorisse, M. Cord, and F. Precioso. Locality-sensitive hashing for chi2
distance. Pattern Analysis and Machine Intelligence, IEEE Transactions
on, 34(2) :402–409, 2012.
[42] R. Grishman. The impact of task and corpus on event extraction systems.
In N. C. C. Chair), K. Choukri, B. Maegaard, J. Mariani, J. Odijk, S. Piperi-
dis, M. Rosner, and D. Tapias, editors, Proceedings of the Seventh Internatio-
nal Conference on Language Resources and Evaluation (LREC’10), Valletta,
Malta, may 2010. European Language Resources Association (ELRA).
[43] A. Guttman. R-trees : A dynamic index structure for spatial searching. In
ACM SIGMOD Conf. of Management of Data, pages 47–57, 1984.
[44] P. Haghani, S. Michel, P. Cudré-Mauroux, and K. Aberer. Lsh at large -
distributed knn search in high dimensions. In WebDB, 2008.
[45] J.-P. Heo, Y. Lee, J. He, S.-F. Chang, and S.-E. Yoon. Spherical hashing.
In CVPR, pages 2957–2964, 2012.
[46] P. Indyk and R. Motwani. Approximate nearest neighbors : towards remo-
ving the curse of dimensionality. In Proceedings of the thirtieth annual ACM
symposium on Theory of computing, STOC ’98, pages 604–613, New York,
NY, USA, 1998. ACM.
Page 123
[47] A. Jaffe, M. Naaman, T. Tassa, and M. Davis. Generating summaries for
large collections of geo-referenced photographs. In Proceedings of the 15th
international conference on World Wide Web, WWW ’06, pages 853–854,
New York, NY, USA, 2006. ACM.
[48] H. Jegou, M. Douze, and C. Schmid. Hamming embedding and weak geo-
metric consistency for large scale image search. In Proceedings of the 10th
European Conference on Computer Vision : Part I, ECCV ’08, pages 304–
317, Berlin, Heidelberg, 2008. Springer-Verlag.
[49] H. Jégou, M. Douze, and C. Schmid. Product quantization for nearest neigh-
bor search. IEEE Transactions on Pattern Analysis & Machine Intelligence,
2010. to appear.
[50] H. Jegou, M. Douze, and C. Schmid. Product quantization for nearest neigh-
bor search. IEEE Trans. Pattern Anal. Mach. Intell., 33(1) :117–128, Jan.
2011.
[51] H. Jégou, T. Furon, and J.-J. Fuchs. Anti-sparse coding for approximate
nearest neighbor search. CoRR, abs/1110.3767, 2011.
[52] J. Ji, J. Li, S. Yan, B. Zhang, and Q. Tian. Super-bit locality-sensitive
hashing. In P. Bartlett, F. Pereira, C. Burges, L. Bottou, and K. Weinberger,
editors, Advances in Neural Information Processing Systems 25, pages 108–
116. 2012.
[53] A. Joly and O. Buisson. A Posteriori Multi-Probe Locality Sensitive Ha-
shing. In ACM International Conference on Multimedia (MM’08), pages
209–218, Vancouver, British Columbia, Canada, oct 2008.
[54] A. Joly and O. Buisson. A posteriori multi-probe locality sensitive hashing.
In Proceedings of the 16th ACM international conference on Multimedia,
MM ’08, pages 209–218, New York, NY, USA, 2008. ACM.
[55] A. Joly and O. Buisson. Random maximum margin hashing. In The
24th IEEE Conference on Computer Vision and Pattern Recognition, CVPR
2011, Colorado Springs, CO, USA, 20-25 June 2011, pages 873–880. IEEE,
2011.
Page 124
[56] R. Kaiser, M. Hausenblas, and M. Umgeher. Metadata-driven interactive
web video assembly. Multimedia Tools and Applications, 41(3) :437–467,
2009-02-01.
[57] N. Katayama and S. Satoh. The sr-tree : An index structure for high-
dimensional nearest neighbor queries. In ACM SIGMOD Int. Conf. on Ma-
nagement of Data, pages 369–380, 1997.
[58] Y. Ke, R. Sukthankar, L. Huston, Y. Ke, and R. Sukthankar. Efficient near-
duplicate detection and sub-image retrieval. In In ACM Multimedia, pages
869–876, 2004.
[59] L. S. Kennedy and M. Naaman. Generating diverse and representative image
search results for landmarks. In Proceedings of the 17th international confe-
rence on World Wide Web, WWW ’08, pages 297–306, New York, NY, USA,
2008. ACM.
[60] B. Kulis and K. Grauman. Kernelized locality-sensitive hashing for scalable
image search. In IEEE Int. Conf. on Computer Vision (ICCV, 2009.
[61] G. Kumaran and J. Allan. Text classification and named entities for new
event detection. In Proceedings of the 27th annual international ACM SIGIR
conference on Research and development in information retrieval, SIGIR ’04,
pages 297–304, New York, NY, USA, 2004. ACM.
[62] M. Larson, A. Rae, C.-H. Demarty, C. Kofler, F. Metze, R. Troncy, V. Me-
zaris, and G. J. F. Jones, editors. Working Notes Proceedings of the MediaE-
val 2011 Workshop, Santa Croce in Fossabanda, Pisa, Italy, September 1-2,
2011, volume 807 of CEUR Workshop Proceedings. CEUR-WS.org, 2011.
[63] Z. Li, B. Wang, M. Li, and W.-Y. Ma. A probabilistic model for retrospective
news event detection. In Proceedings of the 28th annual international ACM
SIGIR conference on Research and development in information retrieval,
SIGIR ’05, pages 106–113, New York, NY, USA, 2005. ACM.
[64] K. Ling and G. Wu. Frequency based locality sensitive hashing. In Mul-
timedia Technology (ICMT), 2011 International Conference on, pages 4929
–4932, july 2011.
Page 125
[65] T. Liu, A. W. Moore, A. Gray, and K. Yang. An investigation of practical
approximate nearest neighbor algorithms. pages 825–832. MIT Press, 2004.
[66] X. Liu, B. Huet, and R. Troncy. Eurecom @ mediaeval 2011 social event
detection task. In Larson et al. [62].
[67] X. Liu, R. Troncy, and B. Huet. Using social media to identify events.
In Proceedings of the 3rd ACM SIGMM international workshop on Social
media, WSM ’11, pages 3–8, New York, NY, USA, 2011. ACM.
[68] Q. Lv, W. Josephson, Z. Wang, M. Charikar, and K. Li. Multi-access lsh :
efficient indexing for high-dimensional similarity search. In Proceedings of
the 33rd international conference on Very large data bases, VLDB ’07, pages
950–961. VLDB Endowment, 2007.
[69] Q. Lv, W. Josephson, Z. Wang, M. Charikar, and K. Li. Multi-probe lsh :
Efficient indexing for high-dimensional similarity search. In VLDB, pages
950–961, 2007.
[70] M.-B. Matei, S. M.-Y. Shan, M.-H. S. Sawhney, S. M.-Y. Tan, M.-R. Kumar,
M.-D. Huber, and M.-M. Hebert. Rapid object indexing using locality sensi-
tive hashing and joint 3d-signature space estimation. IEEE Trans. Pattern
Anal. Mach. Intell., 28(7) :1111–1126, 2006.
[71] G. A. Miller, R. Beckwith, C. Fellbaum, D. Gross, and K. J. Miller. Intro-
duction to WordNet : an on-line lexical database. International Journal of
Lexicography, 3(4) :235–244, 1990.
[72] A. G. Money and H. Agius. Video summarisation : A conceptual frame-
work and survey of the state of the art. J. Vis. Comun. Image Represent.,
19(2) :121–143, Feb. 2008.
[73] M. Muja and D. G. Lowe. Fast approximate nearest neighbors with auto-
matic algorithm configuration. In VISAPP (1), pages 331–340, 2009.
[74] R. Panigrahy. Entropy based nearest neighbor search in high dimensions. In
Proceedings of the seventeenth annual ACM-SIAM symposium on Discrete
algorithm, SODA ’06, pages 1186–1195, New York, NY, USA, 2006. ACM.
Page 126
[75] S. Papadopoulos, R. Troncy, V. Mezaris, B. Huet, and I. Kompatsiaris. Social
event detection at mediaeval 2011 : Challenges, dataset and evaluation. In
MediaEval 2011 Workshop, Pisa, Italy, 09/2011 2011.
[76] S. Papadopoulos, C. Zigkolis, Y. Kompatsiaris, and A. Vakali. Certh @
mediaeval 2011 social event detection task. In Larson et al. [62].
[77] S. Papadopoulos, C. Zigkolis, Y. Kompatsiaris, and A. Vakali. Cluster-based
landmark and event detection for tagged photo collections. IEEE MultiMe-
dia, 18(1) :52–63, Jan. 2011.
[78] L. Paulevé, H. Jégou, and L. Amsaleg. Locality sensitive hashing : A compa-
rison of hash function types and querying mechanisms. Pattern Recognition
Letters, 31(11) :1348 – 1358, 2010.
[79] J. Philbin, O. Chum, M. Isard, J. Sivic, and A. Zisserman. Object retrieval
with large vocabularies and fast spatial matching. In IEEE Conference on
Computer Vision and Pattern Recognition, 2007.
[80] J. Philbin and A. Zisserman. Object mining using a matching graph on very
large image collections. In Proceedings of the 2008 Sixth Indian Conference
on Computer Vision, Graphics & Image Processing, ICVGIP ’08, pages 738–
745, Washington, DC, USA, 2008. IEEE Computer Society.
[81] T. Pitoura, N. Ntarmos, and P. Triantafillou. Replication, load balancing,
and efficient range query processing in dht data networks. In 10th Interna-
tional Conference on Extending Database Technology (EDBT 2006), March
2006.
[82] M. Rabbath, P. Sandhaus, and S. Boll. Analysing facebook features to sup-
port event detection for photo-based facebook applications. In Proceedings
of the 2nd ACM International Conference on Multimedia Retrieval, ICMR
’12, pages 11 :1–11 :8, New York, NY, USA, 2012. ACM.
[83] M. Raginsky and S. Lazebnik. Locality-sensitive binary codes from shift-
invariant kernels. In Y. Bengio, D. Schuurmans, J. D. Lafferty, C. K. I.
Williams, and A. Culotta, editors, NIPS, pages 1509–1517. Curran Asso-
ciates, Inc., 2009.
Page 127
[84] C. Rother, S. Kumar, V. Kolmogorov, and A. Blake. Digital tapestry. In
Proceedings of the 2005 IEEE Computer Society Conference on Computer
Vision and Pattern Recognition (CVPR’05) - Volume 1 - Volume 01, CVPR
’05, pages 589–596, Washington, DC, USA, 2005. IEEE Computer Society.
[85] M. Sahami and T. D. Heilman. A web-based kernel function for measuring
the similarity of short text snippets. In Proceedings of the 15th international
conference on World Wide Web, WWW ’06, pages 377–386, New York, NY,
USA, 2006. ACM.
[86] R. Salakhutdinov, A. Mnih, and G. Hinton. Restricted boltzmann machines
for collaborative filtering. In ICML ’07 : Proceedings of the 24th Int. Conf.
on Machine learning, pages 791–798, New York, NY, USA, 2007. ACM.
[87] A. E. Savakis, S. P. Etz, and E. C. Loui. In proceedings spie human vision
and electronic imaging v, jan. 2000. evaluation of image appeal in consumer
photography.
[88] P. Schmitz. Inducing ontology from Flickr tags. In Proc. of the Collaborative
Web Tagging Workshop (WWW ’06), May 2006.
[89] G. Shakhnarovich, T. Darrell, and P. Indyk. Nearest-Neighbor Methods in
Learning and Vision : Theory and Practice. MIT Press, 2006.
[90] R. Shaw, R. Troncy, and L. Hardman. Lode : Linking open descriptions of
events. In Proceedings of the 4th Asian Conference on The Semantic Web,
ASWC ’09, pages 153–167, Berlin, Heidelberg, 2009. Springer-Verlag.
[91] B. Shevade, H. Sundaram, and L. Xie. Modeling personal and social net-
work context for event annotation in images. In Proceedings of the 7th
ACM/IEEE-CS joint conference on Digital libraries, JCDL ’07, pages 127–
134, New York, NY, USA, 2007. ACM.
[92] C. Silpa-Anan and R. Hartley. Optimised kd-trees for fast image descriptor
matching. In CVPR. IEEE Computer Society, 2008.
[93] P. Sinha, S. Mehrotra, and R. Jain. Summarization of personal photologs
using multidimensional content and context. In Proceedings of the 1st ACM
Page 128
International Conference on Multimedia Retrieval, ICMR ’11, pages 4 :1–
4 :8, New York, NY, USA, 2011. ACM.
[94] M. R. Trad, A. Joly, and N. Boujemaa. Large scale visual-based event
matching. In Proceedings of the 1st ACM International Conference on Mul-
timedia Retrieval, ICMR ’11, pages 53 :1–53 :7, New York, NY, USA, 2011.
ACM.
[95] R. Troncy, B. Malocha, and A. T. S. Fialho. Linking events with media.
In Proceedings of the 6th International Conference on Semantic Systems,
I-SEMANTICS ’10, pages 42 :1–42 :4, New York, NY, USA, 2010. ACM.
[96] B. T. Truong and S. Venkatesh. Video abstraction : A systematic review
and classification. ACM Trans. Multimedia Comput. Commun. Appl., 3(1),
Feb. 2007.
[97] J. Wang, S. Kumar, and S.-F. Chang. Semi-supervised hashing for large-scale
search. IEEE Transactions on Pattern Analysis and Machine Intelligence,
34 :2393–2406, 2012.
[98] J. Wang, L. Quan, J. Sun, X. Tang, and H.-Y. Shum. Picture collage. In
Proceedings of the 2006 IEEE Computer Society Conference on Computer
Vision and Pattern Recognition - Volume 1, CVPR ’06, pages 347–354, Wa-
shington, DC, USA, 2006. IEEE Computer Society.
[99] Y. Wang, L. Xie, and H. Sundaram. Social event detection with clustering
and filtering. In Larson et al. [62].
[100] R. Weber, H. J. Schek, and S. Blott. A quantitative analysis and performance
study for similarity-search methods in high-dimensional spaces. In Int. Conf.
on Very Large Data Bases, pages 194–205, 1998.
[101] Y. Weiss, A. Torralba, and R. Fergus. Spectral hashing. In NIPS, pages
1753–1760, 2008.
[102] U. Westermann and R. Jain. Toward a common event model for multimedia
applications. IEEE MultiMedia, 14(1) :19–29, Jan. 2007.
[103] S. Yan, D. Xu, B. Zhang, H.-J. Zhang, Q. Yang, and S. Lin. Graph em-
bedding and extensions : A general framework for dimensionality reduction.
Page 129
IEEE Transactions on Pattern Analysis and Machine Intelligence, 29 :40–51,
2007.
[104] Y. Yang, J. Carbonell, R. Brown, T. Pierce, B. T. Archibald, and X. Liu.
Learning approaches for detecting and tracking news events. IEEE Intelli-
gent Systems, 14 :32–43, 1999.
[105] J. M. Zacks and B. Tversky. Event structure in perception and conception.
Psychological Bulletin, 127 :3, 2001.
[106] P. Zezula, P. Savino, G. Amato, and F. Rabitti. Approximate similarity
retrieval with m-trees. The VLDB Journal, 7 :275–293, December 1998.
[107] J. Zhai, Y. Lou, and J. Gehrke. Atlas : a probabilistic algorithm for high
dimensional similarity search. In Proceedings of the 2011 international confe-
rence on Management of data, SIGMOD ’11, pages 997–1008, New York, NY,
USA, 2011. ACM.
Page 131
!
!
!
!
!
!
!
!
!
!
!
!
!
!
!
!
!
!
Découverte d’événements par contenu visuel dans les médiassociaux
Mohamed Riadh TRAD
RESUME : L’évolution du web, de ce qui était typiquement connu comme un moyen de communication àsens unique en mode conversationnel, a radicalement changé notre manière à traiter l’information. Des sites demédias sociaux tels que Flickr et Facebook, offrent des espaces d’échange et de diffusion de l’information. Uneinformation de plus en plus riche, mais aussi personnelle, et qui s’organise, le plus souvent, autour d’événementsde la vie réelle. Ainsi, un événement peut être perçu comme un ensemble de vues personnelles et locales, capturéespar différents utilisateurs. Identifier ces différentes instances permettrait, dès lors, de reconstituer une vue globalede l’événement. Plus particulièrrements, lier différentes instances d’un même événement profiterait à bon nombred’applications tel que la recherche, la navigation ou encore le filtrage et la suggestion de contenus.
L’objectif principal de cette thèse est l’identification du contenu multimédia, associé à un événement dans degrandes collections d’images. Une première contribution est une méthode de recherche d’événements basée sur lecontenu visuel. La deuxième contribution est une approche scalable et distribuée pour la construction de graphesdes K plus proches voisins. La troisième contribution est une méthode collaborative pour la sélection de contenupertinent. Plus particuliérement, nous nous intéresserons aux problèmes de génération automatique de résumésd’événements et suggestion de contenus dans les médias sociaux.
MOTS-CLEFS : Recherche d’événements, résumés d’événements, graphes des plus proches voisins.
ABSTRACT : The ease of publishing content on social media sites brings to the Web an everincreasing amount of user generated content captured during, and associated with, real life events.Social media documents shared by users often reflect their personal experience of the event. Hence, anevent can be seen as a set of personal and local views, recorded by different users. These event recordsare likely to exhibit similar facets of the event but also specific aspects. By linking different recordsof the same event occurrence we can enable rich search and browsing of social media events content.Specifically, linking all the occurrences of the same event would provide a general overview of the event.
In this dissertation we present a content-based approach for leveraging the wealth of social mediadocuments available on the Web for event identification and characterization. To match event occur-rences in social media, we develop a new visual-based method for retrieving events in huge photocollections, typically in the context of User Generated Content. The main contributions of the thesisare the following : (1) a new visual-based method for retrieving events in photo collections, (2) a sca-lable and distributed framework for Nearest Neighbors Graph construction for high dimensional data,(3) a collaborative content-based filtering technique for selecting relevant social media documents fora given event.
KEY-WORDS : Event matching, event mining, event summarization, nearest neighbors graph.