▪ Multiple Data source for Maps▪ Custom Data Label and Tooltip▪ Support for Mobile▪ Ability to define initial Zoom / Location▪ Advanced Conditional Formatting▪ Custom marker icons▪ Zoom / Lasso Functionality▪ 30+ Map layer options
▪ Data Visualization for Heat Maps▪ Performance Enhancements - Heat/Bubble
Map▪ Indoor Analyzer▪ Location Analyzer – Zoom based custom
▪ Advanced Table▪ Trend Icon▪ Additional Data Source
▪ What If Analyzer▪ HTML Box▪ Pictogram▪ Script Box▪ Search Box▪ Advanced KPI Tile Enhancements ▪ Advance Table Enhancements▪ Constant Data source with BYOD▪ Multiscreen View in Responsive UI▪ Advanced Label support for Self-service
component creation▪ Advanced Table with more API Scripts▪ Custom Context Menu in Advanced
Table▪ Advanced Table with predefined Table
Templates
- PDF- Microsoft Word- Microsoft PowerPoint- Email
- Microsoft Excel- Google Sheets- WSDL- OData
Selectors Speciality Charts
▪ Period Selector
▪ Hierarchy Filter▪ Dynamic Grid Box▪ Listbox and Dropdown
- Search Box- Alerting capabilities
▪ Range Slider▪ Facet Filter
- Hierarchy Support- Search Box- Sorting
▪ New Selector - Time Slicer▪ Period Selector Week / Month Quarter▪ List Box/ Combo Box enhancements
- Y-M- Y-Q-M - Y-Q-M Multi Select
▪ Gantt Chart▪ Data Utility as Component
5
Visual BI Extensions for SAP Lumira Designer (What is Included as Today)
This type of visualization shows hierarchy through a series of rings, that are sliced for each category node. Each ring corresponds to a level in the hierarchy, with the central circle representing the root node and the hierarchy moving outwards from it.
Sunburst Chart is part of the VBX 2.32 Release version of our Visual BI Extensions for SAP BusinessObjects Design Studio / SAP Lumira.
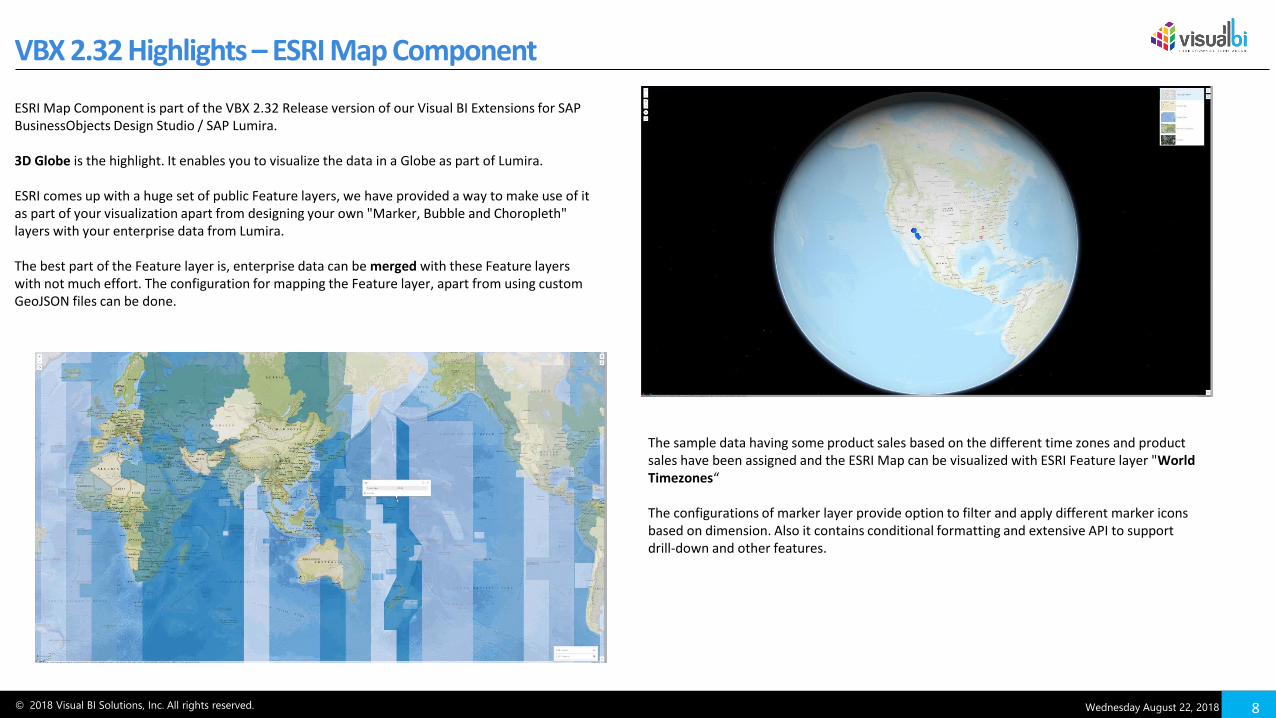
ESRI Map Component is part of the VBX 2.32 Release version of our Visual BI Extensions for SAP BusinessObjects Design Studio / SAP Lumira.
3D Globe is the highlight. It enables you to visualize the data in a Globe as part of Lumira.
ESRI comes up with a huge set of public Feature layers, we have provided a way to make use of it as part of your visualization apart from designing your own "Marker, Bubble and Choropleth" layers with your enterprise data from Lumira.
The best part of the Feature layer is, enterprise data can be merged with these Feature layers with not much effort. The configuration for mapping the Feature layer, apart from using custom GeoJSON files can be done.
The sample data having some product sales based on the different time zones and product sales have been assigned and the ESRI Map can be visualized with ESRI Feature layer "World Timezones“
The configurations of marker layer provide option to filter and apply different marker icons based on dimension. Also it contains conditional formatting and extensive API to support drill-down and other features.
Indoor Analyzer is part of the VBX 2.32 Release version of our Visual BI Extensions for SAP BusinessObjects Design Studio / SAP Lumira.
As part of configuring "Indoor Map" you can go ahead and add all the floor details of floor plan.
We have added all the floor details of an Airport, along with an "Index" map for navigation. Further, we have to configure the shapes and go ahead with scripting.
On the click of any shape, map component navigates to the specified floor map. As part of the mapping data user have to associate all the dimension members to the corresponding shapes.
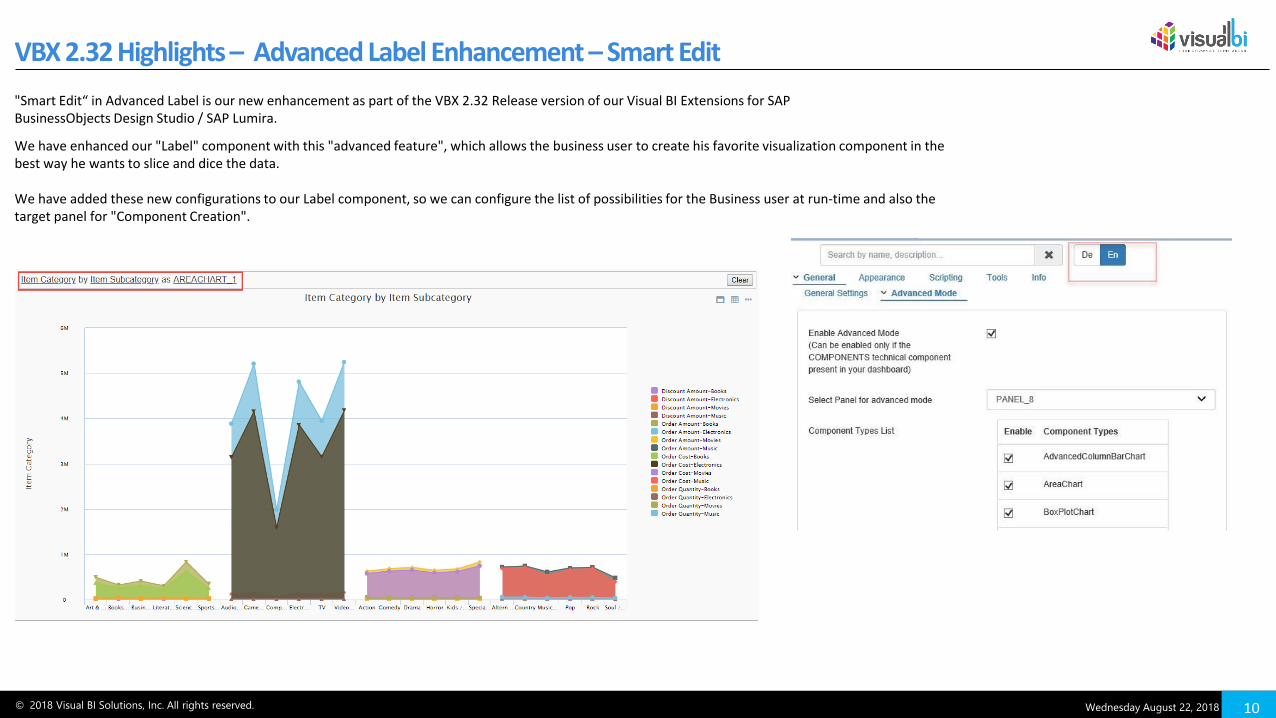
"Smart Edit“ in Advanced Label is our new enhancement as part of the VBX 2.32 Release version of our Visual BI Extensions for SAP BusinessObjects Design Studio / SAP Lumira.
We have enhanced our "Label" component with this "advanced feature", which allows the business user to create his favorite visualization component in the best way he wants to slice and dice the data.
We have added these new configurations to our Label component, so we can configure the list of possibilities for the Business user at run-time and also the target panel for "Component Creation".
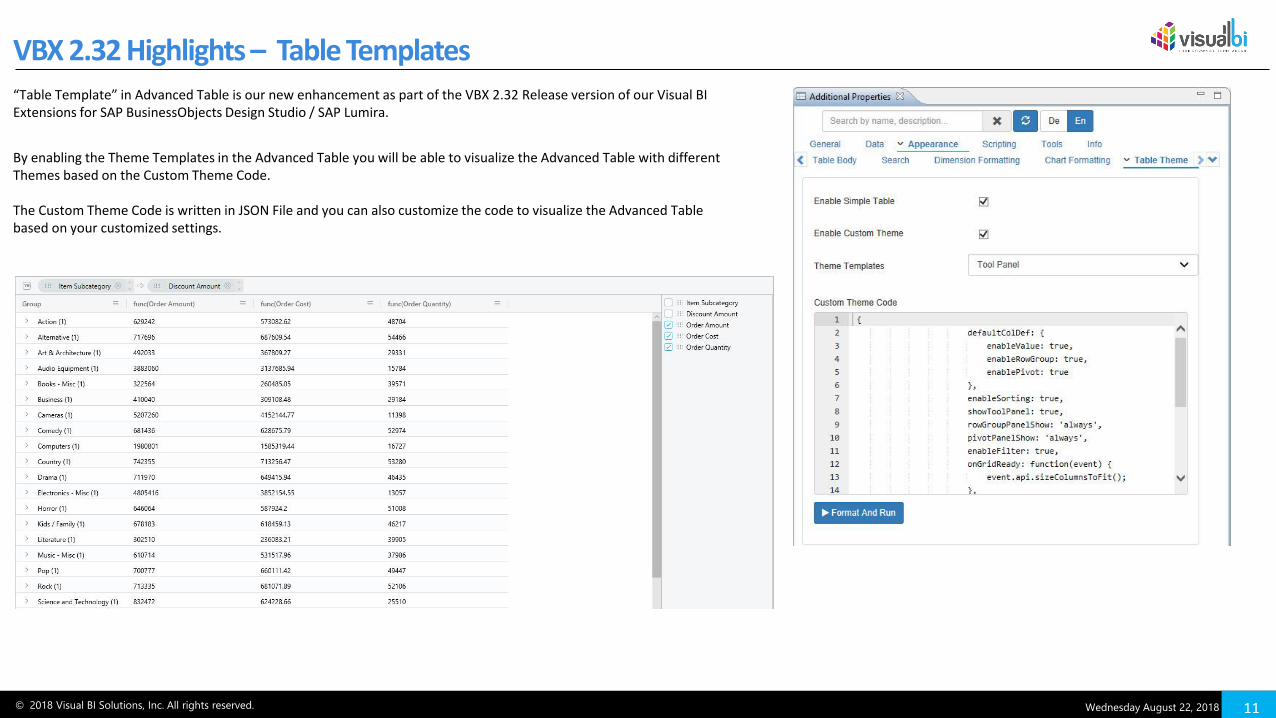
“Table Template” in Advanced Table is our new enhancement as part of the VBX 2.32 Release version of our Visual BI Extensions for SAP BusinessObjects Design Studio / SAP Lumira.
By enabling the Theme Templates in the Advanced Table you will be able to visualize the Advanced Table with different Themes based on the Custom Theme Code.
The Custom Theme Code is written in JSON File and you can also customize the code to visualize the Advanced Table based on your customized settings.
This presentation and Visual BI Solution’s strategy and possible future developments are subject to change and may be changed by Visual BI Solutions at any time for any reason without notice. This document is provided without a warranty of any kind either express or implied, including but not limited to
the implied warranties of merchantability, fitness for a particular purpose, or non-infringement.
VBX Roadmap
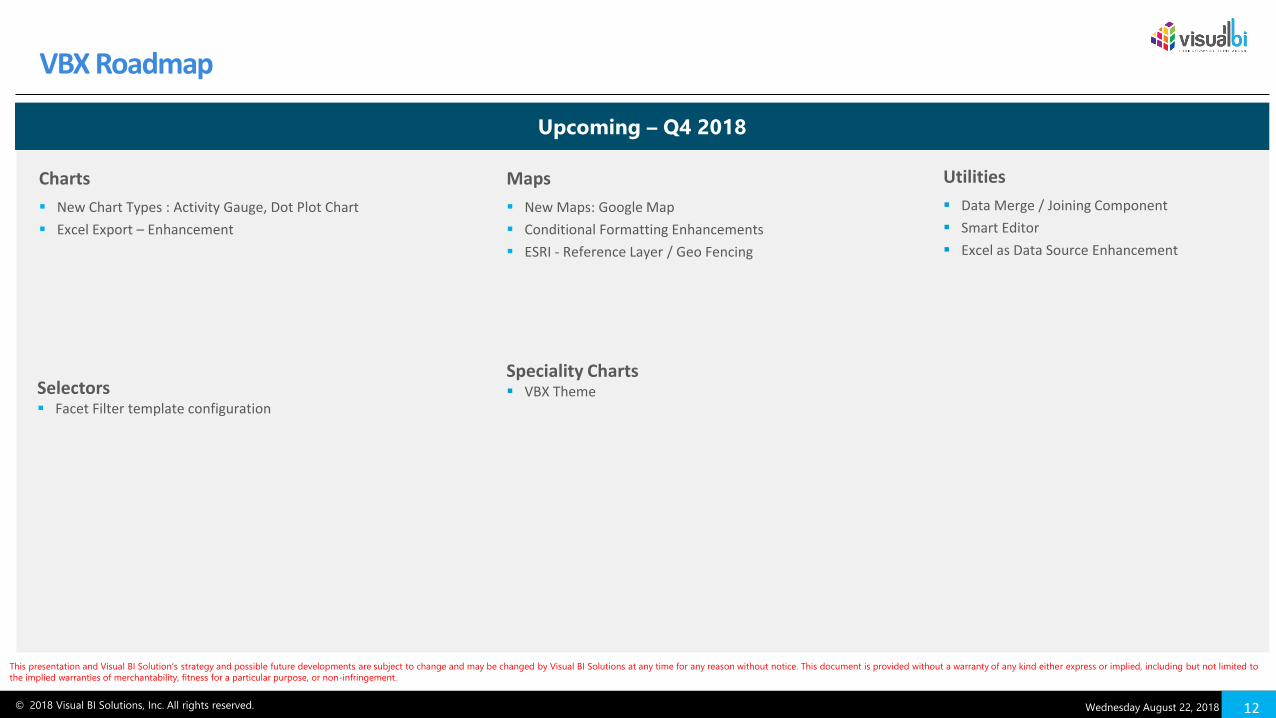
Upcoming – Q4 2018
Charts
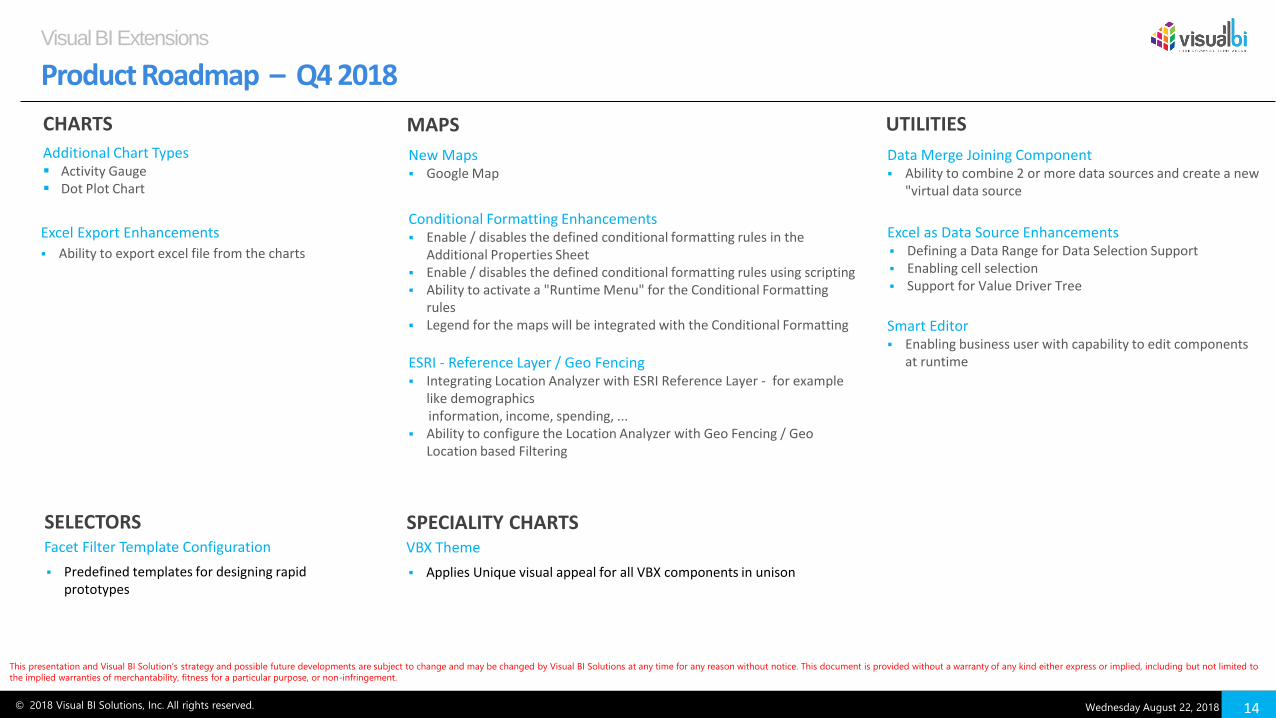
▪ New Chart Types : Activity Gauge, Dot Plot Chart
This presentation and Visual BI Solution’s strategy and possible future developments are subject to change and may be changed by Visual BI Solutions at any time for any reason without notice. This document is provided without a warranty of any kind either express or implied, including but not limited to
the implied warranties of merchantability, fitness for a particular purpose, or non-infringement.
Conditional Formatting Enhancements▪ Enable / disables the defined conditional formatting rules in the
Additional Properties Sheet▪ Enable / disables the defined conditional formatting rules using scripting▪ Ability to activate a "Runtime Menu" for the Conditional Formatting
rules▪ Legend for the maps will be integrated with the Conditional Formatting
ESRI - Reference Layer / Geo Fencing▪ Integrating Location Analyzer with ESRI Reference Layer - for example
like demographicsinformation, income, spending, ...
▪ Ability to configure the Location Analyzer with Geo Fencing / Geo Location based Filtering
MAPS
Excel Export Enhancements
▪ Ability to export excel file from the charts
Data Merge Joining Component▪ Ability to combine 2 or more data sources and create a new
"virtual data source
Excel as Data Source Enhancements▪ Defining a Data Range for Data Selection Support ▪ Enabling cell selection ▪ Support for Value Driver Tree
Smart Editor▪ Enabling business user with capability to edit components
at runtime
UTILITIES
This presentation and Visual BI Solution’s strategy and possible future developments are subject to change and may be changed by Visual BI Solutions at any time for any reason without notice. This document is provided without a warranty of any kind either express or implied, including but not limited to
the implied warranties of merchantability, fitness for a particular purpose, or non-infringement.
SELECTORSFacet Filter Template Configuration
▪ Predefined templates for designing rapid prototypes
SPECIALITY CHARTSVBX Theme
▪ Applies Unique visual appeal for all VBX components in unison
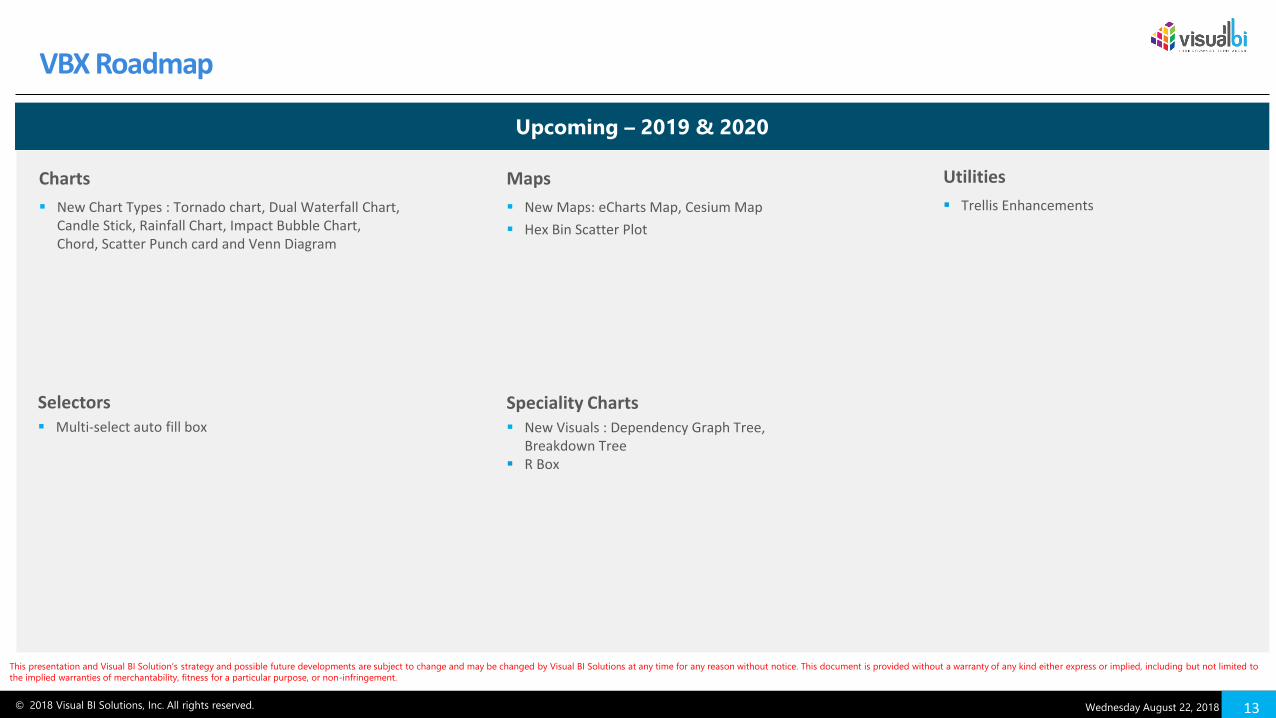
MAPSTrellis Enhancements▪ Adding more features for customizing the Trellis at runtime
UTILITIES
Hex Bin Scatter Plot
▪ Hex bins on map with scatter plot to distinguish data visually
This presentation and Visual BI Solution’s strategy and possible future developments are subject to change and may be changed by Visual BI Solutions at any time for any reason without notice. This document is provided without a warranty of any kind either express or implied, including but not limited to
the implied warranties of merchantability, fitness for a particular purpose, or non-infringement.
SELECTORSMulti-select Auto Fill Box
▪ A component providing user with auto complete feature while selecting dimension members
SPECIALITY CHARTS
New Visuals▪ Dependency Graph Tree▪ Breakdown Tree
R Box:
▪ A utility for bringing R Visualizations as part of Lumira