28
TM Visualization and clusters: collaboration and integration issues Philip NERI – Integrated Solutions Director

TM
Visualization and clusters: collaboration and integration issues
Philip NERI – Integrated Solutions Director
TM
Overview
Introduction, Paradigm & ClustersThe Geoscience task mapSeismic Data Processing / specifics of imaging sectorInteraction, before, during and afterCORBA technologies for integrated operationVisualization needs for terabyte seismic volumesConclusions

TM
Introduction
Seismic data for hydrocarbon exploration / production"Identify and spatially locate percentile variations in
acoustic properties 5 miles below surface, over 100s of square miles, using ship- born measurement systems"30,000 x 15 kbytes recorded ever 15 secondsMonths of 24 x 7 processing on super- large computersPurpose: define drilling locations for M$50 wells

TM
Processing seismic data
Data unit: terabytesVery large volumes
From raw data to final result involves tens of processes
Data volume does reduce as processing progresses
Clusters: thousands of nodesMulti-tiered, 128-node building blocks
Challenge: moving data to the nodes (and back)Data storage devices
Interconnect bandwidth

TM
Paradigm and clusters
Paradigm: geoscience and engineering softwareDiversified range of software includes seismic processing
Traditional trace processing, Pre Stack Depth Migration (PSDM)
Leading visualization tools, both voxel analysis and 3D modeling
Full software suite (15+ million lines of code) delivered on Linux
Paradigm: global geophysical / reservoir servicesProcessing centers on 5 continents
Clusters replaced most multi-cpu architectures in 2001

TM
ReservoirCharacterization
Well Log & Petrophysics
Analysis
Well Planning & Drilling Design
Seismic Data Processing
Simplified Geoscience Task Map
Oilfield Economists
Visualization &Interpretation
Mapping &Model Building
Data Management &Interoperability
Production Engineering
FacilityEngineering
Reservoir Engineering
ReservoirImaging
Geophysics Petrophysics
Geology
Petroleum Engineering
Drilling Engineering
First IA32 clustered applications

TM
Sequential / Trace by Trace processing
Small data collections to work on1 MB to 500 MB eachData requests can be anticipated
No input during processingNo changes in parameters, variables, data flowsAfter trial run(s), process can run for hours, days
Relatively little interaction between streamsInterconnect bandwidth is seldom a bottleneckAverage interconnect bandwidth used, little interconnect trafficScalable to large amount of nodes (in tiered configuration)Move from 32 bit to 64 bit will improve some metrics

TM
ReservoirCharacterization
Well Log & Petrophysics
Analysis
Well Planning & Drilling Design
Seismic Data Processing
Simplified Geoscience Task Map
Oilfield Economists
Visualization &Interpretation
Mapping &Model Building
Data Management &Interoperability
Production Engineering
FacilityEngineering
Reservoir Engineering
ReservoirImaging
Geophysics Petrophysics
Geology
Petroleum Engineering
Drilling Engineering
Advanced clustered applications

TM
Ray tracing in discrete volumes

TM
Large aperture processes
Variable data collections to work on100 MB to the whole dataset, for each node / trace set
Data requests cannot be anticipated (ray tracing, etc..)
Iterative refinement of model, propertiesObservations during processing can lead to suspending processing, editing input data and resuming work
Can run for days
High interaction between streamsInterconnect bandwidth is always a bottleneck
Limit to the amount of nodes

TM
Backplane becomes a major cost
As the cluster size growsLarger data sets
Larger data flows
Larger node interconnection
Interconnect costs dominateOvertake node costs
Still a bottleneck
Limits the size of largest cluster
$
Nodes

TM
Solutions
Shared memoryAll nodes share a common access to memory
Increased bandwidth in interconnect subsystemBrick formats for data
Important caching in file server and nodes
64 bit clusters with stronger nodes (xx cpus w/ xxx GB RAM)
Obvious questions about alternative architecturesCluster versus multi-cpu systems

TM
ReservoirCharacterization
Well Log & Petrophysics
Analysis
Well Planning & Drilling Design
Seismic Data Processing
Extending into interactive modes
Oilfield Economists
Visualization &Interpretation
Mapping &Model Building
Data Management &Interoperability
Production Engineering
FacilityEngineering
Reservoir Engineering
ReservoirImaging
Geophysics Petrophysics
Geology
Petroleum Engineering
Drilling Engineering
Interactive QC and parameter editing

TM
Blocked Seismic :An optimized data format
Allow consistent access times regardless of directionMulti- threading for improved performanceAvoid excessive file sizesConcurrent access in different areas without conflictRelieve cache usage
TM
ApplicationApplication
Application
Application
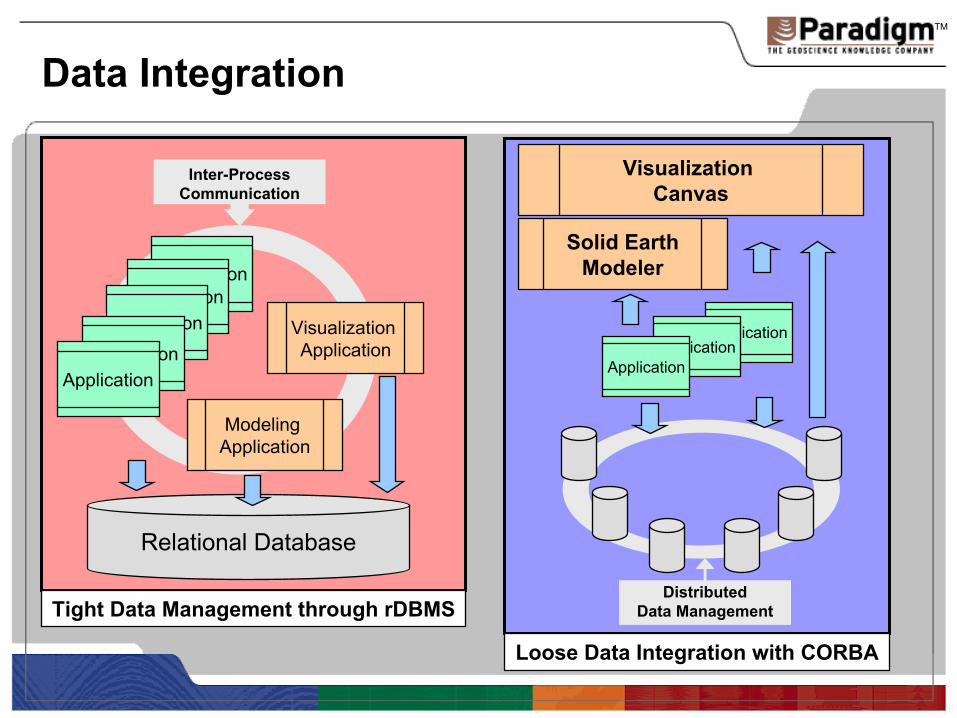
Data Integration
Relational Database
Application
Visualization Application
Modeling Application
Inter-Process Communication
DistributedData Management
Visualization Canvas
Solid EarthModeler
ApplicationApplication
Application
Tight Data Management through rDBMS
Loose Data Integration with CORBA

TM
Platform mix, system mix
"… build pieces and get them talking!"
Distributed Data ManagementStandards-based – XML, CORBA, Java
Local and Remote Data AccessMulti- Vendor InteroperabilityPlatform- Independent Data ManagementHardware Optimized Data Access

TM
Paradigm εpos Data Management & Interoperability Integration
Distributed Data Management: A 5-Layered Model
1) Data stores, repositories and databases

TM
Paradigm εpos Data Management & Interoperability Integration
Distributed Data Management: A 5-Layered Model
1) Data stores, repositories and databases
2) Data Servers execute CORBA instructions for each repository

TM
Paradigm εpos Data Management & Interoperability Integration
Distributed Data Management: A 5-Layered Model
1) Data stores, repositories and databases
2) Data Servers execute CORBA instructions for each repository
3) Services & catalogs for project management and applications

TM
Paradigm εpos Data Management & Interoperability Integration
Distributed Data Management: A 5-Layered Model
1) Data stores, repositories and databases
2) Data Servers execute CORBA instructions for each repository
3) Services & catalogs for project management and applications
4) Data Servers transmit data requests from applications
5) Applications issue data requests to Data Servers

TM
Distributed data and clusters
The management of projectsOn separate systems (security, accessibility, availability)
Catalogs reference data locations / structures
Data flows are point-to-point
SegregationVisualization can take place outside of the processing cluster
Brick format allows access to ongoing jobs data concurrently

TM
Visualization cluster?Data roaming tools
Purpose"Navigate" terabyte datasets to view / QC / interpret data
Not memory-resident, use of brick format and disk caching
Relatively simple displays, tessellated surfaces are the most complex graphical objects
Viewing totally unpredictable in most cases:360º horizontal axis360º vertical axisZoom from overall view to high magnificationSelection / removal of any object at any time
No obvious benefit from clustered graphicsHandled effectively on a single graphic card, I/O bottlenecks

TM
Reservoir Navigator™

TM
Visualization clusterVoxel rendering tools
PurposeAnalysis of data clouds, properties, spatial bodies, anomalies
Data memory resident
Same un-predictable view-point / magnification / selection process
Clustering voxel visualization?Very high bandwidth backplane required
Shared memory, or replication of a large % of the raw data volume on each node
The assembly layer would require high level functions relative to view points, etc..
Can a cluster compete with a bespoke system?

TM
VoxelGeo®

TM
Conclusions
Clusters are adopted for scalability and price/performance in appropriate application domainsClusters are preponderant for seismic data processingSome specific processes do not fit (current) clustersBrick formatted data crucial to cluster architectureCORBA distributed data to access cluster jobs "live"Visualization (roaming or voxel) does not automatically fit the constraints of cluster architecture

TM
TM


