21
Visualizing and Understanding Convolutional Networks Matthew D. Zeiler, Rob Fergus Presented by Huan Jin

Visualizing and UnderstandingConvolutional Networks
Matthew D. Zeiler, Rob Fergus
Presented by Huan Jin
Overview
• What are the models learning?
• Which part of the model is key to performance?
• Do the features generalize?
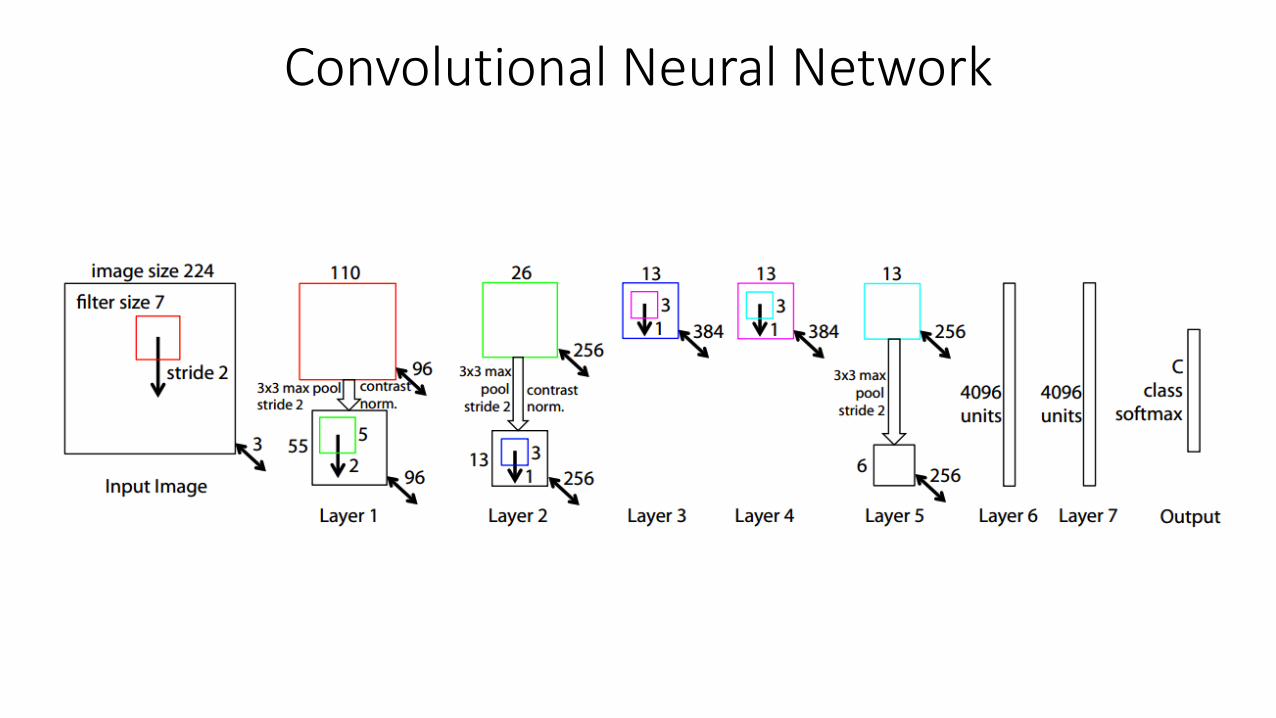
Convolutional Neural Network
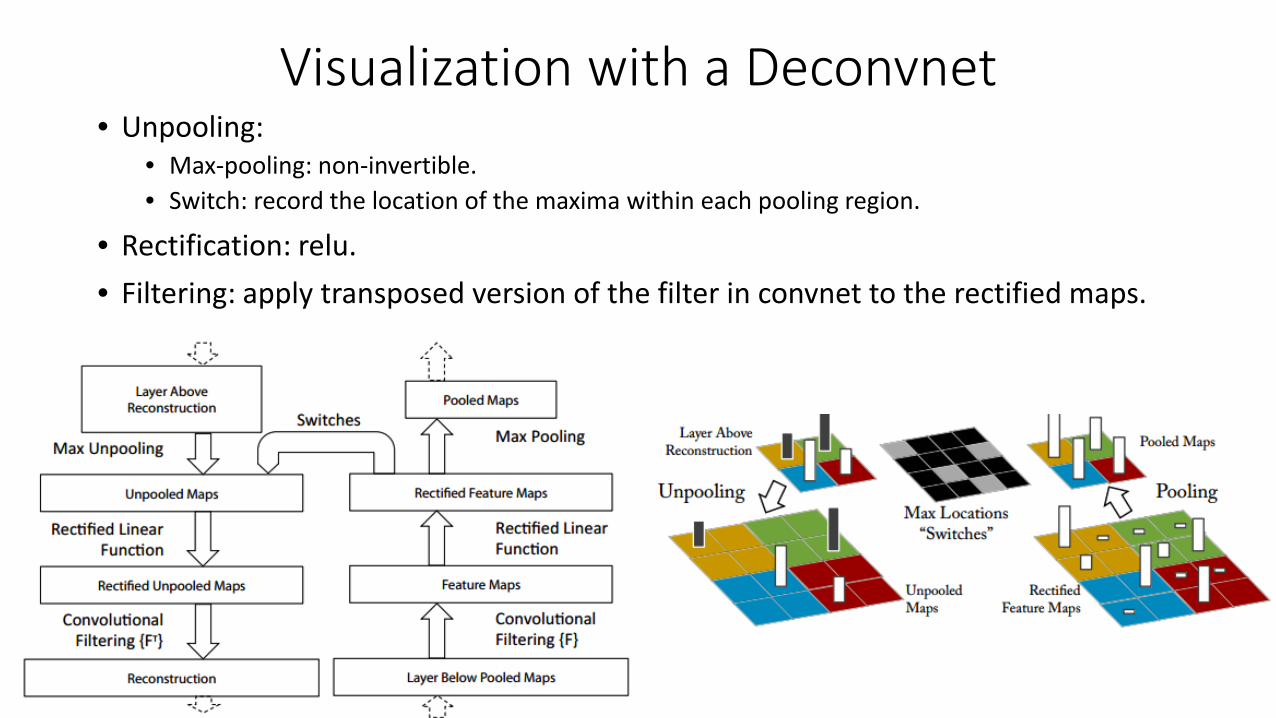
Visualization with a Deconvnet• Unpooling:
• Max-pooling: non-invertible.• Switch: record the location of the maxima within each pooling region.
• Rectification: relu.• Filtering: apply transposed version of the filter in convnet to the rectified maps.

Convnet Visualization• Feature Visualization
Layer2: corners and other edge/color conjunctions.
Layer3: more complex invariances, capturing similar textures. (mesh patterns, text)
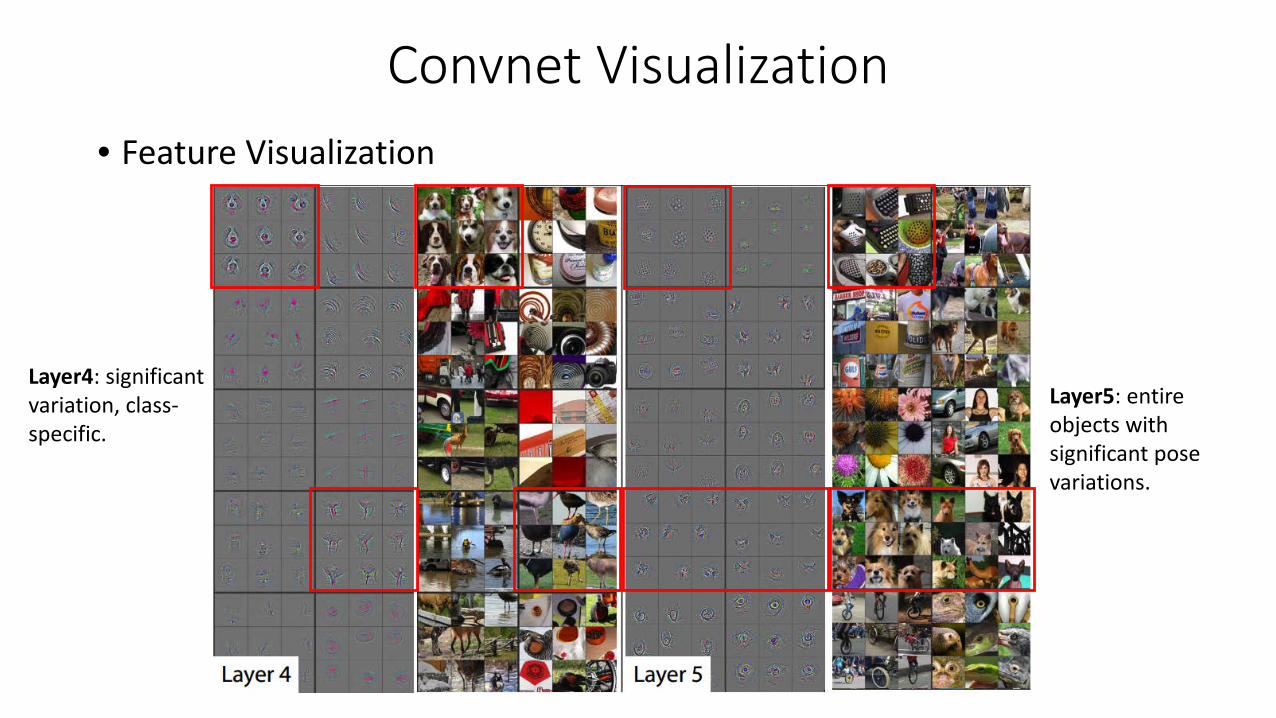
Convnet Visualization• Feature Visualization
Layer4: significant variation, class-specific.
Layer5: entire objects with significant pose variations.
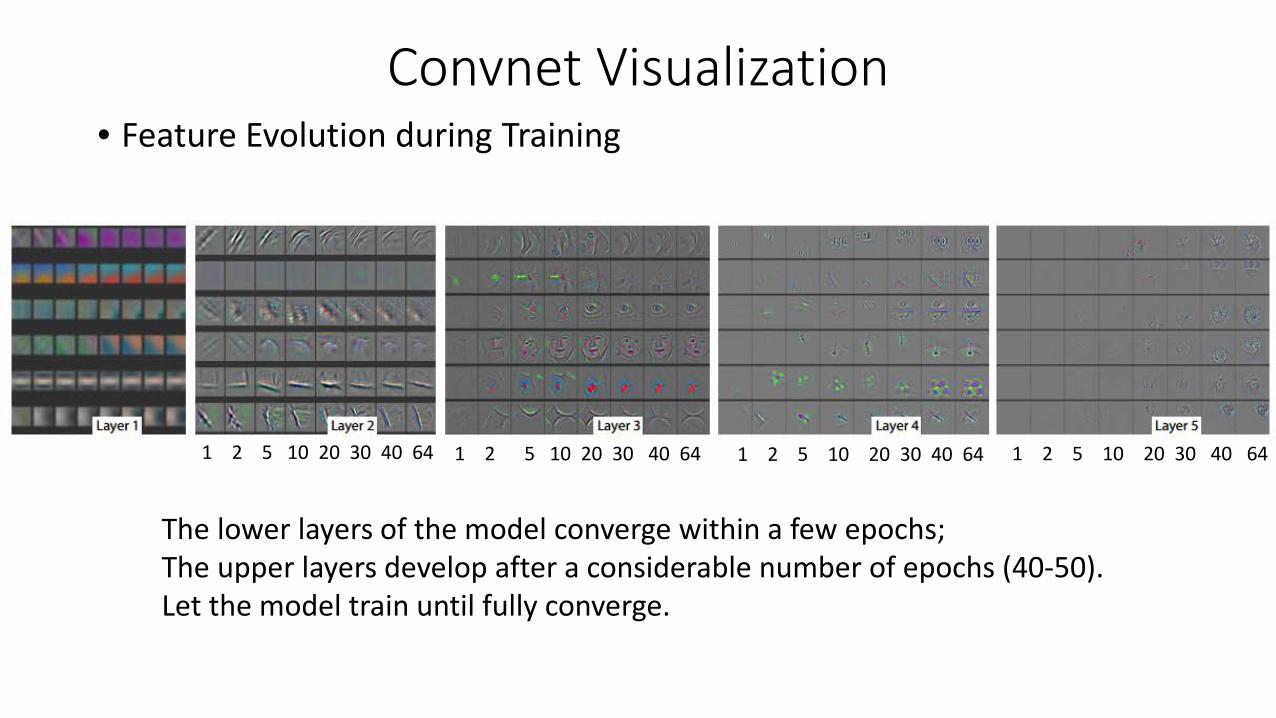
Convnet Visualization• Feature Evolution during Training
The lower layers of the model converge within a few epochs;The upper layers develop after a considerable number of epochs (40-50).Let the model train until fully converge.
1 2 5 10 20 30 40 64 1 2 5 10 20 30 40 64 1 2 5 10 20 30 40 64 1 2 5 10 20 30 40 64

Convnet Visualization• Feature Invariance
Translation (Horizontal)
Out
put
Laye
r 1
Laye
r 7Dramatic effect Lesser impact

Convnet Visualization• Feature Invariance
Scale Invariance
Out
put
Laye
r 1
Laye
r 7Dramatic effect Lesser impact
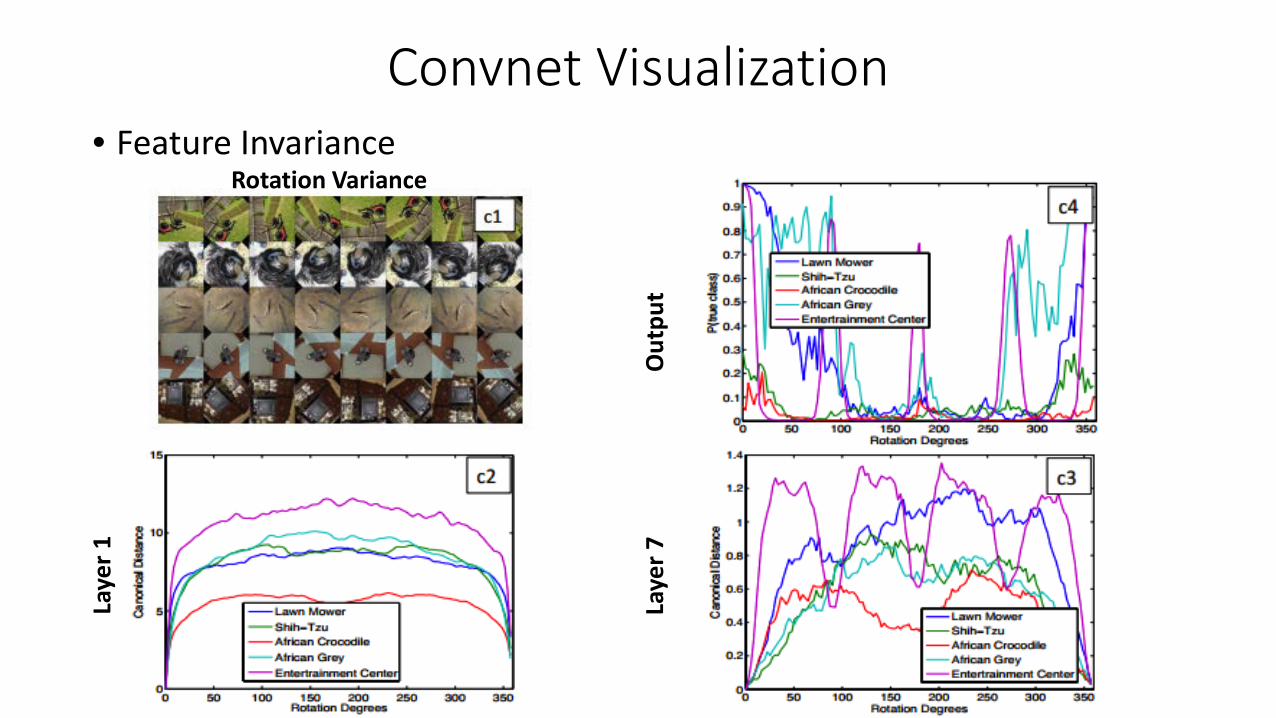
Convnet Visualization• Feature Invariance
Out
put
Laye
r 1
Laye
r 7
Rotation Variance
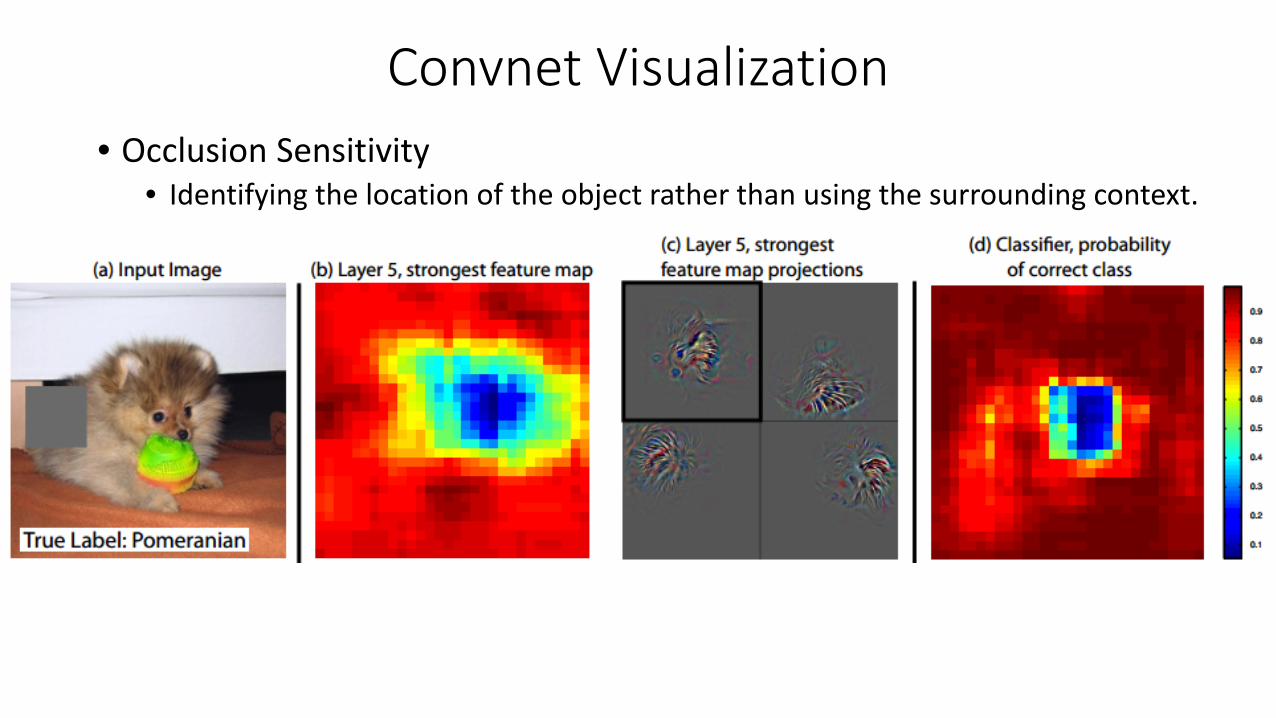
Convnet Visualization• Occlusion Sensitivity
• Identifying the location of the object rather than using the surrounding context.
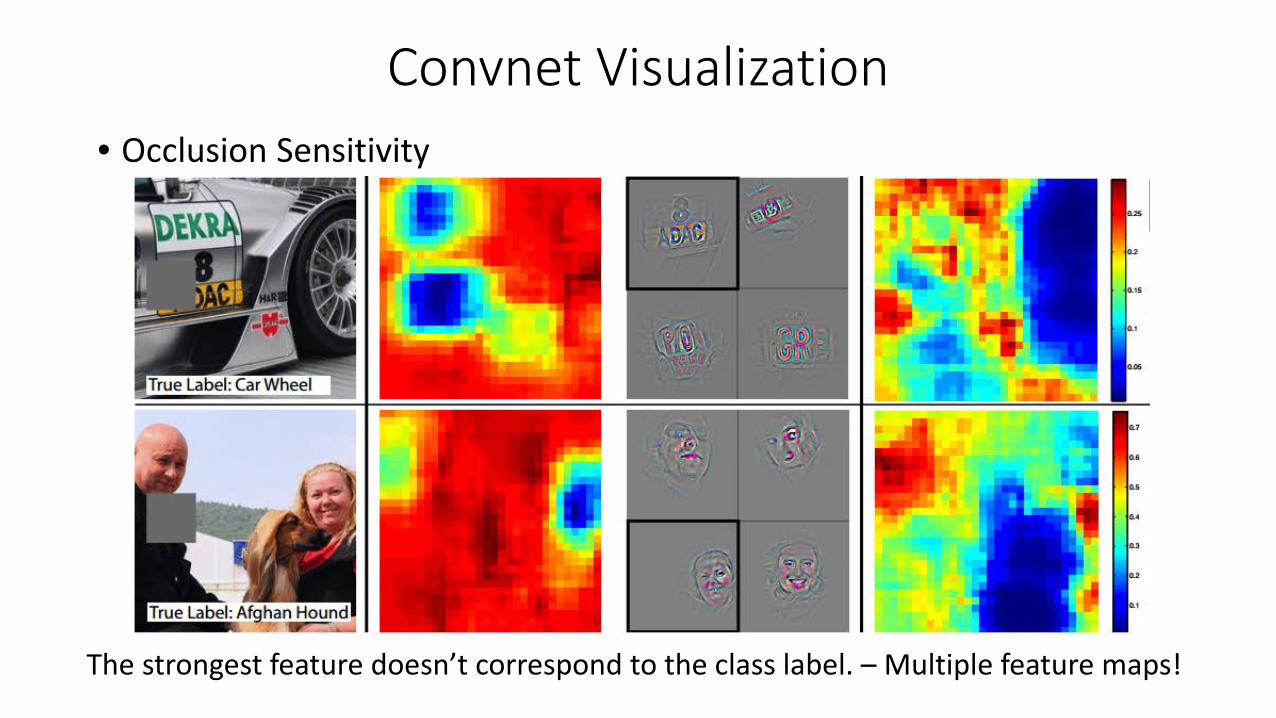
Convnet Visualization• Occlusion Sensitivity
The strongest feature doesn’t correspond to the class label. – Multiple feature maps!
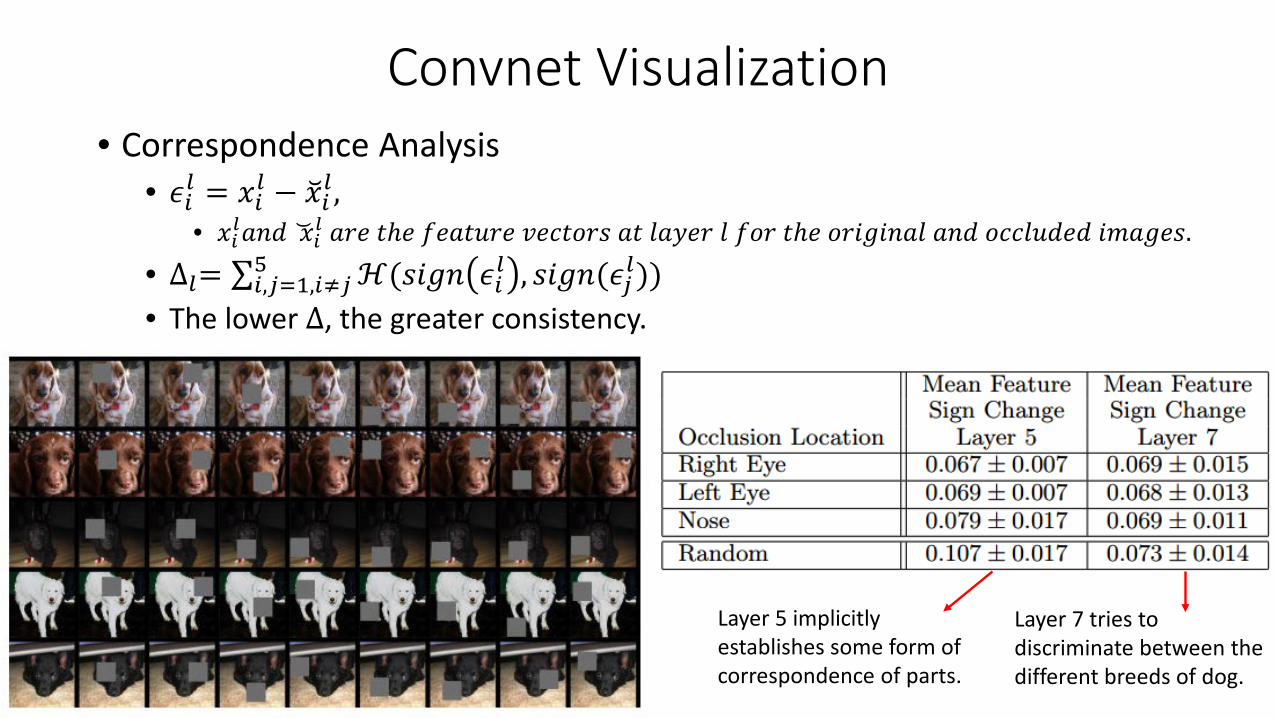
Convnet Visualization• Correspondence Analysis
• 𝜖𝜖𝑖𝑖𝑙𝑙 = 𝑥𝑥𝑖𝑖𝑙𝑙 − �𝑥𝑥𝑖𝑖𝑙𝑙 ,• 𝑥𝑥𝑖𝑖𝑙𝑙𝑎𝑎𝑎𝑎𝑎𝑎 �𝑥𝑥𝑖𝑖𝑙𝑙 𝑎𝑎𝑎𝑎𝑎𝑎 𝑡𝑡𝑡𝑎𝑎 𝑓𝑓𝑎𝑎𝑎𝑎𝑡𝑡𝑓𝑓𝑎𝑎𝑎𝑎 𝑣𝑣𝑎𝑎𝑣𝑣𝑡𝑡𝑣𝑣𝑎𝑎𝑣𝑣 𝑎𝑎𝑡𝑡 𝑙𝑙𝑎𝑎𝑙𝑙𝑎𝑎𝑎𝑎 𝑙𝑙 𝑓𝑓𝑣𝑣𝑎𝑎 𝑡𝑡𝑡𝑎𝑎 𝑣𝑣𝑎𝑎𝑜𝑜𝑜𝑜𝑜𝑜𝑎𝑎𝑎𝑎𝑙𝑙 𝑎𝑎𝑎𝑎𝑎𝑎 𝑣𝑣𝑣𝑣𝑣𝑣𝑙𝑙𝑓𝑓𝑎𝑎𝑎𝑎𝑎𝑎 𝑜𝑜𝑖𝑖𝑎𝑎𝑜𝑜𝑎𝑎𝑣𝑣.
• ∆𝑙𝑙= ∑𝑖𝑖,𝑗𝑗=1,𝑖𝑖≠𝑗𝑗5 ℋ(𝑣𝑣𝑜𝑜𝑜𝑜𝑎𝑎 𝜖𝜖𝑖𝑖𝑙𝑙 , 𝑣𝑣𝑜𝑜𝑜𝑜𝑎𝑎(𝜖𝜖𝑗𝑗𝑙𝑙))
• The lower ∆, the greater consistency.
Layer 5 implicitly establishes some form of correspondence of parts.
Layer 7 tries to discriminate between the different breeds of dog.
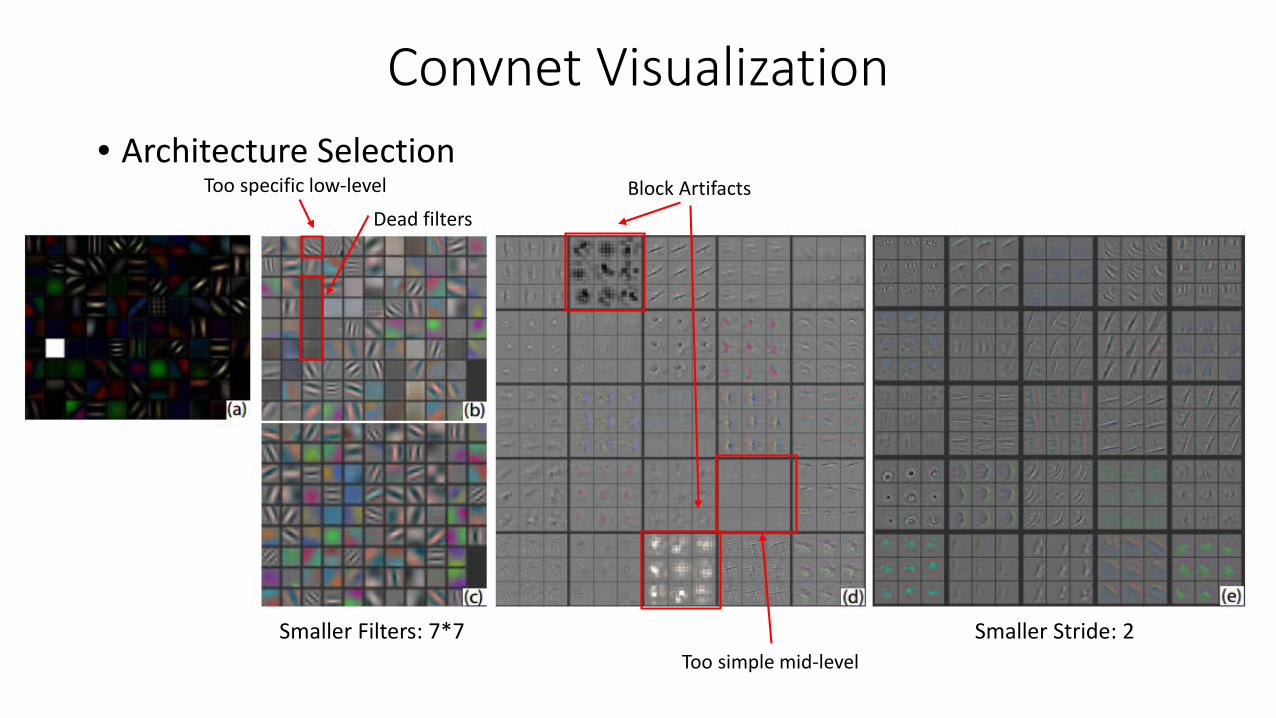
Convnet Visualization• Architecture Selection
Block ArtifactsToo specific low-level
Dead filters
Smaller Filters: 7*7 Smaller Stride: 2Too simple mid-level
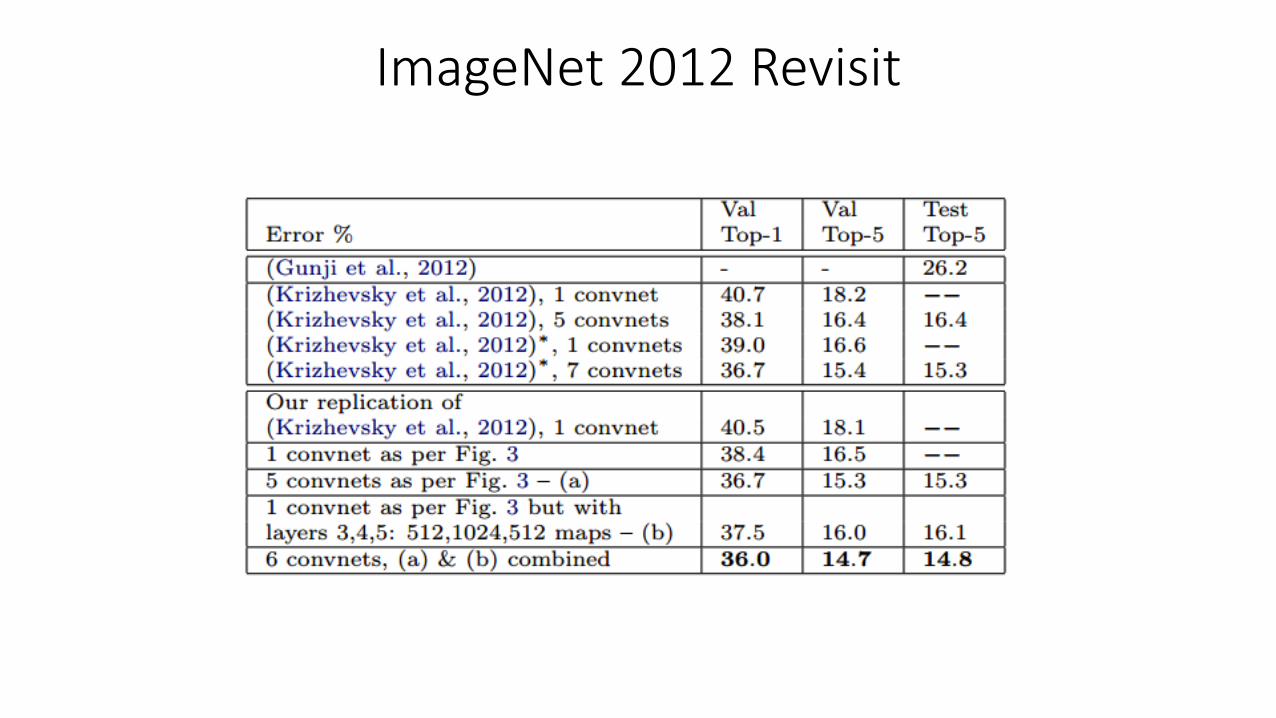
ImageNet 2012 Revisit
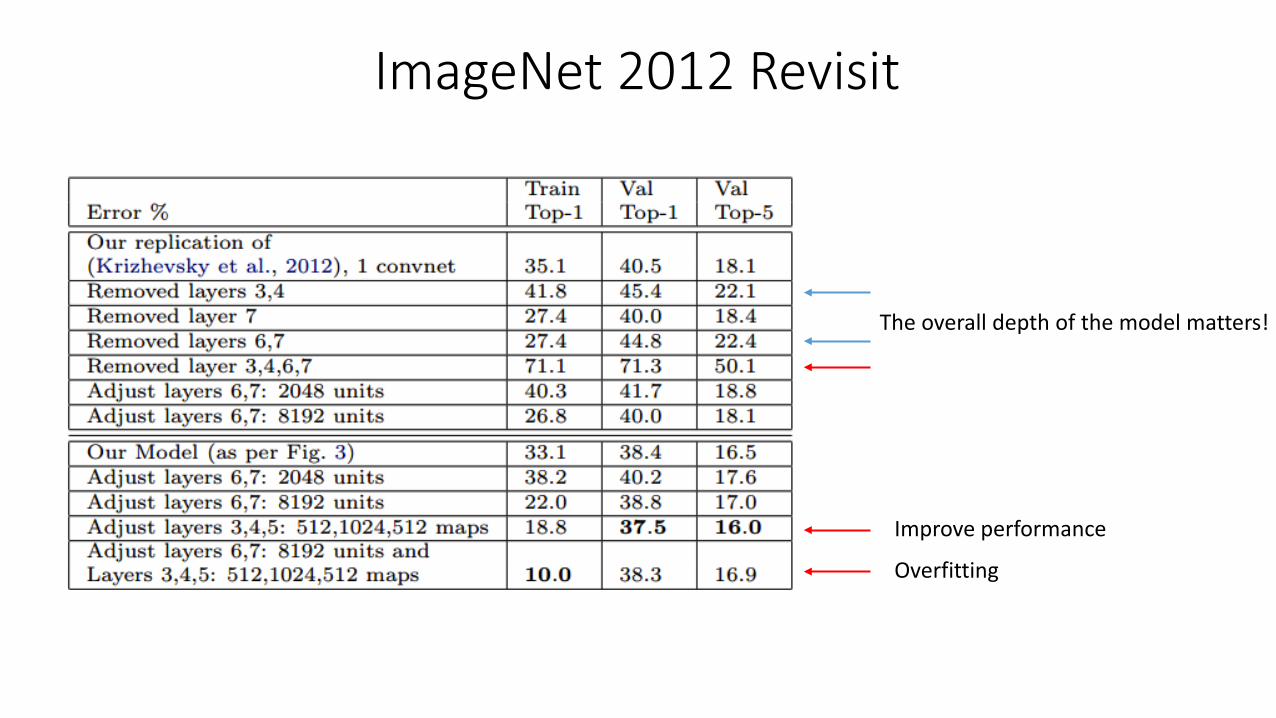
ImageNet 2012 Revisit
The overall depth of the model matters!
Improve performance
Overfitting
Feature Generalization
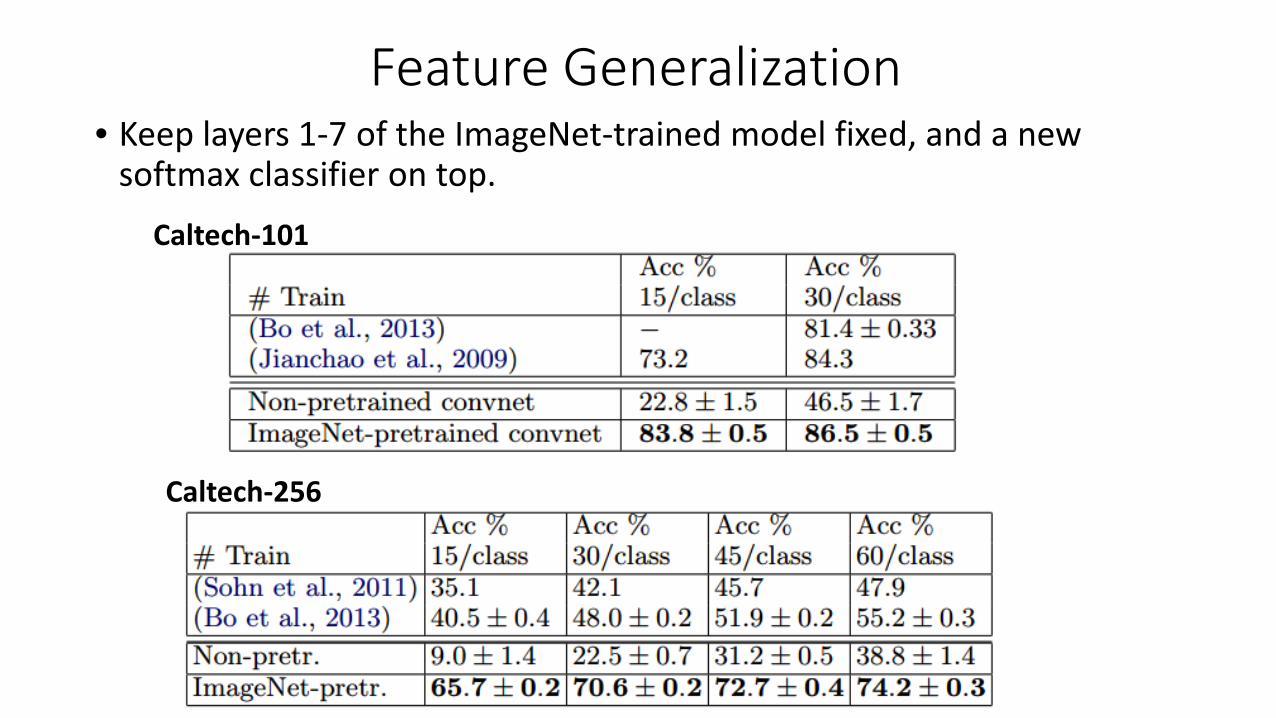
Caltech-101
Caltech-256
• Keep layers 1-7 of the ImageNet-trained model fixed, and a newsoftmax classifier on top.

Feature GeneralizationCaltech-256
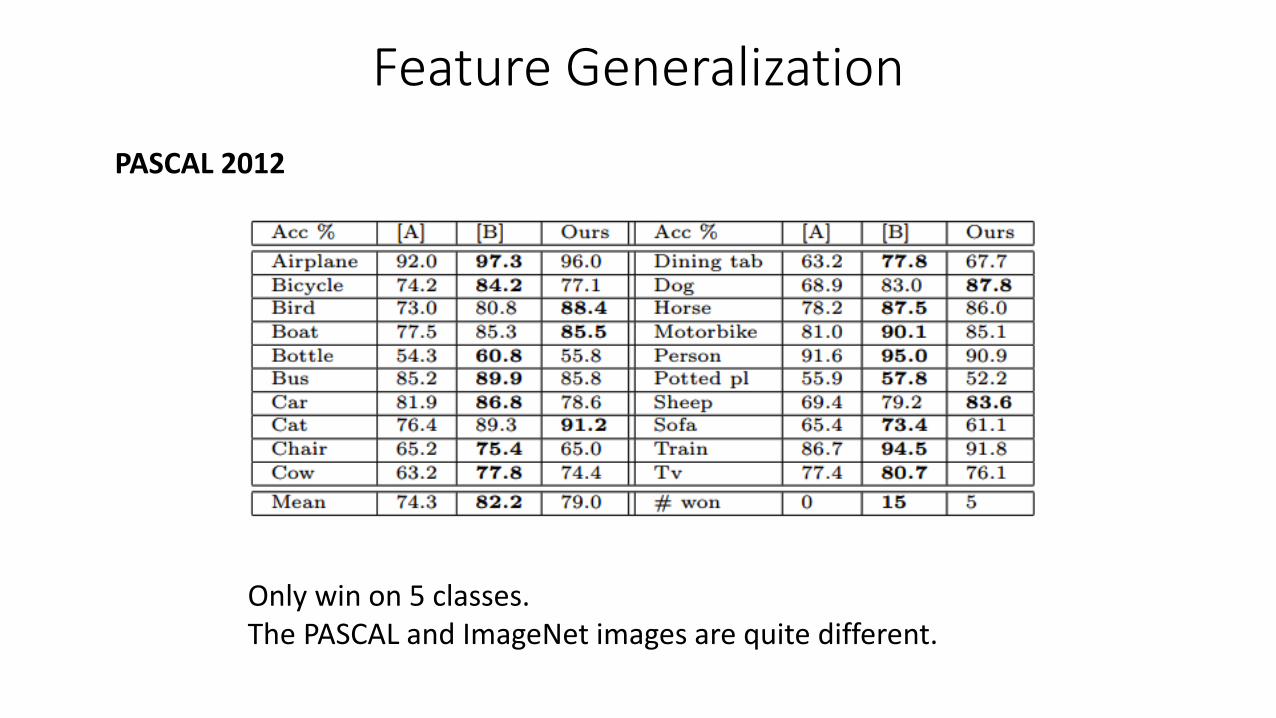
Feature GeneralizationPASCAL 2012
Only win on 5 classes. The PASCAL and ImageNet images are quite different.
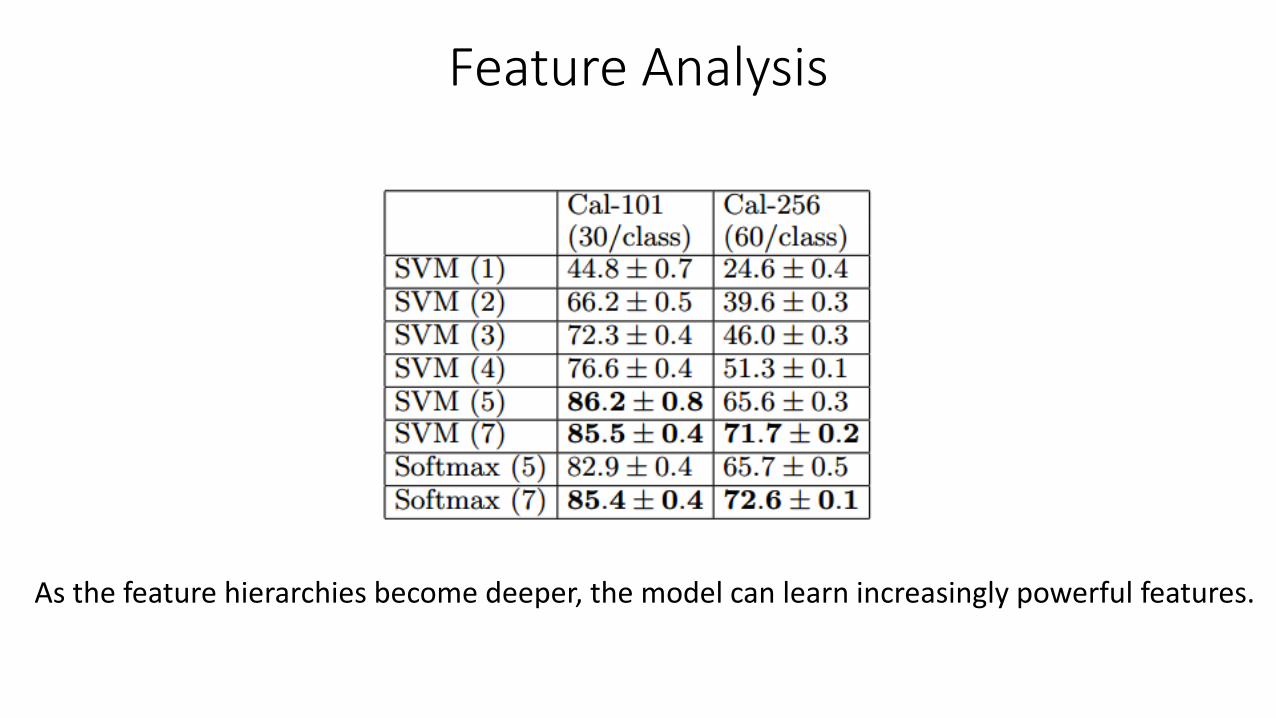
Feature Analysis
As the feature hierarchies become deeper, the model can learn increasingly powerful features.

Summary
• Deconvolutional networks in visualization.• Application to convolutional neural networks
• Better understanding of what is learned• Gives insight into model construction


![DogVCat: Create anbang3/files/DogCat_presentation.pdf · References [1] Zeiler, Matthew D., and Rob Fergus. "Visualizing and Understanding Convolutional Neural Networks." arXiv preprint](https://static.documents.pub/doc/80x56/5f3bef5a48e95c0eb87015e2/dogvcat-create-an-bang3filesdogcatpresentationpdf-references-1-zeiler.jpg)


![Sequentially Aggregated Convolutional Networksopenaccess.thecvf.com/content_ICCVW_2019/papers/... · art networks [10, 19, 14, 3], with its effectiveness further confirmed by visualizing](https://static.documents.pub/doc/80x56/5ecb0c1be5d280171421c69c/sequentially-aggregated-convolutional-art-networks-10-19-14-3-with-its-effectiveness.jpg)


