38
Visualizing graphs with Vision2 Semester Thesis By: Lukas Angerer Supervised by: Michela Pedroni Prof. Bertrand Meyer Student Number: 03-906-591

Visualizing graphs with Vision2
Semester Thesis
By: Lukas AngererSupervised by: Michela Pedroni
Prof. Bertrand Meyer
Student Number: 03-906-591

Table of Contents1 Introduction..............................................................................................................................3
1.1 Objectives........................................................................................................................32 The Graph Widget................................................................................................................... 3
2.1 Object Mapping............................................................................................................... 32.2 Layout Data..................................................................................................................... 3
3 Problems................................................................................................................................. 54 Future Work.............................................................................................................................55 Conclusion...............................................................................................................................6
Appendix A.............................................................................................................................. 6

1 Introduction
This report gives a short description of the “Graph Widget” project. This chapter describes the objectives of the project. The second chapter provides an overview over the final system, while the third chapter is a summary of the most difficult problems that occurred during development. In the forth chapter, a list of possible options for future extensions and improvements is given, and this is then followed by the conclusion. Appendix A contains the full documentation of the project's classes at the time of submission
1.1 Objectives
The objective of the project was to create an Eiffel-Vision2 (http://docs.eiffel.com/eiffelstudio/libraries/vision2/index.html) widget that uses the GraphViz (www.graphviz.org) library to layout graphs and allows the user to modify these layouts in an intuitive way. The widget had to be able to render graphs using a subset of the graphical primitives provided by GraphViz, in particular, the widget had to be able to render a graph containing node shapes that are not part of this subset using a default representation. Besides the graph widget, the project also had to contain a sample application demonstrating the functionality of the widget.
2 The Graph Widget
The final system - the “Graph Widget” - uses the GraphViz library only for a very limited set of operations (see section 3 for reasons). All of the data concerning the graph layout and the component's state is kept strictly in the C structs maintained by GraphViz since the library does not support any other means of communication. Therefore, most of the Eiffel features interfacing to the GraphViz library are simple struct access methods to get data from the C objects or write updated data back to them.
2.1 Object Mapping
Once GraphViz has loaded a graph from a DOT file, a pointer to the “root graph” is returned to Eiffel. The Graph Widget then begins to wrap each element of the primary structure on the C side into the corresponding object on the Eiffel side (see “Figure 1”). GraphViz employs the concept of a “meta graph” to store the sub-graph structure of a graph. Each sub-graph (including the root graph) has a corresponding meta node in the meta graph and the hierarchy between the sub-graphs is modeled by meta edges. This concept has been dropped in the Graph Widget for simplicity.
2.2 Layout Data
The layout information is attached to each graph, node and edge on the C side and has to be kept up to date with modifications on the Eiffel side at all times since the GraphViz renderers depend on this layout information to generate their output. To avoid inconsistencies between the Eiffel and the C layer, almost all layout information only exists in C space and their

information is only accessed indirectly through C calls in Eiffel (in contrast to the nodes and edges which also have a pure Eiffel representation).
For further information about implementation details, please see appendix A.
Figure 1: Primary structure mapping
Root graph(graph_t)
Node 1(node_t)
Node ...(node_t)
Node 2(node_t)
Edge 1(edge_t)
Edge 2(edge_t)
Edge ...(edge_t)
Root meta node(node_t)
Meta graph(graph_t)
Sub graph 1meta node(node_t)
Meta edge 1(edge_t)
Sub graph 1(graph_t)
Graph(GV_GRAPH)
Cluster 1(GV_CLUSTER)
Node 1(GV_NODE)
Edge 1(GV_EDGE)
Node 2(GV_NODE)
Node ...(GV_NODE)
Edge 2(GV_EDGE)
Edge ...(GV_EDGE)
C side (GraphViz)
Eiffel side (Graph Widget)

3 Problems
Most of the problems that occurred during the development of the graph widget were caused by the GraphViz documentation. It seems that most of the (during development time) available GraphViz documentation was either grossly outdated or referred to the version of GraphViz that was under development at that time (the graph widget project is based on GraphViz version 2.8 since version 2.9 was far from stable). The GraphViz library has been, and still is, under heavy development and the library API is changing constantly. Therefore, most of the available tutorials either don't work at all or don't give the expected results using version 2.8. For that reason, most of the research involved going through the GraphViz header files with a fine-tooth comb, and since source code level documentation was mostly missing too, it also involved a lot of guessing what the library functions might actually do.
Another problem is, that the GraphViz library is written in C and is therefore anything but object oriented. Most “modules” such as the layout algorithms, can only be accessed as a whole and interesting sub-components (for example the algorithm used to calculate edges) are either hidden from the library user or don't work in any other context than the one they were originally designed in. As a result, the only GraphViz components accessed by the Graph Widget are:
• Layout algorithms (only for complete graphs)• Load / store functions• Output renderers to create PNGs, JPGs or other output
Probably the most irritating problem is, that GraphViz has no possibility to incorporate modified layout data into a subsequent layout operation. This means that during every layout operation, GraphViz overwrites all the layout attributes, which makes it amazingly difficult to maintain layout modifications during manipulations on the graph's primary structure. (This is solved in the Graph Widget by storing layout data to “string attributes” attached to the graph elements and restoring the modified layout from there after every application of a layout algorithm.)
4 Future Work
Some possibilities for future extensions and improvements:• Implementing the rest of the node shapes that are supported by GraphViz (see
"http://www.graphviz.org/doc/info/shapes.html"• Since the API of the GraphViz library is constantly changing, the graph widget probably
won't work properly with new versions of the library without some modifications to the interface code. So, once a newer stable version of the library becomes available, this might be worth looking into.
• Extending the graph widget to enable the user to modify graph attributes like the node shape, shape color, node label and other layout related attributes directly with the widget instead of changing the DOT file.

5 Conclusion
Although the problems that occurred during development were not particularly simple, they have been solved without compromising the system's overall design. Working with a non object oriented library may not be very enjoyable for somebody who is used to work with object oriented software, but it certainly is instructive. The final widget does what it is supposed to do according to the problem specification and it even has some nice usability features, so all in all the project can be considered a complete success.
Appendix A
Appendix A contains the complete documentation of the Graph Widget project for the source code revision 280 (revision number of the Subversion revision). This documentation is also available on line at http://graphvision.origo.ethz.ch/.
Visualizing graphs with Vision2
Introduction
The Graph Widget provides a graphical user interface to layout graphs. It is based on the GraphViz library (see References), which loads graphs (from DOT files), creates an initial layout and saves the edited graph as an image or an attributed DOT file.
Installation
InstallationGetting started with the GraphViz Widget
Graph Widget Documentation
User DocumentationUser documentation for the Graph Widget
Developer DocumentationDeveloper documentation for the Graph Widget library API
Graph Widget Test Application
OverviewThis gives an overview over the Graph Widget test application and its UI elements.
References
ReferencesReferences to other documents such as thesis reports and web pages

Installation Guide
You can use the Graph Widget either as precompiled executable of the demo application (for Windows users) or you can use it as an Eiffel library using the source code of thedemo application as a starting point. In the latter case you will need to download and install the GraphViz binaries from the download page
Demo Application Binary
Download the Graph Widget archive from the download page , extract the "demo_application.exe" (Win32 binary) and run the executable.
Using the Graph Widget as a Library
First you have to install the GraphViz version 2.8 binaries and download the Graph Widgetarchive from the download page . Installable GraphViz packages are available under www.graphviz.org for several operating systems.
Next, you have to create a new environment variable "GRAPHVIZ" pointing to yourGraphViz installation directory. In Windows, this is done by right-clicking "My Computer" -> Properties -> Advanced Tab -> Environment Variables (Linux users usually know howto do this sort of stuff on their operating system ;). After that, you extract the"graph_widget" folder from the Graph Widget archive to your GraphViz directory.
As the last step, extract the "demo_application" folder from the Graph Widget archive to a location of your choosing. Start your EiffelStudio and compile the project by opening the ACE file in the demo application folder. If everything went as planned, you have now aworking demo application to get you started.

Graph Widget User Guide
The Graph Widget allows easy manipulation of graph layouts and provides methods toperform basic graph manipulations (insert / delete edges and nodes)
This section is structured as follows:
IntroductionIntroduction to Graph Widget
Manipulation OptionsShows the usage of the Graph Widget
Graph Widget User Guide
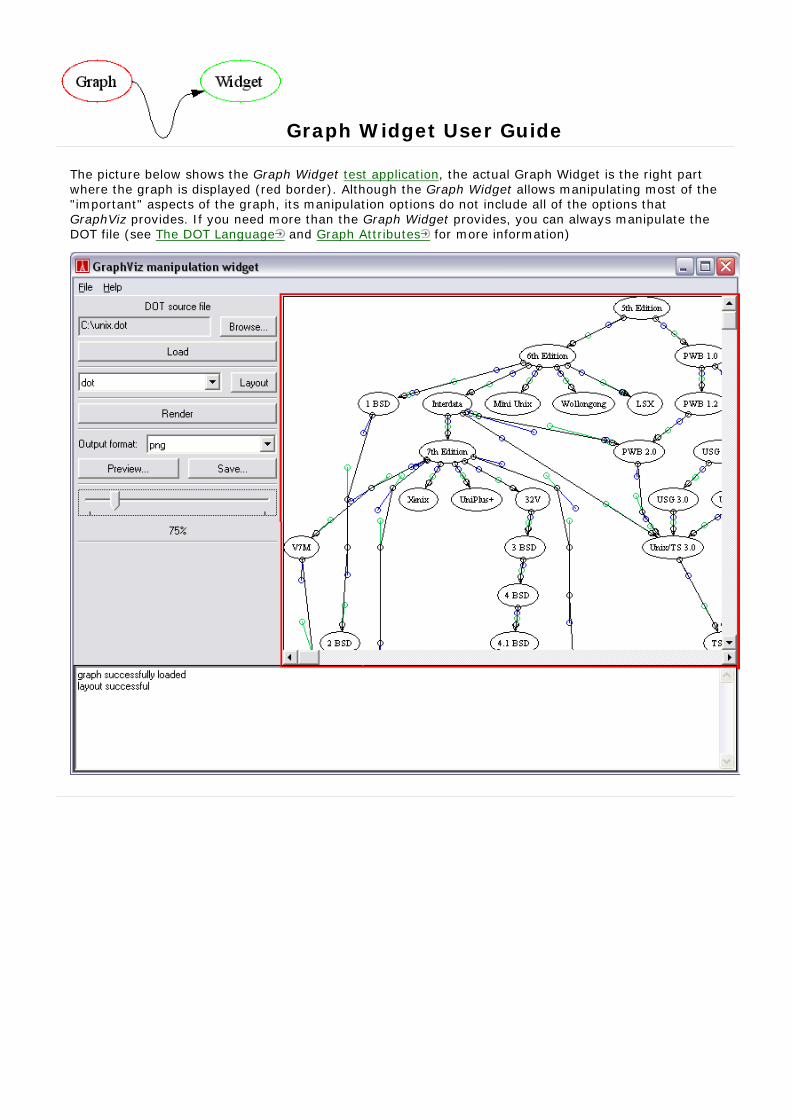
The picture below shows the Graph Widget test application, the actual Graph Widget is the right partwhere the graph is displayed (red border). Although the Graph Widget allows manipulating most of the"important" aspects of the graph, its manipulation options do not include all of the options thatGraphViz provides. If you need more than the Graph Widget provides, you can always manipulate theDOT file (see The DOT Language and Graph Attributes for more information)
Graph Widget User Guide
A graph as shown in the figure of the introduction section contains the following elements that can be created/deleted/edited through context menus provided by the Graph Widget
Clusters
Clusters are subsections of the graph marked by a rectangle surrounding the nodesincluded in the cluster (the whole graph is also a cluster).
Context Menu:
"create node..." : Creates a new node in the selected cluster (centered at the mouse positionduring the right click).
Nodes
Moving: Click on a node of the displayed graph with the left mouse button and dragthe node around while keeping the left mouse button pressed.Context Menu:
"create edge to..." : Creates a new edge to the node that will be clicked next."delete node" : Removes the node (and all associated edges) from the graph.
Edges
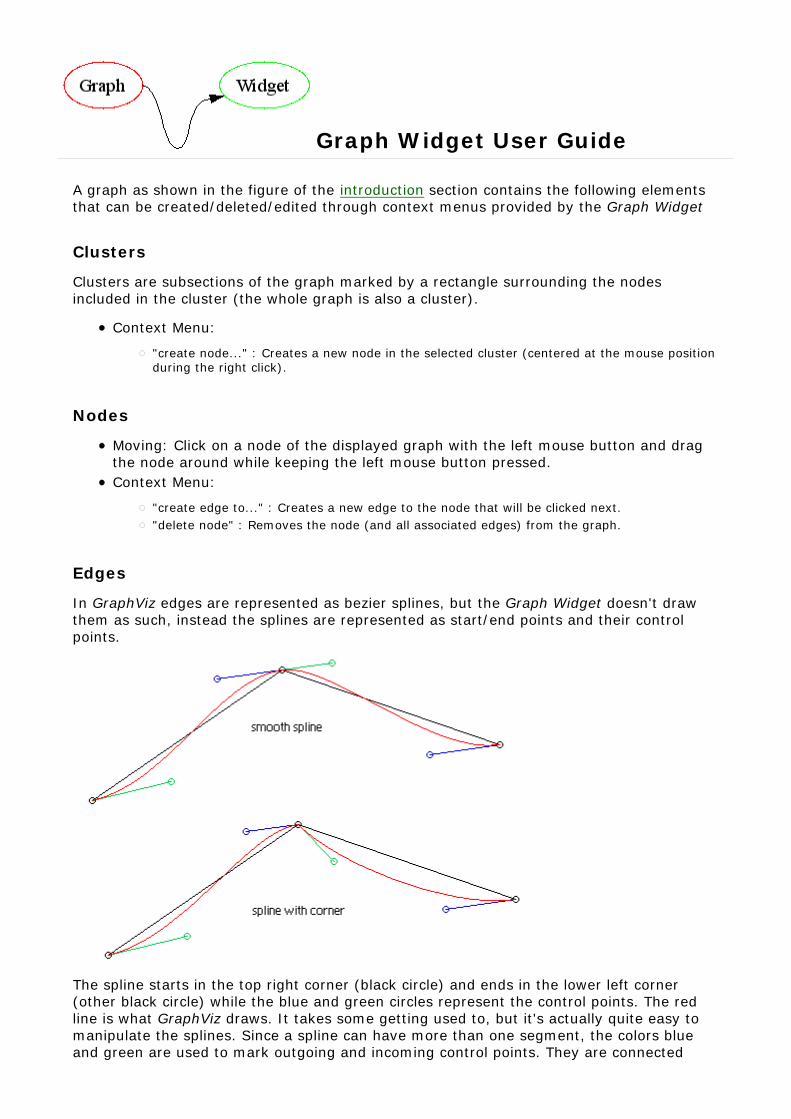
In GraphViz edges are represented as bezier splines, but the Graph Widget doesn't draw them as such, instead the splines are represented as start/end points and their control points.
The spline starts in the top right corner (black circle) and ends in the lower left corner(other black circle) while the blue and green circles represent the control points. The redline is what GraphViz draws. It takes some getting used to, but it's actually quite easy to manipulate the splines. Since a spline can have more than one segment, the colors blueand green are used to mark outgoing and incoming control points. They are connected

because a smooth transition between two spline segments requires that the incoming andoutgoing control point form a straight line with their spline point.
Moving: Simply drag one of the little circles from a spline or control point. Start andend points are a special topic. Since they are each attached to a node, they can't bedragged away from those nodes, instead they stay attached to the border of thenodes they belong to.Context Menu (depends on what kind of point you click on):
"insert point after" : Inserts a new spline point (including control points) after the currentlyselected spline point."insert point before" : Inserts a new spline point (including control points) before thecurrently selected spline point."remove point" : Removes the spline point and all associated control points from the edge."delete edge" : Deletes the edge from the graph.

GraphViz Widget Developer Guide
This section consists of a description of the intention and use of the Graph Widget librarywith a description of each class and its simplified interface.
The Widget
OverviewGives an overview of the classes surrounding the actual graph widget
ClassesDescribes the two widget classes of the Graph Widget
GraphViz Wrapper
OverviewGives an overview over the Eiffel representations of the GraphViz structs and access methods.
ClassesDescribes each class that has a counterpart in the GraphViz library.
ExternalsGives a short description of the C externals used by the Graph Widget
Visual Aspects
OverviewDescribes the overall structure of the graphical aspects of the Graph Widget
InterfacesDescribes the DRAWABLE and MOVABLE deferred classes that are used to draw graphs on the screen.
Points and RectanglesGives a short description of the geometry classes used for visual representation
Node ShapesDescribes how node shapes are represented and how one could create additional node shapes.
Miscellaneous Classes
ClassesGives a description of the Graph Widget helper classes that are not really important in the great scheme of things and could not be assigned to any other category.

Widget Overview
The GRAPH_WIDGET class is one of the key classes in the library since it provides a graphical user interface to manipulate the GV_GRAPH object. It inherits from the SCROLLABLE_WIDGET class which - as the name suggests - enables the GRAPH_WIDGETto scroll. For most actions that can be performed on a GV_GRAPH object and its components (nodes, edges, ...) there is an example in the GRAPH_WIDGET code (if you care to find it ;) but you will find more about that in the next chapter. The GRAPH_WIDGETclass is the "master" class of library; although it is technically only a client of the GV_GRAPH class, it "knows" everything about the wrapper classes (the ones starting with GV_) and their structure. This is of course necessary since it has to manipulate theseclasses to provide the implemented functionality to the end user.

Widget Classes
The widget classes (there are only two that fall in this category) provide the basicfunctionality to visualize a graph and allow the user to manipulate its layout.
SCROLLABLE_WIDGETGRAPH_WIDGET
SCROLLABLE_WIDGETRequirements:
none
Description
The SCROLLABLE_WIDGET is basically just an EV_CELL containing two scrollbars and a pixmap filling that part of the cell that is not filled by the two scroll bars. using theset_scrollable_size feature you can set the virtual size of the component that will be drawnon the pixmap. The rest of the class is pretty much straight forward (mostly accessfeatures to the used widgets).
Class overview
topGRAPH_WIDGETRequirements:
SCROLLABLE_WIDGET
Description
The GRAPH_WIDGET lets the user view and manipulate graphs. Its main access methods are private action handlers that get invoked during user interaction with the widget whichtherefore are not part of the public API.
The main public features are

layout_graph which creates an initial layout for the loaded graph using one of the GraphViz layout algorithms.render_graph which renders the graph (if it has a layout) onto the image of the SCROLLABLE_WIDGET.can_preview which determines whether for a given format there is a preview available or not.preview which creates a preview of the selected format (if available).
You can access the current graph via graph and set it using set_graph (this will not refresh the displayed image call render_graph for this).
Class overview
top

GraphViz Wrappers Overview
The GraphViz wrappers are a set of classes that serve as a link to the GraphViz data structures that represent the loaded graph.
How a Graph is loaded by GraphViz
In GraphViz, a graph is loaded from a DOT file by recreating the graphs primary structure (nodes, edges) as C structs. Some other structs that will later contain the layoutinformation are allocated as well, but initially there is no data in them. The attributes fromthe dot file are attached to these structs in their original (string) form and most of them are NEVER loaded into the corresponding C structs. This is one of the many problems ofGraphViz since there is no possibility to load the string attributes into the C structures besides parsing the strings yourself and setting the values in the layout structs (which hasbeen done in this library).
The graph's secondary structure (clusters, sub-graphs) is loaded into a second set of thesame C structs as the primary structure. In this meta graph, clusters are nodes and edgesspecify the hierarchy of the clusters. (This structure is only partially loaded in the Graph Widget library)
After the graph has been loaded, the user of the GraphViz library can apply any of the GraphViz layout engines to the graph. Each of these layout algorithms then store their layout data in the C layout structs, overwriting any previous modifications to thesestructures. Some of the algorithms even overwrite some of the string attributes that havebeen loaded from the DOT file (which they are not supposed to do) which makes it pretty hard to preserve any kind of layout information.
Eiffel Wrappers and Externals
Each wrapper class (classes starting with the prefix GV_) takes a pointer to one of themany C structs and provides some methods to access and modify this struct. All the Eiffelexternals are grouped in the *_OPERATIONS classes in the "externals" cluster of the GraphWidget library. I would love to refer you to the GraphViz documentation for further details on the C structures and methods, but most of the available documentation was (at thetime this was written) either speculative (referring to future versions) or horribly outdated.Therefore, I added a little one or two sentence summary on every external feature in theexternals section of this document.
Common Functionalities
All wrapper classes have some basic functionality in common: First, they are allDRAWABLE which means they have a graphical representation which can be rendered on a EV_DRAWABLE. The drawing is recursive, which means that drawing the graph will draw the sub clusters, will draw the nodes and so on. Some of the wrappers are also MOVABLEwhich allows the GRAPH_WIDGET to do drag and drop layout of the graph. The last common functionality is the load_attributes feature. Like drawing, this is also a recursive feature and it allows to load the string attributes of the graph into the C layout structures(this is the trick that allows the graph widget to load a previously saved layout that has been modified by the user). This is the most important feature. Without it, saving layoutinformation for later use would be quite useless since it would be impossible to load itagain.
GraphViz Wrappers Classes
The wrapper classes each have a C struct counterpart. At the core, there is always apointer to one of these C structs and manipulations on the Eiffel class are propagated backto the C struct since that is the only way to communicate with GraphViz.
GV_GRAPHGV_CLUSTERGV_NODEGV_EDGEGV_SPLINE
GV_GRAPHRequirements:
GV_CLUSTER
Description
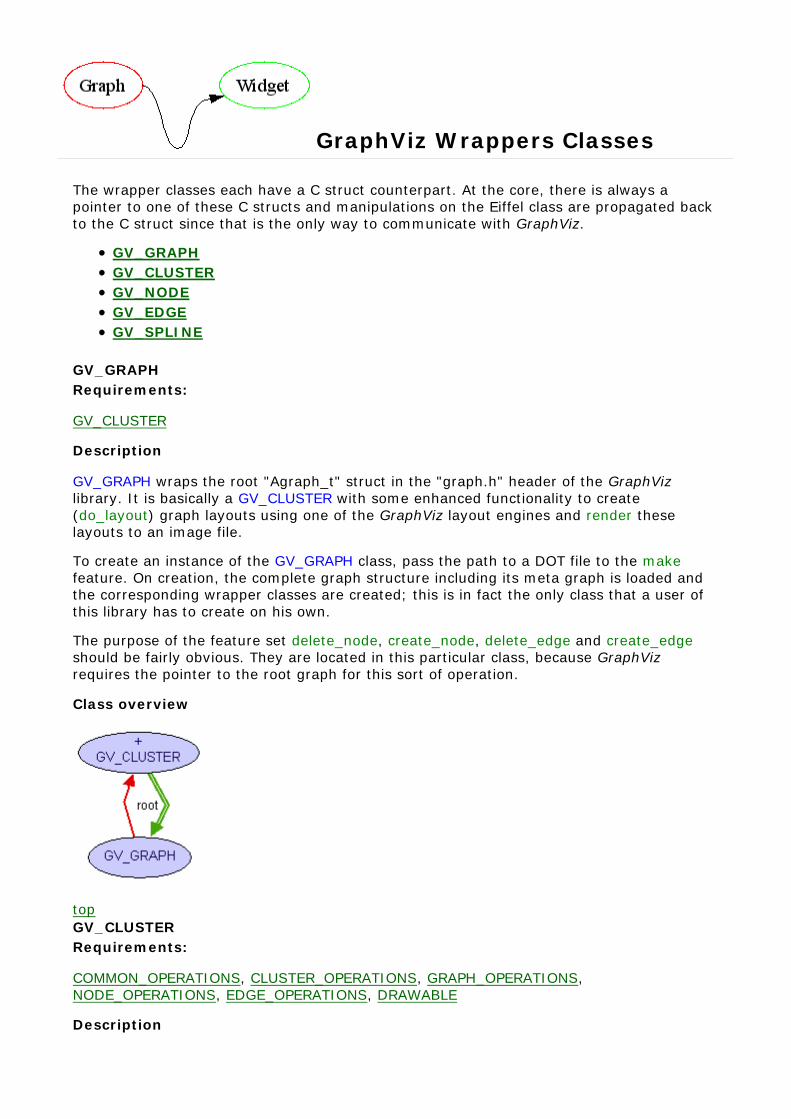
GV_GRAPH wraps the root "Agraph_t" struct in the "graph.h" header of the GraphVizlibrary. It is basically a GV_CLUSTER with some enhanced functionality to create (do_layout) graph layouts using one of the GraphViz layout engines and render these layouts to an image file.
To create an instance of the GV_GRAPH class, pass the path to a DOT file to the makefeature. On creation, the complete graph structure including its meta graph is loaded and the corresponding wrapper classes are created; this is in fact the only class that a user ofthis library has to create on his own.
The purpose of the feature set delete_node, create_node, delete_edge and create_edgeshould be fairly obvious. They are located in this particular class, because GraphVizrequires the pointer to the root graph for this sort of operation.
Class overview
topGV_CLUSTERRequirements:
COMMON_OPERATIONS, CLUSTER_OPERATIONS, GRAPH_OPERATIONS, NODE_OPERATIONS, EDGE_OPERATIONS, DRAWABLE
Description

GV_CLUSTER wraps the "Agraph_t" struct in the "graph.h" header of the GraphViz library. From the GraphWiz documentation it is unclear what its real purpose is, besides giving the graph a more hierarchical structure. In the wrapper it acts as a container for nodes, whereevery cluster contains the nodes of all its sub clusters as well as the direct child nodes ofthe cluster itself.
Apart from that, the GV_CLUSTER is a rectangle representing its bounds. To create one, pass make_cluster a pointer to a "Agraph_t" structure representing the cluster, the parent cluster (to create the tree structure) and the root graph.
There are three special features in the GV_CLUSTER class:
pick_cluster picks the cluster at the given coordinates which is furthest down in the tree structure.recalc_bb recalculates the bounding box rectangle to fit all the nodes contained in thecluster (useful, if you move nodes around).preload_attributes is actually the fix for a GraphViz bug. When performing a layout operation on a graph, GraphViz overrides the "bb" (bounding box) string attribute of the root graph, which it is NOT supposed to do. To prevent this from affecting theprogram, the preload_attributes feature has to be called before any layout operation.It stores the string attribute in a class variable, so when the actual load_attributescall happens, it can restore the original bounding box, and not the one calculated by GraphViz.
Class overview
topGV_NODERequirements:
COMMON_OPERATIONS, NODE_OPERATIONS, MOVABLE
Description
GV_NODE wraps the "Agnode_t" struct in the "graph.h" header of the GraphViz library. Its main purpose (the drawing of the node's shape) is actually defined in another set of classes, namely NODE_SHAPE and its descendants. What remains is a collection of position(x, set_x, y and set_y) and size (width, height, ...) attributes that define the nodes appearance (
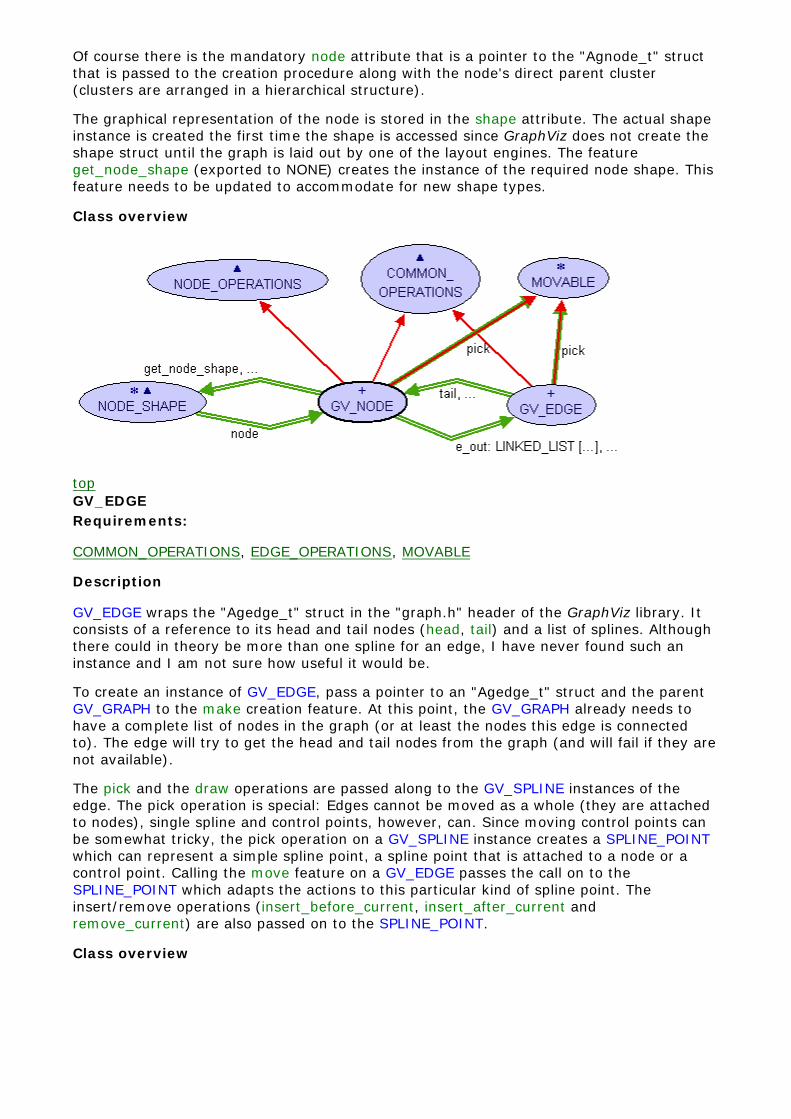
Of course there is the mandatory node attribute that is a pointer to the "Agnode_t" struct that is passed to the creation procedure along with the node's direct parent cluster(clusters are arranged in a hierarchical structure).
The graphical representation of the node is stored in the shape attribute. The actual shape instance is created the first time the shape is accessed since GraphViz does not create the shape struct until the graph is laid out by one of the layout engines. The feature get_node_shape (exported to NONE) creates the instance of the required node shape. Thisfeature needs to be updated to accommodate for new shape types.
Class overview
topGV_EDGERequirements:
COMMON_OPERATIONS, EDGE_OPERATIONS, MOVABLE
Description
GV_EDGE wraps the "Agedge_t" struct in the "graph.h" header of the GraphViz library. It consists of a reference to its head and tail nodes (head, tail) and a list of splines. Although there could in theory be more than one spline for an edge, I have never found such an instance and I am not sure how useful it would be.
To create an instance of GV_EDGE, pass a pointer to an "Agedge_t" struct and the parent GV_GRAPH to the make creation feature. At this point, the GV_GRAPH already needs to have a complete list of nodes in the graph (or at least the nodes this edge is connected to). The edge will try to get the head and tail nodes from the graph (and will fail if they arenot available).
The pick and the draw operations are passed along to the GV_SPLINE instances of the edge. The pick operation is special: Edges cannot be moved as a whole (they are attached to nodes), single spline and control points, however, can. Since moving control points canbe somewhat tricky, the pick operation on a GV_SPLINE instance creates a SPLINE_POINTwhich can represent a simple spline point, a spline point that is attached to a node or a control point. Calling the move feature on a GV_EDGE passes the call on to the SPLINE_POINT which adapts the actions to this particular kind of spline point. The insert/remove operations (insert_before_current, insert_after_current and remove_current) are also passed on to the SPLINE_POINT.
Class overview

topGV_SPLINERequirements:
SPLINE_OPERATIONS, DRAWABLE
Description
GV_SPLINE is a wrapper for the "bezier" struct in the "types.h" header of the GraphVizlibrary. A GV_SPLINE can have a head and/or a tail (has_head, has_tail and head, tailrespectively) where an arrowhead will be drawn.
The creation procedure (make) of GV_SPLINE takes a pointer to a bezier struct and a pointer to its parent edge as arguments. After creation the spline can be drawn via thedraw feature.
There is also a set of spline manipulation features:
insert_point_before inserts a new spline point (and two control points) after a given spline point.insert_point_after inserts a new spline point (and two control points) before a given spline point.remove_point removes a given spline point and the one or two control points associated with it.
Class overview
top

Graph Widget Externals
These classes provide the communication channel to the GraphViz C library. The C functions are grouped into classes according to the class they belong to most (actually most of the functions "belong" to more than one class, since C is not object oriented). Thewrapper classes then inherit from the external classes to gain access to the operationsthey need.
COMMON_OPERATIONSGRAPH_OPERATIONSCLUSTER_OPERATIONSNODE_OPERATIONSEDGE_OPERATIONSSPLINE_OPERATIONS
COMMON_OPERATIONS
get_attribute (obj: POINTER; name: STRING) : STRINGC NameHeader FileDescription gets the string representation of the attribute with the given name
c_agget (p, s: POINTER) : POINTERC Name aggetHeader File gvc.h
Description gets the attribute specified by its name s from the graph, node or edge p
c_agset (p, n, v: POINTER) : INTEGERC Name agsetHeader File gvc.hDescription sets the attribute n of graph, node or edge p to value v
c_agdelete (g, p: POINTER)C Name agdeleteHeader File gvc.hDescription removes the graph, node or edge p from the graph with root g
GRAPH_OPERATIONS
c_gvContext : POINTERC Name gvContextHeader File gvc.hDescription gets a gv context (used to create layouts)
c_gvLayout (gvc, g, layout: POINTER) : INTEGERC Name gvLayoutHeader File gvc.h
Description applies the layout algorithm layout to the graph g using the gv context gvc
c_gvFreeLayout (gvc, g: POINTER) : INTEGER

C Name gvFreeLayoutHeader File gvc.hDescription releases the layout from graph g (resets all layout related structs)
c_gvRender (gvc, g, output, file: POINTER) : INTEGERC Name gvRenderHeader File gvc.hDescription renders the graph g to the file file using output as file format
c_agread (file: POINTER) : POINTERC Name agreadHeader File gvc.hDescription reads the next graph from file and returns a pointer to it
c_agclose (g: POINTER)C Name agcloseHeader File gvc.hDescription closes the graph g (frees the resources associated with g)
c_attach_attrs (g: POINTER)C Name attach_attrsHeader File gvc.h
Description attaches all layout related attributes to the string attributes (overwriting existing ones)
c_meta_graph (g: POINTER) : POINTERStruct Access g->meta_node->graphHeader File gvc.hDescription gets the pointer to the meta graph of root graph g
CLUSTER_OPERATIONS
c_bb_ll_x (p: POINTER) : INTEGERStruct Access p->u.bb.LL.xHeader File gvc.h
Description gets the x coordinate of the lower left corner of the bounding box of p
c_bb_ll_y (p: POINTER) : INTEGERStruct Access p->u.bb.LL.yHeader File gvc.h
Description gets the y coordinate of the lower left corner of the bounding box of p
c_bb_ur_x (p: POINTER) : INTEGERStruct Access p->u.bb.UR.xHeader File gvc.h
Description gets the x coordinate of the upper right corner of the bounding box of p
c_bb_ur_y (p: POINTER) : INTEGERStruct Access p->u.bb.UR.yHeader File gvc.h
Description gets the y coordinate of the upper right corner of the bounding box of p
c_set_bb_ll_x (p: POINTER; v: INTEGER)Struct Access p->u.bb.LL.x

Header File gvc.hDescription sets the x coordinate of the lower left corner of the bounding box of p
c_set_bb_ll_y (p: POINTER; v: INTEGER)Struct Access p->u.bb.LL.yHeader File gvc.hDescription sets the y coordinate of the lower left corner of the bounding box of p
c_set_bb_ur_x (p: POINTER; v: INTEGER)Struct Access p->u.bb.UR.xHeader File gvc.h
Description sets the x coordinate of the upper right corner of the bounding box of p
c_set_bb_ur_y (p: POINTER; v: INTEGER)Struct Access p->u.bb.UR.yHeader File gvc.h
Description sets the y coordinate of the upper right corner of the bounding box of p
c_agfstnode (g: POINTER) : POINTERC Name agfstnodeHeader File gvc.hDescription returns a pointer to the first node in g
c_agnxtnode (g, n: POINTER) : POINTERC Name agnxtnodeHeader File gvc.hDescription returns the node in g following the node n
c_agfindsubg (p, name: POINTER) : POINTERC Name agfindsubgHeader File gvc.hDescription returns a pointer to a subgraph of p given its name
c_meta_node (g: POINTER) : POINTERStruct Access g->meta_nodeHeader File gvc.hDescription gets the pointer to the meta node of graph g
NODE_OPERATIONS
c_agnode (g, n: POINTER) : POINTERC Name agnodeHeader File gvc.h
Description creates a new node with name n in the subgraph pointed to by g and returns said node pointer
c_agfstout (g: POINTER; n: POINTER) : POINTERC Name agfstoutHeader File gvc.hDescription returns a pointer to the first outgoing edge of n
c_agnxtout (g: POINTER; e: POINTER) : POINTERC Name agnxtoutHeader File gvc.hDescription returns a pointer to the next outgoing edge after e

c_get_name (n: POINTER) : POINTERStruct Access n->nameHeader File gvc.hDescription returns a pointer to a C string containing the name of the node n
c_get_u_coord_x (p: POINTER) : INTEGERStruct Access p->u.coord.xHeader File gvc.hDescription gets the x coordinate of the center of node p
c_set_u_coord_x (p: POINTER; v: INTEGER)Struct Access p->u.coord.xHeader File gvc.hDescription sets the x coordinate of the center of node p
c_get_u_coord_y (p: POINTER) : INTEGERStruct Access p->u.coord.yHeader File gvc.hDescription gets the y coordinate of the center of node p
c_set_u_coord_y (p: POINTER; v: INTEGER)Struct Access p->u.coord.yHeader File gvc.hDescription sets the y coordinate of the center of node p
c_get_width (p: POINTER) : DOUBLEStruct Access p->u.widthHeader File gvc.hDescription gets the width (in inches) of the node p
c_set_width (p: POINTER; v: DOUBLE)Struct Access p->u.widthHeader File gvc.hDescription sets the width (in inches) of the node p
c_get_height (p: POINTER) : DOUBLEStruct Access p->u.heightHeader File gvc.hDescription gets the height (in inches) of the node p
c_set_height (p: POINTER; v: DOUBLE)Struct Access p->u.heightHeader File gvc.hDescription sets the height (in inches) of the node p
c_get_shape_name (p: POINTER) : POINTERStruct Access p->u.shape->nameHeader File gvc.hDescription gets the name of the shape of node p
EDGE_OPERATIONS
c_agedge (g, t, h: POINTER) : POINTERC Name agedgeHeader File gvc.hDescription creates a new edge from node t to node h and returns a pointer to it
c_get_head (e: POINTER) : POINTER

Struct Access e->headHeader File gvc.hDescription returns a pointer to the node at the head end of edge e
c_get_tail (e: POINTER) : POINTERStruct Access e->tailHeader File gvc.hDescription returns a pointer to the node at the tail end of edge e
c_get_spline_count (e: POINTER) : INTEGERStruct Access e->u.spl->sizeHeader File gvc.hDescription returns the number of bezier structs associated with edge e
c_get_spline_list (e: POINTER) : POINTERStruct Access
e->u.spl->list
Header File gvc.h
Description returns a pointer to an array of bezier structs representing the splines associated with edge e
c_get_ith_spline (s: POINTER; i: INTEGER) : POINTERC Name i_th_splineHeader File gv_edge.hDescription returns a pointer to the i-th bezier struct in the array pointed to by s
c_reset_edge (e: POINTER; x1, y1, x2, y2: INTEGER)C Name reset_edgeHeader File gv_edge.hDescription resets the edge e to a straight line from point (x1,y1) to point (x2,y2)
c_reset_edge_load (e: POINTER; count: INTEGER)C Name reset_edge_loadHeader File gv_edge.h
Descriptionresets the edge to a state where it has only one spline associated with it which has count points (the points are NOT initialized). This is used to load edges from string attributes.
SPLINE_OPERATIONS
c_get_point_count (b: POINTER) : INTEGERStruct Access b->sizeHeader File gvc.h
Description returns the number of points (regular and control points) in the spline b
c_get_point_list (b: POINTER) : POINTERStruct Access b->listHeader File gvc.h
Description returns a pointer to the first point in the array of points of the spline b
c_get_ith_point (p: POINTER; i: INTEGER) : POINTERC Name i_th_pointHeader File spline.hDescription returns a pointer to the i-th point in the array of points pointed to by p
c_get_sflag (b: POINTER) : BOOLEAN

Struct Access b->sflagHeader File gvc.hDescription returns true if spline b has an arrow tail, false otherwise
c_set_sflag (b: POINTER; v: BOOLEAN)Struct Access b->sflagHeader File gvc.hDescription sets the flag indicating an arrow tail to v
c_get_eflag (b: POINTER) : BOOLEANStruct Access b->eflagHeader File gvc.hDescription returns true if spline b has an arrow head, false otherwise
c_set_eflag (b: POINTER; v: BOOLEAN)Struct Access b->eflagHeader File gvc.hDescription sets the flag indicating an arrow head to v
c_get_sp (p: POINTER) : POINTERC Name bezier_spHeader File spline.hDescription returns a pointer to the pointy end of the arrow tail
c_get_ep (p: POINTER) : POINTERC Name bezier_epHeader File spline.hDescription returns a pointer to the pointy end of the arrow head
c_insert_point (b: POINTER; index: INTEGER)C Name insert_pointHeader File spline.h
Description creates a new spline point and one or two control points at index in splie b
c_delete_point (b: POINTER; index: INTEGER)C Name delete_pointHeader File spline.hDescription deletes the spline point at index (and its control points) from spline b

Visual Aspects Overview
A graph is a simple hierarchical structure: In the case described here, the graph (which is acluster) contains sub clusters and nodes as children. The nodes have edges as children andthe edges have splines. When a graph is drawn, the draw command is passed down thishierarchy and thus the image of the graph is created. The figure below shows this hierarchicalstructure.

Interfaces
This section describes the two deferred classes that build the basis for the visualization ofthe graph objects.
DRAWABLEMOVABLE
DRAWABLERequirements:
none
Description
Every drawable object has a primary color (color, set_color) and a deferred draw (rect: RECT; offset: POINT; zoom: DOUBLE; image: EV_DRAWABLE) feature. To decide whether or not the object should be drawn at all, the rect parameter defines a rectangular region ingraph space (not image pixel space!) that should be drawn. The offset defines the distancefrom the top left corner of the image to the top left corner of the rectangle in image space;that is the x and y offset that has to be added to every draw operation on the image. Thezoom parameter specifies the scaling factor for the graphical primitive and triggersdifferent transformations for each drawable object.
The DRAWABLE interface is implemented in every Graph Widget class that is used for the graph representation (which includes almost every class in the library). To get a betteridea of how it works, please refer to the source code of one of the implementations.
Class overview
topMOVABLERequirements:
DRAWABLE
Description

MOVABLE is the deferred base class for graphical objects that can be moved. The actual movement is mostly done by dragging the object with the mouse, but it could also be doneby the program itself (move). Since it is mostly used for dragging, there are some featuresdirectly related to that. Instead of redrawing the entire visible graph over and over againeach time the mouse moves, the implementation takes another approach: When a dragoperation is initiated, the static part of the graph (all parts that are not currently draggedaround) is drawn onto an off screen surface and every time the mouse moves, this imageis copied to the main image and the moving parts are drawn as an overlay (using adifferent color).
To create the static off screen image, the movable parts have to be prevented from beingdrawn (disable) and later on they have to be drawn manually (manual_draw) to create the overlay. This is why the MOVABLE class provides a standard implementation for the drawfeature of DRAWABLE while introducing the new deferred draw_impl. Once the drag operation has been completed, the movable object is re-enabled and everything is back to normal.
Class overview
top
Points and Rectangles
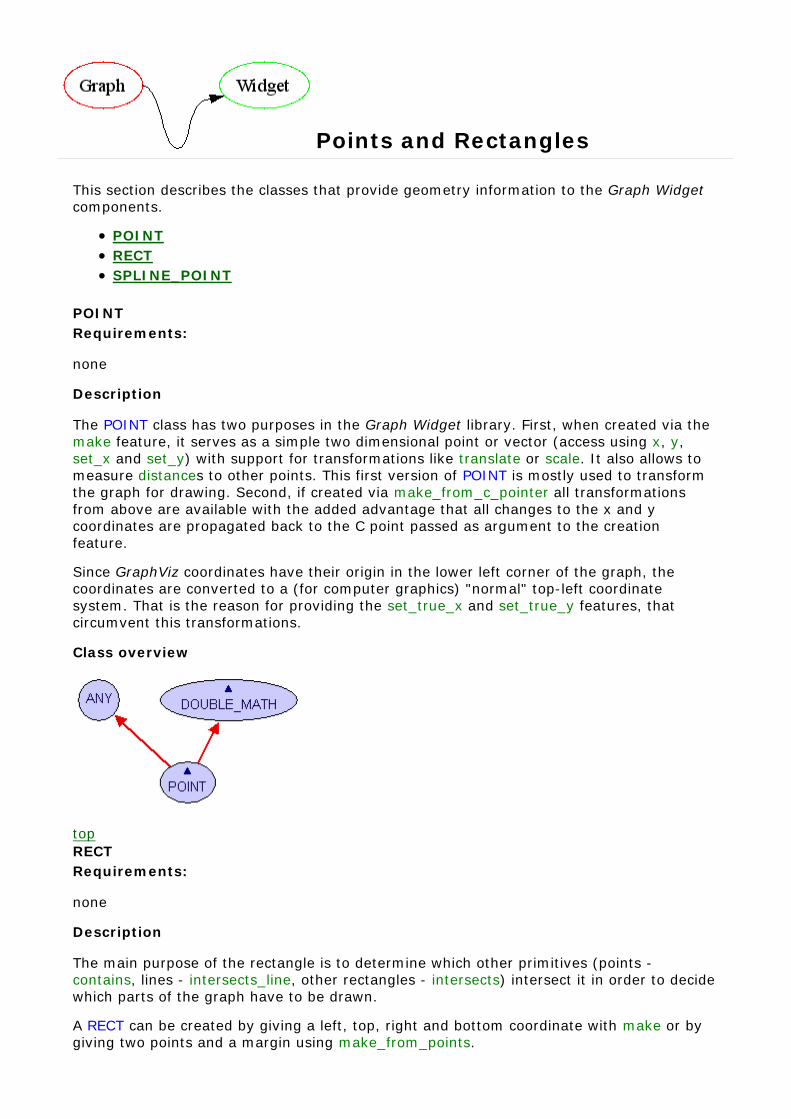
This section describes the classes that provide geometry information to the Graph Widgetcomponents.
POINTRECTSPLINE_POINT
POINTRequirements:
none
Description
The POINT class has two purposes in the Graph Widget library. First, when created via the make feature, it serves as a simple two dimensional point or vector (access using x, y, set_x and set_y) with support for transformations like translate or scale. It also allows to measure distances to other points. This first version of POINT is mostly used to transform the graph for drawing. Second, if created via make_from_c_pointer all transformations from above are available with the added advantage that all changes to the x and y coordinates are propagated back to the C point passed as argument to the creationfeature.
Since GraphViz coordinates have their origin in the lower left corner of the graph, the coordinates are converted to a (for computer graphics) "normal" top-left coordinatesystem. That is the reason for providing the set_true_x and set_true_y features, that circumvent this transformations.
Class overview
topRECTRequirements:
none
Description
The main purpose of the rectangle is to determine which other primitives (points -contains, lines - intersects_line, other rectangles - intersects) intersect it in order to decide which parts of the graph have to be drawn.
A RECT can be created by giving a left, top, right and bottom coordinate with make or by giving two points and a margin using make_from_points.
Like in the POINT class, there are also features to transform the rectangle (mostly used in the drawing features). They are: expand, rescale and translate. There is also a feature to extend the rectangle to include a specific point, which is especially useful for cluster resizing.
Class overview
topSPLINE_POINTRequirements:
MOVABLE
Description
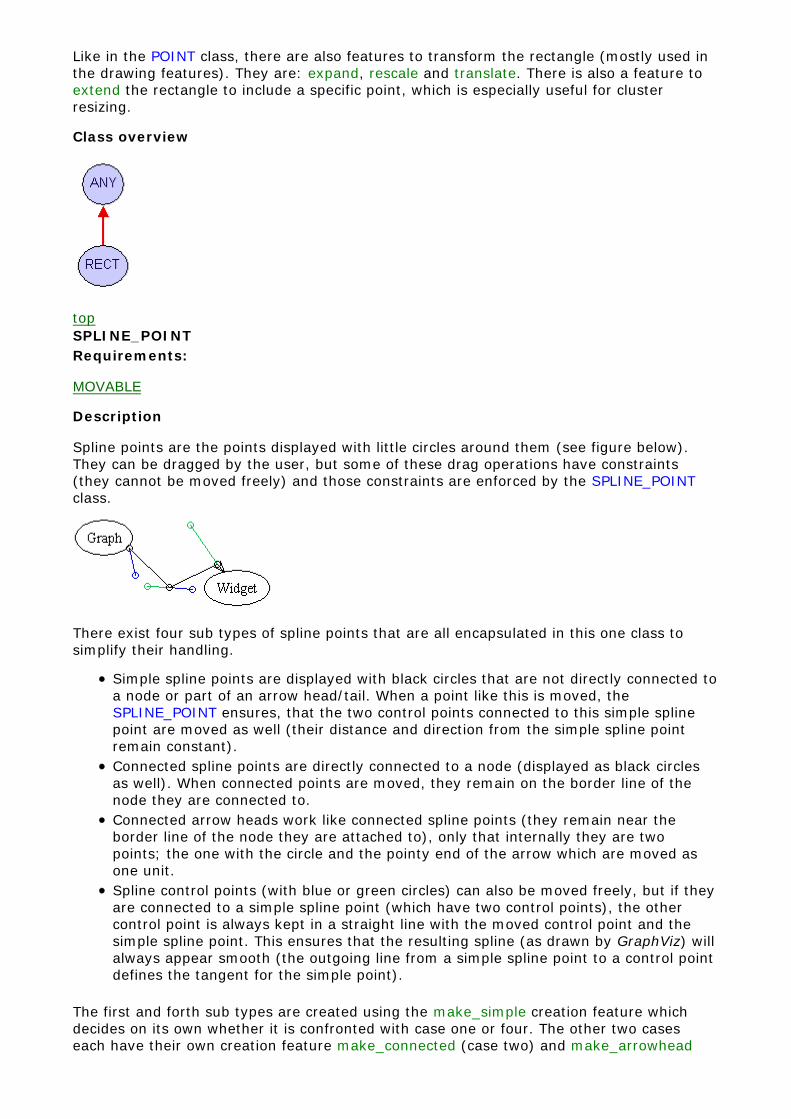
Spline points are the points displayed with little circles around them (see figure below).They can be dragged by the user, but some of these drag operations have constraints(they cannot be moved freely) and those constraints are enforced by the SPLINE_POINTclass.
There exist four sub types of spline points that are all encapsulated in this one class tosimplify their handling.
Simple spline points are displayed with black circles that are not directly connected toa node or part of an arrow head/tail. When a point like this is moved, theSPLINE_POINT ensures, that the two control points connected to this simple spline point are moved as well (their distance and direction from the simple spline pointremain constant).Connected spline points are directly connected to a node (displayed as black circlesas well). When connected points are moved, they remain on the border line of thenode they are connected to.Connected arrow heads work like connected spline points (they remain near theborder line of the node they are attached to), only that internally they are twopoints; the one with the circle and the pointy end of the arrow which are moved asone unit.Spline control points (with blue or green circles) can also be moved freely, but if theyare connected to a simple spline point (which have two control points), the othercontrol point is always kept in a straight line with the moved control point and thesimple spline point. This ensures that the resulting spline (as drawn by GraphViz) will always appear smooth (the outgoing line from a simple spline point to a control pointdefines the tangent for the simple point).
The first and forth sub types are created using the make_simple creation feature which decides on its own whether it is confronted with case one or four. The other two cases each have their own creation feature make_connected (case two) and make_arrowhead

(case three). Since SPLINE_POINT implements MOVABLE it has a move feature. This is where all the actual work of satisfying the constraints is done.
As explained in the description of the GV_SPLINE class, the features insert_point_after, insert_point_before and remove are called by the spline the point belongs to and are nevercalled by anybody else. The "is_" features reflect the sub type of the spline point and areused by the graph widget to determine what options the context menu of a spline point should contain (obviously inserting a point before the first point of the spline does notmake that much sense). Their meaning should be obvious, except maybe is_point which returns true if the point is a spline point (simple, connected or arrowhead) and returns false if it is a control point.
Class overview
top

Node Shapes
The NODE_SHAPE class
Since dragging spline end points along the border of a node is not as easy as it looks, theconcept of a node shape is encapsulated in a separate (deferred) class and itsdescendants.
The NODE_SHAPE class houses the common functionalities for all node shapes:
A creation feature that gets the pointers to the needed C structs called make which should be listed as a creation feature in every descendant of NODE_SHAPEfont gets the EV_FONT that should be used to draw the label of the nodelabel_text gives you the nodes label
Then there are the two features get_port_to_node and get_port_to_point: The idea is to implement get_port_to_point either in a parametric way that gives a point on the nodes border line for each possible parameter or to create actual "ports" that serve as entry/exitpoints for edges (for example, to implement a node shape that has only four points where edges start or end).
The descendants of NODE_SHAPE
Since everything has to end eventually (even my semester project), I only implemented acouple of exemplary node shapes (a subset of the node shapes used by GraphViz). To create a new node, create a new class that inherits from NODE_SHAPE and implement the two features get_port_to_point from NODE_SHAPE and draw from DRAWABLE. Although this can be quite time consuming, it is actually not that difficult to do. To get an idea how it works exactly, take a look at the implemented node shapes in the "node_shapes" clusterof the graph widget library.

Miscellaneous Classes
This entire section is devoted to the most unimportant classes of the Graph Widget project. Feel free to skip it right away.
EDGE_LINENAME_DIALOG
EDGE_LINERequirements:
MOVABLE
Description
The EDGE_LINE is used by the GRAPH_WIDGET as a trick to visualize the process of creating a new edge in the graph. When the user right clicks a node and selects the option"create edge to..." a new EDGE_LINE is created with the selected node as anchor. A line from the center of this node to the current mouse position is drawn to indicate the edgethat will be created. Once the user clicks on a second node, a new edge is created and the EDGE_LINE is destroyed.
Class overview
topNAME_DIALOGRequirements:
EV_DIALOG, EV_DIALOG_CONSTANTS
Description
The NAME_DIALOG is a one to one copy of the EV_MESSAGE_DIALOG class with the addition of one EV_TEXT_FIELD where the user can enter a text.
It is used by the GRAPH_WIDGET to ask the user to enter a name for a new node.
Class overview

top

Graph Widget Test Application Overview
The Graph Widget test application offers a graphical user interface element for almost all features that the GRAPH_WIDGET and GV_GRAPH provide.
Via the "Browse..." button you can select the DOT file to manipulate with the graph widget. Once youpress the "Load" button, the program checks whether the loaded DOT file already contains layoutinformation or not. If the DOT file has a layout, the "Render" button is enabled along with the"Layout" button (otherwise only the "Layout" button is enabled.
Using the output format combo box and the "Preview..." and "Save" buttons, you can take a look atthe preview of certain formats or save your graph in the selected format. To save your layout forlater use, you have to select "dot" as output format, to be able to load it again (reconstruction of agraph from a png file would be a tad difficult).
The zoom of the Graph Widget has still a minor graphical bug (drawing of multiple lines when the zoomed graph is scrolled), but this can always be corrected by pressing the "Render" button thatredraws the whole graph. Apart from that, the zoom feature works just fine and this concludes thislittle tour of the test application.
For a description of the graph widget features, see Graph Widget User Documentation

References
GraphViz
Main page of the GraphViz project.http://www.graphviz.org/
Download page for GraphViz.http://www.graphviz.org/Download.php
GraphViz documentation index.http://www.graphviz.org/Documentation.php
EiffelVision 2
EiffelVision 2 online documentation.http://docs.eiffel.com/eiffelstudio/libraries/vision2/index.html


