CONCURRENCY AND COMPUTATION: PRACTICE AND EXPERIENCEConcurrency Computat.: Pract. Exper. 2010; 22:45–67Published online 13 August 2009 inWiley InterScience (www.interscience.wiley.com). DOI: 10.1002/cpe.1469
Today, personal computers commonly have two to four CPU cores, and shared-memory supercom-puters have hundreds to thousands of cores. In the near future, we may expect personal computers
∗Correspondence to: Kyle B. Wheeler, Sandia National Laboratories, Albuqurque, NM, U.S.A.†E-mail: [email protected]
Contract/grant sponsor: Sandia National Laboratories; contract/grant number: DE-AC04-94AL85000
Copyright q 2009 John Wiley & Sons, Ltd.
46 K. B. WHEELER AND D. THAIN
to have hundreds, and shared-memory supercomputers to have tens of thousands of cores. Asa result, more and more programs must become multithreaded in order to exploit the availablehardware. A number of programming models and libraries such as OpenMP [1], Cilk [2], Intel’sThreading Building Blocks [3], and qthreads [4] are emerging to simplify the construction of suchprograms.Because of its inherent non-determinism, threaded programming has always been a challenging
task. Programmers must avoid errors specific to parallel execution such as race conditions anddeadlocks. Synchronization bugs can hide in programs for years, undetected until a specific machineconfiguration or scheduling order is used. Programmers must also deal with new performance issueslike data structure contention and variable levels of available parallelism in addition to standardperformance tuning issues. Parallelism problems become more complex and hard to analyze orpredict as the scale of parallel execution increases.We have designed ThreadScope to visualize the structure of parallel applications, which assists the
programmer with troubleshooting and debugging massively multithreaded programs. ThreadScopeuses existing tracing tools to instrument multithreaded applications and uses those traces to visualizethe logical structure. The logical structure of multithreaded programs does not rely on a specificorder of execution other than that specified by synchronization methods. This approach removesthe need to replicate a threading problem in order to identify it.The high-level structure of a program reveals the program’s parallel and sequential compo-
nents, as well as potential bottlenecks. This structure is independent of the underlying machine,though may be dependent on the input. Graphs of the structure can be dense and detail-heavy.The challenge in any dense visualization is deciding where to expand and condense details. Toclarify and simplify the visual depiction of the program structure, we employ a static singleassignment (SSA) form to remove programming idioms and coalesce memory cells into logicalmemory objects. These simplification techniques demonstrate how application-specific data struc-tures can be handled. By analyzing the graph structure, we may also identify race conditions anddeadlocks. Unlike some correctness checkers [5], this approach does not require the software tobe described in a new special-purpose language, but can address existing applications withoutmodification. A few key operations—reading and writing to memory, synchronization operations,and spawning or joining threads—are the basic structural elements of any multithreaded applica-tion. Thus, this analysis technique can be a part of the debugging process, rather than the designprocess.Because this approach relies on specific building blocks of multithreaded applications, it is not
specific to a particular threading library or model. This paper demonstrates ThreadScope’s visualiza-tion capabilities and analysis features on several programs using a variety of parallel programmingmodels, and discusses the use of this visualization for structural identification of problems. Theprogramming models used include the Cilk threading library [2], the qthread threading library[4], and the standard pthread library. These models were chosen for their variety of synchroniza-tion mechanisms; however, the ThreadScope technique may be adapted for use with additionalenvironments.The key advance of this work is the graph-based structural approach to error identification,
which can identify race conditions and deadlocks as well as predict potential bottlenecks and theunderlying programming model. Identification of livelocks and analysis of message-passing parallelapplications are venues for future work.
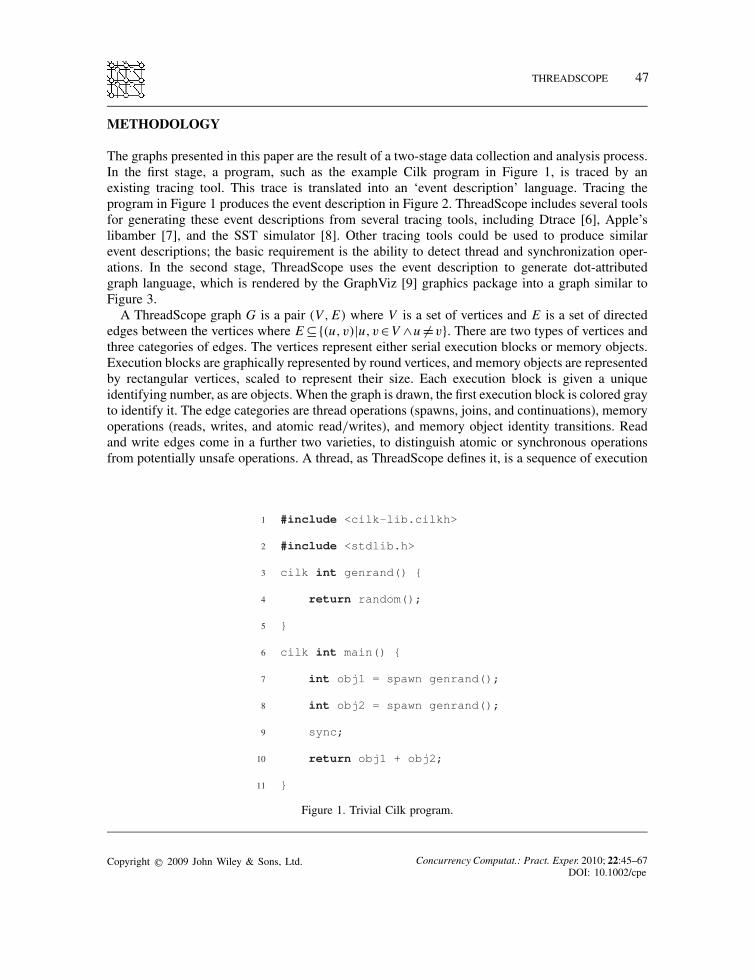
The graphs presented in this paper are the result of a two-stage data collection and analysis process.In the first stage, a program, such as the example Cilk program in Figure 1, is traced by anexisting tracing tool. This trace is translated into an ‘event description’ language. Tracing theprogram in Figure 1 produces the event description in Figure 2. ThreadScope includes several toolsfor generating these event descriptions from several tracing tools, including Dtrace [6], Apple’slibamber [7], and the SST simulator [8]. Other tracing tools could be used to produce similarevent descriptions; the basic requirement is the ability to detect thread and synchronization oper-ations. In the second stage, ThreadScope uses the event description to generate dot-attributedgraph language, which is rendered by the GraphViz [9] graphics package into a graph similar toFigure 3.A ThreadScope graph G is a pair (V,E) where V is a set of vertices and E is a set of directed
edges between the vertices where E⊆{(u,v)|u,v∈V ∧u �=v}. There are two types of vertices andthree categories of edges. The vertices represent either serial execution blocks or memory objects.Execution blocks are graphically represented by round vertices, and memory objects are representedby rectangular vertices, scaled to represent their size. Each execution block is given a uniqueidentifying number, as are objects. When the graph is drawn, the first execution block is colored grayto identify it. The edge categories are thread operations (spawns, joins, and continuations), memoryoperations (reads, writes, and atomic read/writes), and memory object identity transitions. Readand write edges come in a further two varieties, to distinguish atomic or synchronous operationsfrom potentially unsafe operations. A thread, as ThreadScope defines it, is a sequence of execution
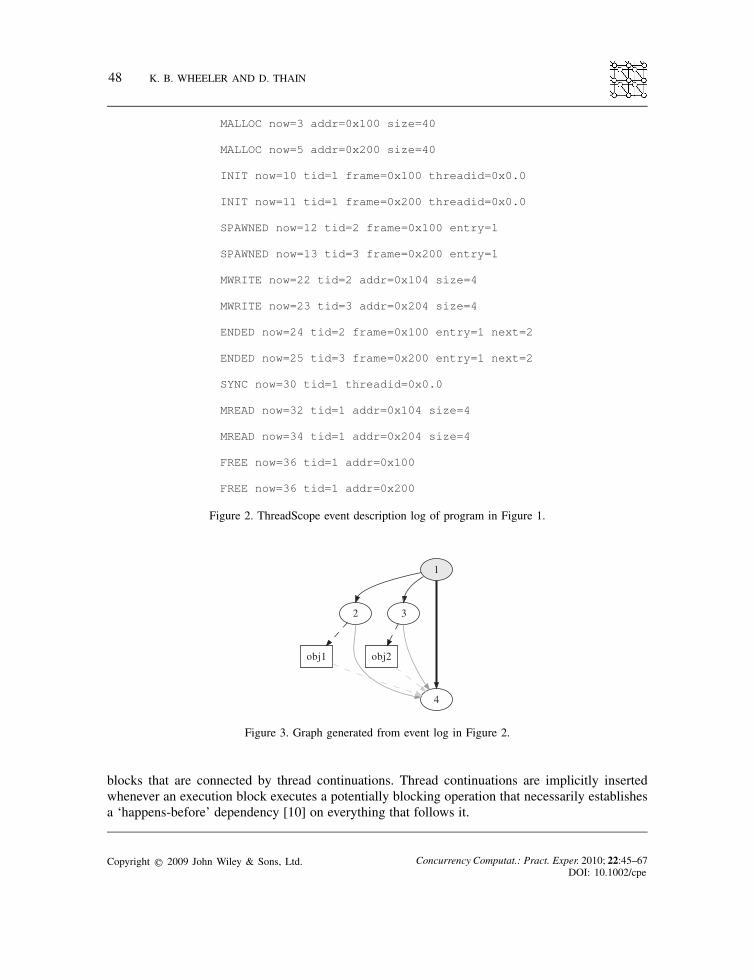
Figure 2. ThreadScope event description log of program in Figure 1.
1
2 3
4
obj1 obj2
Figure 3. Graph generated from event log in Figure 2.
blocks that are connected by thread continuations. Thread continuations are implicitly insertedwhenever an execution block executes a potentially blocking operation that necessarily establishesa ‘happens-before’ dependency [10] on everything that follows it.
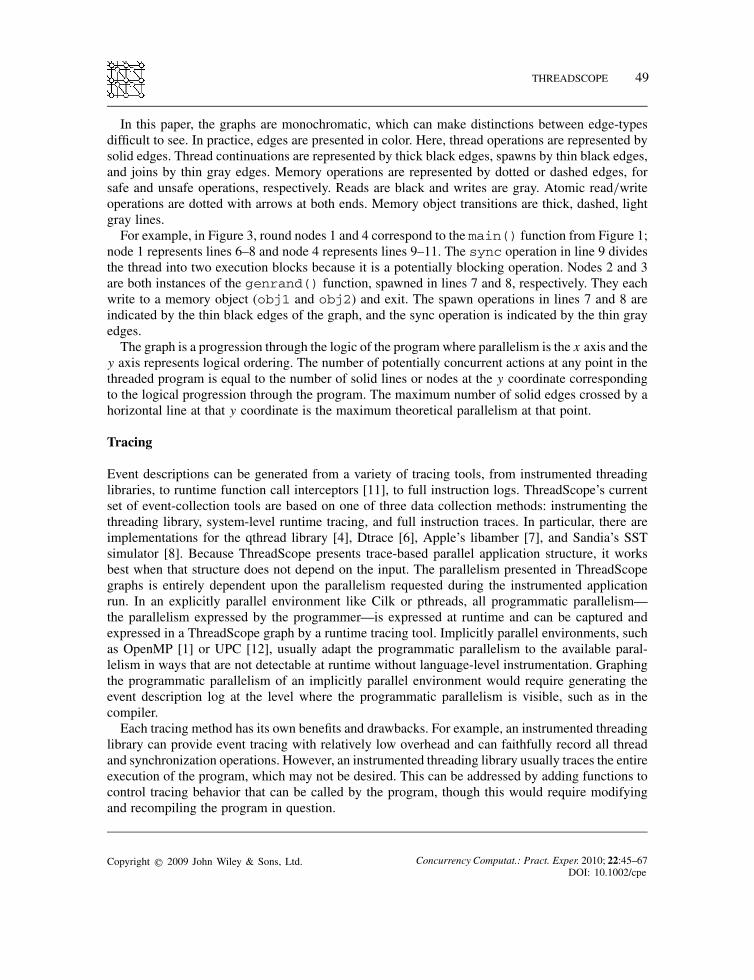
In this paper, the graphs are monochromatic, which can make distinctions between edge-typesdifficult to see. In practice, edges are presented in color. Here, thread operations are represented bysolid edges. Thread continuations are represented by thick black edges, spawns by thin black edges,and joins by thin gray edges. Memory operations are represented by dotted or dashed edges, forsafe and unsafe operations, respectively. Reads are black and writes are gray. Atomic read/writeoperations are dotted with arrows at both ends. Memory object transitions are thick, dashed, lightgray lines.For example, in Figure 3, round nodes 1 and 4 correspond to the main() function from Figure 1;
node 1 represents lines 6–8 and node 4 represents lines 9–11. The sync operation in line 9 dividesthe thread into two execution blocks because it is a potentially blocking operation. Nodes 2 and 3are both instances of the genrand() function, spawned in lines 7 and 8, respectively. They eachwrite to a memory object (obj1 and obj2) and exit. The spawn operations in lines 7 and 8 areindicated by the thin black edges of the graph, and the sync operation is indicated by the thin grayedges.The graph is a progression through the logic of the program where parallelism is the x axis and the
y axis represents logical ordering. The number of potentially concurrent actions at any point in thethreaded program is equal to the number of solid lines or nodes at the y coordinate correspondingto the logical progression through the program. The maximum number of solid edges crossed by ahorizontal line at that y coordinate is the maximum theoretical parallelism at that point.
Tracing
Event descriptions can be generated from a variety of tracing tools, from instrumented threadinglibraries, to runtime function call interceptors [11], to full instruction logs. ThreadScope’s currentset of event-collection tools are based on one of three data collection methods: instrumenting thethreading library, system-level runtime tracing, and full instruction traces. In particular, there areimplementations for the qthread library [4], Dtrace [6], Apple’s libamber [7], and Sandia’s SSTsimulator [8]. Because ThreadScope presents trace-based parallel application structure, it worksbest when that structure does not depend on the input. The parallelism presented in ThreadScopegraphs is entirely dependent upon the parallelism requested during the instrumented applicationrun. In an explicitly parallel environment like Cilk or pthreads, all programmatic parallelism—the parallelism expressed by the programmer—is expressed at runtime and can be captured andexpressed in a ThreadScope graph by a runtime tracing tool. Implicitly parallel environments, suchas OpenMP [1] or UPC [12], usually adapt the programmatic parallelism to the available paral-lelism in ways that are not detectable at runtime without language-level instrumentation. Graphingthe programmatic parallelism of an implicitly parallel environment would require generating theevent description log at the level where the programmatic parallelism is visible, such as in thecompiler.Each tracing method has its own benefits and drawbacks. For example, an instrumented threading
library can provide event tracing with relatively low overhead and can faithfully record all threadand synchronization operations. However, an instrumented threading library usually traces the entireexecution of the program, which may not be desired. This can be addressed by adding functions tocontrol tracing behavior that can be called by the program, though this would require modifyingand recompiling the program in question.
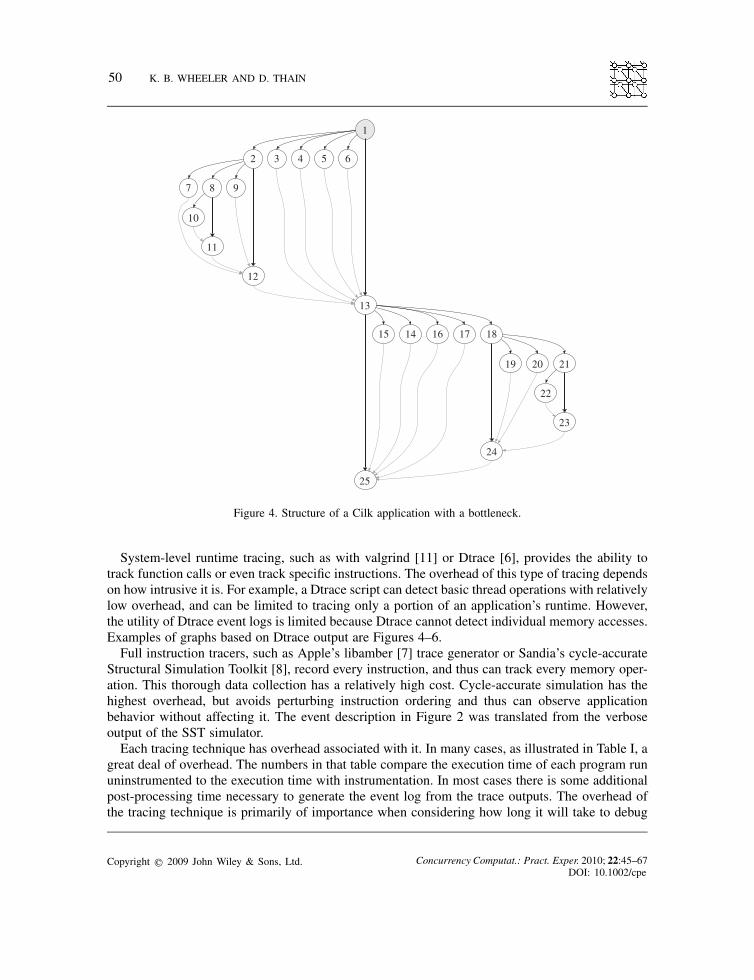
Figure 4. Structure of a Cilk application with a bottleneck.
System-level runtime tracing, such as with valgrind [11] or Dtrace [6], provides the ability totrack function calls or even track specific instructions. The overhead of this type of tracing dependson how intrusive it is. For example, a Dtrace script can detect basic thread operations with relativelylow overhead, and can be limited to tracing only a portion of an application’s runtime. However,the utility of Dtrace event logs is limited because Dtrace cannot detect individual memory accesses.Examples of graphs based on Dtrace output are Figures 4–6.Full instruction tracers, such as Apple’s libamber [7] trace generator or Sandia’s cycle-accurate
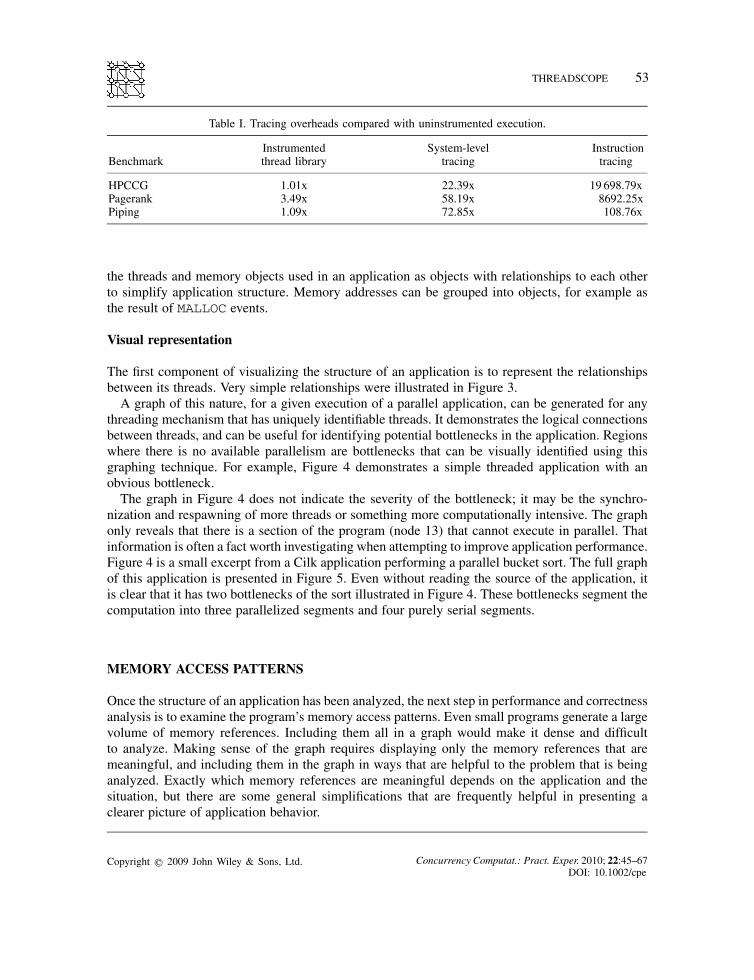
Structural Simulation Toolkit [8], record every instruction, and thus can track every memory oper-ation. This thorough data collection has a relatively high cost. Cycle-accurate simulation has thehighest overhead, but avoids perturbing instruction ordering and thus can observe applicationbehavior without affecting it. The event description in Figure 2 was translated from the verboseoutput of the SST simulator.Each tracing technique has overhead associated with it. In many cases, as illustrated in Table I, a
great deal of overhead. The numbers in that table compare the execution time of each program rununinstrumented to the execution time with instrumentation. In most cases there is some additionalpost-processing time necessary to generate the event log from the trace outputs. The overhead ofthe tracing technique is primarily of importance when considering how long it will take to debug
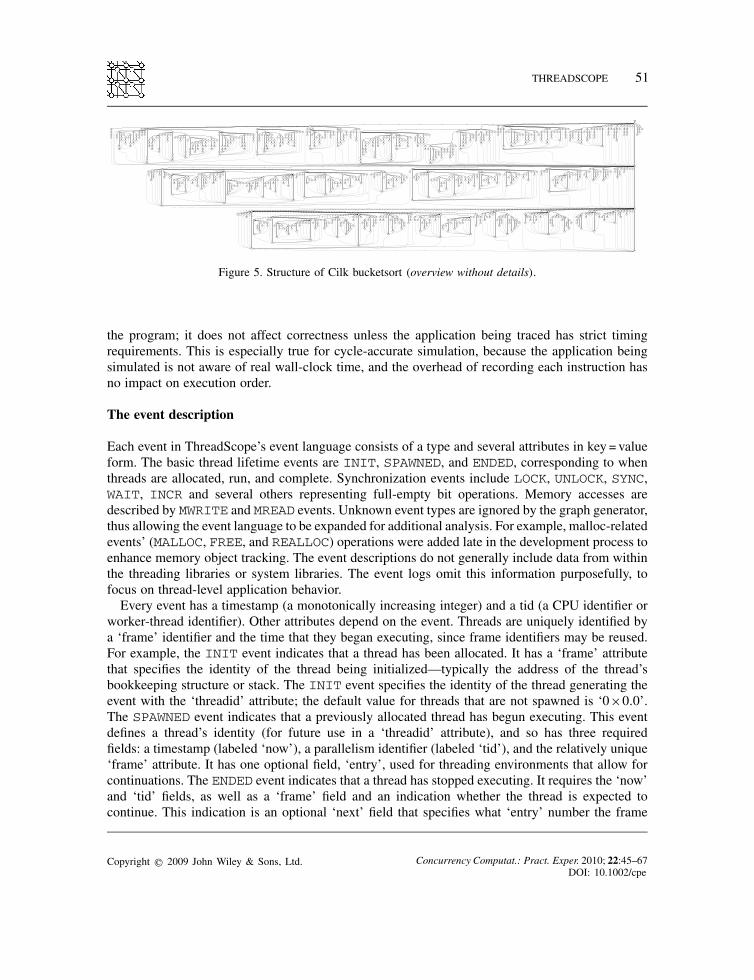
Figure 5. Structure of Cilk bucketsort (overview without details).
the program; it does not affect correctness unless the application being traced has strict timingrequirements. This is especially true for cycle-accurate simulation, because the application beingsimulated is not aware of real wall-clock time, and the overhead of recording each instruction hasno impact on execution order.
The event description
Each event in ThreadScope’s event language consists of a type and several attributes in key = valueform. The basic thread lifetime events are INIT, SPAWNED, and ENDED, corresponding to whenthreads are allocated, run, and complete. Synchronization events include LOCK, UNLOCK, SYNC,WAIT, INCR and several others representing full-empty bit operations. Memory accesses aredescribed by MWRITE and MREAD events. Unknown event types are ignored by the graph generator,thus allowing the event language to be expanded for additional analysis. For example, malloc-relatedevents’ (MALLOC, FREE, and REALLOC) operations were added late in the development process toenhance memory object tracking. The event descriptions do not generally include data from withinthe threading libraries or system libraries. The event logs omit this information purposefully, tofocus on thread-level application behavior.Every event has a timestamp (a monotonically increasing integer) and a tid (a CPU identifier or
worker-thread identifier). Other attributes depend on the event. Threads are uniquely identified bya ‘frame’ identifier and the time that they began executing, since frame identifiers may be reused.For example, the INIT event indicates that a thread has been allocated. It has a ‘frame’ attributethat specifies the identity of the thread being initialized—typically the address of the thread’sbookkeeping structure or stack. The INIT event specifies the identity of the thread generating theevent with the ‘threadid’ attribute; the default value for threads that are not spawned is ‘0×0.0’.The SPAWNED event indicates that a previously allocated thread has begun executing. This eventdefines a thread’s identity (for future use in a ‘threadid’ attribute), and so has three requiredfields: a timestamp (labeled ‘now’), a parallelism identifier (labeled ‘tid’), and the relatively unique‘frame’ attribute. It has one optional field, ‘entry’, used for threading environments that allow forcontinuations. The ENDED event indicates that a thread has stopped executing. It requires the ‘now’and ‘tid’ fields, as well as a ‘frame’ field and an indication whether the thread is expected tocontinue. This indication is an optional ‘next’ field that specifies what ‘entry’ number the frame
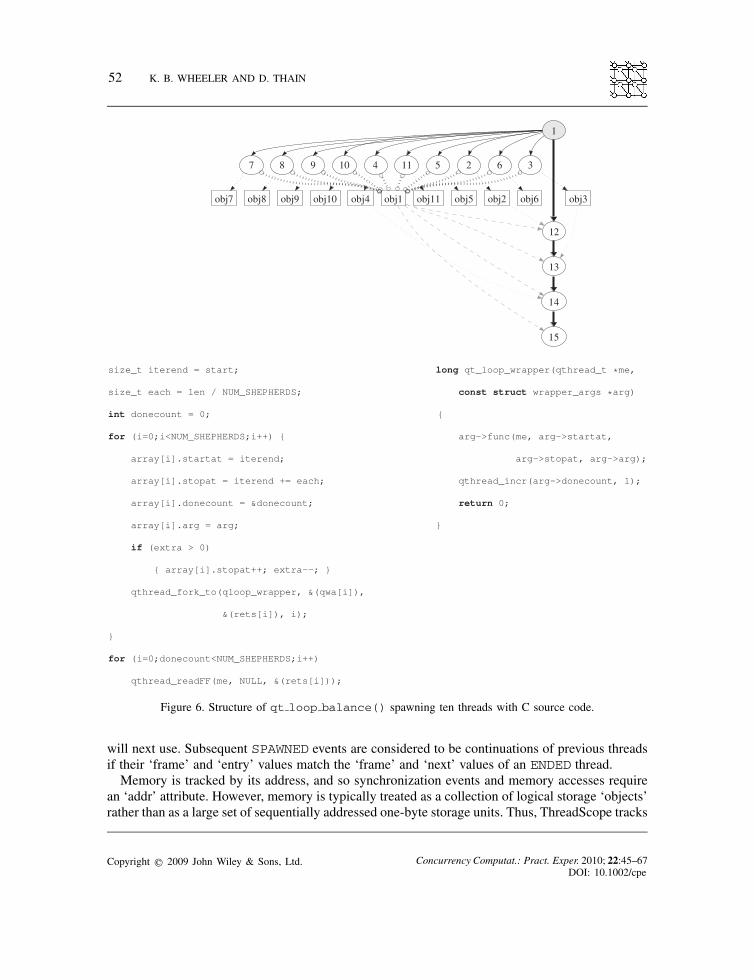
Figure 6. Structure of qt loop balance() spawning ten threads with C source code.
will next use. Subsequent SPAWNED events are considered to be continuations of previous threadsif their ‘frame’ and ‘entry’ values match the ‘frame’ and ‘next’ values of an ENDED thread.Memory is tracked by its address, and so synchronization events and memory accesses require
an ‘addr’ attribute. However, memory is typically treated as a collection of logical storage ‘objects’rather than as a large set of sequentially addressed one-byte storage units. Thus, ThreadScope tracks
the threads and memory objects used in an application as objects with relationships to each otherto simplify application structure. Memory addresses can be grouped into objects, for example asthe result of MALLOC events.
Visual representation
The first component of visualizing the structure of an application is to represent the relationshipsbetween its threads. Very simple relationships were illustrated in Figure 3.A graph of this nature, for a given execution of a parallel application, can be generated for any
threading mechanism that has uniquely identifiable threads. It demonstrates the logical connectionsbetween threads, and can be useful for identifying potential bottlenecks in the application. Regionswhere there is no available parallelism are bottlenecks that can be visually identified using thisgraphing technique. For example, Figure 4 demonstrates a simple threaded application with anobvious bottleneck.The graph in Figure 4 does not indicate the severity of the bottleneck; it may be the synchro-
nization and respawning of more threads or something more computationally intensive. The graphonly reveals that there is a section of the program (node 13) that cannot execute in parallel. Thatinformation is often a fact worth investigating when attempting to improve application performance.Figure 4 is a small excerpt from a Cilk application performing a parallel bucket sort. The full graphof this application is presented in Figure 5. Even without reading the source of the application, itis clear that it has two bottlenecks of the sort illustrated in Figure 4. These bottlenecks segment thecomputation into three parallelized segments and four purely serial segments.
MEMORY ACCESS PATTERNS
Once the structure of an application has been analyzed, the next step in performance and correctnessanalysis is to examine the program’s memory access patterns. Even small programs generate a largevolume of memory references. Including them all in a graph would make it dense and difficultto analyze. Making sense of the graph requires displaying only the memory references that aremeaningful, and including them in the graph in ways that are helpful to the problem that is beinganalyzed. Exactly which memory references are meaningful depends on the application and thesituation, but there are some general simplifications that are frequently helpful in presenting aclearer picture of application behavior.
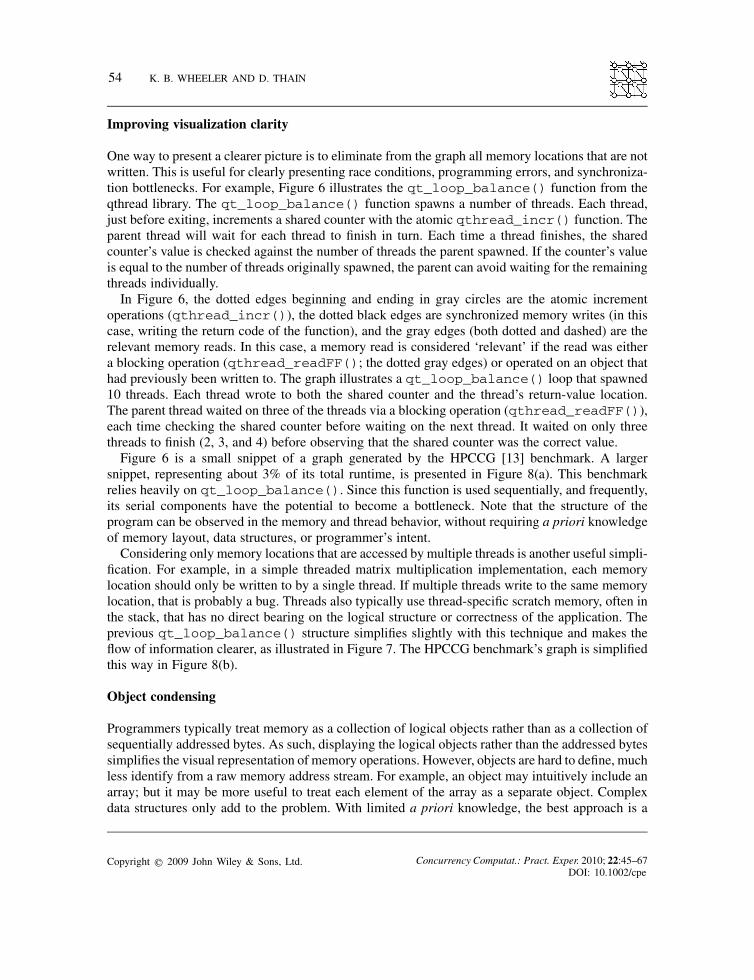
One way to present a clearer picture is to eliminate from the graph all memory locations that are notwritten. This is useful for clearly presenting race conditions, programming errors, and synchroniza-tion bottlenecks. For example, Figure 6 illustrates the qt_loop_balance() function from theqthread library. The qt_loop_balance() function spawns a number of threads. Each thread,just before exiting, increments a shared counter with the atomic qthread_incr() function. Theparent thread will wait for each thread to finish in turn. Each time a thread finishes, the sharedcounter’s value is checked against the number of threads the parent spawned. If the counter’s valueis equal to the number of threads originally spawned, the parent can avoid waiting for the remainingthreads individually.In Figure 6, the dotted edges beginning and ending in gray circles are the atomic increment
operations (qthread_incr()), the dotted black edges are synchronized memory writes (in thiscase, writing the return code of the function), and the gray edges (both dotted and dashed) are therelevant memory reads. In this case, a memory read is considered ‘relevant’ if the read was eithera blocking operation (qthread_readFF(); the dotted gray edges) or operated on an object thathad previously been written to. The graph illustrates a qt_loop_balance() loop that spawned10 threads. Each thread wrote to both the shared counter and the thread’s return-value location.The parent thread waited on three of the threads via a blocking operation (qthread_readFF()),each time checking the shared counter before waiting on the next thread. It waited on only threethreads to finish (2, 3, and 4) before observing that the shared counter was the correct value.Figure 6 is a small snippet of a graph generated by the HPCCG [13] benchmark. A larger
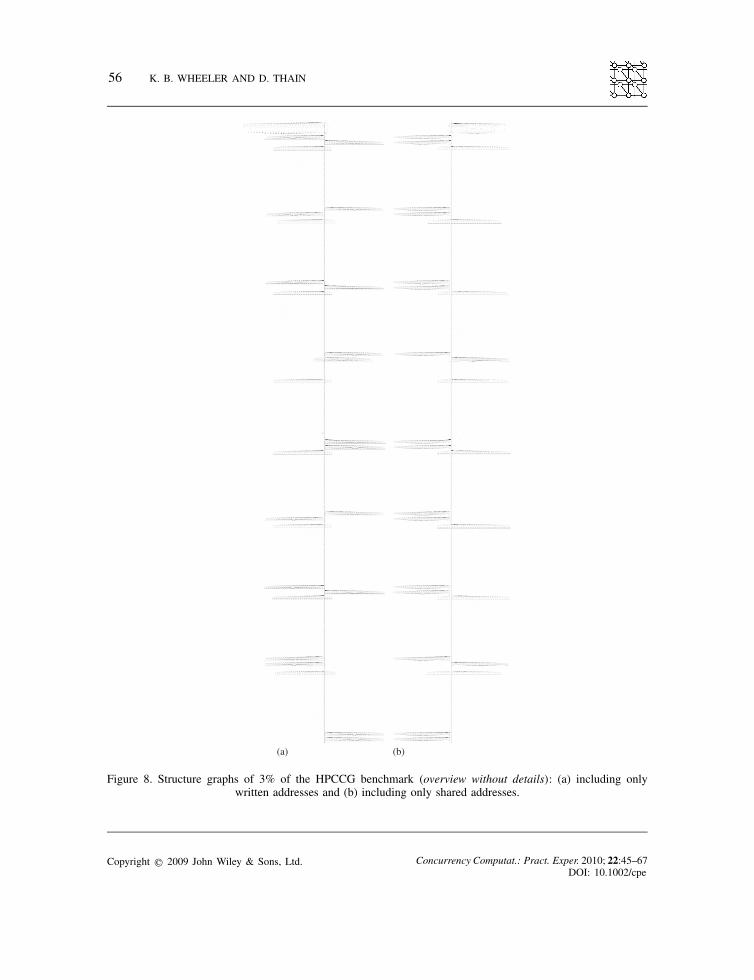
snippet, representing about 3% of its total runtime, is presented in Figure 8(a). This benchmarkrelies heavily on qt_loop_balance(). Since this function is used sequentially, and frequently,its serial components have the potential to become a bottleneck. Note that the structure of theprogram can be observed in the memory and thread behavior, without requiring a priori knowledgeof memory layout, data structures, or programmer’s intent.Considering only memory locations that are accessed by multiple threads is another useful simpli-
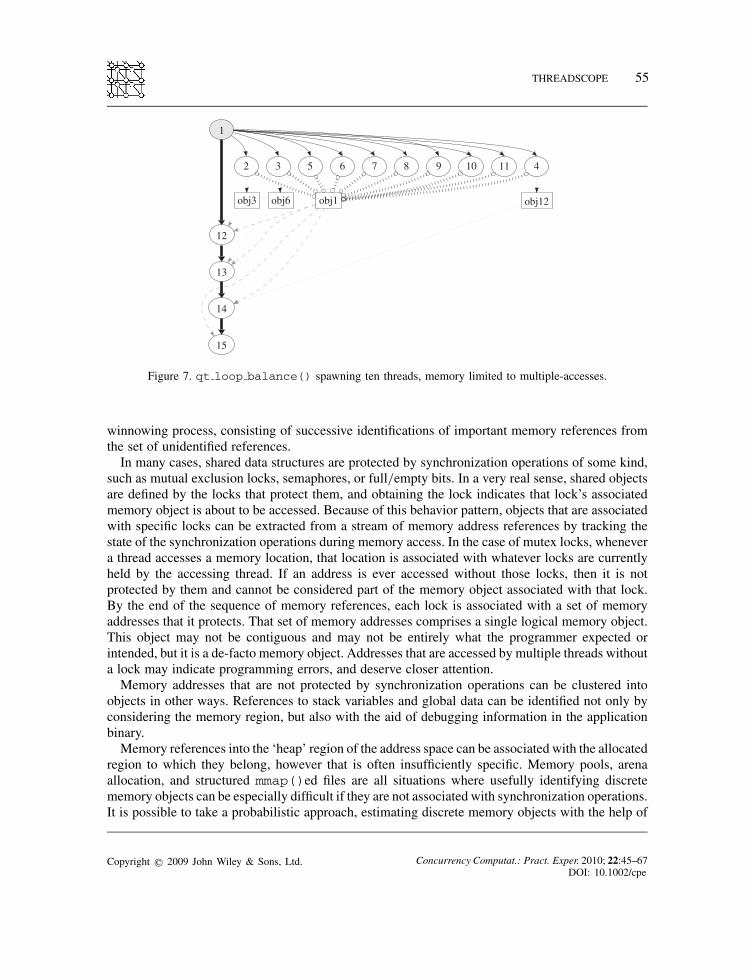
fication. For example, in a simple threaded matrix multiplication implementation, each memorylocation should only be written to by a single thread. If multiple threads write to the same memorylocation, that is probably a bug. Threads also typically use thread-specific scratch memory, often inthe stack, that has no direct bearing on the logical structure or correctness of the application. Theprevious qt_loop_balance() structure simplifies slightly with this technique and makes theflow of information clearer, as illustrated in Figure 7. The HPCCG benchmark’s graph is simplifiedthis way in Figure 8(b).
Object condensing
Programmers typically treat memory as a collection of logical objects rather than as a collection ofsequentially addressed bytes. As such, displaying the logical objects rather than the addressed bytessimplifies the visual representation of memory operations. However, objects are hard to define, muchless identify from a raw memory address stream. For example, an object may intuitively include anarray; but it may be more useful to treat each element of the array as a separate object. Complexdata structures only add to the problem. With limited a priori knowledge, the best approach is a
Figure 7. qt loop balance() spawning ten threads, memory limited to multiple-accesses.
winnowing process, consisting of successive identifications of important memory references fromthe set of unidentified references.In many cases, shared data structures are protected by synchronization operations of some kind,
such as mutual exclusion locks, semaphores, or full/empty bits. In a very real sense, shared objectsare defined by the locks that protect them, and obtaining the lock indicates that lock’s associatedmemory object is about to be accessed. Because of this behavior pattern, objects that are associatedwith specific locks can be extracted from a stream of memory address references by tracking thestate of the synchronization operations during memory access. In the case of mutex locks, whenevera thread accesses a memory location, that location is associated with whatever locks are currentlyheld by the accessing thread. If an address is ever accessed without those locks, then it is notprotected by them and cannot be considered part of the memory object associated with that lock.By the end of the sequence of memory references, each lock is associated with a set of memoryaddresses that it protects. That set of memory addresses comprises a single logical memory object.This object may not be contiguous and may not be entirely what the programmer expected orintended, but it is a de-facto memory object. Addresses that are accessed by multiple threads withouta lock may indicate programming errors, and deserve closer attention.Memory addresses that are not protected by synchronization operations can be clustered into
objects in other ways. References to stack variables and global data can be identified not only byconsidering the memory region, but also with the aid of debugging information in the applicationbinary.Memory references into the ‘heap’ region of the address space can be associated with the allocated
region to which they belong, however that is often insufficiently specific. Memory pools, arenaallocation, and structured mmap()ed files are all situations where usefully identifying discretememory objects can be especially difficult if they are not associated with synchronization operations.It is possible to take a probabilistic approach, estimating discrete memory objects with the help of
Figure 8. Structure graphs of 3% of the HPCCG benchmark (overview without details): (a) including onlywritten addresses and (b) including only shared addresses.
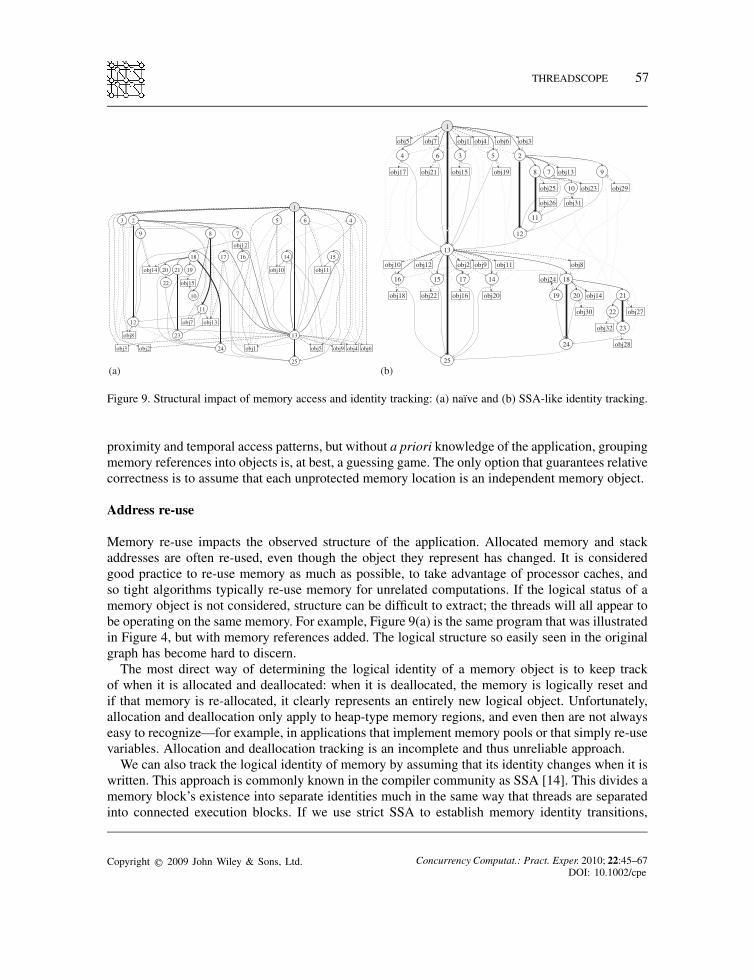
Figure 9. Structural impact of memory access and identity tracking: (a) naıve and (b) SSA-like identity tracking.
proximity and temporal access patterns, but without a priori knowledge of the application, groupingmemory references into objects is, at best, a guessing game. The only option that guarantees relativecorrectness is to assume that each unprotected memory location is an independent memory object.
Address re-use
Memory re-use impacts the observed structure of the application. Allocated memory and stackaddresses are often re-used, even though the object they represent has changed. It is consideredgood practice to re-use memory as much as possible, to take advantage of processor caches, andso tight algorithms typically re-use memory for unrelated computations. If the logical status of amemory object is not considered, structure can be difficult to extract; the threads will all appear tobe operating on the same memory. For example, Figure 9(a) is the same program that was illustratedin Figure 4, but with memory references added. The logical structure so easily seen in the originalgraph has become hard to discern.The most direct way of determining the logical identity of a memory object is to keep track
of when it is allocated and deallocated: when it is deallocated, the memory is logically reset andif that memory is re-allocated, it clearly represents an entirely new logical object. Unfortunately,allocation and deallocation only apply to heap-type memory regions, and even then are not alwayseasy to recognize—for example, in applications that implement memory pools or that simply re-usevariables. Allocation and deallocation tracking is an incomplete and thus unreliable approach.We can also track the logical identity of memory by assuming that its identity changes when it is
written. This approach is commonly known in the compiler community as SSA [14]. This divides amemory block’s existence into separate identities much in the same way that threads are separatedinto connected execution blocks. If we use strict SSA to establish memory identity transitions,
each memory block may eventually obtain a large number of identities. Most of these identitiesare irrelevant to the overall flow of the application and can be merged together. We can focus onimportant memory references by applying the previously discussed simplification heuristics, such aseliminating memory object identities that are not accessed by more than one thread. The operationsupon and previous identities of a memory object impact whether an object must be considered to beshared by multiple threads. For instance, if a memory object is re-used by non-concurrent threads,the two instances are distinct only if the second thread writes to the object before reading fromit. If the first action on the object is a read, the object must be treated as shared with the threadsthat had previously used it. Figures 9(a) and (b) represent the same program, but Figure 9(b) has aclearer structure because of this type of identity tracking.
Condensing structure with a priori knowledge
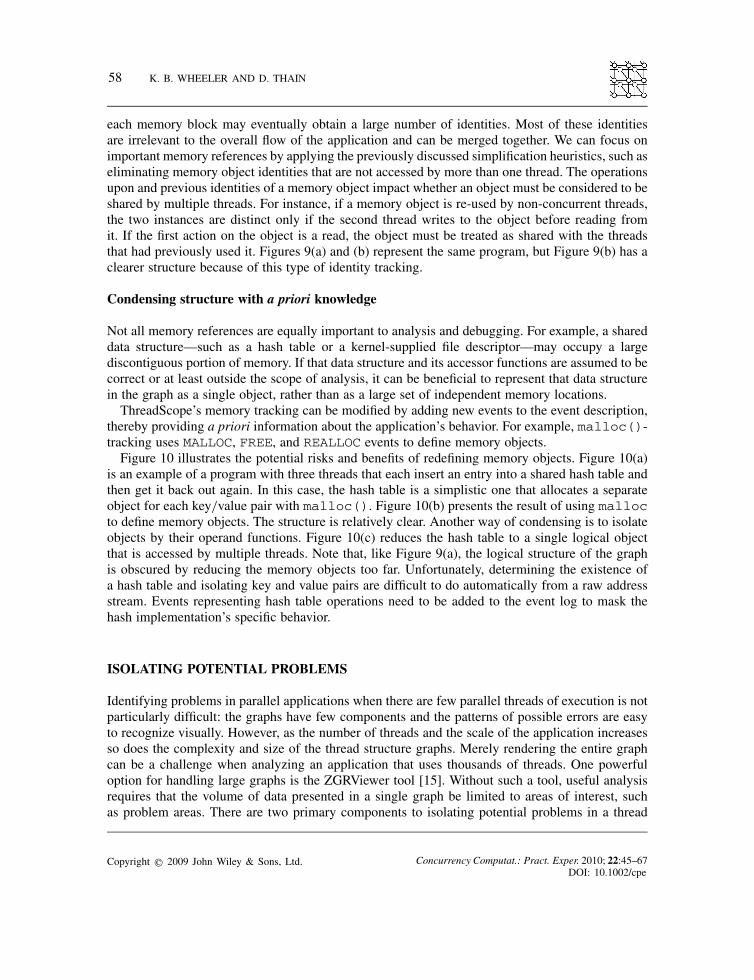
Not all memory references are equally important to analysis and debugging. For example, a shareddata structure—such as a hash table or a kernel-supplied file descriptor—may occupy a largediscontiguous portion of memory. If that data structure and its accessor functions are assumed to becorrect or at least outside the scope of analysis, it can be beneficial to represent that data structurein the graph as a single object, rather than as a large set of independent memory locations.ThreadScope’s memory tracking can be modified by adding new events to the event description,
thereby providing a priori information about the application’s behavior. For example, malloc()-tracking uses MALLOC, FREE, and REALLOC events to define memory objects.Figure 10 illustrates the potential risks and benefits of redefining memory objects. Figure 10(a)
is an example of a program with three threads that each insert an entry into a shared hash table andthen get it back out again. In this case, the hash table is a simplistic one that allocates a separateobject for each key/value pair with malloc(). Figure 10(b) presents the result of using mallocto define memory objects. The structure is relatively clear. Another way of condensing is to isolateobjects by their operand functions. Figure 10(c) reduces the hash table to a single logical objectthat is accessed by multiple threads. Note that, like Figure 9(a), the logical structure of the graphis obscured by reducing the memory objects too far. Unfortunately, determining the existence ofa hash table and isolating key and value pairs are difficult to do automatically from a raw addressstream. Events representing hash table operations need to be added to the event log to mask thehash implementation’s specific behavior.
ISOLATING POTENTIAL PROBLEMS
Identifying problems in parallel applications when there are few parallel threads of execution is notparticularly difficult: the graphs have few components and the patterns of possible errors are easyto recognize visually. However, as the number of threads and the scale of the application increasesso does the complexity and size of the thread structure graphs. Merely rendering the entire graphcan be a challenge when analyzing an application that uses thousands of threads. One powerfuloption for handling large graphs is the ZGRViewer tool [15]. Without such a tool, useful analysisrequires that the volume of data presented in a single graph be limited to areas of interest, suchas problem areas. There are two primary components to isolating potential problems in a thread
structure graph: identification of areas of interest in the graph and selective display of only theportions of the graph relevant to that interest.
Structural threading problems
Some of the most basic problems that afflict threaded programs are structural problems that can berevealed and identified graphically. Problems such as race conditions and deadlocks are commonproblems that can often be discovered using structural analysis.
Deadlocks
Tracking a deadlock down using a basic debugger can be an especially difficult exercisewhen there are a large number of locks involved. Deadlock is defined by the four Coffmanconditions [16]:1. Mutual exclusion.2. Hold and wait.3. No preemption.4. Circular wait.
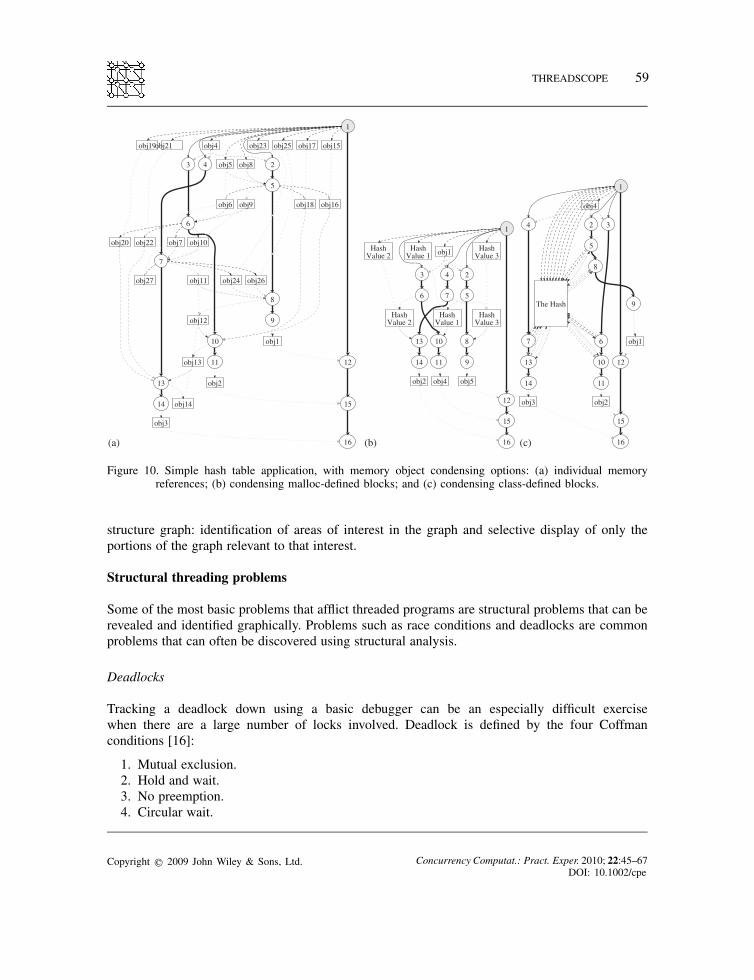
Figure 11. Identification of potential deadlock via structure: (a) circular wait; (b) highlighted circuit;(c) no circular wait; and (d) highlighted dependencies.
In most multithreading programming models, the first three conditions for deadlock are assumed.The fourth, circular wait, is a structural description that becomes apparent from the thread structuregraph of a deadlocked program, even if the program does not deadlock during execution. Figure 11(a)presents a program that does not necessarily deadlock, but has the potential. In this program, twothreads lock two locks. One thread (starting with node 2) locks the first lock (obj1/3/7), unlocksit, then locks and unlocks the second lock (obj2/5/6). The other thread (starting with node 3) locksthe second lock (obj2), locks the first lock (obj3), then unlocks them in the same order. Becauseof the inconsistent ordering, this is a potential deadlock that may not occur at runtime. This canbe detected with dependency tracking [17]. We can interpret the structure graph as a resource-allocation graph that will have a circuit if deadlock can occur. Figure 11(b) highlights the circulardependency. Note that this program can (and did, during graph generation) run to completion,despite the potential deadlock, depending on how the threads are scheduled. Potential deadlock,however, can be identified with a depth-first traversal of the graph. When the previous program isrewritten to ensure that the locks are only obtained in a specific order, as illustrated in Figure 11(c),the circular wait is eliminated. The memory state transitions are highlighted to illustrate the lackof a cycle in Figure 11(d).
Race conditions
There are many different kinds of race conditions, but not all of them can be easily recog-nized by even the most advanced automatic analysis system. We can relatively easily identifybasic race conditions, such as when multiple threads manipulate the same memory object without
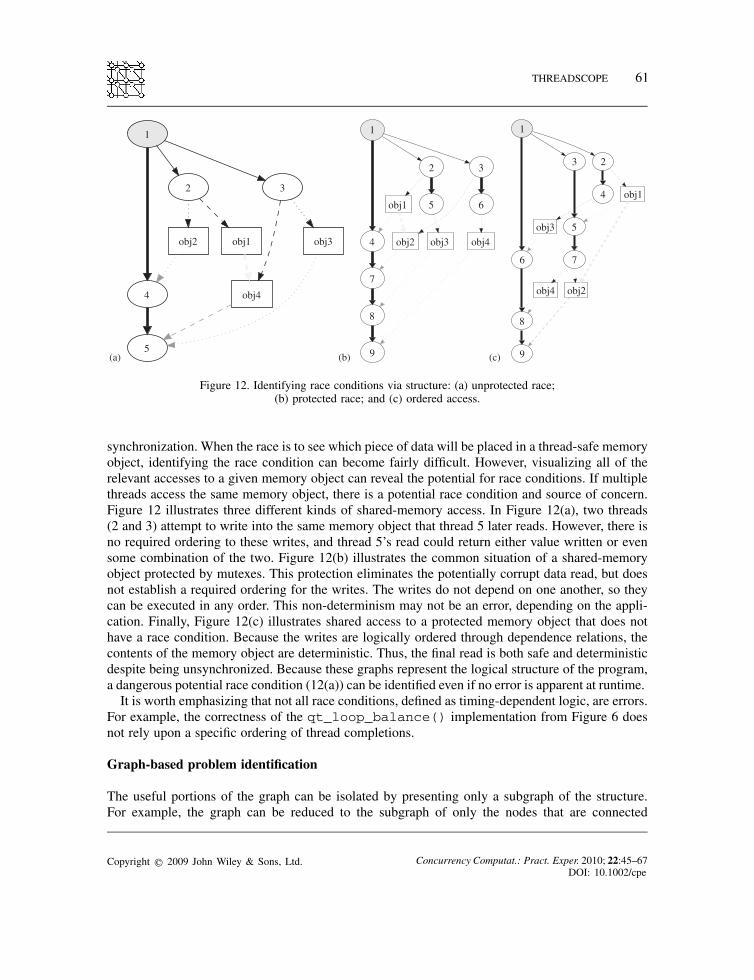
Figure 12. Identifying race conditions via structure: (a) unprotected race;(b) protected race; and (c) ordered access.
synchronization. When the race is to see which piece of data will be placed in a thread-safe memoryobject, identifying the race condition can become fairly difficult. However, visualizing all of therelevant accesses to a given memory object can reveal the potential for race conditions. If multiplethreads access the same memory object, there is a potential race condition and source of concern.Figure 12 illustrates three different kinds of shared-memory access. In Figure 12(a), two threads(2 and 3) attempt to write into the same memory object that thread 5 later reads. However, there isno required ordering to these writes, and thread 5’s read could return either value written or evensome combination of the two. Figure 12(b) illustrates the common situation of a shared-memoryobject protected by mutexes. This protection eliminates the potentially corrupt data read, but doesnot establish a required ordering for the writes. The writes do not depend on one another, so theycan be executed in any order. This non-determinism may not be an error, depending on the appli-cation. Finally, Figure 12(c) illustrates shared access to a protected memory object that does nothave a race condition. Because the writes are logically ordered through dependence relations, thecontents of the memory object are deterministic. Thus, the final read is both safe and deterministicdespite being unsynchronized. Because these graphs represent the logical structure of the program,a dangerous potential race condition (12(a)) can be identified even if no error is apparent at runtime.It is worth emphasizing that not all race conditions, defined as timing-dependent logic, are errors.
For example, the correctness of the qt_loop_balance() implementation from Figure 6 doesnot rely upon a specific ordering of thread completions.
Graph-based problem identification
The useful portions of the graph can be isolated by presenting only a subgraph of the structure.For example, the graph can be reduced to the subgraph of only the nodes that are connected
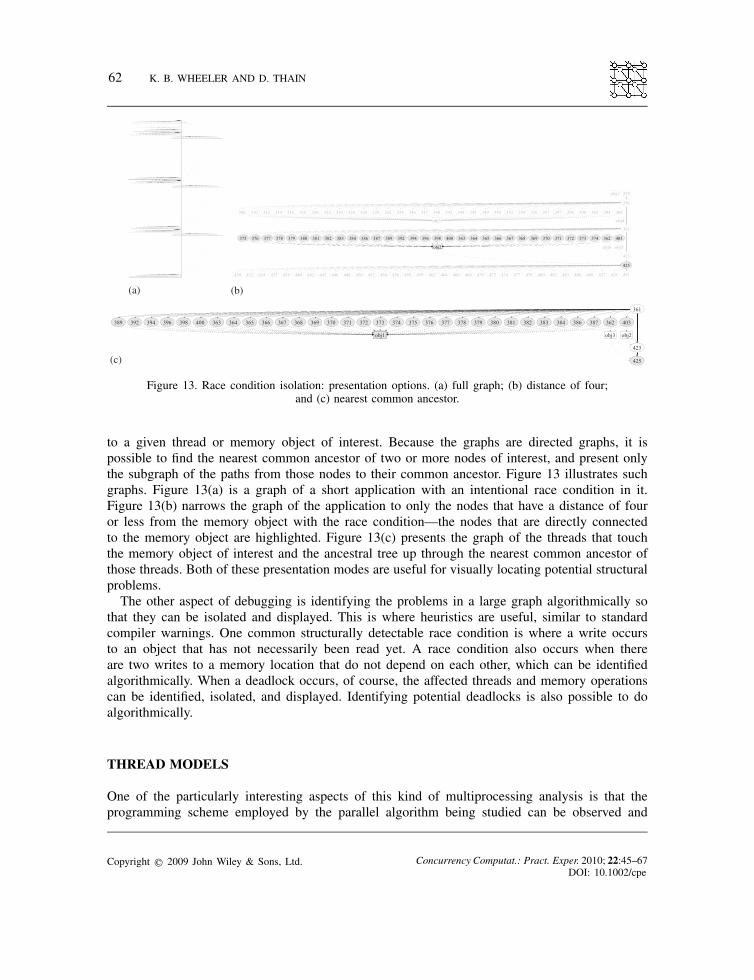
Figure 13. Race condition isolation: presentation options. (a) full graph; (b) distance of four;and (c) nearest common ancestor.
to a given thread or memory object of interest. Because the graphs are directed graphs, it ispossible to find the nearest common ancestor of two or more nodes of interest, and present onlythe subgraph of the paths from those nodes to their common ancestor. Figure 13 illustrates suchgraphs. Figure 13(a) is a graph of a short application with an intentional race condition in it.Figure 13(b) narrows the graph of the application to only the nodes that have a distance of fouror less from the memory object with the race condition—the nodes that are directly connectedto the memory object are highlighted. Figure 13(c) presents the graph of the threads that touchthe memory object of interest and the ancestral tree up through the nearest common ancestor ofthose threads. Both of these presentation modes are useful for visually locating potential structuralproblems.The other aspect of debugging is identifying the problems in a large graph algorithmically so
that they can be isolated and displayed. This is where heuristics are useful, similar to standardcompiler warnings. One common structurally detectable race condition is where a write occursto an object that has not necessarily been read yet. A race condition also occurs when thereare two writes to a memory location that do not depend on each other, which can be identifiedalgorithmically. When a deadlock occurs, of course, the affected threads and memory operationscan be identified, isolated, and displayed. Identifying potential deadlocks is also possible to doalgorithmically.
THREAD MODELS
One of the particularly interesting aspects of this kind of multiprocessing analysis is that theprogramming scheme employed by the parallel algorithm being studied can be observed and
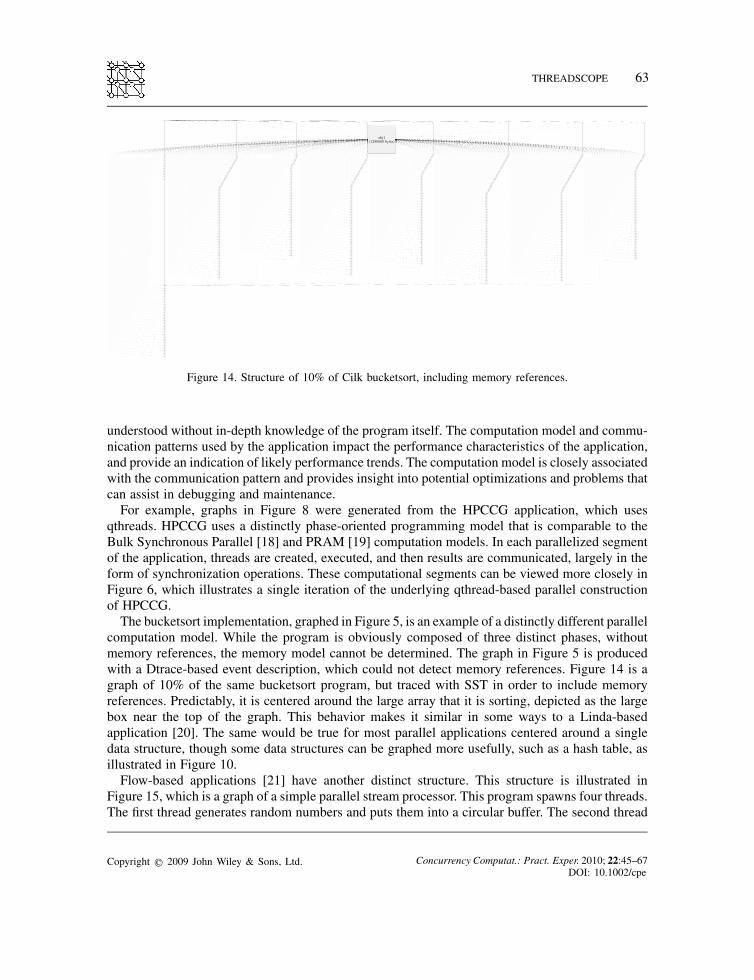
Figure 14. Structure of 10% of Cilk bucketsort, including memory references.
understood without in-depth knowledge of the program itself. The computation model and commu-nication patterns used by the application impact the performance characteristics of the application,and provide an indication of likely performance trends. The computation model is closely associatedwith the communication pattern and provides insight into potential optimizations and problems thatcan assist in debugging and maintenance.For example, graphs in Figure 8 were generated from the HPCCG application, which uses
qthreads. HPCCG uses a distinctly phase-oriented programming model that is comparable to theBulk Synchronous Parallel [18] and PRAM [19] computation models. In each parallelized segmentof the application, threads are created, executed, and then results are communicated, largely in theform of synchronization operations. These computational segments can be viewed more closely inFigure 6, which illustrates a single iteration of the underlying qthread-based parallel constructionof HPCCG.The bucketsort implementation, graphed in Figure 5, is an example of a distinctly different parallel
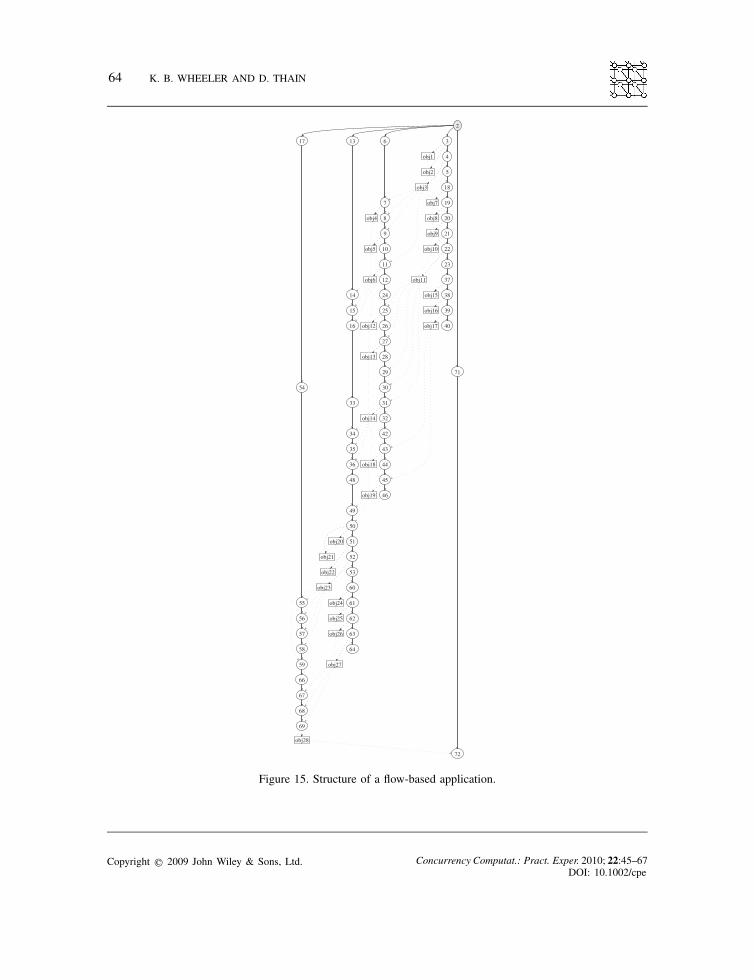
computation model. While the program is obviously composed of three distinct phases, withoutmemory references, the memory model cannot be determined. The graph in Figure 5 is producedwith a Dtrace-based event description, which could not detect memory references. Figure 14 is agraph of 10% of the same bucketsort program, but traced with SST in order to include memoryreferences. Predictably, it is centered around the large array that it is sorting, depicted as the largebox near the top of the graph. This behavior makes it similar in some ways to a Linda-basedapplication [20]. The same would be true for most parallel applications centered around a singledata structure, though some data structures can be graphed more usefully, such as a hash table, asillustrated in Figure 10.Flow-based applications [21] have another distinct structure. This structure is illustrated in
Figure 15, which is a graph of a simple parallel stream processor. This program spawns four threads.The first thread generates random numbers and puts them into a circular buffer. The second thread
fetches numbers from that circular buffer and feeds only the odd numbers into a second circularbuffer. The third thread fetches numbers from the second circular buffer, sorts them, and thenputs them into a third circular buffer. The fourth thread fetches numbers out of the third circularbuffer and prints the unique ones. All three circular buffers have a capacity of three. Note that,rather than relying on a large set of shared objects that multiple threads can access, each shared-memory object is only accessed by two threads. This leads to a distinctive visual pattern. Theresulting thread structure graph has some distinct similarities with respect to the corresponding FBPdiagram.
RELATED WORK
ThreadScope is a hybrid approach to parallel program analysis. It is primarily a visualizer, to makeprogram structure clear and to make structural analysis easy. The graph framework used to generatethis visualization, however, leads to opportunities for detecting basic structural problems algorith-mically.Multithreaded applications have a history of being difficult to visualize, because there are few
strict rules about their behavior. Some of the oldest parallel visualizers, such as Pablo [22] andTapestry [23], are essentially monitoring programs that keep track of statistics like communicationbandwidth and latencies. More recent variations, such as Bedy’s [24] thread monitoring systemand the Gthread [25] visualization package from the PARADE [26] project give somewhat moredetailed information about locks and thread status. Getting more detail has typically meant tailoringthe visualizer to a particular environment. For example, the Gthread system works only on KSRmachines, Eden [27] is specific to Haskel programs, and Paje [28] is a visualization system specif-ically for data-flow programs such as those written in the Athapascan [29] environment. Pajemonitors long-lived parallel threads, diagrams blocked states, and illustrates message transfer andlatency. Assuming that threads are relatively few and long-lived is typical of many parallel visual-izers. In many cases, such as with ParaGraph [30], PARvis [31], and Moviola [32], the visualizationassumes one thread per node, and then focuses on the communication and blocked status of those‘threads’. They provide time-process communication graphs that make it easy to identify basiccommunication problems. Explicit communication is typical of the MPI programming model, andMPI visualization tools like Vampir [33] provide similar information in similar-looking graphs.ThreadScope graphs use communication behavior to help define structure, rather than presenting astructure based on the hardware layout.As multithreaded applications have become more popular, automated correctness checkers have
received a great deal of interest. In some cases these tools stem from serial application correctnesscheckers. This is especially true for memory checkers such as IBM’s Rational Purify [34] andValgrind [11]. Valgrind is particularly interesting because it has developed a validation component,Helgrind [35], to perform validation of common threading operations and watch for potential raceconditions. Another similar tool is Intel’s Thread Checker [36]. These tools are all dynamic programanalysis tools, similar to the tracing tools that generate the event description logs that ThreadScopeuses. The ThreadScope approach is more akin to shape analysis, such as done by Sagiv et al. [37],because of the way it renames memory objects based on access behavior, though ThreadScoperelies primarily on thread behavior.
Analyzing parallel applications continues to be an area of great interest as parallel runtime envi-ronments become more powerful, complex, and unpredictable. The work presented in this paperprovides a powerful method of understanding the behavior of lightweight-threaded applicationsin several common lightweight-threaded environments. This allows application structure to becompared across multiple threading environments and assists in quickly identifying hard-to-reproduce logical problems. Most importantly, this work allows the memory use patterns and threadstructure to be combined in a single visualization tool, enabling not only correctness analysis butalso providing the information necessary to plan thread/data partitioning schemes.
ACKNOWLEDGEMENTS
Sandia is a multiprogram laboratory operated by Sandia Corporation, a Lockheed Martin Company, for the UnitedStates Department of Energy’s National Nuclear Security Administration under Contract DE-AC04-94AL85000.
REFERENCES
1. Chapman B, Jost G, van der Pas R, Kuck DJ. Using OpenMP: Portable Shared Memory Parallel Programming. MITPress: Cambridge, MA, 2007.
2. Blumofe RD, Joerg CF, Kuszmaul BC, Leiserson CE, Randall KH, Zhou Y. Cilk: An efficient multithreaded runtimesystem. Proceedings of the Fifth ACM SIGPLAN Symposium on Principles and Practice of Parallel Programming PPOPP’95. ACM Press: New York, NY, U.S.A., 1995; 207–216. DOI: 10.1145/209936.209958.
3. Intel Corporation. Intel� Threading Building Blocks (1.10 edn), 2008. Available at: http://softwarecommunity.intel.com/isn/downloads/softwareproducts/pdfs/301114.pdf.
4. Wheeler K, Murphy R, Thain D. Qthreads: An API for programming with millions of lightweight threads. Proceedingsof the 22nd IEEE International Parallel and Distributed Processing Symposium, MTAAP ’08. IEEE Computer SocietyPress: Silver Spring, MD, 2008; 1–8. DOI: 10.1109/IPDPS.2008.4536359.
5. Holzmann GJ. The Spin Model Checker: Primer and Reference Manual. Addison-Wesley: Boston, 2004.6. Cantrill BM, Shapiro MW, Leventhal AH. Dynamic instrumentation of production systems. Proceedings of the Annual
Conference on USENIX Annual Technical Conference, ATEC ’04. USENIX Association: Berkeley, CA, U.S.A., 2004; 2.7. Altherr R, Bois RD, Hammond L, Miller E. Software performance tuning with the Apple CHUD tools. IEEE International
Symposium on Workload Characterization 2006; 0:1. DOI: 10.1109/IISWC.2006.302722.8. Rodrigues AF, Murphy RC, Kogge P, Underwood KD. The structural simulation toolkit: Exploring novel architectures.
Proceedings of the 2006 ACM/IEEE Conference on Supercomputing, SC ’06. ACM Press: New York, NY, U.S.A., 2006;157. DOI: 10.1145.1188455.1188618.
9. Gansner ER, North SC. An open graph visualization system and its applications to software engineering.Software—Practice and Experience 2000; 30(11):1203–1233. DOI: 10.1002/1097-024X(200009)30:11<1203::AID-SPE338>3.3.CO;2-E.
10. Lamport L. Time, clocks, and the ordering of events in a distributed system. Communications of the ACM 1978;21(7):558–565. DOI: 10.1145/359545.359563.
11. Nethercote N, Seward J. Valgrind: A framework for heavyweight dynamic binary instrumentation. PLDI ’07: Proceedingsof the 2007 ACM SIGPLAN Conference on Programming Language Design and Implementation. ACM: New York, NY,U.S.A., 2007; 89–100. DOI: 10.1145/1250734.1250746.
12. El-Ghazawi T, Smith L. UPC: Unified parallel C. SC ’06: Proceedings of the 2006 ACM/IEEE Conference onSupercomputing. ACM: New York, NY, U.S.A., 2006; 27. DOI: 10.1145/1188455.1188483.
13. Heroux M. Mantevo. Available at: http://software.sandia.gov/mantevo/ [1 December 2008].14. Cytron R, Ferrante J, Rosen BK, Wegman MN, Zadeck FK. Efficiently computing static single assignment form and
the control dependence graph. ACM Transactions on Programming Languages and Systems 1991; 13(4):451–490. DOI:10.1145/115372.115320.
15. Pietriga E. ZGRViewer, a GraphViz/dot viewer. Available at: http://zvtm.sourceforge.net/zgrviewer.html [7 April 2009].
16. Coffman EG, Elphick M, Shoshani A. System deadlocks. ACM Computing Surveys 1971; 3(2):67–78. DOI:10.1145/356586.356588.
17. Silberschatz A, Galvin PB, Gagne G. Operating System Concepts (6th edn). Wiley: New York, 2003.18. Skillicorn DB, Hill JMD, McColl WF. Questions and answers about BSP. Scientific Programming 1997; 6(3):249–274.19. Fortune S, Wyllie J. Parallelism in random access machines. Proceedings of the 10th Annual ACM Symposium on Theory
of Computing, San Diego, CA, 1978; 114–118. DOI: 10.1145/800133.80433920. Ahuja S, Carriero N, Gelernter D. Linda and friends. Computer 1986; 19(8):26–34. DOI: 10.1109/MC.1986.1663305.21. Morrison JP. Data responsive modular, interleaved task programming system. Technical Disclosure Bulletin 8, IBM,
January 1971.22. Frank EE, Aydt RA. The PABLO performance visualization system functional specification. Department of Computer
Science, University of Illinois, February 1995.23. Malony AD, Reed DA. Visualizing Parallel Computer System Performance. ACM: New York, NY, U.S.A., 1989; 59–90.
DOI: 10.1145/75705.75709.24. Bedy M, Carr S, Huang X, Shene CK. A visualization system for multithreaded programming. SIGCSE ’00: Proceedings
of the Thirty-First SIGCSE Technical Symposium on Computer Science Education. ACM: New York, NY, U.S.A., 2000;1–5. DOI: 10.1145/330908.331798.
25. Zhao QA, Stasko JT. Visualizing the execution of threads-based parallel programs. Technical Report GIT-GVU-95-01,Graphics, Visualization, and Usability Center, Georgia Institute of Technology, Atlanta, GA, January 1995.
26. Stasko JT. The PARADE environment for visualizing parallel program executions: A progress report. Technical ReportGIT-GVU-95-03, Georgia Institute of Technology, 1995.
27. Berthold J, Loogen R. Visualizing parallel functional program runs: Case studies with the eden trace viewer. ParallelComputing: Architectures, Algorithms and Applications (John von Neumann Institute for Computing). Georgia Instituteof Technology: Atlanta, GA, 2007; 121–128.
28. Kergommeaux JCD, Stein BDO, Martin MS. Paje: An extensible environment for visualizing multi-threaded programexecutions. Proceedings of Euro-Par 2000. Springer: Berlin, 2000; 133–144.
29. Galilee F, Roch JL, Cavalheiro GGH, Doreille M. Athapascan-1: On-line building data flow graph in a parallel language.Proceedings of the 1998 International Conference on Parallel Architectures and Compilation Techniques, PACT ’98.IEEE Computer Society Press: Washington, DC, U.S.A., 1998; 88.
30. Heath MT, Finger JE. ParaGraph: A tool for visualizing performance of parallel programs. Technical Report, Oak RidgeNational Laboratory, 1995.
31. Linden LB. Parallel program visualization using ParVis. Parallel Computer Systems: Performance Instrumentation andVisualization. ACM Press: New York, 1990; 157–187. DOI: 10.1145/100215.100265.
32. LeBlanc TJ, Mellor-Crummey JM, Fowler RJ. Analyzing parallel program executions using multiple views. Journal ofParallel and Distributed Computing 1990; 9(2):203–217. DOI: 10.1016/0743-7315(90)90046-R.
33. Nagel WE, Arnold A, Weber M, Solchenbach K. VAMPIR: Visualization and analysis of MPI resources. Supercomputer1996; 12(1):69–80.
34. Software I. Rational purify. Available at: http://www.ibm.com/software/awdtools/purify/ [7 April 2009].35. Jannesari A, Tichy WF. On-the-fly race detection in multi-threaded programs. PADTAD ’08: Proceedings of the
Sixth Workshop on Parallel and Distributed Systems. ACM: New York, NY, U.S.A., 2008; 1–10. DOI: 10.1145/1390841.1390847.
36. Intel Corporation. Intel thread checker. Available at: http://www.intel.com/support/performancetools/threadchecker/[7 April 2009].
37. Sagiv M, Reps T, Wilhelm R. Parametric shape analysis via 3-valued logic. ACM Transactions on ProgrammingLanguages and Systems 2002; 24(3):217–298. DOI: 10.1145/514188.514190.