72
ital Signs c e n t r a l o k l a h o m a VITAL SIGNS SPECIAL EDITION DECEMBER 2017 CENTRAL OKLAHOMA PRIORITIES: A DECADE IN REVIEW
| Date post: | 29-Jun-2018 |
| Category: |
Documents |
| Upload: | duonghuong |
| View: | 213 times |
| Download: | 0 times |
ital Signsc e n t r a l o k l a h o m a
VITAL SIGNS
SPECIAL EDITION DECEMBER 2017
CENTRAL OKLAHOMA PRIORITIES:A DECADE IN REVIEW

Cover photo by: Greater Oklahoma City Chamber

LETTER FROM THE CHAIR
INTRODUCTION
GEOGRAPHIC REGIONS AND DEMOGRAPHICS
SUMMARY OF FINDINGS
OKLAHOMA VERSUS THE NATION
PRIORITY CONCERNS OF CENTRAL OKLAHOMANS IN 2017
MEET JAMIE
HEALTH STATUS
EDUCATIONAL ACHIEVEMENT
ECONOMIC MOBILITY
PUBLIC SAFETY
SOCIAL CAPITAL
ACKNOWLEDGEMENTS
REFERENCES
1
2
3
5
7
8
9
11
27
35
45
55
64
65
1
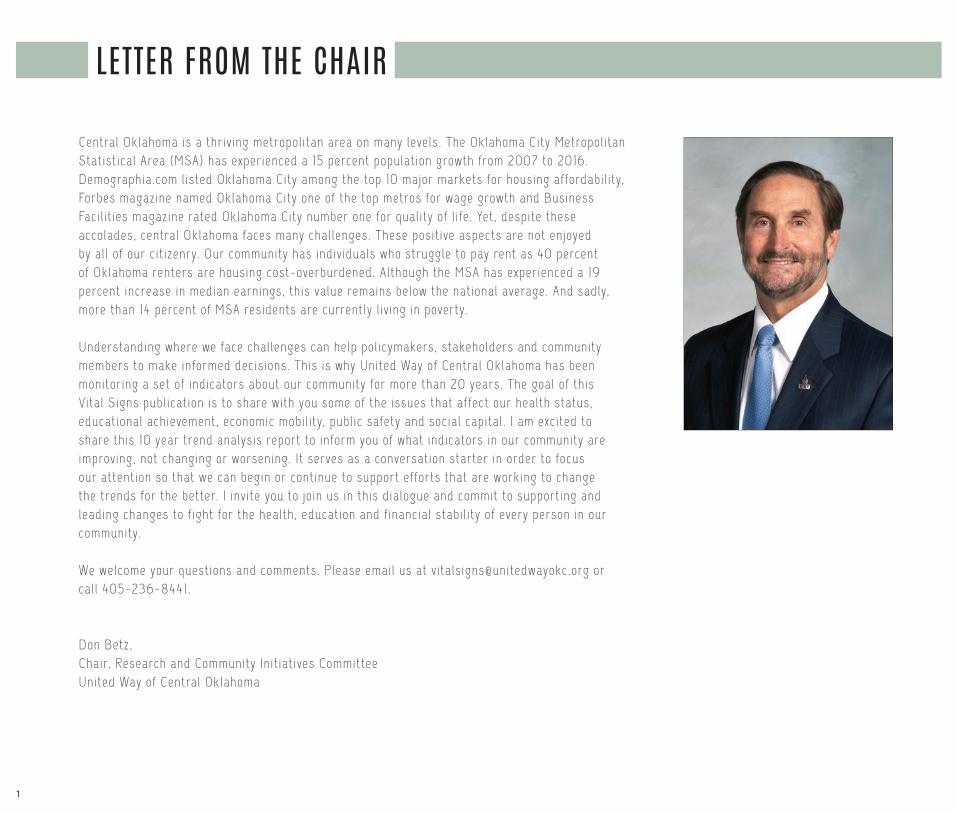
LETTER FROM THE CHAIR
Central Oklahoma is a thr iving metropol i tan area on many levels . The Oklahoma City Metropol i tan Stat ist ical Area (MSA) has experienced a 15 percent populat ion growth from 2007 to 2016. Demographia.com l isted Oklahoma City among the top 10 major markets for housing affordabi l i ty, Forbes magazine named Oklahoma City one of the top metros for wage growth and Business Faci l i t ies magazine rated Oklahoma City number one for qual i ty of l i fe . Yet , despite these accolades, central Oklahoma faces many chal lenges. These posit ive aspects are not enjoyed by al l of our c it izenry. Our community has individuals who struggle to pay rent as 40 percent of Oklahoma renters are housing cost-overburdened. Although the MSA has experienced a 19 percent increase in median earnings, this value remains below the nat ional average. And sadly, more than 14 percent of MSA residents are currently l iving in poverty.
Understanding where we face chal lenges can help pol icymakers, stakeholders and community members to make informed decis ions. This is why United Way of Central Oklahoma has been monitor ing a set of indicators about our community for more than 20 years. The goal of this Vital Signs publ icat ion is to share with you some of the issues that affect our health status, educat ional achievement, economic mobi l i ty, publ ic safety and social capital . I am excited to share this 10 year trend analysis report to inform you of what indicators in our community are improving, not changing or worsening. I t serves as a conversat ion starter in order to focus our attent ion so that we can begin or cont inue to support efforts that are working to change the trends for the better. I invite you to jo in us in this dialogue and commit to support ing and leading changes to f ight for the health, educat ion and f inancial stabi l i ty of every person in our community.
We welcome your quest ions and comments. Please emai l us at vi tals [email protected] or cal l 405-236-8441.
Don Betz ,Chair, Research and Community In it iat ives CommitteeUnited Way of Central Oklahoma

2
Oklahoma County Vital Signs is central Oklahoma’s only broad-based community evaluat ion. Unique local ly, th is document offers extensive data on key trends in our area. First publ ished in 1994 by the Community Counci l of Central Oklahoma and cont inued by United Way of Central Oklahoma, Vital Signs offers a comprehensive review of our wel l-being in Oklahoma, Oklahoma County and Oklahoma City. I f our community could have a rout ine physical , th is would be i t .
This edit ion of Vital Signs is a fo l low on to the last large-scale trend report publ ished in 2007. This edit ion cont inues the tradit ion of tracking key indicators in f ive key areas important to our qual i ty of l i fe : health status, educat ional achievement, economic mobi l i ty, social capital and publ ic safety. Each category uses mult ip le data sets to reveal our community ’s successes and chal lenges.
This publ icat ion is intended to be used by community members, stakeholders and investors to fo l low changing condit ions, guide pol icy development and support al locat ion of precious resources. The indicators are a cal l to act ion and intended to celebrate progress, spur cr i t ical thinking, shape a community vis ion and take steps towards posit ive change.
WHAT ARE INDICATORS?Indicators are presentat ions of data that together show changes and trends over t ime as wel l as provide a view of the overal l health of the community. Indicators funct ion in the same way that heart rate, b lood pressure and body temperature together provide a picture of our overal l personal health. Community indicators are vital s igns for monitor ing and measuring where we are and where we are headed as a community.
CRITERIA FOR SELECTION OF SPECIFIC INDICATORS• Signif icance to the local community• Abi l i ty to ref lect a speci f ic dimension and to contr ibute to the overal l p icture of the wel l-being of c i t izens• Abi l i ty to support pol icy decis ions• Abi l i ty to be obtained annual ly• Abi l i ty to be measured consistent ly over t ime
VITAL SIGNS TRACKS FIVE REGIONS• United States of America (Nat ion)• Oklahoma (State)• Oklahoma County (County)• Oklahoma City Metropol i tan Stat ist ical Area (OKC MSA)• Oklahoma City (City)
INTRODUCTION
3
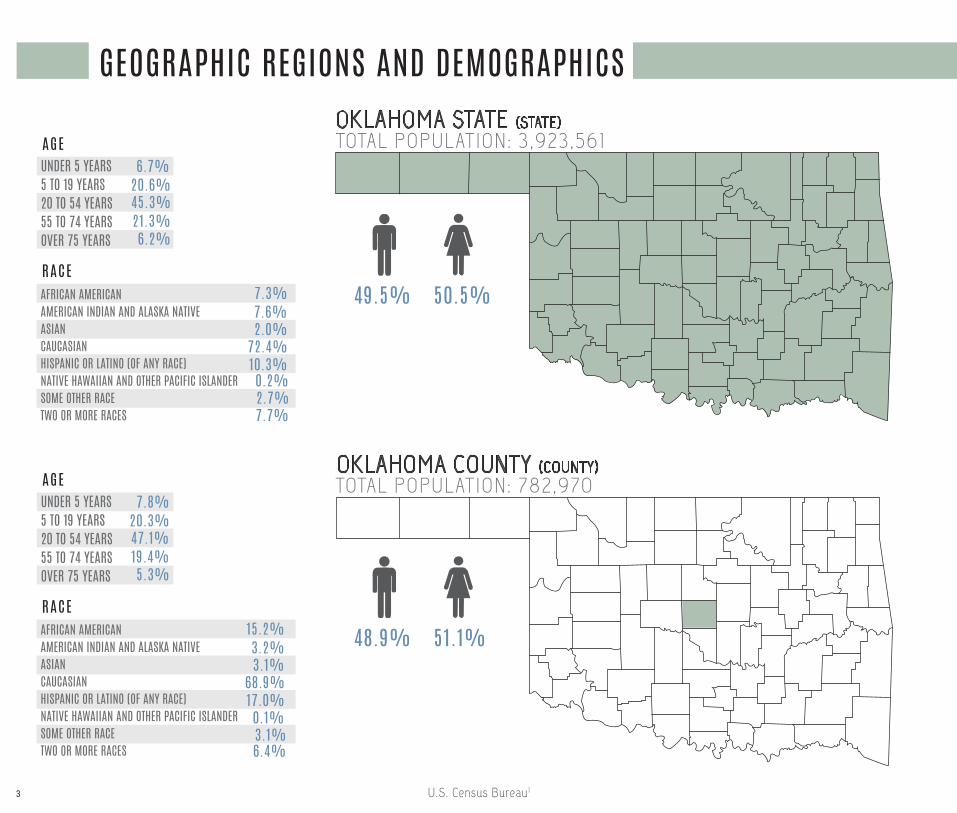
GEOGRAPHIC REGIONS AND DEMOGRAPHICS
U.S. Census Bureau1
OKLAHOMA STATE (STATE)
OKLAHOMA COUNTY (COUNTY)
TOTAL POPULATION: 3,923,561
TOTAL POPULATION: 782,970
49.5% 50.5%
48.9% 51.1%
UNDER 5 YEARS5 TO 19 YEARS20 TO 54 YEARS55 TO 74 YEARSOVER 75 YEARS
AGE6.7%
20.6% 45.3%21.3%6.2%
RACE7.3%7.6%
2.0%72.4%10.3%0.2%2.7%7.7%
UNDER 5 YEARS5 TO 19 YEARS20 TO 54 YEARS55 TO 74 YEARSOVER 75 YEARS
AGE7.8%
20.3% 47.1%19.4%5.3%
RACE15.2%3.2% 3.1%
68.9%17.0%0.1%3.1%6.4%
AFRICAN AMERICANAMERICAN INDIAN AND ALASKA NATIVEASIANCAUCASIANHISPANIC OR LATINO (OF ANY RACE)NATIVE HAWAIIAN AND OTHER PACIFIC ISLANDERSOME OTHER RACETWO OR MORE RACES
AFRICAN AMERICANAMERICAN INDIAN AND ALASKA NATIVEASIANCAUCASIANHISPANIC OR LATINO (OF ANY RACE)NATIVE HAWAIIAN AND OTHER PACIFIC ISLANDERSOME OTHER RACETWO OR MORE RACES
4
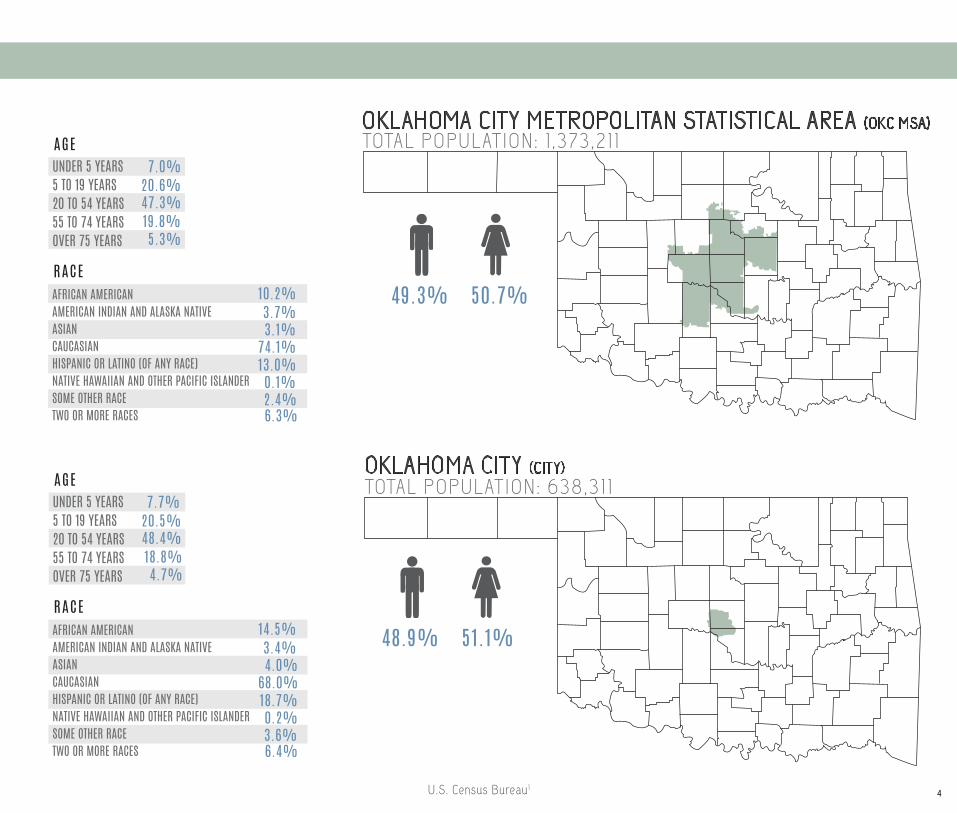
OKLAHOMA CITY METROPOLITAN STATISTICAL AREA (OKC MSA)
OKLAHOMA CITY (CITY)
U.S. Census Bureau1
TOTAL POPULATION: 1 ,373,211
TOTAL POPULATION: 638,311
49.3% 50.7%
48.9% 51.1%
UNDER 5 YEARS5 TO 19 YEARS20 TO 54 YEARS55 TO 74 YEARSOVER 75 YEARS
AGE7.0%
20.6% 47.3%19.8%5.3%
RACE10.2%3.7% 3.1%74.1%13.0%0.1%2.4%6.3%
AFRICAN AMERICANAMERICAN INDIAN AND ALASKA NATIVEASIANCAUCASIANHISPANIC OR LATINO (OF ANY RACE)NATIVE HAWAIIAN AND OTHER PACIFIC ISLANDERSOME OTHER RACETWO OR MORE RACES
UNDER 5 YEARS5 TO 19 YEARS20 TO 54 YEARS55 TO 74 YEARSOVER 75 YEARS
AGE7.7%
20.5% 48.4%18.8%4.7%
RACE14.5%3.4% 4.0%68.0%18.7%0.2%3.6%6.4%
AFRICAN AMERICANAMERICAN INDIAN AND ALASKA NATIVEASIANCAUCASIANHISPANIC OR LATINO (OF ANY RACE)NATIVE HAWAIIAN AND OTHER PACIFIC ISLANDERSOME OTHER RACETWO OR MORE RACES

5
SUMMARY OF FINDINGS
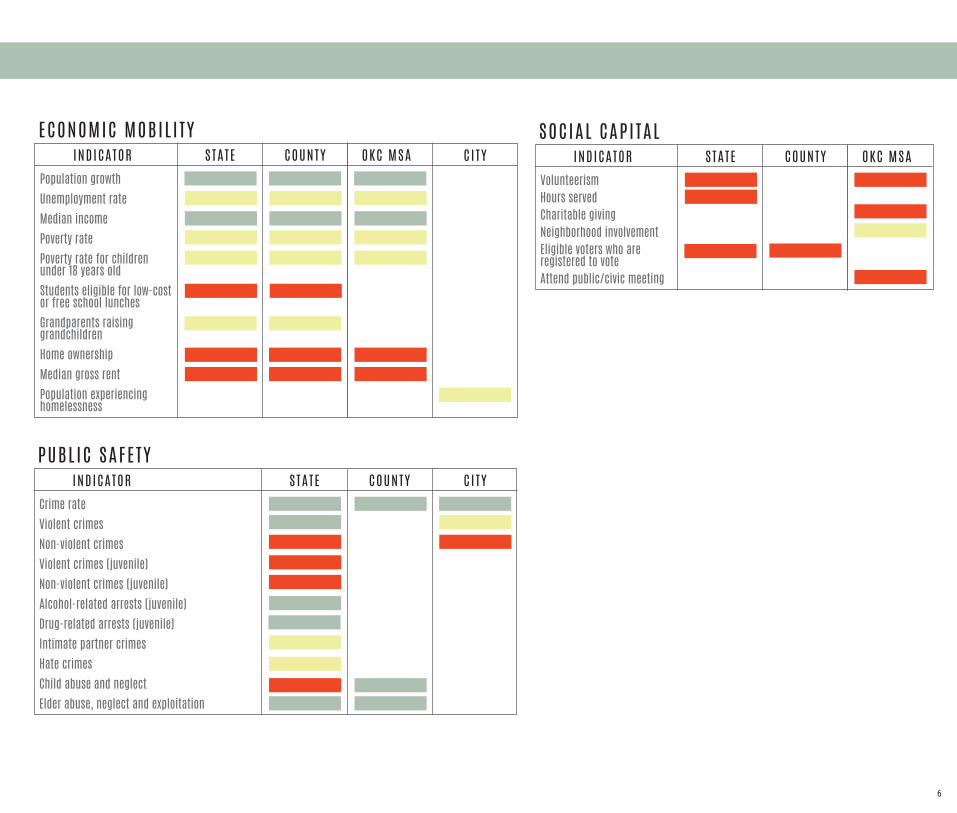
Keeping a watchful eye on local trends is important for understanding the cr it ical needs of our community as wel l as evaluat ing our health and human services community level outcomes. Large system changes, however, require t ime. Therefore, analyz ing trends over the course of 10 or more years provides insight into larger patterns that are occurr ing across Oklahoma and in part icular in Oklahoma County and City.
You wi l l f ind a summary analysis of each indicator for the last decade. Indicators marked in green are ones that have been moving in a favorable direct ion for our community such as an increase in the four year graduation rate or a decrease in the teen birth rate. Conversely, indicators marked in red are those that over the last decade have worsened such as an increase in the poverty rate for chi ldren or a decrease in home ownership. Indicators marked in yel low have remained stable over the same t ime period.
HEALTH STATUSINDICATOR STATE COUNTY OKC MSA
Fertility rateTeen birth rateInfant mortality rateEducation level of all mothersPregnancies receiving early prenatal careDeath rateTobacco useSubstance abuseIllicit drug use (adult)
Illicit drug use (12-17 years old)
Food insecurityHealth insurance coveragePreventative care (colorectal screening)
Dental careNumber of mentally unhealthy days
EDUCAT IONAL ACHIEVEMENTINDICATOR STATE COUNTY
Head start enrollmentFourth grade reading proficiencyFourth grade math proficiencyEighth grade reading proficiencyEigth grade math proficiencyPublic high school dropout rateFour year high school student loss rateFour year high school graduation rateSenior graduation ratePost-secondary educational attainment
6
ECONOMIC MOBIL I TYINDICATOR STATE COUNTY OKC MSA
Population growthUnemployment rateMedian incomePoverty ratePoverty rate for children under 18 years oldStudents eligible for low-cost or free school lunchesGrandparents raising grandchildrenHome ownershipMedian gross rentPopulation experiencing homelessness
C I TY
PUBL IC SAFETYINDICATOR STATE COUNTY
Crime rateViolent crimesNon-violent crimesViolent crimes (juvenile)Non-violent crimes (juvenile)Alcohol-related arrests (juvenile)Drug-related arrests (juvenile)Intimate partner crimesHate crimesChild abuse and neglectElder abuse, neglect and exploitation
CI TY
SOCIAL CAPI TALINDICATOR STATE COUNTY OKC MSA
VolunteerismHours servedCharitable givingNeighborhood involvementEligible voters who are registered to voteAttend public/civic meeting
7
OKLAHOMA VERSUS THE NATION
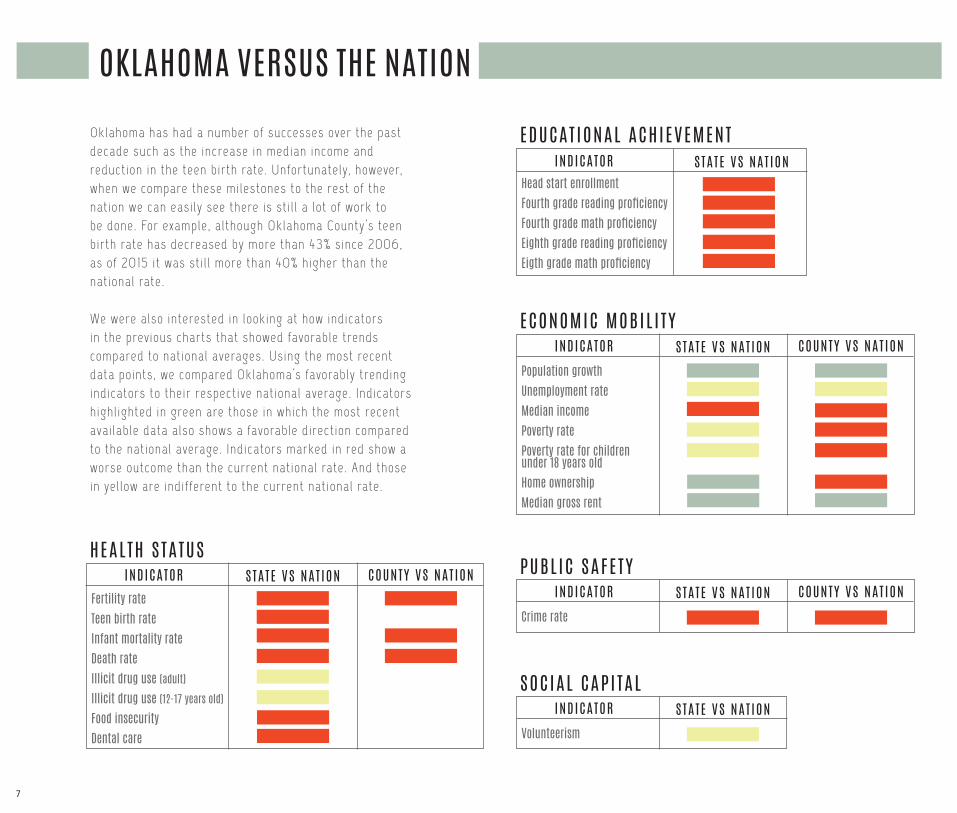
Oklahoma has had a number of successes over the past decade such as the increase in median income and reduct ion in the teen birth rate. Unfortunately, however, when we compare these mi lestones to the rest of the nat ion we can easi ly see there is st i l l a lot of work to be done. For example, a lthough Oklahoma County’s teen birth rate has decreased by more than 43% since 2006, as of 2015 i t was st i l l more than 40% higher than the nat ional rate.
We were also interested in looking at how indicators in the previous charts that showed favorable trends compared to nat ional averages. Using the most recent data points, we compared Oklahoma’s favorably trending indicators to their respect ive nat ional average. Indicators highl ighted in green are those in which the most recent avai lable data also shows a favorable direct ion compared to the nat ional average. Indicators marked in red show a worse outcome than the current nat ional rate. And those in yel low are indif ferent to the current nat ional rate.
HEALTH STATUSINDICATOR STATE VS NAT ION
Fertility rateTeen birth rateInfant mortality rateDeath rateIllicit drug use (adult)
Illicit drug use (12-17 years old)
Food insecurityDental care
COUNTY VS NAT ION
EDUCAT IONAL ACHIEVEMENTINDICATOR STATE VS NAT ION
Head start enrollmentFourth grade reading proficiencyFourth grade math proficiencyEighth grade reading proficiencyEigth grade math proficiency
ECONOMIC MOBIL I TYINDICATOR STATE VS NAT ION COUNTY VS NAT ION
Population growthUnemployment rateMedian incomePoverty ratePoverty rate for children under 18 years oldHome ownershipMedian gross rent
PUBL IC SAFETYINDICATOR STATE VS NAT ION COUNTY VS NAT ION
Crime rate
SOCIAL CAPI TALINDICATOR STATE VS NAT ION
Volunteerism
8
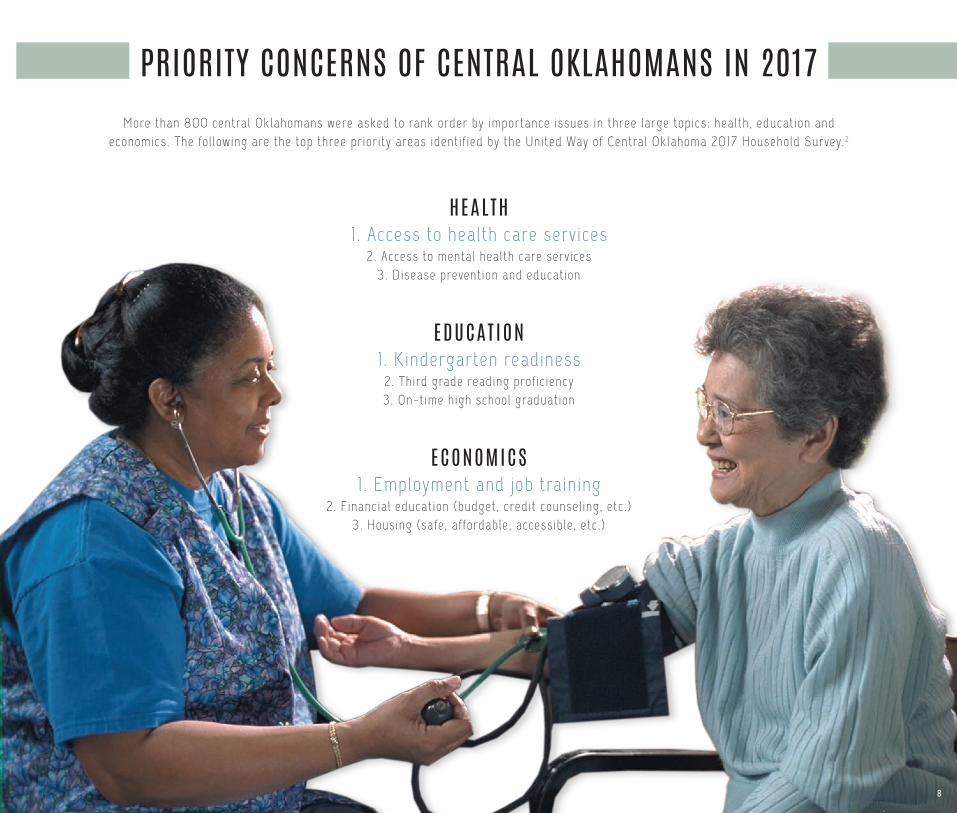
PRIORITY CONCERNS OF CENTRAL OKLAHOMANS IN 2017
HEALTH1 . Access to health care services
2. Access to mental health care services3. Disease prevent ion and educat ion
EDUCAT ION1 . Kindergarten readiness
2. Third grade reading prof ic iency3. On-t ime high school graduation
ECONOMICS1 . Employment and job training
2. Financial educat ion (budget , credit counsel ing, etc .)3. Housing (safe, affordable, accessible , etc .)
More than 800 central Oklahomans were asked to rank order by importance issues in three large topics: health, educat ion and economics. The fol lowing are the top three pr ior i ty areas ident i f ied by the United Way of Central Oklahoma 2017 Household Survey.2
8

9
Jamie is a child who wants to succeed. All he needs is a chance.
MEET JAM E. LET’S GO!
A good early education puts Jamie
on the right path.
Jamie misses less school because of quality health care.
Healthy foods help Jamie focus in the classroom.
AB C
Jamie’s parents maintain jobs and move towards
financial stability.
After school programs build Jamie’s self-esteem and teach
him leadership skills.
9
10
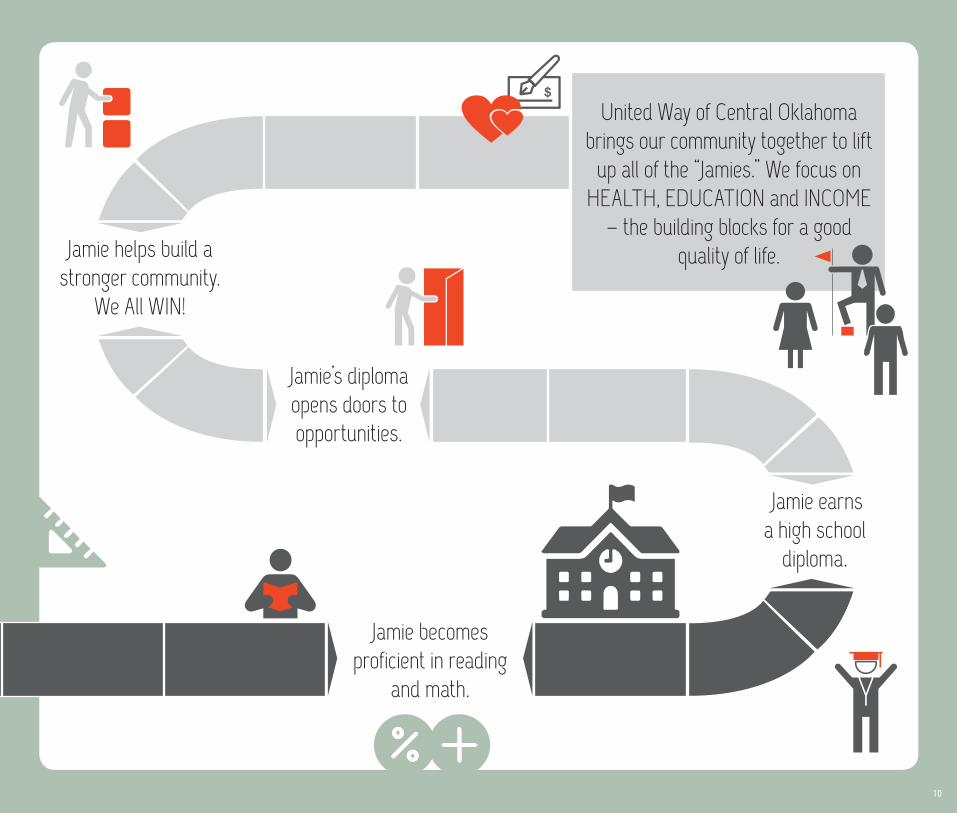
Jamie becomes proficient in reading
and math.
Jamie’s diploma opens doors to opportunities.
Jamie earns a high school
diploma.
Jamie helps build a stronger community.
We All WIN!
United Way of Central Oklahoma brings our community together to lift
up all of the “Jamies.” We focus on HEALTH, EDUCATION and INCOME
– the building blocks for a good quality of life.
10

1111
12
HEALTH STATUSHealth factors are basics that contr ibute to how long we wi l l l ive . They include health
behaviors such as tobacco use, diet , exercise, a lcohol and drug use, and sexual act ivi ty as wel l as c l in ical care access and qual i ty of l i fe . Individual changes to these health factors
wi l l u lt imately have a posit ive impact on the health of our whole community.
HEALTH DEMOGRAPHICS Fert i l i ty rate Teen birth rate Infant mortal i ty rate Educat ion level of mothers of al l new births Early prenatal care Death rate Top three causes of death
HEALTH BEHAVIORS Tobacco use Substance abuse I l l ic i t drug use or dependence Food insecurity
CLINICAL CARE Health insurance coverage Screened for colorectal cancer Dental care Mental health care
PRIORITY HEALTH CONCERNS FOR CENTRAL OKLAHOMANS
1313131414151717
1818181921
2222232324
25
12
13
HEALTH DEMOGRAPHICS
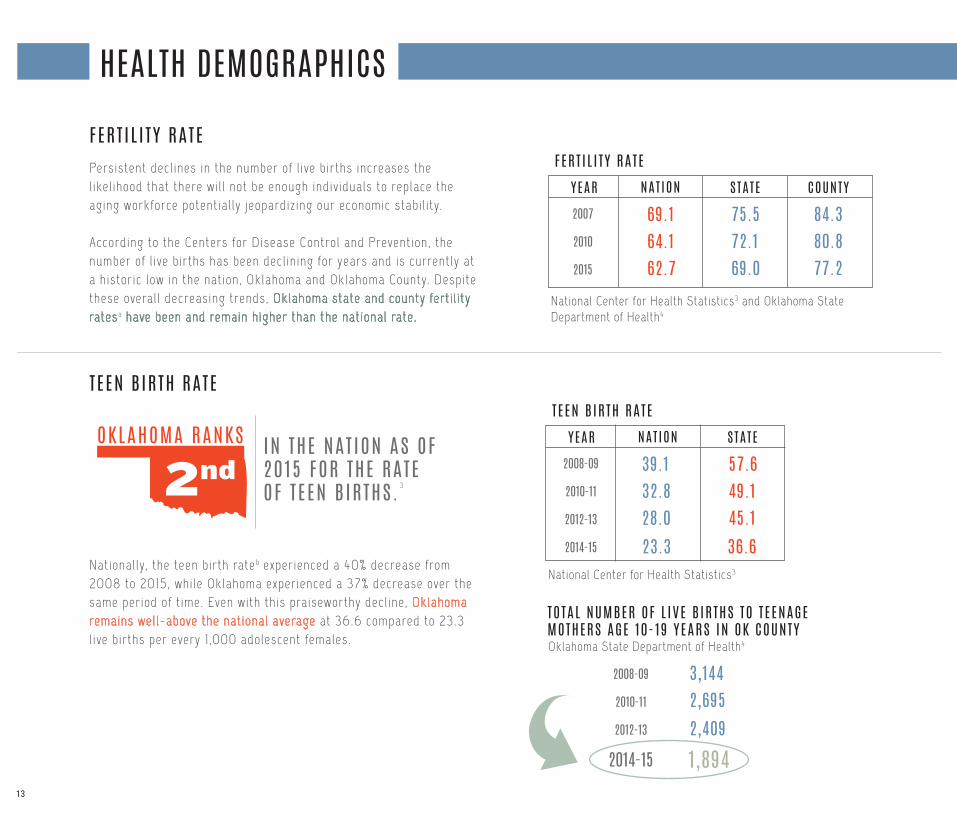
Persistent decl ines in the number of l ive births increases the l ikel ihood that there wi l l not be enough individuals to replace the aging workforce potent ial ly jeopardiz ing our economic stabi l i ty.
According to the Centers for Disease Control and Prevent ion, the number of l ive births has been decl in ing for years and is currently at a histor ic low in the nat ion, Oklahoma and Oklahoma County. Despite these overal l decreasing trends, Oklahoma state and county fert i l i ty ratesa have been and remain higher than the nat ional rate.
FERT I L I TY RATE
National ly, the teen birth rateb experienced a 40% decrease from 2008 to 2015, whi le Oklahoma experienced a 37% decrease over the same period of t ime. Even with this praiseworthy decl ine, Oklahoma remains wel l-above the nat ional average at 36.6 compared to 23.3 l ive births per every 1 ,000 adolescent females.
TEEN B IRTH RATE
OKLAHOMA RANKS
2ndIN THE NAT ION AS OF 2015 FOR THE RATE OF TEEN B IRTHS. 3
YEAR NAT ION STATE
2007
2010
2015
COUNTY
69.164.162.7
75.572.169.0
84.380.877.2
National Center for Health Statistics3 and Oklahoma State Department of Health4
FERT I L I TY RATE
YEAR NAT ION STATE
2008-09
2010-11
2012-13
2014-15
39.132.828.0
57.649.145.1
National Center for Health Statistics3
TEEN B IRTH RATE
23.3 36.6
2008-09
2010-11
2012-13
3,1442,6952,409
Oklahoma State Department of Health4
TOTAL NUMBER OF L IVE B IRTHS TO TEENAGE MOTHERS AGE 10-19 YEARS IN OK COUNTY
1,8942014-15

14
Infant mortal i tyc in the nat ion, state and Oklahoma County has remained relat ively unchanged since 2007. Oklahoma and Oklahoma County infant mortal i ty rates exceeded the nat ional rate from 2007 to 2015.
INFANT MORTAL I TY RATE
THE MOST COMMON CAUSES OF INFANT MORTAL I TY ARE: 5
• Birth defects• Preterm birth (birth before 37 weeks gestat ion)• Low birth weight• Maternal compl icat ions of pregnancy• Sudden Infant Death Syndrome (SIDS) • In jur ies (e .g. suffocat ion)
YEAR NAT ION STATE
2007
2010
2015
COUNTY
6.86.15.9
8.47.57.3
7.27.76.8
National Center for Health Statistics3 and Oklahoma State Department of Health4
INFANT MORTAL I TY RATE
Oklahoma County s ince 2007 has seen a posit ive shi ft in the average educat ional attainment of mothers who have given birth. Specif ical ly, there has been a 32% decrease in l ive births to women with less than eight years of educat ion. Conversely, there has been a 40% increase in the birth rate by women with some col lege educat ion and a 36% increase by women with at least a bachelor ’s degree.
EDUCAT ION LEVEL OF MOTHERS OF ALL NEW BIRTHS
A POSI T IVE CORRELAT ION EX ISTS BETWEEN MATERNAL EDUCAT ION AND THE
HEALTH AND SUCCESS OF THE CHILD. 6
14
15
HEALTH DEMOGRAPHICS
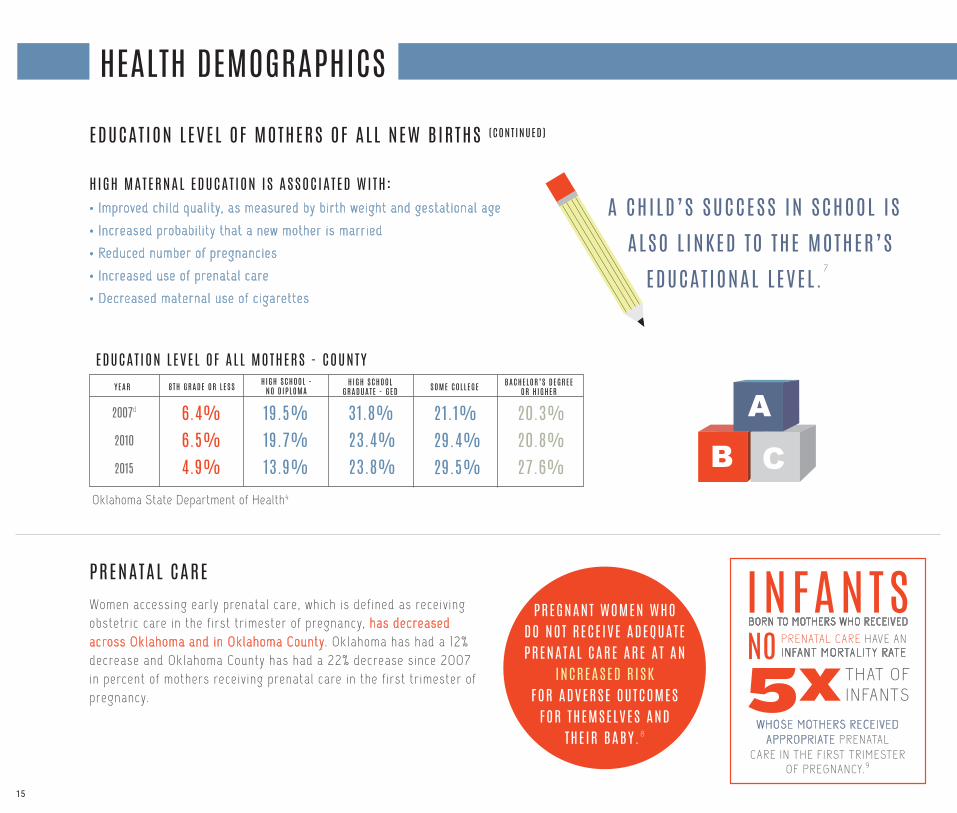
EDUCAT ION LEVEL OF MOTHERS OF ALL NEW BIRTHS (CONT INUED)
H IGH MATERNAL EDUCAT ION IS ASSOCIATED WITH:• Improved chi ld qual i ty, as measured by birth weight and gestat ional age• Increased probabi l i ty that a new mother is married • Reduced number of pregnancies • Increased use of prenatal care• Decreased maternal use of c igarettes
A CHILD’S SUCCESS IN SCHOOL IS ALSO L INKED TO THE MOTHER’S
EDUCAT IONAL LEVEL .7
Oklahoma State Department of Health4
YEAR 8TH GRADE OR LESS
2007d
2010
2015
6.4%6.5%4.9%
19.5%19.7%13.9%
31.8%23.4%23.8%
EDUCAT ION LEVEL OF ALL MOTHERS - COUNTYHIGH SCHOOL -
NO D IPLOMAHIGH SCHOOL
GRADUATE - GED SOME COLLEGE BACHELOR’S DEGREE OR H IGHER
21.1%29.4%29.5%
20.3%20.8%27.6%
Women accessing early prenatal care, which is def ined as receiving obstetr ic care in the f irst tr imester of pregnancy, has decreased across Oklahoma and in Oklahoma County. Oklahoma has had a 12% decrease and Oklahoma County has had a 22% decrease since 2007 in percent of mothers receiving prenatal care in the f irst tr imester of pregnancy.
PRENATAL CARE
AB C
PREGNANT WOMEN WHO DO NOT RECE IVE ADEQUATE PRENATAL CARE ARE AT AN
INCREASED R ISK FOR ADVERSE OUTCOMES
FOR THEMSELVES AND THE IR BABY. 8
5xWHOSE MOTHERS RECEIVED
APPROPRIATE PRENATAL CARE IN THE FIRST TRIMESTER
OF PREGNANCY.9
BORN TO MOTHERS WHO RECEIVEDINFANTSNO PRENATAL CARE HAVE AN
INFANT MORTALITY RATE
THAT OF INFANTS

16
OF EARLY AND ONGOING PRENATAL CARE ARE • IMPROVED B IRTH WEIGHTS• DECREASED R ISK OF PRETERM DEL IVERY2MOST SIGNIFICANT ADVANTAGES
In general accessing early prenatal care posit ively correlates with maternal educat ion in Oklahoma County. In other words, the more highly educated the mother the more l ikely she is to receive appropriate prenatal care. In it iat ives focused on rais ing awareness of the importance of prenatal care to undereducated mothers s ince 2007 are improving their accessing rates. The percent of women with 0-8 years of educat ion receiving prenatal care more than doubled between 1996-2000 (data not shown) and 2011-15.
This data also reveals an emerging and concerning trend. In 2011-15 women with 12 years, 13-15 years or more than 16 years of educat ion accessed early prenatal care less frequently than simi lar women in pr ior years.
YEAR STATE
2007
2010
2015
COUNTY
74.5%59.7%65.4%
Oklahoma State Department of Health4
PERCENT OF PREGNANCIES THAT RECE IVED EARLY PRENATAL CARE
78.1%56.8%60.8%
Oklahoma State Department of Health4
YEAR 0-8 YEARS
1996-00
2011-15
25.4%54.5%
42.6%47.3%
56.0%53.8%
PERCENT OF L IVE B IRTHS THAT RECE IVED PRENATAL CARE IN THE F IRST TR IMESTER BY MATERNAL EDUCAT ION LEVEL - COUNTY
9-11 YEARS 12 YEARS 13-15 YEARS GREATER OR EQUAL TO 16 YEARS
68.4%60.7%
78.3%71.0%

17
HEALTH DEMOGRAPHICS
A simi lar decreasing trend in age-adjusted death ratee is observed at both the nat ional and county level where nat ional ly the rate decreased by 4% and in Oklahoma County by 6% between 2007 and 2015. Oklahoma decreased by 15% over the same period of t ime.
DEATH RATEOKLAHOMA HAS THE
5THHIGHEST OVERALL AGE-ADJUSTED DEATH RATE IN THE NAT ION. 10
YEAR NAT ION STATE
2007
2010
2015
COUNTY
775.3749.7740.8
945.1836.1808.0
917.0856.7859.7
National Center for Health Statistics3
AGE-ADJUSTED DEATH RATE
Recogniz ing the most common causes of death by age group can aid in assessment of r isk factors, prevent ion planning and ult imately mit igat ion of an early death. Regional comparisons, however, may reveal possible cultural , behavioral and environmental r isk factors.
AGE F IRST SECOND
0-1415-2425-3435-4445-5455-6465-7475+
THIRD
U.S. Department of Health and Human Services5
TOP 3 CAUSES OF DEATH BY AGE IN 2015 - NAT ION
Congenital anomalies Short gestation Maternal pregnancy complication
Unintentional injurySuicide
Cancer
Cancer
Heart disease
CancerHomicide
Heart disease
Heart disease
Cancer
Unintentional disease
Lung disease
AGE F IRST SECOND
0-1415-2425-3435-4445-5455-6465-7475+
THIRD
U.S. Department of Health and Human Services5
TOP 3 CAUSES OF DEATH BY AGE IN 2015 - OKLAHOMA
Low birth rate Congenital anomalies Injuries
Road traffic accidents
Suicide
Coronary heart disease
HomicideRoad traffic accidents
Coronary heart disease
Lung cancers
Hypertension
Stroke
SuicidePoisonings
SuicidePoisonings
Poisonings
Lung disease
OKLAHOMA IS T I ED FOR FOURTH WITH ARKANSAS IN THE H IGHEST CHILD (AGE 1 - 14 YEARS) DEATH RATE IN THE NAT ION. 1 1
44TH
OKLAHOMA IS T I ED FOR S IXTH WITH NEW MEXICO IN THE RATE OF TEEN DEATHS (AGE 15-19 YEARS) IN THE NAT ION. 12
66TH

18
HEALTH BEHAVIORS
Central Oklahoma over the last 10 years has experienced a steady decl ine in the percent of individuals that describe themselves as current smokers. There has been an 18% decrease since 2006-07 in the percent of central Oklahoma smokers.
A new and growing trend in tobacco use is e lectronic c igarettes and vapor devices. These c igarette alternat ives are marketed as less harmful alternat ives to smoking as wel l as for promotion of smoking cessat ion. Regardless of the del ivery method, n icot ine and the other chemicals included in the product are st i l l widely known to damage health. 14 Thirty percent of central Oklahomans in 2015 reported at least occasional use of one of these devices (data not shown). E-cigarette use is highest among high school-aged individuals . 14
TOBACCO USE
TOBACCO USE IS THE MOST PREVENTABLE CAUSE OF DEATH AND D ISEASE IN THE UNI TED STATES . 13
2006-07
2008-09
2010-11
2012-13
23.4%23.6%24.0%
Oklahoma State Department of Health4
PERCENT OF INDIV IDUALS THAT CURRENTLY SMOKE – CENTRAL OKLAHOMA
20.2%
2014-15 19.2%
SUBSTANCE ABUSE
SUBSTANCE USE AND ABUSE CAN CAUSE A VARIETY OF HEALTH CONCERNS: 15
• Weakened immune system• Cardiovascular problems• Liver damage or fa i lure• Seizures• Strokes • Birth defects or infant mortal i ty ( i f used during pregnancy)
ALCOHOL IS THE FOURTH MOST PREVALENT , PREVENTABLE CAUSE OF DEATH IN THE UNI TED STATES . 16

19
HEALTH BEHAVIORS
The overal l heavy or chronic alcohol consumption rates in Oklahoma (data not shown) and in central Oklahoma have remained relat ively unchanged since 2006. Alcohol abuse in 2010 cost Oklahoma taxpayers $3 bi l l ion. 17 Less than a third of Oklahoma County residents that need substance abuse treatment wi l l receive services this year. 18
SUBSTANCE ABUSE (CONT INUED)
2006-07
2008-09
2010-11
2012-13
2014-15
4.20%3.60%4.60%
Oklahoma State Department of Health4
PERCENT OF INDIV IDUALS SELF-REPORT ING CHRONIC ALCOHOL CONSUMPT ION - CENTRAL OKLAHOMA
4.80%4.60%
HEAVY OR CHRONIC CONSUMPT ION OF ALCOHOL IS DEF INED AS REGULARLY DRINKING TWO OR MORE DRINKS PER DAY FOR MEN AND ONE OR MORE DRINKS PER DAY FOR WOMEN.
1 IN 10adult Oklahomans are currently struggl ing with substance abuse. 18
Central Oklahomans self-reported that in 2016 i f substance abuse treatment was needed by themselves or a loved one and not received the number one reason was “they didn’t know where to go” and number two was “care was too expensive.” 2
I L L IC I T DRUG USE AND DEPENDENCE
MORE THAN 527 ,000 EMERGENCY ROOM VIS I TS ARE MADE NAT IONALLY EACH YEAR BY I LL IC I T DRUG USERS WHOM ARE EXPERIENCING AN ADVERSE S IDE EFFECT .15
I L L IC I T DRUG USE CAN CAUSE: 15
• Addict ion• Loss of sel f-control• Paranoia• Aggressiveness • Hal lucinat ions
20
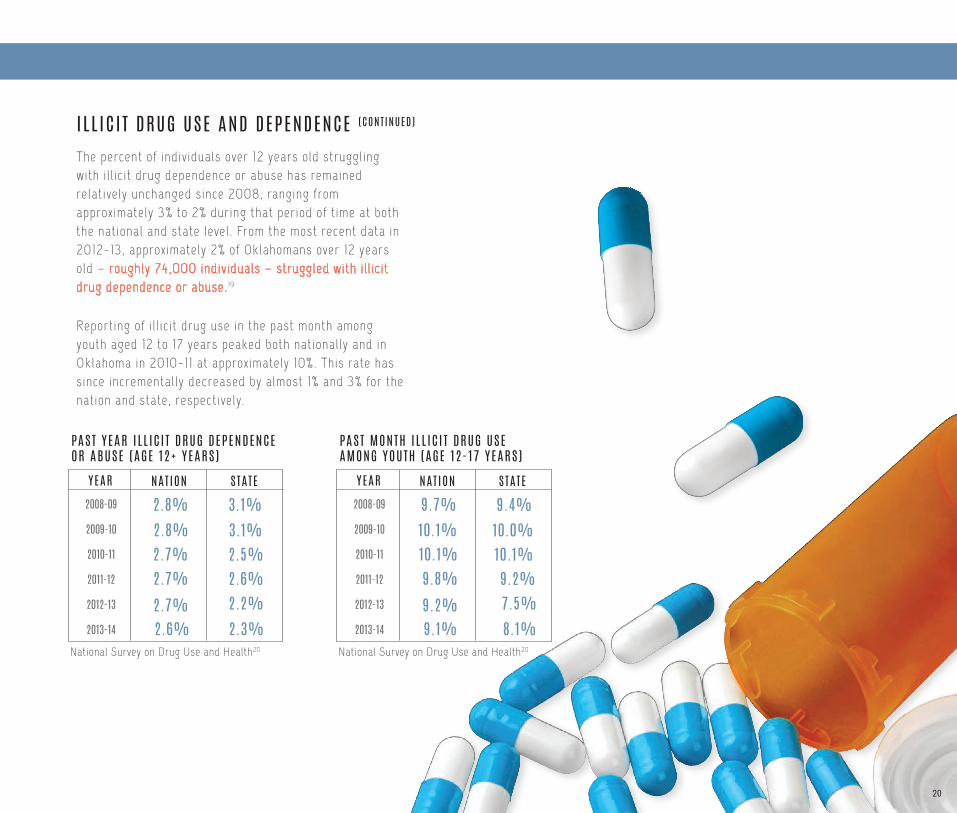
The percent of individuals over 12 years old struggl ing with i l l ic i t drug dependence or abuse has remained relat ively unchanged since 2008, ranging from approximately 3% to 2% during that per iod of t ime at both the nat ional and state level . From the most recent data in 2012-13, approximately 2% of Oklahomans over 12 years old – roughly 74,000 individuals – struggled with i l l ic i t drug dependence or abuse. 19
I L L IC I T DRUG USE AND DEPENDENCE (CONT INUED)
Report ing of i l l ic i t drug use in the past month among youth aged 12 to 17 years peaked both nat ional ly and in Oklahoma in 2010-11 at approximately 10%. This rate has s ince incremental ly decreased by almost 1% and 3% for the nat ion and state, respect ively.
YEAR NAT ION
2008-09
2009-10
2010-11
2011-12
2012-13
2013-14
STATE
2.8%2.8%2.7%
National Survey on Drug Use and Health20
PAST YEAR I LL IC I T DRUG DEPENDENCE OR ABUSE (AGE 12+ YEARS)
3.1%3.1%2.5%
2.7%2.7%2.6%
2.6%2.2%2.3%
YEAR NAT ION
2008-09
2009-10
2010-11
2011-12
2012-13
2013-14
STATE
9.7%10.1%10.1%
National Survey on Drug Use and Health20
PAST MONTH I LL IC I T DRUG USE AMONG YOUTH (AGE 12-17 YEARS)
9.4%10.0%10.1%
9.8%9.2%9.1%
9.2%7.5%8.1%
20
21
HEALTH BEHAVIORS
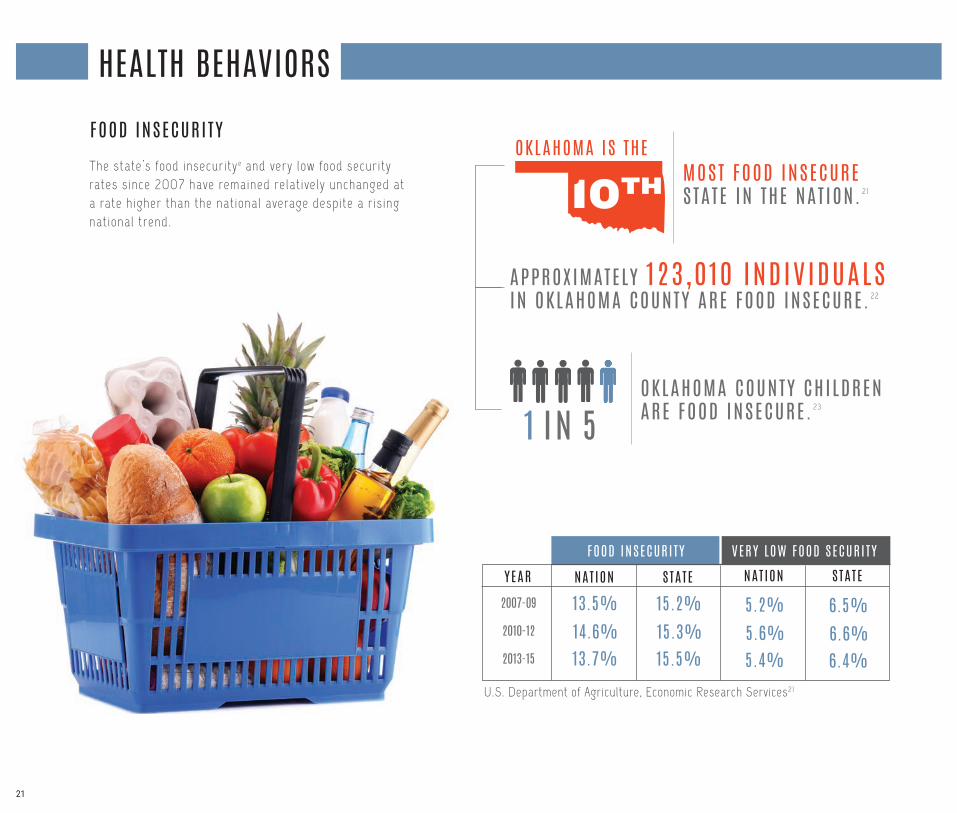
FOOD INSECURITYThe state’s food insecuritye and very low food security rates s ince 2007 have remained relat ively unchanged at a rate higher than the nat ional average despite a r is ing nat ional trend.
OKLAHOMA IS THE
10TH MOST FOOD INSECURE STATE IN THE NAT ION. 21
APPROXIMATELY 123 ,010 INDIV IDUALS IN OKLAHOMA COUNTY ARE FOOD INSECURE. 22
1 IN 5OKLAHOMA COUNTY CHILDREN ARE FOOD INSECURE. 23
YEAR NAT ION
2007-09
2010-12
2013-15
STATE
13.5%14.6%13.7%
U.S. Department of Agriculture, Economic Research Services21
15.2%15.3%15.5%
NATION STATEFOOD INSECURITY VERY LOW FOOD SECURI TY
5.2%5.6%5.4%
6.5%6.6%6.4%
22
CLINICAL CARE
HEALTH INSURANCE COVERAGE
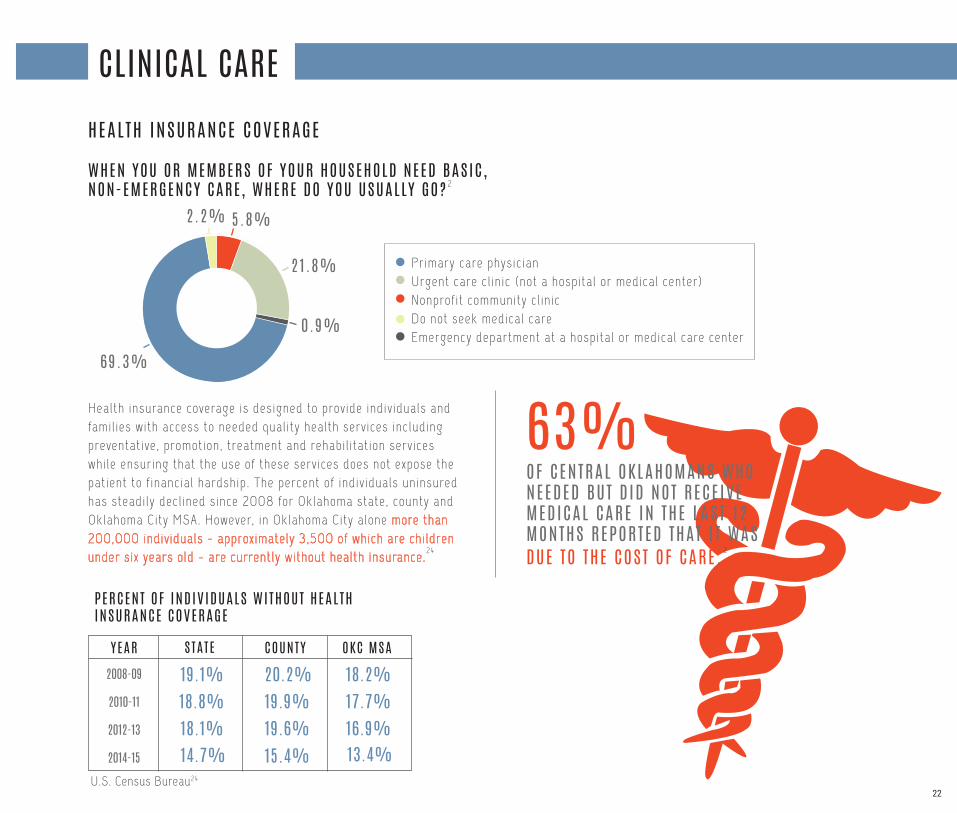
WHEN YOU OR MEMBERS OF YOUR HOUSEHOLD NEED BASIC , NON-EMERGENCY CARE , WHERE DO YOU USUALLY GO? 2
69.3%
0.9%
21.8%
5.8%2.2%
Primary care physic ianUrgent care c l in ic (not a hospital or medical center)Nonprof i t community c l in icDo not seek medical careEmergency department at a hospital or medical care center
Health insurance coverage is designed to provide individuals and famil ies with access to needed qual i ty health services including preventat ive, promotion, treatment and rehabi l i tat ion services whi le ensuring that the use of these services does not expose the pat ient to f inancial hardship. The percent of individuals uninsured has steadi ly decl ined since 2008 for Oklahoma state, county and Oklahoma City MSA. However, in Oklahoma City alone more than 200,000 individuals - approximately 3,500 of which are chi ldren under s ix years old - are currently without health insurance.24
OF CENTRAL OKLAHOMANS WHO NEEDED BUT D ID NOT RECE IVE MEDICAL CARE IN THE LAST 12 MONTHS REPORTED THAT I T WAS DUE TO THE COST OF CARE. 2
63%
YEAR STATE COUNTY
2008-09
2010-11
2012-13
2014-15
OKC MSA
19.1%18.8%18.1%
20.2%19.9%19.6%
18.2%17.7%16.9%
U.S. Census Bureau24
PERCENT OF INDIV IDUALS WITHOUT HEALTH INSURANCE COVERAGE
14.7% 15.4% 13.4%
23
CLINICAL CARE
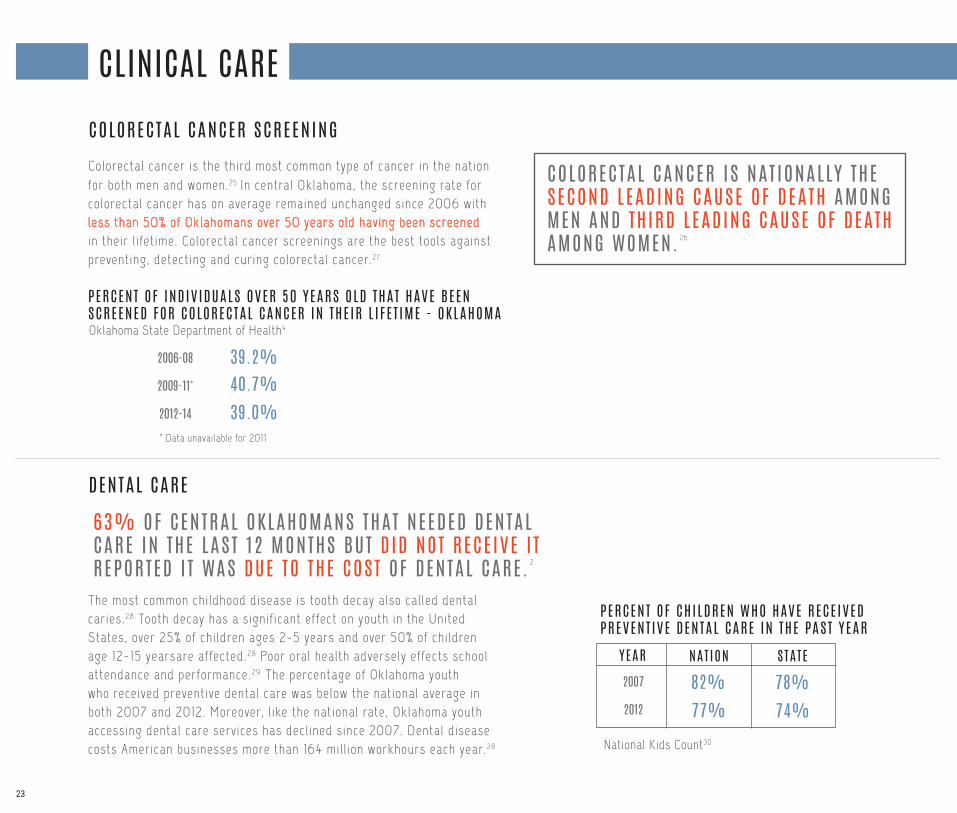
COLORECTAL CANCER SCREENINGColorectal cancer is the third most common type of cancer in the nat ion for both men and women.25 In central Oklahoma, the screening rate for colorectal cancer has on average remained unchanged since 2006 with less than 50% of Oklahomans over 50 years old having been screened in their l i fet ime. Colorectal cancer screenings are the best tools against prevent ing, detect ing and curing colorectal cancer.27
COLORECTAL CANCER IS NAT IONALLY THE SECOND LEADING CAUSE OF DEATH AMONG MEN AND TH IRD LEADING CAUSE OF DEATH AMONG WOMEN. 26
2006-08
2009-11*
2012-14
39.2%40.7%39.0%
Oklahoma State Department of Health4
PERCENT OF INDIV IDUALS OVER 50 YEARS OLD THAT HAVE BEEN SCREENED FOR COLORECTAL CANCER IN THE IR L I FE T IME - OKLAHOMA
* Data unavailable for 2011
DENTAL CARE
The most common chi ldhood disease is tooth decay also cal led dental car ies.28 Tooth decay has a s ignif icant effect on youth in the United States, over 25% of chi ldren ages 2-5 years and over 50% of chi ldren age 12-15 yearsare affected.28 Poor oral health adversely effects school attendance and performance.29 The percentage of Oklahoma youth who received prevent ive dental care was below the nat ional average in both 2007 and 2012. Moreover, l ike the nat ional rate, Oklahoma youth accessing dental care services has decl ined since 2007. Dental disease costs American businesses more than 164 mil l ion workhours each year.28
YEAR NAT ION
2007
2012
STATE
82%77%
National Kids Count30
PERCENT OF CHILDREN WHO HAVE RECE IVED PREVENT IVE DENTAL CARE IN THE PAST YEAR
78%74%
63% OF CENTRAL OKLAHOMANS THAT NEEDED DENTAL CARE IN THE LAST 12 MONTHS BUT D ID NOT RECE IVE I T REPORTED I T WAS DUE TO THE COST OF DENTAL CARE. 2
24
MENTAL HEALTH
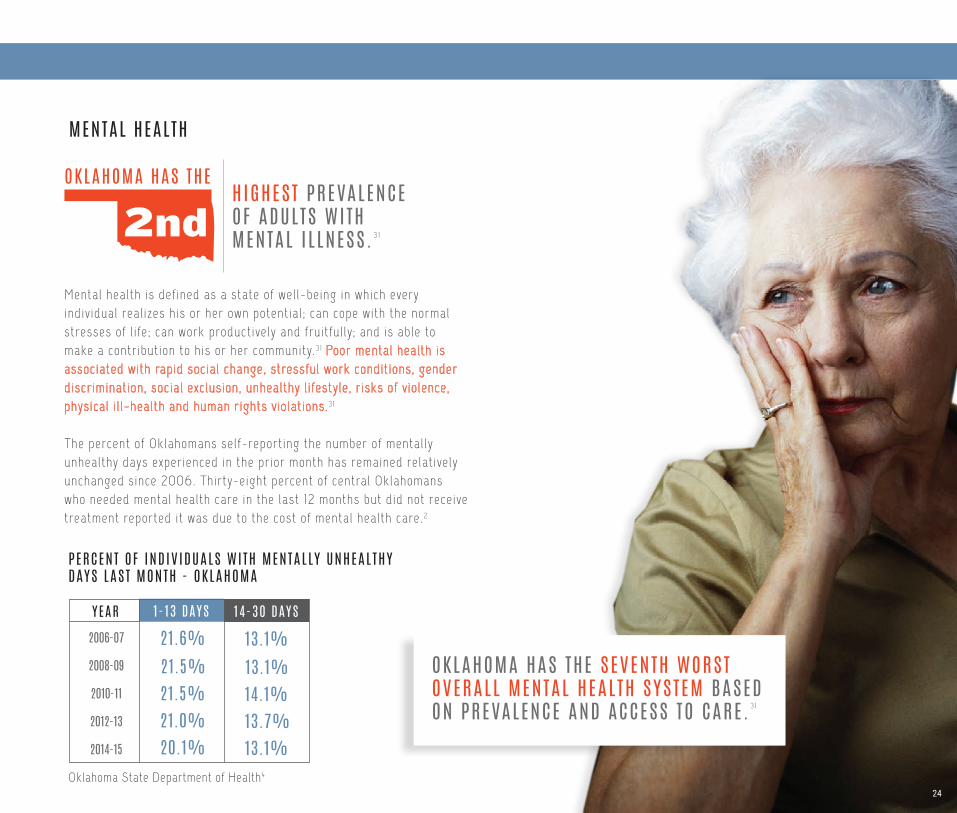
Mental health is def ined as a state of wel l-being in which every individual real izes his or her own potent ial ; can cope with the normal stresses of l i fe ; can work product ively and fruit ful ly; and is able to make a contr ibut ion to his or her community.31 Poor mental health is associated with rapid social change, stressful work condit ions, gender discr iminat ion, social exclusion, unhealthy l i festyle , r isks of vio lence, physical i l l-health and human r ights vio lat ions.31
The percent of Oklahomans self-report ing the number of mental ly unhealthy days experienced in the pr ior month has remained relat ively unchanged since 2006. Thirty-eight percent of central Oklahomans who needed mental health care in the last 12 months but did not receive treatment reported i t was due to the cost of mental health care.2
YEAR
2006-07
2008-09
2010-11
2012-13
2014-15
21.6%21.5%21.5%
Oklahoma State Department of Health4
1 - 13 DAYS
PERCENT OF INDIV IDUALS WITH MENTALLY UNHEALTHY DAYS LAST MONTH - OKLAHOMA
21.0%20.1%
14-30 DAYS
13.1%13.1%14.1%13.7%13.1%
OKLAHOMA HAS THE
2ndHIGHEST PREVALENCE OF ADULTS WITH MENTAL I L LNESS. 31
OKLAHOMA HAS THE SEVENTH WORST OVERALL MENTAL HEALTH SYSTEM BASED ON PREVALENCE AND ACCESS TO CARE. 31
24
25
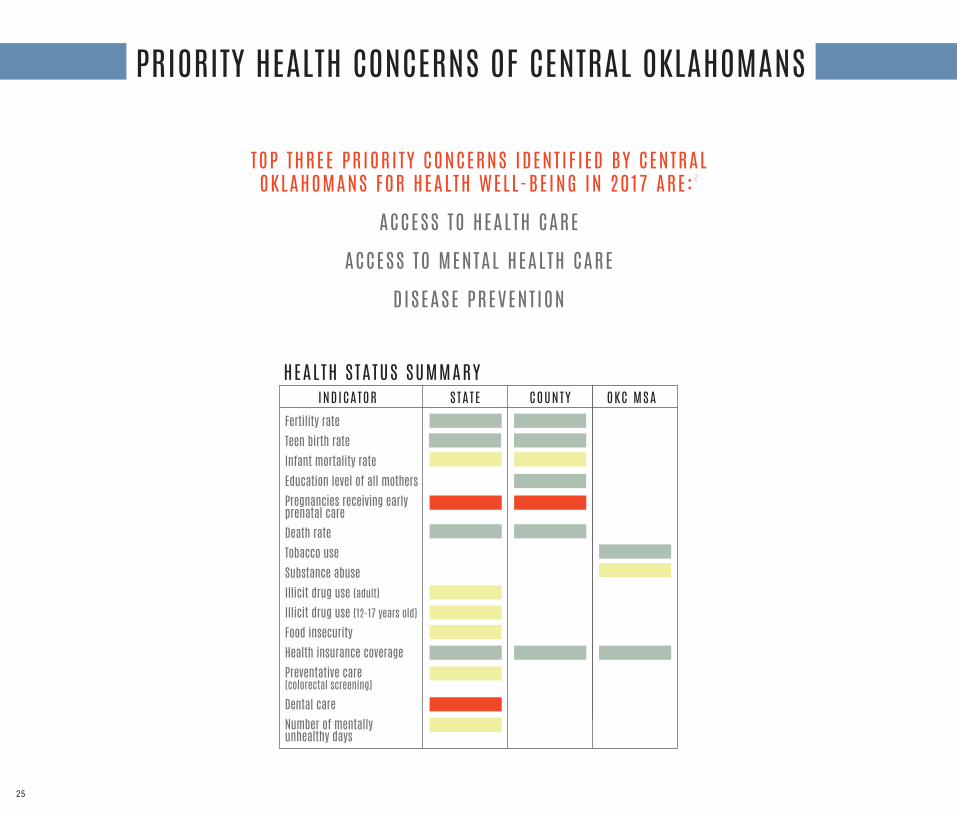
PRIORITY HEALTH CONCERNS OF CENTRAL OKLAHOMANS
TOP THREE PRIORI TY CONCERNS IDENT IF IED BY CENTRAL OKLAHOMANS FOR HEALTH WELL-BE ING IN 2017 ARE: 2
ACCESS TO HEALTH CARE
ACCESS TO MENTAL HEALTH CARE
DISEASE PREVENT ION
HEALTH STATUS SUMMARYINDICATOR STATE COUNTY OKC MSA
Fertility rateTeen birth rateInfant mortality rateEducation level of all mothersPregnancies receiving early prenatal careDeath rateTobacco useSubstance abuseIllicit drug use (adult)
Illicit drug use (12-17 years old)
Food insecurityHealth insurance coveragePreventative care (colorectal screening)
Dental careNumber of mentally unhealthy days
26
NOTES:a) Fert i l i ty rate is a measure of the number of l ive births per the populat ion of chi ld-bearing age women (age 15 to 44 years) and is reported here as a rate per 1 ,000 women. I t indicates a community ’s replacement level .
b) Teen birth rate measures the number of l ive births per the populat ion of teenage gir ls (age 15-19 years) .
c) The death of a baby before his or her f irst b irthday is cal led infant mortal i ty. Infant mortal i ty rate, which is the number of infant deaths per every 1 ,000 l ive births, is an indicator to measure the health and wel l-being of mother and infant .3
d) In the or ig inal data for 2007, the sub-indicators are l isted as 0 to 8 years; 9 to 1 1 years; 12 years; 13 to 15 years; and 16 or more years of educat ion.
e) Food insecurity is def ined as a lack of access, at t imes, to enough food for an act ive, healthy l i fe for al l household members and l imited or uncertain avai labi l i ty of nutr i t ional ly adequate foods.
26

2727
28
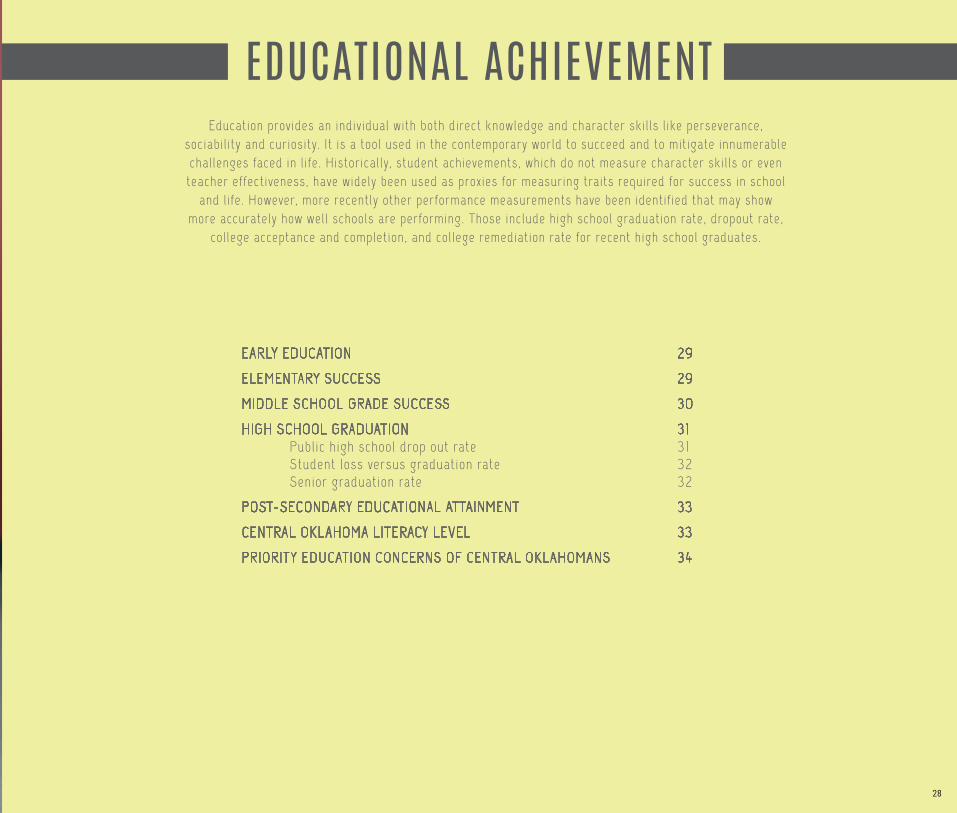
EDUCATIONAL ACHIEVEMENTEducat ion provides an individual with both direct knowledge and character ski l ls l ike perseverance,
sociabi l i ty and curiosity. I t is a tool used in the contemporary world to succeed and to mit igate innumerable chal lenges faced in l i fe . Histor ical ly, student achievements, which do not measure character ski l ls or even
teacher effect iveness, have widely been used as proxies for measuring traits required for success in school and l i fe . However, more recently other performance measurements have been ident i f ied that may show
more accurately how wel l schools are performing. Those include high school graduation rate, dropout rate, col lege acceptance and complet ion, and col lege remediat ion rate for recent high school graduates.
29
29
30
31313232
33
33
34
EARLY EDUCATION
ELEMENTARY SUCCESS
MIDDLE SCHOOL GRADE SUCCESS
HIGH SCHOOL GRADUATION Publ ic high school drop out rate Student loss versus graduation rate Senior graduation rate
POST-SECONDARY EDUCATIONAL ATTAINMENT
CENTRAL OKLAHOMA LITERACY LEVEL
PRIORITY EDUCATION CONCERNS OF CENTRAL OKLAHOMANS
28

29
EARLY EDUCATIONEarly educat ion for three and four year olds improves school readiness for k indergarten and the rest of their educat ional and professional careers.32
Early chi ldhood educat ion programs benef it a l l chi ldren with the greatest gains accruing to the highest-r isk chi ldren.33
57%
OF THREE AND FOUR YEAR OLDS IN OKLAHOMA – COMPARED TO 53% NAT IONALLY – HAVE NOT BEEN ENROLLED IN AN EARLY EDUCAT ION PROGRAM. 33
ELEMENTARY SUCCESS
The abi l i ty to read is cr i t ical to a chi ld ’s success in school , l i fe earning potent ial and their abi l i ty to contr ibute to our nat ion’s economy. A chi ld who gets to fourth grade without learning to read prof ic ient ly is on a high school dropout track, putt ing them at an increased r isk for poverty. The percent of students scoring prof ic ient or above in reading both nat ional ly and in Oklahoma has increased since 2007 by 3% and 6%, respect ively. Thirty-three percent of fourth graders in Oklahoma in 2015 scored prof ic ient or above. This is a record high in more than two decades for our state. However, th is should not overshadow the fact that more than 33,000 students in Oklahoma in 2015 scored below prof ic ient in reading.
The fourth grade math that our students are learning today may look a l i t t le di f ferent from what you learned in school . Now there is more emphasis on real-world problem appl icat ion and focus on the process of solving a problem not just the solut ion. In other words, emphasis is placed on act ivi t ies that require complex thoughts instead of just memoriz ing rules and facts. This strategy prepares our youth to enter and effect ively compete and part ic ipate in a world economy that demands more complex problem-solving ski l led workers.
Nat ional ly s ince 2007 the percent of fourth graders scoring prof ic ient or above in math has ranged from 39% to 41%. Comparat ively, Oklahoma’s percent of fourth graders scoring prof ic ient in math has steadi ly increased since 2007 by 4%. Despite this r is ing trend, Oklahoma fourth grade math prof ic iency scores st i l l fa l l below the nat ional average.
1 IN 6 CHILDREN WHO ARE NOT READING PROF IC IENTLY IN TH IRD GRADE DO NOT GRADUATE FROM HIGH SCHOOL ON T IME. 34
YEAR NAT ION
2007
2009
2011
2013
2015
STATE
32%32%32%
National Center for Education Statistics35
PERCENT OF FOURTH GRADERS SCORING PROF IC IENT OR ABOVE - READING a
27%28%27%
34%35%
30%33%
YEAR NAT ION
2007
2009
2011
2013
2015
STATE
39%38%40%
National Center for Education Statistics35
PERCENT OF FOURTH GRADERS SCORING PROF IC IENT OR ABOVE - MATH a
33%33%33%
41%39%
36%37%

30
MIDDLE SCHOOL GRADE SUCCESSMIDDLE SCHOOL GRADES ARE THE “MAKE I T OR BREAK I T” YEARS. 36
JUST ONE OF THE FOLLOWING OFF-TRACK INDICATORS IN MIDDLE SCHOOL PREDICTS A 15% TO 25% CHANCE OF NOT GRADUAT ING HIGH SCHOOL ON T IME: 36
• Fai l ing grade in mathematics or Engl ish/ language arts• Attendance rate less than 85%• ne unsat isfactory behavior mark in a core course
Both nat ional ly and local ly the percent of e ighth graders scoring prof ic ient or above in reading has incremental ly increased since 2007. Nat ional ly, the increase was by 4% compared to 3% in Oklahoma over the same period of t ime.
Math scores nat ional ly and in Oklahoma peaked in 2011 at 34% and 27%, respect ively. Since that t ime, however, the percent of e ighth graders scoring prof ic ient or above in math has returned to almost the 2007 rates. As of 2015, Oklahoma had more than 30,000 eighth graders who did not score prof ic ient or above in math.
T IPS FOR MIDDLE SCHOOL GRADE SUCCESS 36
• Attend back-to-school n ight and parent-teacher conferences• Vis it the school and i ts website regularly• Support homework expectat ions• Send your chi ld to school rested and ready to learn• Inst i l l organizat ional and study ski l ls• Make t ime to talk about school
YEAR NAT ION
2007
2009
2011
2013
2015
STATE
29%30%32%
National Center for Education Statistics35
PERCENT OF E IGHTH GRADERS SCORING PROF IC IENT OR ABOVE - READING a
26%26%27%
34%33%
29%29%
YEAR NAT ION
2007
2009
2011
2013
2015
STATE
31%33%34%
PERCENT OF E IGHTH GRADERS SCORING PROF IC IENT OR ABOVE - MATH a
21%24%27%
34%32%
25%23%
National Center for Education Statistics35

31
HIGH SCHOOL GRADUATION
PUBLIC H IGH SCHOOL DROPOUTS AND GRADUATESThe four-year publ ic high school dropout ratesb at both the Oklahoma state and county levels have cont inuously decreased since the 2005-06 school year. Decreasing by more than 45% at the state level and 40% at the county level .
INDIV IDUALS THAT DROPOUT OF H IGH SCHOOL ARE 63 times MORE L IKELY TO BE
INCARCERATED THAN COLLEGE GRADS. 37
YEAR STATE
2006-08
2008-10
2010-12
2012-14
2014-16
COUNTY
13.7%11.8%9.9%
Office of Educational Quality & Accountability38
PUBL IC H IGH SCHOOL DROPOUT RATE
14.5%11.9%10.7%
9.2%7.5%
9.2%8.5%
Crooked Oak Publ ic Schools in Oklahoma County has decreased their dropout rate by more than 80% over the last 10 academic years. 38
The average Oklahoma high school dropout rate for 2015-16 was 7.2%.38
Five Oklahoma County school distr icts have dropout rates higher than the state average including Western Heights, Oklahoma City, Putnam City, Jones and Crooked Oak Publ ic Schools . 38
Individuals who drop out of h igh school earn 29% less in their l i fet ime than those with a high school diploma or equivalent . 39
32
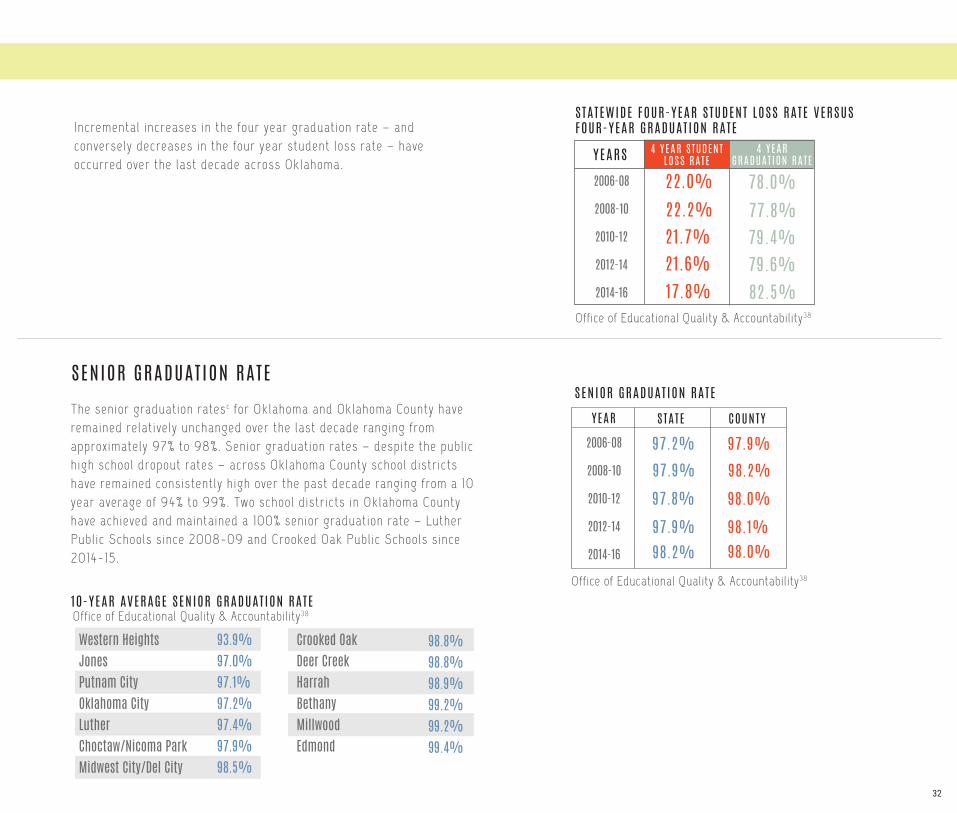
Incremental increases in the four year graduation rate – and conversely decreases in the four year student loss rate – have occurred over the last decade across Oklahoma.
STATEWIDE FOUR-YEAR STUDENT LOSS RATE VERSUS FOUR-YEAR GRADUAT ION RATE
YEARS
2006-08
2008-10
2010-12
2012-14
2014-16
22.0%22.2%21.7%
Office of Educational Quality & Accountability38
4 YEAR STUDENT LOSS RATE
21.6%
78.0%77.8%79.4%79.6%
4 YEAR GRADUAT ION RATE
SENIOR GRADUAT ION RATEThe senior graduation ratesc for Oklahoma and Oklahoma County have remained relat ively unchanged over the last decade ranging from approximately 97% to 98%. Senior graduation rates – despite the publ ic high school dropout rates – across Oklahoma County school distr icts have remained consistent ly high over the past decade ranging from a 10 year average of 94% to 99%. Two school distr icts in Oklahoma County have achieved and maintained a 100% senior graduation rate – Luther Publ ic Schools s ince 2008-09 and Crooked Oak Publ ic Schools s ince 2014-15.
YEAR STATE
2006-08
2008-10
2010-12
2012-14
2014-16
COUNTY
97.2%97.9%
97.8%
SENIOR GRADUAT ION RATE
97.9%98.2%
98.0%
97.9%98.2%
98.1%98.0%
Office of Educational Quality & Accountability38
10-YEAR AVERAGE SENIOR GRADUAT ION RATE
Western HeightsJonesPutnam CityOklahoma CityLutherChoctaw/Nicoma ParkMidwest City/Del City
93.9%97.0%97.1%97.2%97.4%97.9%98.5%
Crooked OakDeer CreekHarrahBethanyMillwoodEdmond
98.8%98.8%98.9%99.2%99.2%99.4%
Office of Educational Quality & Accountability38
17.8% 82.5%
33
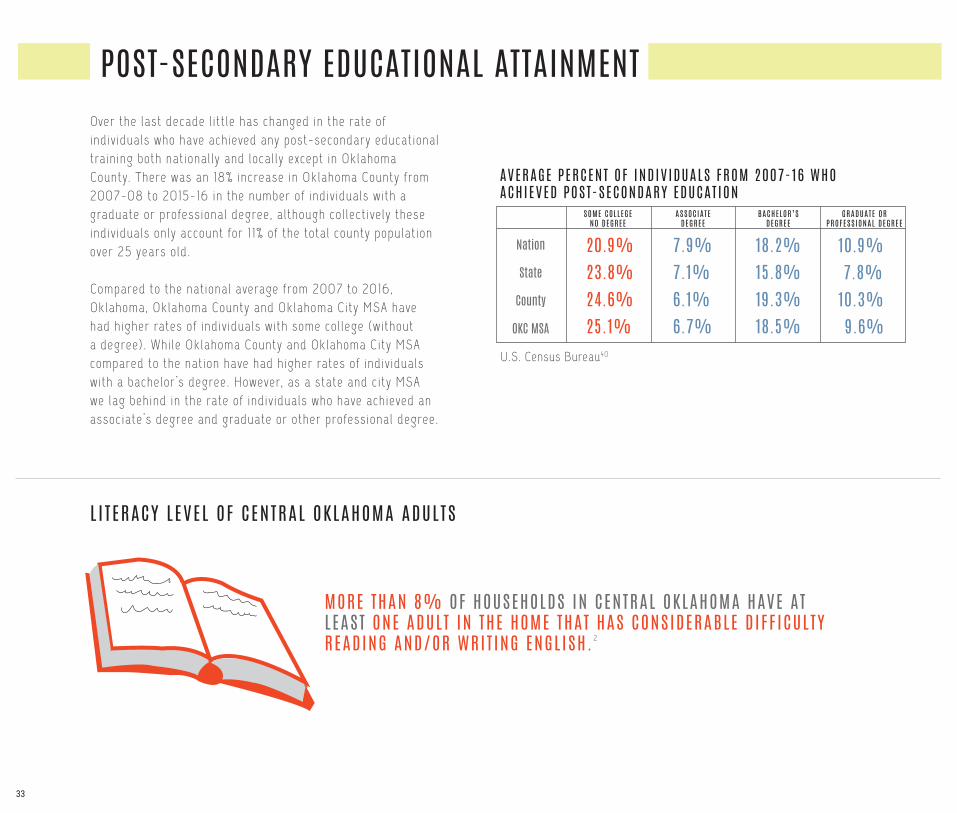
POST-SECONDARY EDUCATIONAL ATTAINMENTOver the last decade l i t t le has changed in the rate of individuals who have achieved any post-secondary educat ional training both nat ional ly and local ly except in Oklahoma County. There was an 18% increase in Oklahoma County from 2007-08 to 2015-16 in the number of individuals with a graduate or professional degree, a lthough col lect ively these individuals only account for 1 1% of the total county populat ion over 25 years old.
Compared to the nat ional average from 2007 to 2016, Oklahoma, Oklahoma County and Oklahoma City MSA have had higher rates of individuals with some col lege (without a degree) . Whi le Oklahoma County and Oklahoma City MSA compared to the nat ion have had higher rates of individuals with a bachelor ’s degree. However, as a state and city MSA we lag behind in the rate of individuals who have achieved an associate’s degree and graduate or other professional degree.
U.S. Census Bureau40
SOME COLLEGE NO DEGREE
Nation
State
County
OKC MSA
20.9%23.8%
7.9%7.1%
18.2%15.8%
AVERAGE PERCENT OF INDIV IDUALS FROM 2007-16 WHO ACHIEVED POST-SECONDARY EDUCAT ION
10.9%7.8%
ASSOCIATEDEGREE
BACHELOR’SDEGREE
GRADUATE ORPROFESSIONAL DEGREE
24.6% 6.1% 19.3% 10.3%25.1% 6.7% 18.5% 9.6%
MORE THAN 8% OF HOUSEHOLDS IN CENTRAL OKLAHOMA HAVE AT LEAST ONE ADULT IN THE HOME THAT HAS CONSIDERABLE D IFF ICULTY READING AND/OR WRIT ING ENGL ISH . 2
L I TERACY LEVEL OF CENTRAL OKLAHOMA ADULTS
34
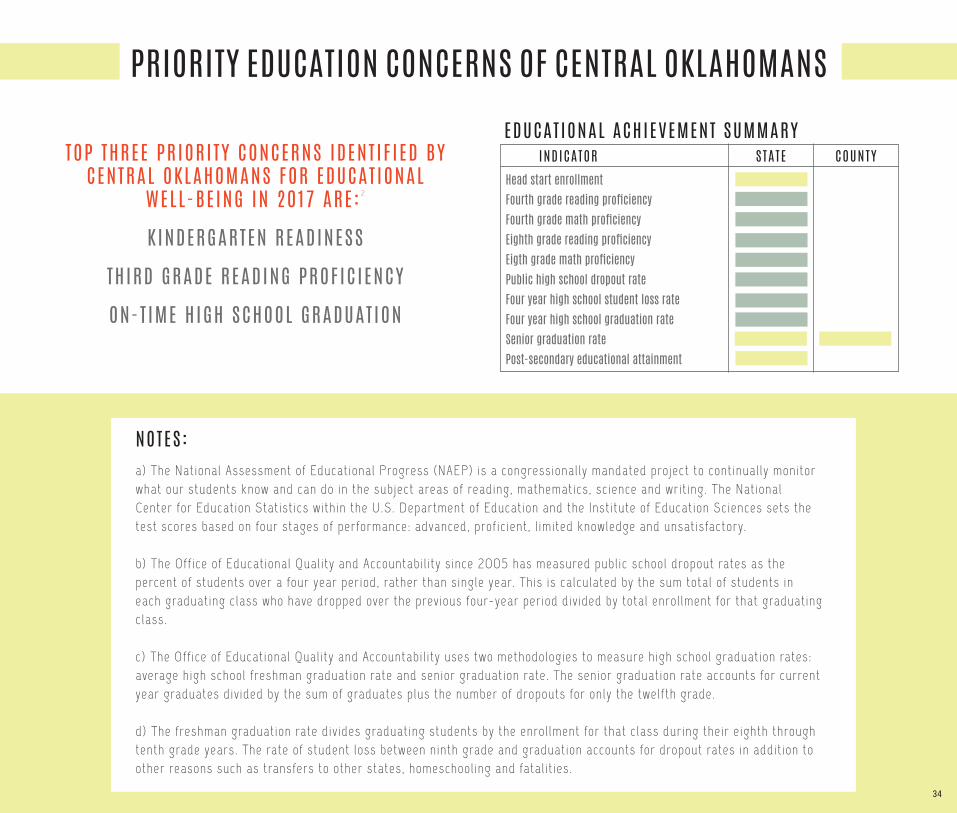
PRIORITY EDUCATION CONCERNS OF CENTRAL OKLAHOMANS
TOP THREE PRIORI TY CONCERNS IDENT IF IED BY CENTRAL OKLAHOMANS FOR EDUCAT IONAL
WELL-BE ING IN 2017 ARE: 2
KINDERGARTEN READINESS
THIRD GRADE READING PROF IC IENCY
ON-T IME H IGH SCHOOL GRADUAT ION
EDUCAT IONAL ACHIEVEMENT SUMMARYINDICATOR STATE COUNTY
Head start enrollmentFourth grade reading proficiencyFourth grade math proficiencyEighth grade reading proficiencyEigth grade math proficiencyPublic high school dropout rateFour year high school student loss rateFour year high school graduation rateSenior graduation ratePost-secondary educational attainment
a) The National Assessment of Educat ional Progress (NAEP) is a congressional ly mandated project to cont inual ly monitor what our students know and can do in the subject areas of reading, mathematics, sc ience and writ ing. The National Center for Educat ion Stat ist ics within the U.S. Department of Educat ion and the Inst i tute of Educat ion Sciences sets the test scores based on four stages of performance: advanced, prof ic ient , l imited knowledge and unsat isfactory.
b) The Off ice of Educat ional Qual i ty and Accountabi l i ty s ince 2005 has measured publ ic school dropout rates as the percent of students over a four year period, rather than single year. This is calculated by the sum total of students in each graduating class who have dropped over the previous four-year period divided by total enrol lment for that graduating class.
c) The Off ice of Educat ional Qual i ty and Accountabi l i ty uses two methodologies to measure high school graduation rates: average high school freshman graduation rate and senior graduation rate. The senior graduation rate accounts for current year graduates divided by the sum of graduates plus the number of dropouts for only the twelfth grade.
d) The freshman graduation rate divides graduating students by the enrol lment for that c lass during their e ighth through tenth grade years. The rate of student loss between ninth grade and graduation accounts for dropout rates in addit ion to other reasons such as transfers to other states, homeschool ing and fatal i t ies.
NOTES:
34
3535
36
ECONOMIC MOBILITYEconomic mobi l i ty is the abi l i ty of an individual or family to improve their economic status. The
whole community benef i ts when more working individuals and famil ies are able to stop walking a f inancial t ightrope and are able to get on sol id ground. Financial ly stable households support our local economy through their purchases in goods and services as wel l as increase our tax revenue, which is used for funding educat ion and bui ld ing roads and br idges. The fol lowing indicators have
been chosen in order to help us understand the long-term economic health of our community.
POPULATION GROWTH
EMPLOYMENT AND EARNINGS Unemployment rate Median income Financial security and ret irement
POVERTY Individuals experiencing poverty Chi ldren experiencing poverty Students el ig ible for low-cost or free school lunches Grandparents rais ing grandchi ldren
HOUSING Homeownership Median gross rent Individuals experiencing homelessness
PRIORITY ECONOMIC CONCERNS OF CENTRAL OKLAHOMANS
37
37373838
3838394040
41414142
43
36

37
POPULATION GROWTHOklahoma’s populat ion s ince 2007 is est imated to have grown by over 306,000 individuals with more than half of those individuals residing in Oklahoma City.
MEAN YEARLY PERCENT POPULAT ION GROWTH FROM 2007 TO 2016
U.S. Census Bureau41
Nation 0.8% 0.9% 1.3% 1.6%State County OKC MSA
TOTAL EST IMATED POPULAT ION GROWTH FROM 2007 TO 2016
U.S. Census Bureau41
Nation 7.5% 8.5% 11.6% 15.0%State County OKC MSA
EMPLOYMENT AND EARNINGS
The unemployment rate in Oklahoma, Oklahoma County and Oklahoma City MSA has been below the nat ional average since 2007-08. A peak in local unemployment was experienced during 2009-10, however, s ince that t ime unemployment rates have receded to almost better than 2007-08 rates.
YEAR NAT ION
2007-09
2009-10
2011-12
2013-14
2015-16
STATE
6.4%10.4%9.9%
5.0%7.5%7.2%
COUNTY
5.3%7.5%6.8%
4.9%7.1%6.2%
OKC MSA
7.8%6.1%
6.0%5.8%
6.1%5.0%
5.6%5.0%
PERCENT OF INDIV IDUALS UNEMPLOYED FOR THE POPULAT ION 16 YEARS AND OVER
U.S. Census Bureau42
UNEMPLOYMENT RATE
38
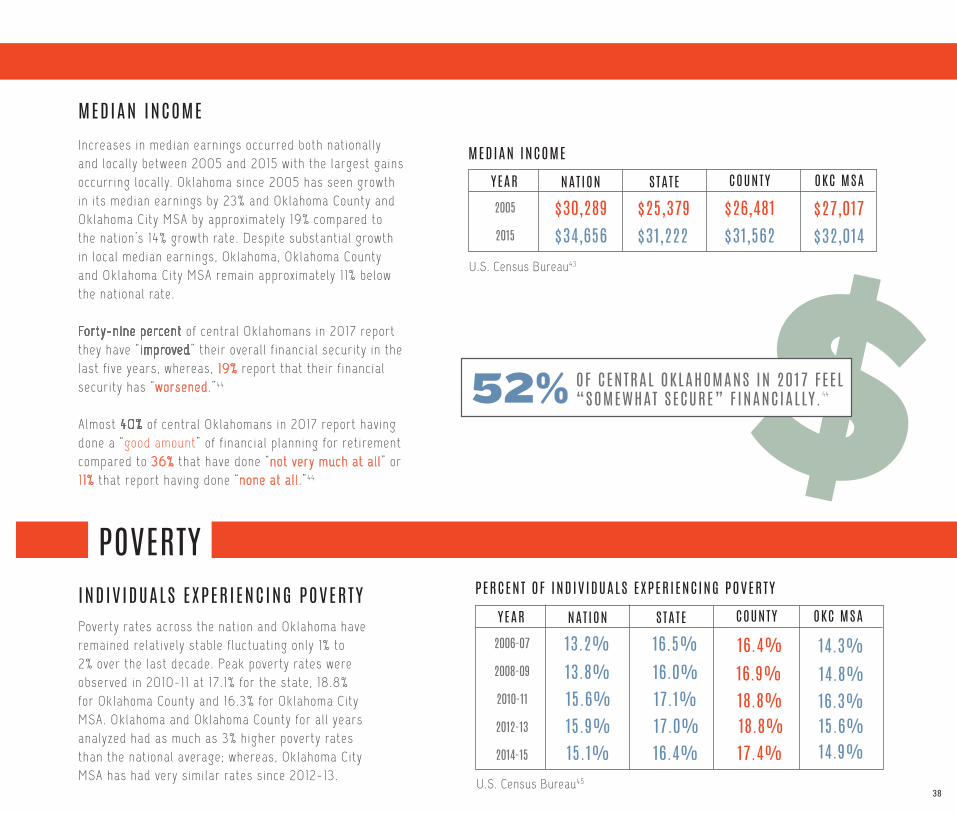
Increases in median earnings occurred both nat ional ly and local ly between 2005 and 2015 with the largest gains occurr ing local ly. Oklahoma since 2005 has seen growth in i ts median earnings by 23% and Oklahoma County and Oklahoma City MSA by approximately 19% compared to the nat ion’s 14% growth rate. Despite substant ial growth in local median earnings, Oklahoma, Oklahoma County and Oklahoma City MSA remain approximately 1 1% below the nat ional rate.
Forty-nine percent of central Oklahomans in 2017 report they have “ improved” their overal l f inancial security in the last f ive years, whereas, 19% report that their f inancial security has “worsened.”44
Almost 40% of central Oklahomans in 2017 report having done a “good amount” of f inancial p lanning for ret irement compared to 36% that have done “not very much at al l ” or 1 1% that report having done “none at al l . ” 44
MEDIAN INCOME
MEDIAN INCOME
U.S. Census Bureau43
YEAR NAT ION
2005
2015
STATE
$30,289 COUNTY OKC MSA
$34,656 $25,379 $31,222
$26,481 $31,562
$27,017 $32,014
$OF CENTRAL OKLAHOMANS IN 2017 FEEL “SOMEWHAT SECURE” F INANCIALLY. 4452%
Poverty rates across the nat ion and Oklahoma have remained relat ively stable f luctuat ing only 1% to 2% over the last decade. Peak poverty rates were observed in 2010-11 at 17. 1% for the state, 18.8% for Oklahoma County and 16.3% for Oklahoma City MSA. Oklahoma and Oklahoma County for al l years analyzed had as much as 3% higher poverty rates than the nat ional average; whereas, Oklahoma City MSA has had very s imi lar rates s ince 2012-13.
POVERTY
YEAR NAT ION
2006-07
2008-09
2010-11
2012-13
2014-15
STATE
13.2%13.8%15.6%
16.5%16.0%17.1%
COUNTY
16.4%16.9%18.8%
14.3%14.8%16.3%
OKC MSA
15.9%15.1%
17.0%16.4%
18.8%17.4%
15.6%14.9%
U.S. Census Bureau45
PERCENT OF INDIV IDUALS EXPERIENCING POVERTYINDIV IDUALS EXPERIENCING POVERTY

39
POVERTY
Percent of chi ldren l iving in povertya across the nat ion has been on the r ise over the last decade, but remained relat ively unchanged here local ly. Nat ional ly, the peak rate in chi ldren experiencing poverty occurred in 2012-13 and although i t has receded since then, i t st i l l remains 3% higher than i t was 10 years ago.
Local ly, Oklahoma County has experienced the largest f luctuat ion of changes, where a peak rate in chi ldren experiencing poverty occurred in 2012-13 at 28%, an increase of more than 4% over s ix years. The percent of chi ldren experiencing poverty in Oklahoma County s ince then has decreased to almost the 2006-07 rate.
CHILDREN EXPERIENCING POVERTY
YEAR NAT ION
2006-07
2008-09
2010-11
2012-13
2014-15
STATE
18.2%19.1%22.1%
23.4%22.4%24.1%
COUNTY
24.1%24.5%27.9%
19.8%20.4%22.9%
OKC MSA
22.4%21.2%
24.1%22.3%
28.4%25.8%
22.1%20.6%
U.S. Census Bureau45
PERCENT OF CHILDREN EXPERIENCING POVERTY
OKLAHOMA COUNTY CHILDREN IN 2015 L IVED IN POVERTY. 45
MORE THAN195,000

40
On trend with the rate of chi ldren experiencing poverty, the percent of students el ig ible to part ic ipate in the National School Lunch Programb (NSLP), which provides low-cost or free lunches to chi ldren each school day has been on the r ise s ince 2006 and peaking in the 2012-13 school year. Although both the overal l state and Oklahoma County rates have been decl in ing s ince the 2014-2015 school year, the Oklahoma County percent of students el ig ible for reduced-price or free lunches remains higher than the average state rate.
During the 2015-2016 academic year in Oklahoma County, there was one school distr ict with more than 75% of chi ldren part ic ipat ing in the NSLP (Putnam City) ; one with more than 80% of chi ldren in the school distr ict part ic ipat ing (Oklahoma City) and four with more than 90% of chi ldren in the school distr ict part ic ipat ing (Western Heights, Crooked Oak, Mi l lwood, and Crutcho) . 46 Fourth grade students in Oklahoma in 2015 who were el ig ible for free or low cost lunches were twice as l ikely to score “below basic” in reading and four t imes as l ikely to score “below basic” in math.47
7 OF 15 SCHOOL D ISTR ICTS IN OKLAHOMA COUNTY HAVE H IGHER RATES OF STUDENTS EL IG IBLE FOR LOW-COST OR FREE LUNCHES THAN THE AVERAGE OVERALL STATE RATE .
YEAR
2006-08
2008-10
2010-12
2012-14
2014-16
STATE
56.0%57.6%61.1%
58.6%60.6%63.8%
COUNTY
62.0%61.8%
65.1%63.1%
Oklahoma Office of Educational Quality and Accountability38
PERCENT OF STUDENTS EL IG IBLE FOR LOW-COST OR FREE SCHOOL LUNCHES
GRANDPARENTS RAIS ING GRANDCHILDREN
Older Oklahomans potent ial ly face health and f inancial burdens of their own. Oklahoma grandparents rais ing grandchi ldren also face the addit ional chal lenges of having to f ind the means to care both physical ly and f inancial ly for their grandchi ldren.41
Number of grandparents (age 60 years +) s ince 2007 responsible for rais ing grandchi ldren under 18 years old has remained relat ively stable both in Oklahoma and in Oklahoma County.
YEAR
2007-08
2009-10
2011-12
2013-14
2015-16
STATE
2.3%1.8%2.2%
1.9%1.8%2.3%
COUNTY
2.2%2.3%
2.0%2.1%
PERCENT OF OLDER OKLAHOMANS RAIS ING GRANDCHILDREN
U.S. Census Bureau41
41
HOUSING
HOMEOWNERSHIP
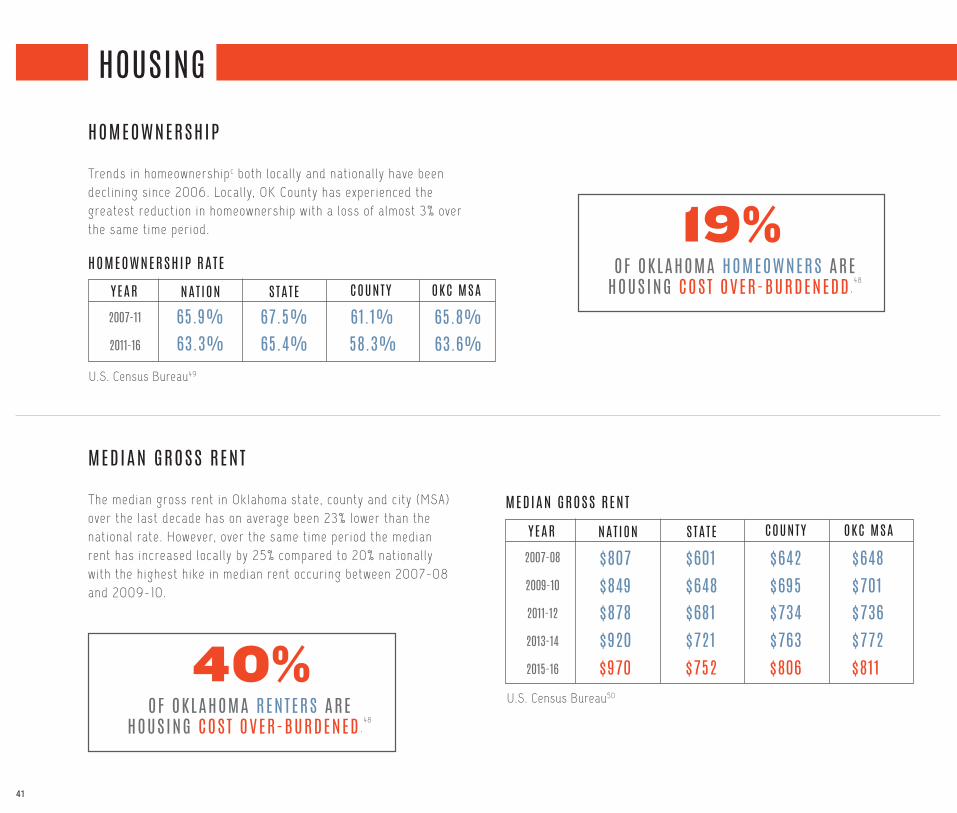
Trends in homeownershipc both local ly and nat ional ly have been decl in ing s ince 2006. Local ly, OK County has experienced the greatest reduct ion in homeownership with a loss of almost 3% over the same t ime period.
HOMEOWNERSHIP RATE
U.S. Census Bureau49
YEAR NAT ION
2007-11
2011-16
STATE COUNTY OKC MSA
MEDIAN GROSS RENT
The median gross rent in Oklahoma state, county and city (MSA) over the last decade has on average been 23% lower than the nat ional rate. However, over the same t ime period the median rent has increased local ly by 25% compared to 20% nat ional ly with the highest hike in median rent occuring between 2007-08 and 2009-10.
65.9% 67.5% 61.1% 65.8%63.3% 65.4% 58.3% 63.6%
YEAR NAT ION
2007-08
2009-10
2011-12
2013-14
2015-16
STATE COUNTY OKC MSA
U.S. Census Bureau50
MEDIAN GROSS RENT
$807 $849 $878$920$970
$601$648$681$721$752
$642$695$734$763$806
$648$701$736$772$811
OF OKLAHOMA HOMEOWNERS ARE HOUSING COST OVER-BURDENEDD .
48
19%
OF OKLAHOMA RENTERS ARE HOUSING COST OVER-BURDENED .
48
40%
42
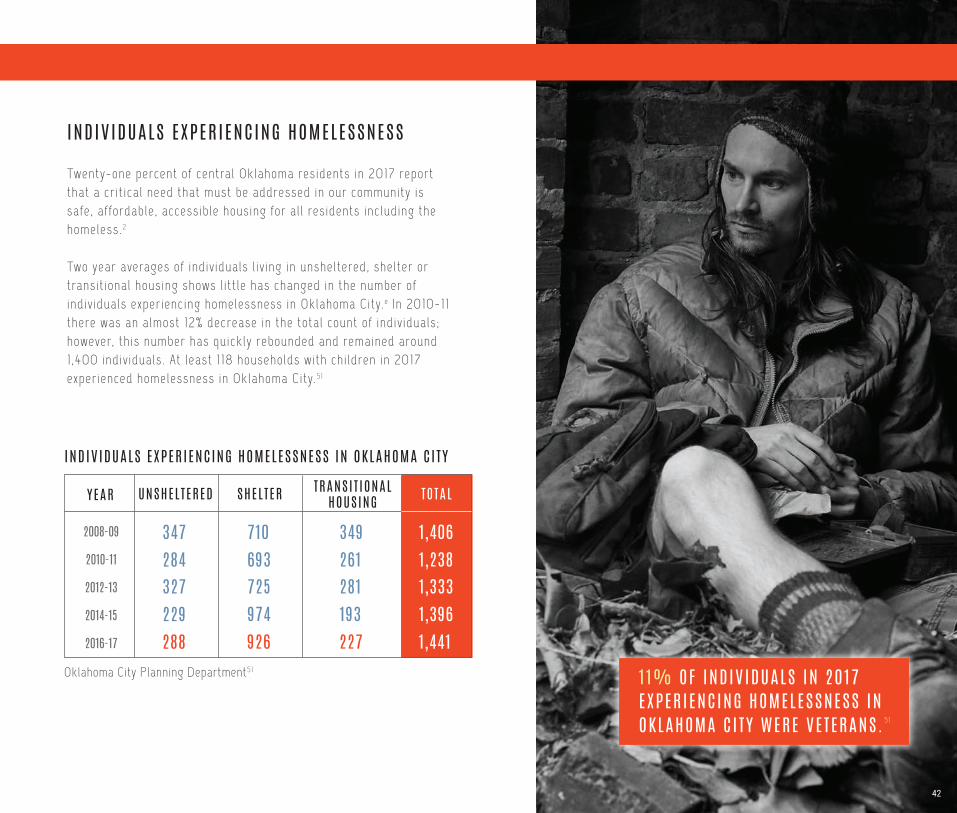
Twenty-one percent of central Oklahoma residents in 2017 report that a cr i t ical need that must be addressed in our community is safe, affordable, accessible housing for al l residents including the homeless.2
Two year averages of individuals l iving in unsheltered, shelter or transit ional housing shows l i t t le has changed in the number of individuals experiencing homelessness in Oklahoma City. e In 2010-11 there was an almost 12% decrease in the total count of individuals ; however, th is number has quickly rebounded and remained around 1 ,400 individuals . At least 1 18 households with chi ldren in 2017 experienced homelessness in Oklahoma City. 51
INDIV IDUALS EXPERIENCING HOMELESSNESS
YEAR UNSHELTERED
2008-09
2010-11
2012-13
2014-15
2016-17
SHELTER TRANSI T IONAL HOUSING TOTAL
Oklahoma City Planning Department51
INDIV IDUALS EXPERIENCING HOMELESSNESS IN OKLAHOMA CI TY
347284327229288
710693725974926
349261281193227
1,4061,2381,3331,3961,441
42
1 1% OF INDIV IDUALS IN 2017 EXPERIENCING HOMELESSNESS IN OKLAHOMA CI TY WERE VETERANS. 51
43
PRIORITY ECONOMIC CONCERNS OF CENTRAL OKLAHOMANS
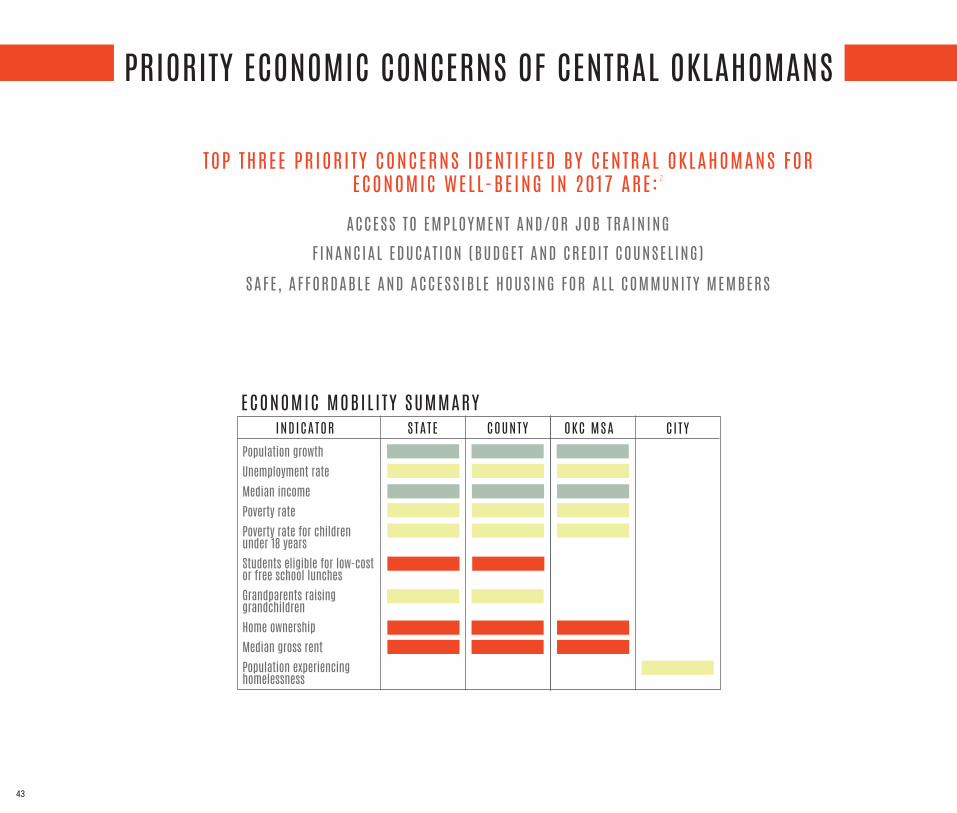
ECONOMIC MOBIL I TY SUMMARYINDICATOR STATE COUNTY OKC MSA
Population growthUnemployment rateMedian incomePoverty ratePoverty rate for children under 18 yearsStudents eligible for low-cost or free school lunchesGrandparents raising grandchildrenHome ownershipMedian gross rentPopulation experiencing homelessness
C I TY
TOP THREE PRIORI TY CONCERNS IDENT IF IED BY CENTRAL OKLAHOMANS FOR ECONOMIC WELL-BE ING IN 2017 ARE: 2
ACCESS TO EMPLOYMENT AND/OR JOB TRAINING F INANCIAL EDUCAT ION (BUDGET AND CREDI T COUNSEL ING)
SAFE , AFFORDABLE AND ACCESSIBLE HOUSING FOR ALL COMMUNITY MEMBERS
4444
NOTES:a) The poverty rate for chi ldren under the age of 18 years is ref lect ive of the number of chi ldren l iving in households with household income at or below 100% of the Federal Poverty Level (FPL). The FPL for a family of four in 2015 was $24,250.
b) In order for a student to be el ig ible for the Free Lunch Program, their family must earn less than 130% of the FPL. El ig ib i l i ty for the Reduced Price Lunch Program is determined i f a student’s family earns between 130% and 185% of the FPL.
c) Home ownership rates account for the percentage of residents l iving in owner-occupied housing.
d) Individuals that are housing cost over-burdened spend 30% or more of their monthly income on rent/mortgage and ut i l i t ies combined.
e) In order to understand the number of individuals experiencing homelessness in Oklahoma City a one night Point-in-Time survey is administered every January. The data shared in this report is then a ref lect ion of that one night count . According to the Corporat ion for Support ive Housing (Est imating the Need, 2005), a more accurate total number of individuals experiencing homelessness in a year is l ikely four to f ive t imes the annual one night total .

4545
46
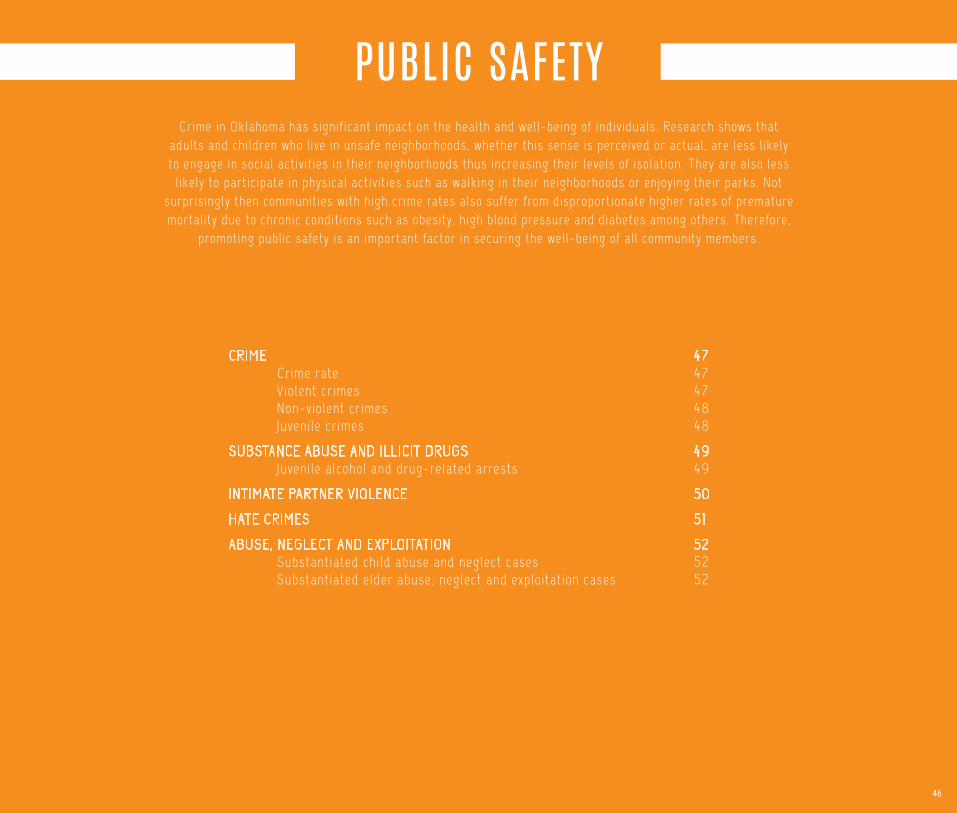
PUBLIC SAFETYCrime in Oklahoma has s ignif icant impact on the health and wel l-being of individuals . Research shows that
adults and chi ldren who l ive in unsafe neighborhoods, whether this sense is perceived or actual , are less l ikely to engage in social act ivi t ies in their neighborhoods thus increasing their levels of isolat ion. They are also less
l ikely to part ic ipate in physical act ivi t ies such as walking in their neighborhoods or enjoying their parks. Not surpris ingly then communit ies with high cr ime rates also suffer from disproport ionate higher rates of premature mortal i ty due to chronic condit ions such as obesity, h igh blood pressure and diabetes among others. Therefore,
promoting publ ic safety is an important factor in securing the wel l-being of al l community members.
46
4747474848
4949
50
51
525252
CRIME Cr ime rate Violent cr imes Non-violent cr imes Juveni le cr imes
SUBSTANCE ABUSE AND ILLICIT DRUGS Juveni le alcohol and drug-related arrests
INTIMATE PARTNER VIOLENCE
HATE CRIMES
ABUSE, NEGLECT AND EXPLOITATION Substant iated chi ld abuse and neglect cases Substant iated elder abuse, neglect and exploitat ion cases

47
CRIME
CRIME RATEThe overal l cr ime rate across the nat ion, state, county and city s ince 2007-08 has been on a decl ine. Overal l , s ince 2007-08 there has been a decrease of 1 1% in Oklahoma and 19% in Oklahoma County in the total number of cr imes reported.
YEAR NAT ION
2007-08
2009-10
2011-12
2013-14
2015-16
STATE
30.127.325.9
39.939.538.6
COUNTY
58.458.658.8
57.857.956.9
CITY
24.025.8
35.432.8
50.141.7
49.545.6
Oklahoma Bureau of Investigation52
CRIME RATE OF OFFENSES PER 1 ,000 INHABITANTS
V IOLENT CRIMESThe vio lent cr imes of murder and rape since 2007-08 have increased by 1 1% and 36%, respect ively, in Oklahoma and 24% and 44%, respect ively, in Oklahoma City. Assaults have also increased by 2% in Oklahoma City. Robberies have decreased 13% and 20% in Oklahoma and Oklahoma City, respect ively. Across Oklahoma, however, assaults have decreased by 1 1%.
YEAR STATE
2007-09
2009-10
2011-12
2013-14
2015-16
C I TY
434420438
Oklahoma Bureau of Investigation52
MURDER RAPE
STATE C I TY
ROBBERY
STATE C I TY STATE C I TY
ASSAULT
385480
115119143107143
3,0112,9933,1343,6394,082
644634666884925
7,0386,6596,5006,0806,095
2,9212,3612,4412,3172,336
26,71126,24125,82822,71323,882
6,3327,3717,3326,4726,451
48
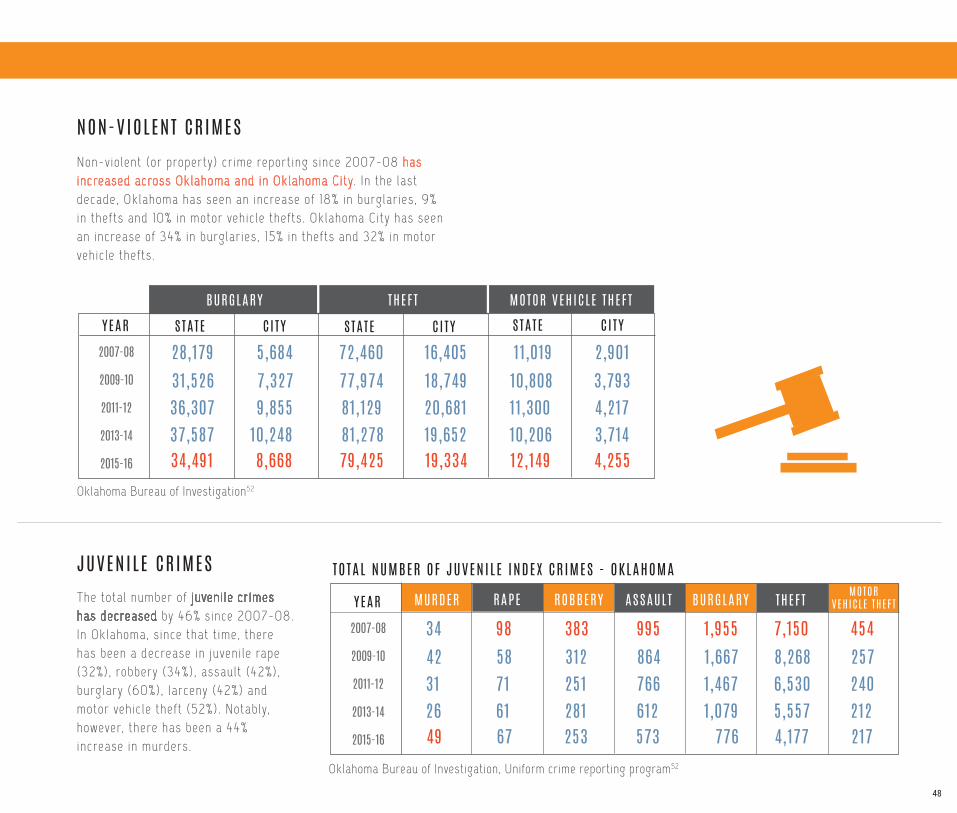
NON-VIOLENT CRIMESNon-violent (or property) cr ime report ing s ince 2007-08 has increased across Oklahoma and in Oklahoma City. In the last decade, Oklahoma has seen an increase of 18% in burglar ies, 9% in thefts and 10% in motor vehic le thefts . Oklahoma City has seen an increase of 34% in burglar ies, 15% in thefts and 32% in motor vehic le thefts .
YEAR STATE
2007-08
2009-10
2011-12
2013-14
2015-16
C I TY
28,17931,52636,307
Oklahoma Bureau of Investigation52
BURGLARY THEFT
STATE C I TY
MOTOR VEHICLE THEFT
STATE C I TY
37,58734,491
5,6847,3279,855
10,2488,668
72,46077,97481,12981,27879,425
16,40518,74920,68119,65219,334
11,01910,80811,30010,20612,149
2,9013,7934,2173,7144,255
JUVENILE CRIMESThe total number of juveni le cr imes has decreased by 46% since 2007-08. In Oklahoma, s ince that t ime, there has been a decrease in juveni le rape (32%), robbery (34%), assault (42%), burglary (60%), larceny (42%) and motor vehic le theft (52%). Notably, however, there has been a 44% increase in murders.
YEAR
2007-08
2009-10
2011-12
2013-14
2015-16
344231
Oklahoma Bureau of Investigation, Uniform crime reporting program52
2649
MURDER RAPE ROBBERY ASSAULT BURGLARY THEFT MOTOR VEHICLE THEFT
9858716167
383312251281253
995864766612573
1,9551,6671,4671,079
776
7,1508,2686,5305,5574,177
454257240212217
TOTAL NUMBER OF JUVENILE INDEX CRIMES - OKLAHOMA
49
SUBSTANCE ABUSE AND ILLICIT DRUGS
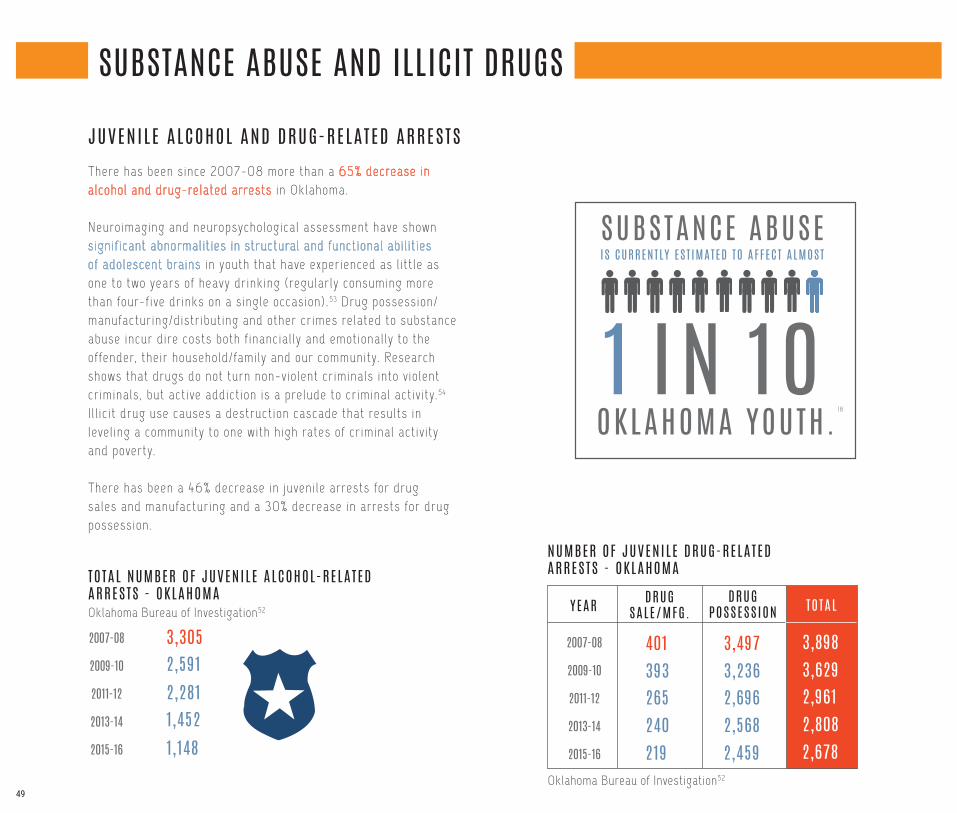
JUVENILE ALCOHOL AND DRUG-RELATED ARRESTSThere has been since 2007-08 more than a 65% decrease in alcohol and drug-related arrests in Oklahoma.
Neuroimaging and neuropsychological assessment have shown signif icant abnormal it ies in structural and funct ional abi l i t ies of adolescent brains in youth that have experienced as l i t t le as one to two years of heavy dr inking (regularly consuming more than four-f ive dr inks on a s ingle occasion) .53 Drug possession/ manufacturing/distr ibut ing and other cr imes related to substance abuse incur dire costs both f inancial ly and emotional ly to the offender, their household/family and our community. Research shows that drugs do not turn non-violent cr iminals into vio lent cr iminals , but act ive addict ion is a prelude to cr iminal act ivi ty. 54 I l l ic i t drug use causes a destruct ion cascade that results in level ing a community to one with high rates of cr iminal act ivi ty and poverty. There has been a 46% decrease in juveni le arrests for drug sales and manufacturing and a 30% decrease in arrests for drug possession.
SUBSTANCE ABUSE
1 IN 10IS CURRENTLY EST IMATED TO AFFECT ALMOST
OKLAHOMA YOUTH.18
2007-08
2009-10
2011-12
2013-14
2015-16
3,3052,5912,281
TOTAL NUMBER OF JUVENILE ALCOHOL-RELATED ARRESTS - OKLAHOMA
1,4521,148
Oklahoma Bureau of Investigation52 YEAR DRUG SALE/MFG.
2007-08
2009-10
2011-12
2013-14
2015-16
DRUG POSSESSION TOTAL
NUMBER OF JUVENILE DRUG-RELATED ARRESTS - OKLAHOMA
401393265240219
3,4973,2362,6962,5682,459
3,8983,6292,9612,8082,678
Oklahoma Bureau of Investigation52

50
INTIMATE PARTNER VIOLENCE Int imate partner vio lence ( IPV), a lso known as domestic vio lence, imposes severe f inancial hardship on vict ims, households, pr ivate businesses, publ ic health and human services sector, and communit ies.55 More than 240,000 IPV reports were f i led in Oklahoma between 2007 and 2016. The highest recorded number of reports during this per iod of t ime was in 2014 with 24,226 and the lowest in 2013 with 22,801.
Although the incidence of IPV has unpredictably f luctuated every year over the last decade, the average rate of IPV shows an overal l average of a 4% increase in occurrence s ince 2007. Comparing total numbers of speci f ic types of IPV cr imes from 2007-08 to 2015-16, there is an overarching increase in sex cr imes as wel l as assault and batter ies and a decrease in murders and assault cases. Specif ical ly, over this t ime period there was a 74% and 6% increase in sex cr imes and assault and batter ies, respect ively, and a 4% and 35% decrease in murders and assaults , respect ively.
OKLAHOMA RANKED FOURTH IN THE NAT ION IN 2016 FOR
THE NUMBER OF WOMEN K ILLED
BY MEN.
47,253 50,631 49,521
TOTAL NUMBER OF INT IMATE PARTNER V IOLENCE REPORTS - OKLAHOMA
47,027 48,119
Oklahoma Bureau of Investigation52
2007-08 2009-10 2011-12 2013-14 2015-16
YEAR
2007-08
2009-10
2011-12
2013-14
2015-16
10711110096
103
MURDER SEX CRIMES ASSAULT ASSAULT &BATTERY
1,0621,2671,6111,6231,856
6,9566,7074,8964,8254,532
39,12842,54642,91440,48341,628
TOTAL NUMBER OF JUVENILE INDEX CRIMES - OKLAHOMA
Oklahoma Bureau of Investigation52
50
51
HATE CRIMES
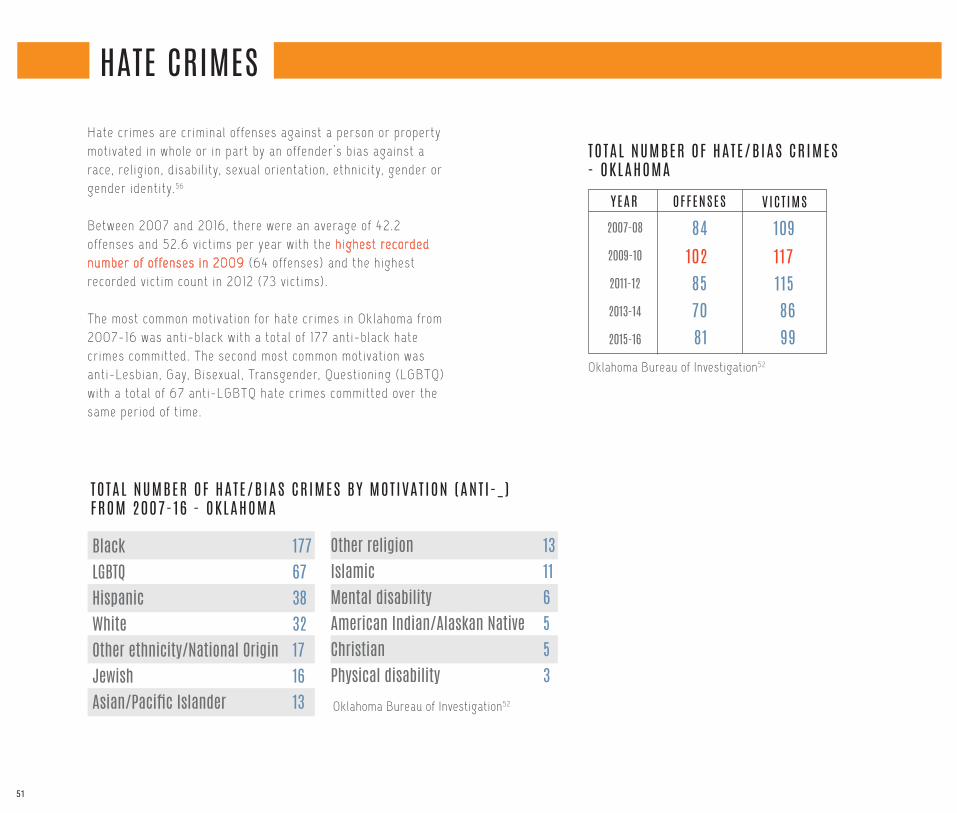
Hate cr imes are cr iminal offenses against a person or property motivated in whole or in part by an offender’s bias against a race, rel ig ion, d isabi l i ty, sexual or ientat ion, ethnic ity, gender or gender ident ity. 56
Between 2007 and 2016, there were an average of 42.2 offenses and 52.6 vict ims per year with the highest recorded number of offenses in 2009 (64 offenses) and the highest recorded vict im count in 2012 (73 vict ims).
The most common motivat ion for hate cr imes in Oklahoma from 2007-16 was ant i-black with a total of 177 ant i-black hate cr imes committed. The second most common motivat ion was ant i-Lesbian, Gay, Bisexual , Transgender, Quest ioning (LGBTQ) with a total of 67 ant i-LGBTQ hate cr imes committed over the same period of t ime.
YEAR
2007-08
2009-10
2011-12
2013-14
2015-16
OFFENSES
8410285
109117115
VICT IMS
7081
8699
TOTAL NUMBER OF HATE/BIAS CRIMES - OKLAHOMA
Oklahoma Bureau of Investigation52
TOTAL NUMBER OF HATE/BIAS CRIMES BY MOT IVAT ION (ANT I -_ ) FROM 2007-16 - OKLAHOMA
BlackLGBTQHispanicWhiteOther ethnicity/National OriginJewishAsian/Pacific Islander
177 67 38 32 17 16 13
Other religionIslamicMental disabilityAmerican Indian/Alaskan NativeChristianPhysical disability
13 11 6 5 5 3
Oklahoma Bureau of Investigation52

52
ABUSE, NEGLECT AND EXPLOITATION
Chi ld abuse, neglect and maltreatment have consequences for the chi ld , family and society that may last l i fet imes, i f not generat ions.57 Chi ldren who have experienced abuse are nine t imes more l ikely to become involved in cr iminal act ivi t ies in their l i fet ime.58
Adults that experienced abuse as chi ldren are more l ikely to commit interpersonal vio lence in their future relat ionships, perpetuat ing the cycle of abuse.59 On average 27% of al l invest igated chi ld abuse and neglect cases in Oklahoma and 29% in OK County are deemed “substant iated.” Since 2007, there have been more than 114,000 substant iated cases of chi ld abuse and neglect in Oklahoma of which more than 26,000 of those cases were from Oklahoma County. Cases represent a dupl icated count in s ituat ions where a family was invest igated more than once and also does not represent a s ingle chi ld as cases may involve mult ip le chi ldren from a family.
SUBSTANT IATED CHILD ABUSE AND NEGLECT CASES 8 1% OF CONFIRMED OKLAHOMA CASES IN 2016 WERE DETERMINED TO
BE MALTREATMENT BY NEGLECT .60
YEAR
2007-08
2009-10
2011-12
2013-14
2015-16
STATE
24,90515,85317,952
6,7234,0014,192
COUNTY
25,57730,439
5,0466,104
NUMBER OF SUBSTANT IATED CHILD ABUSE AND NEGLECT CASES
Oklahoma Department of Human Services61
Older Oklahomans compose 14.2% of Oklahoma’s populat ion with this populat ion ant ic ipated to increase to over 20% of the total populat ion by 2030.62
Elder abuse and exploitat ion includes f inancial , physical or emotional explo itat ion and is an intent ional act , or fa i lure to act , by a caregiver or another person in a relat ionship involving an expectat ion of trust that causes or creates a r isk of harm to an older adult (age 60+ years) .63
SUBSTANT IATED ELDER ABUSE , NEGLECT AND EXPLOI TAT ION CASES
52
53
ABUSE, NEGLECT AND EXPLOITATION
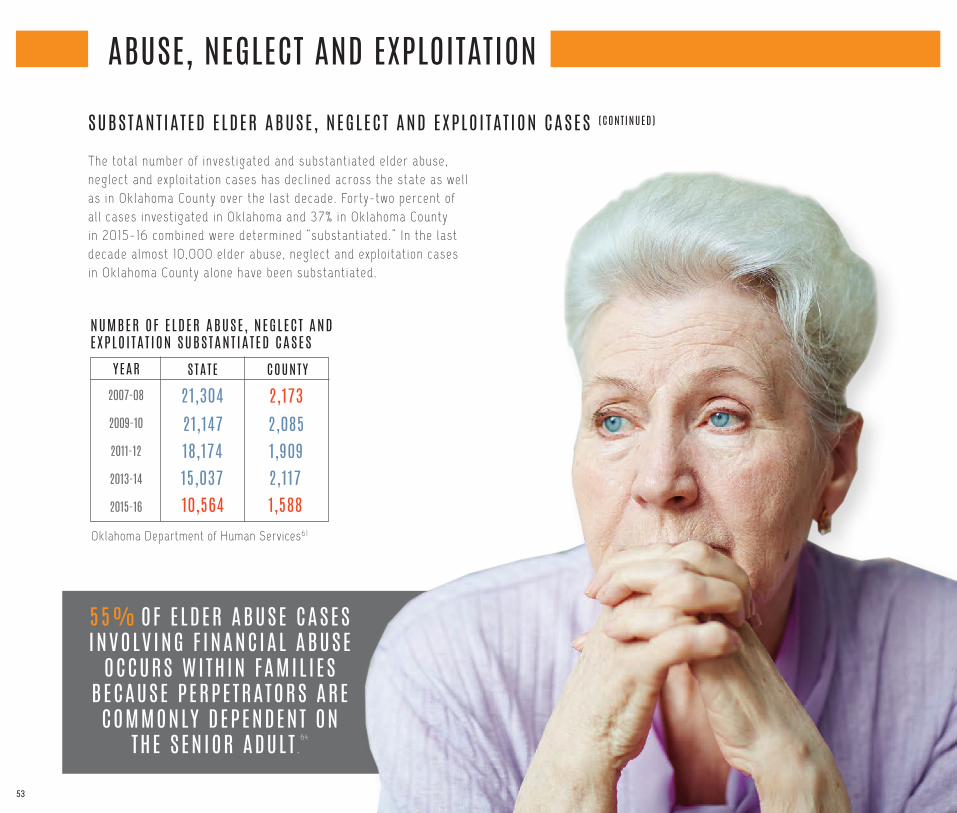
The total number of invest igated and substant iated elder abuse, neglect and exploitat ion cases has decl ined across the state as wel l as in Oklahoma County over the last decade. Forty-two percent of al l cases invest igated in Oklahoma and 37% in Oklahoma County in 2015-16 combined were determined “substant iated.” In the last decade almost 10,000 elder abuse, neglect and exploitat ion cases in Oklahoma County alone have been substant iated.
SUBSTANT IATED ELDER ABUSE , NEGLECT AND EXPLOI TAT ION CASES (CONT INUED)
YEAR
2007-08
2009-10
2011-12
2013-14
2015-16
STATE
21,30421,14718,174
2,1732,0851,909
COUNTY
15,03710,564
2,1171,588
NUMBER OF ELDER ABUSE , NEGLECT AND EXPLOI TAT ION SUBSTANT IATED CASES
Oklahoma Department of Human Services61
55% OF ELDER ABUSE CASES
INVOLVING F INANCIAL ABUSE OCCURS WITHIN FAMIL IES
BECAUSE PERPETRATORS ARE COMMONLY DEPENDENT ON
THE SENIOR ADULT .64

54
PUBL IC SAFETY SUMMARYINDICATOR STATE COUNTY
Crime rateViolent crimesNon-violent crimesViolent crimes (juvenile)Non-violent crimes (juvenile)Alcohol-related arrests (juvenile)Drug-related arrests (juvenile)Intimate partner crimesHate crimesChild abuse and neglectElder abuse, neglect and exploitation
CI TY
54

5555
56
SOCIAL CAPITALMuch l ike physical and human capital that use tools and training to enhance an individual ’s product ivi ty, social capital refers to relat ionships and connect ions that bui ld trust , create a sense of community and
empower residents to work together for mutual benef i t . Researchers in numerous discipl ines have found that societal ly engaged communit ies are more l ikely to have successful outcomes in areas of educat ion,
urban poverty, unemployment, cr ime, drug abuse and overal l health. For these reasons and many others, l i fe is easier and more enjoyable when a community has a high level of social capital .
Social capital is a core concept that encompasses numerous aspects of c ivic engagement and social connectedness. In this sect ion we wi l l explore central Oklahoma’s past and present c ivic and societal
engagement to assess our community ’s social capital .
56
57575859
6060
60
62
SOCIAL CONNECTEDNESS Volunteerism Neighborhoods Arts and culture
TRANSPORTATION Accessibi l i ty and rel iabi l i ty
CIVIC ENGAGEMENT
TRUST AND HOPE
57
SOCIAL CONNECTEDNESS
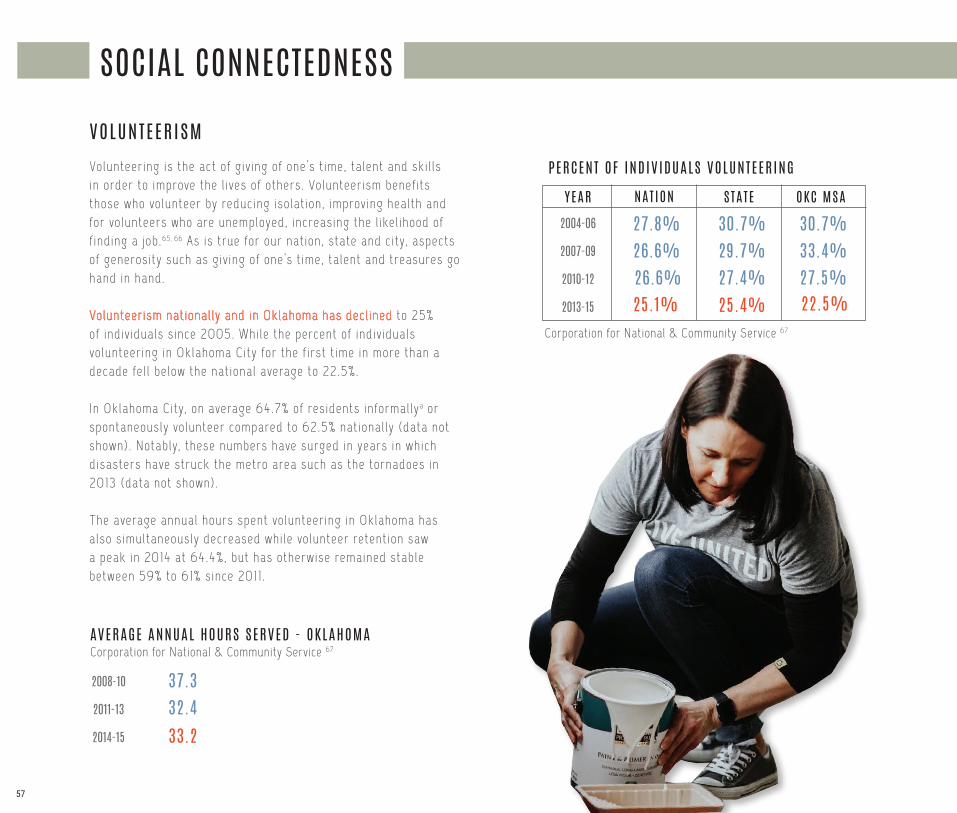
Volunteering is the act of g iving of one’s t ime, talent and ski l ls in order to improve the l ives of others. Volunteerism benef its those who volunteer by reducing isolat ion, improving health and for volunteers who are unemployed, increasing the l ikel ihood of f inding a job.65, 66 As is true for our nat ion, state and city, aspects of generosity such as giving of one’s t ime, talent and treasures go hand in hand.
Volunteerism nat ional ly and in Oklahoma has decl ined to 25% of individuals s ince 2005. Whi le the percent of individuals volunteering in Oklahoma City for the f irst t ime in more than a decade fel l below the nat ional average to 22.5%.
In Oklahoma City, on average 64.7% of residents informal lya or spontaneously volunteer compared to 62.5% nat ional ly (data not shown). Notably, these numbers have surged in years in which disasters have struck the metro area such as the tornadoes in 2013 (data not shown).
The average annual hours spent volunteering in Oklahoma has also s imultaneously decreased whi le volunteer retent ion saw a peak in 2014 at 64.4%, but has otherwise remained stable between 59% to 61% since 2011 .
VOLUNTEERISM
YEAR NAT ION STATE
2004-06
2007-09
2010-12
2013-15
OKC MSA
27.8%26.6%26.6%
30.7%29.7%27.4%
30.7%33.4%27.5%
Corporation for National & Community Service 67
PERCENT OF INDIV IDUALS VOLUNTEERING
25.1% 25.4% 22.5%
2008-10
2011-13
2014-15
37.332.433.2
AVERAGE ANNUAL HOURS SERVED - OKLAHOMACorporation for National & Community Service 67
58
THOSE WHO ARE GENEROUS WITH THE IR T IME ARE MORE THAN TWICE AS L IKELY TO BE GENEROUS
WITH THE IR ‘PURSE STR INGS. ’
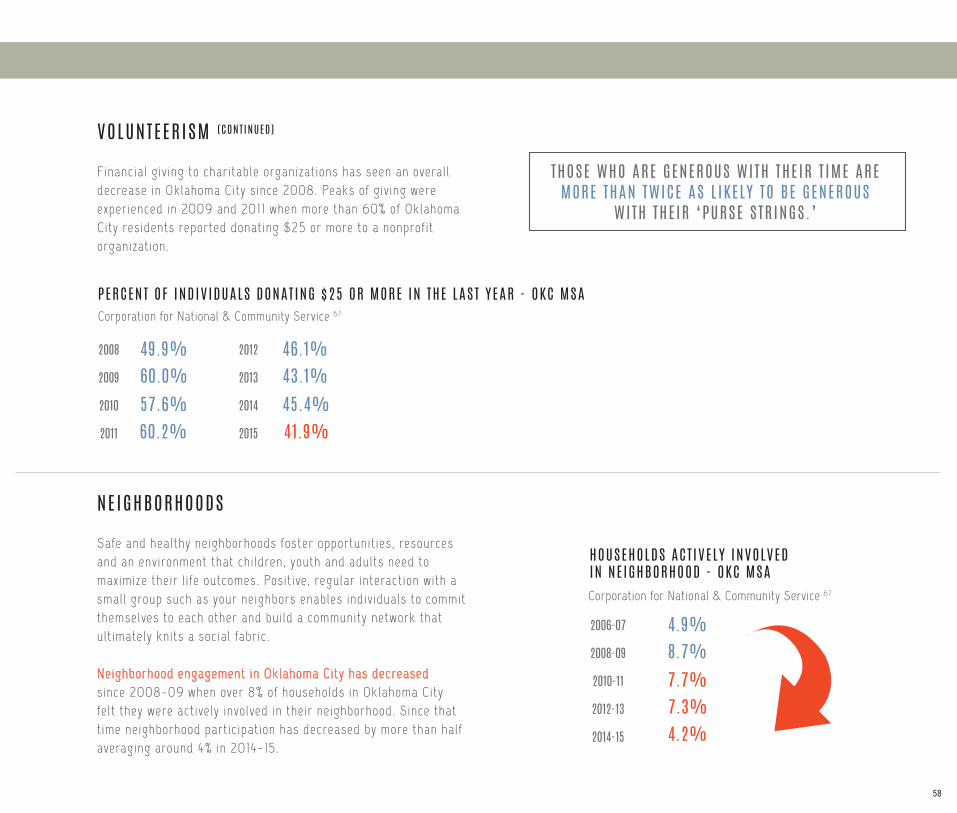
VOLUNTEERISM (CONT INUED)
Financial g iving to charitable organizat ions has seen an overal l decrease in Oklahoma City s ince 2008. Peaks of g iving were experienced in 2009 and 2011 when more than 60% of Oklahoma City residents reported donat ing $25 or more to a nonprof i t organizat ion.
2008
2009
2010
2011
49.9%60.0%57.6%
Corporation for National & Community Service 67
PERCENT OF INDIV IDUALS DONAT ING $25 OR MORE IN THE LAST YEAR - OKC MSA
2012
2013
2014
2015
46.1%43.1%45.4%
60.2% 41.9%
NEIGHBORHOODS
Safe and healthy neighborhoods foster opportunit ies, resources and an environment that chi ldren, youth and adults need to maximize their l i fe outcomes. Posit ive, regular interact ion with a smal l group such as your neighbors enables individuals to commit themselves to each other and bui ld a community network that ult imately knits a social fabric .
Neighborhood engagement in Oklahoma City has decreased since 2008-09 when over 8% of households in Oklahoma City fe lt they were act ively involved in their neighborhood. Since that t ime neighborhood part ic ipat ion has decreased by more than half averaging around 4% in 2014-15.
2006-07
2008-09
2010-11
2012-13
2014-15
4.9%8.7%7.7%
HOUSEHOLDS ACT IVELY INVOLVED IN NE IGHBORHOOD - OKC MSACorporation for National & Community Service 67
7.3%4.2%

59
SOCIAL CONNECTEDNESS
Engagement in art and cultural events has been shown to have numerous individual and community-wide benef i ts . For example, part ic ipat ion in arts and cultural events leads to increased creat ivi ty, development of ski l ls in ident i fy ing new solut ions to personal problems and creat ing a greater connectedness to one’s community. Addit ional ly, art and cultural experiences provide an avenue to exchange ideas and perspect ives across tradit ional boundaries. These opportunit ies broaden our horizons and make each of us more compassionate and empathet ic towards others. Such relat ionships can then br idge social , pol i t ical , socioeconomic and other gaps causing a r ipple effect that bui lds towards being able to work and make progress together.68
ARTS AND CULTURE
ATTENDANCE AT ART AND CULTURAL EVENTS – CENTRAL OKLAHOMA
Live country, jazz or blues performance in OklahomaPlay, musical or some other kind of stage performance in OklahomaLive performance of classical or symphonic music by professional or semi-professionals in OklahomaLive performance of ballet, modern dance, folk, ethnic or jazz dancing by professional or semi-professionals in OklahomaThe Festival of Arts, Red Earth or any other arts festival or cultural events in OklahomaAttended a school age arts performance, concert or play
17.4%21.1%10.7%9.0%
22.6%19.1%
United Way of Central Oklahoma 2
OF INDIV IDUALS IN CENTRAL OKLAHOMA WHO HAVE NOT
PART IC IPATED IN ANY ARTS OR CULTURAL ACT IV I T I ES IN THE LAST
12 MONTHS REPORTED I T WAS BECAUSE THESE ACT IV I T I ES WERE
TOO EXPENSIVE . 2
46%
THE SECOND MOST L IKELY REASON (41%) WHY INDIV IDUALS HAD NOT AT TENDED AN
ARTS OR CULTURAL EXPERIENCE IN THE LAST 12 MONTHS WAS BECAUSE
THEY WERE TOO BUSY. 2
60
TRANSPORTATION
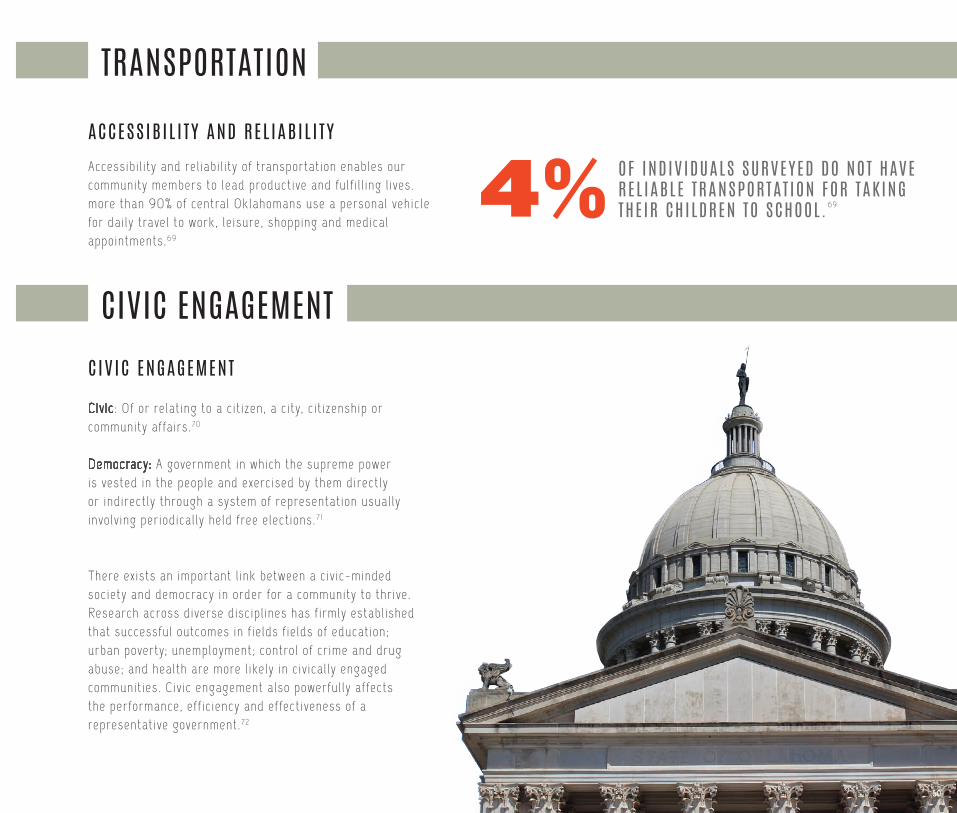
Accessibi l i ty and rel iabi l i ty of transportat ion enables our community members to lead product ive and ful f i l l ing l ives.more than 90% of central Oklahomans use a personal vehic le for dai ly travel to work, le isure, shopping and medical appointments.69
ACCESSIB IL I TY AND REL IABIL I TY
OF INDIV IDUALS SURVEYED DO NOT HAVE REL IABLE TRANSPORTAT ION FOR TAKING THE IR CHILDREN TO SCHOOL . 69
CIVIC ENGAGEMENT
60
Civic : Of or relat ing to a c it izen, a c i ty, c i t izenship or community affa irs .70
Democracy: A government in which the supreme power is vested in the people and exercised by them direct ly or indirect ly through a system of representat ion usual ly involving periodical ly held free elect ions.71
There ex ists an important l ink between a c ivic-minded society and democracy in order for a community to thr ive. Research across diverse discipl ines has f irmly establ ished that successful outcomes in f ie lds f ie lds of educat ion; urban poverty; unemployment; control of cr ime and drug abuse; and health are more l ikely in c ivical ly engaged communit ies. Civic engagement also powerful ly affects the performance, eff ic iency and effect iveness of a representat ive government.72
CIV IC ENGAGEMENT
4%

61
CIVIC ENGAGEMENT
One of the key measures to evaluate c ivic democrat ic engagement is to measure convent ional pol i t ical part ic ipat ion such as percent of e l ig ible voters who are registered to vote and community members attending publ ic meetings.
The percent of e l ig ible voters who are registered to vote in Oklahoma state and county has steadi ly decl ined since 2009 even in president ial e lect ion years, which have histor ical ly demonstrated a renewal in pol i t ical engagement from voters.
Percent of individuals attending publ ic/c ivic meetings peaked in 2008-09 and bottomed out in 2013-14 at 10% and 5%, respect ively.
CIV IC ENGAGEMENT (CONT INUED)
YEAR
2006-07
2008-09
2010-11
2012-13
2014-15
STATE
76.1%77.7%74.3%
72.3%76.6%74.5%
COUNTY
71.3%69.3%
72.9%69.6%
PERCENT OF EL IG IBLE VOTERS WHO ARE REGISTERED TO VOTE
U.S. Census Bureau73 and Oklahoma State Election Board74
2006-07
2008-09
2010-11
2012-13
2014-15
8.3%10.0%8.6%
PERCENT OF HOUSEHOLDS THAT HAVE AT TENDED A PUBL IC/CIV IC MEET ING - OKC MSACorporation for National & Community Service 67
5.0%6.9%

62
TRUST AND HOPE
Trust is a form of social capital that br idges social ly di f ferent groups and connects people of di f ferent backgrounds. Trust al lows us to be more tolerant of others who are di f ferent than ourselves such as immigrants and minorit ies – as wel l as being more favorable to pol ic ies that involve interact ions with populat ions that are of di f ferent backgrounds than our own.75
Seventy-f ive percent of central Oklahomans when surveyed in 2017 reported that they trusted their neighbors whi le almost 60% of individuals reported that they did not trust their e lected publ ic off ic ia ls .
Higher levels of hope in central Oklahomans in 2017 are correlated with individuals who are more successful in their goal attainment.2 Central Oklahomans that do not trust their neighbors also are more l ikely to have lower levels of hope and less l ikely to feel as though they are f lour ishing (data not shown).2
TRUST AND HOPE
75.5%
14.2%
10.3%
YES
NO
PREFER NOT TO ANSWER
DO YOU TRUST YOUR NE IGHBORS? 2
NO
YES
PREFER NOT TO ANSWER
DO YOU TRUST YOUR ELECTED OFF IC IALS? 2
59.8%
22.5%17.6%
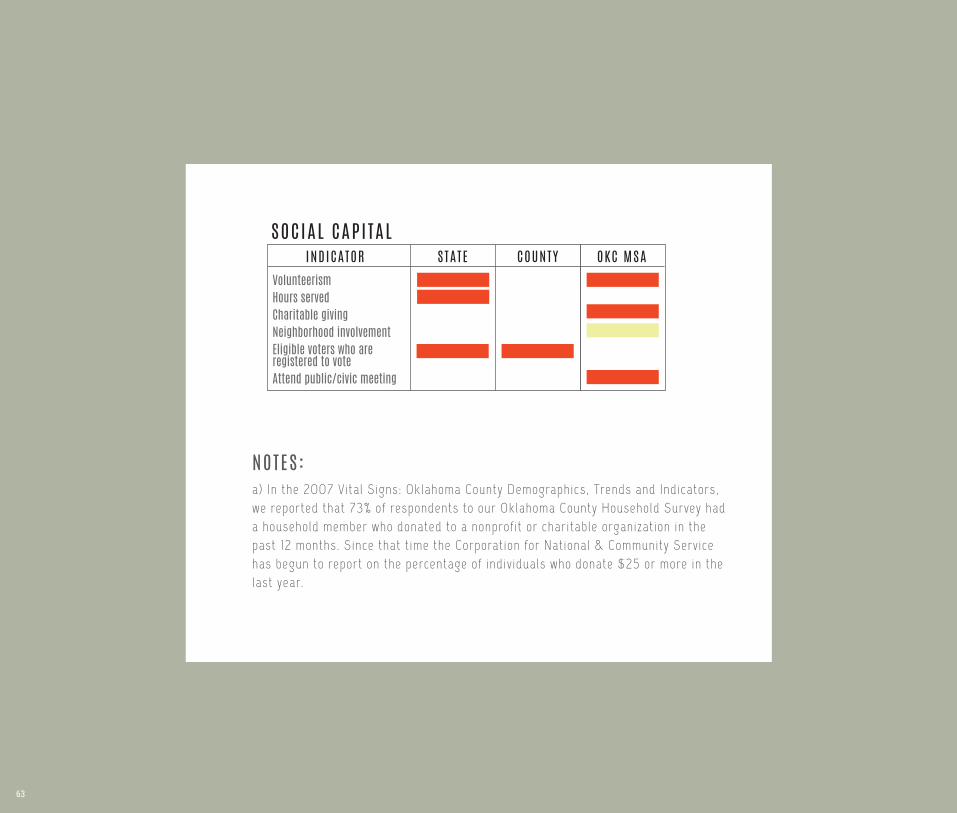
63
SOCIAL CAPI TALINDICATOR STATE COUNTY OKC MSA
VolunteerismHours servedCharitable givingNeighborhood involvementEligible voters who are registered to voteAttend public/civic meeting
NOTES:a) In the 2007 Vital Signs: Oklahoma County Demographics, Trends and Indicators, we reported that 73% of respondents to our Oklahoma County Household Survey had a household member who donated to a nonprof i t or charitable organizat ion in the past 12 months. Since that t ime the Corporat ion for Nat ional & Community Service has begun to report on the percentage of individuals who donate $25 or more in the last year.
63
64
ACKNOWLEDGEMENTSTHANK YOU!
RESEARCH AND COMMUNITY IN I T IAT IVES COMMITTEE
Dr. Don Betz – Chair Jane Abraham Nancy Anthony Shea Bracken Cordel l Brown Dr. Kent Buchanan
Mike Coats Mary Jane Coffman Deborah Copeland Michael Davis Tim Doty Drew Dugan
Brad Ezel l Dr. Mart i Ferrett i Kirk Hal l Kr ist in Hol land Marsha Ingersol l Christ i Jernigan-Marshal l
Aust in Manger J .T. Petherick Meg Salyer Connie Schl i tt ier Dr. Dave Schroeder Steven Shepelwich
Perry Sneed Tracey Strader Bob Toler Lori Wharton
VOLUNTEER REVIEWERSClay Bennett , Chair, Oklahoma County Criminal Just ice Reform Project
Steven Buck, Execut ive Director, Oklahoma Off ice of Juveni le Affairs
Alex Roth, Program Associate, Vera Inst i tute of Just ice
Natal ie Shir ley, President , OSU-OKC and Oklahoma Secretary of Educat ion & Workforce Development
Rev. Dr. Wi l l iam Tabbernee, Execut ive Director, Oklahoma Conferences of Churches
Tony Tyler, Vice President , Tyler Media Group
Chad Wilkerson, Vice President and Oklahoma City Branch Execut ive, Federal Reserve Bank of Kansas City
Roy Wil l iams, President & CEO, Greater Oklahoma City Chamber
UNITED WAY OF CENTRAL OKLAHOMA STAFF Debby HamptonPresident and CEO
Wendi SchuurVice President of Communicat ions
Crystal StuhrVice President of Strategies and Community Impact
Amanda Templeton, PhDDirector of Research and Advocacy
Andrew Underkoff ler, MA Manager of Research and Convening
Kimberly Vautr inCreat ive Design Manager

65
1 . U n i t e d S t a t e s C e n s u s B u r e a u . A m e r i c a n c o m m u n i t y s u r v e y , 1 y e a r e s t i m a t e s . D e m o g ra p h i c s a n d h o u s i n g e s t i m a t e s ( D P 0 5 ) . [ O n l i n e ] 2 0 1 6 . 2 . U n i t e d Wa y o f C e n t ra l O k l a h o m a a n d C e n t e r o f A p p l i e d R e s e a r c h f o r N o n - p r o f i t O r g a n i z a t i o n s . C o m m u n i t y n e e d s a s s e s s m e n t : h o u s e h o l d s u r v e y . [ O n l i n e ] 2 0 1 7 . 3 . U n i t e d S t a t e s D e p a r t m e n t o f H e a l t h a n d H u m a n S e r v i c e s ( U S D H H S ) , N a t i o n a l C e n t e r f o r H e a l t h S t a t i s t i c s ( N C H S ) , C e n t e r s f o r D i s e a s e C o n t r o l a n d P r e v e n t i o n ( C D C ) . C D C W O N D E R O n l i n e D a t a b a s e . [ O n l i n e ] 2 0 0 7 - 2 0 1 6 . h t t p : / / w o n d e r . c d c . g o v/ .4 . O k l a h o m a S t a t e D e p a r t m e n t o f H e a l t h ( O S D H ) , C e n t e r f o r H e a l t h S t a t i s t i c s , H e a l t h C a r e I n f o r m a t i o n . O k l a h o m a S t a t i s t i c s o n H e a l t h Av a i l a b l e f o r E v e r y o n e ( O K 2 S H A R E ) . [ O n l i n e ] 2 0 0 7 - 2 0 1 6 . h t t p : / / w w w . h e a l t h . o k . g o v/ o k 2 s h a r e .5 . U n i t e d S t a t e s D e p a r t m e n t o f H e a l t h a n d H u m a n S e r v i c e s ( U D H H S ) , N a t i o n a l C e n t e r f o r H e a l t h S t a t i s t i c s ( N C H S ) , C e n t e r s f o r D i s e a s e C o n t r o l a n d P r e v e n t i o n . H e a l t h , U n i t e d S t a t e s . [ O n l i n e ] 2 0 1 6 . h t t p s : / / w w w . c d c . g o v/ n c h s / f a s t a t s / l e a d i n g - c a u s e s - o f - d e a t h . h t m .6 . J C u r r i e , E M o r e t t i . M o t h e r ’s e d u c a t i o n a n d t h e i n t e r g e n e ra t i o n a l t ra n s m i s s i o n o f h u m a n c a p i t a l : e v i d e n c e f r o m c o l l e g e o p e n i n g s a n d l o n g i t u d i n a l d a t a . [ O n l i n e ] 2 0 0 3 . 7 . J A u g u s t i n e , K C P r i c k e t , S K e n d i g , a n d R C r o s n o e . M a t e r n a l e d u c a t i o n a n d t h e l i n k b e t w e e n b i r t h t i m i n g a n d c h i l d r e n ’s s c h o o l r e a d i n e s s . S o c S c i Q . [ O n l i n e ] 2 0 1 5 . 8 . U n i t e f S t a t e s D e a p r t m e n t o f H e a l t h a n d H u m a n S e r v i c e s , C e n t e r s f o r D i s e a s e C o n t r o l a n d P r e v e n t i o n . S a f e m o t h e r h o o d : p r o m o t i n g h e a l t h f o r w o m e n b e f o r e , d u r i n g a n d a f t e r p r e g n a n c y . [ O n l i n e ] 2 0 0 6 . 9 . M a r c h o f D i m e s . M a r c h o f D i m e s . [ O n l i n e ] 2 0 0 9 . h t t p : / / w w w . m a r c h o f d i m e s . o r g / .1 0 . H e n r y J . Ka i s e r Fa m i l y Fo u n d a t i o n . N u m b e r o f d e a t h s p e r 1 0 0 , 0 0 0 p o p u l a t i o n . S t a t e h e a l t h f a c t s . [ O n l i n e ] 2 0 1 4 . h t t p : / / w w w . k f f . o r g / o t h e r / s t a t e - i n d i c a t o r / d e a t h - ra t e - p e r- 1 0 0 0 0 0 .1 1 . — . Ra t e o f c h i l d ( 1 0 - 1 4 y e a r s o l d ) d e a t h s . S t a t e h e a l t h f a c t s . [ O n l i n e ] 2 0 1 4 . h t t p : / / w w w . k f f . o r g / o t h e r / s t a t e - i n d i c a t o r / c h i l d - d e a t h - ra t e .1 2 . — . Ra t e o f t e e n d e a t h s ( 1 5 - 1 9 y e a r s ) p e r 1 0 0 , 0 0 0 t e e n a g e r s . S t a t e h e a l t h f a c t s . [ O n l i n e ] 2 0 1 4 . h t t p : / / w w w . k f f . o r g / o t h e r / s t a t e - i n d i c a t o r / t e e n - d e a t h - ra t e .1 3 . U n i t e d S t a t e s D e p a r t m e n t o f H e a l t h a n d H u m a n S e r v i c e s ( U S D H H S ) , O f f i c e o f D i s e a s e P r e v e n t i o n a n d H e a l t h P r o m o t i o n ( O D P H P ) . To b a c c o u s e . [ O n l i n e ] 2 0 1 7 . h t t p s : / / w w w . h e a l t h y p e o p l e . g o v/ 2 0 2 0/ t o p i c s - o b j e c t i v e s / t o p i c / t o b a c c o - u s e .1 4 . S u r g e o n G e n e ra l . K n o o w t h e r i s k s : e - c i g a r e t t e s a n d y o u n g p e o p l e . [ O n l i n e ] 2 0 1 7 . h t t p s : / / e - c i g a r e t t e s . s u r g e o n g e n e ra l . g o v/ .1 5 . G a t e w a y Fo u n d a t i o n . E f f e c t s o f d r u g a b u s e a n d a d d i c t i o n . [ O n l i n e ] 2 0 1 7 . h t t p : / / r e c o v e r g a t e w a y . o r g / s u b s t a n c e - a b u s e - r e s o u r c e s / d r u g - a d d i c t i o n - e f f e c t s / .1 6 . N a t i o n a l I n s t i t u t e o f H e a l t h , N a t i o n a l I n s t i t u t e o n A l c o h o l A b u s e a n d A l c o h o l i s m . A l c o h o l f a c t s a n d s t a t i s t i c s . [ O n l i n e ] 2 0 1 7 . h t t p s : / / w w w . n i a a a . n i h . g o v/ a l c o h o l - h e a l t h / o v e r v i e w - a l c o h o l - c o n s u m p t i o n / a l c o h o l - f a c t s - a n d - s t a t i s t i c s .1 7 . W h i t e , Te r r i . O D M H S A S B u d g e t P r e s e n t a t i o n t o L e g i s l a t u r e J a n u a r y 3 0 , 2 0 1 7 . O k l a h o m a C i t y : s . n . , J a n u a r y 3 0 , 2 0 1 7 .1 8 . M e n t a l H e a l t h A m e r i c a . Pa r i t y o r D i s p a r i t y : t h e s t a t e o f m e n t a l h e a l t h i n A m e r i c a . [ O n l i n e ] 2 0 1 5 . 1 9 . S u b s t a n c e A b u s e a n d M e n t a l H e a l t h S e r v i c e s A d m i n i s t ra t i o n . B e h a v i o r H e a l t h B a r o m e t e r , O k l a h o m a . [ O n l i n e ] 2 0 1 5 . h t t p s : / / w w w . s a m h s a . g o v/ d a t a / s i t e s / d e f a u l t / f i l e s / 2 0 1 5 _ O k l a h o m a _ B H B a r o m e t e r . p d f .2 0 . S u b s t a n c e A b u s e a n d M e n t a l H e a l t h S e r v i c e s A d m i n i s t ra t i o n ( S A M H S A ) . N a t i o n a l S u r v e y o n D r u g U s e a n d H e a l t h ( N S D U H ) , t w o y e a r e s t i m a t e s . [ O n l i n e ] 2 0 0 8 - 2 0 1 4 . h t t p s : / /w w w . s a m h s a . g o v/ d a t a / p o p u l a t i o n - d a t a - n s d u h .2 1 . U n i t e d S t a t e s D e p a r t m e n t o f Ag r i c u l t u r e . E c o n o m i c R e s e a r c h S e r v i c e s . I n t e ra c t i v e C h a r t s a n d H i g h l i g h t s , Tr e n d s i n U . S . f o o d s e c u r i t y , 2 0 0 1 - 1 6 . [ O n l i n e ] 2 0 0 7 - 1 6 . h t t p s : / / w w w . e r s . u s d a . g o v/ t o p i c s / f o o d - n u t r i t i o n - a s s i s t a n c e / f o o d - s e c u r i t y - i n - t h e - u s / i n t e ra c t i v e - c h a r t s - a n d - h i g h l i g h t s / .2 2 . U n i t e d S t a t e s D e p a r t m e o f Ag r i c u l t u r e , E c o n o m i c R e s e a r c h S e r v i c e s . Fo o d s e c u r i t y i n t h e U n i t e d S t a t e s : H o w d o s t a t e s c o m p a r e ? Fo o d I n s e c u r i t y i n t h e U . S . [ O n l i n e ] 2 0 1 7 . h t t p s : / / w w w . e r s . u s d a . g o v/ t o p i c s / f o o d - n u t r i t i o n - a s s i s t a n c e / f o o d - s e c u r i t y - i n - t h e - u s / i n t e ra c t i v e - c h a r t s - a n d - h i g h l i g h t s / .2 3 . Fe e d i n g A m e r i c a . M a p t h e m e a l g a p : h i g h l i g h t s o f f i n d i n g s f o r o v e ra l l a n d c h i l d f o o d i n s e c u r i t y . s . l . : H o w a r d G . B u f f e t t Fo u n d a t i o n , 2 0 1 7 .2 4 . U n i t e d S t a t e s C e n s u s B u r e a u , A m e r i c a n C o m m u n i t y S u r v e y . H e a l t h i n s u ra n c e c o v e ra g e s t a t u s b y s e x b y a g e ( B 2 7 0 0 1 ) . [ O n l i n e ] 2 0 0 7 - 2 0 1 6 . 2 5 . N a t i o n a l C a n c e r I n s t i t u t e . C a n c e r s t a t f a c t s : c o l o n a n d r e c t u m c a n c e r . S u r v e i l l a n c e , e p i d e m i o l o g y a n d e n d r e s u l t s p r o g ra m . [ O n l i n e ] 2 0 1 7 . h t t p s : / / s e e r . c a n c e r . g o v/ s t a t f a c t s / h t m l / c o l o r e c t . h t m l .2 6 . A m e r i c a n C a n c e r S o c i e t y . K e y S t a t i s t i c s f o r C o l o r e c t a l C a n c e r . [ O n l i n e ] A p r i l 2 0 1 7 . h t t p s : / / w w w . c a n c e r . o r g / c a n c e r / c o l o n - r e c t a l - c a n c e r / a b o u t / k e y - s t a t i s t i c s . h t m l .2 7 . — . C a n c o l o r e c t a l p o l y p s a n d c a n c e r b e f o u n d e a r l y ? [ O n l i n e ] M a r c h 2 0 1 7 . h t t p s : / / w w w . c a n c e r . o r g / c a n c e r / c o l o n - r e c t a l - c a n c e r / d e t e c t i o n - d i a g n o s i s - s t a g i n g / d e t e c t i o n . h t m l .2 8 . A m e r i c a n D e n t a l A s s o c i a t i o n . A c t i o n f o r D e n t a l H e a l t h : B r i n g i n g d i s e a s e p r e v e n t i o n i n t o c o m m u n i t i e s . [ O n l i n e ] D e c e m b e r 2 0 1 3 . h t t p s : / / w w w . a d a . o r g / ~ / m e d i a / A DA / P u b l i c % 2 0 P r o g ra m s / F i l e s / b r i n g i n g - d i s e a s e - p r e v e n t i o n - t o - c o m m u n i t i e s _ a d h . a s h x .2 9 . J a c k s o n S L 1 , Va n n W F J r , K o t c h J B , Pa h e l B T, L e e J Y . I m p a c t o f p o o r o ra l h e a l t h o n c h i l d r e n ’s s c h o o l a t t e n d a n c e a n d p e r f o r m a n c e . A m e r i c a n J o u r n a l o f P u b l i c H e a l t h . [ O n l i n e ] 2 0 1 1 . 3 0 . N a t i o n a l K i d s C o u n t . K i d s C o u n t d a t a c e n t e r , 2 0 0 7 - 2 0 1 5 . [ O n l i n e ] 2 0 1 7 . h t t p : / / d a t a c e n t e r . k i d s c o u n t . o r g / .3 1 . M e n t a l H e a l t h A m e r i c a . Pa r i t y o r D i s p a r i t y : t h e S t a t e o f M e n t a l H e a l t h i n A m e r i c a . [ O n l i n e ] 2 0 1 5 . h t t p : / / w w w . m e n t a l h e a l t h a m e r i c a . n e t / i s s u e s / m e n t a l - h e a l t h - a m e r i c a - p r i n t e d - r e p o r t s .3 2 . E R I C C l e a r i n g h o u s e o n E l e m e n t a r y a n d E a r l y C h i l d h o o d E d u c a t i o n . L a s t i n g b e n e f i t s o f p r e s c h o o l p r o g ra m s . E R I C d i g e s t . O f f i c e o f E d u c a t i o n a l R e s e a r c h a n d I m p r o v e m e n t ( E D ) . [ O n l i n e ] 1 9 9 4 . 3 3 . T h e A n n i e E . C a s e y Fo u n d a t i o n . O k l a h o m a : y o u n g c h i l d r e n n o t e n r o l l e d i n e a r l y e d u c a t i o n p r o g ra m s . K I D S C O U N T. [ O n l i n e ] 2 0 1 7 . h t t p : / / d a t a c e n t e r . k i d s c o u n t . o r g / .3 4 . H e r n a n d e z , D o n a l d J . D o u b l e j e o p a r d y : h o w t h i r d - g ra d e r e a d i n g s k i l l s a n d p o v e r t y i n f l u e n c e h i g h s c h o o l g ra d u a t i o n . [ O n l i n e ] 2 0 1 1 . 3 5 . I n s t i t u t e o f E d u c a t i o n S c i e n c e s , N a t i o n a l C e n t e r f o r E d u c a t i o n S t a t i s t i c s . M a t h e m a t i c s a n d r e a d i n g a s s e s s m e n t s : S u m m a r y d a t a t a b l e s f o r a n t i o n a l a n d s t a t e a v e ra g e s c o r e s a n d a c h i e v e m e n t l e v e l r e s u l t s . T h e N a t i o n a ’s R e p o r t C a r d . [ O n l i n e ] 2 0 0 7 - 2 0 1 5 . h t t p s : / / w w w . n a t i o n s r e p o r t c a r d . g o v/ .3 6 . G r e a t M i d d l e S c h o o l s . T h e i m p o r t a n c e o f m i d d l e s c h o o l . M i d d l e s c h o o l m a t t e r s . [ O n l i n e ] 2 0 1 7 . h t t p s : / / g r e a t m i d d l e s c h o o l s . o r g / .3 7 . R e a d i n g Pa r t n e r s . D o p r i s o n s u s e t h i r d g ra d e r e a d i n g s c o r e s t o p r e d i c t t h e n u m b e r o f p r i s o n b e d s t h e y ’ l l n e e d ? R e a d i n g Pa r t n e r s . [ O n l i n e ] 2 0 1 3 . h t t p : / / r e a d i n g p a r t n e r s . o r g / .3 8 . O f f i c e o f E d u c a t i o n a l Q u a l i t y & A c c o u n t a b i l i t y . O k l a h o m a S c h o o l P r o f i l e s - O k l a h o m a C o u n t y . [ O n l i n e ] 2 0 0 5 - 2 0 1 6 . h t t p : / / w w w . e d p r o f i l e s . i n f o / r e p o r t - c a r d / c o u n t y / 5 5 / y e a r / 2 0 1 6 .
REFERENCES
66
3 9 . C o l l e g e B o a r d . L i f e t i m e e a r n i n g s b y e d u c a t i o n a l l e v e l . Tr e n d s i n H i g h e r E d u c a t i o n . [ O n l i n e ] 2 0 0 9 . h t t p s : / / t r e n d s . c o l l e g e b o a r d . o r g / e d u c a t i o n - p a y s / f i g u r e s - t a b l e s / l i f e t i m e - e a r n i n g s - e d u c a t i o n - l e v e l .4 0 . U n i t e d S t a t e s C e n s u s B u r e a u , A m e r i c a n C o m m u n i t y S u r v e y . S e l e c t e d s o c i a l c h a ra c t e r i s t i c s i n t h e U n i t e d S t a t e s ( D P 0 2 ) . [ O n l i n e ] 2 0 0 7 - 2 0 1 6 . 4 1 . U n i t e d S t a t e s C e n s u s B u r e a u . A m e r i c a n c o m m u n i t y s u r v e y , 1 y e a r e s t i m a t e s . D e m o g ra p h i c a n d h o u s i n g e s t i m a t e s ( D P 0 5 ) . [ O n l i n e ] 2 0 0 6 - 2 0 1 6 . h t t p s : / / f a c t f i n d e r . c e n s u s . g o v/ .4 2 . — . A m e r i c a n c o m m u n i t y s u r v e y , 1 y e a r e s t i m a t e s . Po p u l a t i o n 1 6 y e a r s a n d o v e r - u n e m p l o y m e n t ra t e ( S 2 3 0 1 ) . [ O n l i n e ] 2 0 0 7 - 2 0 1 6 . 4 3 . — . A m e r i c a n c o m m u n i t y s u r v e y , 1 y e a r e s t i m a t e s . I n d u s t r y b y S e x a n d M e d i a n E a r n i n g s i n t h e Pa s t 1 2 M o n t h s f o r t h e C i v i l i a n E m p l o y e d Po p u l a t i o n 1 6 Ye a r s a n d Ov e r ( S 2 4 0 3 ) . [ O n -l i n e ] 2 0 0 5 - 2 0 1 5 . h t t p s : / / f a c t f i n d e r . c e n s u s . g o v/ f a c e s / t a b l e s e r v i c e s / j s f / p a g e s / p r o d u c t v i e w . x h t m l ? p i d = AC S _ 1 4 _ 1 Y R _ S 2 4 0 3 & p r o d T y p e = t a b l e .4 4 . U n i t e d Wa y o f C e n t ra l O k l a h o m a a n d C e n t e r o f A p p l i e d R e s e a r c h f o r N o n - p r o f i t O r g a n i z a t i o n s . C o m m u n i t y N e e d s A s s e s s m e n t - H o u s e h o l d S u r v e y . [ O n l i n e ] 2 0 1 7 . 4 5 . U . S . C e n s u s B u r e a u . Po v e r t y S t a t u s i n t h e Pa s t 1 2 M o n t h s ( S 1 7 0 1 ) . A m e r i c a n c o m m u n i t y s u r v e y , 5 y e a r e s t i m a t e s . [ O n l i n e ] 2 0 0 6 - 2 0 1 6 . h t t p s : / / f a c t f i n d e r . c e n s u s . g o v/ f a c e s / t a b l e s e r v i c e s / j s f / p a g e s / p r o d u c t v i e w . x h t m l ? p i d = AC S _ 1 5 _ 1 Y R _ S 1 7 0 1 & p r o d T y p e = t a b l e .4 6 . O k l a h o m a O f f i c e o f E d u c a t i o n a l Q u a l i t y a n d A c c o u n t a b i l i t y . O k l a h o m a E d u c a t i o n a l I n d i c a t o r s P r o g ra m - P r o f i l e s 2 0 1 5 S t a t e R e p o r t . O k l a h o m a C i t y : s . n . , 2 0 1 6 .4 7 . N a t i o n a l C e n t e r f o r E d u c a t i o n S t a t i s t i c s . 2 0 1 5 M a t h e m a t i c s a n d R e a d i n g A s s e s s m e n t s : S u m m a r u d a t a t a b l e s f o r n a t i o n a l a n d s t a t e a v e ra g e s c o r e s a n d a c h i e v e m e n t l e v e l r e s u l t s . T h e N a t i o n ’s R e p o r t C a r d . [ O n l i n e ] 2 0 1 5 . h t t p s : / / w w w . n a t i o n s r e p o r t c a r d . g o v/ r e a d i n g _ m a t h _ 2 0 1 5 / # m a t h e m a t i c s / s c o r e s ? g ra d e = 4 .4 8 . I n t e g ra R e a l t y R e s o u r c e s . S u m m a r y f i n d i n g s . O k l a h o m a h o u s i n g n e e d s a s s e s s m e n t . [ O n l i n e ] 2 0 1 5 . h t t p : / / o k l a h o m a h o u s i n g n e e d s . o r g / .4 9 . U n i t e d S t a t e s C e n s u s B u r e a u . A m e r i c a n c o m m u n i t y s u r v e y , 1 y e a r e s t i m a t e s . S e l e c t e d h o u s i n g c h a ra c t e r i s t i c s . [ O n l i n e ] 2 0 0 7 - 2 0 1 6 . h t t p s : / / f a c t f i n d e r . c e n s u s . g o v/ .5 0 . — . A m e r i c a n c o m m u n i t y s u r v e y , 1 y e a r e s t i m a t e s . M e d i a n g r o s s r e n t ( D o l l a r s ) - R e n t e r- o c c u p i e d h o u s i n g u n i t s p a y i n g c a s h r e n t ( B 2 5 0 6 4 ) . [ O n l i n e ] 2 0 0 7 - 2 0 1 6 . 5 1 . O k l a h o m a C i t y P l a n n i n g D e p a r t m e n t - H o u s i n g & C o m m u n i t y D e v e l o p m e n t D i v i s i o n . 2 0 1 7 Po i n t - I n - T i m e : A S n a p s h o t o f H o m e l e s s n e s s i n O k l a h o m a C i t y . 2 0 1 7 .5 2 . O k l a h o m a B u r e a u o f I n v e s t i g a t i o n . I n f o r m a t i o n S e r v i c e s D i v i s i o n , D a t a C o l l e c t i o n a n d R e p o r t i n g S e c t i o n . C r i m e i n O k l a h o m a . [ O n l i n e ] 2 0 0 1 - 2 0 1 5 . 5 3 . T h e i n f l u e n c e o f s u b s t a n c e u s e o n a d o l e s c e n t b ra i n d e v e l o p m e n t . L M S q u e g l i a , J J a c o b u s , a n d S F Ta p e r t . 1 , s . l . : C l i n E E G N e u r o s c i , 2 0 0 9 , V o l . 4 0 , p p . 3 1 - 3 8 .5 4 . D r u g s a n d C r i m e . D a c k i s , B R N o r d s t r o m a n d C A . 4 , s . l . : J o u r n Ps y & L a w , 2 0 1 1 , V o l . 3 9 .5 5 . T h e A d v o c a t e s f o r H u m a n R i g h t s . C o m m u n i t y C o s t s o f D o m e s t i c V i o l e n c e . S t o p V i o l e n c e Ag a i n s t W o m e n . [ O n l i n e ] 2 0 1 1 . [ C i t e d : J u n e 2 , 2 0 1 7 . ] h t t p : / / w w w . s t o p v a w . o r g / c o m m u n i t y _ c o s t s _ o f _ d o m e s t i c _ v i o l e n c e .5 6 . Fe d e ra l B u r e a u o f I n v e s t i g a t i o n . W h a t W e I n v e s t i g a t e : H a t e C r i m e s . [ O n l i n e ] 2 0 1 7 . h t t p s : / / w w w . f b i . g o v/ i n v e s t i g a t e / c i v i l - r i g h t s / h a t e - c r i m e s .5 7 . C h i l d r e n ’s B u r e a u . Lo n g - t e r m c o n s e q u e n c e s o f c h i l d a b u s e a n d n e g l e c t . C h i l d W e l f a r e I n f o r m a t i o n G a t e w a y . [ O n l i n e ] J u l y 2 0 1 3 . [ C i t e d : J u n e 5 , 2 0 1 7 . ] h t t p s : / / w w w . c h i l d w e l f a r e . g o v .5 8 . J G o l d , M W o l a n S u l l i v a n , a n d M L e w i s . T h e r e l a t i o n b e t w e e n a b u s e a n d v i o l e n t d e l i n q u e n c y : T h e c o n v e r s i o n o f s h a m e t o b l a m e i n j u v e n i l e o f f e n d e r s . C h i l d A b u s e N e g l . [ O n l i n e ] 2 0 1 1 . 5 9 . A n d a , V J Fe l i t t i a n d R . T h e r e l a t i o n s h i p o f a d v e r s e c h i l d h o o d e x p e r i e n c e s t o a d u l t m e d i c a l d i s e a s e , p s y c h i a t r i c d i s o r d e r s , a n d s e x u a l b e h a v i o r : I m p l i c a t i o n s f o r h e a l t h c a r e . T h e h i d d e n e p i d e m i c : T h e i m p a c t o f e a r l y l i f e t ra u m a o n h e a l t h a n d d i s e a s e . [ O n l i n e ] 2 0 0 9 . [ C i t e d : J u n e 5 , 2 0 1 7 . ] h t t p : / / w w w . a c e s t u d y . o r g / y a h o o _ s i t e _ a d m i n / a s s e t s / .6 0 . O k l a h o m a D e p a r t m e n t o f H u m a n S e r v i c e s . Ta b l e 1 4 C h i l d P r o t e c t i v e S e r v i c e s , S u b s t a n t i a t e d R e p o r t s b y T y p e a n d c o u n t y . F i s c a l Ye a r 2 0 1 6 A n n u a l R e p o r t a n d Ta b l e s . [ O n l i n e ] FY 2 0 1 6 . h t t p : / / w w w . o k d h s . o r g / l i b ra r y / r p t s / Pa g e s / s 1 6 _ o k d h s a n n u a l r e p o r t _ t a b l e s . a s p x .6 1 . — . F i s c a l Ye a r 2 0 0 1 - 2 0 1 5 A n n u a l R e p o r t s . D H S R e p o r t s . [ O n l i n e ] 2 0 1 7 . h t t p : / / w w w . o k d h s . o r g / s i t e s / s e a r c h c e n t e r / Pa g e s / o k d h s r e p o r t r e s u l t s . a s p x .6 2 . U n i t e d S t a t e s C e n s u s B u r e a u / A m e r i c a n Fa c t F i n d e r . U n i t e d S t a t e s C e n s u s B u r e a u / A m e r i c a n Fa c t F i n d e r . [ O n l i n e ] U . S . C e n s u s B u r e a u ’s A m e r i c a n , 2 0 1 5 . h t t p : / / f a c t f i n d e r 2 . c e n s u s . g o v . G CT 0 1 0 3 . ST 0 5 .6 3 . C e n t e r s f o r D i s e a s e C o n t r o l a n d P r e v e n t i o n . E l d e r a b u s e : d e f i n i t i o n s . V i o l e n c e p r e v e n t i o n . [ O n l i n e ] J u n e 2 0 1 6 . h t t p s : / / w w w . c d c . g o v/ v i o l e n c e p r e v e n t i o n / e l d e ra b u s e / d e f i n i t i o n s . h t m l .6 4 . K i l l a c k e y , J . E l d e r a b u s e i s o n t h e r i s e i n O k l a h o m a , o f f i c a l s s a y . N e w s O K . [ O n l i n e ] 2 0 1 5 . 6 5 . G r i m m , R o b e r t , K i m b e r l y S p r i n g , a n d N a t h a n D i e t z . T h e H e a l t h B e n e f i t s o f V o l u n t e e r i n g : A R e v i e w o f R e c e n t R e s e a r c h . C o r p o ra t i o n f o r N a t i o n a l & C o m m u n i t y S e r v i c e , A p r i l 2 0 0 7 . [ O n l i n e ] h t t p : / / w w w . n a t i o n a l s e r v i c e . g o v/ p d f / 0 7 _ 0 5 0 6 _ h b r . p d f .6 6 . S p e ra , C h i s t o p h e r , R o b i n G h e r t n e r , A n t h o n y N e r i n o , a n d A d r i e n n e D i To m m a s o . V o l u n t e e r i n g a s a Pa t h w a y t o E m p l o y m e n t : D o e s V o l u n t e e r i n g I n c r e a s e O d d s o f F i n d i n g a J o b f o r t h e O u t o f W o r k ? C o r p o ra t i o n f o r N a t i o n a l & C o m m u n i t y S e r v i c e . [ O n l i n e ] J u n e 2 0 1 3 . h t t p : / / w w w . n a t i o n a l s e r v i c e . g o v/ s i t e s / d e f a u l t / f i l e s / u p l o a d / e m p l o y m e n t _ r e s e a r c h _ r e p o r t . p d f .6 7 . C o r p o ra t i o n f o r N a t i o n a l & C o m m u n i t y S e r v i c e . V o l u n t e e r i n g a n d C i v i c L i f e i n A m e r i c a . [ O n l i n e ] 2 0 0 4 - 2 1 5 . h t t p s : / / w w w . n a t i o n a l s e r v i c e . g o v/ v c l a .6 8 . F i n e A r t s Fu n d . T h e A r t s R i p p l e E f f e c t : A R e s e a r c h - B a s e d S t ra t e g y t o B u i l d S h a r e d R e s p o n s i b i l i t y f o r t h e A r t s . [ O n l i n e ] To p o s Pa r t n e r s h i p s f o r Fu n e A r t s Fu n d , J a n u a r y 2 0 1 0 . f i n -e a r t s f u n d . o r g .6 9 . U n i t e d Wa y o f C e n t ra l O k l a h o m a . 2 0 1 7 U n i t e d Wa y o f C e n t ra l O k l a h o m a C o m m u n i t y N e e d s A s s e s s m e n t : H o u s e h o l d S u r v e y . 2 0 1 7 .7 0 . M e r r i a m - W e b s t e r . c o m . C i v i c . [ O n l i n e ] h t t p s : / / w w w . m e r r i a m - w e b s t e r . c o m / d i c t i o n a r y / c i v i c .7 1 . M e r r i a m - w e b s t e r . c o m . D e m o c ra c y . [ O n l i n e ] f r o m h t t p s : / / w w w . m e r r i a m - w e b s t e r . c o m / d i c t i o n a r y / d e m o c ra c y .7 2 . P u t n a m , R D . B o w l i n g a l o n e : A m e r i c a ’s d e c l i n i n g s o c i a l c a p i t a l . J o u r n a l o f D e m o c ra c y . [ O n l i n e ] 1 9 9 5 . 7 3 . U . S . C e n s u s B u r e a u , A m e r i c a n C o m m u n i t y S u r v e y . S 0 1 0 1 : Ag e a n d S e x ( 2 0 0 6 - 2 0 1 5 ) . 2 0 0 6 A m e r i c a n C o m m u n i t y S u r v e y ( AC S ) , 2 0 0 7 - 2 0 0 9 AC S 3 - y e a r e s t i m a t e s , 2 0 1 0 - 2 0 1 5 AC S , 5 y e a r e s t i m a t e s . [ O n l i n e ] 7 4 . O k l a h o m a S t a t e E l e c t i o n B o a r d . V o t e r r e g i s t ra t i o n r e p o r t s , 2 0 0 6 - 2 0 1 5 . [ O n l i n e ] h t t p s : / / w w w . o k . g o v/ e l e c t i o n s / V o t e r _ I n f o / V o t e r _ R e g i s t ra t i o n _ S t a t i s t i c s / .7 5 . U s l a n e r E r i c M . a n d B r o w n M i t c h e l l . I n e q u a l i t y , Tr u s t , a n d C i v i c E n g a g e m e n t . A m e r i c a n Po l i t i c s R e s e a r c h . 2 0 0 5 , V o l . 3 3 , p p . 8 6 8 – 8 9 4 .7 6 . U . S . C e n s u s B u r e a u , Po p u l a t i o n D i v i s i o n . A n n u a l E s t i m a t e s o f t h e R e s i d e n t Po p u l a t i o n : A p r i l 1 , 2 0 1 0 t o J u l y 1 , 2 0 1 6 . [ O n l i n e ] D e c e m b e r 2 0 1 6 . 7 7 . O k l a h o m a S t a t e D e p a r t m e n t o f H e a l t h ( O S D H ) , C e n t e r f o r H e a l t h S t a t i s t i c s , H e a l t h C a r e I n f o r m a t i o n . B e h a v i o ra l R i s k Fa c t o r S u r v e i l l a n c e Sy s t e m 2 0 0 5 - 2 0 1 5 . O k l a h o m a S t a t i s t i c s o n H e a l t h Av a i l a b l e f o r E v e r y o n e ( O K 2 S H A R E ) . [ O n l i n e ] 2 0 1 7 . h t t p : / / w w w . h e a l t h . o k . g o v/ o k 2 s h a r e .7 8 . P r e v e n t i o n , C e n t e r s f o r D i s e a s e C o n t r o l a n d . I n f a n t M o r t a l i t y . [ O n l i n e ] 2 0 1 6 . [ C i t e d : M a y 5 , 2 0 1 7 . ] h t t p s : / / w w w . c d c . g o v/ r e p r o d u c t i v e h e a l t h / m a t e r n a l i n f a n t h e a l t h / i n f a n t m o r t a l i t y . h t m .7 9 . P r o b l e m s , A s s o c i a t i o n o f M a t e r n a l & C h i l d H e a l t h . A s s o c i a t i o n o f M a t e r n a l & C h i l d H e a l t h P r o b l e m s . [ O n l i n e ] 2 0 1 7 . [ C i t e d : M a y 5 , 2 0 1 7 . ] h t t p : / / w w w . a m c h p . o r g / p a g e s / d e f a u l t . a s p x .
P r i m a r y d a t a w a s c o l l e c t e d b y a w e b - b a s e d h o u s e h o l d s u r v e y o f o v e r 8 0 0 i n d i v i d u a l s l i v i n g i n c e n t ra l O k l a h o m a . T h e r e s e a r c h w a s c o n d u c t e d b y U n i t e d Wa y o f C e n t ra l O k l a h o m a i n c o l l a b o ra t i o n w i t h t h e U n i v e r s i t y o f O k l a h o m a - Tu l s a C e n t e r o f A p p l i e d R e s e a r c h f o r N o n p r o f i t O r g a n i z a t i o n s .
S e c o n d a r y d a t a w a s o b t a i n e d f r o m t h e m o s t r e c e n t r e c o r d s a n d d o c u m e n t s a v a i l a b l e f r o m p u b l i c a n d p r i v a t e a g e n c i e s . T h e i n f o r m a t i o n c o n t a i n e d h e r e i n h a s b e e n o b t a i n e d f r o m r e a s o n a b l y r e l i a b l e s o u r c e s . U n i t e d Wa y o f C e n t ra l O k l a h o m a m a k e s n o g u a ra n t e e , e i t h e r e x p r e s s o r i m p l i e d , a s t o t h e a c c u ra c y o f s u c h i n f o r m a t i o n . A l l d a t a c o n t a i n e d h e r e i n i s s u b j e c t t o e r r o r s , o m i s s i o n s a n d c h a n g e s . R e p r o d u c t i o n , d i s s e m i n a t i o n o r u s e o f
i n f o r m a t i o n f r o m t h i s r e p o r t i s g ra n t e d p r o v i d e d t h a t a t t r i b u t i o n i s g i v e n t o U n i t e d Wa y o f C e n t ra l O k l a h o m a .R e c o m m e n d e d c i t a t i o n :
U n i t e d Wa y o f C e n t ra l O k l a h o m a . ( 2 0 1 7 ) . V i t a l S i g n s : a D e c a d e R e v i e w . O k l a h o m a C i t y , O K . Av a i l a b l e a t h t t p : / / w w w . u n i t e d w a y o k c . o r g / r e s e a r c h / l i b ra r y .

Vital Signs is a publication of United Way of Central Oklahoma. We w e lcome you r ques t ions a nd comment s . P lea s e ema i l u s atin fo@u n i te dwayokc .o rg or ca l l 4 0 5 . 2 3 6 .8 4 41 .
UNITED WAY OF CENTRAL OKLAHOMA1444 NW 28th Street • Oklahoma City, Oklahoma 73106unitedwayokc.org • 405.236.8441


![Learning Analytics · [my university]. So, I need to put the priorities of the institution ahead of the priorities of ALA.” • “I think that probably in the last decade or 15](https://static.documents.pub/doc/80x56/5f67eba67d4f3813a37d5179/learning-analytics-my-university-so-i-need-to-put-the-priorities-of-the-institution.jpg)

