Camp. Biochem. Physiol. Vol. 103A, No. 1,pp. 2 13-219. I992 0300-9629/92 $5.00 + 0.00 Printed in Great Britain 0 1992 Pergamon Press Ltd VITAMIN D STUDIES WITH CHANNEL CATFISH (ICTALURUS PUNCTATUS) REARED IN CALCIUM-FREE WATER PAUL B. BROWN* and EDWIN H. ROBINSON? Texas A and M University, Department of Wildlife and Fisheries Sciences, Room 210, Nagle Hall, College Station, TX 77843, U.S.A. (Received 2 January 1992) Abstract-l. Various levels and forms of vitamin D were fed to channel catfish (Icfalurus punctatus) in rearing water containing 0.0 mg/l calcium; an experimental system in which fish must rely on a dietary source of calcium. 2. Based on weight gain data, the dietary requirement for vitamin D from these studies appeared to be 250-500 I.U./kg as either cholecalciferol or ergocalciferol. 3. Plasma K. 2%OHD, and 24,25-(OH),D levels indicated a dietary requirement of 2OOOLU./kg as cholecalciferol. 4. The discrimination in use of relatively high levels of ergocalciferol appeared to be related to further hydroxylation of the 25hydroxymetabolite. 5. Effects on calcium and phosphorus levels were not affected by levels or form of the vitamin and emphasize the differences between aquatic and terrestrial vertebrates. INTRODUCTION Vitamin D is an essential nutrient in all animals studied thus far and several functions of the biochem- ically active form have been established in mam- malian and avian species. However, the functions of vitamin D in aquatic animals have not been established, though the antirachitic activity of vita- min D was first identified as a component in fish oil (Mellanby, 1919) and the vitamin D concentration of fish tissues can reach relatively high levels. Several studies with channel catfish (Zctaluruspunc- tatus) reared in a controlled environment established the dietary essentiality of vitamin D and, based on weight gain data, the requirement is currently listed as a range of 50&2000 I.U./kg diet as cholecalciferol (Jewel1 et al., 1933; Launer et a/., 1978; Love11and Li, 1978; Andrews et al., 1980). Love11 and Li (1978) reported decreases in whole body ash, calcium and phosphorus concentrations in catfish fed vitamin D-deficient diets for 16 weeks, but many of the typical biochemical parameters used to assess vitamin D status in other animals have been unresponsive to graded levels of the vitamin in long-term feeding studies with channel catfish. One finding that has been similar to other animals (Hunt et al., 1967; Horst et al., 1982) has been the inability of catfish to use ergocalciferol (Andrews et al., 1980). However, the relatively poor utilization has been observed only at dietary levels of 2000 I.U./kg and higher. - *To whom all correspondence should be addressed at: Purdue University, Department of Forestry and Natural Resources, Forestry Building, West Lafayette, IN 47907, U.S.A. Tel.: 317-494-4968; Fax: 3 17-494-0409. tPresent address: Mississippi State University, Delta Branch Experiment Station, Stoneville, MS 38776, U.S.A. George et al. (1981) reported that vitamin D deficiency impaired the normal development of white muscle fibers in rainbow trout (Oncorhynchus mykiss), but not red muscle fibers. The authors attributed the observed difference to disruption of subcellular Ca pools and further suggested that red fibers were protected by the large concentrations of mitochondria which may act as Ca regulators. How- ever, there was no detectable change in serum Ca concentration. Data from further studies with trout indicated that hypervitaminosis D, did not affect Ca homeostasis (Hilton and Ferguson, 1982), cholecal- ciferol was approximately 3 times more effective than ergocalciferol in promoting weight gain, and the minimum dietary requirement was greater than 800 I.U./kg diet as cholecalciferol (Barnett et al., 1982). There have been several attempts to identify and quantify vitamin D metabolites in fish. Early attempts were unable to identify 25hydroxy- cholecalciferol (25OHD,) or 24,25dihydroxychole- calciferol (24,24-(OH),D,) in rainbow trout plasma (Barnett et al., 1982; Hollis et al., 1977). Trout injected with [‘4C]cholecalciferoI and [‘4C]25-OHDJ metabolized those forms of the vitamin to more polar, but unidentified, compounds, and the carbon label was detected in liver, gill, gall bladder, kidney, blood and intestinal mucosa (Yanda and Ghazarian, 1981). Later studies identified both 25-hydroxyvita- min D-I-hydroxylase, and vitamin D metabolites in various species of fish (Henry and Norman, 1975; Avioli et al., 1981; Marocci et al., 1982; Hayes et al., 1986), as well as short-term dose responsive changes in serum Ca and P concentrations in fish on admin- istration of various vitamin D metabolites (Swarup and Srivastav, 1982; Swarup et al., 1984; Srivastav, 1984; Fenwick et al., 1984). 213
Transcript
Camp. Biochem. Physiol. Vol. 103A, No. 1, pp. 2 13-219. I992 0300-9629/92 $5.00 + 0.00 Printed in Great Britain 0 1992 Pergamon Press Ltd
VITAMIN D STUDIES WITH CHANNEL CATFISH (ICTALURUS PUNCTATUS) REARED IN CALCIUM-FREE
WATER
PAUL B. BROWN* and EDWIN H. ROBINSON?
Texas A and M University, Department of Wildlife and Fisheries Sciences, Room 210, Nagle Hall, College Station, TX 77843, U.S.A.
(Received 2 January 1992)
Abstract-l. Various levels and forms of vitamin D were fed to channel catfish (Icfalurus punctatus) in rearing water containing 0.0 mg/l calcium; an experimental system in which fish must rely on a dietary source of calcium.
2. Based on weight gain data, the dietary requirement for vitamin D from these studies appeared to be 250-500 I.U./kg as either cholecalciferol or ergocalciferol.
3. Plasma K. 2%OHD, and 24,25-(OH),D levels indicated a dietary requirement of 2OOOLU./kg as cholecalciferol.
4. The discrimination in use of relatively high levels of ergocalciferol appeared to be related to further hydroxylation of the 25hydroxymetabolite.
5. Effects on calcium and phosphorus levels were not affected by levels or form of the vitamin and emphasize the differences between aquatic and terrestrial vertebrates.
INTRODUCTION
Vitamin D is an essential nutrient in all animals studied thus far and several functions of the biochem- ically active form have been established in mam- malian and avian species. However, the functions of vitamin D in aquatic animals have not been established, though the antirachitic activity of vita- min D was first identified as a component in fish oil (Mellanby, 1919) and the vitamin D concentration of fish tissues can reach relatively high levels.
Several studies with channel catfish (Zctaluruspunc- tatus) reared in a controlled environment established the dietary essentiality of vitamin D and, based on weight gain data, the requirement is currently listed as a range of 50&2000 I.U./kg diet as cholecalciferol (Jewel1 et al., 1933; Launer et a/., 1978; Love11 and Li, 1978; Andrews et al., 1980). Love11 and Li (1978) reported decreases in whole body ash, calcium and phosphorus concentrations in catfish fed vitamin D-deficient diets for 16 weeks, but many of the typical biochemical parameters used to assess vitamin D status in other animals have been unresponsive to graded levels of the vitamin in long-term feeding studies with channel catfish. One finding that has been similar to other animals (Hunt et al., 1967; Horst et al., 1982) has been the inability of catfish to use ergocalciferol (Andrews et al., 1980). However, the relatively poor utilization has been observed only at dietary levels of 2000 I.U./kg and higher.
- *To whom all correspondence should be addressed at:
Purdue University, Department of Forestry and Natural Resources, Forestry Building, West Lafayette, IN 47907, U.S.A. Tel.: 317-494-4968; Fax: 3 17-494-0409.
tPresent address: Mississippi State University, Delta Branch Experiment Station, Stoneville, MS 38776, U.S.A.
George et al. (1981) reported that vitamin D deficiency impaired the normal development of white muscle fibers in rainbow trout (Oncorhynchus mykiss), but not red muscle fibers. The authors attributed the observed difference to disruption of subcellular Ca pools and further suggested that red fibers were protected by the large concentrations of mitochondria which may act as Ca regulators. How- ever, there was no detectable change in serum Ca concentration. Data from further studies with trout indicated that hypervitaminosis D, did not affect Ca homeostasis (Hilton and Ferguson, 1982), cholecal- ciferol was approximately 3 times more effective than ergocalciferol in promoting weight gain, and the minimum dietary requirement was greater than 800 I.U./kg diet as cholecalciferol (Barnett et al., 1982).
There have been several attempts to identify and quantify vitamin D metabolites in fish. Early attempts were unable to identify 25hydroxy- cholecalciferol (25OHD,) or 24,25dihydroxychole- calciferol (24,24-(OH),D,) in rainbow trout plasma (Barnett et al., 1982; Hollis et al., 1977). Trout injected with [‘4C]cholecalciferoI and [‘4C]25-OHDJ metabolized those forms of the vitamin to more polar, but unidentified, compounds, and the carbon label was detected in liver, gill, gall bladder, kidney, blood and intestinal mucosa (Yanda and Ghazarian, 1981). Later studies identified both 25-hydroxyvita- min D-I-hydroxylase, and vitamin D metabolites in various species of fish (Henry and Norman, 1975; Avioli et al., 1981; Marocci et al., 1982; Hayes et al., 1986), as well as short-term dose responsive changes in serum Ca and P concentrations in fish on admin- istration of various vitamin D metabolites (Swarup and Srivastav, 1982; Swarup et al., 1984; Srivastav, 1984; Fenwick et al., 1984).
213
214 PAUL B. BROWN and EDWIN H. ROBINSON
There have been conflicting results regarding fishes ability to synthesize vitamin D in skin via photo- chemical means. Data from early studies indicated goldfish (Carassius auratus) and catfish held in darkness were able to synthesize vitamin D by non- photochemical methods (Bills, 1927; Blondin, i967), but later studies indicated these same species were not able to synthesize vitamin D or other metabolites from 4[‘~C]7-dehydrocholesterol or ~‘4C]cholecalciferol (Oizumi and Monder, 1972; Sugisaki et al., 1974).
In most vitamin D studies with fish, Ca has been present in the rearing water at various concen- trations. Freshwater fish actively transport Ca across the gill membrane; as much as 80% of their metabolic needs when environmental Ca concentration was low and dietary Ca concentration was high (Simkiss, 1974). This may have influenced the observed re- sponses regarding a lack of hypocalcemia, hypophos- phatemia, and bone mineral resorption in previous long-term feeding studies. It has been suggested that the Ca-ATPase in fish gill is vitamin D-independent (George et ai., 1981).
In the studies presented here, we evaluated the efficacy of cholecalciferol and ergocalciferol, and the effect of hypervitaminosis D, in juvenile channel catfish reared in water containing no measurable Ca, an experimental system in which fish rely solely on dietary Ca. Additionally, we conducted an extensive evaluation of tissue mineralization, and identified and measured vitamin D metabolites in catfish serum.
MATERIALS AND METHODS
Two studies were conducted. In the first study, graded levels of cholecalcifero~ and ergo~al~feroi within the range encompassing the dietary requirement, and four treatments without vitamin D were fed to juvenile channel catfish. In the second study, hypervitaminosis D, was evaluated.
Juvenile channel catfish (mean weight 4 g in experiment 1, and 5 g in experiment 2), hatched and reared at the Aqua- cultural Research Center, Texas A&M University, were maintained in an experimental aquaria system equipped with flow-through well water and air supply. The water supply was from a deep well (approximately 667 m) and contained no measurable calcium as determined by atomic absorption spectrophotometry. Supplemental aeration was supplied by a low-pressure, high-volume blower. Photo- period was 12L: IZD and aquaria were covered on all sides with black polyethylene to reduce stress associated with activity in the laboratory.
The basal diet for both studies (Table 1) was formulated with purified ingredients to contain 30% crude protein and 344 kcal gross energy/kg diet (Garling and Wilson, 1976). In experiment one, graded levels of cholecalciferoi and ergocal- ciferol were added such that dietary concentrations were 250, 500, 1000, 1500, 2000 and 2500 I.U./kg diet; these diets contained 0.5% supplemental Ca (as CaSO,; Robinson et al., 1986) and 0.5% supplemental phosphorus (as an equal mix of NaHPO, and K,HPO,; Lovell, 1978a; Wilson et al., 1982). Additionally, four diets were formulated without supplemental vitamin D and with or without supplemental Ca and P. Diets in experiment 2 were formulated identically to those in experiment 1, except all eontained 0.5% Ca and 0.5% P supplied by the same sources. Dietary choleealcif- erol concentrations in that study were geometrically increas- ing levels of the vitamin from 500 through 16,~I.U,/kg and one treatment contained 1 x lO”I.U./kg.
The activity of each vitamin D source was 5 x lO’I.U./kg (Hoffman-LaRoche, Nutley, NJ). Therefore, each source was diluted 1: 1000 (w/w) with cellulose and mixed in a V-mixer for 30min; this premix was made fresh for each experiment. Vitamin D premixes, and supplemental Ca and P were added to each experimental diet at the expense of cellulose.
All diets were mixed, pressure-pelleted, air-dried to a constant moisture content, and stored frozen f- 1YC) prior to their use. Before feeding, dietary pellets were mechani- cally broken into pieces fish could readily consume.
At the ~ginning of each experiment, fish were sorted into groups of 12 and randomly assigned to aquaria. Al1 fish in each experiment were conditioned for 2 weeks prior to initiation of the experiments by feeding the basal diet deficient in vitamin D, but replete with Ca and P. Dietary treatments were randomly assigned to triplicate aquaria. Fish were fed 3% of their body weight per day in experiment 1 and 4% of their body weight per day in experiment 2, with feed allotments in each study divided into two equal meals per day. All fish were weighed every 2 weeks and feed allowances adjusted. An unidentified bacterial outbreak during week 5 of experiment I was successfully treated with nitrofurazone, Fish survival averaged 88.9% in experiment I (range 75.0-94.4) and 94.7% in experiment 2 (range 88.9-1~). Mortalities did not appear to be related to dietary treatments.
Water qualify
Temperature, dissolved oxygen, pH and ammonia-nitro- gen were monitored from randomly chosen aquaria during the course of the studies and ranged from 2628°C 6.5-7.0 mg/l, 8.1-8.3, and 0.01-0.06 mg/l, respectively in experiment I. Temperature ranged from 28-3 1°C in exper- iment 2, but other water quality variables were similar with those from experiment I. Calcium and phosphorus were monitored in the water supply and remained 0.0 mg/l and 0.6 mg/l, respectively in both experiments.
Sample coifection and analysrs
Final weights were recorded at the end of each experiment (14 weeks) and fish were fasted overnight to allow for gastrointestinal evacuation. All fish were then bled by severing the caudal peduncle and allowing blood to drain into acid-washed tubes. Blood sampies clotted at room temperature and serum was collected and stored frozen (- 15°C) prior to analyses, Jn addition, samples of skin, muscle, alimentary tract, liver, heart, gill, gas bladder, anterior and posterior kidney, vertebrae, and pectoral spines were collected from 10 fish per treatment in experiment I.
Table I. Composition of the basal diet (% dry matter basis) used in experiments I and 2’
Ingredient % -~- -_--- Casein 25. I Gelatin 6.0 Dextrin 25.0 Soybean oil 10.0 Vitamin premix? (vitamin D-free) 0.5 Mineral premix? (Ca- and P-free) 4.0 Carboxymethyl cellulose 2.0 Cellul0se 27.4
*All ingredients, except soybean oil, were obtained from U.S. Biochemical, Cleveland, OH. Soybean oil was obtained locally.
TPremixes were the same as those reported by Robinson et nl. (1986) with the exceptions that vitamin D was omitted from the vitamin premix and Ca and P were omitted from the mineral premix; celiulose was added in place of these ingredients. Vitamins were obtained from U.S. Biochemical and reagent-grade minerals were obtained from Sigma Chemical, St. Louis, MO or locally.
Vitamin D in catfish 215
Samples of skin, muscle, alimentary tract, liver, and anterior and posterior kidney were collected from eight fish per replicate in experiment 2. All tissues were collected from frozen fish and stored frozen (- 15’C) prior to analyses. All tissues in each experiment were analysed for Ca, P, Mg, K and Na.
Ca, Mg, Na and K concentrations were measured by atomic absorption spectrophotometry (Perkin-Elmer model 4400); P concentrations were quantified calorimetrically (Cooper Biomedical, Nutley, NJ). Bone and pectoral spine samples were defatted by overnight ether extraction prior to ashing. Diet and tissue samples were ashed by the method of Love11 (1978b), which is a wet-ashing method. Serum 25-OHD, 1,25-(OH), D, and 24,25-(OH),D metabolites were isolated by ether extraction and open column chroma- tography (Aksnes, 1980a) and identified by liquid chroma- tography (Waters and Associates, Milford, MA) by comparison to retention times of known cholccalciferol standards (Hoffman-LaRoche, Nutley, NJ) subjected to the same extraction procedures (Aksnes, 1980b). Metabolite concentrations were quantified by comparison with known concentrations of standard (external standard method). Percentage recovery of spiked samples was similar to values reported for human serum (Aksnes, 1980a) and these values were used to adjust final metabolite concentrations.
~tatistic~i methods
All data were analysed as a completely randomized design (one-way analysis of variance) using the general linear models procedure of the statistical analysis system, SAS (Helwig and Council, 1979). If analysis of variance indicated that significant differences were present, Duncan’s multiple range test was used to separate mean values.
RESULTS
Experiment 1
Weight gain and feed efficiency (FE) of catfish fed the diet deficient in vitamin D and Ca, but replete in P (diet 3) were significantly lower than weight gain and FE of catfish fed other vitamin D-deficient diets (diets 1, 2 and 4, Table 2). There were no significant differences in weight gain or FE values of fish fed
Table 2. Weight gain (% increase) and feed efficiency (FE) of catfish fed diets in experiment I
*Feed efficiency = wet weight gain of fish/dry weight feed fed.
ivitamin-D deficient and with (+) or without (-) supplemental Ca or P.
S$I.U./kg of supplemental ergocalciferol or choiecal- ciferol, respectively.
Means in the same column with the same superscript are nol si~ifi~dy different. Mean square er- rors for weight gain and feed efficiency were I .S and 0.3, respectively.
Table 3. Mean serum mineral concentrations (mg/dl) of catfish fed diets in experiment 1
*Vitamin D deficient and with (+) or without (-) sup- plemental Ca or P.
tfI.U./kg of supplemental ergwalciferol or cholecalciferol, respectively.
Means in the same column with the same superscript are not significantly different. Mean square errors for serum magnesium, potassium and sodium were 0.01, 0.46 and 8.06. respectively for fish fed the vitamin D deficient diets; 0.01, 1.56 and 102.69, respectively for fish fed supplemental ergocalciferol and 0.20, 0.98 and 155.42, respectively for fish fed supplemental cholecatciferol.
other vitamin D-deficient diets. Weight gains and FE were significantly improved in fish fed diets 5-8 (25&1500 I.U./kg as ergocalciferol) compared to weight gains and FE of fish fed any of the vitamin D-deficient diets, but weight gains and FE of fish fed diets 9 and 10 (2000 and 2500 I.U./kg as ergocalcif- erol) were not significantly different from weight gain of fish fed vitamin D-deficient diets 1,2 and 4. Weight gains and FE of fish fed graded levels of cholecalcif- erol were significantly higher than those values from fish fed diet 4, but were not signi~~antly different from each other.
Serum Ca and P concentrations were not signifi- cantly different among treatments and averaged 8.8 k 0.9 mg/dl and 23.0 + 2.0 mg/dl, respectively. There were no clear distinctions in other serum mineral concentrations between fish fed vitamin D- deficient diets 14 and fish fed any level of either form of the vitamin, but there were several clear differences within the respective groups. Serum K concentrations were significantly higher and serum Na significantly lower in fish fed the vitamin D-deficient diet without supplementai Ca, but replete in P (diet 3), compared to fish fed other vitamin D-deficient diets (Table 3). Serum Mg was significantly lower in fish fed vitamin D-deficient diets without supplemental P (diets 1 and 2).
Serum K was significantly higher in fish fed 150&2500 I.U./kg of ergocalciferol (diets 8-10) and in fish fed 1000-1500 I.U./kg cholecalciferol (diets 13-14, Table 3). Serum Mg was significantly higher in fish fed 250-1000 I.U./kg ergocalciferol (diets 5-7) compared to serum levels in fish fed greater amounts. While statistical differences were detected in other serum mineral values, dear trends were not apparent.
Vertebral bone ash and K concentrations (Table 4) were signi~cantly lower in fish fed vitamin D-deficient diets without supplemental P (diets 1 and 2) com- pared to fish fed vitamin D-deficient diets with
216 PAUL 0. BROWN and EDWIN H. ROBINSON
Table 4. Vertebral bone and pectoral spine ash and mineral con~ntrations (X, dry fat-free basis) of catfish fed vitamin D-deficient diets with (+) or without f-) supplemental Ca or
P in experiment 1
Diet number Ash Ca P Mg K Na -
1 (-Ca, -P) 2 (+Ca, -P) 3 (-Ca, +P) 4 (tCa, +P)
1 (-Ca, -P) 2 (+Ca, -P) 3 (-ca, +P) 4 (+Ca. +PI
40.31 41.71 49.7* 46.9t
53.0t 53.6f 59.4* 55.9*
Vertebral bone 15.q 9.0. 16.8Q 8.5’ 18.7* 8.4’ 18.2*t 8.4’
Means in any column of each tissue with the same symbol are not si~ificantly different. Mean square errors for ash, calcium, phosphorus, magnesium, potassium, and sodium concentrations were 0.75,0.31, 3.42, 0.01, 0.01 and 0.01, respectively for vertebral bone and 1.28, 0.30, 4.89, 0.01, 0.01 and 0.01, respectively for pectoral spines.
supplemental P (diets 3 and 4). Hard tissue ash, Mg and Na concentrations were significantly higher in fish fed diet 3 compared to fish fed other vitamin D-deficient diets. Phosphorus concentrations were not signi~cantly different between fish fed deficient diets, but bone Ca concentrations were generally lower in fish fed vitamin D-deficient diets without supplemental P. Significant differences in vertebral bone and pectoral spine mineral concentrations were detected in fish fed increasing levels of both vitamins, but there were no clear trends that could be related to dietary treatments.
Soft tissue calcium and phosphorus concentrations from catfish fed vitamin D-deficient diet 3 (+P, -Ca) were significantly higher than values from fish fed other vitamin D-deficient diets (Table 5). There were no clear trends in other mineral ~on~ntrations from fish fed vitamin D-deficient diets, or from fish fed graded levels of either form of the vitamin.
Similarly, there were no clear trends in serum vitamin D metabolite concentrations from fish in experiment 1. Mean values from 25-OHD, 1,2S- (OH),D and 24,25-(OH), were 43.8 _t 9.5, 20.4 + 5.4 and 46.7 + 17.2, respectively in fish fed vitamin D-deficient diets, 56.7 & 54.6, 34.9 k 24.2 and 36.4 + 20.7, respectively in fish fed ergocalciferol, and 84.9 + 55.3, 37.2 rt 14.8 and 68.9 + 58.2, respectively in fish fed cholecal~iferol. However, column retention time of the 25-OHD metabolite from fish fed any level of ergocalciferol was consistently shorter than
from fish fed vitamin D-deficient diets or from fish fed graded levels of cholecalciferol; other metabolites measured, regardless of the amount or form of the vitamin fed, co-chromatographed with standards.
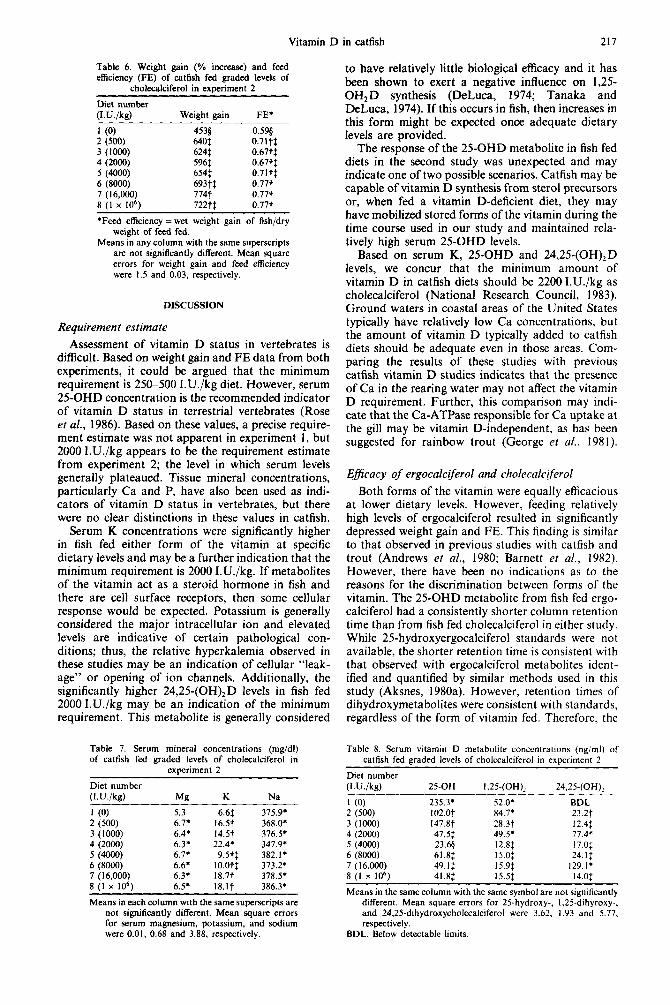
Weight gain and feed efficiency of fish fed the vitamin D-deficient diet were significantly lower than weight gain and FE of fish fed any level of cholecal- ciferol (Table 6). There were no clear distinctions in weight gain or FE of fish fed graded levels of the vitamin.
Serum Mg concentration was significantly lower in fish fed the vitamin D-deficient diet and serum K was significantly higher in fish fed 2000 I.U./kg (Table 7) compared to fish fed other diets. Serum Ca, P, and Na concentrations were not significantly different among dietary treatments and Ca levels averaged 13.7 t_ 0.9mg/dl and P levels averaged 19.9 k 1.1 mg/dl. There were no clear trends in tissue mineral concentrations from fish fed any level of the vitamin.
Serum 25-OHD concentrations were significantly higher in fish fed diets 1-3 (O-1000 I.U./kg) compared to fish fed higher levels of the vitamin, and 1,25- (OH),D concentrations were significantly higher in fish fed diets 1-4 (0-2000LUJkg; Table 8). Serum 24,25-(OH),D concentrations were significantly higher from fish fed 2000 and 16,000 I.U./kg than from fish fed other levels of the vitamin.
Table 5. Soft tissue calcium concentrations (mg/kg, wet weight basis) of catfish fed vitamin D-deficient diets with (+) or without (-) supplemental Ca or P in experiment I
Means in any row with the same symbol were not significantly different. Mean square errors for anterior kidney, posterior kidney, gas bladder, gill, alimentary tract, heart, liver, muscle and skin calcium were 36.8, 45.3, 18.0, 2.8, 41.4, 7.3, 142.7, 5.3 and 48.9, respectively.
Vitamin D in catfish 217
Table 6. Weight gain (% increase) and feed efficiency (FE) of catfish fed graded levels of
*Feed efficiency = wet weight gain of fish/dry weight of feed fed.
Means in any column with the same superscripts are not significantly different. Mean square errors for weight gain and feed efficiency were 1.5 and 0.03, respectively.
DISCUSSION
Requirement estimate
Assessment of vitamin D status in vertebrates is difficult. Based on weight gain and FE data from both experiments, it could be argued that the minimum requirement is 250-500 I.U./kg diet. However, serum 25-OHD concentration is the recommended indicator of vitamin D status in terrestrial vertebrates (Rose et al., 1986). Based on these values, a precise require- ment estimate was not apparent in experiment 1, but 2000 I.U./kg appears to be the requirement estimate from experiment 2; the level in which serum levels generally plateaued. Tissue mineral concentrations, particularly Ca and P, have also been used as indi- cators of vitamin D status in vertebrates, but there were no clear distinctions in these values in catfish.
Serum K concentrations were significantly higher in fish fed either form of the vitamin at specific dietary levels and may be a further indication that the minimum requirement is 2000 I.U./kg. If metabolites of the vitamin act as a steroid hormone in fish and there are cell surface receptors, then some cellular response would be expected. Potassium is generally considered the major intracellular ion and elevated levels are indicative of certain pathological con- ditions; thus, the relative hyperkalemia observed in these studies may be an indication of cellular “leak- age” or opening of ion channels. Additionally, the significantly higher 24,25-(OH),D levels in fish fed 2000 I.U./kg may be an indication of the minimum requirement. This metabolite is generally considered
Table 7. Serum mineral concentrations (mg/dl) of catfish fed graded levels of cholecalciferol in
5 (4000) 6.1’ 9.w 382. I l 6 (8000) 6.6’ 1o.oti 373.2’ 7 (16,000) 6.3* 18.7t 378.5’ 8 (1 x 10⁶) 6.5’ lS.lt 386.3’
Means in each column with the same superscripts are not significantly different. Mean square errors for serum magnesium, potassium, and sodium were 0.01, 0.68 and 3.88, respectively.
to have relatively little biological efficacy and it has been shown to exert a negative influence on 1,25- OH,D synthesis (DeLuca, 1974; Tanaka and DeLuca, 1974). If this occurs in fish, then increases in this form might be expected once adequate dietary levels are provided.
The response of the 25-OHD metabolite in fish fed diets in the second study was unexpected and may indicate one of two possible scenarios. Catfish may be capable of vitamin D synthesis from sterol precursors or, when fed a vitamin D-deficient diet, they may have mobilized stored forms of the vitamin during the time course used in our study and maintained rela- tively high serum 25-OHD levels.
Based on serum K, 25-OHD and 24,25-(OH),D levels, we concur that the minimum amount of vitamin D in catfish diets should be 2200 I.U./kg as cholecalciferol (National Research Council, 1983). Ground waters in coastal areas of the United States typically have relatively low Ca concentrations, but the amount of vitamin D typically added to catfish diets should be adequate even in those areas. Com- paring the results of these studies with previous catfish vitamin D studies indicates that the presence of Ca in the rearing water may not affect the vitamin D requirement. Further, this comparison may indi- cate that the Ca-ATPase responsible for Ca uptake at the gill may be vitamin D-independent, as has been suggested for rainbow trout (George et al., 1981).
Eficacy of ergocalciferol and cholecalciferol
Both forms of the vitamin were equally efficacious at lower dietary levels. However, feeding relatively high levels of ergocalciferol resulted in significantly depressed weight gain and FE. This finding is similar to that observed in previous studies with catfish and trout (Andrews et al., 1980; Barnett et al., 1982). However, there have been no indications as to the reasons for the discrimination between forms of the vitamin. The 25-OHD metabolite from fish fed ergo- calciferol had a consistently shorter column retention time than from fish fed cholecalciferol in either study. While 25-hydroxyergocalciferol standards were not available, the shorter retention time is consistent with that observed with ergocalciferol metabolites ident- ified and quantified by similar methods used in this study (Aksnes, 1980a). However, retention times of dihydroxymetabolites were consistent with standards, regardless of the form of vitamin fed. Therefore, the
Table 8. Serum vitamin D metabolite concentrations (&ml) of catfish fed graded levels of cholccalciferol in experiment 2
Means in the same column with the same symbol are not significantly different. Mean square errors for 25-hydroxy-, 1,25-dihyroxy-, and 24.2%dihydroxycholecalciferol were 3.62, 1.93 and 5.77, respectively.
BDL, Below detectable limits.
218 PAULB.BROWN and EDWIN H. ROBINSON
discrimination in ability to use the two forms of the vitamin may be due to an inability to utilize 25-hydroxyergocalciferol as a substrate for further hydroxylation, leading to eventual excretion of this form. Our speculation was recently identified as one of the causes of vitamin D discrimination in poultry (Hoy et ai., 1988).
Efects on mineral metabolism
Serum hypocalcemia, hypophosphatemia and bone mineral resorption are several of the generalized responses to dietary vitamin D deficiency, and serum hypercalcemia is one of the typical responses to hypervitaminosis D. However, these parameters have not been responsive in previous feeding studies with fish reared in fresh waters and were not in this study. It is becoming increasingly clear the Ca and vitamin D metabolism in freshwater fish is not iden- tical to other vertebrates. The response of fish fed the vitamin D-deficient diet 3 (-Ca, +P) in the first study may be indicative of the strategy employed by fish when faced with dietary inadequacies of Ca or vitamin D. There was a significant increase in Ca concentrations of all soft tissues analysed, which is similar to findings in previous studies conducted in the same rearing water with catfish and tilapia (Ore- ochromis aureus) fed Ca-deficient, but vitamin D-re- plete diets (Robinson et af., 1986, 1987). Therefore, it appears that freshwater fish decrease Ca losses in these situations, possibly via decreased renal ex- cretion, resulting in increased soft tissue concen- trations. Feeding graded levels of P to tilapia in the same rearing water used in this and in previous studies (Robinson et al., 1987) resulted in hypophos- phatemia and reduced bone ash and P concen- trations. Therefore, it appears that P metabolism in freshwater fish may be more similar to that observed in other vertebrates.
Relatively long-term feeding studies with fish fed graded levels of calcium or vitamin D have recorded few changes in serum or bone mineral concentrations, yet short-term physiological studies have identified some of the typical responses observed in terrestrial animals. Based on the information to date, the differ- ences observed may indicate that increases in serum Ca and P on administration of vitamin D or it’s metabolites may be rapidly sequestered in certain soft tissue storage sites. Therefore, feeding studies may not be recording transient changes in serum levels of these nutrients. The lack of bone mineral resorption in most of the feeding studies may indicate a lack of receptors in fish bone.
Acknowledgements-We thank the staff of the Aquacultural Research Center for their help with these studies.
REFERENCES
Andrews J. W., Murai T. and Page J. W. (1980) Effects of dietary cholecalciferol and ergocalciferol on channel catfish. Aquaculture 19, 49-54.
Aksnes L. (1980a) Quantitation of the main metabolites of vitamin D in a single serum sample. I. Extraction, separ- ation and purification of metabolites. C/in. Chem. Acta 104, 133-146.
Aksnes L. (1980b) Quantitation of the main metabolites of vitamin D in a single serum sample. II. Determination of UV-absorption and competitive protein binding assays. Clin. Chem. Acta 104, 147-159.
Avioli L. V., Sonn Y., Jo D., Nahon T. H., Haussler M. R. and Chandler J. S. (1981) 1,25Dihydroxyvitamin D, in male, non-spawning female and spawning female trout, Proc. Sot. exp. Biol. Med. 166, 291-299.
Barnett B. J., Cho C. Y. and Slinger S. J. (1982) Relative biopotency of dietary ergocalciferol and cholicalciferol and the role of and requirement for vitamin D in rainbow trout (Salmo gairdneri). J. Nutr. 112, 201 l-2019.
Bills C. E. (1927) Antirrachitic substances. VI. The distri- bution of vitamin D with some notes on possible origin. J. biol. Chem. 72, 751-758.
Blondin G. A. (1967) Concerning the non-photochemical biosynthesis of vitamin D, in fish. J. Am. Chem. Sot. 86, 2528-2529.
DeLuca H. F. (1974) Vitamin D-1973. Am. J. Med. 56, 871-875.
Fenwick J. C., Smith K. and Flik G. (1984) Effect of various vitamin D analogs on plasma calcium: phosphorus and intestinal calcium absorption in fed and unfed American eels, Anguilla rostrata. 6en. camp. Endocr. 55, 398-404.
Garlina D. L. and Wilson R. P. (1976) Ontimum dietarv protein to energy ratio for channel catfish figerlings, Iciaho-us punctatus. J. Nutr. 107, 203 l-2037.
George J. C., Bamett B. J., Cho C. Y. and Slinger S. J. (1981) Vitamin D, and muscle function in the rainbow trout. Cytobios 31, 7-18.
Hayes M. E., Guilland-Cumming D. F., Russell R. G. G. and Henderson I. W. (1986) Metabolism of 25-hydroxy- cholicalciferol in a telost fish, the rainbow trout (Salmo gairdneri). Gen. camp. Endocr. 64, 143-150.
Helwie. J. T. and Council K. A. (1979) SAS User’s Guide. Statistical Analysis Systems Institute, Cary, NC.
Henry H. and Norman A. W. (1975) Presence of renal 2%hydroxyvitamin D-I-hydroxylase in species of all vertebrate classes. Comp. Biochem. Physiol. SOB, 431-434.
Hilton J. W. and Ferguson H. W. (1982) Effect of excess vitamin D, on calcium metabolism in rainbow trout, Salmo gairdneri Richardson. J. Fish Biol. 21, 373-379.
Hollis B. W., Burton J. H. and Draper H. H. (1977) A binding assay for 25-hydroxycalciferols and 24R,25-dihy- droxycalciferols using bovine plasma globulin. Steroids 30, 285-293.
Horst R. L., Napoli J. L. and Littledike E. T. (1982) Discrimination in the metabolism of orally dosed ergocal- ciferol and cholicalciferol by the pig, rat, and the chick. Biochem. J. 204, 185-189.
Hoy D. A., Ramberg C. F. Jr and Horst R. L. (1988) Evidence that discrimination against ergocalciferol by the chick is the result of enhanced metabolic clearance rates for its mono- and dihydroxylated metabolites. J. Nutr. 118, 633638.
Hunt R. D., Garcia F. G. and Hegsted D. M. (1967) A comparison of vitamin D, and vitamin D, in new world primates. 1. Progression and regression of osteodystriphia fibrosa. Lab. Anim. Care 17, 155-187.
Jewel1 M. E., Schneberger 0. W. and Ross I. A. (1933) Vitamin requirements of goldfish and channel cat. Trans. Am. Fish Sot. 63, 338-347.
Launer C. A., Tiemeier 0. W. and Deyoe C. W. (1978) Effects of dietary addition of vitamins C and D, on growth and calcium and phosphorus content of pond-cul- tured channel catfish. Prog. Fish Cult. 40, 1630.
Lovell R. T. (1978a) Dietary phosphorus requirement of channel catfish. Trans. Am. Fish. Sot. 107, 617621.
Love11 R. T. (1978b) Laboratory Manual for Fish Feed and Nutrition Analysis. Alabama Agricultural Experiment Station, Auburn, AL.
Vitamin D in catfish 219
Love11 R. T. and Li Yin-Pen (1978) Essentiality of vitamin D in diets of channel catfish, lctalurus punctatus. Trans. Am. Fish Sot. 107, 809611.
Marocci C., Freake H. C., Iwaski J., Lopez E. and MacIntyre I. (1982) Demonstration and organ binding of the 125dihydroxyvitamin D,-binding protein in fish (A. anguila). Endocrinology 110, 1347-1354.
Mellanby E. (1919) An experimental investigation on rick- ets. Lancer I, 407-412.
National Research Council (1983) ~#fr~enr requirements of Warmwater Fishes and S~el/~hes. National Academy Press, W~hington, DC.
Oizumi K. and Monder C. (1972) Localizaton and metab- olism of vitamin D, and hydroxychoficalciferol in goldfish (Carassius auratus L.). Comp. Biochem. Physiol. 42B, 523-532.
Robinson E. H., Rawles S. D., Brown P. B., Yette H. E. and Green L. W. (1986) Dietary calcium requirement of channel catfish, Ictaluruspunctatus, reared in calcium-free water. Aquaculture 53, 263-270.
Robinson E. H., LaBomascus D., Brown P. 8. and Linton T. L. (1987) Dietary calcium and phosphorus require- ments of Greochromis uureus reared in calcium-free water. Aquaculture 64, 267-276.
Rose R. C., McCormick D. B., Li T.-K., Lumeng L.. Haddad J. G. Jr and Spector R. (1986) Transport and metabolism of vitamins. Fed. Prof. 45, 30-39.
Simkiss K. (1974) Calcium metabolism of fish in relation to aging. In The Aging of Fish (Edited by Bagenal T. B.), Unwin Brothers, Surrey, U.K.
Srivastav A. K. (1984) Calcaemic responses in the fresh- water mud eel, Amphipnous cuchia to vitamin D, admin- istration. J. Fish Biol. 23, 301-304.
Sugisaki N., Welcher M. and Monder C. (1974) Lack of vitamin D, synthesis by goldfish. Comp. Bioehem. Physiol. 49B, 647-653.
Swarup K., Norman A. W., Srivastav A. K. and Srivastav S. P. (1984) Dose-dependent vitamin Ds and 1.25dihy- droxyvitamin D,-induced hypercafcemia and hyperphos- phatemia in male catfish, CIarias butrucmts. Comp. Biochem. Physiot. 78B, 553-555.
Swarup K. and Srivastav S. P. (1982) Vitamin D,-induced hypercalcemia in male catfish, Clurias barracks. Gen. camp. Endorr. 46, 271-278.
Tanaka T. and DeLuca H. F. (1974) Stimulation of 24,25 dihydroxy-vitamin D, production by I,25 dihydroxyvita- min D, Science 183, 1198-l 201.
Wilson R. P., Robinson E. H., Gatlin D. M. III and Poe W. E. (1982) Dietary phosphorus requirement of channel catfish. J. Nutr. 112, 1197-1292.
Yanda D. M. and Ghazarian J. G. (1981) Vitamin D and 25-hydroxyvitamjn D in rainbow trout (Salmo gairdneri): cytochrome P-450 and biotransfo~atjon of the vitamins. Camp. Biochem. Physiol. 69B, 183-188.