25
| Date post: | 02-Jul-2015 |
| Category: |
Investor Relations |
| Upload: | vivo-investor-relations |
| View: | 240 times |
| Download: | 0 times |

Vivo Participações S/AFebruary 21, 2008
RESULTS
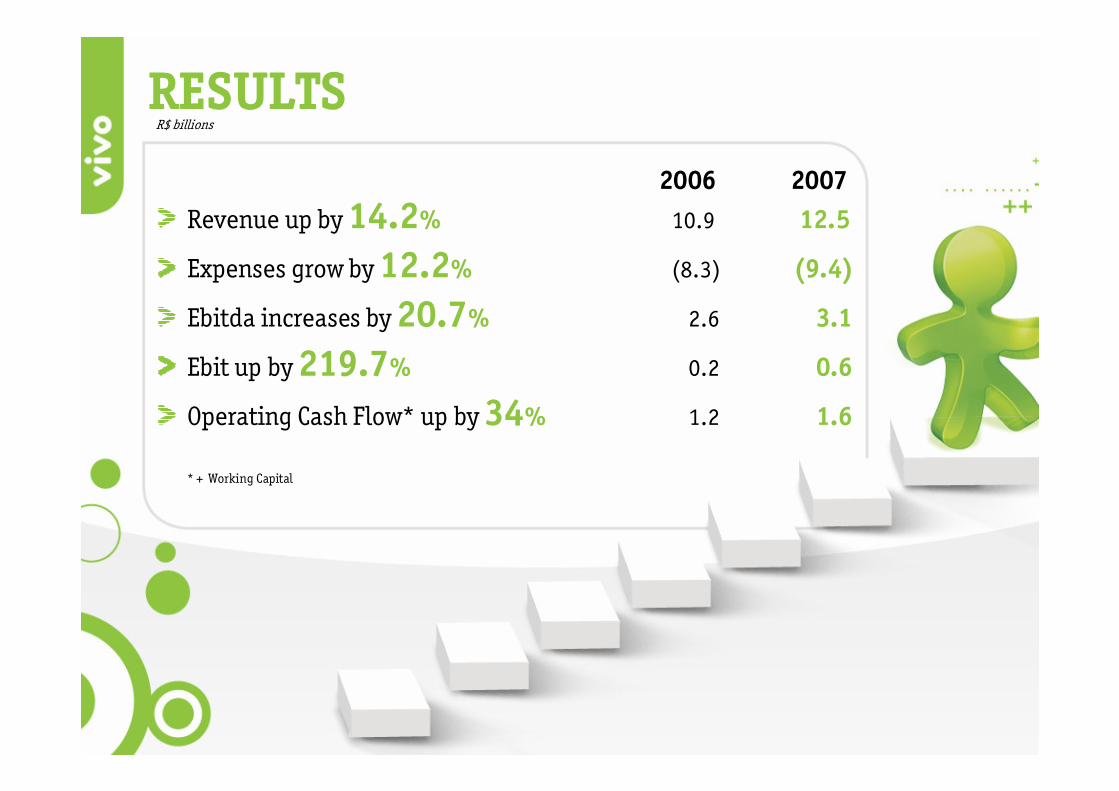
Revenue up by14.2% 10.9 12.5
Expenses grow by12.2% (8.3) (9.4)
Ebitda increases by20.7% 2.6 3.1
Ebit up by219.7% 0.2 0.6
Operating Cash Flow* up by34% 1.2 1.6
* + Working Capital
2006 2007
R$ billions

AgendaOperating PerformanceFinancial Performance
Vivo Participações S/AFebruary 21, 2008
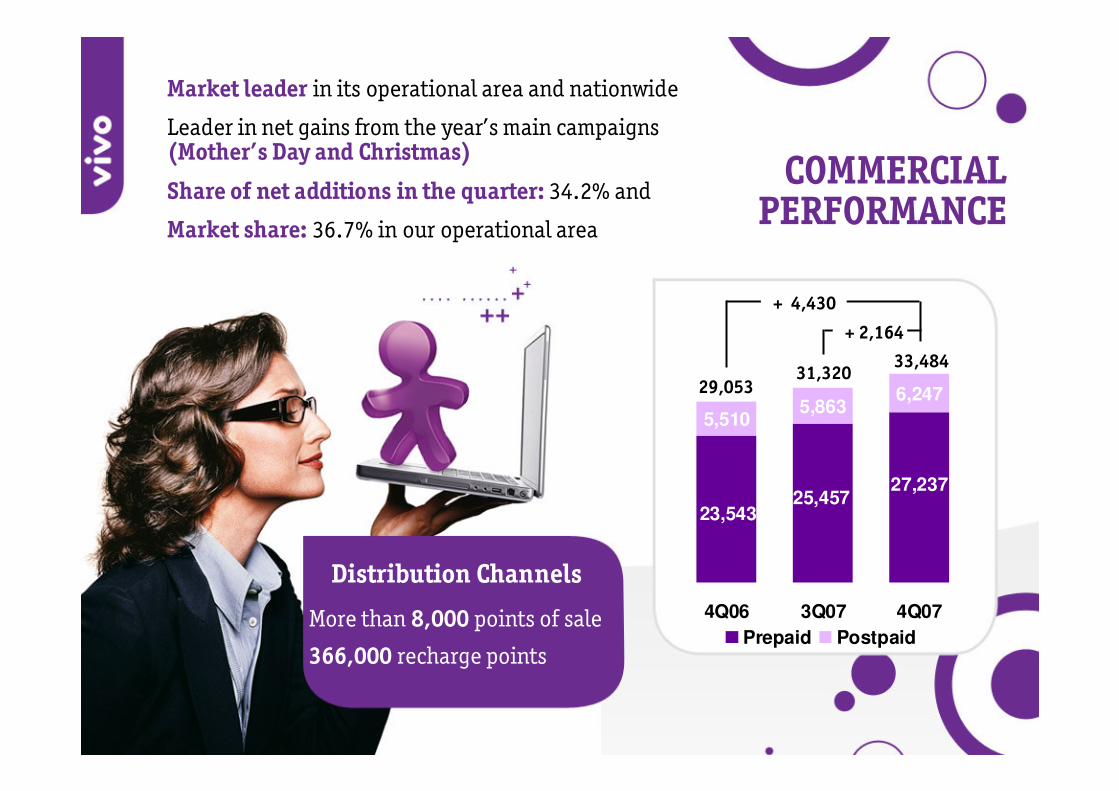
+ 2,164
+ 4,430
33,48431,320
29,053
More than 8,000 points of sale
366,000 recharge points
Distribution Channels
Market leader in its operational area and nationwide
Leader in net gains from the year’s main campaigns(Mother’s Day and Christmas)
Share of net additions in the quarter: 34.2% and
Market share: 36.7% in our operational area
COMMERCIAL PERFORMANCE
27,237 25,457
23,543
6,2475,863
5,510
4Q06 3Q07 4Q07
Prepaid Postpaid
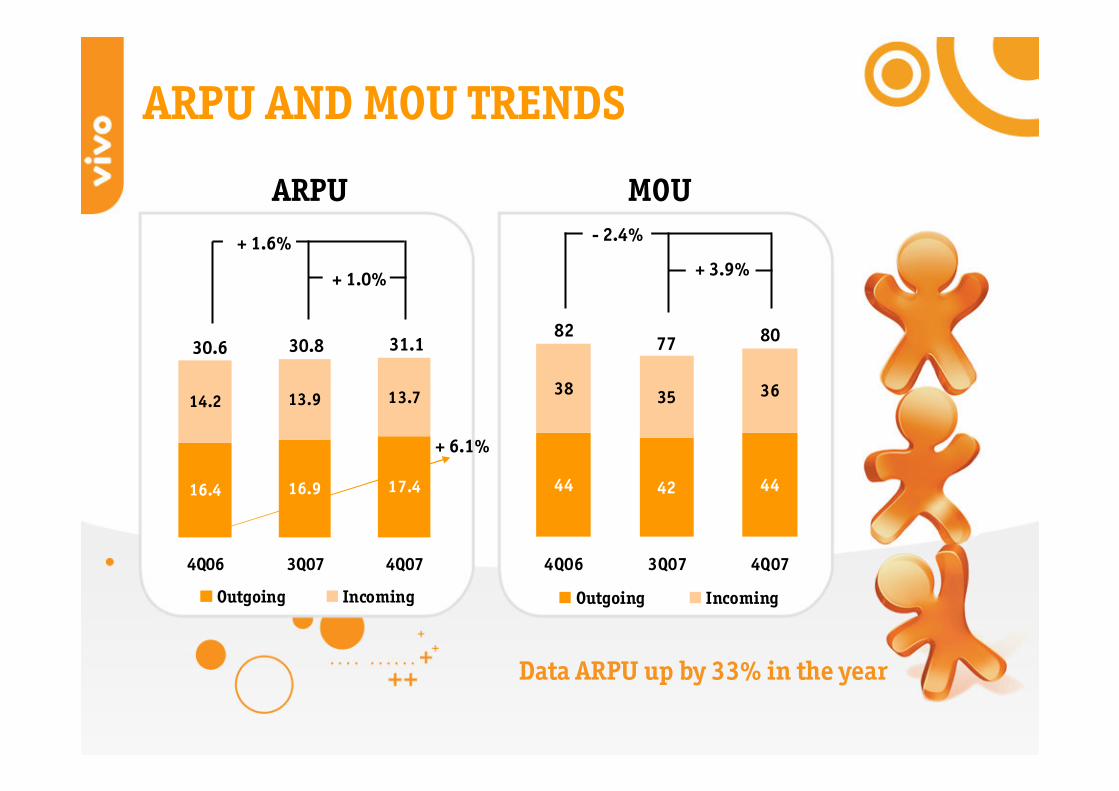
ARPU AND MOU TRENDS
ARPU MOU
+ 6.1%
31.130.830.6
+ 1.0%
+ 1.6% + 3.9%
- 2.4%
44 42 44
38 35 36
4Q06 3Q07 4Q07
Outgoing Incoming
807782
Data ARPU up by 33% in the year
17.416.916.4
13.713.914.2
4Q06 3Q07 4Q07
Outgoing Incoming
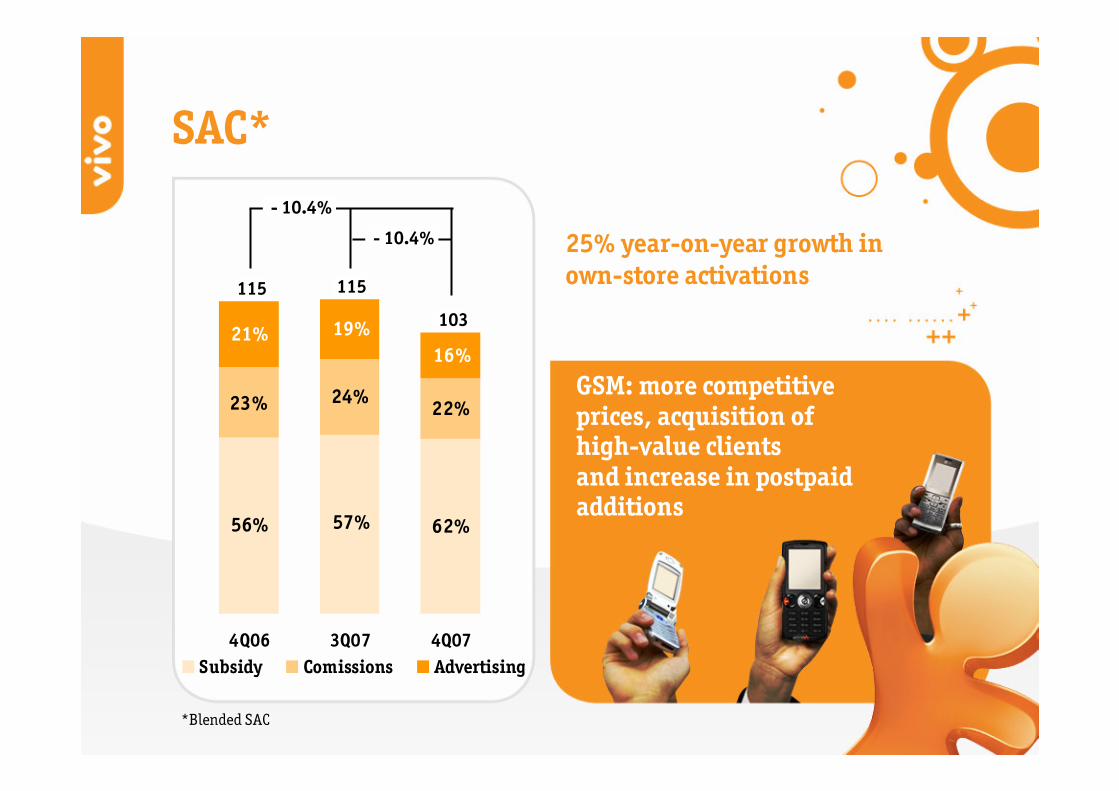
SAC*
GSM: more competitive prices, acquisition of high-value clients and increase in postpaid additions
- 10.4%
- 10.4%
115 115
103
*Blended SAC
25% year-on-year growth in own-store activations
57% 56% 62%
24% 22% 23%
16% 19% 21%
4Q06 3Q07 4Q07Subsidy Comissions Advertising
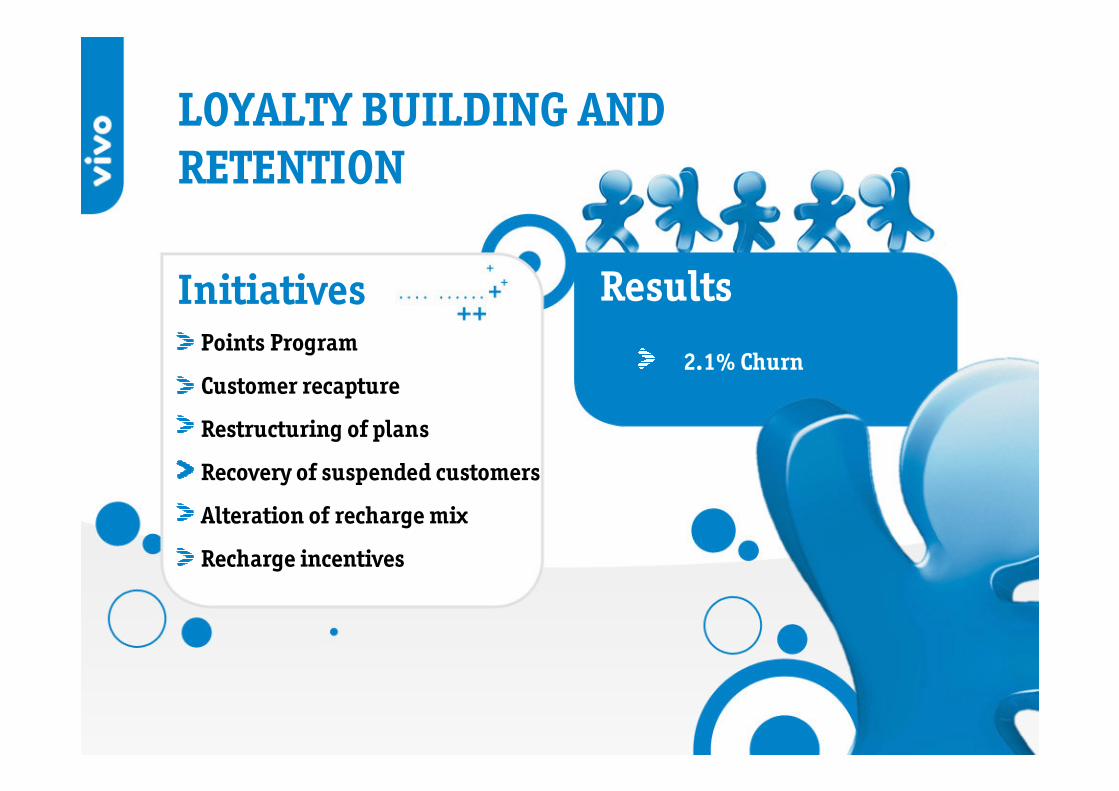
LOYALTY BUILDING AND RETENTION
InitiativesPoints Program
Customer recapture
Restructuring of plans
Recovery of suspended customers
Alteration of recharge mix
Recharge incentives
Results
2.1% Churn
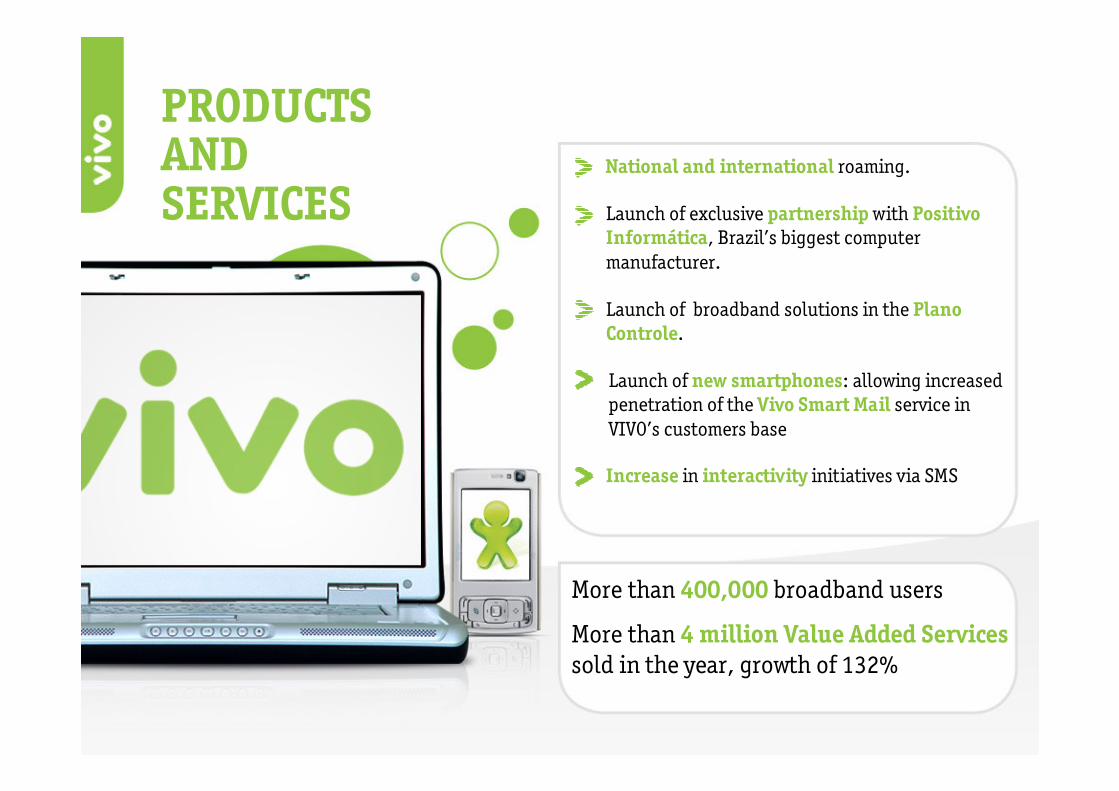
PRODUCTS AND SERVICES Launch of exclusive partnership with Positivo
Informática, Brazil’s biggest computermanufacturer.
Launch of broadband solutions in the PlanoControle.
Launch of new smartphones: allowing increasedpenetration of the Vivo Smart Mail service in VIVO’s customers base
Increase in interactivity initiatives via SMS
National and international roaming.
More than 400,000 broadband users
More than 4 million Value Added Servicessold in the year, growth of 132%
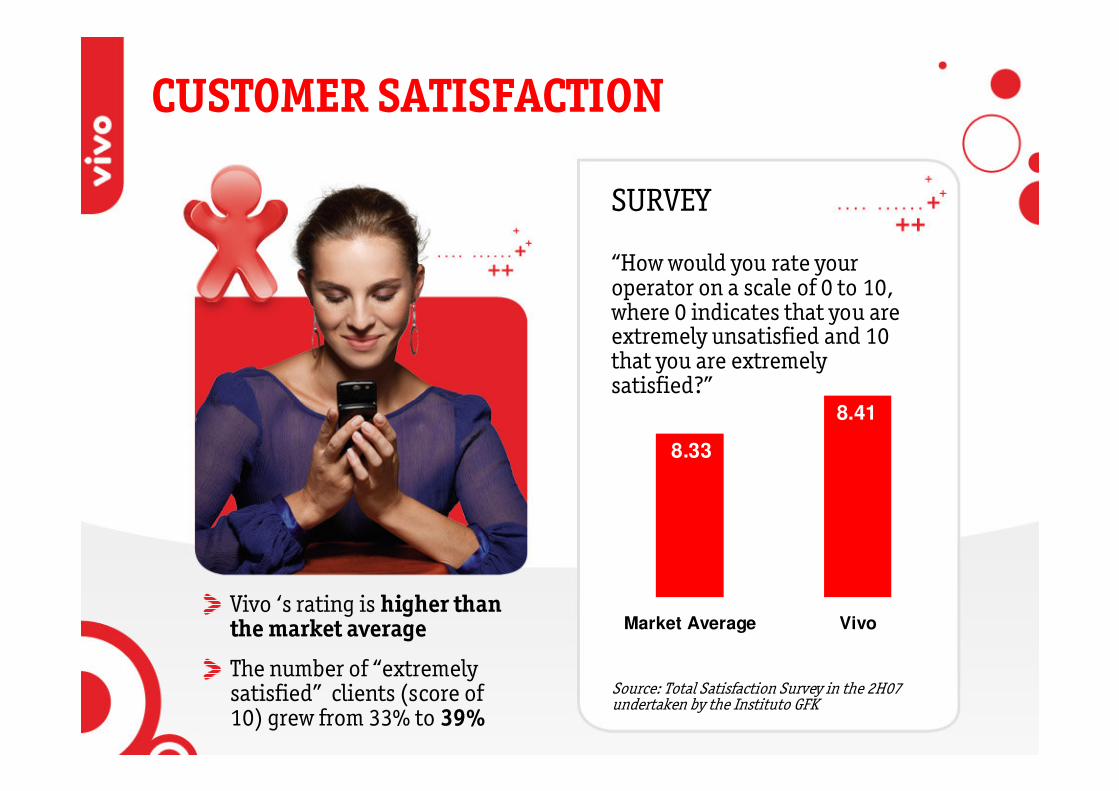
CUSTOMER SATISFACTION
Vivo ‘s rating is higher thanthemarket average
8.41
8.33
Market Average Vivo
The number of “extremelysatisfied” clients (score of10) grew from 33% to 39%
“How would you rate your operator on a scale of 0 to 10, where 0 indicates that you are extremely unsatisfied and 10 that you are extremely satisfied?”
Source: Total Satisfaction Survey in the 2H07 undertaken by the Instituto GFK
SURVEY
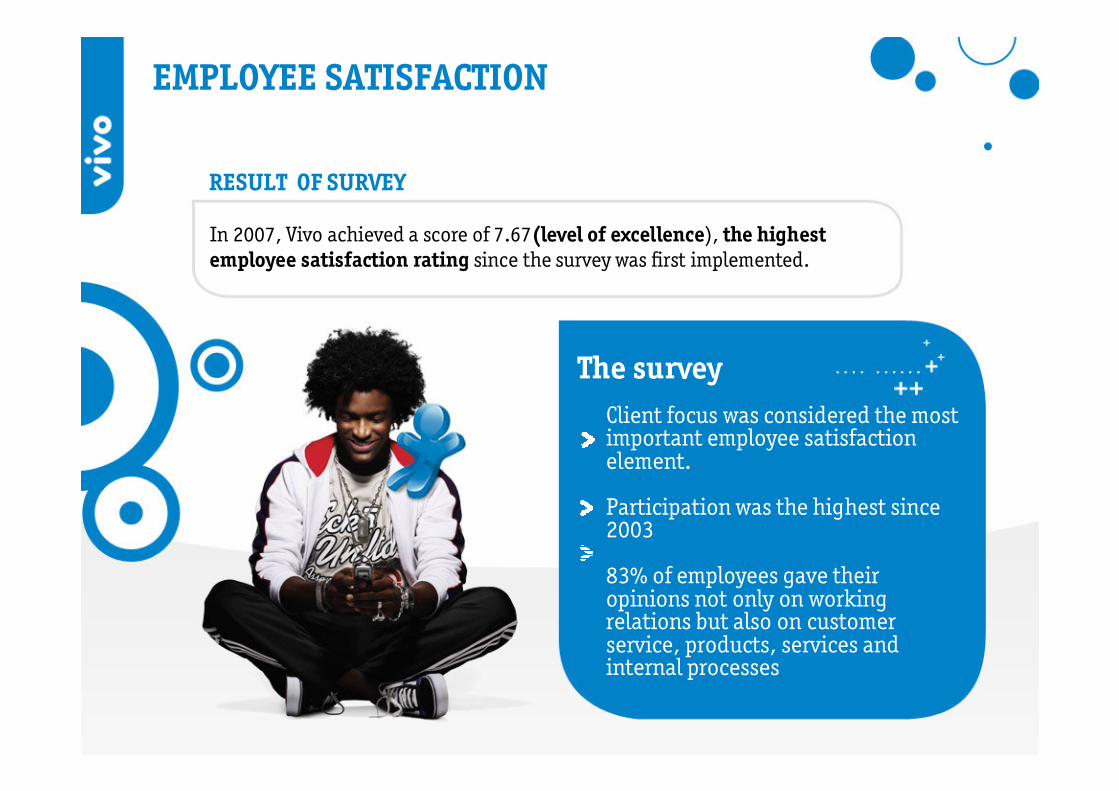
EMPLOYEE SATISFACTION
In 2007, Vivo achieved a score of 7.67(level of excellence), the highestemployee satisfaction rating since the survey was first implemented.
RESULT OF SURVEY
Client focus was considered the mostimportant employee satisfactionelement.
Participation was the highest since2003
83% of employees gave theiropinions not only on working relations but also on customerservice, products, services andinternal processes
The survey
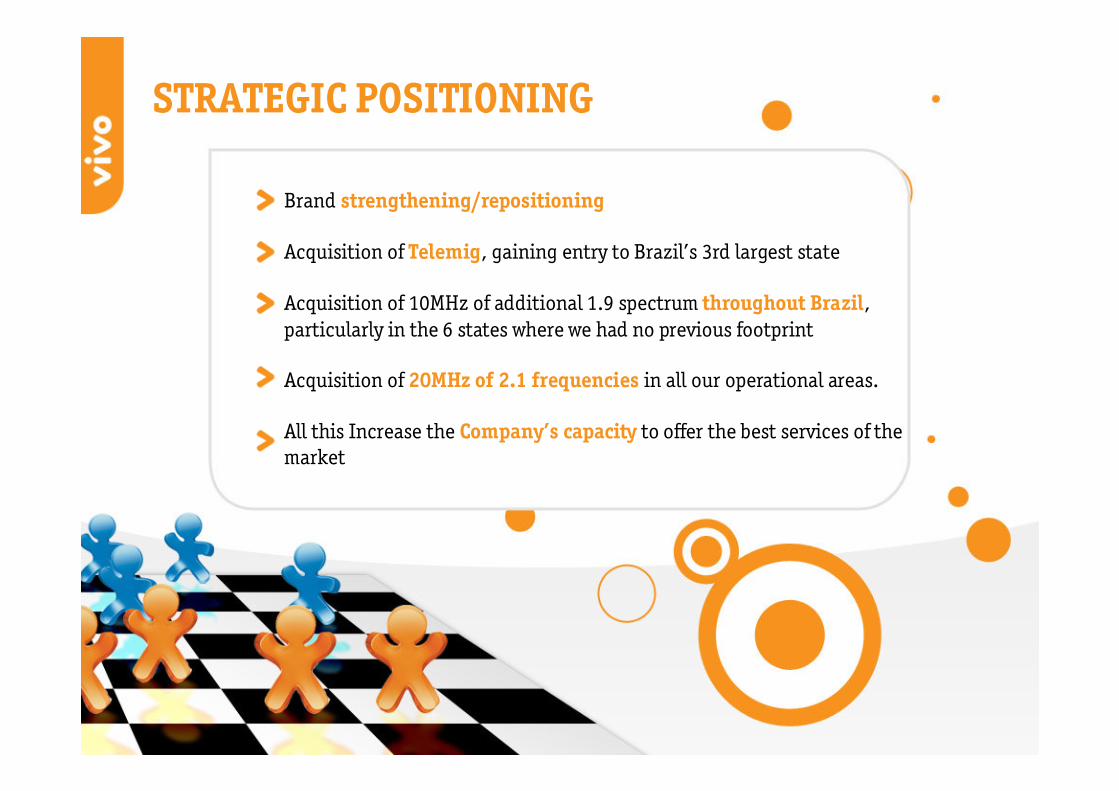
Brand strengthening/repositioning
Acquisition of Telemig, gaining entry to Brazil’s 3rd largest state
Acquisition of 10MHz of additional 1.9 spectrum throughout Brazil, particularly in the 6 states where we had no previous footprint
Acquisition of 20MHz of 2.1 frequencies in all our operational areas.
All this Increase the Company’s capacity to offer the best services of the market
STRATEGIC POSITIONING

SO MUCH WORK DESERVESRECOGNITION
Vivo is the “Company that Most RespectsConsumers”
1st Brazil Intangibles Award
Most remembered Internet brand –Top of Mind UOL/ DataFolha
Most reliable sector brand – Seleções / Reader's Digest/ IBOPE
Vivo para o Cliente and Vivo Voluntário Programs: TOP HR and Top Social - ADVB
Brand repositioning: TOP Marketing (ADVB), Premio About and Marketing Best
IT Professional 2007: Informatica Hoje magazine, Info Corporate Award and TOP IT

Operating PerformanceFinancial Performance
Agenda
Vivo Participações S/AFebruary 21, 2008

AgendaOperating PerformanceFinancial Performance
Vivo Participações S/AFebruary 21, 2008
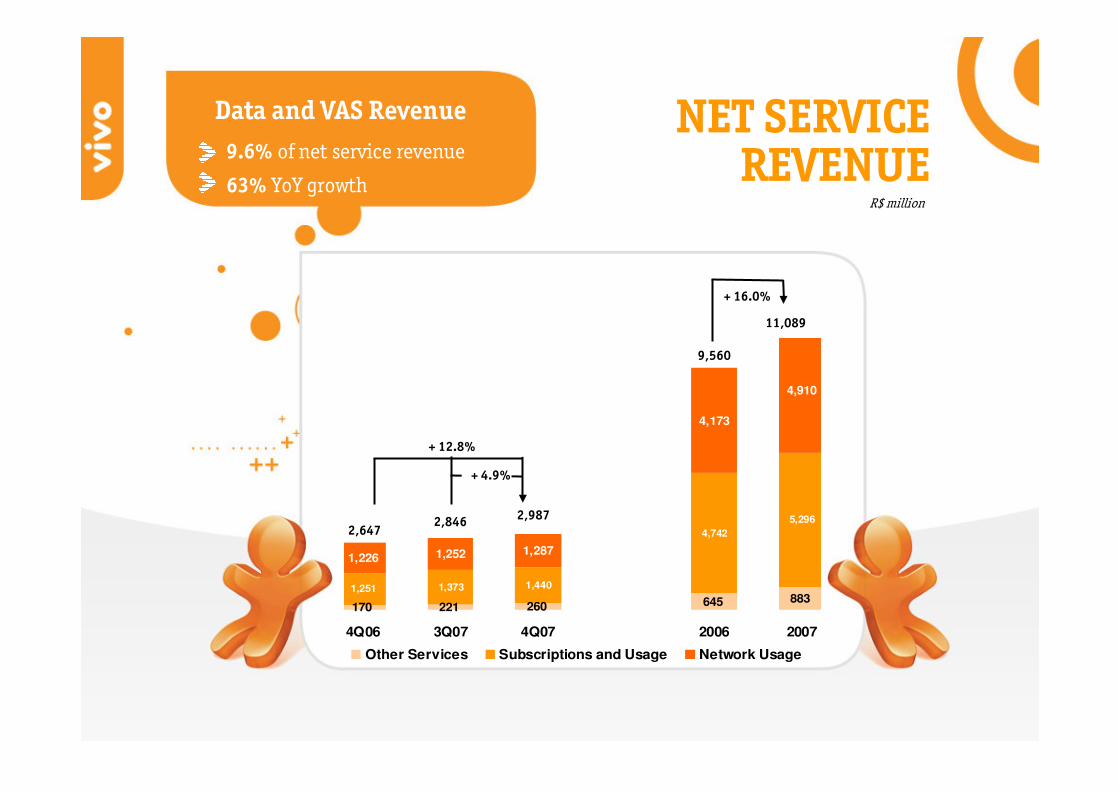
NET SERVICE REVENUE
170 221 645 883260
5,296
1,440 1,3731,251
4,742
1,226 1,252 1,287
4,910
4,173
4Q06 3Q07 4Q07 2006 2007
Other Services Subscriptions and Usage Network Usage
+ 16.0%
9,560
11,089
2,6472,9872,846
+ 12.8%
+ 4.9%
9.6% of net service revenue
63% YoY growth
Data and VAS Revenue
R$ million
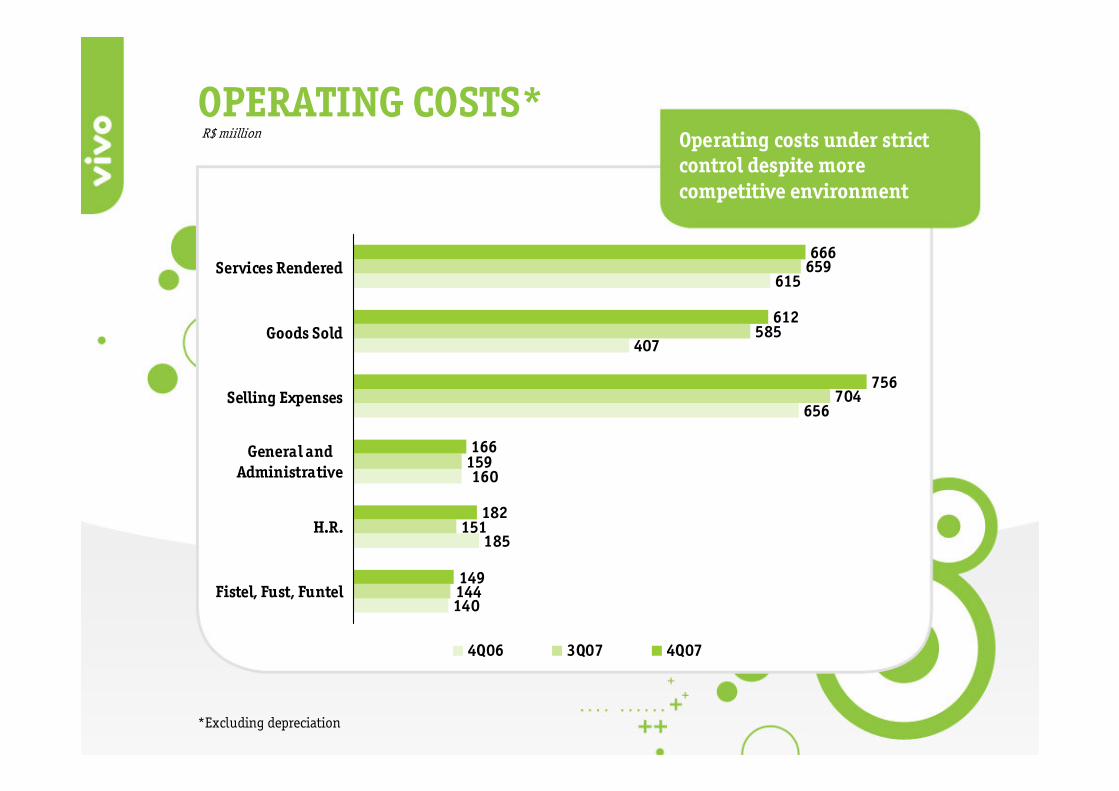
Operating costs under strict control despite more competitive environment
*Excluding depreciation
R$ miillion
140
185
656
407
615
144
151
159
704
585
659
149
182
166
756
612
666
160
Fistel, Fust, Funtel
H.R.
General andAdministrative
Selling Expenses
Goods Sold
Services Rendered
4Q06 3Q07 4Q07
OPERATING COSTS*
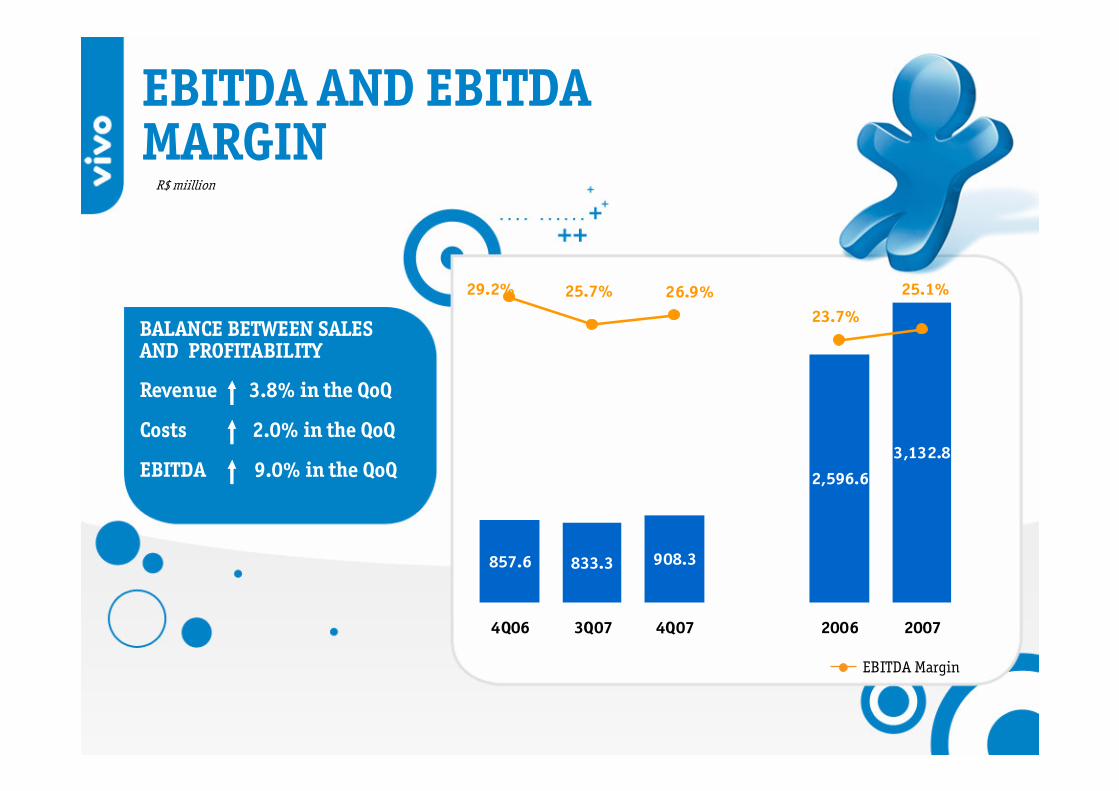
BALANCE BETWEEN SALES AND PROFITABILITY
Revenue 3.8% in the QoQ
Costs 2.0% in the QoQ
EBITDA 9.0% in the QoQ
EBITDA Margin
3,132.8
2,596.6
908.3857.6 833.3
25.7% 26.9%29.2%
23.7%
25.1%
4Q06 3Q07 4Q07 2006 2007
EBITDA AND EBITDA MARGIN
R$ miillion
* EBITDA – CAPEX +Working Capital
R$ millions
CASH FLOW* NET RESULT
-99.416.3
885.6
28.34.4
4Q06 3Q07 4Q07 2006 2007
CASH FLOW AND NET RESULT
1,616.3
1,204.8
654.5
527.5
760.2
4Q06 3Q07 4Q07 2006 2007
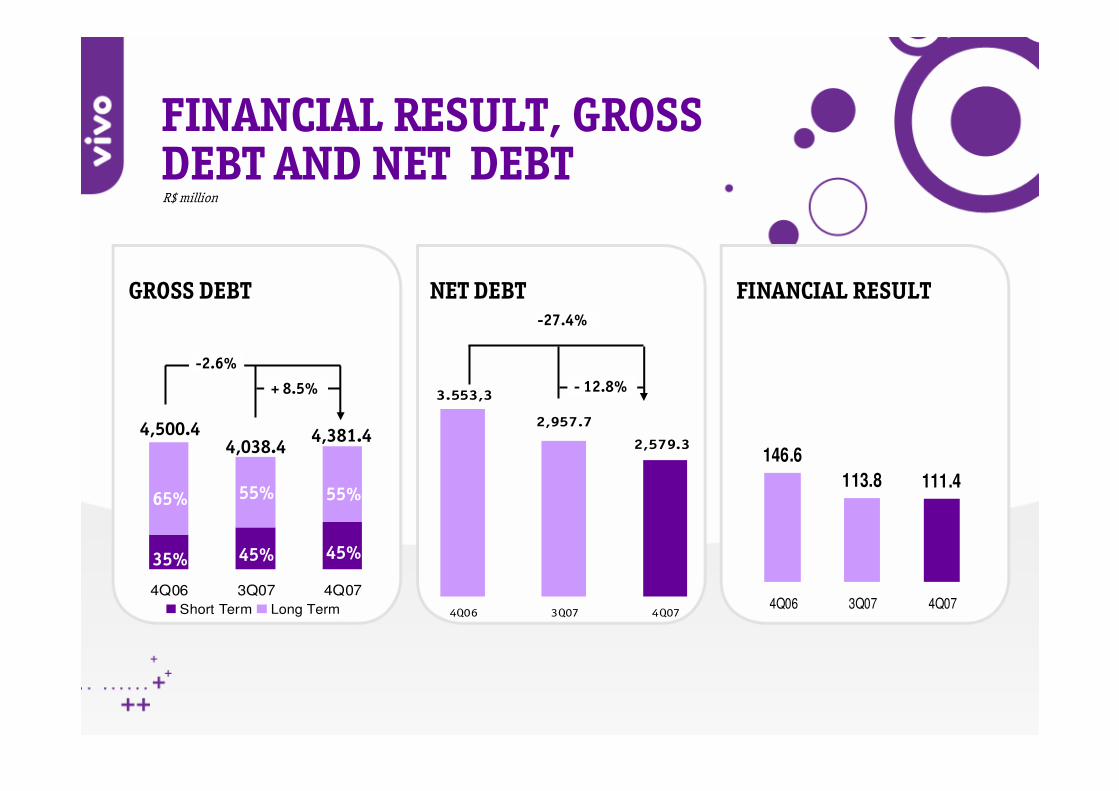
2,957.7
2,579.3
3.553,3
4Q06 3Q07 4Q07
4Q06 3Q07 4Q07
Short Term Long Term
4,038.44,500.4
65%
35%
55%
45%
55%
45%
4,381.4
111.4113.8
146.6
4Q06 3Q07 4Q07
FINANCIAL RESULT, GROSS DEBT AND NET DEBTR$ million
+ 8.5%
-2.6%
- 12.8%
-27.4%
GROSS DEBT NET DEBT FINANCIAL RESULT
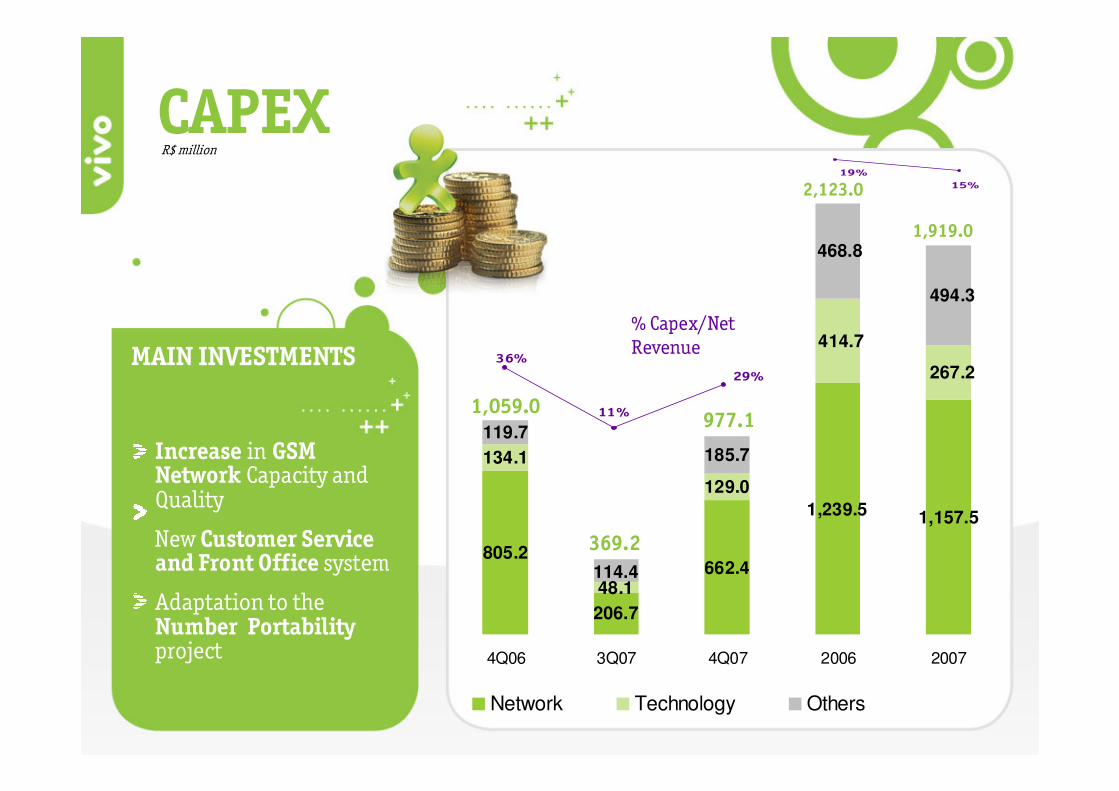
1,157.5 1,239.5
662.4
206.7
805.2
129.0
48.1
134.1
267.2
414.7
185.7
114.4
494.3
468.8
119.7
4Q06 3Q07 4Q07 2006 2007
Network Technology Others
29%
11%
36%
1,059.0977.1
369.2
% Capex/Net Revenue
2,123.0
1,919.0
CAPEX
MAIN INVESTMENTS
Increase in GSM Network Capacity andQuality
New Customer Serviceand Front Office system
Adaptation to theNumber Portabilityproject
R$ million
15%19%
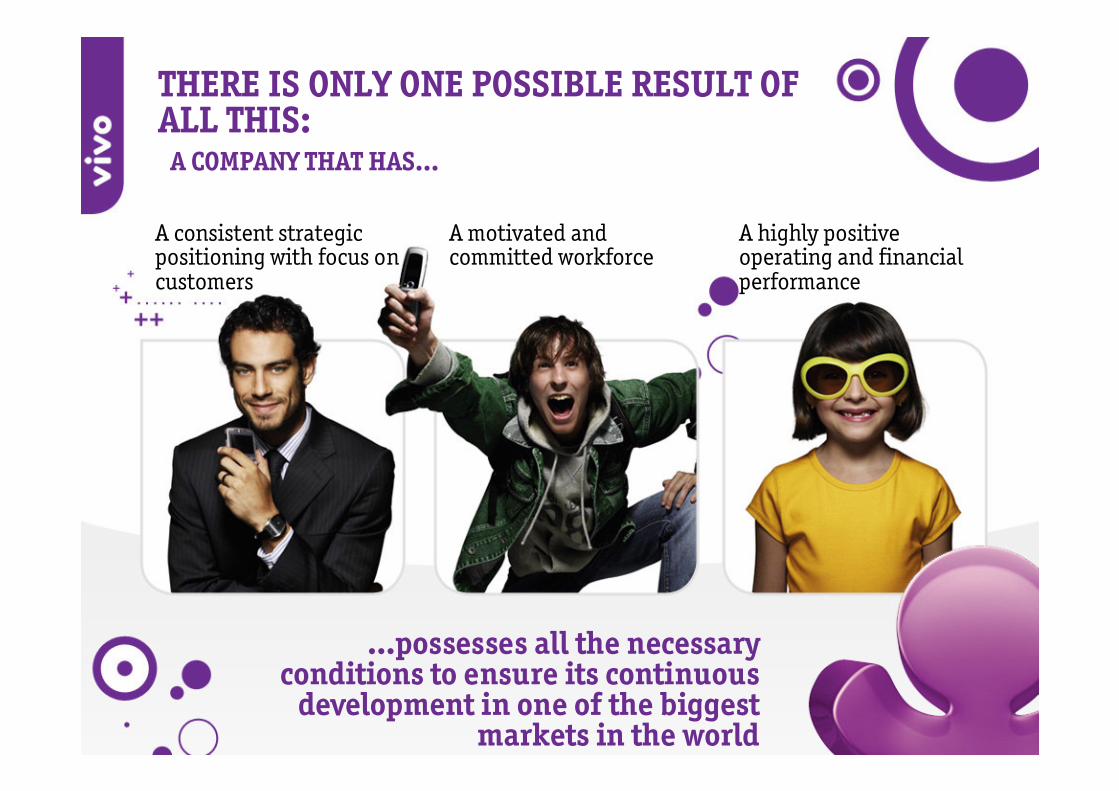
THERE IS ONLY ONE POSSIBLE RESULT OF ALL THIS:
...possesses all the necessaryconditions to ensure its continuousdevelopment in one of the biggest
markets in the world
A COMPANY THAT HAS...
A consistent strategicpositioning with focus on customers
A motivated andcommitted workforce
A highly positive operating and financial performance
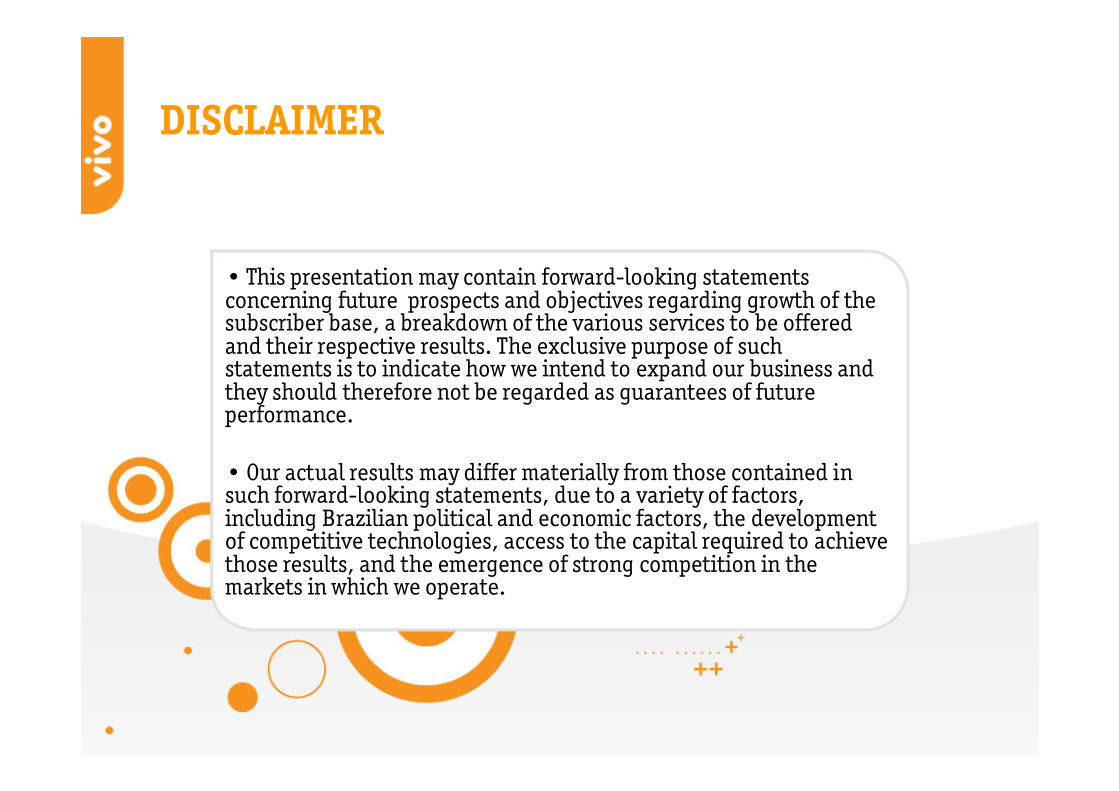
DISCLAIMER
• This presentation may contain forward-looking statements concerning future prospects and objectives regarding growth of the subscriber base, a breakdown of the various services to be offered and their respective results. The exclusive purpose of such statements is to indicate how we intend to expand our business and they should therefore not be regarded as guarantees of future performance.
• Our actual results may differ materially from those contained in such forward-looking statements, due to a variety of factors, including Brazilian political and economic factors, the development of competitive technologies, access to the capital required to achieve those results, and the emergence of strong competition in the markets in which we operate.
VIVO PARTICIPAÇÕES S.A.


