35
VMWARE HORIZON 6 ON HYPER-CONVERGED INFRASTRUCTURES Horizon 6 version 6.2 VMware vSphere 6U1 / VMware Virtual SAN 6U1 Supermicro TwinPro 2 4 Nodes TECHNICAL WHITE PAPER – SEPTEMBER 2016
VMWARE HORIZON 6 ON HYPER-CONVERGED INFRASTRUCTURESHorizon 6 version 6.2 VMware vSphere 6U1 / VMware Virtual SAN 6U1 Supermicro TwinPro2 4 Nodes
TECHNICAL WHITE PAPER – SEPTEMBER 2016
T E C H N I C A L W H I T E PA P E R | 2
VMWARE HORIZON 6 ON HYPER-CONVERGED INFRASTRUCTURES
Table of Contents
Audience . . . . . . . . . . . . . . . . . . . . . . . . . . . . . . . . . . . . . . . . . . . . . . . . . . . . . . . . . . . . . . . . . . . . . . . . . . . . . . . . . .3
Summary . . . . . . . . . . . . . . . . . . . . . . . . . . . . . . . . . . . . . . . . . . . . . . . . . . . . . . . . . . . . . . . . . . . . . . . . . . . . . . . . . .3
Hyper-Converged Infrastructure . . . . . . . . . . . . . . . . . . . . . . . . . . . . . . . . . . . . . . . . . . . . . . . . . . . . . . . . . . . . 4
View in Horizon 6 . . . . . . . . . . . . . . . . . . . . . . . . . . . . . . . . . . . . . . . . . . . . . . . . . . . . . . . . . . . . . . . . . . . . . . . . . 4
Test Environment . . . . . . . . . . . . . . . . . . . . . . . . . . . . . . . . . . . . . . . . . . . . . . . . . . . . . . . . . . . . . . . . . . . . . . . . . .5
Hardware Configuration . . . . . . . . . . . . . . . . . . . . . . . . . . . . . . . . . . . . . . . . . . . . . . . . . . . . . . . . . . . . . . . . . . 5
Management Block . . . . . . . . . . . . . . . . . . . . . . . . . . . . . . . . . . . . . . . . . . . . . . . . . . . . . . . . . . . . . . . . . . . . . . 5
Desktop Blocks . . . . . . . . . . . . . . . . . . . . . . . . . . . . . . . . . . . . . . . . . . . . . . . . . . . . . . . . . . . . . . . . . . . . . . . . . . 6
Logical Layout of the Test Bed . . . . . . . . . . . . . . . . . . . . . . . . . . . . . . . . . . . . . . . . . . . . . . . . . . . . . . . . . . . 7
Test Methodology . . . . . . . . . . . . . . . . . . . . . . . . . . . . . . . . . . . . . . . . . . . . . . . . . . . . . . . . . . . . . . . . . . . . . . . 8
Test Results . . . . . . . . . . . . . . . . . . . . . . . . . . . . . . . . . . . . . . . . . . . . . . . . . . . . . . . . . . . . . . . . . . . . . . . . . . . . . . 11
Workload Testing . . . . . . . . . . . . . . . . . . . . . . . . . . . . . . . . . . . . . . . . . . . . . . . . . . . . . . . . . . . . . . . . . . . . . 12
Desktop Specifications . . . . . . . . . . . . . . . . . . . . . . . . . . . . . . . . . . . . . . . . . . . . . . . . . . . . . . . . . . . . . . .12
Applications Testing . . . . . . . . . . . . . . . . . . . . . . . . . . . . . . . . . . . . . . . . . . . . . . . . . . . . . . . . . . . . . . . . .13
Desktop Pool with Traditional Applications . . . . . . . . . . . . . . . . . . . . . . . . . . . . . . . . . . . . . . . . . . . 15
Desktop Pool with AppStacks . . . . . . . . . . . . . . . . . . . . . . . . . . . . . . . . . . . . . . . . . . . . . . . . . . . . . . . 19
Summary of Login VSI Test Results . . . . . . . . . . . . . . . . . . . . . . . . . . . . . . . . . . . . . . . . . . . . . . . . . . 22
Operations Testing . . . . . . . . . . . . . . . . . . . . . . . . . . . . . . . . . . . . . . . . . . . . . . . . . . . . . . . . . . . . . . . . . . . 23
Provisioning a Desktop Pool . . . . . . . . . . . . . . . . . . . . . . . . . . . . . . . . . . . . . . . . . . . . . . . . . . . . . . . . . 23
Refreshing a Desktop Pool . . . . . . . . . . . . . . . . . . . . . . . . . . . . . . . . . . . . . . . . . . . . . . . . . . . . . . . . . . 24
Recomposing a Desktop Pool . . . . . . . . . . . . . . . . . . . . . . . . . . . . . . . . . . . . . . . . . . . . . . . . . . . . . . . 25
Boot Storm . . . . . . . . . . . . . . . . . . . . . . . . . . . . . . . . . . . . . . . . . . . . . . . . . . . . . . . . . . . . . . . . . . . . . . . . 25
Configuration . . . . . . . . . . . . . . . . . . . . . . . . . . . . . . . . . . . . . . . . . . . . . . . . . . . . . . . . . . . . . . . . . . . . . . . . . . . . 26
Hyper-Converged Appliance . . . . . . . . . . . . . . . . . . . . . . . . . . . . . . . . . . . . . . . . . . . . . . . . . . . . . . . . . . 26
View Storage Accelerator . . . . . . . . . . . . . . . . . . . . . . . . . . . . . . . . . . . . . . . . . . . . . . . . . . . . . . . . . . . . . 26
Networking . . . . . . . . . . . . . . . . . . . . . . . . . . . . . . . . . . . . . . . . . . . . . . . . . . . . . . . . . . . . . . . . . . . . . . . . . . 27
Storage . . . . . . . . . . . . . . . . . . . . . . . . . . . . . . . . . . . . . . . . . . . . . . . . . . . . . . . . . . . . . . . . . . . . . . . . . . . . . 27
Management Virtual Machines . . . . . . . . . . . . . . . . . . . . . . . . . . . . . . . . . . . . . . . . . . . . . . . . . . . . . . . . 29
About the Author and Contributor . . . . . . . . . . . . . . . . . . . . . . . . . . . . . . . . . . . . . . . . . . . . . . . . . . . . . . . . . 33
Additional Resources . . . . . . . . . . . . . . . . . . . . . . . . . . . . . . . . . . . . . . . . . . . . . . . . . . . . . . . . . . . . . . . . . . . . . 33
Appendix A: Scaling Out a Hyper-Converged Infrastructure . . . . . . . . . . . . . . . . . . . . . . . . . . . . . . . . . 34
T E C H N I C A L W H I T E PA P E R | 3
VMWARE HORIZON 6 ON HYPER-CONVERGED INFRASTRUCTURES
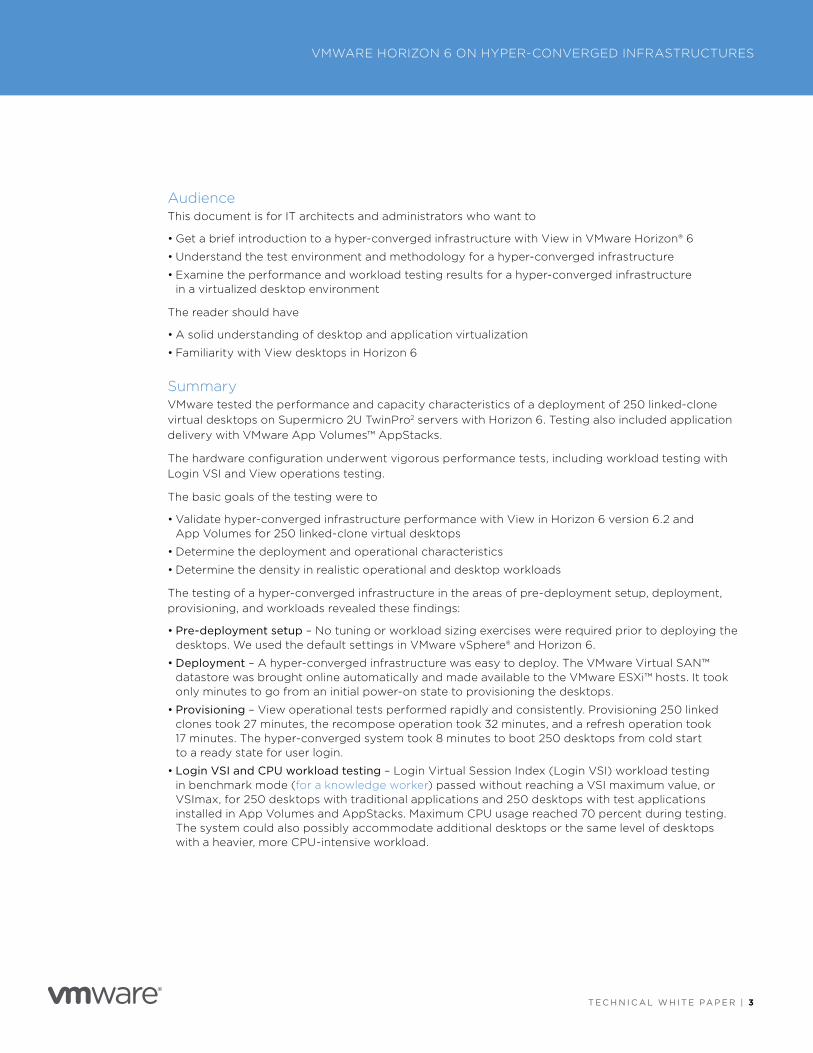
AudienceThis document is for IT architects and administrators who want to
• Get a brief introduction to a hyper-converged infrastructure with View in VMware Horizon® 6
• Understand the test environment and methodology for a hyper-converged infrastructure
• Examine the performance and workload testing results for a hyper-converged infrastructure in a virtualized desktop environment
The reader should have
• A solid understanding of desktop and application virtualization
• Familiarity with View desktops in Horizon 6
SummaryVMware tested the performance and capacity characteristics of a deployment of 250 linked-clone virtual desktops on Supermicro 2U TwinPro2 servers with Horizon 6 . Testing also included application delivery with VMware App Volumes™ AppStacks .
The hardware configuration underwent vigorous performance tests, including workload testing with Login VSI and View operations testing .
The basic goals of the testing were to
• Validate hyper-converged infrastructure performance with View in Horizon 6 version 6 .2 and App Volumes for 250 linked-clone virtual desktops
• Determine the deployment and operational characteristics
• Determine the density in realistic operational and desktop workloads
The testing of a hyper-converged infrastructure in the areas of pre-deployment setup, deployment, provisioning, and workloads revealed these findings:
• Pre-deployment setup – No tuning or workload sizing exercises were required prior to deploying the desktops . We used the default settings in VMware vSphere® and Horizon 6 .
• Deployment – A hyper-converged infrastructure was easy to deploy . The VMware Virtual SAN™ datastore was brought online automatically and made available to the VMware ESXi™ hosts . It took only minutes to go from an initial power-on state to provisioning the desktops .
• Provisioning – View operational tests performed rapidly and consistently . Provisioning 250 linked clones took 27 minutes, the recompose operation took 32 minutes, and a refresh operation took 17 minutes . The hyper-converged system took 8 minutes to boot 250 desktops from cold start to a ready state for user login .
• Login VSI and CPU workload testing – Login Virtual Session Index (Login VSI) workload testing in benchmark mode (for a knowledge worker) passed without reaching a VSI maximum value, or VSImax, for 250 desktops with traditional applications and 250 desktops with test applications installed in App Volumes and AppStacks . Maximum CPU usage reached 70 percent during testing . The system could also possibly accommodate additional desktops or the same level of desktops with a heavier, more CPU-intensive workload .
T E C H N I C A L W H I T E PA P E R | 4
VMWARE HORIZON 6 ON HYPER-CONVERGED INFRASTRUCTURES
Hyper-Converged InfrastructureA hyper-converged infrastructure contains compute, network, and storage that you can easily scale out for extra performance and storage by adding components .
The hyper-converged infrastructure is built for
• Virtual desktop infrastructures (VDI)
• Data centers
• Virtual private clouds
• Remote and branch offices
A hyper-converged infrastructure provides the following benefits:
• Easy deployment, configuration, and management because the infrastructure is built as a software-defined building block . Compute, network, storage, and management are delivered in a single hardware platform with a single SKU for easy inventory tracking .
• Simple and straightforward support with a single point of contact through a preferred hyper-converged infrastructure partner .
View in Horizon 6With Horizon 6, View is the VMware VDI software that delivers a Windows desktop experience remotely to a user’s thin client, zero client, PC, or mobile device from a centralized enterprise server . Delivering View virtual desktops from centralized vSphere servers enhances application and data security, improves IT responsiveness, and reduces the cost of desktop operations . The user has a more consistent and responsive experience across devices and locations while maintaining IT-approved levels of customization .
With View VDI, you can
• Eliminate repeatedly building, configuring, and maintaining each physical desktop
• Avoid physical desktop CPU and memory issues, and meet virtual desktop service-level agreement (SLA) requirements with VMware vRealize® Operations for Horizon, which alerts or remediates under-provisioned desktop virtual machines automatically
• Deliver a consistent Windows desktop experience for each user across multiple end-user devices
• Secure enterprise application access only to View-enabled users
• Eliminate unintended enterprise data loss due to lost or stolen physical desktop devices
• Deliver controlled access, persistence, and customization for each user
• Reduce application-delivery costs by centralizing software updates
• Improve provisioning of Windows desktops by centrally managing virtual desktops
• Reduce hardware requirements and costs at the endpoint
• Reduce resource costs on vSphere servers through VMware storage optimization technologies
• Deliver a high-performance end-user experience based on a dynamically adaptive network protocol, PCoIP, which compresses and encrypts traffic based on available bandwidth
• Deliver a high-performance remote desktop experience for both VDI and RDSH sessions, including rich, 3D graphics applications, using vGPU and vDGA graphics-acceleration technologies
• Provide a zero-install desktop solution for zero and thin clients and HTML5-compatible browsers
• Provide remote desktop access on iOS and Android devices with Unity Touch
T E C H N I C A L W H I T E PA P E R | 5
VMWARE HORIZON 6 ON HYPER-CONVERGED INFRASTRUCTURES
Test EnvironmentThis section provides the details of the test environment .
In a View environment, blocks provide a scalable and modular architecture that facilitates standardization, expansion, and ease of management .
The two types of View blocks are
• Management block
• Desktop block
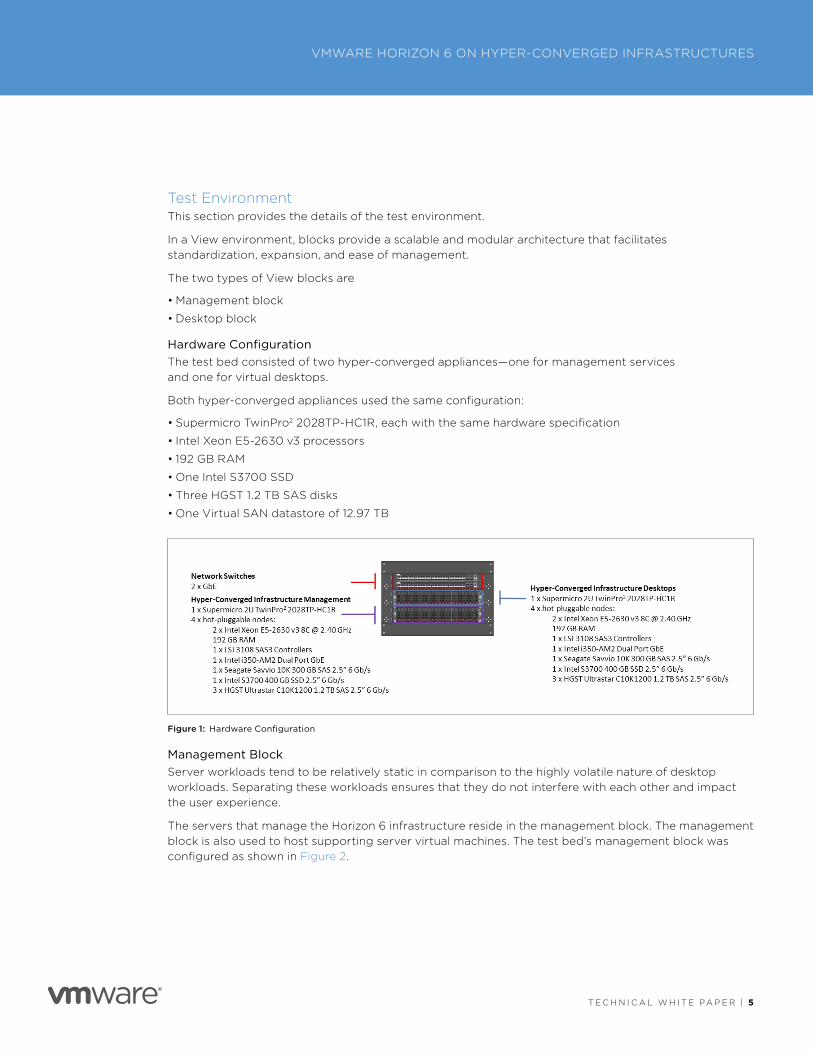
Hardware ConfigurationThe test bed consisted of two hyper-converged appliances—one for management services and one for virtual desktops .
Both hyper-converged appliances used the same configuration:
• Supermicro TwinPro2 2028TP-HC1R, each with the same hardware specification
• Intel Xeon E5-2630 v3 processors
• 192 GB RAM
• One Intel S3700 SSD
• Three HGST 1 .2 TB SAS disks
• One Virtual SAN datastore of 12 .97 TB
Figure 1: Hardware Configuration
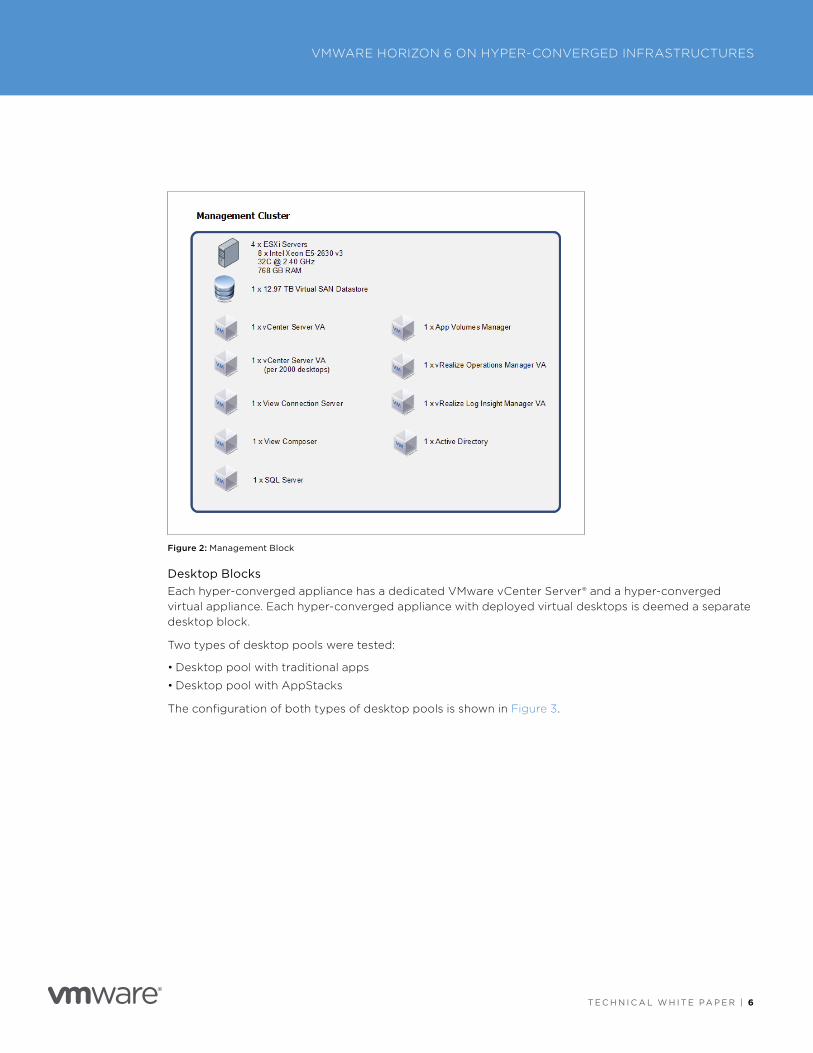
Management BlockServer workloads tend to be relatively static in comparison to the highly volatile nature of desktop workloads . Separating these workloads ensures that they do not interfere with each other and impact the user experience .
The servers that manage the Horizon 6 infrastructure reside in the management block . The management block is also used to host supporting server virtual machines . The test bed’s management block was configured as shown in Figure 2 .
T E C H N I C A L W H I T E PA P E R | 6
VMWARE HORIZON 6 ON HYPER-CONVERGED INFRASTRUCTURES
Figure 2: Management Block
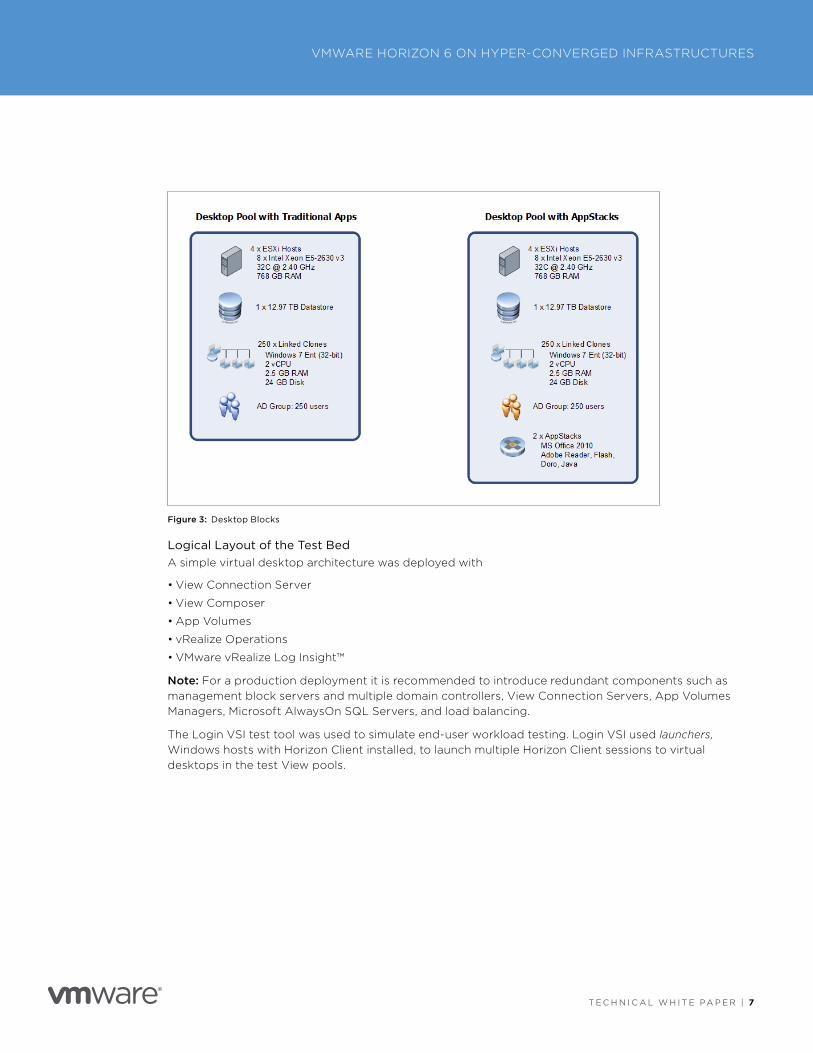
Desktop BlocksEach hyper-converged appliance has a dedicated VMware vCenter Server® and a hyper-converged virtual appliance . Each hyper-converged appliance with deployed virtual desktops is deemed a separate desktop block .
Two types of desktop pools were tested:
• Desktop pool with traditional apps
• Desktop pool with AppStacks
The configuration of both types of desktop pools is shown in Figure 3 .
T E C H N I C A L W H I T E PA P E R | 7
VMWARE HORIZON 6 ON HYPER-CONVERGED INFRASTRUCTURES
Figure 3: Desktop Blocks
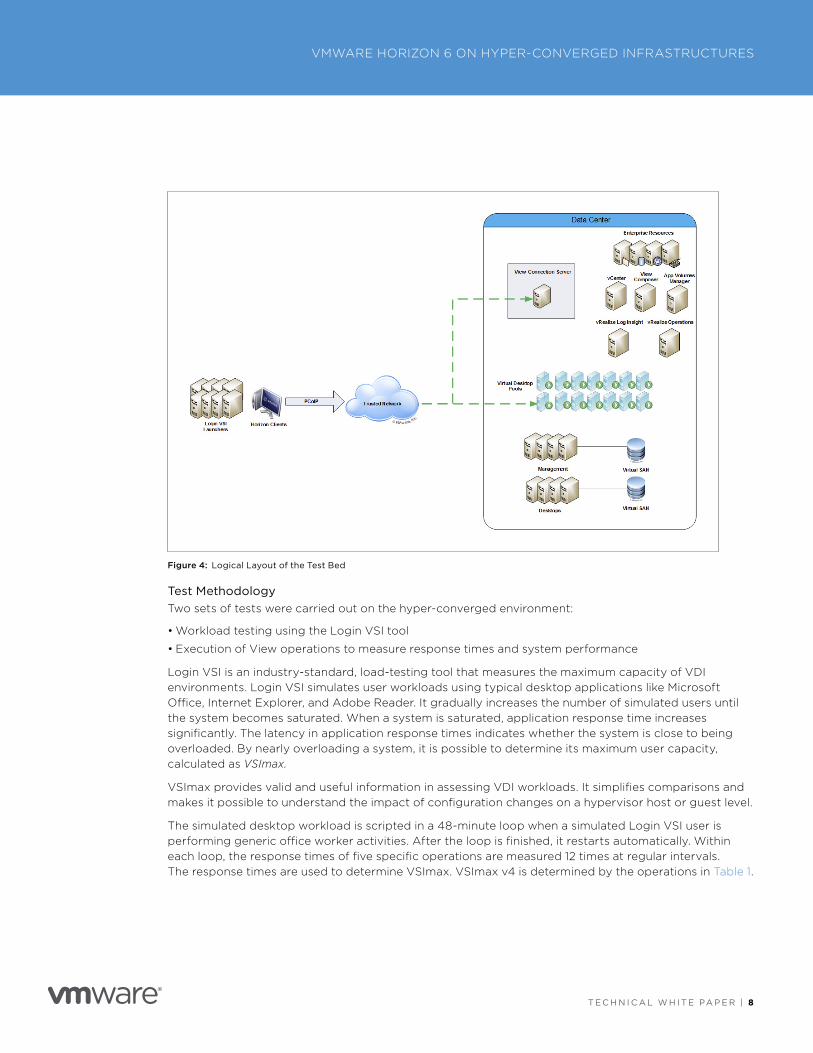
Logical Layout of the Test BedA simple virtual desktop architecture was deployed with
• View Connection Server
• View Composer
• App Volumes
• vRealize Operations
• VMware vRealize Log Insight™
Note: For a production deployment it is recommended to introduce redundant components such as management block servers and multiple domain controllers, View Connection Servers, App Volumes Managers, Microsoft AlwaysOn SQL Servers, and load balancing .
The Login VSI test tool was used to simulate end-user workload testing . Login VSI used launchers, Windows hosts with Horizon Client installed, to launch multiple Horizon Client sessions to virtual desktops in the test View pools .
T E C H N I C A L W H I T E PA P E R | 8
VMWARE HORIZON 6 ON HYPER-CONVERGED INFRASTRUCTURES
Figure 4: Logical Layout of the Test Bed
Test Methodology Two sets of tests were carried out on the hyper-converged environment:
• Workload testing using the Login VSI tool
• Execution of View operations to measure response times and system performance
Login VSI is an industry-standard, load-testing tool that measures the maximum capacity of VDI environments . Login VSI simulates user workloads using typical desktop applications like Microsoft Office, Internet Explorer, and Adobe Reader . It gradually increases the number of simulated users until the system becomes saturated . When a system is saturated, application response time increases significantly . The latency in application response times indicates whether the system is close to being overloaded . By nearly overloading a system, it is possible to determine its maximum user capacity, calculated as VSImax.
VSImax provides valid and useful information in assessing VDI workloads . It simplifies comparisons and makes it possible to understand the impact of configuration changes on a hypervisor host or guest level .
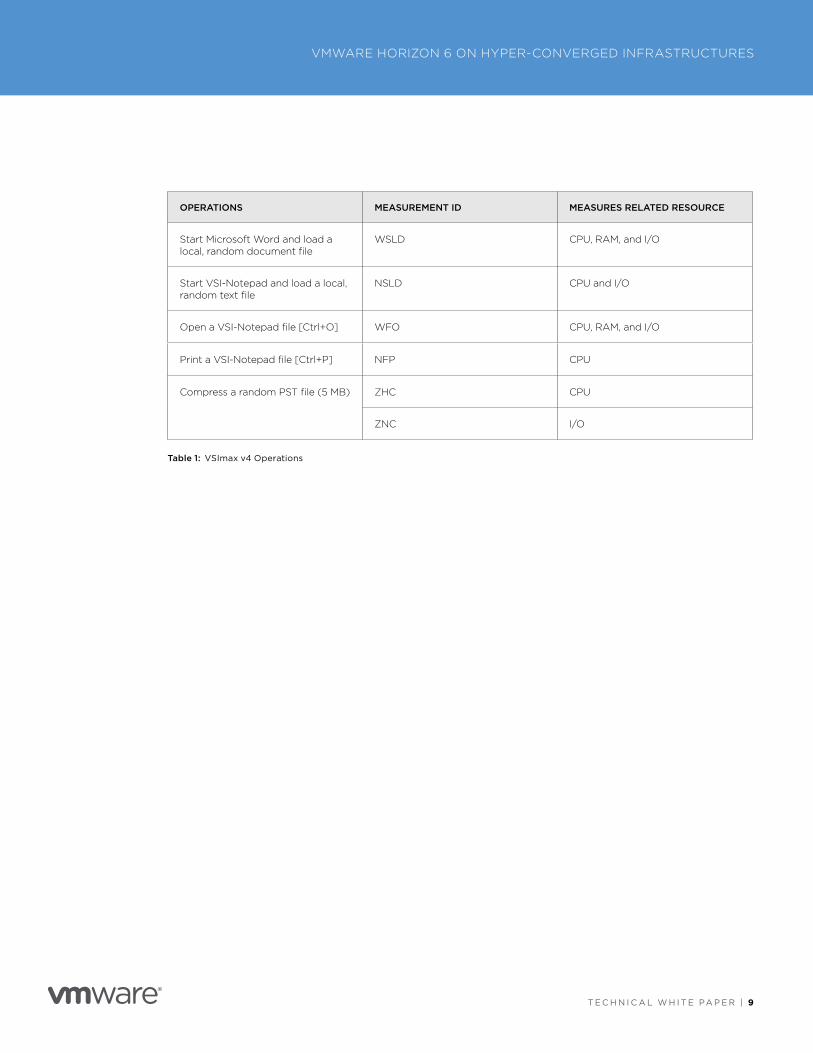
The simulated desktop workload is scripted in a 48-minute loop when a simulated Login VSI user is performing generic office worker activities . After the loop is finished, it restarts automatically . Within each loop, the response times of five specific operations are measured 12 times at regular intervals . The response times are used to determine VSImax . VSImax v4 is determined by the operations in Table 1 .
T E C H N I C A L W H I T E PA P E R | 9
VMWARE HORIZON 6 ON HYPER-CONVERGED INFRASTRUCTURES
OPERATIONS MEASUREMENT ID MEASURES RELATED RESOURCE
Start Microsoft Word and load a local, random document file
WSLD CPU, RAM, and I/O
Start VSI-Notepad and load a local, random text file
NSLD CPU and I/O
Open a VSI-Notepad file [Ctrl+O] WFO CPU, RAM, and I/O
Print a VSI-Notepad file [Ctrl+P] NFP CPU
Compress a random PST file (5 MB) ZHC CPU
ZNC I/O
Table 1: VSImax v4 Operations
T E C H N I C A L W H I T E PA P E R | 1 0
VMWARE HORIZON 6 ON HYPER-CONVERGED INFRASTRUCTURES
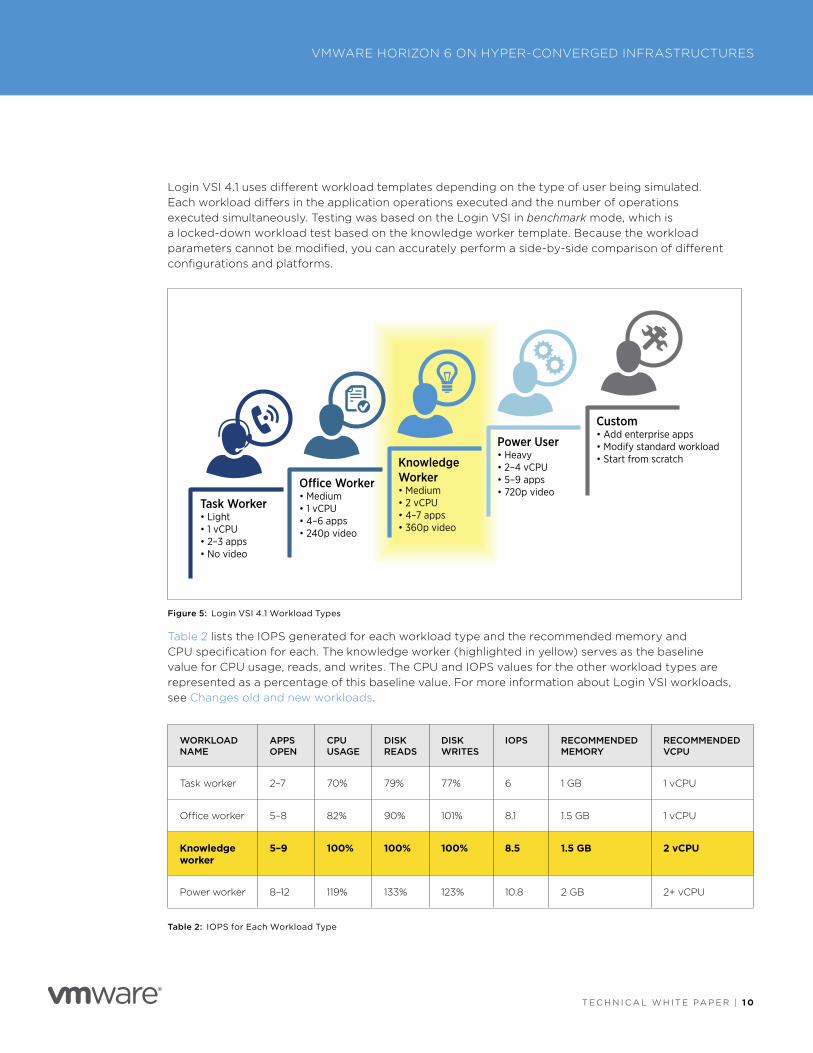
Login VSI 4 .1 uses different workload templates depending on the type of user being simulated . Each workload differs in the application operations executed and the number of operations executed simultaneously . Testing was based on the Login VSI in benchmark mode, which is a locked-down workload test based on the knowledge worker template . Because the workload parameters cannot be modified, you can accurately perform a side-by-side comparison of different configurations and platforms .
T E C H N I C A L W H I T E PA P E R | 1
4832 - WORKLOAD DIAGRAM
Task Worker• Light• 1 vCPU• 2–3 apps• No video
O�ce Worker• Medium• 1 vCPU• 4–6 apps• 240p video
Knowledge Worker• Medium• 2 vCPU• 4–7 apps• 360p video
Power User• Heavy• 2–4 vCPU• 5–9 apps• 720p video
Custom• Add enterprise apps• Modify standard workload• Start from scratch
Figure 5: Login VSI 4 .1 Workload Types
Table 2 lists the IOPS generated for each workload type and the recommended memory and CPU specification for each . The knowledge worker (highlighted in yellow) serves as the baseline value for CPU usage, reads, and writes . The CPU and IOPS values for the other workload types are represented as a percentage of this baseline value . For more information about Login VSI workloads, see Changes old and new workloads .
WORKLOAD NAME
APPS OPEN
CPU USAGE
DISK READS
DISK WRITES
IOPS RECOMMENDED MEMORY
RECOMMENDED VCPU
Task worker 2–7 70% 79% 77% 6 1 GB 1 vCPU
Office worker 5–8 82% 90% 101% 8 .1 1 .5 GB 1 vCPU
Knowledge worker
5–9 100% 100% 100% 8.5 1.5 GB 2 vCPU
Power worker 8–12 119% 133% 123% 10 .8 2 GB 2+ vCPU
Table 2: IOPS for Each Workload Type
T E C H N I C A L W H I T E PA P E R | 1 1
VMWARE HORIZON 6 ON HYPER-CONVERGED INFRASTRUCTURES
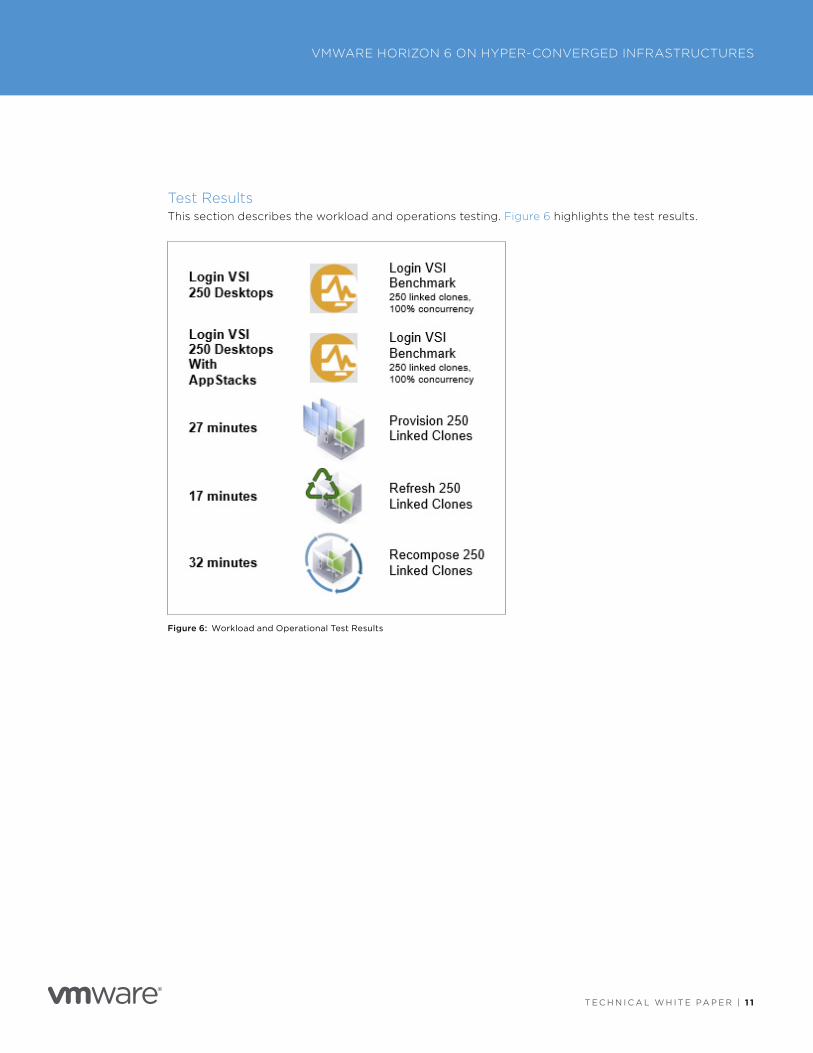
Test ResultsThis section describes the workload and operations testing . Figure 6 highlights the test results .
Figure 6: Workload and Operational Test Results
T E C H N I C A L W H I T E PA P E R | 1 2
VMWARE HORIZON 6 ON HYPER-CONVERGED INFRASTRUCTURES
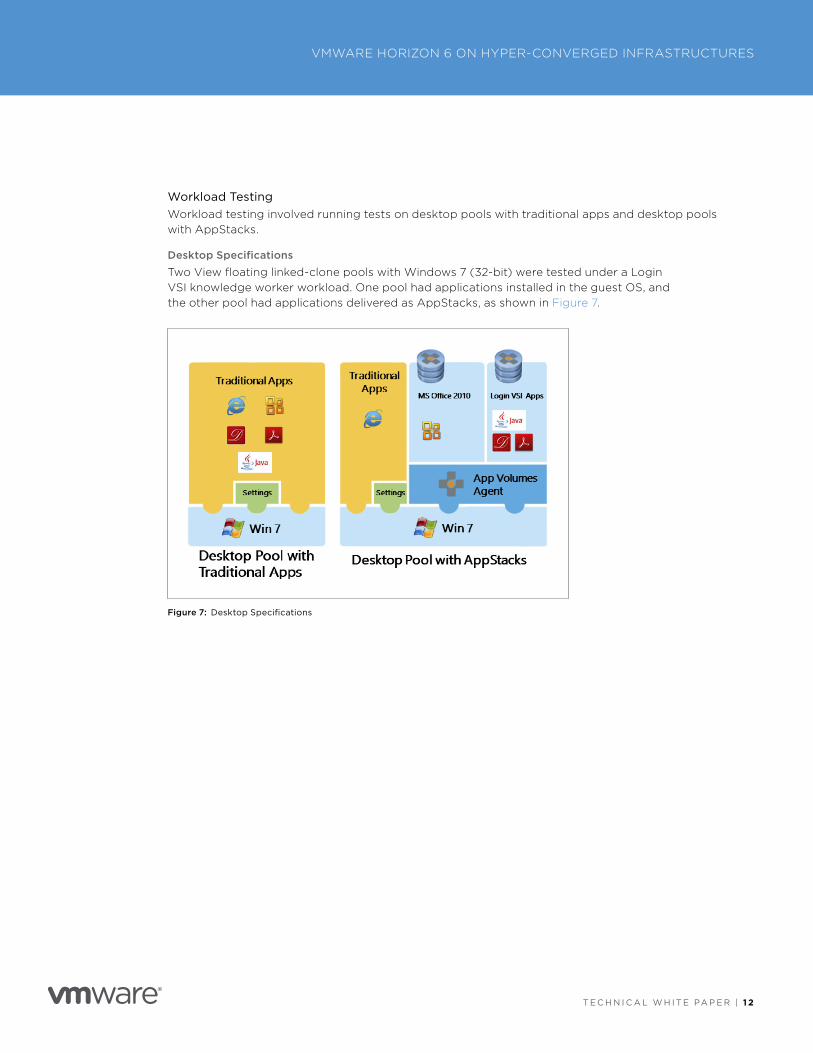
Workload TestingWorkload testing involved running tests on desktop pools with traditional apps and desktop pools with AppStacks .
Desktop Specifications
Two View floating linked-clone pools with Windows 7 (32-bit) were tested under a Login VSI knowledge worker workload . One pool had applications installed in the guest OS, and the other pool had applications delivered as AppStacks, as shown in Figure 7 .
Figure 7: Desktop Specifications
T E C H N I C A L W H I T E PA P E R | 1 3
VMWARE HORIZON 6 ON HYPER-CONVERGED INFRASTRUCTURES
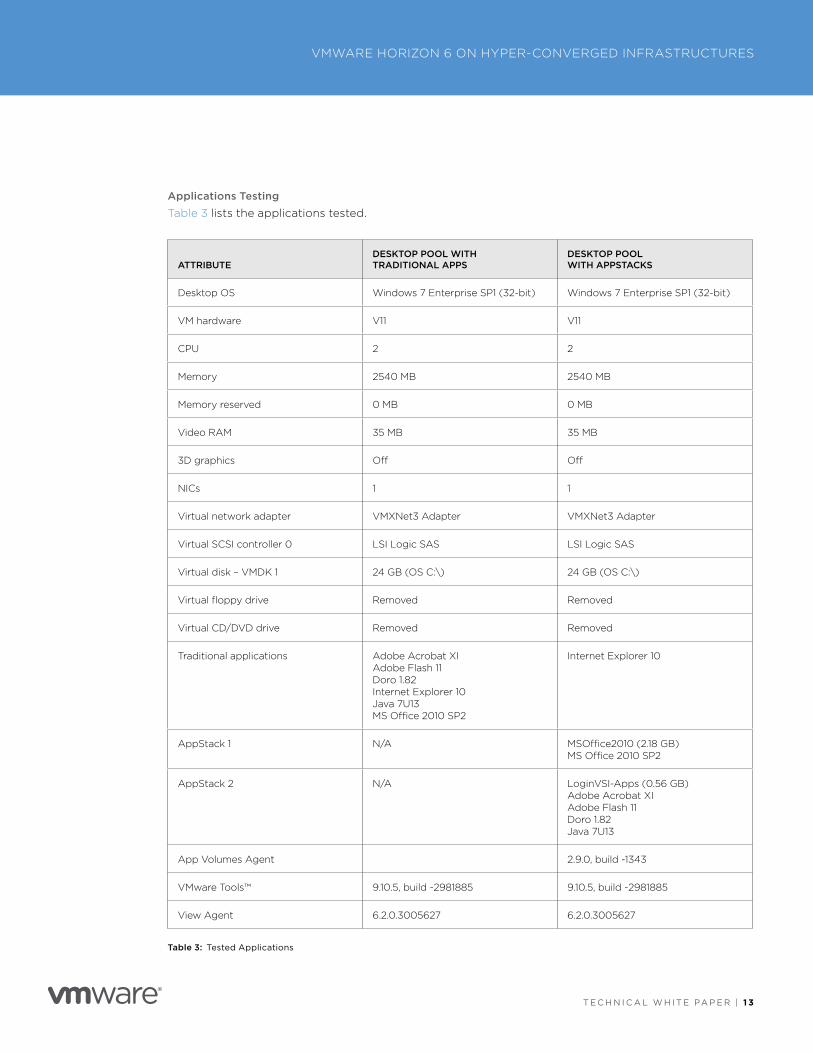
Applications Testing
Table 3 lists the applications tested .
ATTRIBUTE
DESKTOP POOL WITH TRADITIONAL APPS
DESKTOP POOL WITH APPSTACKS
Desktop OS Windows 7 Enterprise SP1 (32-bit) Windows 7 Enterprise SP1 (32-bit)
VM hardware V11 V11
CPU 2 2
Memory 2540 MB 2540 MB
Memory reserved 0 MB 0 MB
Video RAM 35 MB 35 MB
3D graphics Off Off
NICs 1 1
Virtual network adapter VMXNet3 Adapter VMXNet3 Adapter
Virtual SCSI controller 0 LSI Logic SAS LSI Logic SAS
Virtual disk – VMDK 1 24 GB (OS C:\) 24 GB (OS C:\)
Virtual floppy drive Removed Removed
Virtual CD/DVD drive Removed Removed
Traditional applications Adobe Acrobat XI Adobe Flash 11 Doro 1 .82 Internet Explorer 10 Java 7U13 MS Office 2010 SP2
Internet Explorer 10
AppStack 1 N/A MSOffice2010 (2 .18 GB) MS Office 2010 SP2
AppStack 2 N/A LoginVSI-Apps (0 .56 GB) Adobe Acrobat XI Adobe Flash 11 Doro 1 .82 Java 7U13
App Volumes Agent 2 .9 .0, build -1343
VMware Tools™ 9 .10 .5, build -2981885 9 .10 .5, build -2981885
View Agent 6 .2 .0 .3005627 6 .2 .0 .3005627
Table 3: Tested Applications
T E C H N I C A L W H I T E PA P E R | 1 4
VMWARE HORIZON 6 ON HYPER-CONVERGED INFRASTRUCTURES
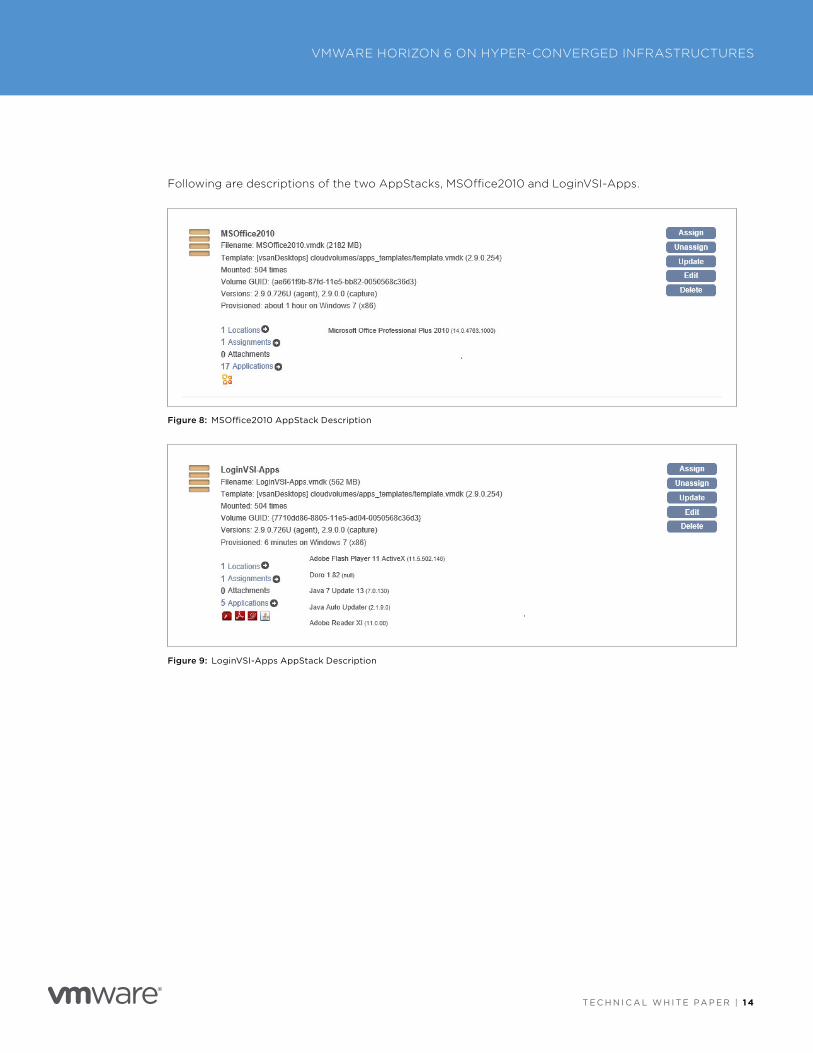
Following are descriptions of the two AppStacks, MSOffice2010 and LoginVSI-Apps .
Figure 8: MSOffice2010 AppStack Description
Figure 9: LoginVSI-Apps AppStack Description
T E C H N I C A L W H I T E PA P E R | 1 5
VMWARE HORIZON 6 ON HYPER-CONVERGED INFRASTRUCTURES
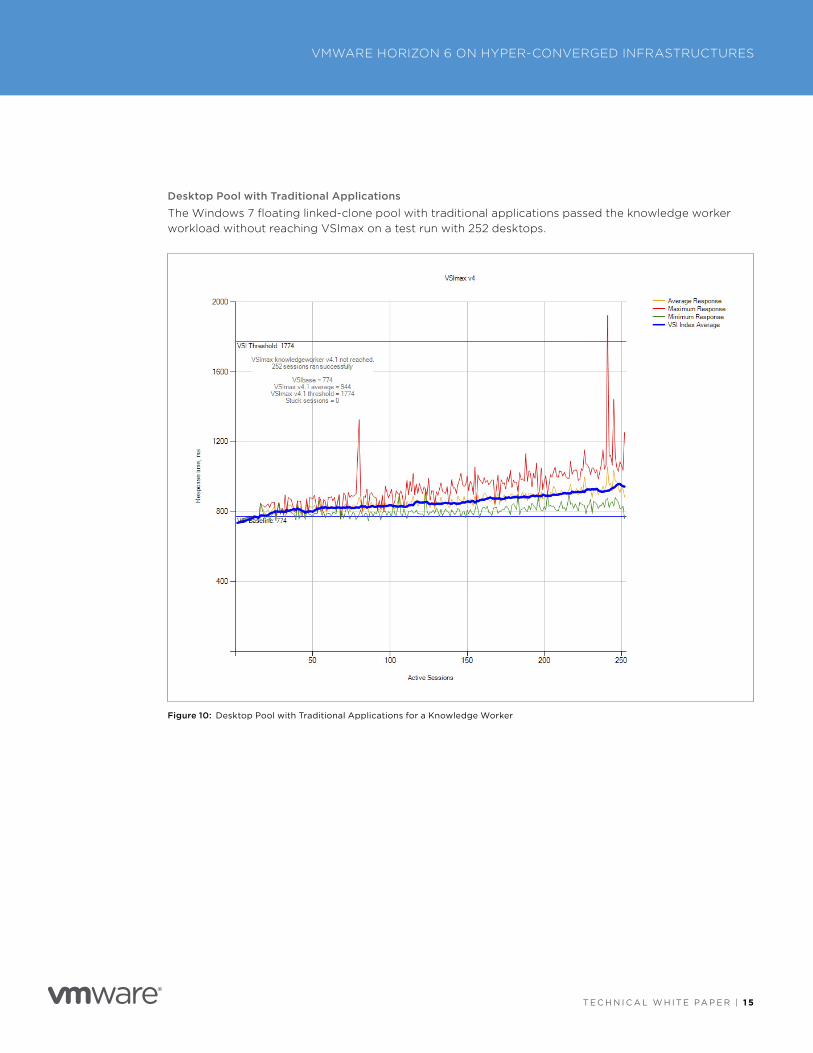
Desktop Pool with Traditional Applications
The Windows 7 floating linked-clone pool with traditional applications passed the knowledge worker workload without reaching VSImax on a test run with 252 desktops .
Figure 10: Desktop Pool with Traditional Applications for a Knowledge Worker
T E C H N I C A L W H I T E PA P E R | 1 6
VMWARE HORIZON 6 ON HYPER-CONVERGED INFRASTRUCTURES
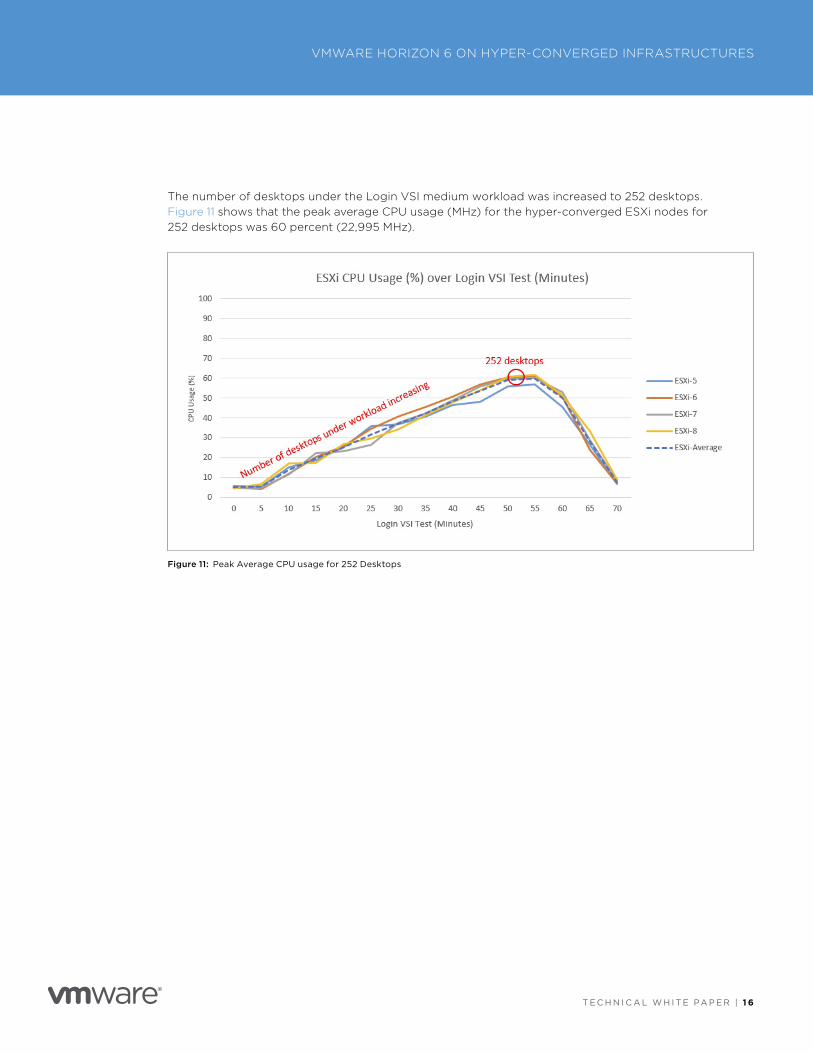
The number of desktops under the Login VSI medium workload was increased to 252 desktops . Figure 11 shows that the peak average CPU usage (MHz) for the hyper-converged ESXi nodes for 252 desktops was 60 percent (22,995 MHz) .
Figure 11: Peak Average CPU usage for 252 Desktops
T E C H N I C A L W H I T E PA P E R | 1 7
VMWARE HORIZON 6 ON HYPER-CONVERGED INFRASTRUCTURES
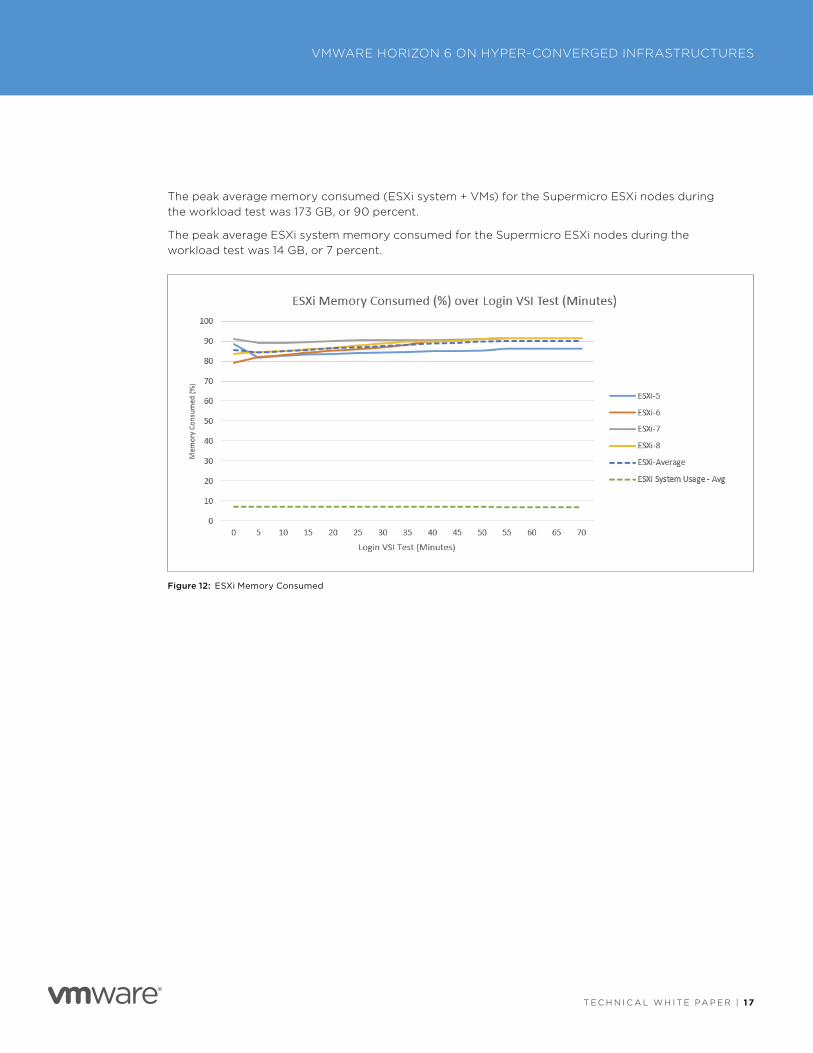
The peak average memory consumed (ESXi system + VMs) for the Supermicro ESXi nodes during the workload test was 173 GB, or 90 percent .
The peak average ESXi system memory consumed for the Supermicro ESXi nodes during the workload test was 14 GB, or 7 percent .
Figure 12: ESXi Memory Consumed
T E C H N I C A L W H I T E PA P E R | 1 8
VMWARE HORIZON 6 ON HYPER-CONVERGED INFRASTRUCTURES
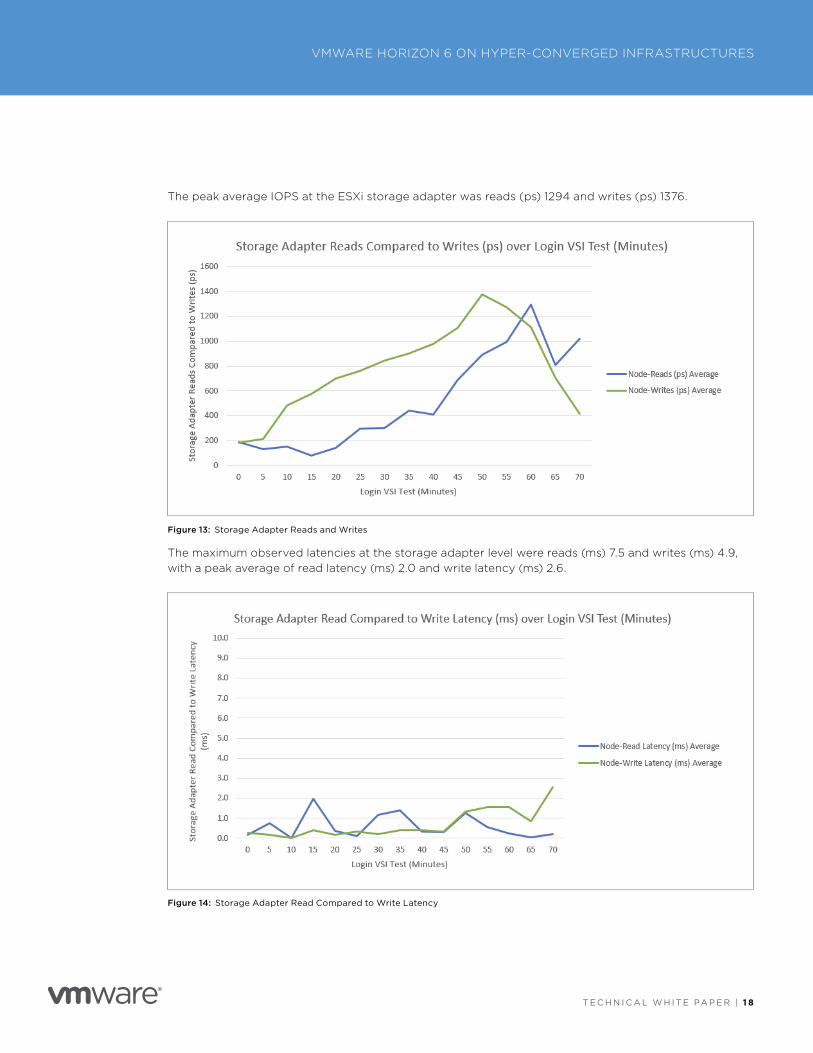
The peak average IOPS at the ESXi storage adapter was reads (ps) 1294 and writes (ps) 1376 .
Figure 13: Storage Adapter Reads and Writes
The maximum observed latencies at the storage adapter level were reads (ms) 7 .5 and writes (ms) 4 .9, with a peak average of read latency (ms) 2 .0 and write latency (ms) 2 .6 .
Figure 14: Storage Adapter Read Compared to Write Latency
T E C H N I C A L W H I T E PA P E R | 1 9
VMWARE HORIZON 6 ON HYPER-CONVERGED INFRASTRUCTURES
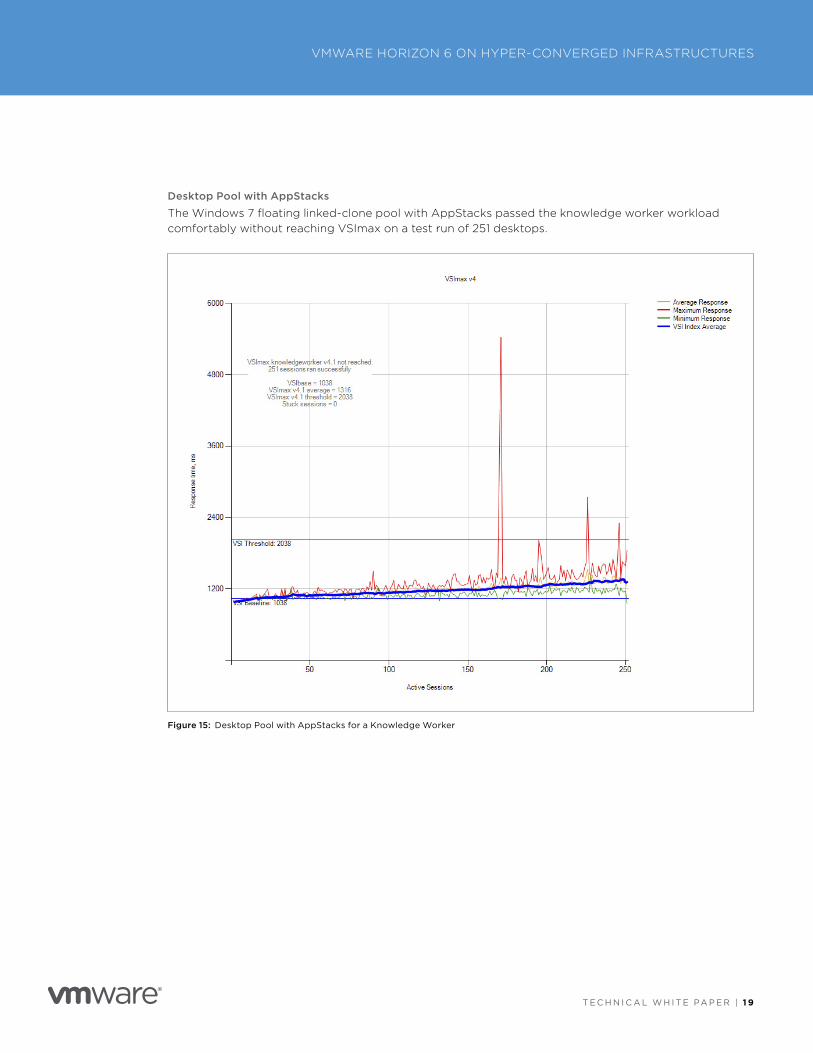
Desktop Pool with AppStacks
The Windows 7 floating linked-clone pool with AppStacks passed the knowledge worker workload comfortably without reaching VSImax on a test run of 251 desktops .
Figure 15: Desktop Pool with AppStacks for a Knowledge Worker
T E C H N I C A L W H I T E PA P E R | 2 0
VMWARE HORIZON 6 ON HYPER-CONVERGED INFRASTRUCTURES
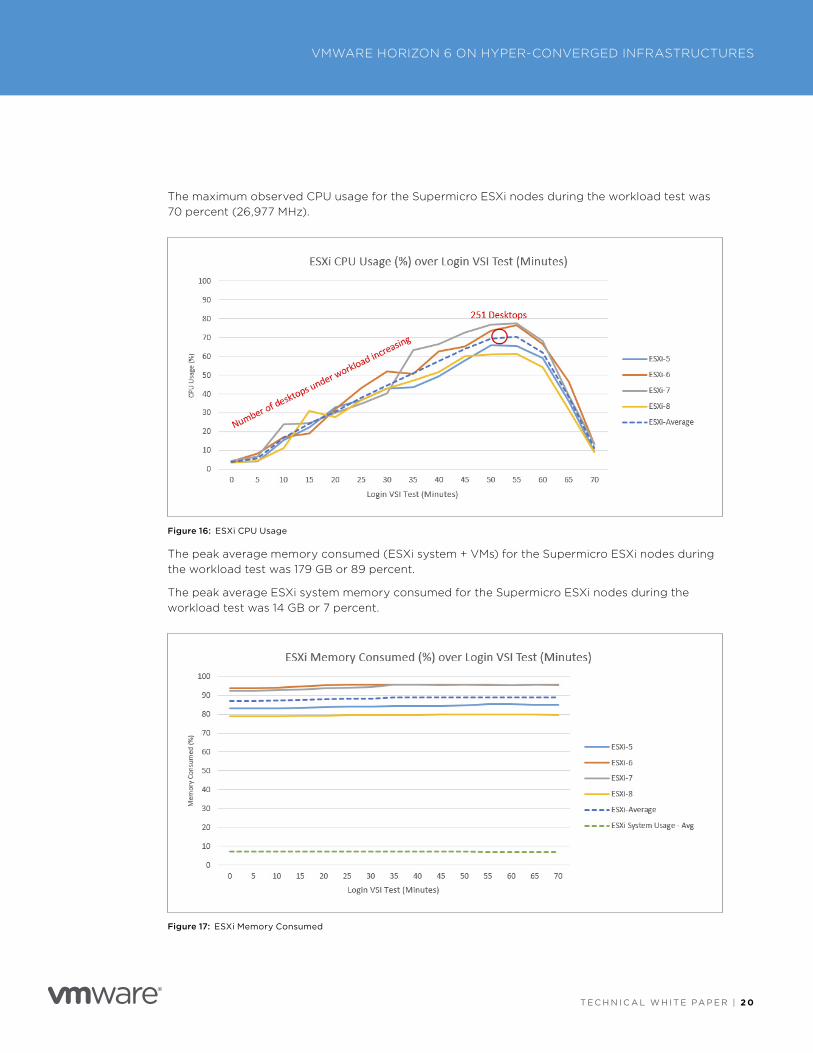
The maximum observed CPU usage for the Supermicro ESXi nodes during the workload test was 70 percent (26,977 MHz) .
Figure 16: ESXi CPU Usage
The peak average memory consumed (ESXi system + VMs) for the Supermicro ESXi nodes during the workload test was 179 GB or 89 percent .
The peak average ESXi system memory consumed for the Supermicro ESXi nodes during the workload test was 14 GB or 7 percent .
Figure 17: ESXi Memory Consumed
T E C H N I C A L W H I T E PA P E R | 2 1
VMWARE HORIZON 6 ON HYPER-CONVERGED INFRASTRUCTURES
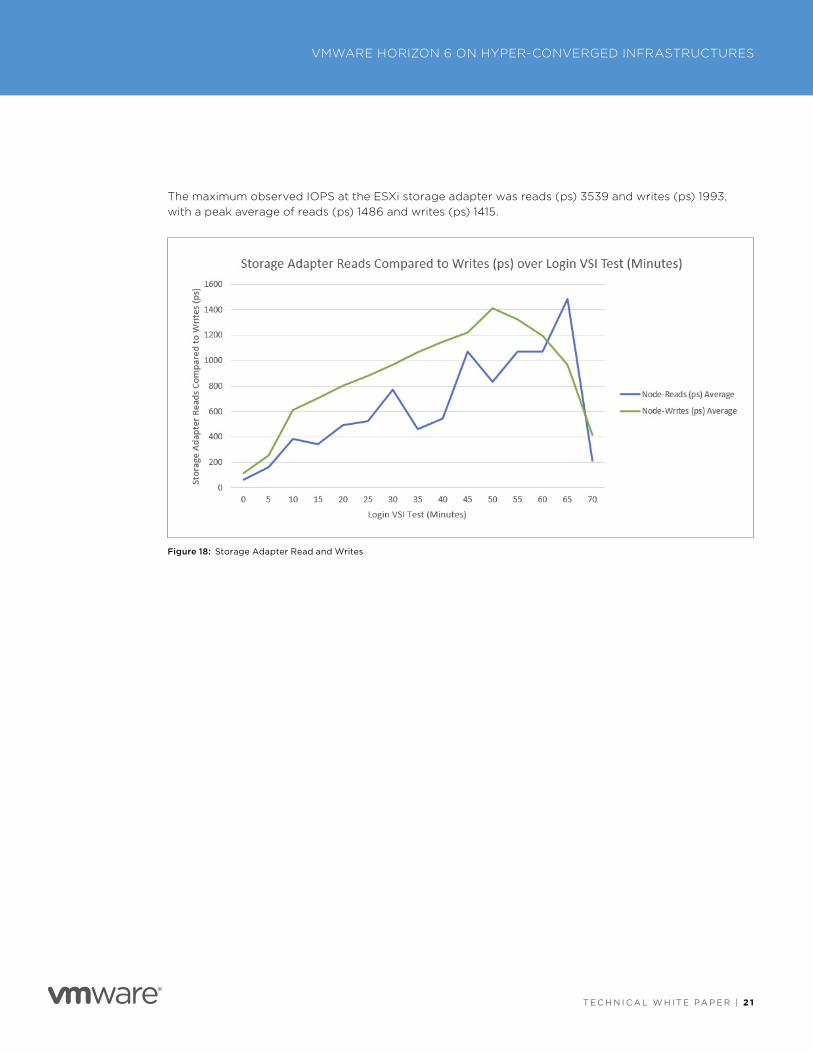
The maximum observed IOPS at the ESXi storage adapter was reads (ps) 3539 and writes (ps) 1993, with a peak average of reads (ps) 1486 and writes (ps) 1415 .
Figure 18: Storage Adapter Read and Writes
T E C H N I C A L W H I T E PA P E R | 2 2
VMWARE HORIZON 6 ON HYPER-CONVERGED INFRASTRUCTURES
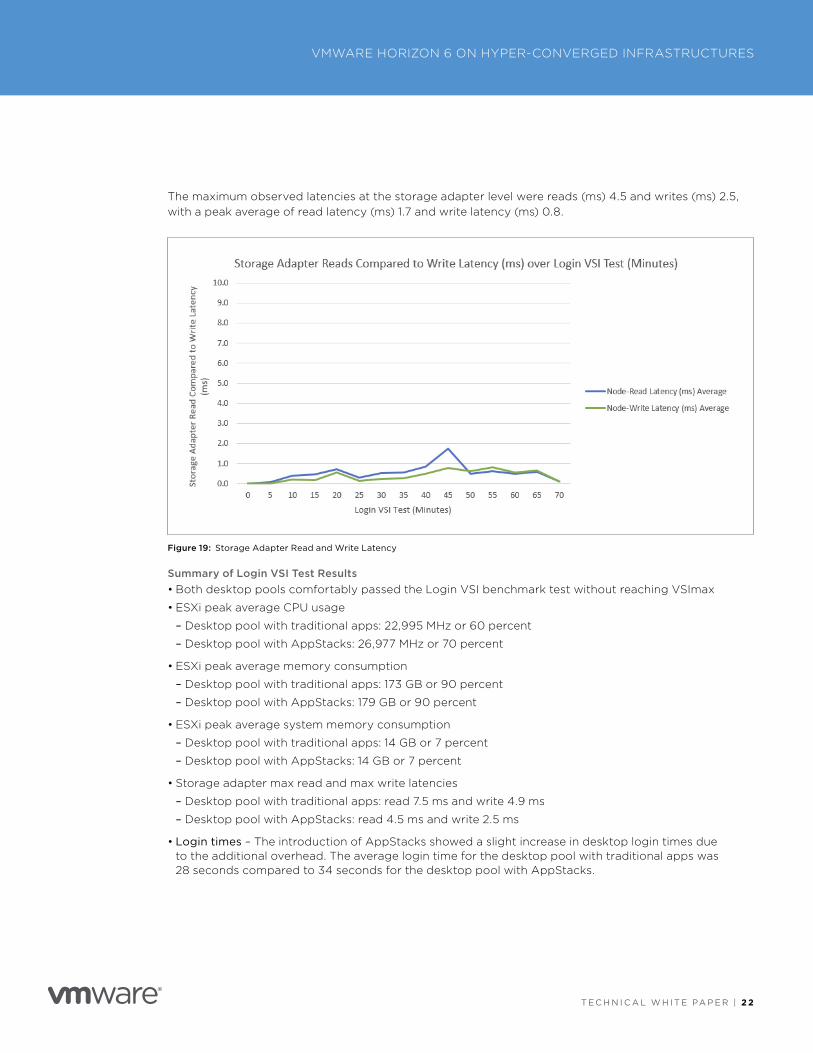
The maximum observed latencies at the storage adapter level were reads (ms) 4 .5 and writes (ms) 2 .5, with a peak average of read latency (ms) 1 .7 and write latency (ms) 0 .8 .
Figure 19: Storage Adapter Read and Write Latency
Summary of Login VSI Test Results• Both desktop pools comfortably passed the Login VSI benchmark test without reaching VSImax
• ESXi peak average CPU usage
– Desktop pool with traditional apps: 22,995 MHz or 60 percent
– Desktop pool with AppStacks: 26,977 MHz or 70 percent
• ESXi peak average memory consumption
– Desktop pool with traditional apps: 173 GB or 90 percent
– Desktop pool with AppStacks: 179 GB or 90 percent
• ESXi peak average system memory consumption
– Desktop pool with traditional apps: 14 GB or 7 percent
– Desktop pool with AppStacks: 14 GB or 7 percent
• Storage adapter max read and max write latencies
– Desktop pool with traditional apps: read 7 .5 ms and write 4 .9 ms
– Desktop pool with AppStacks: read 4 .5 ms and write 2 .5 ms
• Login times – The introduction of AppStacks showed a slight increase in desktop login times due to the additional overhead . The average login time for the desktop pool with traditional apps was 28 seconds compared to 34 seconds for the desktop pool with AppStacks .
T E C H N I C A L W H I T E PA P E R | 2 3
VMWARE HORIZON 6 ON HYPER-CONVERGED INFRASTRUCTURES
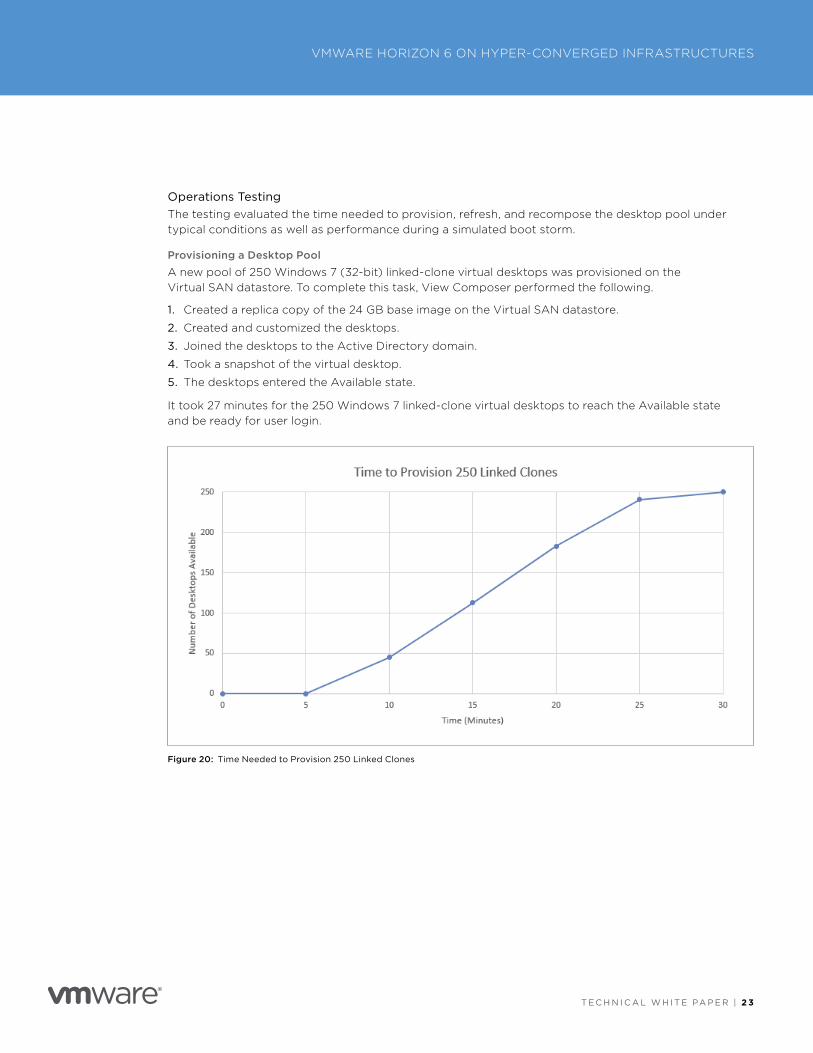
Operations TestingThe testing evaluated the time needed to provision, refresh, and recompose the desktop pool under typical conditions as well as performance during a simulated boot storm .
Provisioning a Desktop Pool
A new pool of 250 Windows 7 (32-bit) linked-clone virtual desktops was provisioned on the Virtual SAN datastore . To complete this task, View Composer performed the following .
1 . Created a replica copy of the 24 GB base image on the Virtual SAN datastore .
2 . Created and customized the desktops .
3 . Joined the desktops to the Active Directory domain .
4 . Took a snapshot of the virtual desktop .
5 . The desktops entered the Available state .
It took 27 minutes for the 250 Windows 7 linked-clone virtual desktops to reach the Available state and be ready for user login .
Figure 20: Time Needed to Provision 250 Linked Clones
T E C H N I C A L W H I T E PA P E R | 2 4
VMWARE HORIZON 6 ON HYPER-CONVERGED INFRASTRUCTURES
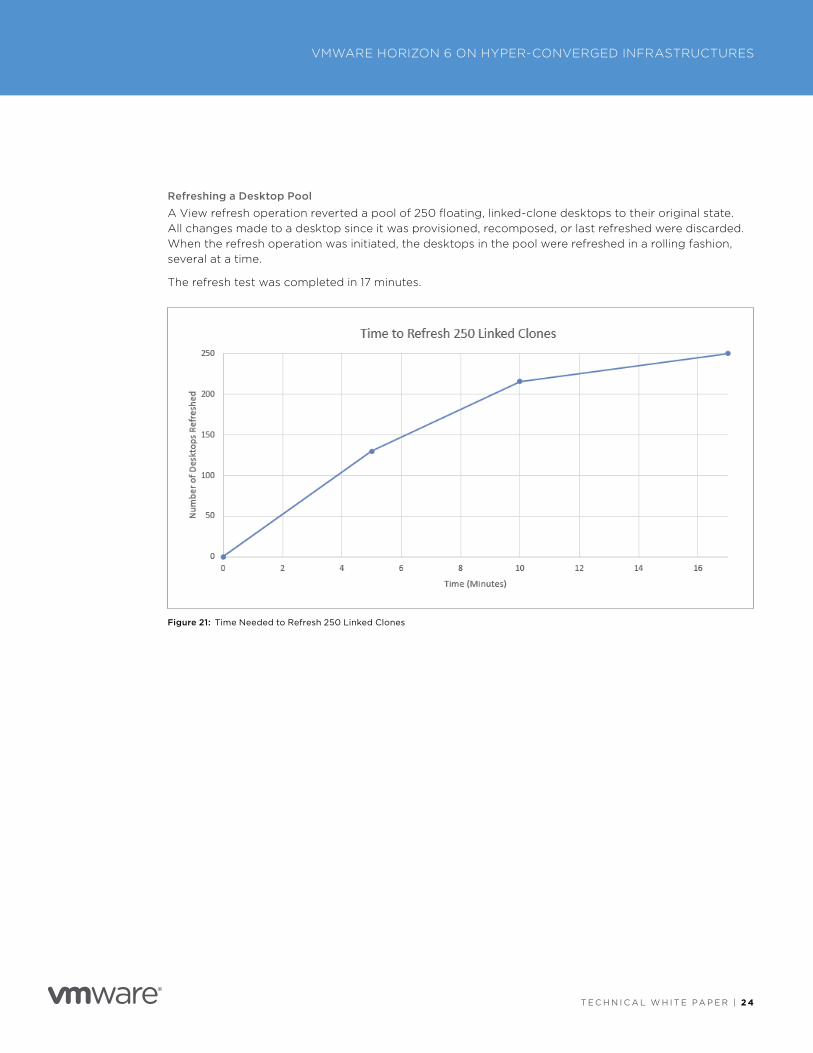
Refreshing a Desktop Pool
A View refresh operation reverted a pool of 250 floating, linked-clone desktops to their original state . All changes made to a desktop since it was provisioned, recomposed, or last refreshed were discarded . When the refresh operation was initiated, the desktops in the pool were refreshed in a rolling fashion, several at a time .
The refresh test was completed in 17 minutes .
Figure 21: Time Needed to Refresh 250 Linked Clones
T E C H N I C A L W H I T E PA P E R | 2 5
VMWARE HORIZON 6 ON HYPER-CONVERGED INFRASTRUCTURES
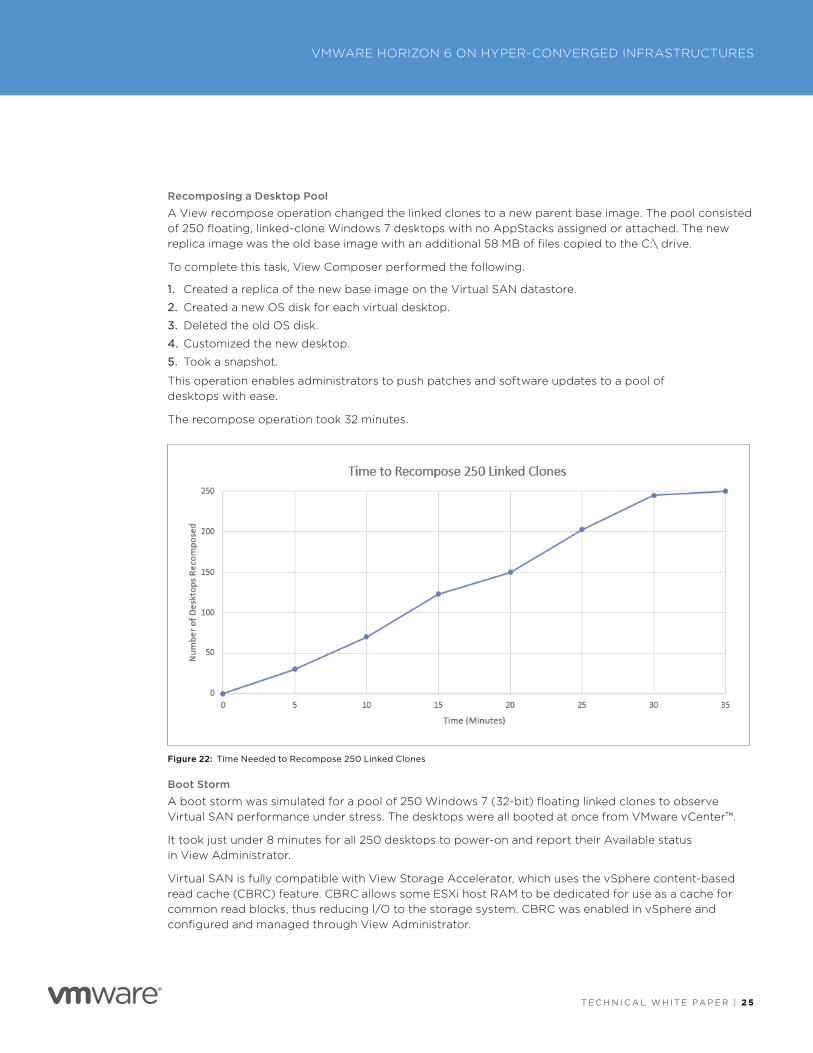
Recomposing a Desktop Pool
A View recompose operation changed the linked clones to a new parent base image . The pool consisted of 250 floating, linked-clone Windows 7 desktops with no AppStacks assigned or attached . The new replica image was the old base image with an additional 58 MB of files copied to the C:\ drive .
To complete this task, View Composer performed the following .
1 . Created a replica of the new base image on the Virtual SAN datastore .
2 . Created a new OS disk for each virtual desktop .
3 . Deleted the old OS disk .
4 . Customized the new desktop .
5 . Took a snapshot .
This operation enables administrators to push patches and software updates to a pool of desktops with ease .
The recompose operation took 32 minutes .
Figure 22: Time Needed to Recompose 250 Linked Clones
Boot Storm
A boot storm was simulated for a pool of 250 Windows 7 (32-bit) floating linked clones to observe Virtual SAN performance under stress . The desktops were all booted at once from VMware vCenter™ .
It took just under 8 minutes for all 250 desktops to power-on and report their Available status in View Administrator .
Virtual SAN is fully compatible with View Storage Accelerator, which uses the vSphere content-based read cache (CBRC) feature . CBRC allows some ESXi host RAM to be dedicated for use as a cache for common read blocks, thus reducing I/O to the storage system . CBRC was enabled in vSphere and configured and managed through View Administrator .
T E C H N I C A L W H I T E PA P E R | 2 6
VMWARE HORIZON 6 ON HYPER-CONVERGED INFRASTRUCTURES
ConfigurationThis section provides the configuration details for the hyper-converged appliance, networking, storage, and virtual machine management .
Hyper-Converged ApplianceThe hardware configuration for the two Supermicro 2U TwinPro2 2028TP-HC1R was
• 4 hot-pluggable nodes
• 2 Intel Xeon E5-2630 v3 8C @ 2 .40 GHz
• 192 GB RAM
• 1 LSI 3108 SAS3 controller
• 1 Intel i350-AM2 dual port GbE
• 1 Seagate Savvio 10 K 300 GB SAS 2 .5" 6 Gb/s
• 1 Intel S3700 400 GB SSD 2 .5" 6 Gb/s
• 3 HGST Ultrastar C10K1200 1 .2 TB SAS 2 .5" 6 Gb/s
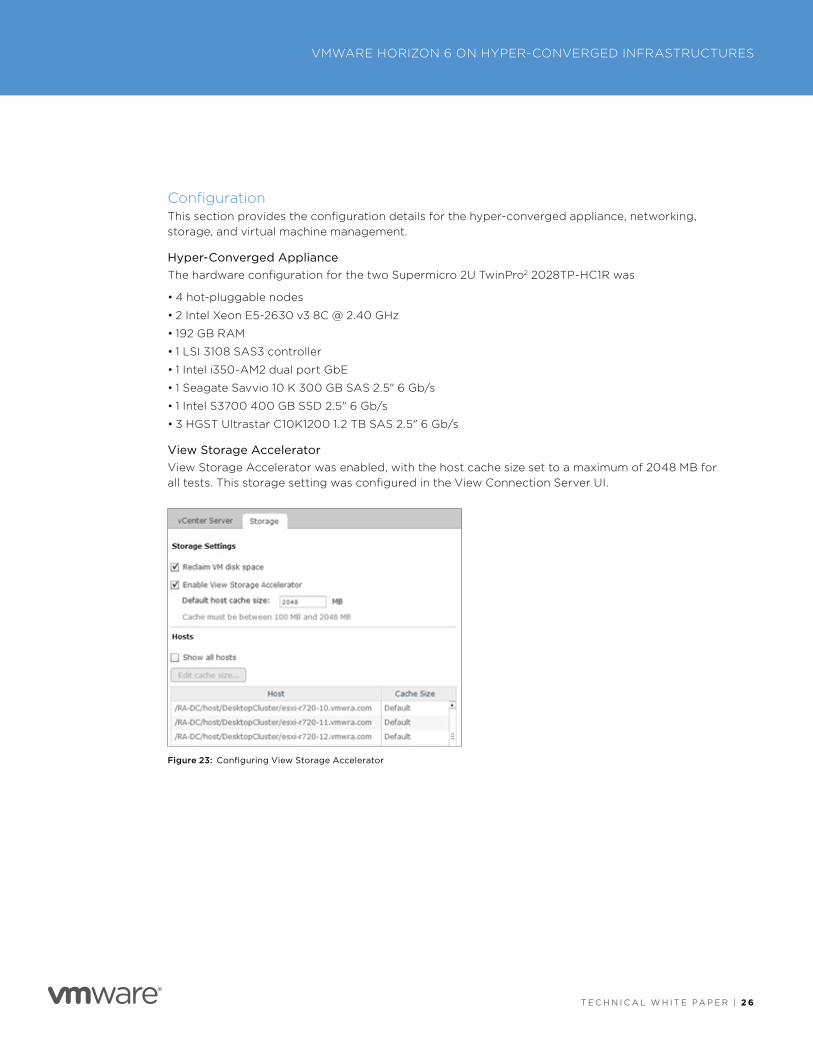
View Storage AcceleratorView Storage Accelerator was enabled, with the host cache size set to a maximum of 2048 MB for all tests . This storage setting was configured in the View Connection Server UI .
Figure 23: Configuring View Storage Accelerator
T E C H N I C A L W H I T E PA P E R | 2 7
VMWARE HORIZON 6 ON HYPER-CONVERGED INFRASTRUCTURES
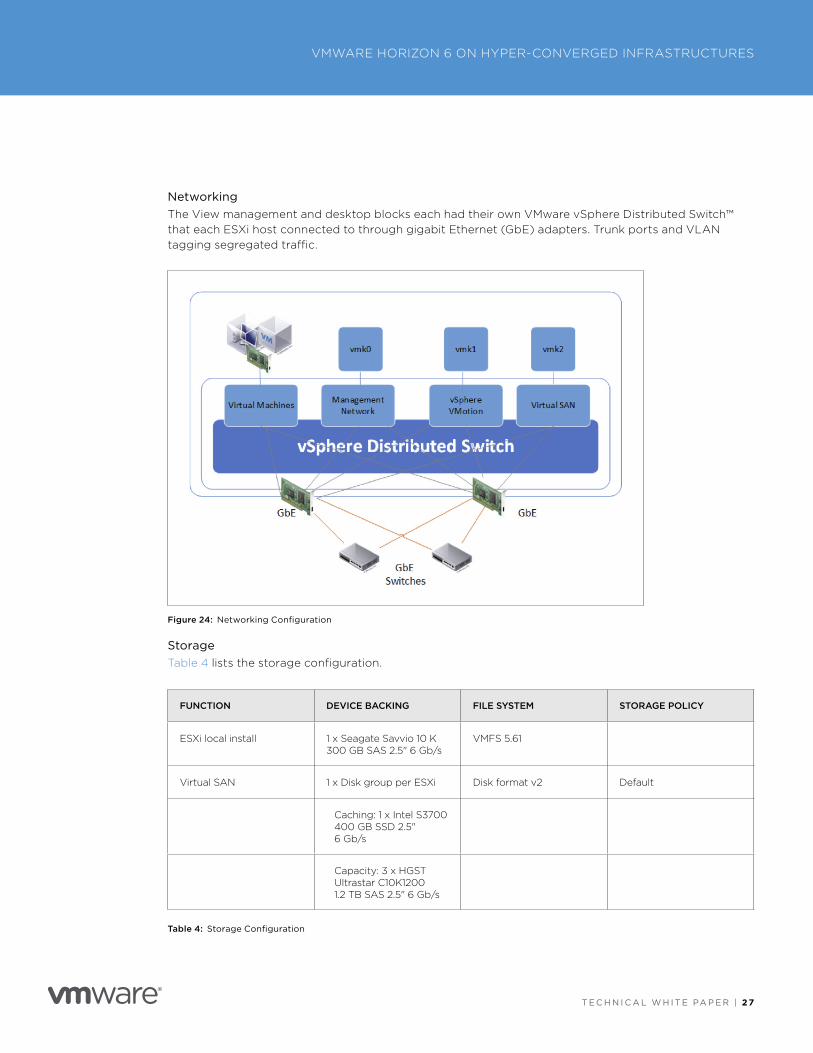
NetworkingThe View management and desktop blocks each had their own VMware vSphere Distributed Switch™ that each ESXi host connected to through gigabit Ethernet (GbE) adapters . Trunk ports and VLAN tagging segregated traffic .
Figure 24: Networking Configuration
StorageTable 4 lists the storage configuration .
FUNCTION DEVICE BACKING FILE SYSTEM STORAGE POLICY
ESXi local install 1 x Seagate Savvio 10 K 300 GB SAS 2 .5" 6 Gb/s
VMFS 5 .61
Virtual SAN 1 x Disk group per ESXi Disk format v2 Default
Caching: 1 x Intel S3700 400 GB SSD 2 .5" 6 Gb/s
Capacity: 3 x HGST Ultrastar C10K1200 1 .2 TB SAS 2 .5" 6 Gb/s
Table 4: Storage Configuration
T E C H N I C A L W H I T E PA P E R | 2 8
VMWARE HORIZON 6 ON HYPER-CONVERGED INFRASTRUCTURES
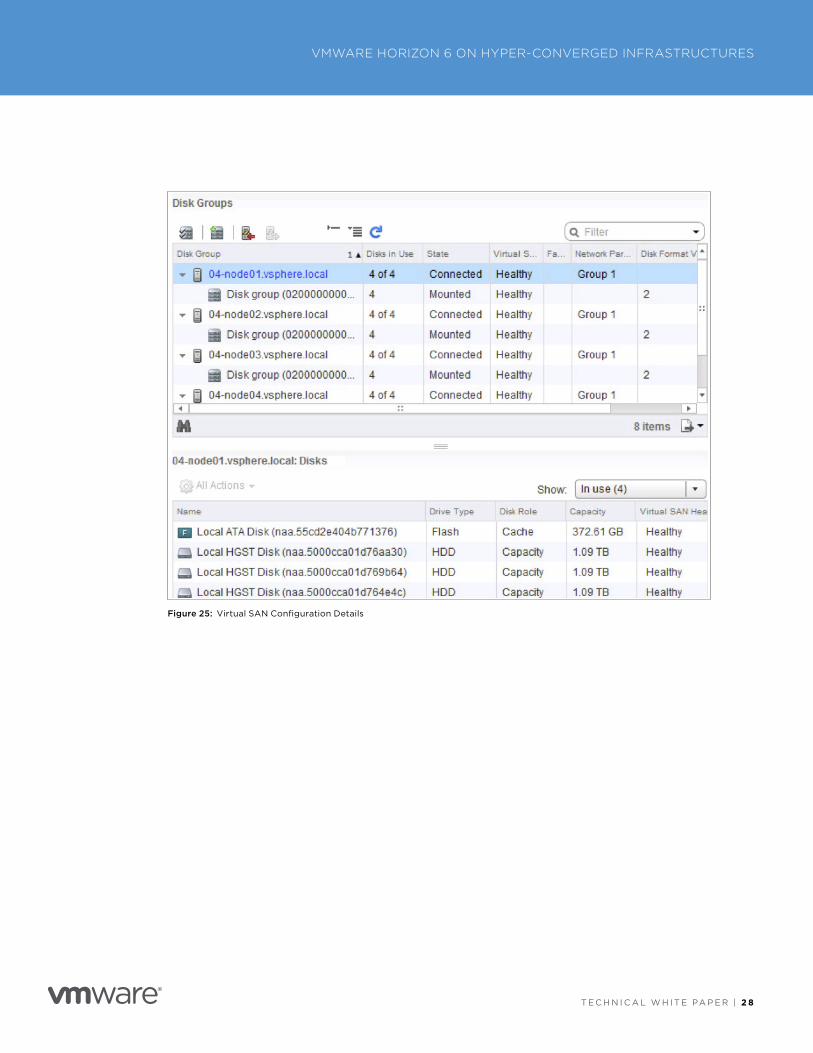
Figure 25: Virtual SAN Configuration Details
T E C H N I C A L W H I T E PA P E R | 2 9
VMWARE HORIZON 6 ON HYPER-CONVERGED INFRASTRUCTURES
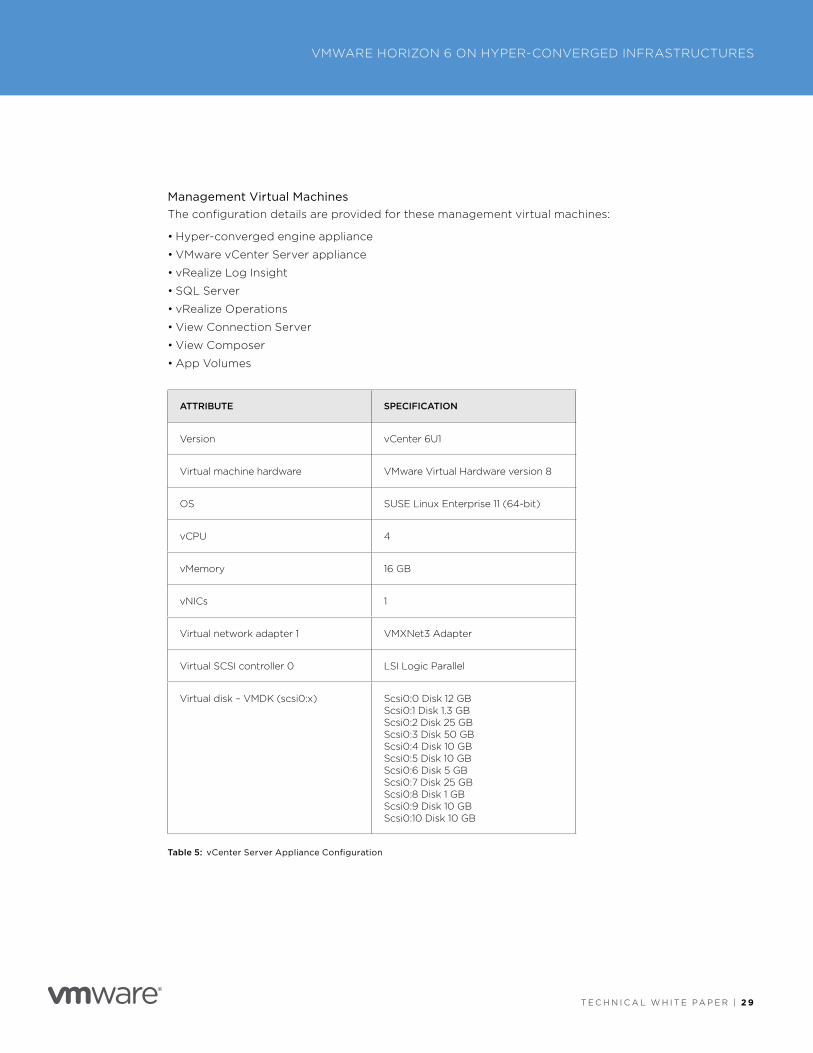
Management Virtual MachinesThe configuration details are provided for these management virtual machines:
• Hyper-converged engine appliance
• VMware vCenter Server appliance
• vRealize Log Insight
• SQL Server
• vRealize Operations
• View Connection Server
• View Composer
• App Volumes
ATTRIBUTE SPECIFICATION
Version vCenter 6U1
Virtual machine hardware VMware Virtual Hardware version 8
OS SUSE Linux Enterprise 11 (64-bit)
vCPU 4
vMemory 16 GB
vNICs 1
Virtual network adapter 1 VMXNet3 Adapter
Virtual SCSI controller 0 LSI Logic Parallel
Virtual disk – VMDK (scsi0:x) Scsi0:0 Disk 12 GB Scsi0:1 Disk 1 .3 GB Scsi0:2 Disk 25 GB Scsi0:3 Disk 50 GB Scsi0:4 Disk 10 GB Scsi0:5 Disk 10 GB Scsi0:6 Disk 5 GB Scsi0:7 Disk 25 GB Scsi0:8 Disk 1 GB Scsi0:9 Disk 10 GB Scsi0:10 Disk 10 GB
Table 5: vCenter Server Appliance Configuration
T E C H N I C A L W H I T E PA P E R | 3 0
VMWARE HORIZON 6 ON HYPER-CONVERGED INFRASTRUCTURES
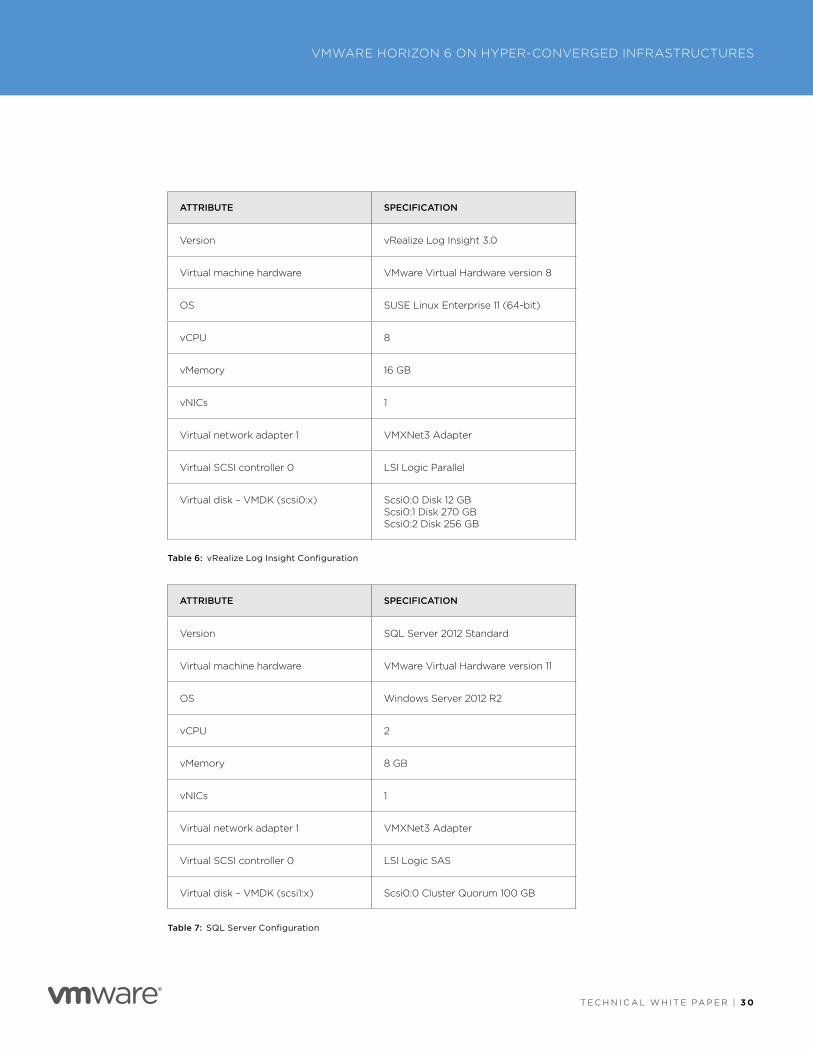
ATTRIBUTE SPECIFICATION
Version vRealize Log Insight 3 .0
Virtual machine hardware VMware Virtual Hardware version 8
OS SUSE Linux Enterprise 11 (64-bit)
vCPU 8
vMemory 16 GB
vNICs 1
Virtual network adapter 1 VMXNet3 Adapter
Virtual SCSI controller 0 LSI Logic Parallel
Virtual disk – VMDK (scsi0:x) Scsi0:0 Disk 12 GB Scsi0:1 Disk 270 GB Scsi0:2 Disk 256 GB
Table 6: vRealize Log Insight Configuration
ATTRIBUTE SPECIFICATION
Version SQL Server 2012 Standard
Virtual machine hardware VMware Virtual Hardware version 11
OS Windows Server 2012 R2
vCPU 2
vMemory 8 GB
vNICs 1
Virtual network adapter 1 VMXNet3 Adapter
Virtual SCSI controller 0 LSI Logic SAS
Virtual disk – VMDK (scsi1:x) Scsi0:0 Cluster Quorum 100 GB
Table 7: SQL Server Configuration
T E C H N I C A L W H I T E PA P E R | 3 1
VMWARE HORIZON 6 ON HYPER-CONVERGED INFRASTRUCTURES
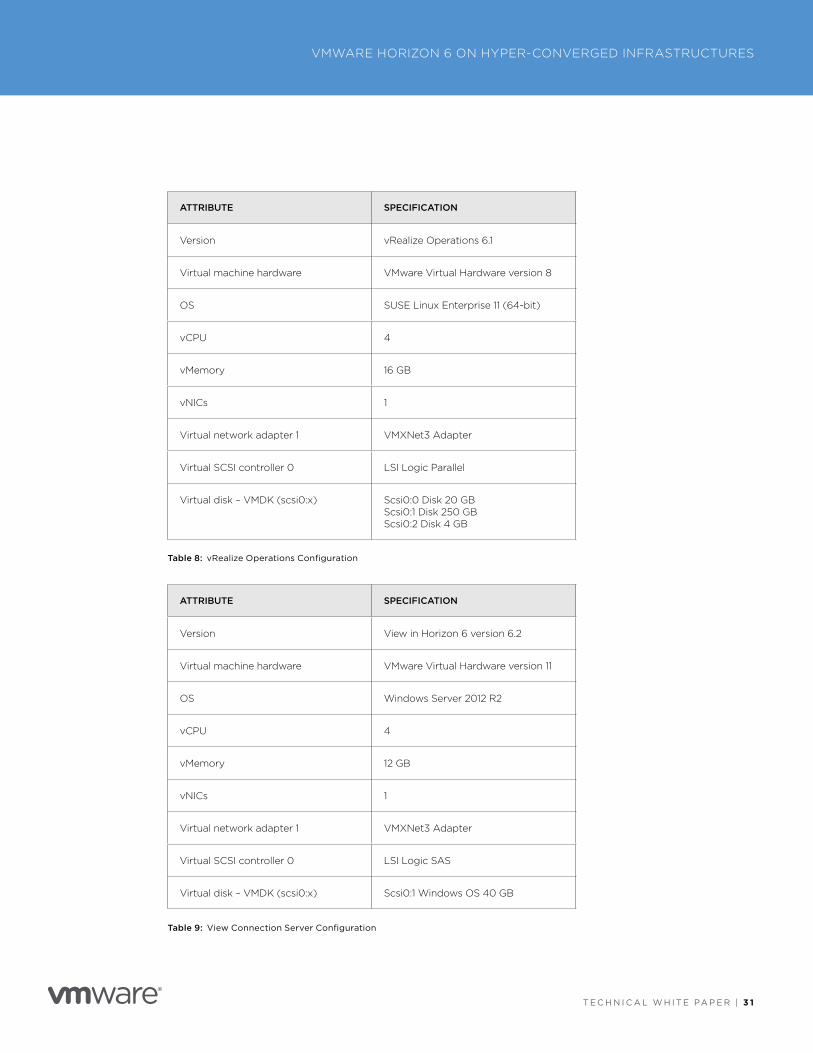
ATTRIBUTE SPECIFICATION
Version vRealize Operations 6 .1
Virtual machine hardware VMware Virtual Hardware version 8
OS SUSE Linux Enterprise 11 (64-bit)
vCPU 4
vMemory 16 GB
vNICs 1
Virtual network adapter 1 VMXNet3 Adapter
Virtual SCSI controller 0 LSI Logic Parallel
Virtual disk – VMDK (scsi0:x) Scsi0:0 Disk 20 GB Scsi0:1 Disk 250 GB Scsi0:2 Disk 4 GB
Table 8: vRealize Operations Configuration
ATTRIBUTE SPECIFICATION
Version View in Horizon 6 version 6 .2
Virtual machine hardware VMware Virtual Hardware version 11
OS Windows Server 2012 R2
vCPU 4
vMemory 12 GB
vNICs 1
Virtual network adapter 1 VMXNet3 Adapter
Virtual SCSI controller 0 LSI Logic SAS
Virtual disk – VMDK (scsi0:x) Scsi0:1 Windows OS 40 GB
Table 9: View Connection Server Configuration
T E C H N I C A L W H I T E PA P E R | 3 2
VMWARE HORIZON 6 ON HYPER-CONVERGED INFRASTRUCTURES
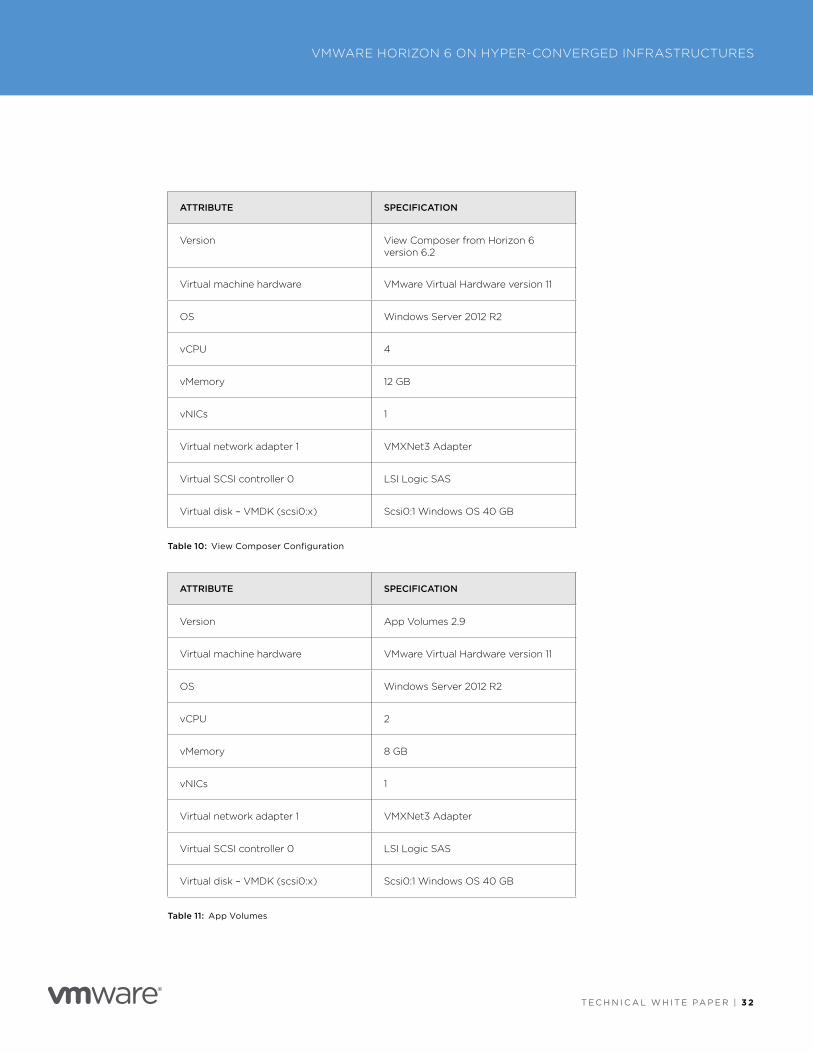
ATTRIBUTE SPECIFICATION
Version View Composer from Horizon 6 version 6 .2
Virtual machine hardware VMware Virtual Hardware version 11
OS Windows Server 2012 R2
vCPU 4
vMemory 12 GB
vNICs 1
Virtual network adapter 1 VMXNet3 Adapter
Virtual SCSI controller 0 LSI Logic SAS
Virtual disk – VMDK (scsi0:x) Scsi0:1 Windows OS 40 GB
Table 10: View Composer Configuration
ATTRIBUTE SPECIFICATION
Version App Volumes 2 .9
Virtual machine hardware VMware Virtual Hardware version 11
OS Windows Server 2012 R2
vCPU 2
vMemory 8 GB
vNICs 1
Virtual network adapter 1 VMXNet3 Adapter
Virtual SCSI controller 0 LSI Logic SAS
Virtual disk – VMDK (scsi0:x) Scsi0:1 Windows OS 40 GB
Table 11: App Volumes
T E C H N I C A L W H I T E PA P E R | 3 3
VMWARE HORIZON 6 ON HYPER-CONVERGED INFRASTRUCTURES
About the Author and ContributorThis paper was a collaborative effort of the End-User-Computing Technical-Marketing Center of Excellence team at VMware .
Donal Geary, Reference Architect Engineer, conducted the system architecture validation and performance testing for a hyper-converged infrastructure and wrote this white paper to present his findings .
Hilko Lantinga, EUC Architect, contributed additional technical review and information .
To comment on this paper, contact the VMware End-User-Computing Technical-Marketing Center of Excellence team at euc_tech_content_feedback@vmware .com .
Additional ResourcesHorizon 6
App Volumes
Horizon 6 Technical Resources
Supermicro TwinPro Solutions
T E C H N I C A L W H I T E PA P E R | 3 4
VMWARE HORIZON 6 ON HYPER-CONVERGED INFRASTRUCTURES
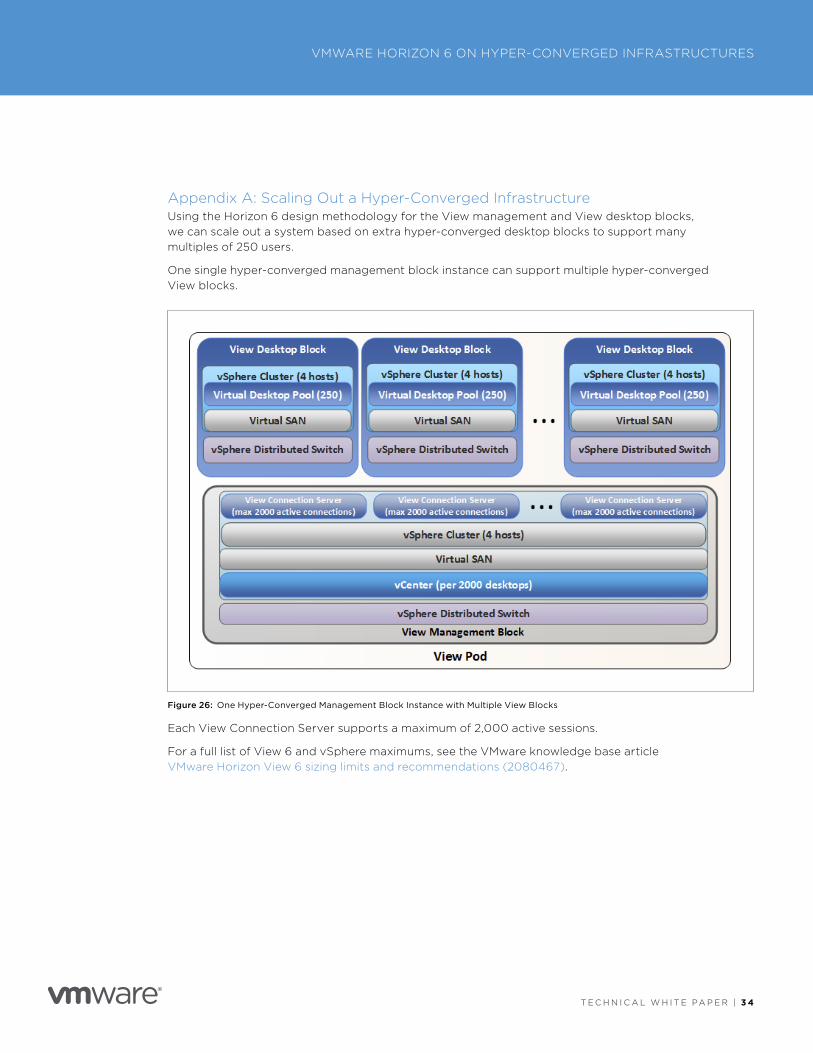
Appendix A: Scaling Out a Hyper-Converged Infrastructure Using the Horizon 6 design methodology for the View management and View desktop blocks, we can scale out a system based on extra hyper-converged desktop blocks to support many multiples of 250 users .
One single hyper-converged management block instance can support multiple hyper-converged View blocks .
Figure 26: One Hyper-Converged Management Block Instance with Multiple View Blocks
Each View Connection Server supports a maximum of 2,000 active sessions .
For a full list of View 6 and vSphere maximums, see the VMware knowledge base article VMware Horizon View 6 sizing limits and recommendations (2080467) .
VMware, Inc. 3401 Hillview Avenue Palo Alto CA 94304 USA Tel 877-486-9273 Fax 650-427-5001 www .vmware .comCopyright © 2016 VMware, Inc . All rights reserved . This product is protected by U .S . and international copyright and intellectual property laws . VMware products are covered by one or more patents listed at http://www .vmware .com/go/patents . VMware is a registered trademark or trademark of VMware, Inc . in the United States and/or other jurisdictions . All other marks and names mentioned herein may be trademarks of their respective companies . Item No: 4832-VMW-WP-HYPER-CONVERGED-INFRASTRUCTURE-USLET-20160907-WEB 9/16


