Voice of the American Shareholder Voice of the American Shareholder Quarterly Poll Quarterly Poll Prepared for: Prepared for: National Association of National Association of Investors Corporation (NAIC) Investors Corporation (NAIC) October 22, 2003 October 22, 2003 FINAL FINAL
Transcript
Voice of the American Shareholder Voice of the American Shareholder Quarterly PollQuarterly Poll
The National Association of Investors Corporation (NAIC) commissioned Harris Interactive to conduct a research study to better understand the attitudes and behaviors of American investors.
By regularly reporting on these findings, NAIC expects to capture the voice of an American shareholder.
Specifically, the survey focused on the following topics:
Investment profile, goals and strategy;
Views towards the economy and stock market;
Investment activity and decision-making, both on- and off-line;
Sources used for investment information; and
Attitudes about investing including enjoyment, confidence and knowledge.
4
Overview of Methodology
Sample includes 1,035 U.S. adults aged 18 or older who currently own individual stocks or stock mutual funds.
Interviewing was conducted between September 2 – 11, 2003.
The interview averaged 15 minutes in length.
All interviewing was conducted online using the Harris Poll Online (HPOL) database consisting of several million members who have agreed to participate in survey research.
5
Key HighlightsKey Highlights
6
Key Highlights
Shareholders are cautiously optimistic about the economy.
Shareholders are not a homogenous group and have mixed feelings about investing – while some enjoy it very much, and feel confident and knowledgeable, there is nearly an equal proportion that does not feel this way.
Shareholders are proactive about investing - both online and offline. In a typical three month period, almost everyone researches and tracks investments and over half make stock trades.
Financial professionals and the Internet are the most valuable sources of information to shareholders. Sources of information are considered most useful if they are easy to understand and accessible.
There is a significant gender gap between men and women – men enjoy investing more and are more confident, active, and knowledgeable than women.
7
Executive SummaryExecutive Summary
8
Executive SummaryExecutive Summary
Profile of a typical American shareholder
The American shareholder is part of a varied group that are not defined in just one way based on characteristics such as the investments they hold, when they started investing and their level of knowledge.
On average, a typical American shareholder has about $62,000 invested in individual stocks.
However, almost four out of ten (37%) have less than $5,000 invested in stocks; and
Twelve percent (12%) have more than $100,000 invested in stocks.
Shareholders began investing around age 30, with a minority (14%) who started later in life (that is, at age 45 or older).
In general, shareholders consider their investments as moderately risky and tend to hold onto their investments for about 8 years before selling their stocks.
Shareholders consider themselves moderately informed when it comes to their investment knowledge, and give themselves a grade of C+. However, about a third (34%) have more confidence and rate themselves with an A or B.
A typical shareholder is cautiously optimistic about the U.S. economy.
While nearly six out of ten (57%) shareholders have confidence in the direction of the economy, a substantial minority (43%) has little or no confidence.
Optimism in the stock market grows as shareholders look further into the future – over half (55%) of all shareholders believe the stock market will improve a year from today and just over three-quarters feel it will improve five years from today.
Optimists most commonly cite economic factors to demonstrate that things are improving; while pessimists most commonly cite political factors to show that things are not improving.
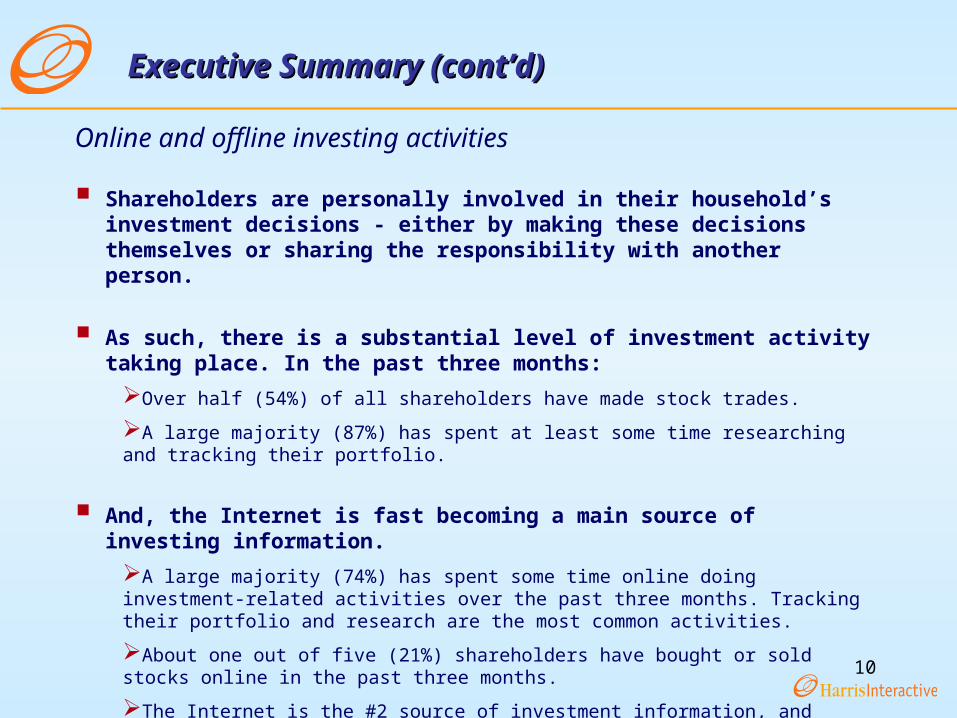
Shareholders are personally involved in their household’s investment decisions - either by making these decisions themselves or sharing the responsibility with another person.
As such, there is a substantial level of investment activity taking place. In the past three months:
Over half (54%) of all shareholders have made stock trades.
A large majority (87%) has spent at least some time researching and tracking their portfolio.
And, the Internet is fast becoming a main source of investing information.
A large majority (74%) has spent some time online doing investment-related activities over the past three months. Tracking their portfolio and research are the most common activities.
About one out of five (21%) shareholders have bought or sold stocks online in the past three months.
The Internet is the #2 source of investment information, and rivals newspapers and surpasses television and magazines as a top medium.
A majority feels that money should be conserved rather than spent, regardless of how much money they have.
However, shareholders are not homogeneous in their attitudes towards investing.
Nearly equal proportions of shareholders feel professionals can do a better job at investing as those who feel they are more capable than professionals are.
About a third truly enjoy investing while another third does not.
Nearly half feel satisfied with their portfolio’s performance while another three out of ten do not.
Differences among shareholders by gender and region
There is a significant gender gap between shareholders who are men and those who are women.
Men are more involved in investing activities than are women.
Men feel more confident about their investing abilities than do women.
Men feel more knowledgeable about investing than do women.
Men enjoy investing more than do women.
Shareholders across the four regions look fairly similar to each other although there are some differences.
Southern and Midwestern shareholders are more confident in the U.S. economy than those in the East or West are.
Southerners are more confident in their investment abilities than those in the East or West are.
Shareholders in the South are more likely to spend investment earnings if it is a smaller amount (but more likely to save if they earn a larger amount) than those in the East are.
14
Detailed FindingsDetailed Findings
15
WHO IS A TYPICAL SHAREHOLDER?
16
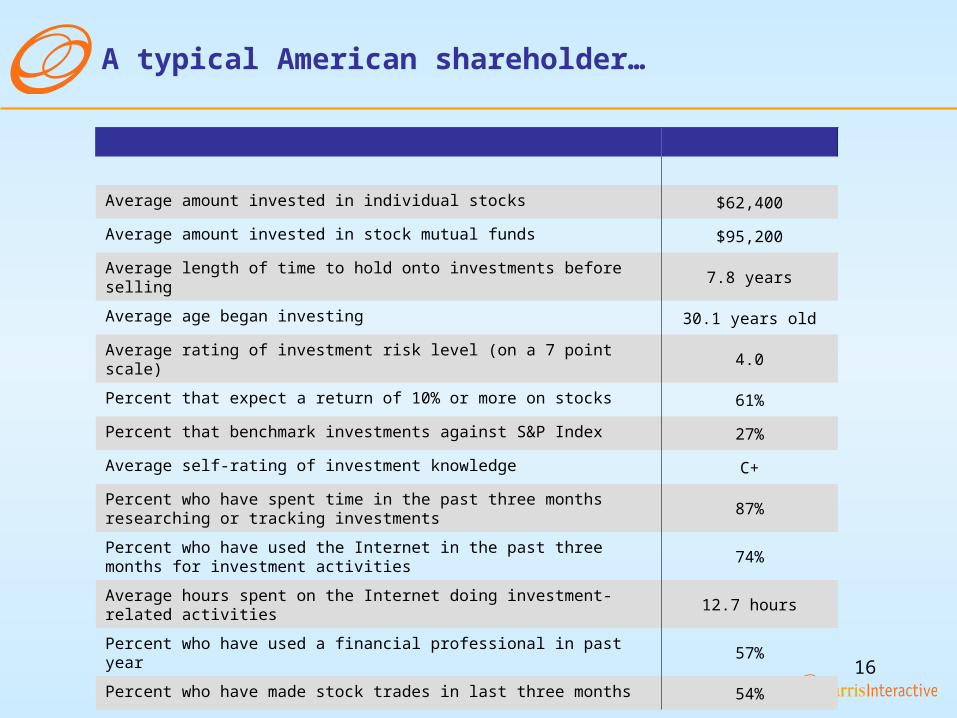
A typical American shareholder…
Average amount invested in individual stocks $62,400
Average amount invested in stock mutual funds $95,200
Average length of time to hold onto investments before selling 7.8 years
Average age began investing 30.1 years old
Average rating of investment risk level (on a 7 point scale) 4.0
Percent that expect a return of 10% or more on stocks 61%
Percent that benchmark investments against S&P Index 27%
Average self-rating of investment knowledge C+
Percent who have spent time in the past three months researching or tracking investments
87%
Percent who have used the Internet in the past three months for investment activities
74%
Average hours spent on the Internet doing investment-related activities 12.7 hours
Percent who have used a financial professional in past year 57%
Percent who have made stock trades in last three months 54%
17
Individual Stocks Stock Mutual Funds
% %
Less than $5,000 37 26
$5,000 - $9,999 13 8
$10,000 - $49,999 20 25
$50,000 - $99,999 8 11
More than $100,000 12 18
MEAN $62,400 $95,200
MEDIAN $6,000 $18,000
On average, shareholders have about $62,000 invested in individual stocks and $95,000 in stock mutual funds.
Total Amount Invested in Individual Stocks and Stock Mutual Funds
Q440: You mentioned that you have the following investments. About how much do you have invested in the following…?Base: Have individual stocks or stock mutual funds
*Note: The data displayed above does not include the percentage of respondents who gave a reply of “Decline to Answer” when asked about their individual stocks or stock mutual funds. These proportions are 10% and 12%, respectively.
18
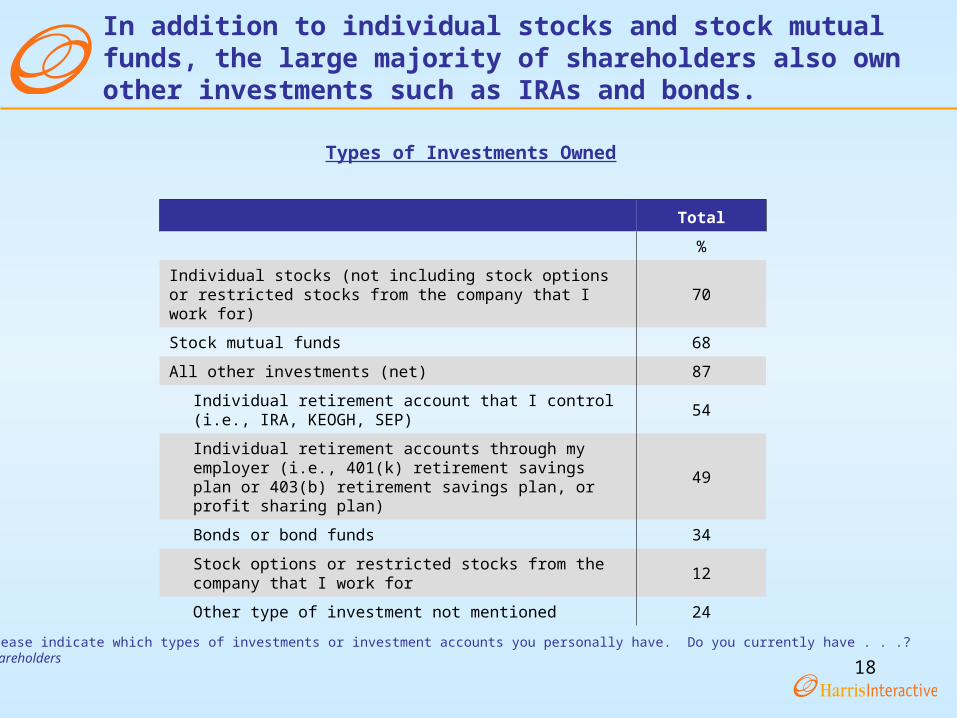
Q430: Please indicate which types of investments or investment accounts you personally have. Do you currently have . . .?Base: All shareholders
Total
%
Individual stocks (not including stock options or restricted stocks from the company that I work for)
70
Stock mutual funds 68
All other investments (net) 87
Individual retirement account that I control (i.e., IRA, KEOGH, SEP)
54
Individual retirement accounts through my employer (i.e., 401(k) retirement savings plan or 403(b) retirement savings plan, or profit sharing plan)
49
Bonds or bond funds 34
Stock options or restricted stocks from the company that I work for
12
Other type of investment not mentioned 24
In addition to individual stocks and stock mutual funds, the large majority of shareholders also own other investments such as IRAs and bonds.
Types of Investments Owned
19
F4%
D13%
C49%
B28%
A7%
Q710: Compared to other adults in the United States, how would you rate your overall investment knowledge?Base: All shareholders*Note: For this question, the mean was calculated after assigning a numeric value to each letter grade: A=5, B=4, C=3, D=2, F=1
On average, shareholders rate their investment knowledge as a C+.
Average Investment Knowledge Grade
MEAN = 3.2 (C+)
Overall Investment Knowledge Grade
20Q610: At what age did you start investing?Base: All shareholders
34%
33%
18%
14%
Less than 25years old
25-34 yearsold
35-44 yearsold
45+
15%
19%
15%
12%
38%
5 years or less
6-10 years
11-15 years
16-20 years
More than 20years
MEAN = 30.1 yearsMEDIAN = 28 years
MEAN = 18.8 yearsMEDIAN = 16 years
Age Started Investing Total Number of Years Involved in Investing
Shareholders began investing around age 30 and have been involved in investing for about 19 years.
21
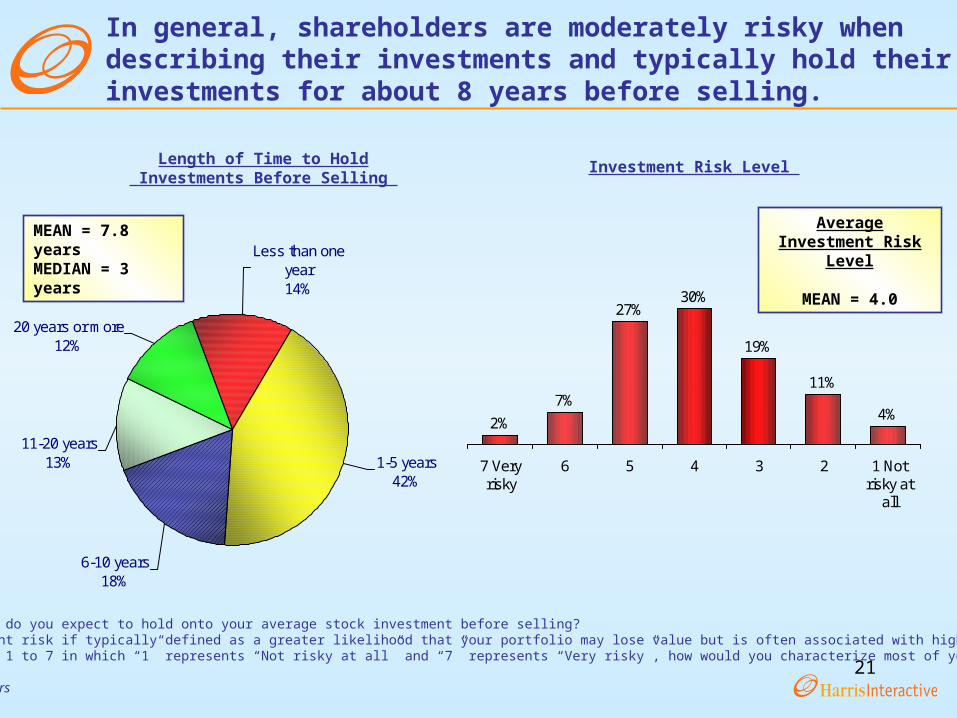
20 years or more12%
11-20 years13%
6-10 years18%
1-5 years42%
Less than one year14%
Q625: How long do you expect to hold onto your average stock investment before selling?Q615: Investment risk if typically defined as a greater likelihood that your portfolio may lose value but is often associated with higher returns. On a scale from 1 to 7 in which “1” represents “Not risky at all” and “7” represents “Very risky”, how would you characterize most of your investments?Base: All shareholders
In general, shareholders are moderately risky when describing their investments and typically hold their investments for about 8 years before selling.
Length of Time to Hold Investments Before Selling
MEAN = 7.8 yearsMEDIAN = 3 years
2%
7%
27%30%
19%
11%
4%
7 Veryrisky
6 5 4 3 2 1 Notrisky at
all
Investment Risk Level
Average Investment Risk Level
MEAN = 4.0
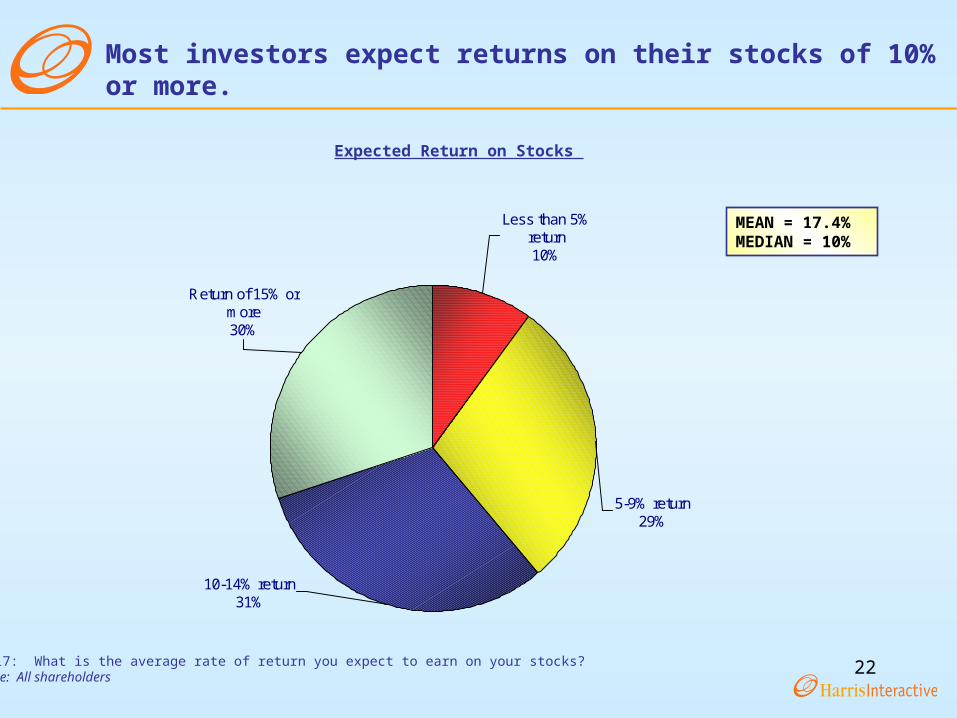
22Q617: What is the average rate of return you expect to earn on your stocks?Base: All shareholders
Most investors expect returns on their stocks of 10% or more.
MEAN = 17.4%MEDIAN = 10%
Expected Return on Stocks
Return of 15% or more30%
10-14% return31%
5-9% return29%
Less than 5% return10%
23
No73%
Yes27%
Q620: Do you benchmark your investments against the S & P 500 index?Base: All shareholders
Just over a quarter of shareholders benchmark their investments against the S&P 500 Index.
Whether Benchmark Investments Against S&P 500 Index
24
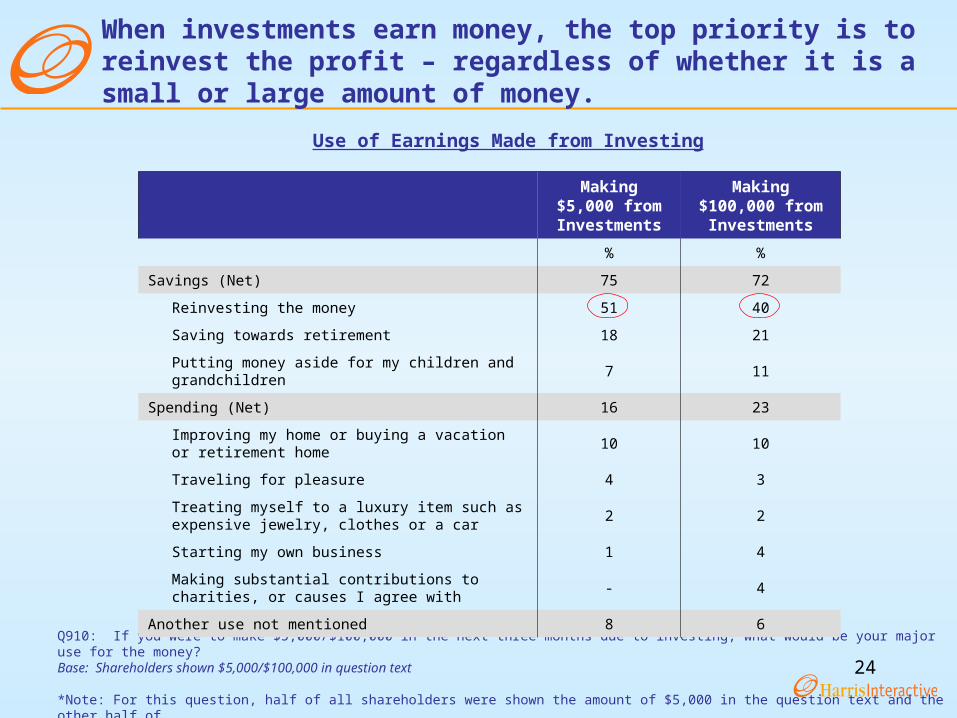
Q910: If you were to make $5,000/$100,000 in the next three months due to investing, what would be your major use for the money?Base: Shareholders shown $5,000/$100,000 in question text
*Note: For this question, half of all shareholders were shown the amount of $5,000 in the question text and the other half of shareholders shown $100,000.
Making$5,000 from Investments
Making$100,000 from Investments
% %
Savings (Net) 75 72
Reinvesting the money 51 40
Saving towards retirement 18 21
Putting money aside for my children and grandchildren 7 11
Spending (Net) 16 23
Improving my home or buying a vacation or retirement home
10 10
Traveling for pleasure 4 3
Treating myself to a luxury item such as expensive jewelry, clothes or a car
2 2
Starting my own business 1 4
Making substantial contributions to charities, or causes I agree with
- 4
Another use not mentioned 8 6
When investments earn money, the top priority is to reinvest the profit – regardless of whether it is a small or large amount of money.
Use of Earnings Made from Investing
25
Q635: Again thinking about your investment portfolio, over the next six months, do you plan to increase, decrease or make no change in your investments in each of the following?Base: All shareholders
Increase DecreaseMake no change
% % %
Individual stocks 32 7 62
Stock mutual funds 27 4 69
Cash 29 11 61
Bond mutual funds 11 5 84
Individual bonds 7 4 89
Alternative investments (such as hedge funds, private equity and managed futures)
7 2 91
Other investments 14 1 85
Most shareholders expect to make no changes to their portfolio in the next six months. However, for those who will, shareholders are five times as likely to increase stocks as they are to decrease.
Plans for Changing Investments in Next Six Months
26
HOW DOES A TYPICAL SHAREHOLDER FEEL ABOUT THE ECONOMY AND STOCK MARKET?
27
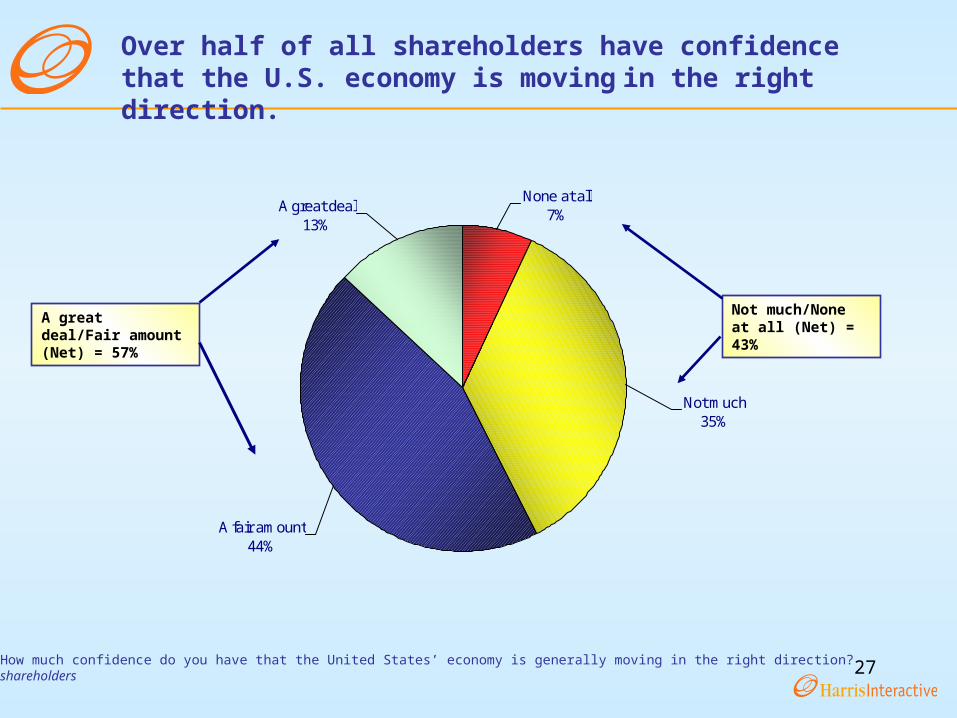
Over half of all shareholders have confidence that the U.S. economy is moving in the right direction.
A great deal13%
A fair amount 44%
Not much35%
None at all7%
A great deal/Fair amount (Net) = 57%
Not much/None at all (Net) = 43%
Q410: How much confidence do you have that the United States’ economy is generally moving in the right direction?Base: All shareholders
28
Q415: Thinking about the next three months, one year from now and five years from now, do you think the stock market will . . .?Base: All shareholders
3 months from now
1 year from now
5 years from now
% % %
Go down 19 13 10
Stay about the same 49 32 13
Go up 32 55 77
Shareholders become more optimistic about the stock market as they look further into the future.
Direction of the Stock Market
29
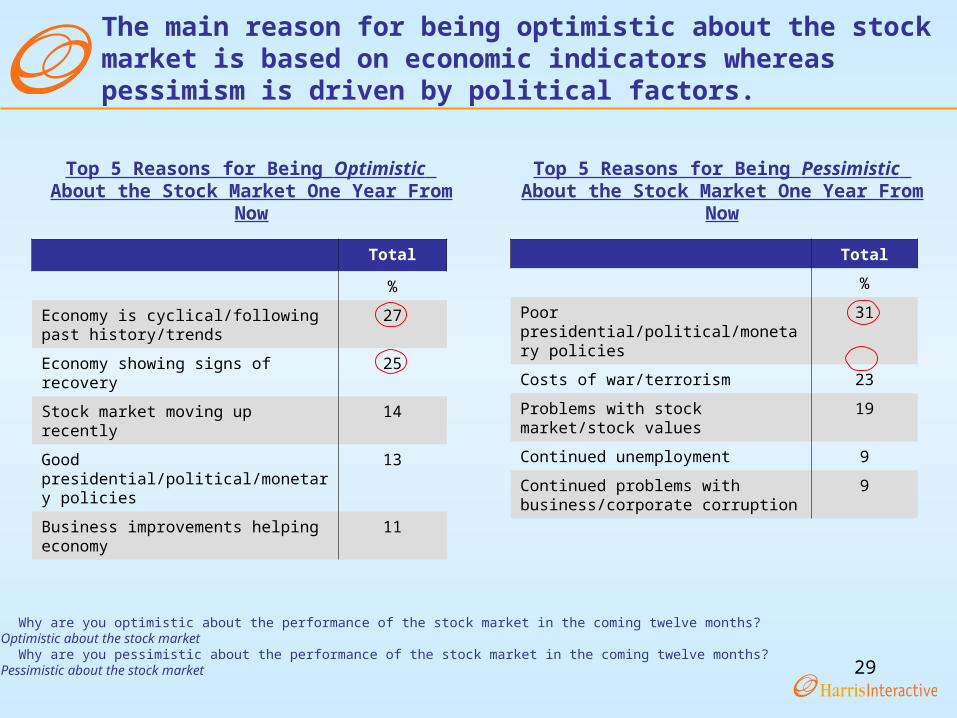
Q420: Why are you optimistic about the performance of the stock market in the coming twelve months?Base: Optimistic about the stock marketQ425: Why are you pessimistic about the performance of the stock market in the coming twelve months?Base: Pessimistic about the stock market
Total
%
Poor presidential/political/monetary policies
31
Costs of war/terrorism 23
Problems with stock market/stock values
19
Continued unemployment 9
Continued problems with business/corporate corruption
9
Total
%
Economy is cyclical/following past history/trends
27
Economy showing signs of recovery 25
Stock market moving up recently 14
Good presidential/political/monetary policies
13
Business improvements helping economy
11
The main reason for being optimistic about the stock market is based on economic indicators whereas pessimism is driven by political factors.
Top 5 Reasons for Being Optimistic About the Stock Market One Year From Now
Top 5 Reasons for Being Pessimistic About the Stock Market One Year From Now
30
WHAT ARE SHAREHOLDERS DOING OFFLINE AND ONLINE?
31
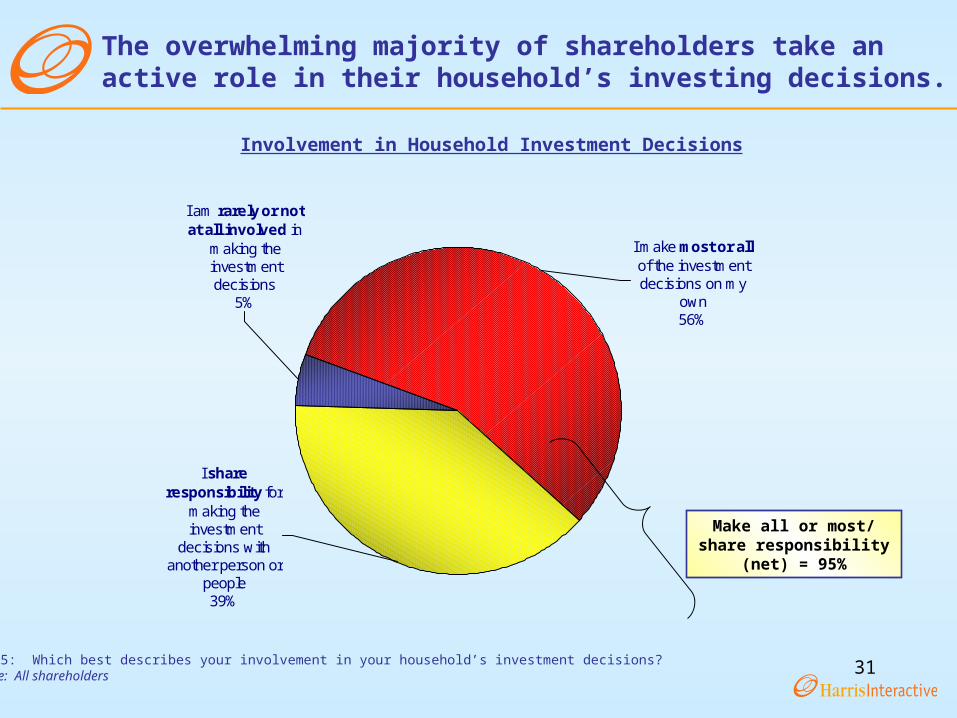
I am rarely or not at all involved in
making the investment decisions
5%
I share responsibility for
making the investment
decisions with another person or
people39%
I make most or all of the investment decisions on my
own56%
Q505: Which best describes your involvement in your household’s investment decisions?Base: All shareholders
The overwhelming majority of shareholders take an active role in their household’s investing decisions.
Involvement in Household Investment Decisions
Make all or most/share responsibility (net)
= 95%
32Q535: How many times have you done each of the following investment-related activities in the past three months?Base: All shareholders
Over half of all shareholders have bought or sold stocks in the past three months.
31%
26% 27%
15%
47%
31%
10%
6%
2%
Boughtindividualstocks
Sold individualstocks
Bought stockmutual funds
Sold stockmutual funds
Obtainedfinancial advice
Changed thetypes of
investments orthe compositionof my portfolio
Participated inchat groups orconversations
regardinginvesting
Attendedinvestmentclasses orseminars
Participated ininvestment club
meetings
% Who Have Done Investment Activities One or More Times In Past Three Months
Bought/Sold Stocks or Mutual Funds (net) =
54%
33Q540: About how many hours in the past three months have you spent on the following investment-related activities? Base: All shareholders
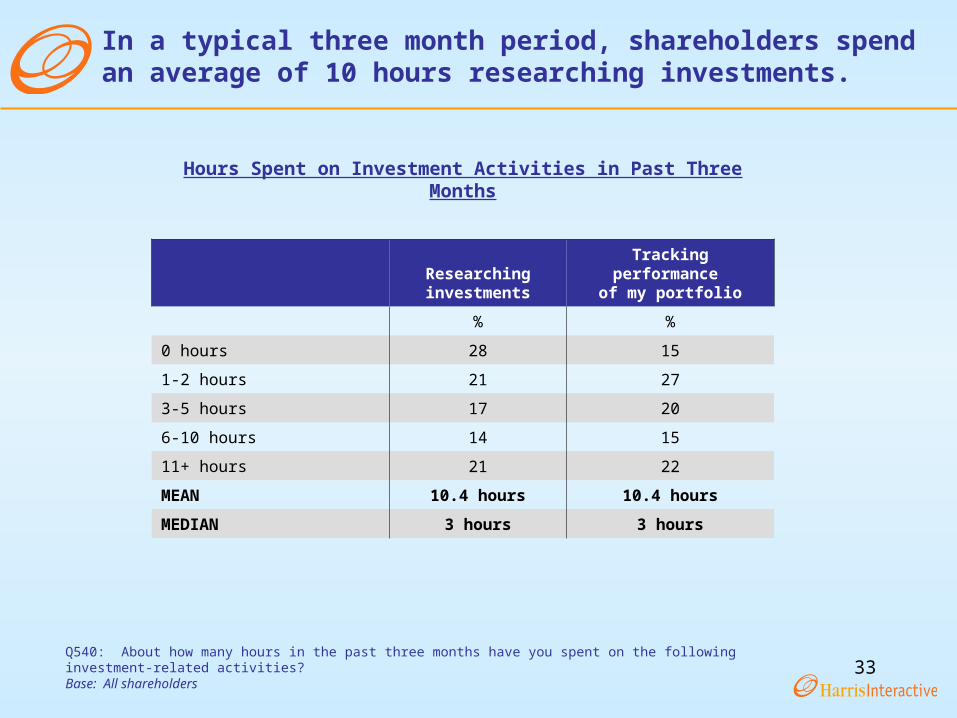
In a typical three month period, shareholders spend an average of 10 hours researching investments.
Hours Spent on Investment Activities in Past Three Months
Researching investments
Tracking performance of my portfolio
% %
0 hours 28 15
1-2 hours 21 27
3-5 hours 17 20
6-10 hours 14 15
11+ hours 21 22
MEAN 10.4 hours 10.4 hours
MEDIAN 3 hours 3 hours
34
More than 30 hours7%
11-30 hours14%
6-10 hours10%
1-5 hours43%
0 hours26%
Q545: Again thinking about the past three months, how many hours have you spent doing investment-related activities on the Internet?Base: All shareholdersQ550: Also thinking about the past three months, have you used the Internet to do any of the following investment-related activities?Base: Have used Internet for investment activities
MEAN = 12.7 hoursMEDIAN = 2 hours
And, about three-quarters of shareholders use the Internet for investment activities, with research and tracking the most common activities.
Hours Spent on Investment-Related Activities on the Internet
Total
%
Track the performance of my portfolio 65
Research investments 56
Buy/Sell Individual Stocks or Stock Mutual Funds (net) 28
Buy individual stocks 19
Sell individual stocks 14
Buy stock mutual funds 11
Sell stock mutual funds 8
Change the types of investments or the composition of my portfolio
20
Obtain financial advice 17
Attend investment seminars or classes 1
Participate in chat groups or conversations regarding investing
2
Participate in investment club meetings *
Other investment activity not mentioned 7
None of these 14
Investment-Related Activities Conducted Online – By Those Who Use the Internet
35Q552: What percentage of your stock trades over the past three months have been done online?Base: Bought or sold individual stocks or stock mutual funds online
One out of five shareholders trade online. For those who do, the vast majority of their stock trades are done using the Internet.
All shareholders100%
Shareholders who use Internet for for investing activities
74%
All shareholders
who make trades online
21%
Percent of Stock Trades Conducted Online
Mean Median
% %
All shareholders 17 -
All shareholders who trade online
81 100
36
WHERE DO SHAREHOLDERS GET INVESTMENT-RELATED INFORMATION?
37Q510: Of the following, what are your top three most useful sources of investment-related information?Base: All shareholders
*Note: Lawyer and Investment club each received ratings of #1 from less than one-half percent of all shareholders.
34%
24%
10%
11%
6%
4%
5%
29%
26%
21%
21%
13%
6%
8%
2%
2%
1%
8%
38%
20%Financial professional
Internet
Newspapers
Family and friends
Television
Magazines
Accountant
Books
Radio
*Lawyer
*Investment club
Another source not mentioned
Financial professionals and the Internet are the top sources for investment information.
Top Sources of Investment-Related Information –% Total Mentions (net ratings of 1, 2, or 3)
Types of Information Sources
People (net) = 72%Audio/Visual Medium (net) = 88%
55%
53%
49%
37%
27%
25%
15%
9%
7%
3%
2%
13%
% Gave Rating of #1
% Gave Rating of #2 or #3
38
More than half27%
Twenty-six to fifty percent
7%
Eleven to twenty-five percent
6%
One to ten percent17%
None43%
Q555: Over the past year, for what percentage of your investment decisions have you used a financial professional?Base: All shareholdersQ560: Which of the following types of financial professionals have you used to help you with investment decisions in the past year?Base: Used a financial professional
MEAN = 30.5%MEDIAN = 4%
Shareholders use a financial professional for about three out of ten of their investment decisions.
70%
35%
16%
Financial planneror advisor
Stockbroker Other type offinancial
professional notmentioned
Percentage of Investment Decisions Involving a Financial Professional
Type of Financial Professional Used
39Q530: Why is …your most useful source of investment-related information?Base: Have most useful source of investment-related information
Total
%
Provides me with information in a way I can easily understand 58
Is the most accessible source 54
Provides me with information so I can decide if I need to adjust my portfolio 50
Helps me evaluate new investments 45
Helps me find new investments to consider 44
Offers me the most complete information about current economic trends 43
Allows me to track my investments 43
Provides me with the most objective information 42
Helps me to customize information to best meet my investment goals 38
Is the most trustworthy source 35
Offers me the most complete information about general corporate issues 29
Another reason not mentioned 6
Investment information sources are valuable if they are: 1) easy to understand and 2) accessible.
Top Reasons Why Information Source is the Most Useful (Net All Sources)
40Q530: Why is …your most useful source of investment-related information?Base: Have most useful source of investment-related information
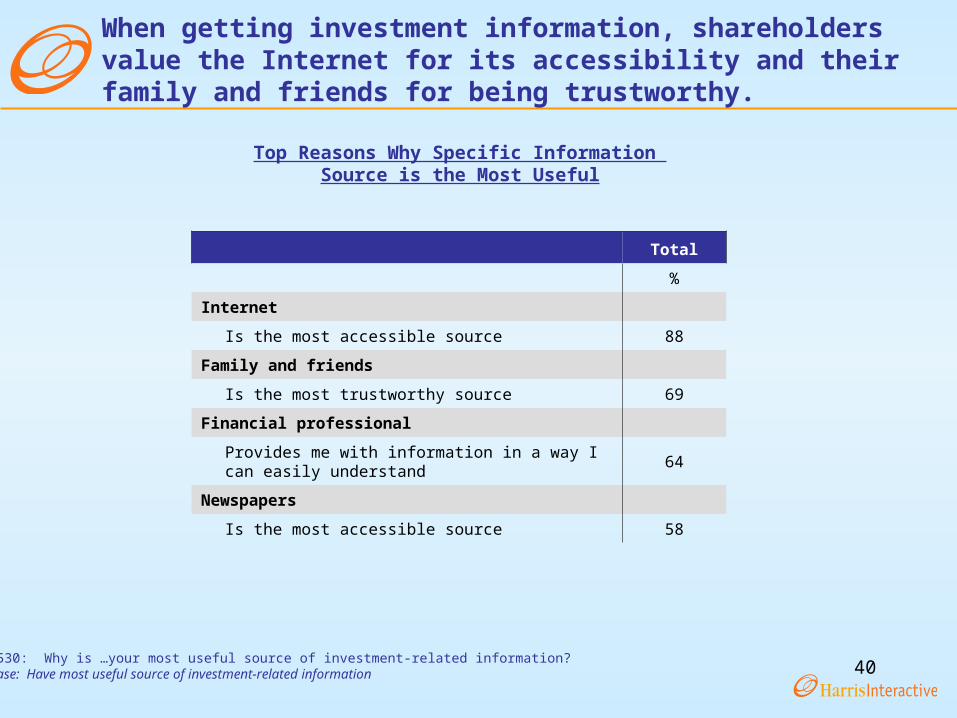
When getting investment information, shareholders value the Internet for its accessibility and their family and friends for being trustworthy.
Total
%
Internet
Is the most accessible source 88
Family and friends
Is the most trustworthy source 69
Financial professional
Provides me with information in a way I can easily understand
64
Newspapers
Is the most accessible source 58
Top Reasons Why Specific Information Source is the Most Useful
41
HOW DO SHAREHOLDERS REALLY FEEL ABOUT INVESTING?
42
Although shareholders generally agree that investing matters, they are not a homogeneous group.
There are different groups of shareholders that vary based on enjoyment, confidence, time and satisfaction.
Equal proportions of shareholders enjoy investing as those who do not.
Similar numbers of shareholders are confident about their investing abilities as those who do not feel confident.
About the same proportion of shareholders believe professionals can do a better job at investing as those who think they are more capable.
Nearly equal numbers of shareholders want to spend their free time on investing as those who do not.
About four in ten shareholders have time for investing while nearly a third do not.
Nearly half of all shareholders are satisfied with their portfolio’s past performance although about a third are not satisfied.
Shareholders, as a group, do not think about investing in the same way.
43
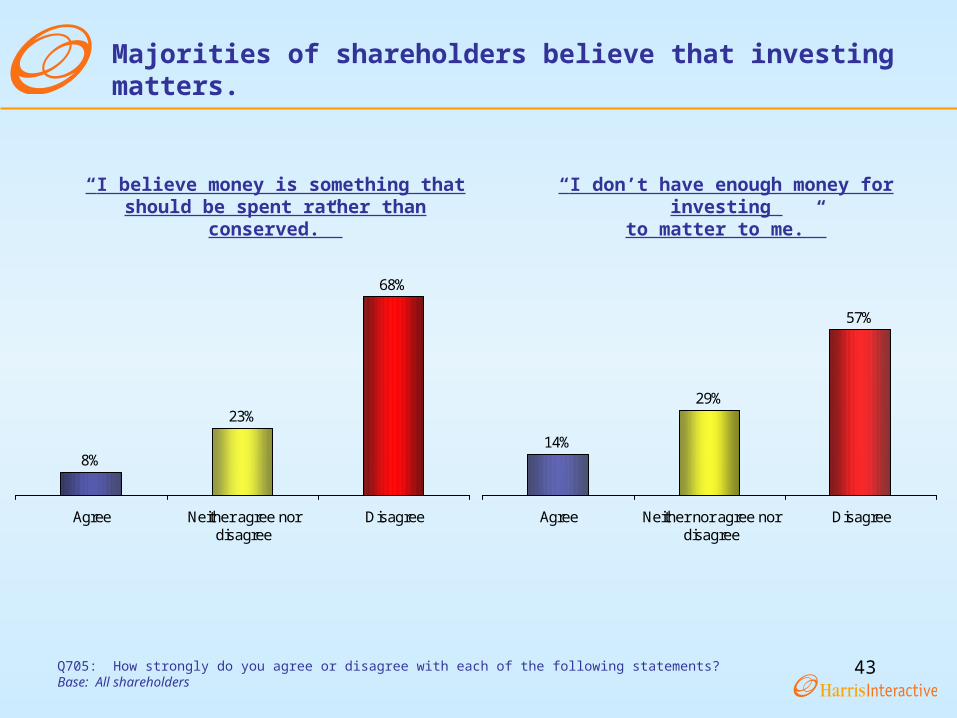
Majorities of shareholders believe that investing matters.
Q705: How strongly do you agree or disagree with each of the following statements?Base: All shareholders
8%
23%
68%
Agree Neither agree nordisagree
Disagree
14%
29%
57%
Agree Neither nor agree nordisagree
Disagree
“I believe money is something that should be spent rather than conserved.”
“I don’t have enough money for investing to matter to me.”
44
17%
27%
56%
Agree Neither agree nordisagree
Disagree
22%30%
48%
Agree Neither agree nordisagree
Disagree
Shareholders generally feel they have some knowledge about investing.
Q705: How strongly do you agree or disagree with each of the following statements?Base: All shareholders
“Investing is too complicated for me to understand.” “I don’t have enough information on how to make decisions about investing.”
30% 32%39%
Agree Neither agree nordisagree
Disagree
“I don’t have enough time to spend on investing.”
45
39%
25%
36%
Agree Neither agree nordisagree
Disagree
40%
23%
36%
Agree Neither agree nordisagree
Disagree
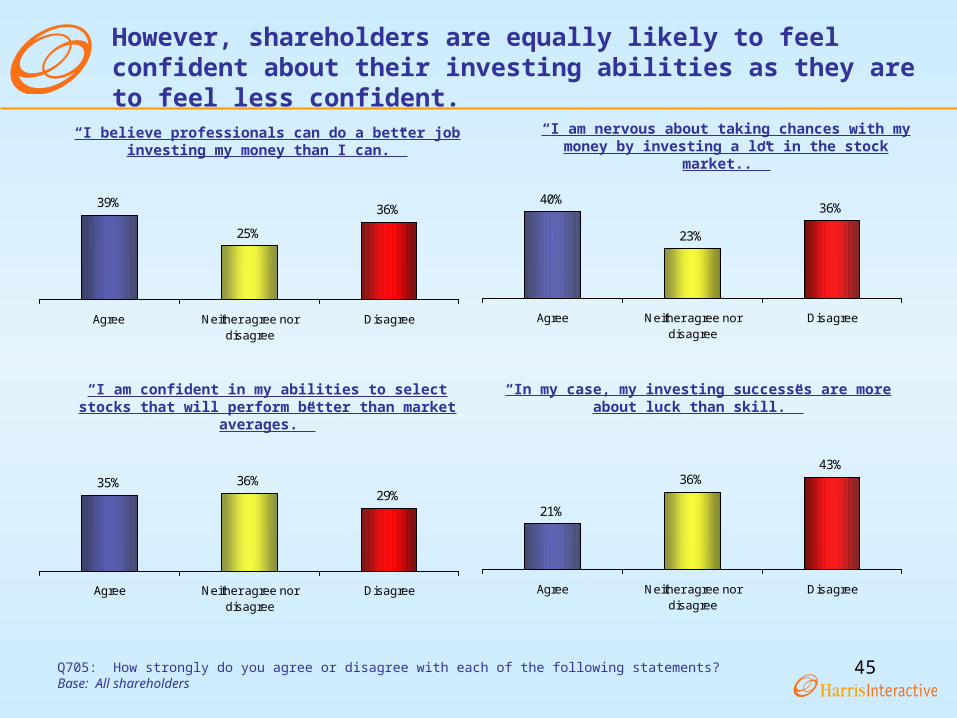
However, shareholders are equally likely to feel confident about their investing abilities as they are to feel less confident.
Q705: How strongly do you agree or disagree with each of the following statements?Base: All shareholders
“I believe professionals can do a better job investing my money than I can.”
“I am nervous about taking chances with my money by investing a lot in the stock market..”
35% 36%29%
Agree Neither agree nordisagree
Disagree
21%
36%43%
Agree Neither agree nordisagree
Disagree
“I am confident in my abilities to select stocks that will perform better than market averages.”
“In my case, my investing successes are more about luck than skill.”
46
27% 27%
47%
Agree Neither agree nordisagree
Disagree
37%
28%35%
Agree Neither agree nordisagree
Disagree
About a third of all shareholders enjoy investing and want to spend time researching investments, but about a third do not.
Q705: How strongly do you agree or disagree with each of the following statements?Base: All shareholders
“Investing is something I don’t want to do but I feel that I have to.”
“When I have free time, researching investments is one of the last things I want to do.”
34% 37%29%
Agree Neither agree nordisagree
Disagree
“Investing is an activity I truly enjoy.”
47
30%26%
44%
Agree Neither agree nor disagree Disagree
Nearly half of all shareholders are satisfied with the past performance of their portfolio, but about a third are not.
Q705: How strongly do you agree or disagree with each of the following statements?Base: All shareholders
“I’m satisfied with the past performance of my portfolio.”
48
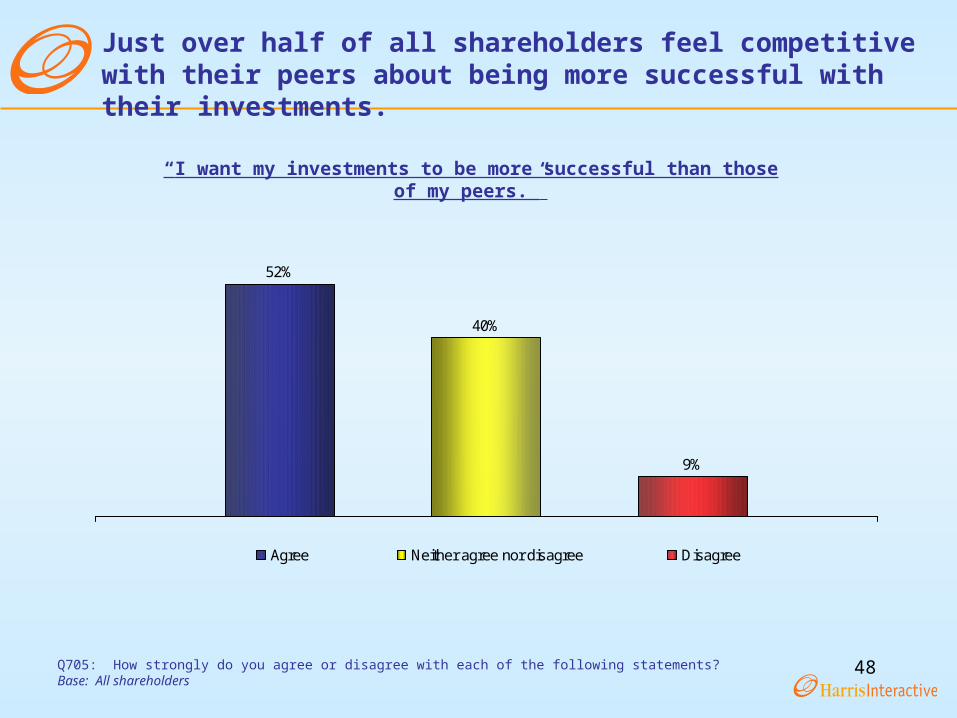
52%
40%
9%
Agree Neither agree nor disagree Disagree
Just over half of all shareholders feel competitive with their peers about being more successful with their investments.
Q705: How strongly do you agree or disagree with each of the following statements?Base: All shareholders
“I want my investments to be more successful than those of my peers.”
49
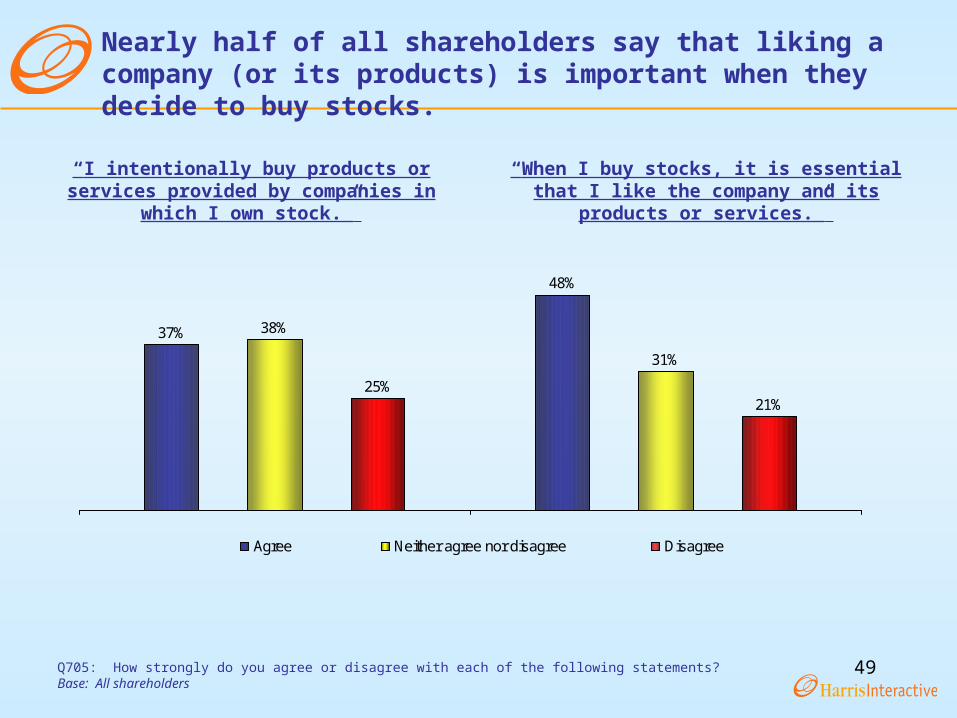
37% 38%
31%
25%21%
48%
Agree Neither agree nor disagree Disagree
Nearly half of all shareholders say that liking a company (or its products) is important when they decide to buy stocks.
Q705: How strongly do you agree or disagree with each of the following statements?Base: All shareholders
“I intentionally buy products or services provided by companies in which I own stock.”
“When I buy stocks, it is essential that I like the company and its products or services.”
50
SUBGROUP ANALYSISSUBGROUP ANALYSIS
51
WHAT ARE THE DIFFERENCES BETWEEN WHAT ARE THE DIFFERENCES BETWEEN MALE AND FEMALE SHAREHOLDERS?MALE AND FEMALE SHAREHOLDERS?
52
Typical male and female shareholders look very different from each other.
Male Shareholders
Female Shareholders
Average amount invested in individual stocks $86,700 $20,100
Average amount invested in stock mutual funds $133,600 $35,200
Average length of time to hold onto investments before selling 7 years 8 years
Average age began investing 27.6 years old 33.7 years old
Average rating of investment risk level (on a 7 point scale) 4.2 3.7
Percent that expect a return of 10% or more on stocks 63% 59%
Percent that benchmark investments against S&P Index 33% 17%
Average self-rating of investment knowledge 3.5 (B-) 2.8 (C-)
Percent who have spent time in the past three months researching or tracking investments
93% 78%
Percent who have used the Internet in the past three months for investment activities
84% 59%
Average hours spent on the Internet doing investment-related activities 16.9 hours 6.3 hours
Percent who have used a financial professional in past year 52% 65%
Percent who have made stock trades in last three months 60% 46%
53
Investing matters about equally to men and women.
Q705: How strongly do you agree or disagree with each of the following statements?Base: All shareholders
“I believe money is something that should be spent rather than conserved.”
“I don’t have enough money for investing to matter to me.”
% Strongly/Somewhat Disagree
70%
61%66%
52%
Men Women
54
46%
41%
Men Women
And, men and women are about equally satisfied with the past performance of their portfolio.
Q705: How strongly do you agree or disagree with each of the following statements?Base: All shareholders
“I’m satisfied with the past performance of my portfolio.”
% Strongly/Somewhat Agree
55
40%36%
17%
8%
26%29%
21%24%
Less than 25years old
25-34 years old 35-44 years old 45+ years old
Men Women
But, men started investing at an earlier age than women did.
Q610: At what age did you start investing?Base: All shareholders
Age Started Investing
Men WomenMEAN = 27.6 years old MEAN = 33.7 years oldMEDIAN = 25 years old MEDIAN = 30 years old
56
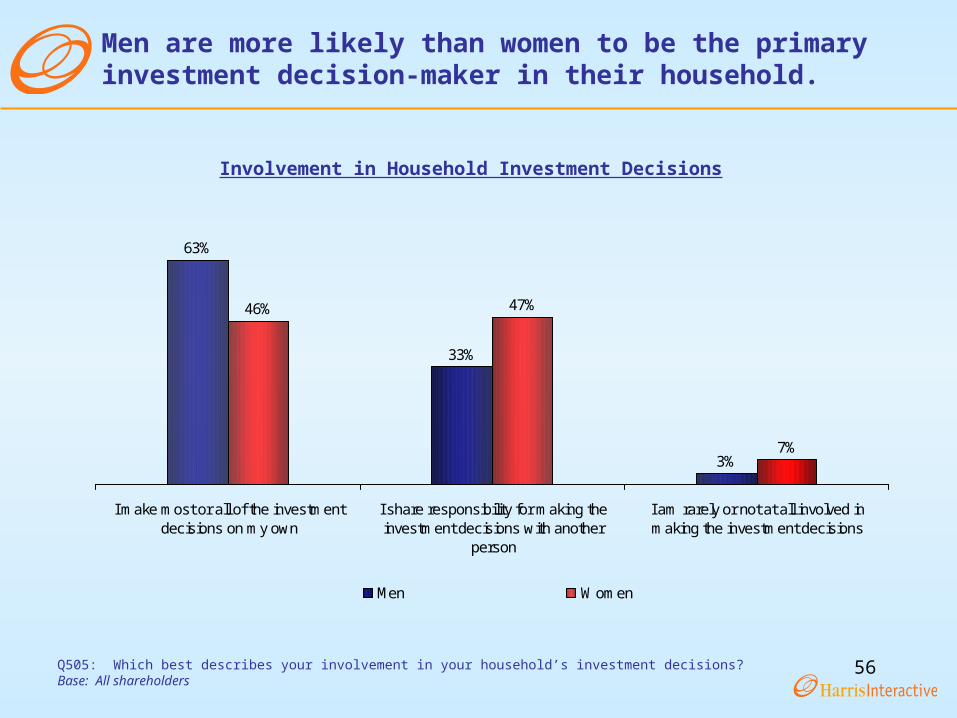
63%
33%
3%
46% 47%
7%
I make most or all of the investmentdecisions on my own
I share responsibility for making theinvestment decisions with another
person
I am rarely or not at all involved inmaking the investment decisions
Men Women
Men are more likely than women to be the primary investment decision-maker in their household.
Q505: Which best describes your involvement in your household’s investment decisions?Base: All shareholders
Involvement in Household Investment Decisions
57
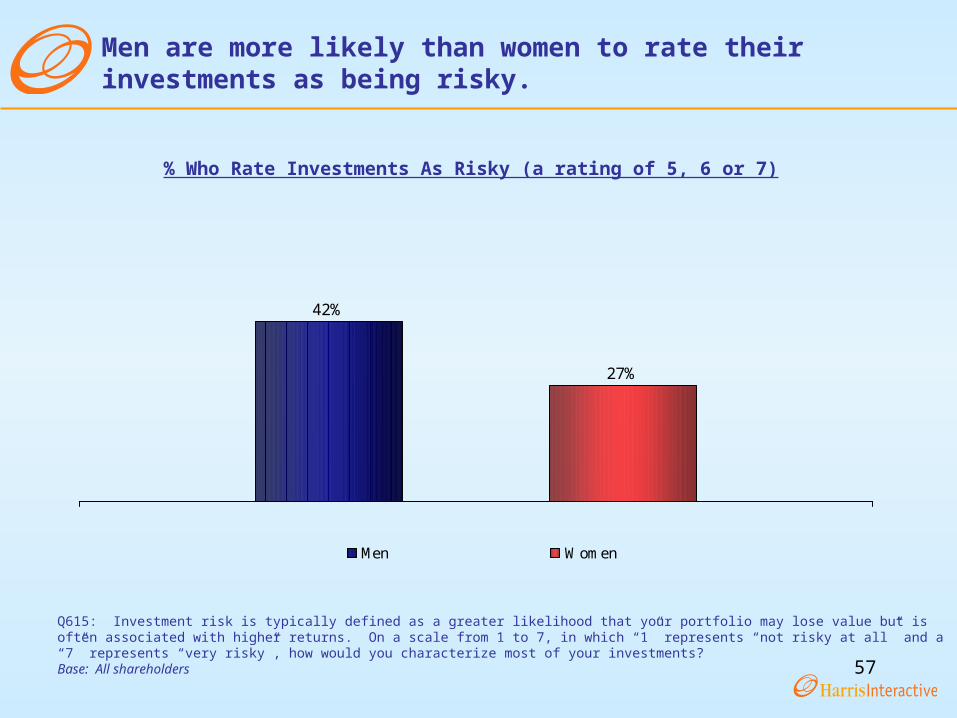
42%
27%
Men Women
Men are more likely than women to rate their investments as being risky.
Q615: Investment risk is typically defined as a greater likelihood that your portfolio may lose value but is often associated with higher returns. On a scale from 1 to 7, in which “1” represents “not risky at all” and a “7” represents “very risky”, how would you characterize most of your investments?Base: All shareholders
% Who Rate Investments As Risky (a rating of 5, 6 or 7)
58
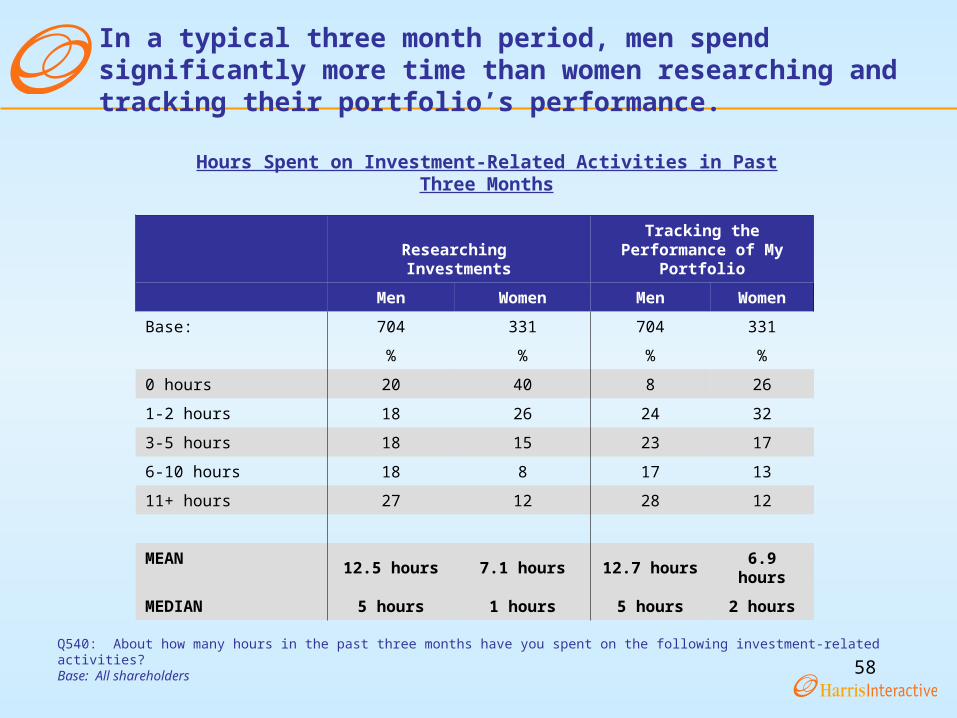
In a typical three month period, men spend significantly more time than women researching and tracking their portfolio’s performance.
Researching Investments
Tracking the Performance of My Portfolio
Men Women Men Women
Base: 704 331 704 331
% % % %
0 hours 20 40 8 26
1-2 hours 18 26 24 32
3-5 hours 18 15 23 17
6-10 hours 18 8 17 13
11+ hours 27 12 28 12
MEAN 12.5 hours 7.1 hours 12.7 hours 6.9 hours
MEDIAN 5 hours 1 hours 5 hours 2 hours
Q540: About how many hours in the past three months have you spent on the following investment-related activities?Base: All shareholders
Hours Spent on Investment-Related Activities in Past Three Months
59
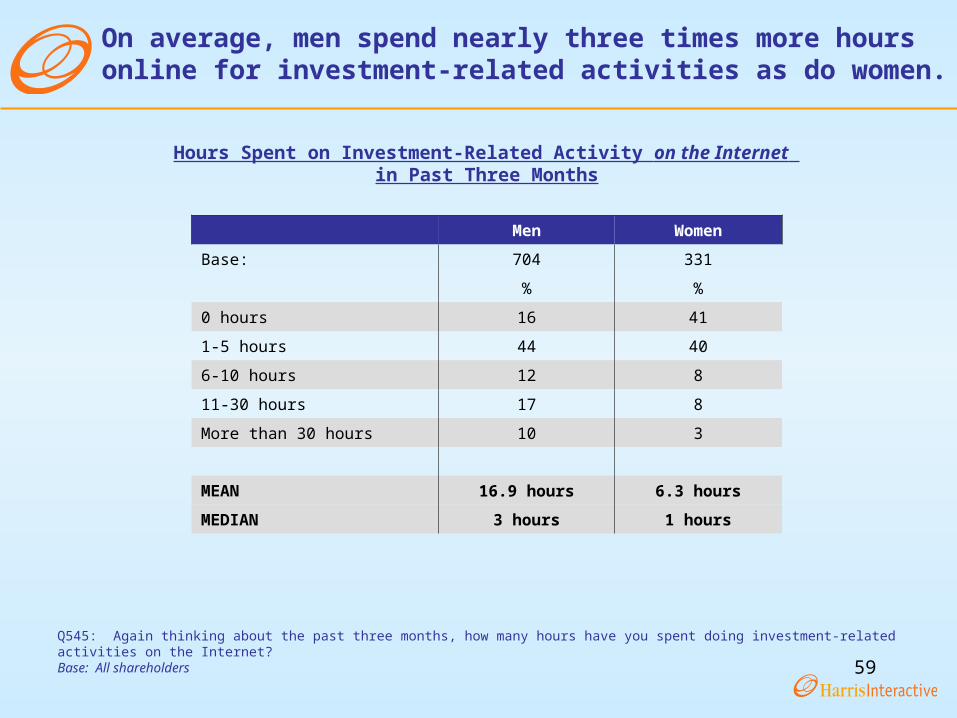
On average, men spend nearly three times more hours online for investment-related activities as do women.
Men Women
Base: 704 331
% %
0 hours 16 41
1-5 hours 44 40
6-10 hours 12 8
11-30 hours 17 8
More than 30 hours 10 3
MEAN 16.9 hours 6.3 hours
MEDIAN 3 hours 1 hours
Q545: Again thinking about the past three months, how many hours have you spent doing investment-related activities on the Internet?Base: All shareholders
Hours Spent on Investment-Related Activity on the Internet in Past Three Months
60
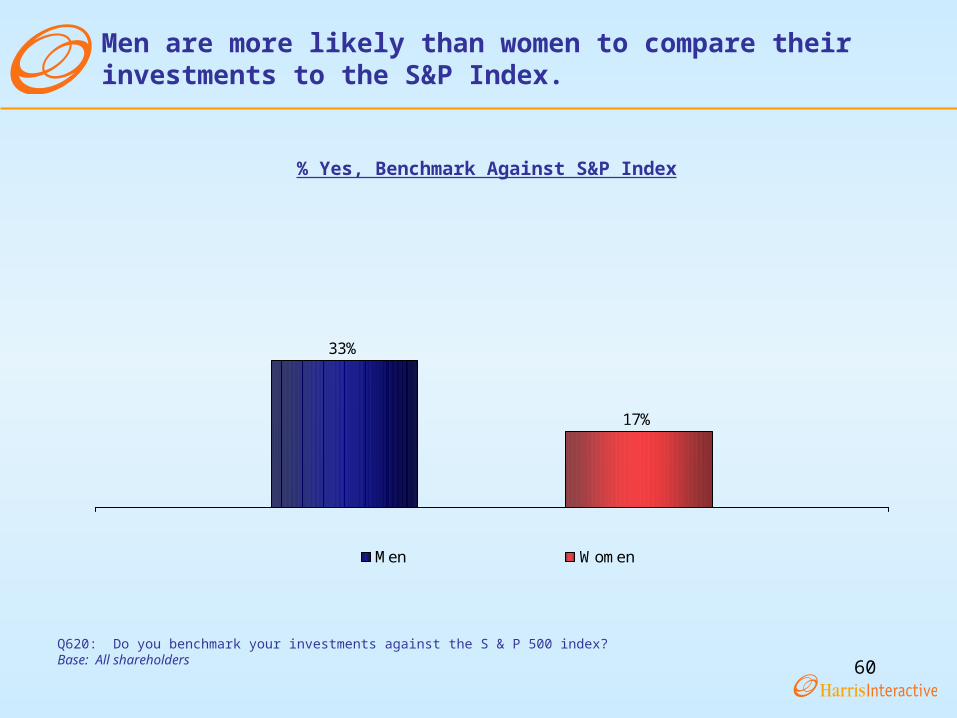
33%
17%
Men Women
Men are more likely than women to compare their investments to the S&P Index.
Q620: Do you benchmark your investments against the S & P 500 index?Base: All shareholders
% Yes, Benchmark Against S&P Index
61
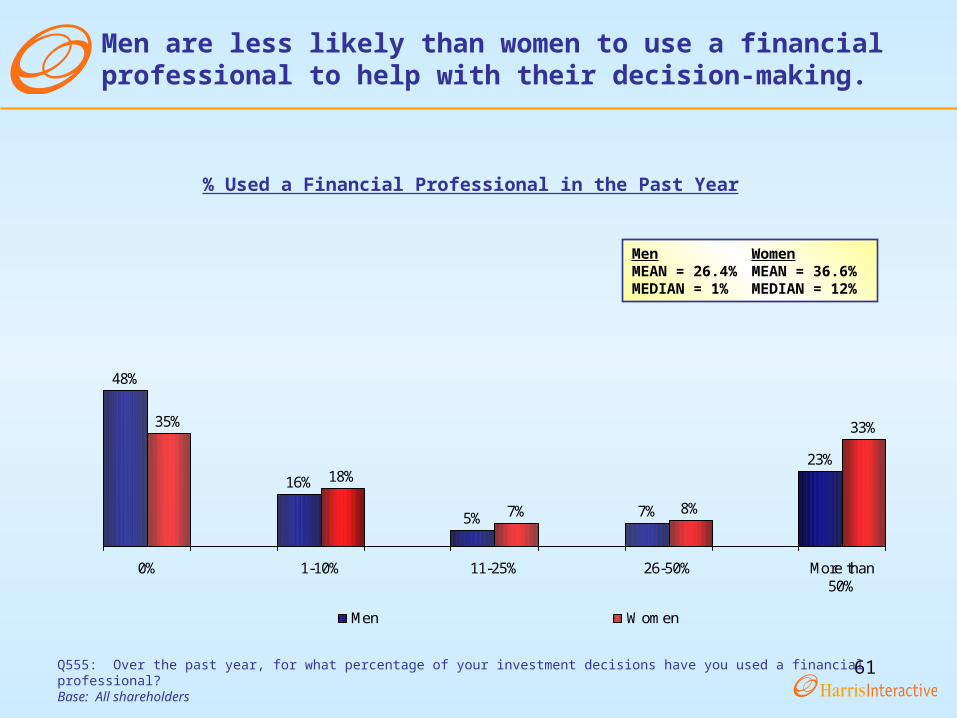
Men are less likely than women to use a financial professional to help with their decision-making.
Q555: Over the past year, for what percentage of your investment decisions have you used a financial professional?Base: All shareholders
% Used a Financial Professional in the Past Year
48%
16%
5% 7%
23%
35%
18%
7% 8%
33%
0% 1-10% 11-25% 26-50% More than50%
Men Women
Men WomenMEAN = 26.4% MEAN = 36.6%MEDIAN = 1% MEDIAN = 12%
62
40%
55%60%
36%
People (Net) Visual/Audio Sources (Net)
Men Women
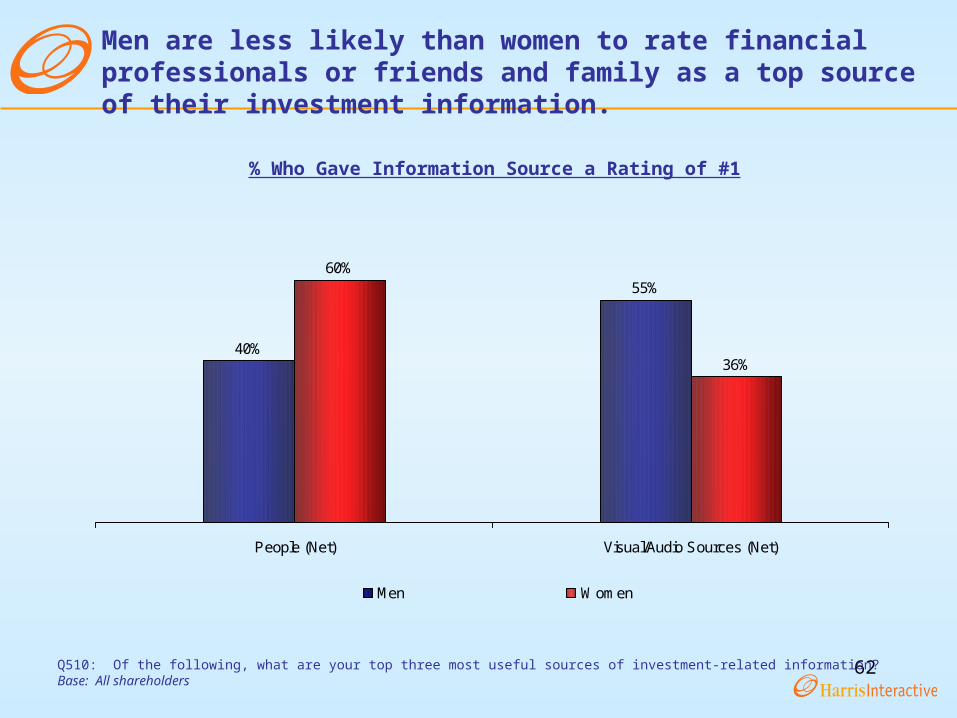
Men are less likely than women to rate financial professionals or friends and family as a top source of their investment information.
Q510: Of the following, what are your top three most useful sources of investment-related information?Base: All shareholders
% Who Gave Information Source a Rating of #1
63
44%
17%21%
26%
Men Women
35%31%
45%
54%
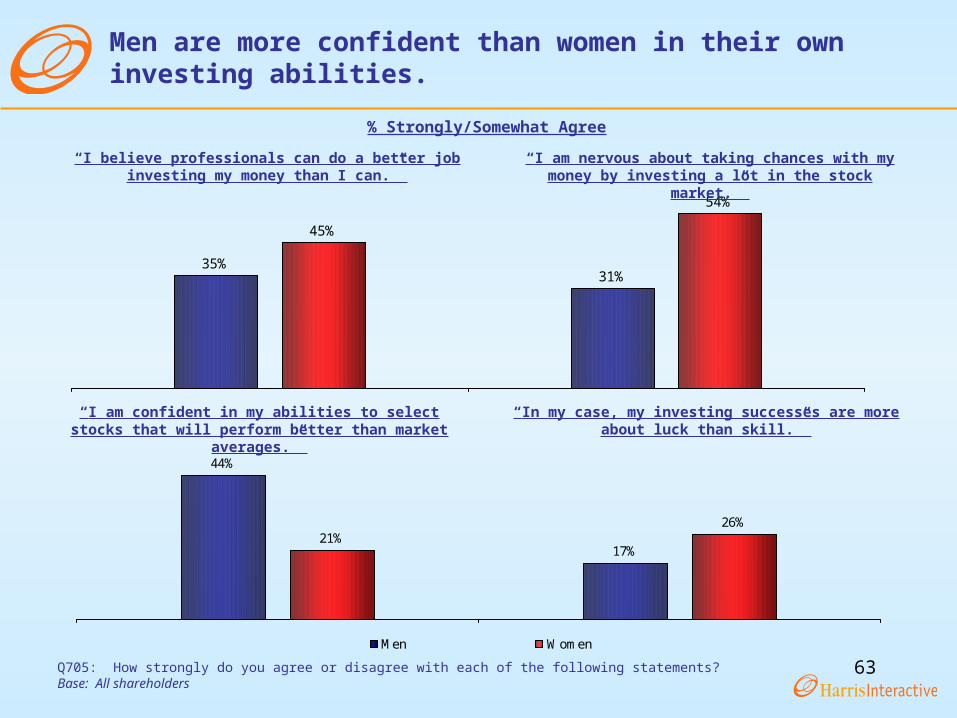
Men are more confident than women in their own investing abilities.
Q705: How strongly do you agree or disagree with each of the following statements?Base: All shareholders
“I believe professionals can do a better job investing my money than I can.”
“I am nervous about taking chances with my money by investing a lot in the stock market.”
“I am confident in my abilities to select stocks that will perform better than market averages.”
“In my case, my investing successes are more about luck than skill.”
% Strongly/Somewhat Agree
64
10%15%
27%31%
Men Women
Men are more likely than women to feel knowledgeable about investing.
Q705: How strongly do you agree or disagree with each of the following statements?Base: All shareholders
“Investing is too complicated for me to understand.” “I don’t have enough information on how to make decisions about investing.”
“I don’t have enough time to spend on investing.”
26%
35%
% Strongly/Somewhat Agree
65
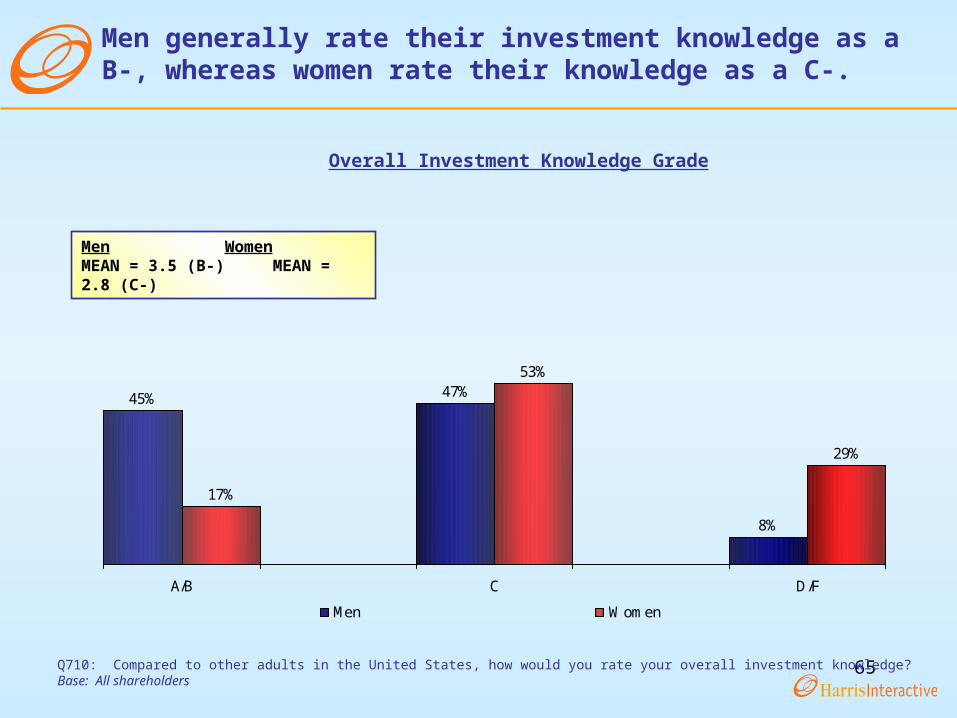
Men generally rate their investment knowledge as a B-, whereas women rate their knowledge as a C-.
Q710: Compared to other adults in the United States, how would you rate your overall investment knowledge?Base: All shareholders
Overall Investment Knowledge Grade
45% 47%
8%
17%
53%
29%
A/B C D/F
Men Women
Men WomenMEAN = 3.5 (B-) MEAN = 2.8 (C-)
66
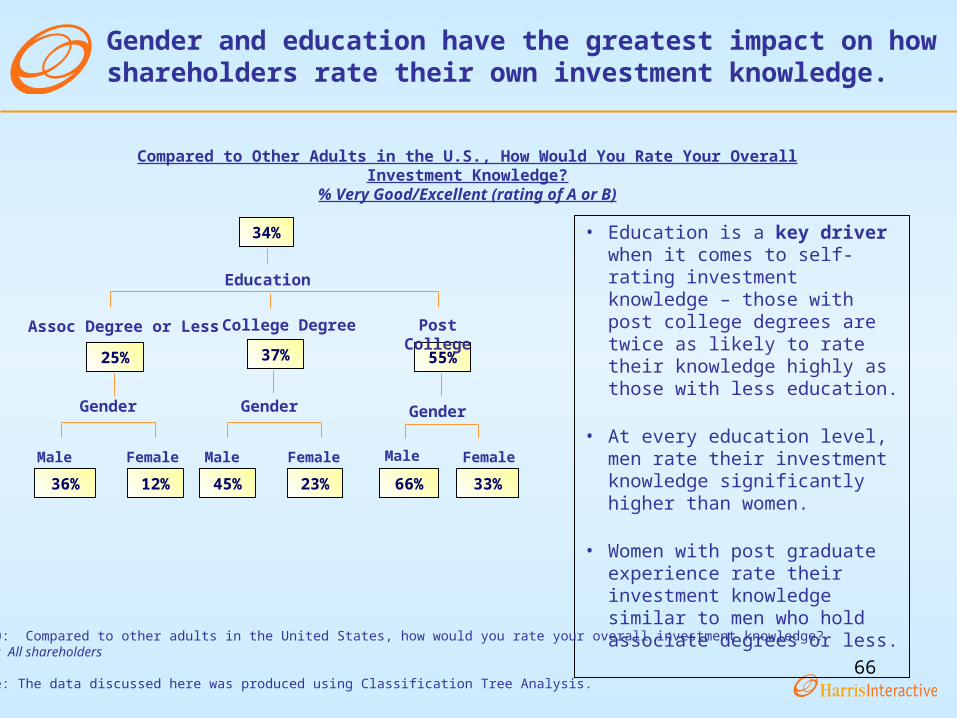
Compared to Other Adults in the U.S., How Would You Rate Your Overall Investment Knowledge?% Very Good/Excellent (rating of A or B)
25%
Assoc Degree or Less
34%
Education
55%
Post College
37%
College Degree
45%
Male
23%
Female
Gender
66%
Male
33%
Female
Gender
36%
Male
12%
Female
Gender
• Education is a key driver when it comes to self-rating investment knowledge – those with post college degrees are twice as likely to rate their knowledge highly as those with less education.
• At every education level, men rate their investment knowledge significantly higher than women.
• Women with post graduate experience rate their investment knowledge similar to men who hold associate degrees or less.
Q710: Compared to other adults in the United States, how would you rate your overall investment knowledge?Base: All shareholders
Note: The data discussed here was produced using Classification Tree Analysis.
Gender and education have the greatest impact on how shareholders rate their own investment knowledge.
67
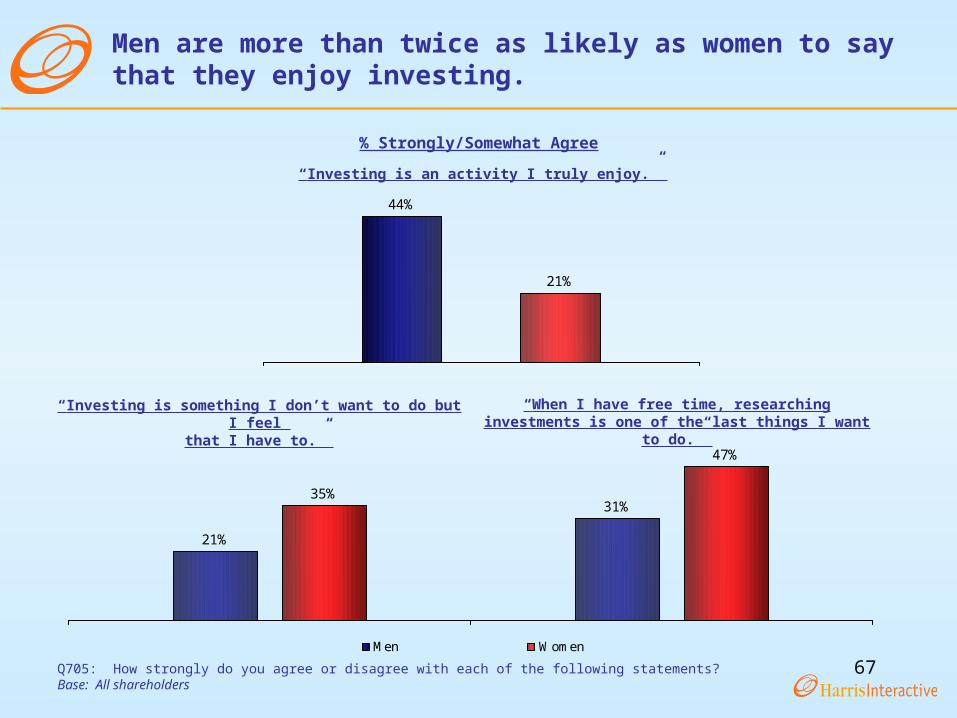
44%
21%
21%
31%35%
47%
Men Women
Men are more than twice as likely as women to say that they enjoy investing.
Q705: How strongly do you agree or disagree with each of the following statements?Base: All shareholders
% Strongly/Somewhat Agree
“Investing is an activity I truly enjoy.”
“Investing is something I don’t want to do but I feel that I have to.”
“When I have free time, researching investments is one of the last things I want to do.”
68
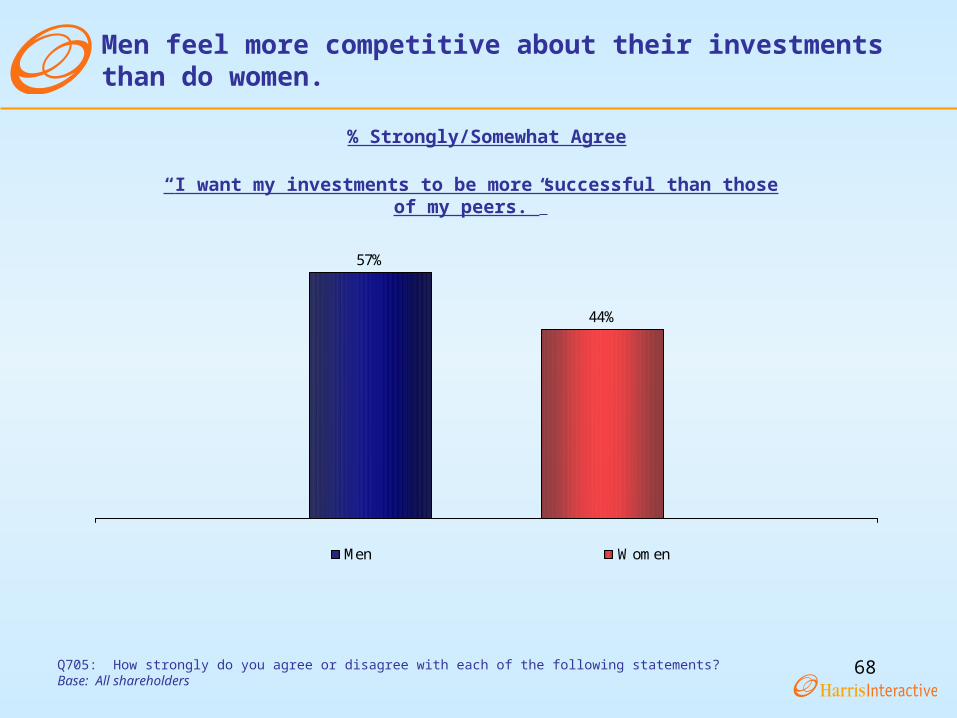
57%
44%
Men Women
Men feel more competitive about their investments than do women.
Q705: How strongly do you agree or disagree with each of the following statements?Base: All shareholders
“I want my investments to be more successful than those of my peers.”
% Strongly/Somewhat Agree
69
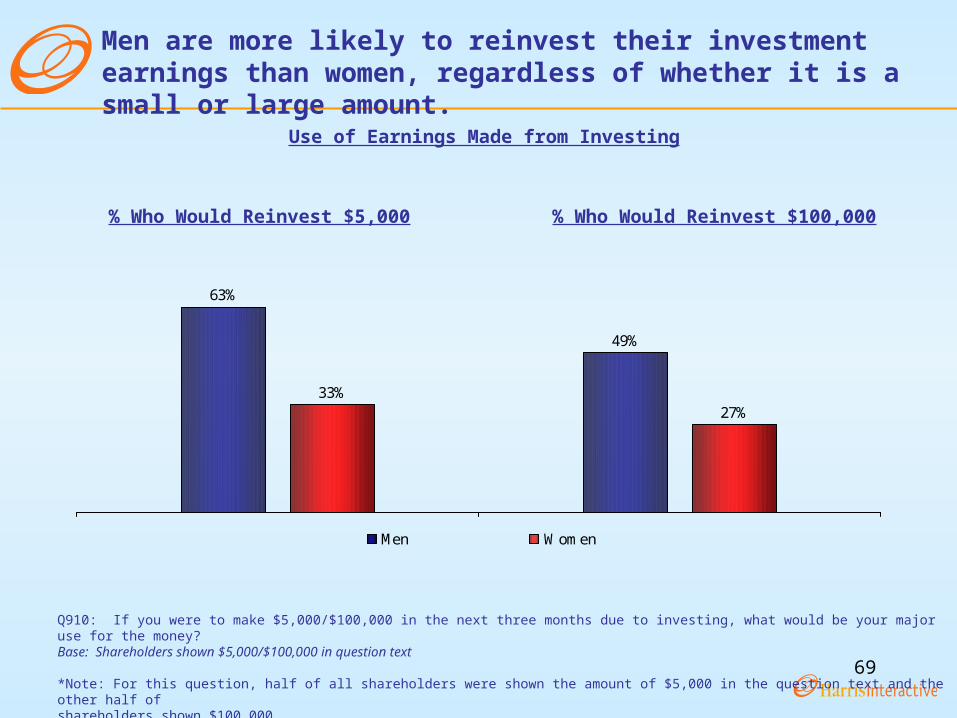
Men are more likely to reinvest their investment earnings than women, regardless of whether it is a small or large amount.
% Who Would Reinvest $5,000 % Who Would Reinvest $100,000
Use of Earnings Made from Investing
63%
49%
33%27%
Men Women
Q910: If you were to make $5,000/$100,000 in the next three months due to investing, what would be your major use for the money?Base: Shareholders shown $5,000/$100,000 in question text
*Note: For this question, half of all shareholders were shown the amount of $5,000 in the question text and the other half of shareholders shown $100,000.
70
38% 37%
55%
43%
Men Women
Men feel less of a need to like a company (or its products) before investing than women do.
Q705: How strongly do you agree or disagree with each of the following statements?Base: All shareholders
“I intentionally buy products or services provided by companies in which I own stock.”
“When I buy stocks, it is essential that I like the company and its products or services.”
% Strongly/Somewhat Agree
71
WHAT ARE THE DIFFERENCES WHAT ARE THE DIFFERENCES BETWEEN SHAREHOLDERS IN THE BETWEEN SHAREHOLDERS IN THE
EAST, MIDWEST, SOUTH AND WEST?EAST, MIDWEST, SOUTH AND WEST?
72
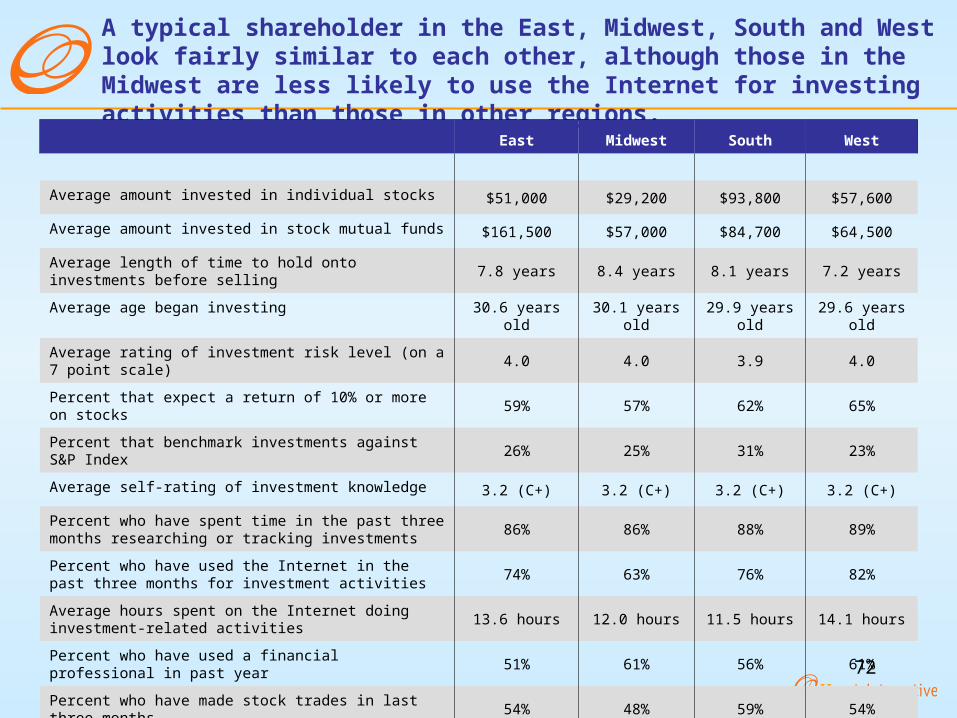
A typical shareholder in the East, Midwest, South and West look fairly similar to each other, although those in the Midwest are less likely to use the Internet for investing activities than those in other regions.
East Midwest South West
Average amount invested in individual stocks $51,000 $29,200 $93,800 $57,600
Average amount invested in stock mutual funds $161,500 $57,000 $84,700 $64,500
Average length of time to hold onto investments before selling
7.8 years 8.4 years 8.1 years 7.2 years
Average age began investing 30.6 years old 30.1 years old 29.9 years old 29.6 years old
Average rating of investment risk level (on a 7 point scale) 4.0 4.0 3.9 4.0
Percent that expect a return of 10% or more on stocks 59% 57% 62% 65%
Percent that benchmark investments against S&P Index 26% 25% 31% 23%
Average self-rating of investment knowledge 3.2 (C+) 3.2 (C+) 3.2 (C+) 3.2 (C+)
Percent who have spent time in the past three months researching or tracking investments
86% 86% 88% 89%
Percent who have used the Internet in the past three months for investment activities
74% 63% 76% 82%
Average hours spent on the Internet doing investment-related activities
13.6 hours 12.0 hours 11.5 hours 14.1 hours
Percent who have used a financial professional in past year 51% 61% 56% 61%
Percent who have made stock trades in last three months 54% 48% 59% 54%
73
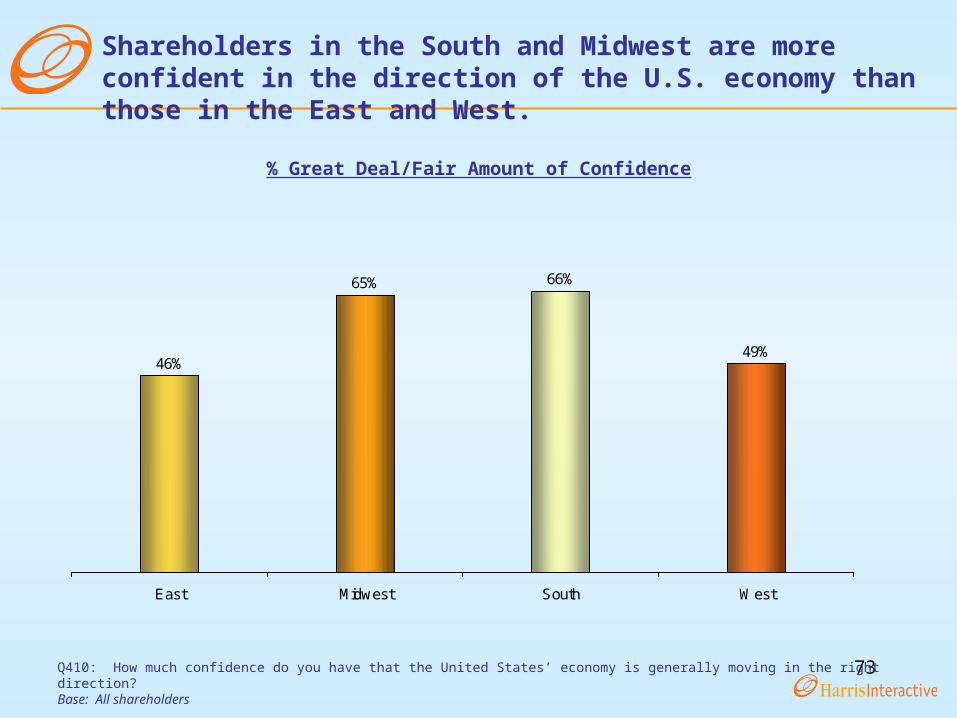
46%
66%
49%
65%
East Midwest South West
Shareholders in the South and Midwest are more confident in the direction of the U.S. economy than those in the East and West.
Q410: How much confidence do you have that the United States’ economy is generally moving in the right direction?Base: All shareholders
% Great Deal/Fair Amount of Confidence
74
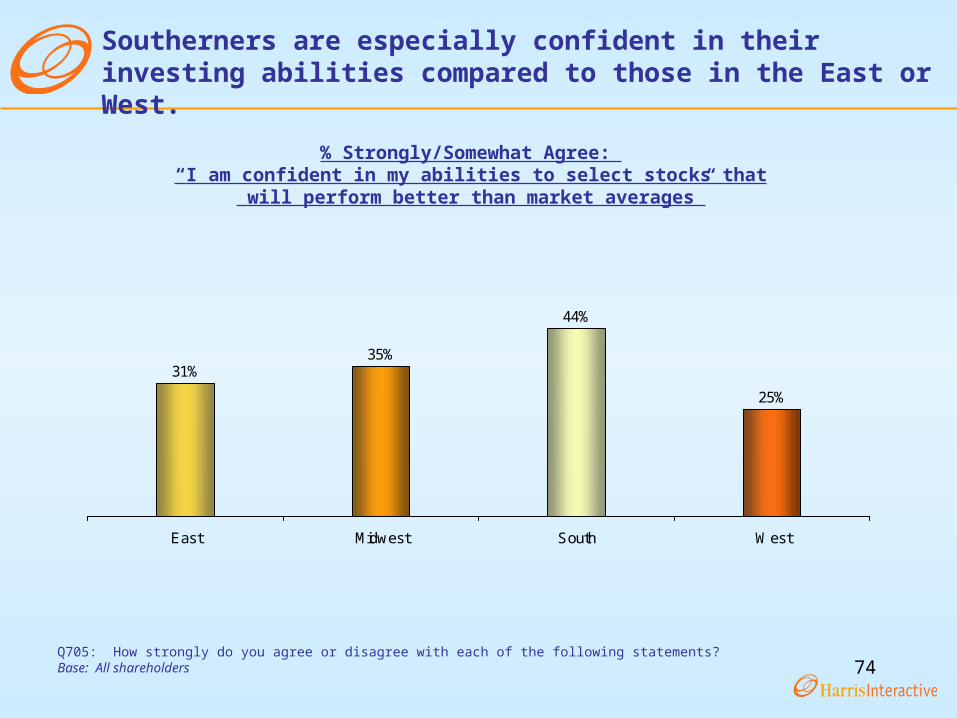
31%
44%
25%
35%
East Midwest South West
Southerners are especially confident in their investing abilities compared to those in the East or West.
Q705: How strongly do you agree or disagree with each of the following statements?Base: All shareholders
% Strongly/Somewhat Agree: “I am confident in my abilities to select stocks that
will perform better than market averages”
75
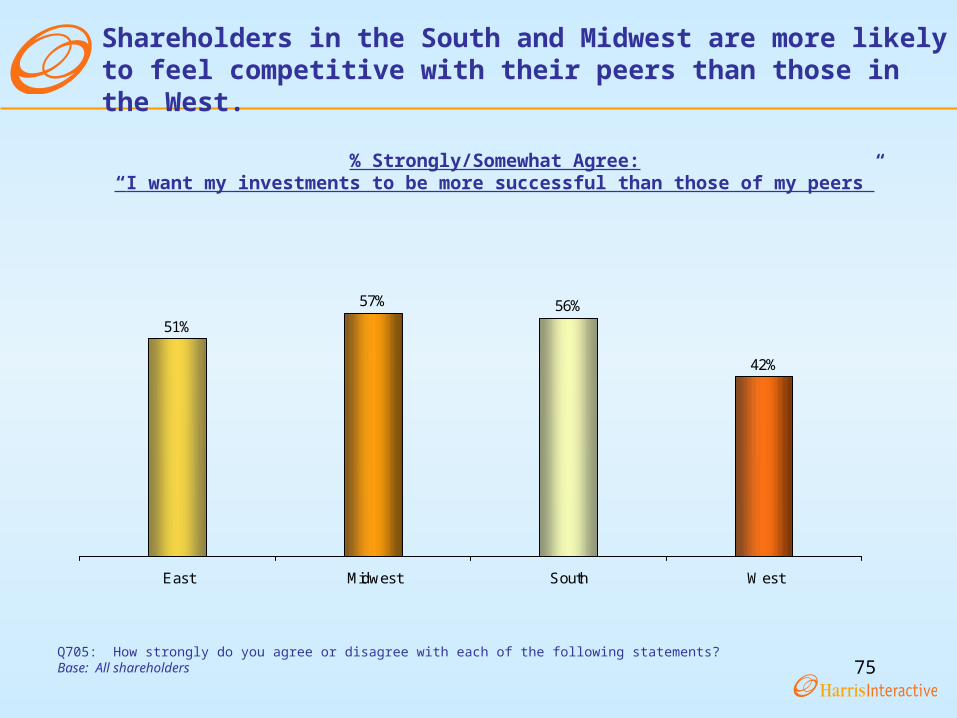
51%56%
42%
57%
East Midwest South West
Shareholders in the South and Midwest are more likely to feel competitive with their peers than those in the West.
Q705: How strongly do you agree or disagree with each of the following statements?Base: All shareholders
% Strongly/Somewhat Agree:“I want my investments to be more successful than those of my peers”
76
39%37%
28%
45%
East Midwest South West
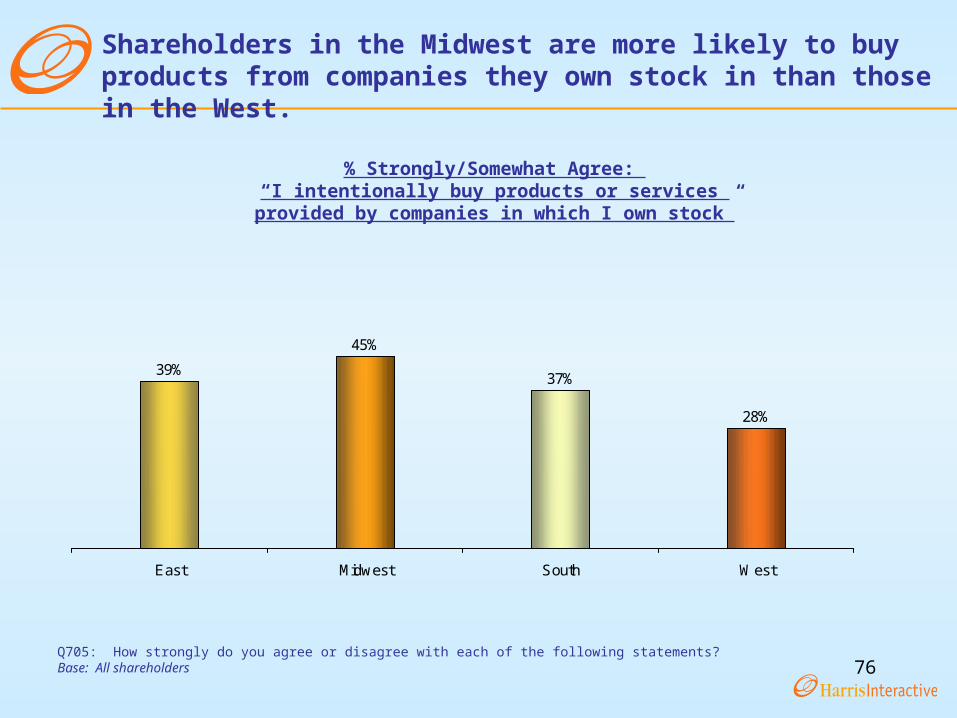
Shareholders in the Midwest are more likely to buy products from companies they own stock in than those in the West.
Q705: How strongly do you agree or disagree with each of the following statements?Base: All shareholders
% Strongly/Somewhat Agree: “I intentionally buy products or services
provided by companies in which I own stock”
77
Making $5,000 from Investing Making $100,000 from Investing
East Midwest South West East Midwest South West
Base: 132 101 185 119 112 115 158 113
% % % % % % % %
Saving (net) 84 81 67 76 60 72 81 73
Spending (net) 11 11 24 14 33 26 16 18
Use of Earnings Made from Investing
Q910: If you were to make $5,000/$100,000 in the next three months due to investing, what would be your major use for the money?Base: Respondents shown $5,000/$100,000 in question text
*Note: For this question, half of all shareholders were shown the amount of $5,000 in the question text and the other half of shareholders shown $100,000.
Southerners are more likely to save investment earnings that are large (and less likely when earnings are smaller) than those in the East.
78
DemographicsDemographics
79
DemographicsDemographics
GenderGenderTotalTotal
%
Male 60
Female 40
GenderGenderTotalTotal
%
Male 60
Female 40
AgeAge
TotalTotal
%
35 years old or less 2636-49 2550-64 2865+ 21
MEAN 48.7
MEDIAN 49
AgeAge
TotalTotal
%
35 years old or less 2636-49 2550-64 2865+ 21
MEAN 48.7
MEDIAN 49
Marital StatusMarital Status
TotalTotal
%
Single, never married 19Married 64Divorced 8Separated 1Widowed 4Living with partner 3
Marital StatusMarital Status
TotalTotal
%
Single, never married 19Married 64Divorced 8Separated 1Widowed 4Living with partner 3
Children in Household Under 18Children in Household Under 18
TotalTotal
%
0 681 162 113+ 5MEAN 1MEDIAN -
Children in Household Under 18Children in Household Under 18
TotalTotal
%
0 681 162 113+ 5MEAN 1MEDIAN -
Race/EthnicityRace/Ethnicity
TotalTotal
%White 80Black 4African American 1Asian or Pacific Islander 2Native American or Alaskan Native *Mixed racial background 1Other race 1Hispanic 7
Race/EthnicityRace/Ethnicity
TotalTotal
%White 80Black 4African American 1Asian or Pacific Islander 2Native American or Alaskan Native *Mixed racial background 1Other race 1Hispanic 7
80
Demographics (Cont’d)Demographics (Cont’d)
EducationEducation
TotalTotal%
High school graduate or less 20Some college, but no degree 34College (e.g., B.A., B.S.) 27Some graduate school, but no degree 6Graduate school (e.g., M.S., M.D., Ph.D.) 14
EducationEducation
TotalTotal%
High school graduate or less 20Some college, but no degree 34College (e.g., B.A., B.S.) 27Some graduate school, but no degree 6Graduate school (e.g., M.S., M.D., Ph.D.) 14
Not employed, but looking for work 3Not employed and not looking for work 1Retired 25Student 7Homemaker 7
81
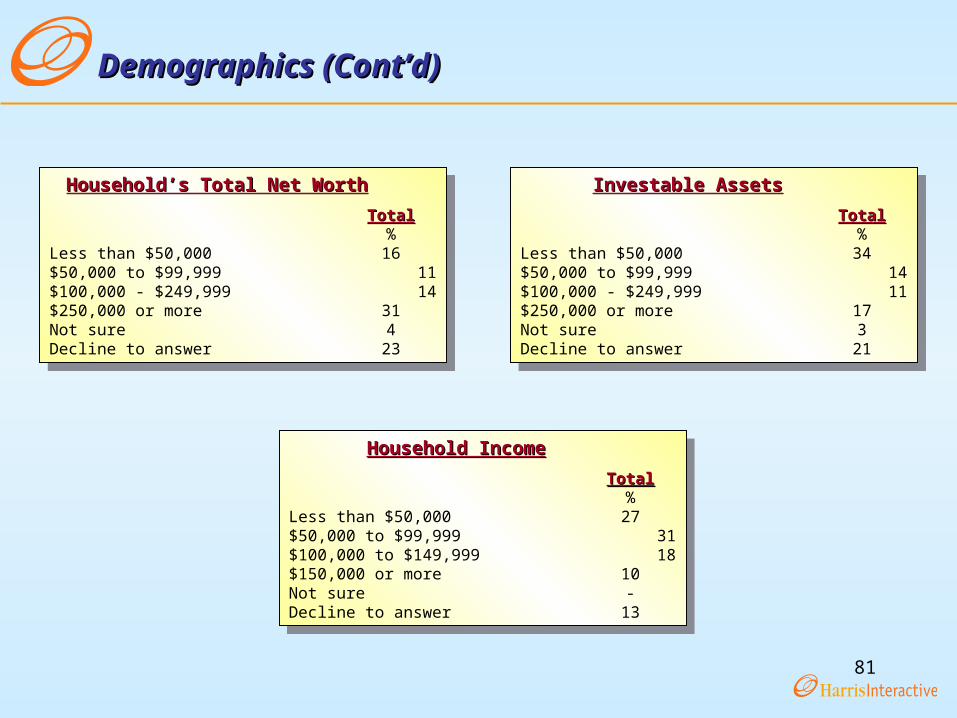
Demographics (Cont’d)Demographics (Cont’d)
Household’s Total Net WorthHousehold’s Total Net Worth
TotalTotal%
Less than $50,000 16$50,000 to $99,999 11$100,000 - $249,999 14$250,000 or more 31Not sure 4Decline to answer 23
Household’s Total Net WorthHousehold’s Total Net Worth
TotalTotal%
Less than $50,000 16$50,000 to $99,999 11$100,000 - $249,999 14$250,000 or more 31Not sure 4Decline to answer 23
Investable AssetsInvestable Assets
TotalTotal%
Less than $50,000 34$50,000 to $99,999 14$100,000 - $249,999 11$250,000 or more 17Not sure 3Decline to answer 21
Investable AssetsInvestable Assets
TotalTotal%
Less than $50,000 34$50,000 to $99,999 14$100,000 - $249,999 11$250,000 or more 17Not sure 3Decline to answer 21
Household IncomeHousehold Income
TotalTotal%
Less than $50,000 27$50,000 to $99,999 31$100,000 to $149,999 18$150,000 or more 10Not sure -Decline to answer 13
Household IncomeHousehold Income
TotalTotal%
Less than $50,000 27$50,000 to $99,999 31$100,000 to $149,999 18$150,000 or more 10Not sure -Decline to answer 13
82
Demographics (Cont’d)Demographics (Cont’d)
RegionRegion
TotalTotal%
East 24Midwest 20South 33West 23
RegionRegion
TotalTotal%
East 24Midwest 20South 33West 23
Size of PlaceSize of Place
TotalTotal
%Central counties of metro areas of 1 million or more 51Fringe counties of metro areas of 1 million or more 4Counties in metro areas of 250,000 to 1 million 23Counties in metro areas of fewer than 250,000 9Urban population of 20,000 or more, adjacent to metro area 3Urban population of 20,000 or more, not adjacent to metro area 1Urban population of 2,500-19,999, adjacent to metro area 4Urban population of 2,500-19,999, not adjacent to metro area 3Completely rural or less than 2,500 urban population, *adjacent to metro areaCompletely rural or less than 2,500 urban population, 1not adjacent to metro areaNA 1
83
Detailed MethodologyDetailed Methodology
84
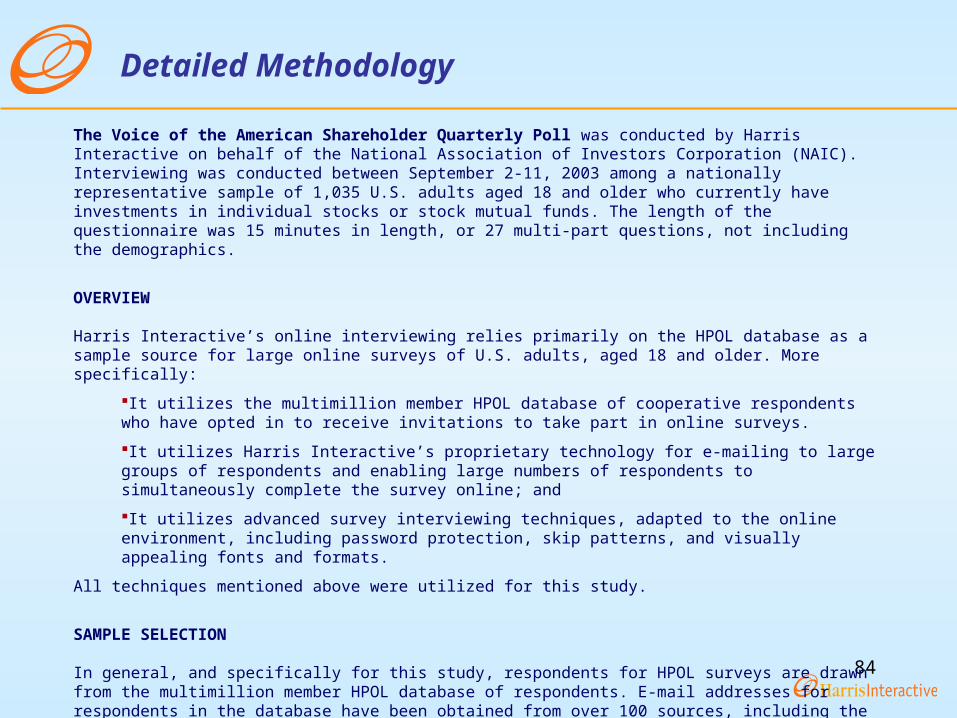
Detailed Methodology
The Voice of the American Shareholder Quarterly Poll was conducted by Harris Interactive on behalf of the National Association of Investors Corporation (NAIC). Interviewing was conducted between September 2-11, 2003 among a nationally representative sample of 1,035 U.S. adults aged 18 and older who currently have investments in individual stocks or stock mutual funds. The length of the questionnaire was 15 minutes in length, or 27 multi-part questions, not including the demographics.
OVERVIEW
Harris Interactive’s online interviewing relies primarily on the HPOL database as a sample source for large online surveys of U.S. adults, aged 18 and older. More specifically:
It utilizes the multimillion member HPOL database of cooperative respondents who have opted in to receive invitations to take part in online surveys.
It utilizes Harris Interactive’s proprietary technology for e-mailing to large groups of respondents and enabling large numbers of respondents to simultaneously complete the survey online; and
It utilizes advanced survey interviewing techniques, adapted to the online environment, including password protection, skip patterns, and visually appealing fonts and formats.
All techniques mentioned above were utilized for this study.
SAMPLE SELECTION
In general, and specifically for this study, respondents for HPOL surveys are drawn from the multimillion member HPOL database of respondents. E-mail addresses for respondents in the database have been obtained from over 100 sources, including the HPOL registration site, Yahoo!, HPOL banner advertisements, and MSN/Hotmail.
85
Detailed Methodology (cont’d)
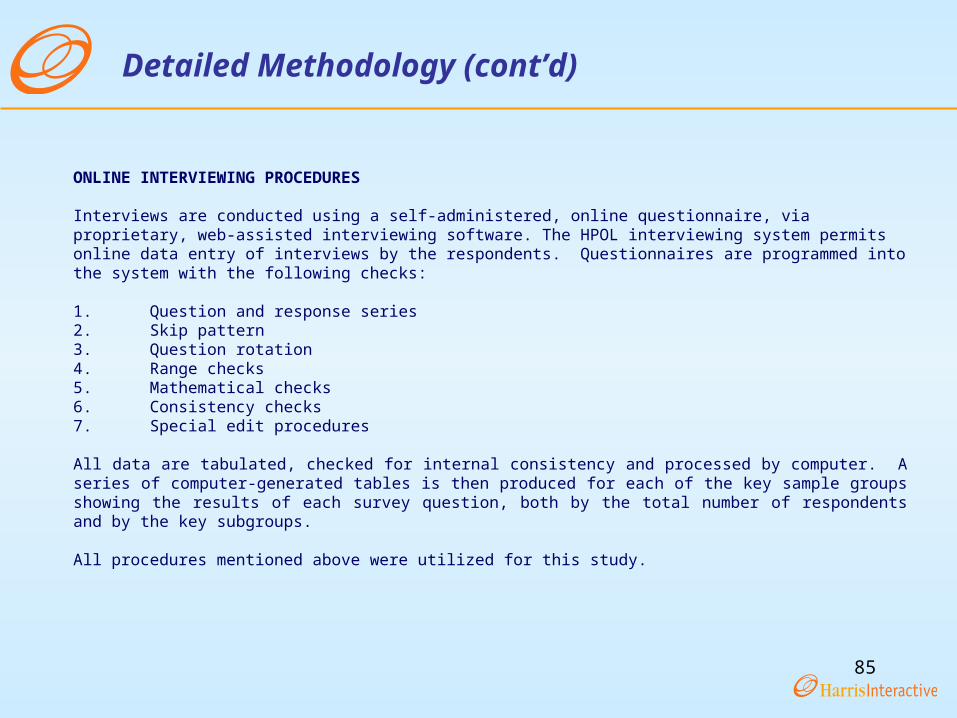
ONLINE INTERVIEWING PROCEDURES
Interviews are conducted using a self-administered, online questionnaire, via proprietary, web-assisted interviewing software. The HPOL interviewing system permits online data entry of interviews by the respondents. Questionnaires are programmed into the system with the following checks: 1. Question and response series2. Skip pattern3. Question rotation4. Range checks5. Mathematical checks6. Consistency checks7. Special edit procedures All data are tabulated, checked for internal consistency and processed by computer. A series of computer-generated tables is then produced for each of the key sample groups showing the results of each survey question, both by the total number of respondents and by the key subgroups.
All procedures mentioned above were utilized for this study.
86
Detailed Methodology (cont’d)
CONTROL OF THE SAMPLE
To maintain the reliability and integrity in the sample, the following procedures are used:
1. Password protectionEach invitation contains a password that is uniquely assigned to that e-mail address. A respondent is required to enter the password at the beginning of the survey to gain access into the survey. Password protection ensures that a respondent completes the survey only one time. This process was used for this study.
2. Reminder invitations To increase the number of respondents in the survey and to improve overall response rates, up to two additional reminder invitations are typically mailed at 2-4 day intervals to those respondents who have not yet participated in the survey. For this study, one reminder was sent to respondents.
3. Summary of the survey findingsTo increase the number of respondents in the survey and to improve overall response rates, respondents are provided with a summary of some of the survey responses. This too is done via the Internet. Respondents are sent an email that provides them access to web site that will contain the survey findings. As with the survey itself, this is a password protected site that is accessible for a limited period (1-2 weeks). This procedure was used for this study.
87
Detailed Methodology (cont’d)
WEIGHTING
Typically, completed interviews are weighted to figures obtained from the Current Population Survey (CPS). Harris uses several demographic variables (e.g., sex, age, education, race and ethnicity and income) to generalize survey results to the population at large. In addition, Harris Interactive applies a proprietary technique to the data called "propensity weighting" that essentially balances all the characteristics (e.g., demographic, attitudinal, and behavioral) of online respondents. It is no surprise that certain kinds of people have a greater or lesser likelihood to be online and therefore to reply to our surveys. To account for this, we give each individual a “propensity weight” which corresponds to their likelihood to be online. This ensures that the sample represents the general shareholder population at large and is not skewed toward more active online users or survey takers. People who have a lesser likelihood to be online can act as a proxy for those who are not online at all. Typical propensity weights that we use include measures of activity (our online respondents do more things), knowledge (our online samples are better informed), and attitudes (our online samples are more skeptical or cynical). Both techniques mentioned above were used for this study as well as two additional weighting strategies: 1) any questions relating to online activity were weighted to represent the online shareholder population and 2) any questions that related to offline activity were weighted to represent the general shareholder population. One example of the success of Harris’ online methodology is the Election 2000 surveys. Election 2000 involved a series of national surveys on the presidential election from January to November 2000 as well as statewide polling on the presidential, Senate and governership races in 38 states. The Election 2000 surveys outperformed all other surveys – both telephone and online – and were the most accurate publicly reported surveys. The Election 2000 survey program represented major successes in: 1) the reliability of the data; and 2) the ability to undertake large-scale research that could not be accomplished just by telephone.
88
Detailed Methodology (cont’d)
WEIGHTING (CONT’D)
It is also worth mentioning that Harris conducts parallel telephone and online research on a regular basis through The Harris Poll, our monthly omnibus survey. By conducting this research, Harris is able to track results to make comparisons between data collected online and by phone, closely examine the biases and most importantly, develop strategies for correcting these biases. In fact, Harris has an internal department that is entirely focused on conducting this “research on research.”
EDITING AND CLEANING THE DATA
In general, and specifically for this study, the data-processing staff perform machine edits and additional cleaning for the entire data set. Our edit programs act as a verification of the skip instructions and other data checks that are written into the online program. The edit programs list any errors by case number, question number and type. These are then resolved by senior personnel, who inspect the original file and make appropriate corrections. Complete records are kept of all such procedures.