34
Research, Development and Technology MoDOT RDT 04-004 Void Detection with the Falling Weight Deflectometer January, 2004 RI 99-044
Research, Development and Technology
MoDOT
RDT 04-004
Void Detection with the Falling Weight Deflectometer
January, 2004
RI 99-044

TECHNICAL REPORT DOCUMENTATION PAGE
1. Report No. 2. Government Accession No. 3. Recipient's Catalog No. RDT04-004 4. Title and Subtitle 5. Report Date
January 2004 6. Performing Organization Code
Void Detection with the Falling Weight Deflectometer
MoDOT 7. Author(s) 8. Performing Organization Report No. Missouri Department of Transportation RDT 04-004 / RI99-044 9. Performing Organization Name and Address 10. Work Unit No.
11. Contract or Grant No.
Missouri Department of Transportation Research, Development and Technology P. O. Box 270-Jefferson City, MO 65102 12. Sponsoring Agency Name and Address 13. Type of Report and Period Covered
Final Report 14. Sponsoring Agency Code
Missouri Department of Transportation Research, Development and Technology P. O. Box 270-Jefferson City, MO 65102 15. Supplementary Notes The investigation was conducted in cooperation with the U. S. Department of Transportation, Federal Highway Administration. 16. Abstract This study evaluated the effectiveness of the falling weight deflectometer (FWD) for determining the presence of voids under concrete pavement slabs at bridge approach locations. It also evaluated the deflection improvement, after the slabs with voids had been undersealed with polyurethane, by using the AASHTO ‘rapid void detection procedure’. 17. Key Words 18. Distribution Statement Falling weight deflectometer, void detection, polyurethane undersealing, deflections
No restrictions. This document is available to the public through National Technical Information Center, Springfield, Virginia 22161
19. Security Classification (of this report) 20. Security Classification (of this page) 21. No. of Pages 22. Price Unclassified Unclassified 6 w/o Appendix
Form DOT F 1700.7 (06/98)
Final Report
RI 99-044
Void Detection with the Falling Weight Deflectometer
MISSOURI DEPARTMENT OF TRANSPORTATION RESEARCH, DEVELOPMENT, AND TECHNOLOGY
BY: John P. Donahue, P.E.
JEFFERSON CITY, MISSOURI DATE SUBMITTED: January 14, 2004
The opinions, findings, and conclusions expressed in this publication are those of the principal investigator and the Missouri Department of Transportation; Research, Development, and Technology. They are not necessarily those of the U.S. Department of Transportation, Federal Highway Administration. This report does not constitute a standard or regulation.

EXECUTIVE SUMMARY
The objective of this study was to evaluate the efficiency of the falling weight deflectometer (FWD) for determining the presence of voids under concrete pavement slabs at bridge approach locations. It also evaluated the deflection improvement (reduction), after the slabs with voids had been undersealed with polyurethane, by using the AASHTO ‘rapid void detection procedure’. Based on the AASHTO procedure the FWD did a very good job of (1) locating suspect slabs and (2) verifying their improvement in support after undersealing. The FWD has several advantages over conventional ‘proof rolling’ for void detection including (1) less manpower required (no one has to set up and read gauge), (2) less time spent on lane closure (especially critical at bridge approaches where the structure has inadequate shoulder width), (3) no influence of shoulder movement to apparatus, (4) better truck simulation with dynamic loading, and (5) load vs. deflection trends provided by multiple load levels. The FWD is recommended for future void detection use when available.
Table of Contents
Introduction........................................................................................................................ 2 Objective ............................................................................................................................. 2 Discussion of Present Conditions...................................................................................... 2 Technical Approach........................................................................................................... 3 Results and Discussion ...................................................................................................... 4 Conclusions ........................................................................................................................ 5 Recommendations .............................................................................................................. 6
Appendix A - Approach Slab Diagrams Appendix B - Load versus Deflection Graphs

Introduction The practice of good preventive maintenance requires attention to bridge and roadway features that have not yet deteriorated to the point of obvious physical distress. By detecting certain symptoms, such as in this case, the development of voids underneath pavement slabs at bridge approaches, the Missouri Department of Transportation (MoDOT) can, either with its maintenance forces or by contract, apply remedial treatments at an early stage and avoid costly full-scale rehabilitation or replacement at a later date. The falling weight deflectometer (FWD) has proven to be an effective tool for evaluating the stiffness of AC and PCC pavement layers and their subgrades, and the load transfer at PCCP joints. It can also be used to detect voids through a series of corner deflection drops, which is the focus of this investigation.
Objective The objective of this investigation is to evaluate the effectiveness of using the falling weight deflectometer (FWD) for large void detection at bridge approach slabs. A secondary objective, which is the focus of another ongoing investigation, is the effectiveness of a polyurethane undersealing material in lieu of the standard grout mixture.
Discussion of Present Conditions Concrete pavement joints must provide good load transfer with low maximum deflections. Prior to an overlay or as a stand alone remedial treatment, slabs that are suspected of providing weak support at their transverse edges are tested for deflections and load transfer. Missouri has extensively used grout undersealing for filling in voided areas under slab edges and improving support where these fail to meet minimum test criteria. The standard test method for measuring support in the past has been �proof rolling� as defined in MoDOT Test Method T64. A vehicle, usually a dump truck, is loaded till its rear axle weighs 18,000 pounds. The rear tires are placed one foot beyond the edge of a transverse joint. A deflection instrument sitting on the shoulder has gauge arms extended over onto the approach and leave sides of the driving lane joint. The gauges measure the drop in slab edge elevation when the vehicle is at rest near the joint. The readings provide maximum deflections and load transfer (LT) efficiencies (unloaded slab edge / loaded slab edge X 100). Joints with LTs greater than 65% and loaded side deflections ≥ 17.5 mils (0.0175 inches) are undersealed. Joints with LTs less than 65% and loaded side deflections ≥ 17.5 mils (0.0175 inches) are typically replaced.
2
The advantages of using the FWD over the proof rolling method are: (1) less manpower required (no one has to set up and read gauge), (2) less time spent on lane closure (especially critical at bridge approaches where the structure has inadequate shoulder width), (3) no influence of shoulder movement to apparatus, (4) better truck simulation with dynamic loading, and (5) load vs. deflection trends provided by multiple load levels.
Technical Approach The RD&T functional unit coordinated with District Seven operations personnel to develop a list of bridge approaches for testing with the FWD. A total of 50 bridges spread across Lawrence, Jasper, and MacDonald counties on I-44 and US 71 comprised the original list. Time limitations and the danger and inconvenience of extended lane closures, especially on two-lane US 71 in MacDonald county, reduced the number of bridges to twenty-seven. The selected bridges were tested with the FWD during December 1999. An attempt was made to check the three or four closest slabs on both sides of the structure. Tests were run in close accordance with 1993 AASHTO pavement design guide protocol. The load tests were conducted on the leave side of the joint near the outside corner of the driving lane. Load levels were approximately 9,000, 12,000, and 16,000 pounds. Over two hundred joints were tested. Cursory pavement distress surveys were also conducted. Load versus deflection graphs were plotted for each joint. The linear trend line for each joint was backcast to its deflection (x) axis intercept. Joints with intercepts greater than three mils became undersealing candidates. A marginal undersealing candidate met the deflection axis between three and seven mils, while a strong undersealing candidate equaled or exceeded seven mils. FWD drop locations and recommended undersealing sites were illustrated for each bridge (Appendix A). A total of twenty-seven joints were recommended for undersealing. Load transfer was not evaluated in this study. District Seven elected to underseal all twenty-seven joints with polyurethane. A contractor performed the undersealing during the Spring of 2001. FWD testing was performed on twenty-two of the twenty-seven undersealed joints in the Spring of 2002. Two of the remaining five joints had been replaced with full-depth repairs. The other three joints were mistakenly omitted during the repairs. Plots of load versus deflection were generated and compared with pre-undersealing data. No coring was performed to verify the presence of voids before undersealing or the lack of voids after undersealing.
3

Results and Discussion The results of the polyurethane undersealing operations on slab corner deflections are summarized in the Table below. The before- and after-undersealing deflections in the table are normalized to 10,000 pounds using the linear regression equation generated for the trend line. The linear regression plots for each slab location are shown in Appendix B.
Bridge # Rte Dir Slab
Defl. �axis intercept
after undersealing
Before Undersealing
Defl. @ 10K lb (mils)
After Undersealing
Defl. @ 10K lb (mils)
Improvement (mils)
A-2022 71 NB 3rd-Appr 0.00 24.58 7.82 16.76A-2022 71 NB 2nd-Appr -0.41 23.06 8.13 14.93A-4829 71 NB 3rd-Appr -1.18 17.41 9.26 8.15A-4829 71 NB 2nd-P-Leav 0.24 14.32 7.89 6.43A-4928 71 SB 1st-C-Appr 0.87 14.35 16.88 -2.53A-937 44 WB 2nd-P-Leav -1.88 17.84 9.28 8.56A-936 44 WB 4th-Appr -2.76 58.52 10.71 47.81A-936 44 WB 3rd-Appr 1.50 17.90 10.84 7.06A-936 44 WB 2nd-Appr -0.96 34.27 11.96 22.31A-936 44 WB 1st-P-Appr -1.10 15.36 17.42 -2.06A-981 44 WB Appr-Appr 0.79 19.28 9.44 9.84A-981 44 WB 3rd-Leav -1.18 22.57 6.97 15.60A-978 44 WB 1st-Appr 11.49 15.21 27.96 -12.75A-978 44 WB Appr-Appr 4.43 16.04 17.02 -0.98A-862 44 WB 2nd-P-Appr 3.92 15.28 16.86 -1.58A-543 44 WB 3rd-C-Appr -0.22 14.30 8.86 5.44A-541 44 WB 1st-Appr 0.25 17.70 10.24 7.46A-541 44 WB Appr-Leav 0.08 11.42 1.83 9.59A-541 44 WB 3rd-Appr 4.19 15.64 17.59 -1.95A-541 44 WB 2nd-P-Appr -0.56 17.17 11.86 5.31A-541 44 EB 1st-P-Appr -0.45 15.79 7.77 8.02A-541 44 EB 3rd-P-Leav -0.34 19.19 9.28 9.91
Deflection reduction average for all 22 slabs = 8.24 (mils) Deflection reduction standard deviation for all 22 slabs = 11.78 (mils) Deflection reduction average for 16 slabs with positive improvement = 12.70 (mils) Deflection reduction standard deviation for 16 slabs with positive improvement = 10.48 (mils)
Sixteen of the 22 slabs showed positive reduction in deflections after undersealing. The average reduction for the 16 improved slabs was 12.70 mils. The reduction for the 4th slab on the approach side of Bridge A-936 was more than double the next highest improvement, so that the average was skewed somewhat by this statistical outlier.
4

Six of the slabs did not show an improvement, but actually had higher deflections after the undersealing. Five of the six slabs had deflections that were ≤ 2.53 (mils) higher, which were negligible enough to indicate that the slabs were nearly unaffected by the undersealing. The sixth slab had a significant deflection increase of 12.75 (mils) after undersealing. One explanation may be derived from the pavement diagram in Appendix A for the 1st slab on the approach side of Bridge A-978, which shows a crack at the corner location. The testing performed before undersealing had the load plate intentionally moved up to avoid being seated on a floating piece. It is possible that the testing performed after undersealing was mistakenly positioned on the broken corner, which would have resulted in much higher deflections. The table also contains the deflection value on the x-axis where it is intercepted by the linear trend line. The AASHTO Guide for Design of Pavement Structures, adopting recommendations from the NCHRP 1-21 Final Report in 1984 for the �rapid void detection procedure�, uses an x-axis intercept of 2 (mils) as the maximum limit for slabs without apparent voids underneath. Eighteen of the 22 slabs had x-axis intercepts less than 2 (mils), indicating they had no voids. The four remaining slabs had higher intercepts and they were also among the six slabs that had no reduction in deflections. The other two out of the six slabs had shallower linear trend slopes, so despite their higher deflections after undersealing, their intercepts had been reduced below 2 (mils). The reason for this is uncertain, although it is known these slabs were two out of the three that were less than ten feet in length. Therefore, undersealing may have filled any voids underneath, but the slabs were not long enough to prevent rocking from corner loading.
Conclusions The FWD is an efficient tool to use for void detection under PCC pavement slabs, assuming the rapid void detection procedure is correct. Plotting the linear trend for load-versus-deflection before and after undersealing is simple. The assumptions about linearity, within the 9,000 to 16,000 (lb) range, appear to be accurate based on the plots in Appendix B. In 73 percent (16 of 22) of the slabs that were undersealed there was clear evidence in the plots that an improvement had been made. Two of the six slabs, whose load deflections had not improved, still had a change in deflection slope, thus indicating that some betterment had occurred. Another one of the six slabs may have been tested improperly on a cracked piece after undersealing. The remaining three slabs showed negligible changes for unexplained reasons, assuming that they had been properly undersealed. Although it is the primary intent of another study to evaluate the effectiveness of the polyurethane undersealing process, it can be concluded from the FWD tests that a positive improvement in support did occur under most of the slabs. It may be a more reliable process than grout undersealing, which, although cheaper, has in the past on occasions caused uneven filling of voids, because of its high viscosity, and created greater support problems than existed before.
5
Recommendations The FWD should be used for determining voids under PCC slabs, assuming the FWD and operator are available, when the following conditions are met:
1) undersealing is being considered as a preventive maintenance treatment and one or more of the following
2) long lane closures for proof roll testing are not desirable (ex. at bridge approaches with reduced shoulder widths, high volume routes, etc.)
3) fewer personnel, than required with proof rolling, are available for testing 4) the pavement shoulder is unstable for accurate proof rolling measurements 5) more clear and quantifiable indications of undersealing improvements, than proof
rolling can provide, are desired (i.e. AASHTO rapid void detection procedure).
6

APPENDIX A
Approach Slab Diagrams

BRIDGE APPROACH SLAB CONDITION SHEET Rt: US 71 (NB) County: Jasper Date: 12/15/99 Bridge Number: A-2022 Bridge Location: Center Creek overflow
0� 1/16� 8/16�
E
1/16� 6/
Crack
Grout Hole
Direction of
8/16�
BRIDG
BRIDG
16� 10/16
E
BRIDG
-
Faulting
PCC Patch AC Patch STRONG UNDERSEALINGFWD Test
MARGINAL UNDERSEALING

BRIDGE APPROACH SLAB CONDITION SHEET Rt: US 71 NB County: Jasper Date: 12/15/99 Bridge Number: A-4829 Bridge Location: N. of Spring River
4/16�8/16�
BRIDG
BRIDG
BRIDGE
0� - 7/16�1/16�
Faulting PCC Patch
AC Patch
Crack
Grout Hole
STRONG UNDERSEALING
FWD Test
MARGINAL UNDERSEALING
Direction of
0� 1/16�
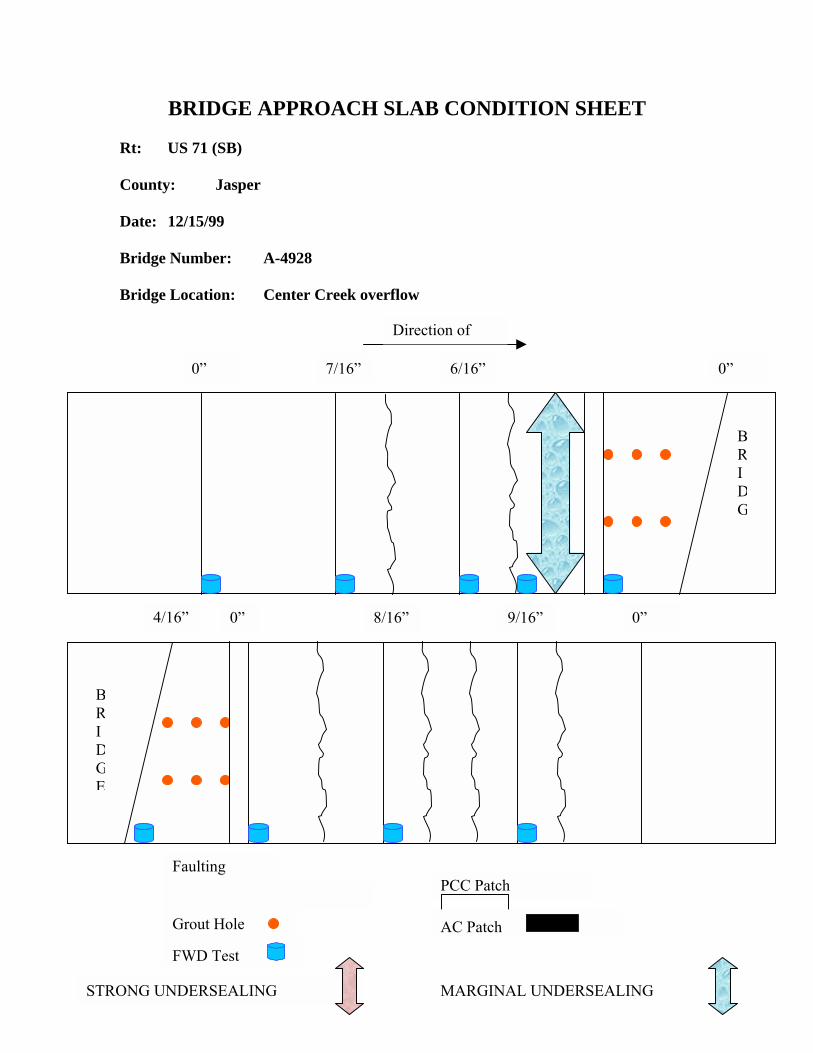
BRIDGE APPROACH SLAB CONDITION SHEET Rt: US 71 (SB) County: Jasper Date: 12/15/99 Bridge Number: A-4928 Bridge Location: Center Creek overflow
6/16�7/16�
BRIDG
4/16� 8/16� 9/16�0� 0�
BRIDGE
BRIDG
Direction of
0� 0�
Crack
FWD Test
STRONG UNDERSEALING
Grout Hole
Faulting PCC Patch
AC Patch
MARGINAL UNDERSEALING

BRIDGE APPROACH SLAB CONDITION SHEET Rt: I-44 (WB) County: Lawrence Date: 12/13/99 Bridge Number: A-937 Bridge Location: Turnback Creek
5/16�5/16�
BRIDG
2/16� -2/16�
BRIDGE
BRIDG
Direction of
3/16� 0� 0�
FWD Test
STRONG UNDERSEALING
Grout Hole
Crack
Faulting PCC Patch
AC Patch
MARGINAL UNDERSEALING
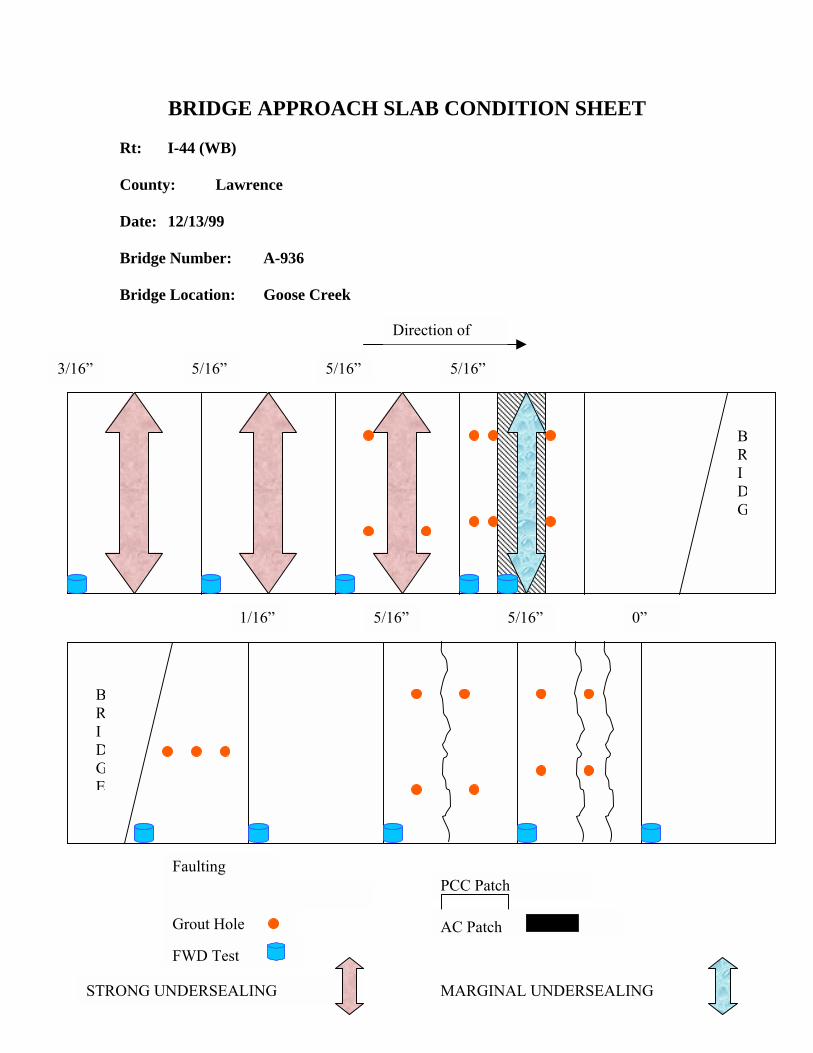
BRIDGE APPROACH SLAB CONDITION SHEET Rt: I-44 (WB) County: Lawrence Date: 12/13/99 Bridge Number: A-936 Bridge Location: Goose Creek
5/16�5/16�
BRIDG
0� 5/16�5/16�1/16�
BRIDGE
BRIDG
Direction of
3/16� 5/16�
Crack
FWD Test
STRONG UNDERSEALING
Grout Hole
Faulting PCC Patch
AC Patch
MARGINAL UNDERSEALING

BRIDGE APPROACH SLAB CONDITION SHEET Rt: I-44 (WB) County: Lawrence Date: 12/14/99 Bridge Number: A-981 Bridge Location: Williams Creek
2/16�3/16�1/16�0�
BRIDG
0� 5/16� 2/16�6/16�1/16�
BRIDGE
BRIDG
Direction of
1/16� 0� -
FWD Test
STRONG UNDERSEALING
Grout Hole
Crack
Faulting PCC Patch
AC Patch
MARGINAL UNDERSEALING

BRIDGE APPROACH SLAB CONDITION SHEET Rt: I-44 (WB) County: Lawrence Date: 12/14/99 Bridge Number: A-978 Bridge Location: Rt. H overpass @ Exit #44
5/16�3/16� 5/16�
BRIDG
10/168/16�0�
BRIDGE
BRIDG
Direction of
0� 5/16�
Crack
FWD Test
STRONG UNDERSEALING
Grout Hole
Faulting PCC Patch
AC Patch
MARGINAL UNDERSEALING
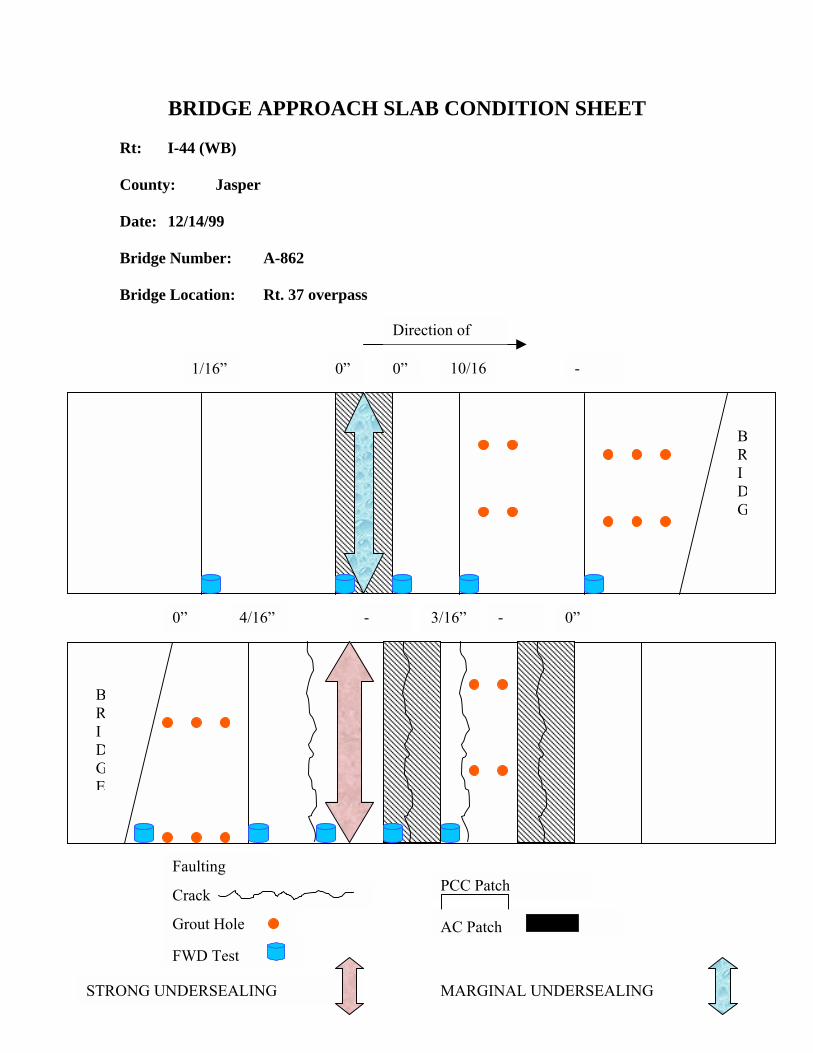
BRIDGE APPROACH SLAB CONDITION SHEET Rt: I-44 (WB) County: Jasper Date: 12/14/99 Bridge Number: A-862 Bridge Location: Rt. 37 overpass
0� 10/160�
BRIDG
3/16�0� 0� --4/16�
BRIDGE
BRIDG
Direction of
1/16� -
FWD Test
STRONG UNDERSEALING
Grout Hole
Crack
Faulting PCC Patch
AC Patch
MARGINAL UNDERSEALING

BRIDGE APPROACH SLAB CONDITION SHEET Rt: I-44 (WB) County: Jasper Date: 12/14/99 Bridge Number: A-543 Bridge Location: Jones Creek
0� 0�
BRIDG
4/16�2/16�
BRIDGE
BRIDG
Direction of
3/16� 1/16�
Crack
FWD Test
STRONG UNDERSEALING
Grout Hole
Faulting PCC Patch
AC Patch
MARGINAL UNDERSEALING
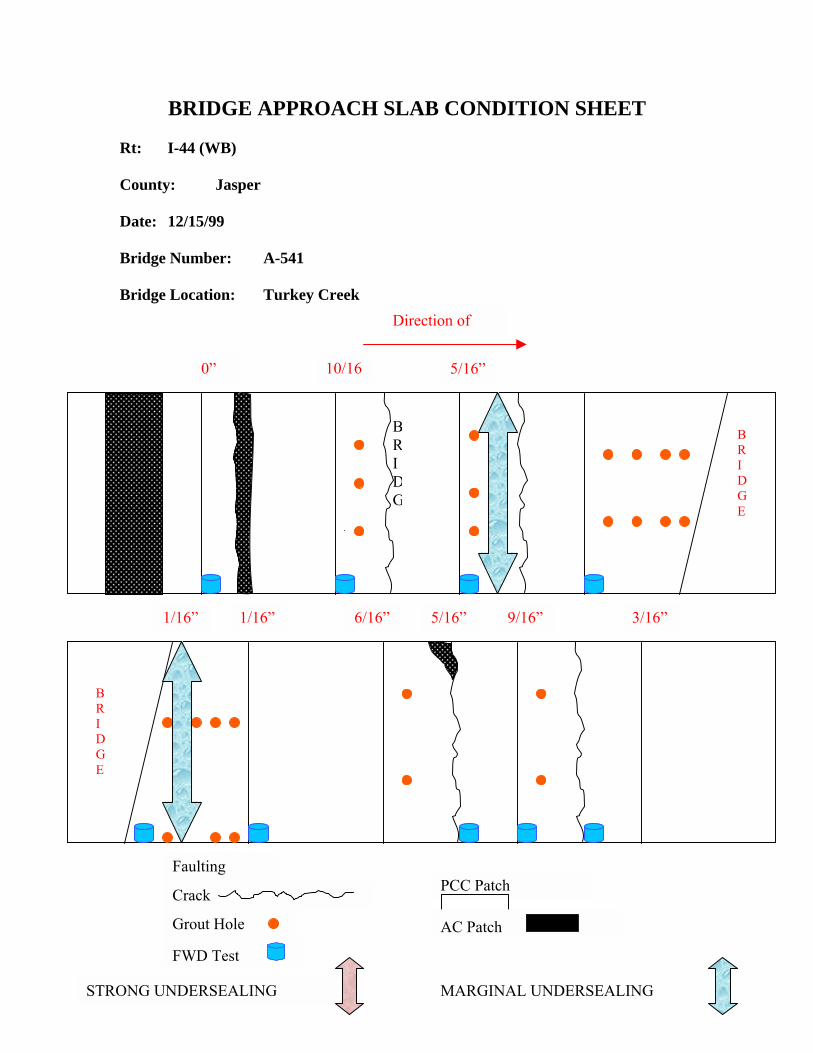
BRIDGE APPROACH SLAB CONDITION SHEET Rt: I-44 (WB) County: Jasper Date: 12/15/99 Bridge Number: A-541 Bridge Location: Turkey Creek Direction of
0� 10/16 5/16�
BRIDG
1/16� 1/16� 6/16� 9/16� 3/16�5/16�
BRIDGE
BRIDGE
FWD Test
STRONG UNDERSEALING
Grout Hole
Crack
Faulting PCC Patch
AC Patch
MARGINAL UNDERSEALING

BRIDGE APPROACH SLAB CONDITION SHEET Rt: I-44 (EB) County: Jasper Date: 12/15/99 Bridge Number: A-541 Bridge Location: Turkey Creek
0�0� 1/16�
BRIDG
0� 7/16� 3/16�2/16�7/16�1/16� 2/16�
BRIDGE
BRIDG
Direction of
1/16� 1/16� 1/16� 0�
Crack
FWD Test
STRONG UNDERSEALING
Grout Hole
Faulting PCC Patch
AC Patch
MARGINAL UNDERSEALING

APPENDIX B
Load vs. Deflection Graphs

US 71 NB at Bridge A-2022 in Jasper Co.3rd Approach Slab
0
2000
4000
6000
8000
10000
12000
14000
16000
18000
20000
0 2 4 6 8 10 12 14 16 18 20 22 24 26 28 30 32 34 36 38 40
Ave. Deflection (mils)
Ave
. Loa
d (lb
) Before Undersealing
After Undersealing
US 71 NB at Bridge A-2022 in Jasper Co.2nd Approach Slab
0
2000
4000
6000
8000
10000
12000
14000
16000
18000
20000
0 2 4 6 8 10 12 14 16 18 20 22 24 26 28 30 32 34 36 38 40
Ave. Deflection (mils)
Ave
. Loa
d (lb
)
Before Undersealing
After Undersealing

US 71 NB at Bridge A-4829 in Jasper Co.3rd Approach Slab
0
2000
4000
6000
8000
10000
12000
14000
16000
18000
20000
0 2 4 6 8 10 12 14 16 18 20 22 24 26 28 30
Ave. Deflection (mils)
Ave
. Loa
d (lb
)
Before Undersealing
After Undersealing
US 71 NB at Bridge A-4829 in Jasper Co.2nd Leave Slab (Patch)
0
2000
4000
6000
8000
10000
12000
14000
16000
18000
20000
0 2 4 6 8 10 12 14 16 18 20 22 24 26 28 30
Ave. Deflection (mils)
Ave
. Loa
d (lb
)
Before Undersealing
After Undersealing
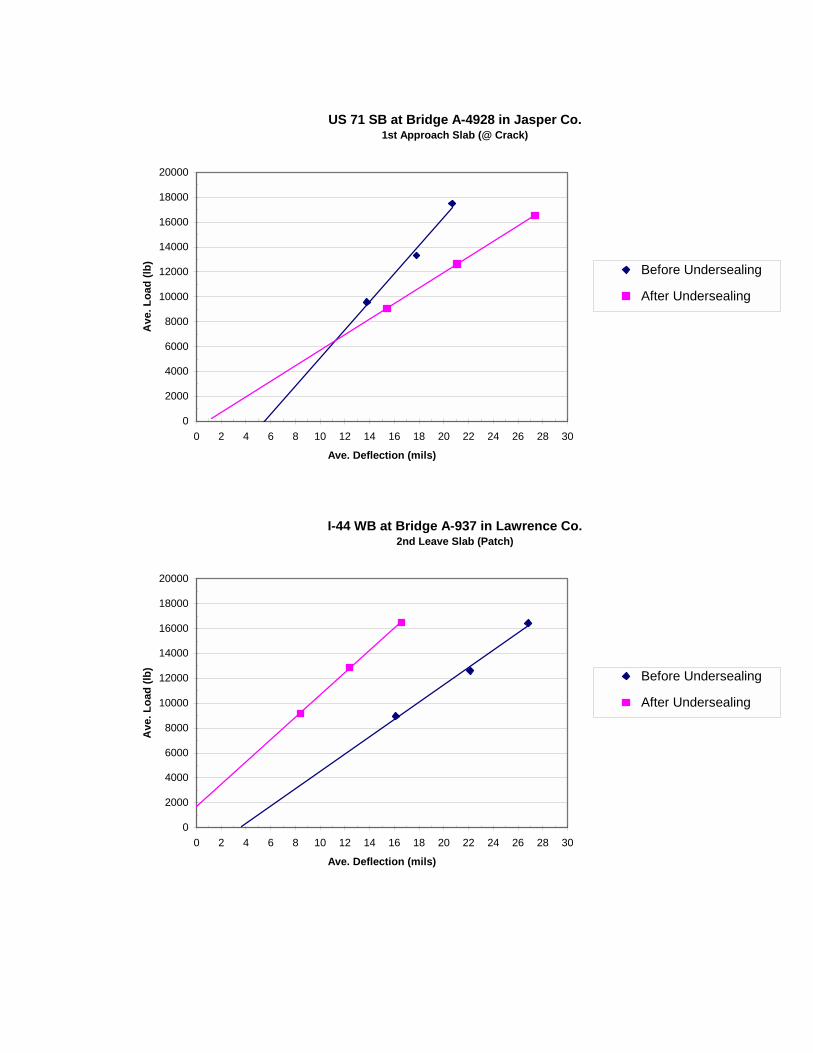
US 71 SB at Bridge A-4928 in Jasper Co.1st Approach Slab (@ Crack)
0
2000
4000
6000
8000
10000
12000
14000
16000
18000
20000
0 2 4 6 8 10 12 14 16 18 20 22 24 26 28 30
Ave. Deflection (mils)
Ave
. Loa
d (lb
)
Before Undersealing
After Undersealing
I-44 WB at Bridge A-937 in Lawrence Co.2nd Leave Slab (Patch)
0
2000
4000
6000
8000
10000
12000
14000
16000
18000
20000
0 2 4 6 8 10 12 14 16 18 20 22 24 26 28 30
Ave. Deflection (mils)
Ave
. Loa
d (lb
)
Before Undersealing
After Undersealing
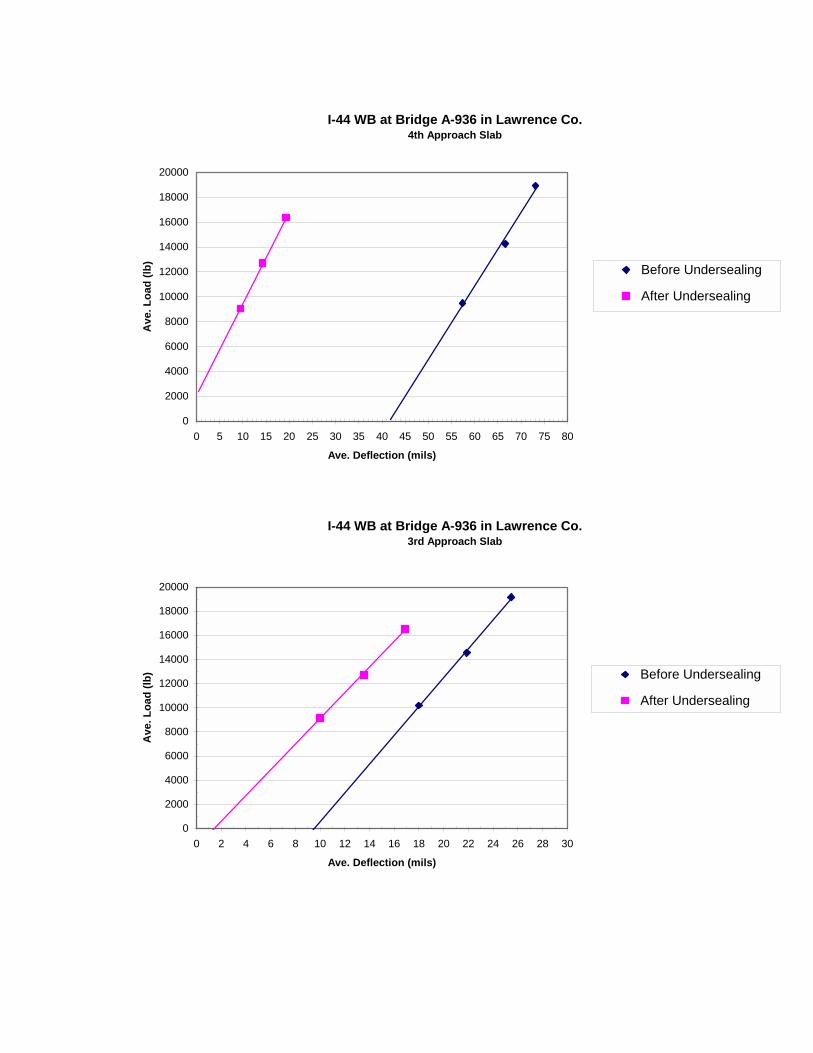
I-44 WB at Bridge A-936 in Lawrence Co.4th Approach Slab
0
2000
4000
6000
8000
10000
12000
14000
16000
18000
20000
0 5 10 15 20 25 30 35 40 45 50 55 60 65 70 75 80
Ave. Deflection (mils)
Ave
. Loa
d (lb
)
Before Undersealing
After Undersealing
I-44 WB at Bridge A-936 in Lawrence Co.3rd Approach Slab
0
2000
4000
6000
8000
10000
12000
14000
16000
18000
20000
0 2 4 6 8 10 12 14 16 18 20 22 24 26 28 30
Ave. Deflection (mils)
Ave
. Loa
d (lb
) Before Undersealing
After Undersealing

I-44 WB at Bridge A-936 in Lawrence Co.2nd Approach Slab
0
2000
4000
6000
8000
10000
12000
14000
16000
18000
20000
0 5 10 15 20 25 30 35 40 45 50 55 60
Ave. Deflection (mils)
Ave
. Loa
d (lb
)
Before Undersealing
After Undersealing
I-44 WB at Bridge A-936 in Lawrence Co.Ist Approach Slab (Patch)
0
2000
4000
6000
8000
10000
12000
14000
16000
18000
20000
0 2 4 6 8 10 12 14 16 18 20 22 24 26 28 30
Ave. Deflection (mils)
Ave
. Loa
d (lb
)
Before Undersealing
After Undersealing
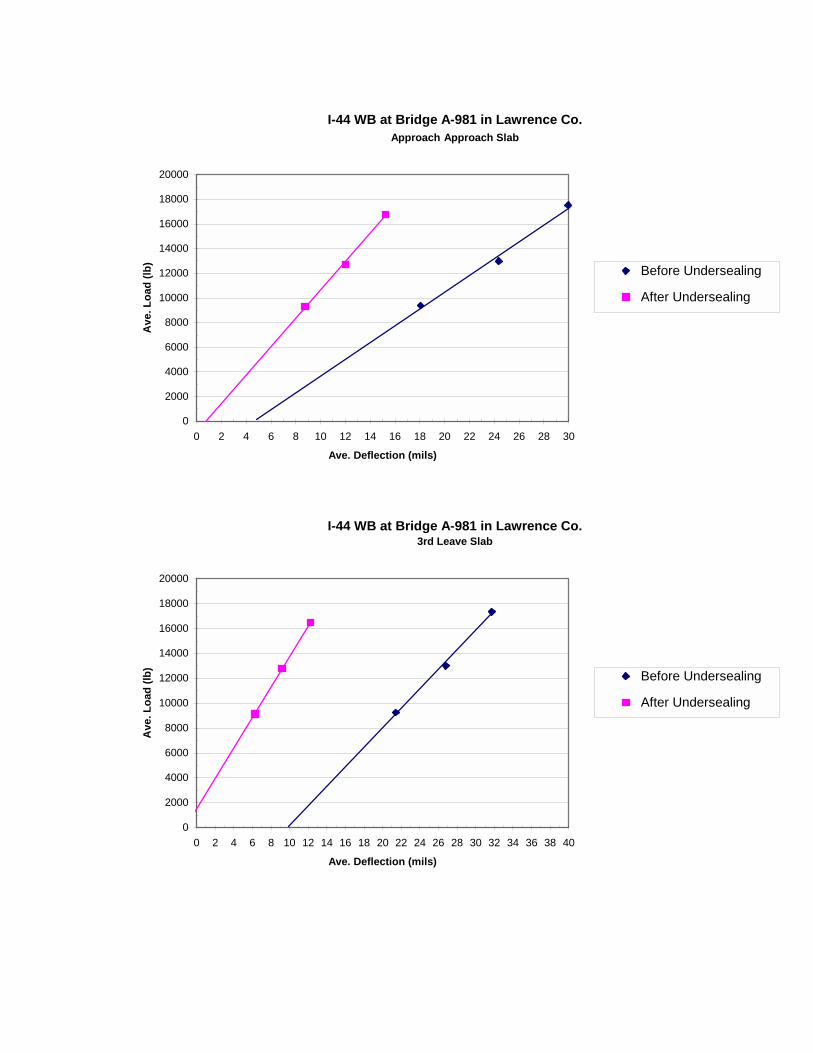
I-44 WB at Bridge A-981 in Lawrence Co.Approach Approach Slab
0
2000
4000
6000
8000
10000
12000
14000
16000
18000
20000
0 2 4 6 8 10 12 14 16 18 20 22 24 26 28 30
Ave. Deflection (mils)
Ave
. Loa
d (lb
)
Before Undersealing
After Undersealing
I-44 WB at Bridge A-981 in Lawrence Co.3rd Leave Slab
0
2000
4000
6000
8000
10000
12000
14000
16000
18000
20000
0 2 4 6 8 10 12 14 16 18 20 22 24 26 28 30 32 34 36 38 40
Ave. Deflection (mils)
Ave
. Loa
d (lb
)
Before Undersealing
After Undersealing
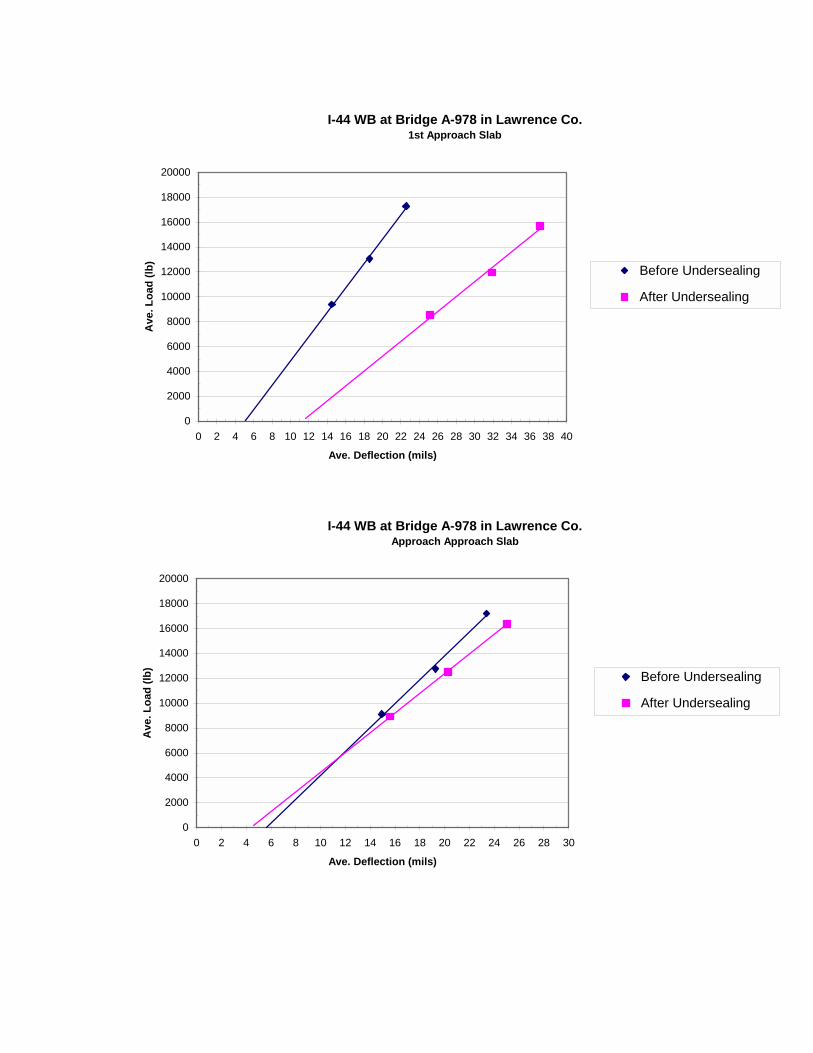
I-44 WB at Bridge A-978 in Lawrence Co.1st Approach Slab
0
2000
4000
6000
8000
10000
12000
14000
16000
18000
20000
0 2 4 6 8 10 12 14 16 18 20 22 24 26 28 30 32 34 36 38 40
Ave. Deflection (mils)
Ave
. Loa
d (lb
)
Before Undersealing
After Undersealing
I-44 WB at Bridge A-978 in Lawrence Co.Approach Approach Slab
0
2000
4000
6000
8000
10000
12000
14000
16000
18000
20000
0 2 4 6 8 10 12 14 16 18 20 22 24 26 28 30
Ave. Deflection (mils)
Ave
. Loa
d (lb
)
Before Undersealing
After Undersealing

I-44 WB at Bridge A-862 in Jasper Co.2nd Approach Slab
0
2000
4000
6000
8000
10000
12000
14000
16000
18000
20000
0 2 4 6 8 10 12 14 16 18 20 22 24 26 28 30
Ave. Deflection (mils)
Ave
. Loa
d (lb
)
Before Undersealing
After Undersealing
I-44 WB at Bridge A-543 in Jasper Co.3rd Approach Slab (@ Crack)
0
2000
4000
6000
8000
10000
12000
14000
16000
18000
20000
0 2 4 6 8 10 12 14 16 18 20 22 24 26 28 30
Ave. Deflection (mils)
Ave
. Loa
d (lb
)
Before Undersealing
After Undersealing

I-44 WB at Bridge A-541 in Jasper Co.1st Approach Slab
0
2000
4000
6000
8000
10000
12000
14000
16000
18000
20000
0 2 4 6 8 10 12 14 16 18 20 22 24 26 28 30
Ave. Deflection (mils)
Ave
. Loa
d (lb
)
Before Undersealing
After Undersealing
I-44 WB at Bridge A-541 in Jasper Co.Approach Leave Slab
0
2000
4000
6000
8000
10000
12000
14000
16000
18000
20000
0 2 4 6 8 10 12 14 16 18 20 22 24 26 28 30
Ave. Deflection (mils)
Ave
. Loa
d (lb
)
Before Undersealing
After Undersealing

I-44 EB at Bridge A-541 in Jasper Co.3rd Approach Slab
0
2000
4000
6000
8000
10000
12000
14000
16000
18000
20000
0 2 4 6 8 10 12 14 16 18 20 22 24 26 28 30
Ave. Deflection (mils)
Ave
. Loa
d (lb
)
Before Undersealing
After Undersealing
I-44 EB at Bridge A-541 in Jasper Co.2nd Approach Slab (Patch)
0
2000
4000
6000
8000
10000
12000
14000
16000
18000
20000
0 2 4 6 8 10 12 14 16 18 20 22 24 26 28 30
Ave. Deflection (mils)
Ave
. Loa
d (lb
)
Before Undersealing
After Undersealing

I-44 EB at Bridge A-541 in Jasper Co.1st Aproach Slab (Patch)
0
2000
4000
6000
8000
10000
12000
14000
16000
18000
20000
0 2 4 6 8 10 12 14 16 18 20 22 24 26 28 30
Ave. Deflection (mils)
Ave
. Loa
d (lb
)
Before Undersealing
After Undersealing
I-44 EB at Bridge A-541 in Jasper Co.3rd Leave Slab (Patch)
0
2000
4000
6000
8000
10000
12000
14000
16000
18000
20000
0 2 4 6 8 10 12 14 16 18 20 22 24 26 28 30
Ave. Deflection (mils)
Ave
. Loa
d (lb
)
Before Undersealing
After Undersealing


