Volume Seven, Number Two Winter 2005 C ENTER F OR E CONOMIC S ELF -R ELIANCE MARRIOTT S CHOOL BRIGHAM YOUNG UNIVERSITY PROVO, UT of Journal Microfinance S CHOOL OF B USINESS BRIGHAM YOUNG UNIVERSITY–HAWAII LAIE, HI
Transcript
Volume Seven, Number Two
Winter 2005
CENTER FOR ECONOMIC
SELF-RELIANCE
MARRIOTT SCHOOLBRIGHAM YOUNG UNIVERSITY
PROVO, UT
ofJournalMicrofinance
SCHOOL OF BUSINESSBRIGHAM YOUNG UNIVERSITY–HAWAII
LAIE, HI
The Journal of Microfinance thanks the following for their contributions:
The Marriott School at Brigham Young University
The BYU Humanities Publication Center, for editing and production services.Director: Professor Melvin J. Thorne; Student Assistants: Alicia Owings, LuciNielsen, Megan Hale, and Geneil Johnson
Journal of Microfinanceis a joint publication of
The Center for Economic Self-Reliance,Marriott School,
at Brigham Young UniversityProvo, UT, USA
and the School of BusinessBrigham Young University–Hawaii
This will be the final issue of the Journal of Microfinance before it changesits title and focus as explained below. As we mark this transition, we lookback with appreciation on the genesis of the journal. Particular thanks goto Gary Woller and Warner Woodworth for their vision in seeing the needfor a journal that would formalize microfinance as a serious topic of aca-demic research.
This vision of a journal that would open the dialogue between practi-tioners and academics on the topic of microfinance was only realizedthrough the hard work and support of many individuals and institutions.Gary Woller is especially deserving for his efforts as editor in the earliestyears of the journal. He worked tirelessly to create awareness of the Journalof Microfinance, recruiting a strong group of reviewers as well as establish-ing the journal’s reputation among researchers. As a result of his efforts, thejournal reached a point where only about twenty-five percent of articlessubmitted were accepted for publication, putting the Journal of Microfinanceon par with other top journals in the field.
Gary was supported in this effort by the George W. Romney Institutefor Public Management and the Center for Economic Self-Reliance of theMarriott School at Brigham Young University. Additional support camefrom the School of Business at Brigham Young University–Hawaii, bothfinancially and editorially through Beth Haynes, who served as BookReview Editor, while I served as co-editor of the journal.
Of course, additional thanks go out to our fine editorial board, con-sisting of many leaders in the field of microfinance. I also wish to expressgratitude for the fine work of our many volunteer reviewers, who workedhard to ensure the quality of the articles that appeared in the journal.
Finally, to the authors of the research appearing in the Journal ofMicrofinance, I wish to extend my congratulations for having made thejournal into a demanding and innovative publication. Your efforts have ledus all to think about the practice of microfinance in ways that will push themovement forward for years to come. In fact, the journal’s shift from amore narrow focus on microfinance to a broader focus on economic self-reliance is indicative of the lessons we have learned as we have sought bet-ter ways to reduce poverty throughout the world.
Again, I thank all who have been involved in trying to make this worlda better place through the use of microfinance. Your work continues to bevaluable in the push toward greater economic self-reliance and will find a
welcoming home in the new publication, Advances in Economic Self-Reliance.
Norman WrightEditor, Journal of Microfinance
With the next issue, the name, focus, and format of the Journal ofMicrofinance will change—the new name will be Advances in Economic Self-Reliance. In March of 2003, the Center for Economic Self-Reliance was for-mally established at the Marriott School of Management at Brigham YoungUniversity. The Center was founded on a vision of improving the economicself-reliance of individuals and families around the world by bringingresearchers, practitioners, and donors together through action research.
Microfinance deals with the provision of financial services to the poorto establish and sustain microenterprises, thus improving their earningcapabilities. As such, the principles and practices of microfinance representone important vehicle through which people can improve their economicself-reliance. Economic self-reliance is a broader concept that includes edu-cation, work within traditional employment relationships, principles ofpersonal prudence and discipline such as budgeting or resource manage-ment, and concerns such as risk management through social networks orinsurance. Each of these components, coupled with individual initiative,works to create or improve self-reliance. The name change of the journalsignifies our willingness to publish articles on these important broadertopics as well as continuing to support microenterprise efforts.
The focus of the journal will be broader than before, and the writingstyle and article selection policies will change as we attempt to reach out topractitioners and donors as well as researchers. The initial issues willinclude pieces from thought leaders in the area of economic development,a theory article that outlines new and important concepts in the field, aresearch and case study section, a short description of best practices in theareas of self-reliance or NGO organizational management, and a bookreview. We expect the format and content of the journal to evolve as webetter understand and model the processes of economic self-reliance. Weinvite you to evolve with us and hope you will continue to see this publi-cation as valuable to your efforts to build a better world.
Paul C. GodfreyEditor, Advances in Economic Self-Reliance
SUBSCRIPTIONS AND SUBMISSIONS
Journal of Microfinance (ISSN 0360-151X) is published semiannually byBrigham Young University. Second-class postage paid at Provo, Utah, and atadditional mailing offices. Postmaster: please send address changes to Journalof Microfinance, 712 TNRB, Marriott School of Management, BrighamYoung University, Provo, UT 84602.
2006 Subscriptions: The subscription rate for subscribers in the U.S. andCanada for two issues of Advances in Economic Self-Reliance is the following(in U.S. Dollars):
Add $10 for non-U.S./Canada hard copy or combination subscriptions.Please send all correspondence regarding subscriptions to [email protected] Journal of Microfinance, 712 TNRB, Marriott School of Management,Brigham Young University, Provo, UT 84602; call (801) 422-9009; or visit usonline at http://www.microjournal.com.
Submissions: Since Advances in Economic Self-Reliance is a practitioner-oriented journal, we welcome article proposals dealing with various aspects ofself-reliance from thoughtful practitioners, researchers, and donors. Pleaseemail a one page article proposal to the editor at [email protected] to begin thesubmission process, or mail your proposal to: Advances in Economic Self-Reliance, BYU Center for Economic Self-Reliance, 712 TNRB, Provo, UT84602.
Content: Views expressed herein are to be attributed to their authors and notto Journal of Microfinance or Brigham Young University unless otherwiseindicated.
Copyright: Except as otherwise noted, Journal of Microfinance is pleased togrant permission for copies of articles to be made for classroom use, providedthat (1) a proper notice of copyright is affixed to each copy, (2) the author andsource are identified, (3) copies are distributed at or below cost, and (4)Journal of Microfinance is notified of the use.
Asubstantial track record of accomplishment and a significantbody of empirical studies worldwide together underline thesignificance of microfinance as an effective antipoverty and
development strategy (Wright, 2000; Zaman, 2000; Khandker,
A Case from India
K. K. Kaushal and J. C. Kala
Abstract: India has embarked upon a community involvement process to restock
the state-owned forests through a recent approach called Joint Forest
Management. But the success of the Joint Forest Management program lies in
the provision of alternative livelihoods to woodcutters and grazers. This article
presents how the forest department of a southern state of India devised a potent
tool of microfinance promotion for weaning those who are dependent on the
forest by implementing a massive externally aided Joint Forest Management
Project. Based on a study of 27 program villages in the Tamilnadu state, this
paper proves that the success of Joint Forest Management is dependent on and
directly linked to the provision of microfinance to villagers through a people’s
representative body—the Village Forest Council. The forest department was suc-
cessful in this unusual task of promoting microfinance even in villages where
formal microfinance institutions have failed, which corroborates an earlier find-
ing that microfinance is more workable and successful if it is properly packaged
in a locally suitable development program.
Journal of Microf inance
Volume 7 Number 22
2001). However, even a well-designed microfinance program isunlikely to have a positive impact on the poorest unless it specifi-cally seeks to reach them through appropriate product design andtargeting (Wright, 2000). It is clear from various reports that thereare strong potential synergies between microfinance and the provi-sion of basic social services to clients. However, the services providedneed to be relevant to the needs of the target groups and not just anadd-on that is of poor quality (Marcus, Portes, & Harper, 1999).
Of the 63.72 million hectares (ha) of actual forest area of India(most of which is state owned) almost 38% is degraded, with acanopy density1 of less than 40% (FSI, 2000). This degradation offorests is mainly ascribed to the rigid state control and the result-ing disempowerment and displacement of indigenous tribal andhill communities, accompanied by the disintegration of community-based resource management (Fernandes & Menon, 1987; Guha,1991; Kelkar & Nathan, 1991; Gadgil & Guha, 1992).Consequently the Government of India made a major policy shiftin 1988 and switched over to Joint Forest Management (JFM).JFM is an evolving policy-based program, which sets out to estab-lish management “partnerships” between local forest-dependentcommunities and the state for the sustainable management andjoint benefit-sharing of public forest land (Sarin, 1995). To accom-plish this, JFM seeks to shift the existing inequitable distributionof management control by directly involving local people andinstitutions in forest management (Campbell, 1996). JFM doesnot involve the transfer of ownership over forests, but attemptsinstead to restructure the formal system of access, decision-making,and sharing of benefits to account for the needs of local communi-ties. So far, 22 state governments have issued orders to implementJFM and the states have evolved their own mechanisms of involv-ing local communities in conformity with the proclaimed policy.
K. K. Kaushal is Deputy Conservator of Forests in Madurai District of Tamilnadu State for theIndian Forest Service. Email: [email protected]
J. C. Kala is Principal Chief Conservator of Forests, Tamilnadu State Government, IndianForest Service. Email: [email protected]
Nurtur ing Joint Fores t Management
Volume 7 Number 2 3
About 36,130 Village Forest Councils are managing a total of10.25 million ha of forest area in the country (FSI, 2000).
It is a known fact that during the last 140 years of state con-trol, most of the land with the potential for agriculture was clearedof forests. The remaining forest in India is now concentrated inrugged and inaccessible areas, and this reduces the potential to har-vest and manage the forest for production purposes. The abuttingpopulation has increased manifold; their needs have also multi-plied. It is impossible to create forest-based livelihoods for all theabutting population. Consequently, most of the states are follow-ing a two-pronged approach to involve communities: increasingthe stake of the neighboring communities in the management andutilization of the forests, and creating alternative sources ofemployment to reduce the pressure on forests (Kumar, Naresh,Yogindra, & Kinsuk, 2000). But the resources to promote alterna-tive income are limited and cannot wean all forest dependents(Kaushal & Kala, 2004). However, if the limited available fundsare used for the creation of a revolving fund for microfinance pro-vision instead of providing doles to a few individuals, then theimpact can be larger and more sustainable also.
This paper seeks to present how microfinance as a componentof the Joint Forest Management project has emerged as a potenttool for the development of forest villages in Tamilnadu and isreducing people’s dependence on forests to nontimber forest prod-ucts and indirect benefits. Further it substantiates with field datathat the regeneration of forests is directly linked to the successfulworking of microfinance.
Tamilnadu Forestry Project
Tamilnadu, the southern state of India, has a geographic area of 13million hectares, which constitutes 3.96% of the land area of thecountry. The total population of the state is 55.86 million (1991census), accounting for 6.60% of the country’s population. Therecorded forest area2 is 2.26 million hectares, which constitutes17.40% of the land area of the state. But the actual forest cover3
as assessed through remote sensing is only 1.71 million hectares—a mere 13.13% of the land area. Furthermore, half of this actual for-
est cover is degraded and has a canopy density of less than 40%(FSI, 2000).
There are 15,822 villages in the state, of which 1405 are forestabutting. The total population of these forest villages is estimatedto be 3.11 million. No separate consumption or income data areavailable, but it is a known fact that forest communities are thepoorest of the poor (Tiwari, 1994; Kaushal & Kala, 2004). Becauseof remoteness and a thin and scattered population, modern develop-ment and amenities have not reached them. Moreover, the devel-opment departments hardly reach these areas. Likewise, thecooperative banks and grameen banks restrict their operations tothe villages in the plains, which have more productive lands thatallow their people to make gainful use of loans.
The Tamilnadu Forestry Project (TFP) is a Joint ForestManagement (community forestry) Project that is funded by theJapan Bank for International Cooperation at a level of US$100million.4 This project has been implemented in Tamilnadu statesince 1997–98. In the Project, degraded forest microwatersheds alongwith abutting habitations are selected. The forest area is divided intothree zones—Lower zone or Utility zone, Middle zone or Asset cre-ation zone, and Upper zone or Eco-restoration zone. Normally, thearea for all three zones is 250 ha, in which the zone-wise gap plant-ing is taken up. The unique feature of the Project is that it has aprovision of $12,000 for the development of abutting village pop-ulation over a period of three years. The aim is to reduce thedependence of villagers on forests by initiating alternate activitiesfor generating income.
In each of the identified management units, the people’s repre-sentative body, called a Village Forest Council (VFC), is formedwhich is fully involved in the planning and execution of works, pro-tection, harvesting, and benefit sharing, with focus on degradedforests. One man and one woman from each household, providedthat they are willing, are enrolled as its members. Any person whoopts out from the membership of VFC is not entitled to any benefits.The VFC meets as and when called for, but in any case at least oncein three months.
Journal of Microf inance
Volume 7 Number 24
Nurtur ing Joint Fores t Management
Volume 7 Number 2
Each Village Forest Council elects an Executive Committee,with each hamlet electing at least two members; each VFC elects aminimum of 5 and a maximum of 15 members to the ExecutiveCommittee. The panchayat5 members of the management unit areco-opted as ex-officio members of the Executive Committee (EC).The members of the Executive Committee elect a President fromamong themselves who is also President of the VFC. The ForestRanger concerned is the Member Secretary of the ExecutiveCommittee, who facilitates the election of the members andPresident of the Executive Committee. The Executive Committeeis responsible for the day-to-day activities of the VFC and meets atleast once a month. A Memorandum of Understanding is signed inthe beginning between the Divisional Forest Officer (on behalf ofForest Department) and the VFC President. This gives the detailsof the roles and responsibilities of the Forest Department andVFC—the partners in Joint Forest Management. All the VFCshave been registered under the Societies Registration Act 1975.
The government order sanctioning funds from JBIC soft loandefined the objective of the program as increasing the tree coverthrough the involvement of people. But once the program waslaunched, it was continuously reviewed, modified, and broadenedin consonance with the feedback from the people and the fieldofficers. The amount for development of forest dependents wasincreased to $12,000 from $6000. The individual grants were con-verted into interest free loans so that the VFC can build up itscorpus fund and extend loans to the remaining forest dependentsfor acquiring productive assets. The VFC President was made thejoint signatory for the withdrawl of funds and the submission ofaccounts. State Government ordered the involvement of all otherline departments, like Public Works Department, Electricity,Health, Agriculture, Animal husbandry, and Tribal Development,etc., for the holistic development of these microwatersheds on apriority basis. Thus the Project has come to acquire a multidisci-plinary approach in which the promotion of microfinance plays thelead role.
5
TFP and Microfinance
Each VFC opens an account with the nearest post office and bank,which account is jointly operated by the President and MemberSecretary. Income from the following sources accrue into thataccount:
1. Fines imposed for offenses (like grazing or illicit removal)in the JFM area.
2. Recovery of loans.
3. Income from the sale of nontimber forest products6
(NTFPs).
4. Membership fees.
Out of $12,000 meant to be spent on the buffer zone in eachvillage, about 30% is spent on village development and communityassets like threshing floors, community halls, etc. The remainingamount is given to individuals for acquiring productive assets.Soon after the launching of the Project, this amount was declaredas a loan, which individuals have to pay back to the VFC so that itcan give loans to other people, as well as later further assistance tothe same individuals. In fact, this buffer zone amount is the majorsource of VFC fund, as income from the sale of NTFPs will takemany more years to be significant.
Presently, extending credit is the main financial activity of theVFC. But the term microfinance has been applied to the VFC becauseit arranges insurance for the cattle purchased through its loans. SomeVFCs have also taken group insurance policies for their members.Further, NTFP sales are done by the VFC only.
Methodology
Study Area
There are 48 field-level implementing units called Forest Divisionsin Tamilnadu State Forest Department which have been imple-menting TFP. Plantation Division, Madurai is undertaking TFP
Journal of Microf inance
Volume 7 Number 26
Nurtur ing Joint Fores t Management
Volume 7 Number 2
implementation in Madurai and Theni districts of TamilnaduState. So far 27 villages have been brought under the Project in thisdivision and this study was conducted in the 27 villages of thePlantation Division, Madurai.
Procedural Description and Results
Data regarding the financial position and recycling of money werecollected from the records of each VFC, since each VFC maintainsthe loan disbursement and loan recovery registers and cashbook.Recovery and recycling were separately rated on a scale of 0 to 1. Ifloan recovery for the village showed 100% recovery, we gave it avalue of 1, and if loan recovery was less, then the decimal valuecorresponding to the loan recovery percentage was assigned. Foranalyzing recycling, evaluation considered whether the funds afterrecovery were kept in a bank account or given as fresh loans to newindividuals within a reasonable period, with a value from 0 to 1assigned. We allowed a period of 1 month and an accumulation ofup to Rs 50000 for giving fresh loans. As per expectations, the val-ues were almost the same as the better recovery villages for earlydisbursal. The average of loan recovery and recycling values wastaken to arrive at the value of the combined parameter of loanrecovery and recycling.
Then a team of three Forest Range Officers assessed the protec-tion and regeneration status of each program area. Better protectionthrough effective social fencing was reflected in the growth ofplanted seedlings, the regeneration of existing rootstock, and theabsence of goat or cattle dung on the forest floor. The team per-ambulated the forest area of each of the 27 forest villages to assesthe protection and regeneration status and independently rated thesame on a scale of 0 to 1. The average of the ratings assigned bythe three rangers was taken as the value of forest protection statusfor the respective villages.
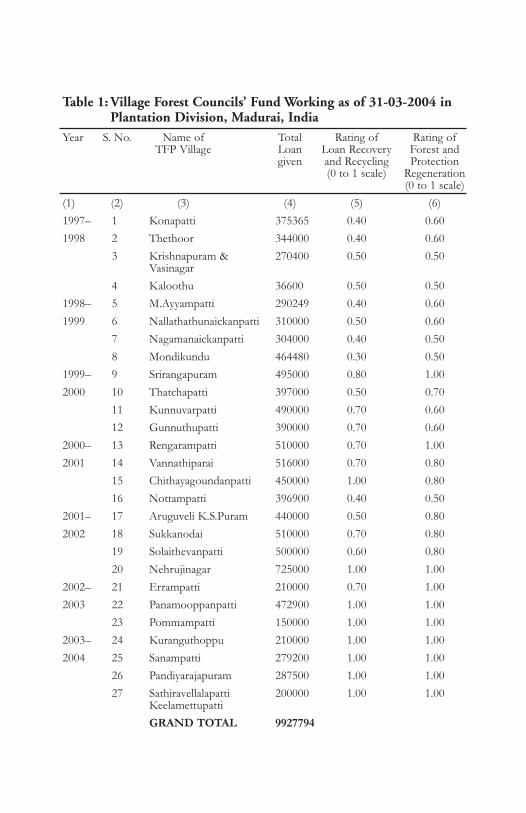
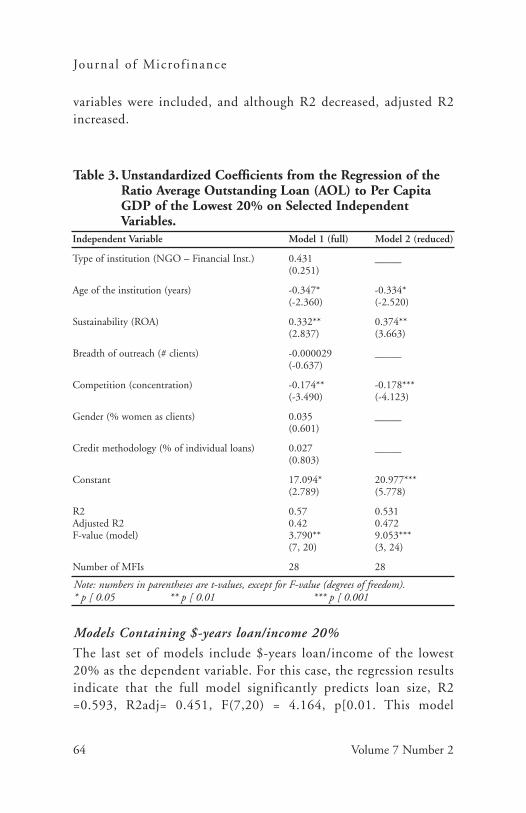
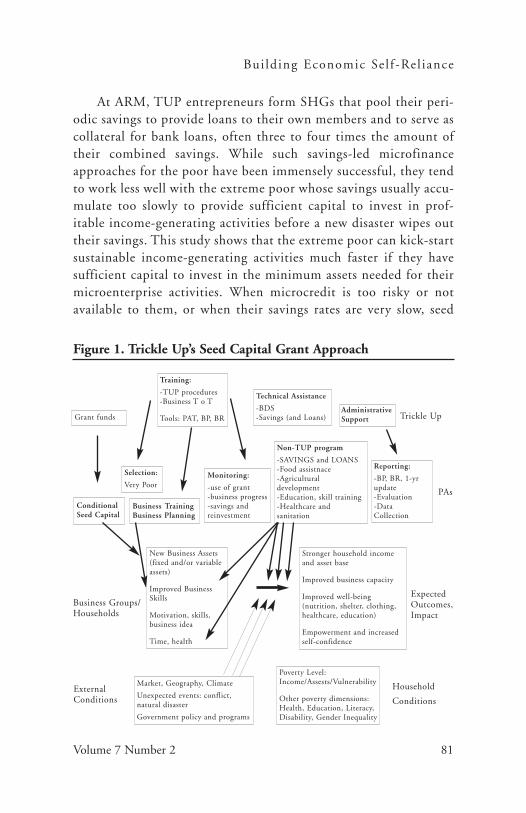
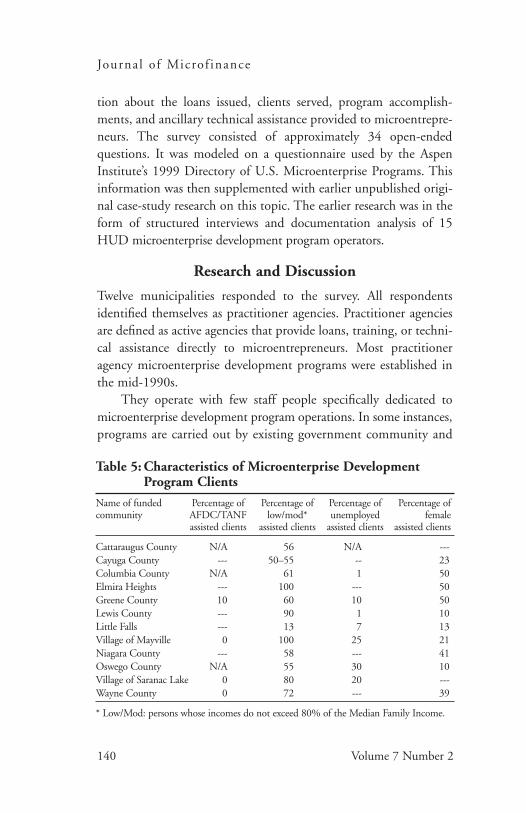
Data regarding the financial position of each village is pre-sented in Table 1, which shows the year of the formation of theVillage Forest Council, the amount extended as loan, along withthe ratings of the VFC fund and forest protection.
7
Table 1: Village Forest Councils’ Fund Working as of 31-03-2004 inPlantation Division, Madurai, India
Year S. No. Name of Total Rating of Rating ofTFP Village Loan Loan Recovery Forest and
given and Recycling Protection (0 to 1 scale) Regeneration
Income from fines, membership fees, and NTFP sales is almostnegligible in all the villages and has not been shown. The mainsource of VFC funds is the amount given by the department toindividual beneficiaries for alternative income promotion, whichthey pay back to the VFC concerned. Most of the loans are for pur-chasing hybrid cattle, because cattle rearing comes naturally tothem, and if a village has 20 cattle, the milk procurement societygets started at the nearest road head. Hybrid cattle are notamenable to grazing and have to be stall-fed. They yield 10–12litres of milk per day in comparison to 1–2 liters from indige-nously bred cattle. In some cases artisans have taken loans toimprove their profession. In Rangarampatti village, people havetaken up iron file making, and as many as 102 men and women aregainfully engaged in that trade (Kaushal, 2004). The forest depart-ment has not imposed an alternative income generation activityand the people decide on their own. Almost all the successful VFCshave voluntarily imposed an interest rate of 1% per month on allthe loans given by them. For instance, in Naurjinagar village onlyRs 4 Lakhs was given from the project fund, but with 1% permonth interest, the total amount has grown to Rs 7.5 Lakhs. Ascan be seen in columns 5 and 6 of Table 1, there is a direct corre-spondence between the VFC fund working and forest protection;this shows that once the people get alternate livelihoods they neednot do woodcutting and consequently forest protection improves.In the villages where loan recovery is poor, the remaining forestdependents could not be provided with productive assets and theycontinue to indulge in the grazing of goats or the removal of fire-wood from the forest. In successful villages, the people receivedloans two times and are therefore able to engage themselves in othervocations. The social fencing of the forest area is complete in suchvillages and there is no reason why it should not sustain itself infuture. The concept of Joint Forest Management hinges on socialfencing, which means the local people agree through their localinstitutions and mechanisms not to indulge in grazing and wood-cutting and to ensure that others also comply with it.
9
The VFC President handles the loan collection and only incase of default is persuasion by the VFC members and forest staffadopted, because most of the people do not have collateral securitiesand even when they do, the tedious legal process of loan recoveriescannot be pursued by the VFC President or Member Secretary.Since the Forest Ranger enjoys a tremendous amount of respectand fear in forest villages, his persuasive role, if enacted sincerely,is enough to keep people paying on their loans even in villageswhere formal financial institutions have failed.
The results are the poorest in 1997–98 villages, because theProject was launched hastily and initially loan recovery was notenvisaged. Only in February 1998 was it announced that individualbeneficiaries have to pay back the loan amounts to the concernedVFCs. The results are better in recent years due to better interesttaken by a fresh set of Rangers in the latter years. Nurturant style ofForest Ranger is more successful in JFM (Rishi, 2003). Also, theDepartment personnel have learned the technique of fosteringthe VFCs in the latter years.
The efficient working of a VFC fund is reflected not only inforest protection but also in the improvement of the living stan-dards of the people, as evidenced through the increase in thenumber of concrete houses, people switching over to the use ofcooking gas from firewood, number of cycles and mopeds, etc.
Conclusions
1. In Joint Forest Management programs, forest regenerationand a profit yield from NTFPs will take years; hence thepeople have to be compensated for the lost opportunitycost of grazing and illicit removal to ensure effective socialfencing of the forests. If properly applied, microfinance isa potent tool in this regard.
2. In Joint Forest Management Program villages, forestregeneration and protection show a direct correspondencewith the working of Village Forest Councils as microfi-nance institutions.
Journal of Microf inance
Volume 7 Number 210
Nurtur ing Joint Fores t Management
Volume 7 Number 2
3. Microfinance is more successful if it is launched as a com-ponent of a development package relevant to the peopleand the area.
4. In forest villages, the Forest Department has more interac-tion and rapport with the people. Hence any developmentinitiative including microfinance implemented by theforest department has a better chance of success.
5. The post-Project sustainability of the program is assuredin all such villages, where microfinance has been wellestablished, because the people need not revert to grazingand illicit woodcutting and can pursue alternative liveli-hoods through microfinance. Also, the Village ForestCouncils in such villages acquire more popularity andauthority, which further helps in forest protection.
Notes
1. Canopy density indicates the extent to which sunlight is prevented from falling
on the ground by tree crowns. Canopy density of 40% and above is taken as dense
forest whereas 10–39% is taken as degraded.
2. Forest areas in all lands statutorily classified as forest, though they may not
necessarily bear tree cover.
3. Forest cover is all lands with a tree canopy density of more than 10%, though
they may not be statutorily classified as forestland.
4. US$1 = 45 Indian National Rupees.
5. The panchayat is the lowest tier of local self-government in India.
6. NTFPs are goods of biological origin other than wood that are derived from
the forests. These include fruits, nuts, tubers, mushrooms, essential oils, medicinal
herbs, spices, resins, and gums.
References
Campbell, J. Y. (1996). The power to control versus the need to use: A pragmatic view
of Joint Forest Management. Common Property Resource Digest, 37 (March
1996), 9–10.
Fernandes, W., & Menon, G. (1987). Tribal women and forest economy, deforestation,
exploitation and status change. New Delhi: Indian Social Institute.
11
Forest Survey of India (FSI). (2000). State of Forest Report 1999, Ministry of
Environment and Forests, Dehradun, India.
Guha, R. (1991). The unquiet woods: Ecological change and peasant resistance in the
Himalaya. New Delhi: Oxford University Press.
Gadgil, M., & Guha, R. (1992). This fissured land: An ecological history of India. New
Delhi: Oxford University Press.
Kaushal, K. K. (in press). Alternate livelihood promotion in Rangarampatty village
through JFM Project: A case study. Kurukshetra.
Kaushal, K. K., & Kala, J. C. (2004). Joint Forest Management in India—Need for
sustainable livelihood approach. International Forestry Review, 6 (1), 13–18.
Kelkar, G., & Nathan, D. (1991). Gender and tribe: Women, land and forests in
Jharkhand. New Delhi: Kali for Women.
Khandker, S. (2001). Does micro-finance really benefit the poor? Evidence from
Bangladesh. Paper presented at Asia and Pacific Forum on Poverty: Reforming
Policies and Institutions for Poverty Reduction, held by the Asian Development
Bank. Manila.
Kumar, N., Naresh, S., Yogindra, A., & Kinsuk, M. (2000). India alleviating poverty
through forest development (Evaluation country case study series). Washington,
DC: World Bank.
Marcus, R., Porter, B., & Harper, C. (1999). Money matters: Understanding microfi-
nance. London: Save the Children.
Rishi, P. (2003). Leading JFM through nurturance: An Indian Scenario. International
Forestry Review, 4 (2), 143–148.
Sarin, M. (1995). Joint Forest Management in India: Achievements and unaddressed
challenges. Unasylva, 26 (180), 30–36.
Tiwari, D. D. (1994). Developing and sustaining non–Tiber Forest products: Policy
issues and concerns with special reference to India. Journal of World Forestry
Resource Mangement 7, 151–178.
Wright, G. A. N. (2000). Microfinance Systems: Designing Quality Financial Services
for the Poor. London & New York: Zed Books Ltd., and Dhaka: The University
Press Limited.
Zaman, H. (2000). Assessing the poverty and vulnerability impact of micro-credit in
Bangladesh: A case study of BRAC. World Bank. Retrieved from
There have been government policies on the role of microfi-nance in the rural development process for more than fourdecades. In the 1960s and 1970s, the policies focused on
the provision of agricultural credit as a necessary support to theintroduction of new, more productive agricultural technologies
A Long-Term Perspective
Henk A. J. Moll
Abstract: The long-term perspective on microfinance starts with a discussion of
three central issues: first, views and policies, with two opposing views: “credit for
target group” and “pushing the financial frontier”; second, the performance of
microfinance institutions measured via two objectives: outreach and financial
sustainability; third, microfinance and rural development. This latter issue is
approached through analyses of the effects of financial services on rural house-
holds and analyses of long term national financial development. Both micro and
macro studies show positive effects of an expansion of savings and lending services,
financial deepening. The negative side of financial deepening, the apparently
unavoidable occurrence of bank insolvancies, is also reviewed. The concluding
section argues that the microfinance sector should be guided by “stability and
expansion”: stability to withstand shocks and to maintain the relationships estab-
lished between rural households and microfinance institutions, and expansion to
include more people within the financial frontier.
Journal of Microf inance
Volume 7 Number 214
that would simultaneously improve farmers’ incomes and feed thenation. Later, the focus broadened to include credit provision tothe rural population engaged in other enterprises, such as trade,handicrafts, and small-scale industry. Presently the internationaldevelopment agenda is dominated by the Millennium Goals, withpoverty eradication heading the list of goals, and with microfi-nance firmly linked to this goal.
The implementation of rural credit policies through financialinstitutions has been debated internationally. What triggered thisdebate was the publication of the “Spring Review,” an evaluationof small-farmer credit programs by USAID in the 1970s (Donald,1976), which made available world wide experience on the achieve-ments and failings of credit programs supported by governmentsand donors. In the 1970s, the discussion shifted from “lack of cap-ital” and consequently “the need for cheap credit,” to “cost-coveringinterest rates” that would enable financial institutions to continueto operate (Adams & Von Pischke, 1992). Later, the discussionwidened to include imperfect information as one of the distinctivecharacteristics of rural credit markets (Hoff & Stiglitz, 1993) thatleads to insight into the screening, monitoring, and enforcementproblems that rural microfinance institutions face. Presently we seea sort of consensus about the operations of microfinance institutions:they should strive towards both outreach and financial sustainability.
The debate on microfinance largely assumes a micro perspec-tive, with a short- to medium-term horizon. From this perspective,assumptions about the behavior of farmers, the rural population,or the poor, and about the constraints these groups face lead topolicies to be implemented by financial institutions. These institu-tions measure the effects of access to finance on their target groupafter a couple of years. Finally, the objective to become financiallysustainable is to be reached in a few years’ time. Long-term analysesof the role of microfinance institutions in rural development arescarce. Mellor (1966) and Timmer (1988) deal in macro terms with
Henk A. J. Moll is associate professor in the Development Economics Group of WageningenUniversity, the Netherlands. Email: [email protected]
Microf inance and Rura l Development
Volume 7 Number 2 15
the role of the agricultural sector in national development and dis-cuss the transfer of people and capital from the agricultural (orrural) sector to the services and industrial sectors in the urbanareas. They do not, however, discuss the mechanisms for such atransfer of capital. McKinnon (1973) and Shaw (1973) deal explic-itly with the development of the financial sector within economicdevelopment and plead for financial liberalization to enable sav-ings to be mobilized, followed by an efficient banking system thatlends to investors with expected high return investments. Morerecently, financial development and the links with economicgrowth and with poverty reduction have been discussed by Kingand Levine (1993) and Li, Squire, and Zou (1998). Though theseauthors make no distinction between the rural and urban sectors,their analyses are relevant for the rural sector too.
The three issues introduced above, views and policies regard-ing microfinance; the operations of microfinance institutions; andthe position of microfinance in rural development, are linked. Inthis article I will discuss these issues and then draw overall conclu-sions regarding the long-term role of microfinance institutions inrural areas.
The reason for focusing on rural microfinance is because thisdiffers from microfinance in urban areas in several ways. The mostobvious difference is that the dominant economic enterprise inrural areas is agriculture, with known seasonality and unpre-dictable climatic conditions. This results in similar cash flowrequirements for many households and in co-variant risk.Additionally, in many rural areas the population is widely dis-persed, which means high transaction costs for clients and possiblylow volumes of services per microfinance location. These aspectsrequire specific attention from microfinance institutions operatingin rural areas, in addition to the general microfinance problem ofhandling financial transactions for the small sums low-incomeclients require.
Views and Policies
Nowadays microfinance enjoys widespread support from govern-ments, development agencies and nongovernmental organizations.The reasons for this support are, however, diverse, and the termmicrofinance is linked with very different views and assumptionsabout the relationship between finance and development. Variousauthors have attempted to classify these views. Krahnen andSchmidt (1994), for example, distinguish four views by tracingdevelopment thinking from the 1950s: capital as the engine foreconomic growth, financing specific target groups, the focus onfinancial systems, and, from the 1990s onwards, the insights fromthe new institutional economics emphasizing the dominant role ofinstitutions in development and with specific views on the pecu-liarities of financial institutions. Robinson (2001) distinguishestwo approaches to microfinance: the poverty lending approach andthe financial system approach. Different views or approaches haveconsequences for the policies shaping the environment of micro-finance institutions, the financial services provided, and microfi-nance institutions themselves. Below I will discuss two opposingviews and their resulting policies. The consequences for microfi-nance institutions and for the role of microfinance in rural areaswill be discussed in the sections that follow.
The two opposing views are: (a) credit for target group and (b)pushing the financial frontier. Based on Robinson’s poverty lendingapproach, the first view is defined in a wider sense, with the poorbeing replaced by any target group. The phrasing of the secondview echoes Von Pischke (1991), who refers to the financial fron-tier as the dividing line between the established formal financialinstitutions with their large-scale business and private clients, andthe majority of the rural population without access to formalfinance.
Credit for target group is the oldest view and can be summa-rized as follows: A specified group of people lacks the capital toundertake certain enterprises that would lead to development. Thegroup of people and their enterprises can be specified to a greateror lesser degree: small farmers, fishermen, market women, or
Journal of Microf inance
Volume 7 Number 216
Microf inance and Rura l Development
Volume 7 Number 2
small-scale entrepreneurs with their respective enterprises in agri-culture, fishing, trade, and industry. The specification of develop-ment too may differ: improved health, food security, povertyreduction, or improvement in general welfare. The perspective onthe financial environment of the specified group is limited: theonly way the target group can access credit is through privatemoneylenders whose interest rates are unacceptably high andwould nullify any positive effect of the credit.
It was this view that led many governments in the 1960s and1970s to provide targeted credit with or without support fromdonors; for example, to enable small farmers to use modern pro-duction technologies, such as hybrid seeds or imported dairy cows.This credit would increase their incomes and provide enough andsufficiently diversified food for the domestic market. The credit fortarget group view is still widespread and nowadays is generally tar-geted at “the poor,” in line with the international attention forpoverty eradication. The micro-credit summit (not microfinancesummit) held in Washington in 1997, for example, advocated pro-viding credit to the world’s poor to enable them to shed theirpoverty. Barrett (2003) mentions targeted microfinance (togetherwith land reform, targeted school meals programs, and subsidiesfor agricultural inputs) as one of the “cargo net policies” that canlift people out of poverty. In short, the credit for target group viewis based on the following two central assumptions:
1. The factor constraining development is capital.2. The target group is unable to mobilize this capital under
acceptable conditions.
The policy implication of these assumptions is straight-forward: lend capital to the target group.
The pushing the financial frontier view developed in the 1970sto the 1990s from an increasing understanding of the financialcapabilities of low-income rural households and the existing formaland informal financial institutions in rural financial markets.According to this view, rural households are economic units thatmake daily decisions about production, consumption, and the
17
resource base under conditions that are characterised by (a) sea-sonality that rules rural economic life, (b) uncertainty about futureproduction and consumption requirements, and (c) income levelsthat are generally not far above subsistence. The decisions arereflected internally in the size and composition of the household’sassets and in the enterprise choice, and externally in the house-hold’s participation as buyer and seller of financial assets in ruralfinancial markets (Moll, 1989).
This sharper focus on rural households was accompanied byinsight into the rural financial markets (Von Pischke et al., 1983),defined as the totality of relationships between buyers and sellersof financial assets who are active in rural economies. Rural finan-cial markets are characterized by having a range of institutions thatare usually divided into formal institutions, such as state or privatebanks, semiformal institutions such as cooperatives and NGOsinvolved in financial services, and informal institutions, ranging fromprivate moneylenders and traders to relatives and friends and groups.Despite the wide range of institutions present, individual rural house-holds generally have access to only some of the institutions and theproducts these institutions provide, as rural financial markets arehighly segmented (Moll, Ruben, Mol & Sanders, 2000).
New, comprehensive explanations for the observed segmenta-tion in rural financial markets have been offered by Bell (1988),Hoff and Stiglitz (1993), and others. These focus on the informa-tion asymmetry between lender and borrower as a central issue incredit provision, with as consequences the absence of credit rela-tionships where information on borrowers was perceived as insuf-ficient, and the failure of government-supported financialinstitutions if these information asymmetries were neglected.
The insights gained firstly contradict the two assumptions ofthe credit for target group view: (a) low-income rural householdscan and do save both in kind and in financial assets through a vari-ety of informal arrangements, and (b) the existing savings capacityin rural financial markets refutes the assumption that capital assuch is the major factor constraining rural development. Secondly,the insights into rural households and the rural financial market
Journal of Microf inance
Volume 7 Number 218
Microf inance and Rura l Development
Volume 7 Number 2
institutions revealed the limitations of the informal financial insti-tutions in mobilizing and storing savings, dealing with co-variantrisk, and transforming small, short-term savings into larger loansof medium-term duration. In this way, these insights revealed anunfulfilled demand for financial services that formal institutionscan address more readily than informal ones:
1. Mobilizing savings together with providing unrestrictedwithdrawal.
2. Short-term lending for working capital, as and whenrequired.
3. Medium- and long-term lending for investments.
The overall conclusion was that rural households would benefitfrom the presence of formal financial institutions with servicesadjusted to their capabilities. The policy implications are twofold:(a) government policy attention for rural finance was vindicated,though not policies with the aim to provide capital, but policies toenable formal financial institutions to intermediate between saversand borrowers; and (b) policies should encourage financial institu-tions to participate in pushing the financial frontier to includenew, low-income rural households as their clients, by tackling theinformation problem through innovative screening, monitoring,and enforcement procedures.
The Performance of Microfinance Institutions
The views and policies described above translate into the operationsof microfinance institutions and thereafter into the assessment oftheir performance. The credit for target group view results in micro-finance institutions that focus on providing loans, generally in spec-ified quantities and possibly provided in kind and earmarked for aspecific enterprise. These loans are provided to the defined targetgroup, to be used to attain the specified development goals. Theloans are generally at subsidized interest rates, as the target group ispoor—in whatever terms poverty is defined. The assessment of theperformance initially focuses on the number of loans provided, orthe number of people who have received one or more loans,
19
because this number of people is assumed to reach the anticipateddevelopment goal. The latter assumption can be tested throughimpact assessment,1 for which elaborate methodologies have beendeveloped. This operational approach can be summed up as “supplyleading finance.” Adams and Von Pischke (1992) are among thosewho have analyzed this approach in detail and shown that govern-ment interference adversely influences lending and causes the basiceconomics of banking to be bypassed. The consequences of thesefailings have been that microfinance institutions incurred lossesand sooner or later ceased operating—but not before destroyingrepayment morale in the population and giving bank staff wrongideas about banking. Most importantly, the target group was onlypartly and temporarily reached, and after the demise of the finan-cial institution was again left without financial services.
Two developments in the 1980s and 1990s changed the situa-tion. The emerging pushing the financial frontier view showed theimportance of permanent financial relationships for rural house-holds, and thereby the permanence of financial institutions. The“cost-covering interest rates” for microfinance institutions (insteadof the subsidized interest rates) advocated by Adams and VonPischke were a major step towards achieving such permanence.Financial sustainability became part of the microfinance discussionand Yaron (1992) made this operational by devising the subsidydependence index with two levels of achievement: operational sus-tainability and financial sustainability, whereby the latter indicatesthe total independence from subsidies. New microfinance institu-tions took on board the increased insight and the attention forfinancial sustainability and used new approaches to reach peoplewho had previously lacked access to institutional financial services.
The emergence and expansion of microfinance institutions wasgreatly facilitated by a second development: financial liberaliza-tion. This meant a reduced role for government in the allocation ofcapital, less interference with banking, and thus new opportunitiesfor banks and microfinance institutions to engage in the centralfunction of financial institutions: intermediating between saversand borrowers. Less interference with banking generally meant the
Journal of Microf inance
Volume 7 Number 220
Microf inance and Rura l Development
Volume 7 Number 2
abandonment of interest rate control on savings and credit, andthat enabled the microfinance institutions to pay attention tofinancial objectives.
By the end of the 1980s, case studies had become available onmicrofinance institutions that had succeeded in reaching low-income households with savings and credit services (Moll, 1989;Patten & Rosengard, 1991; Yaron, 1992) and that showed a widevariety of organizational structures and operations. These casestudies provided the material for comparative analyses and theemergence of “best practices” in microfinance literature. These bestpractices offer a wealth of experience, but as the description of thebackground that shaped the specific institutions is generally lim-ited, these best practices need to be tested, assessed, and adapted tothe individual circumstances.
Presently there seems to be consensus on at least the objec-tives of microfinance institutions: outreach towards low-incomepeople and financial sustainability. Given these two objectives,microfinance institutions must deal with two central issues intheir day-to-day operations:
(a) the information issue: how to establish borrowers’ abilityand willingness to repay; and
(b) the cost issue: how to handle cost-effectively the smallfinancial transactions with a short duration generallyrequired by low-income people.
The first issue requires screening, monitoring, and enforcementprocedures that comply with the specific circumstances of low-income people and that deviate widely from the usual bankingpractices. The second issue requires operating with transactioncosts (including information costs and risk) that necessarily lead tointerest rates that are well above commercial bank rates, but thatare nevertheless still competitive and thus attractive for themicrofinance institution’s clients.
Microfinance institutions generally experience a trade-off intheir operations between the two objectives: a focus on the some-what better known clients who require somewhat larger loans eases
21
the cost issue and brings financial sustainability closer. This,however, leaves the smaller clients outside the financial frontier.Conversely, a focus on new clients with small financial capacitieswho require small loans does bring new clients inside the frontier,but also brings more costs and risk due to an initial shortage ofinformation on the new clients. The consequence is that it is moredifficult to achieve financial sustainability. It is in this trade-offbetween the two objectives that the two views sketched in the pre-vious section have maintained their roles up until today. The creditfor target group view complies directly with the outreach objective,as outreach can be made operational in terms of reaching a specifictarget group. Successfully reaching the target group with loans,possibly measured through impact studies, may easily provide ajustification for slackening the financial sustainability objective byaccepting “structural subsidies” or by postponing the date forachieving sustainability. The pushing the financial frontier viewoffers more opportunity for a better balance between the twoobjectives, as financial sustainability is required to keep low-income people inside the financial frontier. The resulting greateremphasis on financial sustainability may, however, slow the flow ofnew people across the frontier.
The balance between the two objectives often remains hiddenin management decisions on organization, operations, and thefinancial products offered. The consequences of these decisionsare, however, reflected in the annual accounts; whether or notthese are considered acceptable depends on the views of the gov-erning body of the microfinance institution.
Microfinance and Rural Development
No studies have been done on the long-term effect of microfi-nance, most likely due to the relative youth of many microfinanceinstitutions and the generally still limited coverage within theirareas of operation. However, an exploration of studies on theeffects of microfinance on rural households and studies on the roleof finance at national level provides indications of what the long-term effect might be. As a start, an overview of the position of a
Journal of Microf inance
Volume 7 Number 222
Microf inance and Rura l Development
Volume 7 Number 2
microfinance institution in the rural financial market is given inFigure 1.
The potential demand for formal financial services by the ruralpopulation is depicted by the triangular segments. The populationin the lowest income quintile has a demand for saving services andshort-term credit. Higher income quintiles require more types ofservices and a larger volume of these services, with the volumesmeasured along the Y-axis. The position of commercial banks is onthe left: serving the highest income groups with a range of services.Microfinance institutions focus on the population in the lowerquintiles and offer a limited range of services. Over time, success-ful microfinance institutions will reach a steadily increasing shareof the rural population and most likely will expand the range ofservices offered. Commercial banks may also expand their presenceby offering services to somewhat less well-off people. In the longrun we can envision a gradual change from complementarity tocompetition between the two types of financial institutions.
23
Figure 1. Formal Financial Services in the Rural FinancialMarket: Demand and Supply
The effect of microfinance on individual low-income house-holds has been studied through microeconomic impact studies.Three aspects are generally highlighted. Firstly, there is an increasedcapacity to deal with risk through the withdrawal of savings orobtaining credit in the case of an emergency. This may mean thatproductive assets (machinery, inventory, land, livestock) need notbe sold during an emergency and thus that the flow of income isnot interrupted. Secondly, there is an improved management ofconsumption requirements over the year, to maintain adequatelevels of food intake (Pitt & Khandker, 1998). This is of majorimportance, as labor is often the main resource of low-incomehouseholds. Thirdly, opportunities to invest in productive enter-prises increase. These increased capabilities of rural households toproduce, consume, and invest may be reflected only partly in theactual credit and savings relationships with microfinance institu-tions, because reliable access to microfinance forms a potentialthat can be tapped if and when required. This potential may, forexample, mean that the household’s own resources will be utilizedmore fully for production, with access to microfinance being reliedon if there is an emergency.
Extrapolating the effects of microfinance on individual house-holds to rural areas in total gives some idea of the overall conse-quences. The increased individual capacity to deal with shocksreduces the effects of a co-variant shock for the rural population asa whole, at least when a substantial proportion of the population iswithin the financial frontier. Further, increased saving in financialassets means a shift away from storing wealth in assets with zero orlow productivity. The financial savings become available for invest-ment in agriculture, in agriculture-related trade and processing,and in a host of other enterprises with expected benefits for tech-nological progress and rural employment. In a later stage, whenremunerative investment opportunities in rural areas become lim-ited and the volume of savings overtakes the volume of credit,excess capital can be channelled via microfinance institutions andthe national banking system to urban areas where large-scale indus-tries and services offer extensive investment opportunities. In this
Journal of Microf inance
Volume 7 Number 224
Microf inance and Rura l Development
Volume 7 Number 2
way, rural savers will benefit from those investments and the chil-dren of the savers might find the urban jobs they are looking for.
The above process of increased saving in financial assets fol-lowed by intermediation by the banking system and investmentby borrowers has been studied extensively at the national level.In their theory of financial development, Shaw (1973) andMcKinnon (1973) describe this process as financial deepening.This theory was developed in the 1960s when governments usedthe banking system to support investment in their priority sectors(often industry), thereby bypassing efficiency considerations inmany cases and neglecting domestic savings. Since the 1980s, manycountries have shifted policy from financial repression towardsfinancial liberalization, or from shallow finance to deep finance.
The relationship between financial development and economicgrowth at the national level has received renewed attention nowthat databases covering many countries over prolonged periodshave become available. In a cross-country sample of 80 countriesover the period 1960 to 1989, King and Levine (1993) found apositive relationship between financial depth, measured throughfour indicators,2 and economic growth. They also showed thatfinancial development has predictive power for future growth,indicating a causal relationship between financial development andgrowth. Khan and Senhadji (2000) reviewed methodological issuesregarding the relationship between financial development andgrowth and applied these insights to a data set covering 159 coun-tries over the period 1960–1999. Their results are in line with thefindings of King and Levine, and they conclude that financialdepth is an important determinant of economic growth.
The analysis of the relationships between financial develop-ment and economic growth has been expanded to include poverty.Li, Squire, and Zou (1998) studied income inequality in a largedata set from 112 developed and developing countries for the years1947–1994. They found that financial deepening helped reduceinequality and raise the income of the lower 80% of the popula-tion. Honohan (2004) gives a recent overview of financial development, economic growth, and poverty and concludes that
25
finance-intensive growth is empirically associated with lowerpoverty ratios.
The discussion of financial deepening, economic growth, andpoverty cited above considers these issues at the national level.However, the central tenet of financial deepening, a shift to savingin financial assets followed by intermediation by the banking systemand investment by borrowers, has direct relevance for microfinancein rural areas, since providing rural households for the first timewith access to savings and credit through local intermediation isthe core of financial deepening. The effects of financial deepeninggo beyond the individual links between microfinance institutionsand households, because a reduction of the capital locked up inpoorly productive assets and the availability of capital for new,trustworthy clients with productive uses fundamentally affectseconomic relationships in rural areas. Rajan and Zingales (2003),for example, state: “a healthy financial system can be a powerfulanti-monopoly tool, providing the lubrication for the emergence ofcompetitors that can undermine the power of incumbent firms,and the means for poor households and small-scale producers toescape the tyranny of exploitative middlemen.” Microfinance thuspositively affects economic life in rural areas; expanding outreach,enlarging the microfinance oval in Figure 1 to include a substantialproportion of the rural population, will make these effects morevisible.
The review of long-term financial development at the nationallevel also provides a perspective on a potentially negative side offinancial deepening: the occurrence of bank insolvency. Caprioand Klingebiel (1996) give an overview of bank insolvencies in 69countries since the late 1970s. The list includes countries from allfive continents and covers industrialized, transitional, and alsodeveloping countries. A number of countries saw more than onecrisis in the period covered. The crises involved governmentbanks, private banks, savings banks, and rural banks and rangedfrom a few banks to the entire banking sector in a country. Thecosts or losses ranged from less than 1% of GDP to as much as55% of GDP and were borne by taxpayers, savers, or a combina-
Journal of Microf inance
Volume 7 Number 226
Microf inance and Rura l Development
Volume 7 Number 2
tion of both. The factors cited as reasons for the crises range frommacroeconomic factors, through weak incentives for banks to actprudently, to lack of managerial skill and fraud.
The widespread occurrence of national bank crises means thatviewed from a long-term perspective, financial institutions are atrisk irrespective of current apparently stable situations. Formicrofinance institutions this risk has special dimensions. A pos-sible collapse of a microfinance institution in a national bankingcrisis means a loss of savings for their low-income clients, andthis is the more damaging as a financial crisis is usually followedby a period of economic recession. Less visible, but with similargrave consequences, is the loss of the relationship-specific socialcapital built up between the microfinance institution and clients.This social capital cannot be replaced without again overcomingthe information gap and building up new confidence betweenfinancial institution and clients—a costly affair that will takeyears. Finally, in a national banking crisis the government’s pri-orities are usually with the larger commercial banks. These banksare more likely to be rescued in the name of national interest andwith taxpayers’ money than the smaller, less visible, rural micro-finance institutions.
The exploration of microfinance and rural development showsa potentially positive impact of microfinance institutions on ruraleconomic life, as they are the primary vehicles for the process offinancial deepening in rural areas. This process is not without risk,however, as a failure of a microfinance institution, whetherinduced by a national bank crisis or by the institution’s ownactions, will result in a loss of both financial capital and the rela-tionship-specific social capital built up between institution andclient.
Discussion
The foregoing review of views and policies on microfinance andthe operations of microfinance institutions vis-à-vis the position ofmicrofinance in the long-term process of rural development leadsto the conclusions given below.
27
First, the generally accepted objective of microfinance institu-tions—financial sustainability, or independence from subsidies—seems to be outdated. It was certainly relevant in the 1980s and 1990swhen microfinance institutions were struggling into existence.Nowadays, many microfinance institutions are operational and theestablished relationships with clients deserve to be safeguarded. Thisis the more relevant as history has shown that bank crises are therule rather than the exception. The financial objective must there-fore be raised towards financial stability, defined as the ability towithstand financial shocks, whether the shocks come from insidedue to the adverse conditions of clients or from outside, transmittedthrough the financial links with the national economic and finan-cial sectors. Financial stability must be approached from two sides:diversification of the loan portfolio to minimize the negativeeffects of co-variant risks facing the rural population, and buildingup reserves. The latter means making a profit, not as an objectiveas such, but as a requirement for continuation.
Second, outreach in the sense of reaching a more or less nar-rowly defined group is, in the long run, not justified. First, a focuson one group of clients makes a microfinance institution vulnerable,thereby endangering financial stability. Second, a focus on onetype of clients overlooks the indirect positive effects of wider accessto financial services for the rural population as a whole. Therefore,the objective that is beneficial for all rural households in the longrun is expansion towards new clients and the provision of newfinancial services. Profit comes in again for two additional reasons:profitable microfinance institutions are more likely to be able todraw capital from the national market for expansion, and profit isrequired for experiments to include new groups of clients and todevelop new financial products to serve old clients better.
The two opposing views on microfinance, credit for targetgroup and pushing the financial frontier can be united into one newperspective for policy formulation: stability and expansion. Fromthis perspective the first priority is to achieve financial stability tomaintain what has been achieved; the second is to expand towardsnew clients. It is interesting to note that from a long-term perspective,
Journal of Microf inance
Volume 7 Number 228
Microf inance and Rura l Development
Volume 7 Number 2
there is no trade-off between stability and expansion, as financialstability is a necessary condition for an expansion of services.
Government policies that are based on stability and expansionmust support microfinance institutions in two ways. First, they mustpass legislation that allows microfinance institutions to mobilizesavings, to provide credit, and to undertake other services, such asinsurance and money transfers. This combination of servicesresults in economies of scale and scope, which strengthens thefinancial position of individual microfinance outlets and thusallows geographical expansion and financial deepening in ruralareas. Second, prudent regulations are required that buttress thefinancial stability of microfinance institutions in their specificcircumstances.
Notes
This article is based on a paper presented at the International Seminar on BRI
Microbanking System, Bali, Indonesia, 1–3 December 2004.
1. Impact assessment may include an assessment of the effect of credit on clients
as well as a study of the appropriateness of credit services.
2. (1) The ratio of liquid liabilities (M3) of the financial system to GDP; (2) the
ratio of deposit money bank domestic assets to deposit money bank assets plus cen-
tral bank domestic assets; (3) the ratio of claims on the nonfinancial private sector to
total domestic credit; and (4) the ratio of claims on the nonfinancial private sector to
GDP.
References
Adams, D. W., & Von Pischke, J. D. (1992). Microenterprise credit programs: Déjà
vu. World Development 20 (10): 1463–1470.
Barret, C. B. (2003). Rural poverty dynamics: Development policy implications. Paper
presented at the 25th International Conference of Agricultural Economists,
Durban, South Africa.
Bell, C. (1988). Credit markets and interlinked transactions. In H. Chenery and
T. N. Srinivasan (Eds.), Handbook of development economics (Vol. I, pp.
763–772). Amsterdam: North-Holland.
Billah, P. (1984). Report on indigenous savings and credit arrangements in Lombok.
Unpublished manuscript.
Bouman, F. J. A. (1977). Indigenous savings and credit societies in the third world: A
message. Savings and Development, 1(4), 181–218.
29
Caprio, G. Jr., & Klingebiel, D. (1996). Bank insolvencies: Cross-country experience
(Policy Research Working Paper 1620). Washington DC: World Bank.
Donald, G. (1976). Credit for small farmers in developing countries. Boulder, Colorado:
Westview Press.
Hoff, K., & Stiglitz, J. E. (1993). Imperfect information and rural credit markets:
puzzles and policy perspectives. In: K. Hoff, A. Braverman, & J. E. Stiglitz. The
economics of rural organization, theory, practice, and policy. Oxford: Oxford
University Press.
Honohan, P. (2004). Financial development, growth and poverty: How close are the
links? (Policy Research Working Paper 3203). World Bank.
Khan, M. S., & Senhadji, A. S. (2000). Financial development and economic growth:
An overview (IMF Working Paper).
King, R. G., & Levine, R. (1993). Finance and growth: Schumpeter might be right.
The Quarterly Journal of Economics, 108(3), 717–737.
Krahnen, J. P., & Schmidt, R. H. (1994). Development finance as institution building:
A new approach to poverty-oriented banking. Boulder: Westview Press.
Li, H., Squire, L., & Zou, H. (1998). Explaining international and intertemporal
variations in income inequality. The Economic Journal, 108 (446), 26–43.
Mellor, J. W. (1966). The economics of agricultural development. Ithaca: [publisher]
McKinnon, R. I. (1973). Money and capital in economic development. Washington,
DC: Brookings Institution.
Moll, H. A. J. (1989). Farmers and finance: Experience with institutional savings and
credit in West Java. Wageningen: Wageningen Agricultural University.
Moll, H. A. J., Ruben, R., Mol, E. W. G., & Sanders, A. A. (2000). Exploring seg-
mentation in rural financial markets: An application in El Salvador. Savings
and Development, 1(24), 33–54.
Moll, H. A. J. (1994). The performance of banks in rural financial markets. In F. J.
A. Bouman and O. Hospes (Eds.), Financial landscapes reconstructed: The fine
art of mapping development (pp. 71–84). Boulder: Westview Press.
Patten, R. H. & Rosengard, J. K. (1991). Progress with profits: The development of
rural banking in Indonesia. San Fransisco: ICS Press.
Pitt, M. M., & Khandker, S. R. (1998). The impact of group-based credit programs
on poor households in Bangladesh: Does the gender of participants matter? The
Journal of Political Economy, 106(5), 958–996.
Rajan, R., & Zingales, L. (2003). Financial depencence and growth. University of
Chicago, unpublished. Quoted in Khan and Senhadji (2003).
Robinson, M. S. (2001). The microfinance revolution: Sustainable finance for the poor.
Washington, DC: World Bank.
Shaw, E. S. (1973). Financial deepening in economic development. New York: Oxford
University Press.
Journal of Microf inance
Volume 7 Number 230
Microf inance and Rura l Development
Volume 7 Number 2
Timmer, C. P. (1988). The agricultural transformation. In: H. Chenery and T. N.
Srinivasan (Eds), Handbook of development economics (Vol. 1 pp. 275–331).
Amsterdam: Elsevier Science Publishers B.V.
Von Pischke, J. D. (1991). Finance at the frontier: Debt capacity and the role of credit
in the private economy. Washington, DC: EDI Development Studies.
Von Pischke, J. D., et al. (1983). Rural financial markets in developing countries.
Baltimore: Johns Hopkins University Press.
Yaron, J. (1992). Successful rural finance institiutions (World Bank Discussion Paper
No. 150). Washington, DC: World bank.
31
Volume 7 Number 2
Data Standards for Connectingto Commercial Sources ofCapital
Ongoing financial innovations in the microfinance market—equity investments, portfolio securitization, and creditfacilities—demand comprehensive scrutiny of microfi-
nance institutions (MFIs) to ensure that their operational systemsmeet the requirements of such financial instruments. In addition,careful attention must be paid to the value and the quality of thedata MFIs produce.
James Dailey
Abstract: The importance of data interchange between commercial sources of
capital and the microfinance sector is generally acknowledged, if not well
detailed. But microfinance institutions (MFIs) and commercial sources of capital
often need a different depth and breadth of information. As the industry grows
and accesses more commercial capital, there is a need to enable standardized
reporting from multiple MFIs to multiple sources of capital, rather than a pro-
liferation of one-to-one reporting relationships. IT professionals and managers of
microfinance institutions need to recognize this need and push vendors and
industry associations to agree on specific standards of data elements, quality,
and transmission protocols. This paper aims to provide the reader with a grasp
of the issues involved and to recommend a sample set of data standards for MFIs
to use in communicating with commercial sources of capital.
Journal of Microf inance
Volume 7 Number 234
According to an article about financial transparency publishedonline by the World Bank’s Consultant Group to Assist the Poor(CGAP, n.d.),
Only a handful of microfinance providers currently includeenough information to comply with International FinancialReporting Standards (IFRS) and industry-specific disclosureguidelines. Industry-specific disclosure requires certain infor-mation in addition to that required by IFRS to permit a fairassessment of the profitability and asset quality of microfi-nance operations.
The importance of enabling data interchange between com-mercial sources of capital and the microfinance sector has beenunderscored in multiple forums. The microfinance industry needsan estimated US$300 billion to grow to scale. However, this figuremay be too conservative, given that approximately three billionpeople globally do not have regular access to financial services.That number continues to grow.
An analysis of the industry's needs by a group of funders andmicrofinance practitioners shows three related obstacles (personalcommunication, July 28, 2004):
1. Lack of diversified sources of capital for microfinanceinvesting.
2. Lack of sufficient market infrastructure to facilitate efficientinformation and resource flow.
3. Lack of business expertise and capacity among leading MFIsrequired to reach scale.
From these concepts, we can derive broad requirements:• Diversification of portfolio financing by MFIs requires more
sophisticated segmentation of the loan portfolio and loan ser-vicing concepts, better data for regulatory agencies to allow
James Dailey is the Technical Project Manager for Innovations in Microfinance at the GrameenTechnology Center, an initiative of GFUSA located in Seattle, WA. Email: [email protected]
Data Standards
Volume 7 Number 2 35
registered deposit taking, and more customer data to enablethe modeling of the risk profile of any derivative securities.
• The market infrastructure factors that will enable resourcesand information to flow are the ability to send information,the need for data to be understood, and the need to createnorms, audit standards, and mechanisms to comply with therequiremens of rating agencies.
• Organization-wide norms, expressed through systems, are akey part of operational capacity. These systems must alsohave the flexibility to adapt to changing conditions.
This paper proposes an overall strategy to meet the emergingneed for data standards in the microfinance industry. These stan-dards should, nominally, leverage large parts of the existing financialservices standards with some important caveats. However, themicrofinance industry, precisely because it deals with the non-banked, does not always have the same level of information that isfound in the formal sector.
Data standards should cover the following areas:
• Financial reporting, such as those embodied in the MixMarket platform.
• Connections to commercial capital markets (e.g., the securi-tization of portfolio).
• The information needs of credit bureaus and regulatoryplayers.
• Remittances and external payment systems.• Remote transactions and third-party transactions.
The remittance market, which is currently estimated atUS$150 billion annually, is particularly interesting to note as apotential source of capital.
Third-party transactions include connections to global trans-actional systems such as point of sale (POS), automated tellermachine (ATM), credit card, or ACH transactions (an inter-bankautomated clearinghouse system). Such transactional networks typ-ically operate through agreements with regulated banking entitiesin each country, a fast growing market globally. Currently, these
networks are absent in microfinance operations in rural environ-ments, but this seems to be mostly a function of connectivity.
Other reporting standards not covered in this documentinclude those used by credit bureaus and other regulatory or stan-dard financial documents used to evaluate an organization’sstrength.
Microfinance Open Source and Establishing Standards
The microfinance open source project (Mifos) developed byGrameen Foundation USA focuses on integrating data standardsand protocols for financial transactions into an operational system.To maximize the effectiveness of the system and to move towardscommon standards, input from others in the industry is critical,particulary because one effective strategy for pioneering new stan-dards is to encourage partner institutions to adopt them.
Intended Audience
The audience for this paper is composed of those concerned withthe technical interface between the back-office systems used bymicrofinance institutions and those used by banking entities.Vendors of back-office systems for MFIs and the Mifos softwareitself will benefit from having specifications from these importantdata flows.
General Approach
In the context of promoting financial instruments and the infor-mation requirements to enable the aforementioned financialmechanisms, the intent of this report is to look as broadly as pos-sible. Requirements for data standards should reflect currenttrends away from legacy systems in the commercial sector, withtheir strong systems-in-isolation approaches, and toward “market-place” approaches, where interoperability and data exchange arekey drivers. There is probably little need in the microfinance sec-tor to be backwards compatible with legacy systems in the com-mercial sector.
Journal of Microf inance
Volume 7 Number 236
Data Standards
Volume 7 Number 2
There are numerous sources which can be used to determinethe information requirements for back-office systems of microfi-nance institutions. These include work on portfolio managementsystems and financial accountability funded by the World Bank. Asnoted by Dailey and Parekh (2003),
One of the most important kinds of information exchangeconducted at microfinance institutions is basic financialreporting. Many different kinds of financial reports are neededfor the effective functioning of an institution. . . . Thesereports can be intended for a variety of audiences, and encap-sulate different subsets of data for institutional performanceand operations.
The financial reports typically used by MFIs include thefollowing:
• Teller/operational reports guide the teller or loan officer intransactions.
• Portfolio reports provide qualitative analysis of the paymentperformance of a loan portfolio, including such indicator cal-culations as loan aging, portfolio-at-risk, and credit scoring.
• Financial statements are the most common documents,including balance sheets and income statements.
• Cash flow reports provide monitoring data for actual andpredicted cash flows; they are used in evaluating performanceand forecasting problems.
• Summary reports provide aggregate reports for upper man-agement to guide institutional strategy and planning.
While useful to specific audiences, these reports focus only ona high-level data summary. The financial instruments being con-sidered by GFUSA and the MFIs, however, focus more on detailedportfolio transactional data.
For the commercial banking sector and other sources of capi-tal, the format and type of data needed is dictated by its use.Whereas in equity investments, only summary data validating the
37
strength of the organization and transparency about weaknesses isnecessary, for portfolio securitizations, more complex data is required.To date, financial deals with microfinance organizations have notdemanded changes to the MFI-customer relationship. Therefore,while the financial paper corresponding to that segment of theportfolio may be traded (as in the case of ICICI Bank of India’spurchase and subsequent sale of a segment of the portfolio of aleading MFI to another Indian bank), the actual “loan servicer”does not change. The requirements for the bank in these types ofdeals, according to interviews conducted in August 2003 withICICI, will involve the following components:
• Elements of risk within the portfolio by segment (indentify-ing diverse sources of risk, such as geographic focus, industry-specific or MFI-management–specific issues, etc.).
• Determinants of that risk, including loan size, terms, andloan purpose.
• Current loan terms and loan repayment history.
These elements determine how the funding bank would ideallystratify the portfolio into risk-based segments and are thus thebasics for determining the appropriate pricing for the overall loanportfolio. Until such pricing becomes outsourced to credit ratingagencies and similar entities, or there is sufficient industry history,individual deals will require a willing bank to look at the risk fac-tors and determine their pricing. Grameen Foundation USA andGrameen Capital India could have a key role to play in determin-ing how these types of data formats are generated and evaluated.
An article in the Deloitte and Touche Journal (Caplan, 2001)points to three areas of data for the commercially traded loan:
1. Pedigree information—who issued the loan originally, underwhat facility, etc.
2. Pricing information—how one should value the loan (largelyautomated through algorithms in developed markets).
3. Back-office information—how a third party can service theloan and what information is transferred to enable that.
Journal of Microf inance
Volume 7 Number 238
Data Standards
Volume 7 Number 2
For microfinance, the third area of loan servicing is nowunderway in limited areas. In contrast, the second area is stillunclear to the markets, and the first is relatively easy, since fewdeals have happened. The second area deserves the most attentionbecause this is where the microfinance industry is the least stan-dardized, and the availability of such transactional data sets is alsounclear, at best.
With regard to loan servicing, it is generally held that only theoriginal institution has the relationship and the operational reachto service the customer. Actual field conditions are proving other-wise. Currently it appears true that only institutions with relativelysimilar methodologies, rotating staffs, and similar geographic out-reach can actually do loan servicing for another MFI or, throughacquisition, easily absorb the other MFI’s customer portfolio.Although the industry is a long way away from offering investorsclear options for loan servicing, it is interesting to note that this mis-conception is already giving way to the real needs of the industry.
Reporting versus Transactions
As noted previously, banks with a typical lender relationship witha microfinance institution are interested in standard financialstatements, such as balance sheets, profit and loss statements, cashflow reports, and portfolio-at-risk ratios. They may have no interestin the transactional data that underpins the portfolio-at-risk calcu-lations but will be interested largely in the debt-to-equity ratiosand solid cash flows from external sources. These relationships donot explicitly recognize the asset valuation of the portfolio.Commercial sources of capital seeking to work with MFIs in thesame manner as a typical bank should structure the deal so thateither the asset of the loan portfolio is used as collateral or the assetis effectively purchased, as happens in a securitization deal.
According to Jennifer Meehan (2004), director of GFUSA’sCapital Markets Group, “In the largest individual microfinancesecuritization to date, ICICI paid US$4.3 million for 25% ofSHARE’s loan portfolio. SHARE’s cost of funds was approximately
39
8.75%, below the 12 to 13% it has traditionally paid borrowingfrom commercial banks, including ICICI.”
It is clear that the ability to use the MFI portfolio as a readilypriced asset class requires a greater degree of reliability and accuracyfor the portfolio data, frequent or on-demand reporting on portfo-lio quality, and better transparency with regard to debt servicing bythe customer. Those standard financial practices do not necessarilyhave to be specific to the microfinance industry, but they must existwithin it. They must also be enforced via commonly accepted mecha-nisms, such as true ratings agencies. The rating agencies must bebonded and must be able to accurately assess the microfinanceportfolio through meaningful audits and analysis.
An important step toward data standardization in the microfi-nance industry is the creation of a set of data standards that areuniversally accepted and understood by all MFIs.
Developing a Data Standard
The next section sets out a high level data standard. The first partis concerned with the data elements that one would expect to find,and the second part covers data protocol issues. The data standardis given from the perspective of a flat file transmission.
The rationale for this is that in most electronic data inter-changes, the database is flattened out to provide a simple hierarchyof the multidimensional data, rather than sending a multitabledatabase.
The data elements should include annotations, which aremeant to magnify a particular grouping of data elements. Forexample, the data element “extend” is a common annotation forXML-based standards and indicates those places in the file formatwhere additional data elements can be added. Determiningoptional or required elements and specifying data types are bothpart of the standards settings and part of the implementation.
The process imagined for setting this data standard in themicrofinance industry is, briefly:
1. Determine minimum requirements of a specific bank.2. Sketch out overall sector requirements (this document).
Journal of Microf inance
Volume 7 Number 240
Data Standards
Volume 7 Number 2
3. Review the document (performed by the range of institu-tions that may be involved).
4. Develop a prototype solution between two entities.
Borrowing from Fannie Mae’s approach to data standards, theMifos project envisions a data dictionary, a conceptual data model,and a conceptual XML shema.
Data Dictionary
The data dictionary will present the portfolio data standards in alist form and will build on the data list below. It will include infor-mation for each data attribute, including standard business names,screen names, definitions, data types and lengths, allowable values,and XML names.
Conceptual Data Model
The conceptual data model will show the relationships betweengroups of data, such as the recursive loan details and the clientinformation to which those loan details relate.
Conceptual XML Schema
The Mifos XML schema for this data set type will consist of refer-ences to the specialized microfinance schema (groups, methodolo-gies) and standard financial data. It will essentially capture the datadictionary in XML with attribute and element names, enumerationvalues, and definitions.
Data Elements
Data elements can be described as having four segments:
1. Metadata—annotations and fields describing the data set,its origins, and general information about the institution.
2. Customer data—basic determinants of risk with regard tothe profile of the customer.
3. Account data—information about the product (e.g., loan)provided to the client.
4. Account transactions—the core of the data set, whichdescribes the payments and relationship to arbitration valuesfor being “on time.”
41
Protocols for Data
Beyond the basic data format, there are many questions about howdata will be generated within the system. In the formal financialsector, the relationship between transactional data and actualaccounting events is generally understood; knowledge of the micro-finance sector, however, is limited. Data quality includes the con-cepts of reliability according to a set of financial operationalstandards.
Journal of Microf inance
Volume 7 Number 242
Metadata Customer data Account data Account transactions
Data set informa-tion:
Number of recordsDate or reportAnnotationsExtendFacility informa-tion (Tanche ID):
Bank deal identifierBank deal typefacility amountFacility start dateExtendInstitutioninformation:
-Type of work-Type of industrialsector (e.g.,farming)
-Extend
Loan (recursive)Loan PurposeLoan amountExtendTerms of loanLengthInterestCollateral (opt)-Type-Value-Date of value-Depreciationmethod
-Verificationmethod
Co-guarantors (opt)Revolving loantype?
Restrctured loantype?
Extend
History of loansPercentage ofpaymentspreviously on time
ExtendPayments on thiscurrent loan(recursive)
Date of paymentPayment amountOn time? (flag)Extend
Table 1. Data Elements
Data Standards
Volume 7 Number 2
One of the successes of microfinance is the relatively highrepayment rates. This has been achieved through a combination ofpersonal touch (the officer goes to the customer), expectationsmanagement (repayment schedules are structured with minor graceperiods that are not shared with the client), and group-based riskmanagement. The group-based risk management is the mostimportant factor and has several components, all of which are welldocumented in microfinance literature. The first is loan issuance,where the group operates as a kind of business plan review com-mittee, ensuring that only the most productive business ideas areadvanced for funding. Secondly, it implies, depending on the situ-ation, that the group entity is either the loan guarantor or the loanrecipient. Since these group entities are not legal entities, the indi-vidual is usually the stated borrower on the loan. Because thegroup may, in some institutions, be required to make up any pay-ment shortfalls, 97% to 100% repayment rates are not uncommon.This creates a fundamental question for the data protocol: howmuch intra-group payment dynamics are required to accuratelyaccount for risk management?
It is at this level that the Mifos project hopes to have the great-est impact by allowing for metadata that explains the techniquesutilized by the MFI to manage such risk components. The proto-col for communicat ing such r i sk components wi l l need tobe fur ther developed through surveys of existing MFIs and betterunderstanding of the intra-group dynamics that are captured ininternal back-office systems. One suggestion is to flag when indi-vidual payments are made in part or in full by the group, ratherthan the debtor.
Metadata
Capturing the unique characteristics of microfinance requires a typeof metadata for the portfolio data. By structuring how those intra-group risk mitigation dynamics are described, the information sys-tem can manage the complex data and use it for risk analysis.
As detailed in the data elements section, metadata about thetransaction record set allows for the data quality and integrity to be
43
described. Building on this, the metadata should allow for fulltransparency to the appropriate parties of:
• Coverage, periodicity, timeliness.• Data access and privileged rights.• Data integrity.• Data quality.
Coverage refers to the data set within context. Providing thetotal portfolio of the organization and then the relative size ofthe portfolio covered by the data set provides one type of context.Periodicity of providing data can be regular or irregular, and if reg-ular, the period should be noted in the metadata. Timeliness is ajudgment as to how well the data has been provided according tothe reference of the periodicity. Data integrity refers to the abilityto trace the data back to data generated at the source institution,data quality refers to how well that data reflects actual occurrences.Data access and privilege rights are self-explanatory.
Conclusions
The global financial services industry is a very large consumer ofdata about customers and financial products. Microfinance, as apart of that industry with a social mission, should also be able topromote and use a set of standards for data about asset quality andprofitability. This data should be both meaningful to the commercialsector and in keeping with the long-term mission to have customersof microfinance become full economic participants in society.
Secondly, data that is sorted in different ways can reveal pat-terns and information beyond the initial intent. At a minimum,microfinance institutions should be aware of the value of their cus-tomer database to the commercial bank, which may or may not bethinking about these microfinance customers as their next market.
Lastly, Grameen Foundation USA and others are promotinginnovations in the financing of microfinance institutions to achievegreater effectiveness in serving the poorest with access to credit.Commercial data interface standards have an important role to playin terms of leveraging the exiting portfolio quality for funding.
Journal of Microf inance
Volume 7 Number 244
Data Standards
Volume 7 Number 2
References
Caplan, H. (2001). Speaking of Securitization. Deloitte and Touche Journal 6 (3), 5.
Consultant Group to Assist the Poor (CGAP). (n.d.). Financial transparency award:
MFIs invited to compete. Retrieved February, 2005, from
Microfinance institutions (MFIs) in Latin America are inthe midst of a commercialization process. Internationalorganizations are encouraging this process and inviting
NGOs to join it, while the perception of MFIs as profitable busi-nesses has increased (Christen, 2001). In an MFI inventory carried
Empirical Evidence from LatinAmerica
Francisco Olivares-Polanco
Abstract: Does commercialization mean mission drift? Christen (2001) argues
that commercialization, which is characterized by profitability, competition, and
regulation, does not have any effect on large differences in loan size between reg-
ulated and nonregulated MFIs. I used data from 28 Latin American MFIs to
conduct a multiple regression analysis to test for some of Christen’s conclusions,
as well as for other factors that, according to the literature on microfinance, may
affect loan size. The results of the regression indicate first that the type of insti-
tution, in terms of NGO versus financial institution, regardless of being regu-
lated or not, has no effect on loan size. Second, the age of the institution
predicts loan size in a direction contrary to that suggested by Christen. Third,
competition turned out to be significant, in contradiction to Christen’s conclu-
sion; it appears that more competition may lead to larger loan sizes and less
depth of outreach. Finally, the models confirm an old belief in microfinance:
there is a trade-off between depth and sustainability.
Journal of Microf inance
Volume 7 Number 248
out by Christen in 2001, 205 MFIs were identified in LatinAmerica. Seventy-seven MFIs (37.6% of the total) were regulatedand accounted for 73.9% of a US$877 million portfolio. In gen-eral, this phenomenon has been called the commercialization ofmicrofinance. Commercialization is characterized by profitability,competition, and regulation, but at the same time large differencesin loan size are observed between regulated and unregulated insti-tutions (Christen, 2001). While unregulated MFIs recorded anaverage outstanding loan size of US$322 in 1999, regulated insti-tutions recorded US$803, which is 2.5 times larger. Assessed interms of relative wealth, the average outstanding loan size forunregulated MFIs represented 24% of GNP per capita in 1999,versus 49% for regulated MFIs.
Do these large differences in loan size mean mission drift?Christen concludes that larger loans do not necessarily indicatemission drift, and they could simply be the function of differentfactors, such as choice of strategy, period of entry into the market,or natural evolution of the target group. Consequently, in the firstplace this paper discusses the points of view on impact assessmentand the use of loan size as a “proxy” measurement for povertylevel, and more important, it tests through a multiple regressionanalysis for commercialization factors, as well as for those factorsthat may also affect depth of outreach, in terms of loan size.
A preliminary sample of 30 Latin American MFIs was chosenand finally 28 were included, based on the availability of opera-tional and financial information.1
Some Points of View on Impact Assesment
Microfinance scholars and practitioners are divided into two fields:the welfarist and the institutionalist (Bhatt & Tang, 2001; Woller& Woodworth, 2001). Morduch (2000) refers to these two posi-tions as the microfinance schism. Each position differs in their viewson how microfinance services should be delivered (NGO versus
Francisco Olivares-Polanco is currently working as a Consultant for CANTV, the largesttelecommunication company in Venezuela. Email: [email protected]
Commercia l i z ing Microf inance
Volume 7 Number 2 49
commercial banks), on the technology they should use (financialservices, or “minimalist,” approach versus an “integrated” serviceapproach), and on how their performance should be assessed,among other subjects.
On the last mentioned discrepancy, the welfarists believe thatMFI performance should be assessed in terms of the impact on thewelfare of the poor. In short, the welfarist approach is not onlyconcerned with the question of how poor the clients are, butwhether or not they are less poor after they borrow the money(Cheston & Reed, 1999). Hence, their methods are aimed at deter-mining whether the institutions are achieving their poverty reduc-tion objective. On the other hand, the institutionalists believe thatperformance should be assessed in terms of the institution’s successin achieving self-sustainability and breadth of outreach. Breadthand depth of outreach, although desirable for both institutional-ists and welfarists, are perceived as contradictory objectives, thusrepresenting a trade-off for the institutions.
For the welfare-oriented practitioners, microfinance shouldfocus on reaching the poorest and help alleviate both material andnonmaterial poverty, even with subsidized operations. On theother hand, the institutionalists foster financial broadening, wheremicrofinance should focus on providing services to a large numberof poor people and reaching financial sustainability through moreefficient operations, market or higher-than-market interest rates,and economies of scale (Bhatt & Tang, 2001).
Methods, Advantages, and Disadvantages of each Approach
The methods used by the welfarists assess the impact of the pro-gram on their clients by measuring changes in dependent variables,such as the level of income, the level of production, sales, assets, orthe general well being of the client (Alfaro, 1999; Bhatt & Tang,2001). The underlying assumption is the existence of a direct causalrelationship between the credit and the observed change in the depen-dent variable (Rhyne, 1994). The methodology to assess the impactgenerally consists in collecting data ex-ante and ex-post the pro-gram intervention through direct interviews, and sometimes incomparing the results against a control group.
Eventually, the advantage of this approach is that it wouldallow knowing whether the MFI has a positive impact in fightingpoverty. However, there are diverse criticisms to this approach.Selection bias, lack of control groups, and inability to gather lon-gitudinal data are common concerns (Bhatt & Tang, 2001).Validity of the data also seems to be problematic, because suchstudies “rely on the often unreliable memories of clients to deter-mine their status before receiving a loan” (Cheston & Reed, 1999).In addition, conducting these may take time and may be tooexpensive to be absorbed by MFIs on a regular basis (Alfaro, 1999).
Additional fundamental problems still remain with thismethodology. First, credit is not an input for the productionprocess, but rather a financial instrument that increases purchasingpower. The fungibility of financial instruments implies that estab-lishing a causal relationship between the credit and the dependentvariables would require controlling for the rest of the unit of analy-sis’s sources and uses of funds (Alfaro, 1999) and probably forother factors different from money that may have an effect on thedependent variables under study (i.e., the level of education ofthe borrower). Second, the credit does not necessarily represent anaddition of 100% in purchasing power. In some cases there isfinancial substitution and deviation (Von Pischke & Adams, 1980;Alfaro, 1999).2 In addition, even though an impact analysisincludes control groups, there is the problem of achieving equiva-lence between the control group and the group actually receivingloans. As an efficient financial system or institution should dis-criminate between good and risky clients, the control groupswould be essentially different (Alfaro, 1999). Finally, looking forequivalent control groups may also lead to other dilemmas.3
Contrary to the welfarist methods, the analysis of the institu-tion’s performance carries lower costs and becomes more feasible toassess continually in the long run. Basically, the institutionalistapproach employs two measurements of success: outreach and sus-tainability. Outreach is measured in two dimensions: depth, orhow poor the clients are; and breadth, or how many people the pro-gram is reaching. There is no causality chain analysis, and the
Journal of Microf inance
Volume 7 Number 250
Commercia l i z ing Microf inance
Volume 7 Number 2
indicators for depth of outreach are various measures of loan size.For international comparisons, a ratio of loan size to per capitaGDP is also commonly used (Alfaro, 1999; Schreiner, 2001), andbreadth is usually measured as the number of clients or the typesof instruments offered (Bhatt & Tang, 2001).
The level of sustainability is measured through financial indi-cators such as the Subsidy Dependency Index (SDI), suggested byYaron in 1992, or through other similar indicators such as theExplicit Subsidy Dependency Index (ESDI) or the Implicit SubsidyDependency Index (ISDI). Other more common measures suchas the Return over Equity (ROE) or the Return over Assets (ROA)are also employed, but they do not account for subsidies when theyare recorded in the Profit and Loss statement. Contrary to thewelfarist approach, subsidies adjustments are necessary under thisapproach, and they have to be reduced to a minimum level when aMFI is looking for sustainability. In addition, Rhyne (1994) recom-mends the inclusion of one additional measure: the quality of theservice provided or quality of outreach. When an institutionrecords high repayment rates and high growth rates in terms ofclients, retains a large number of clients, and its clients are willingto pay interest rates that allow for institutional self-sustainability,then the services provided by the institution are considered of“good quality” because they are “appreciated and relevant to itsclients” (Christen, Rhyne, Vogel, & McKean, 1995; Alfaro, 1999).
Due to the availability of data to carry out an analysis underthe institutionalist point of view, the methodology of this study is framed within this approach. The shortcomings of the study willbe addressed when explaining each variable. Consequently, the final results of this study are influenced and affected by theselimitations.
Models and Data
The goal of the study is to test for commercialization factors, aswell as for other factors that according to the literature may havean impact on the depth of outreach. I use the Ordinary Least
51
Square (OLS) regression method to find out which variables aregood predictors of loan size.
Dependent Variable: Depth of Outreach
Within the institutionalist approach, reaching the poor meanssmall loan sizes. The basic assumption is that the smaller the loansize, the deeper the outreach, or the poorer the client. Thus, loan sizehas been consistently used as a “proxy” for the level of poverty. Inhis study, Christen uses two widely used measures of loan size:average outstanding loan (AOL), obtained by dividing the out-standing loan portfolio by the number of active clients at the endof the period of analysis; and the ratio of AOL to per capita GNP(AOL/PCGNP), usually used in cross-comparative analyses. Forthe initial sample of 30 Latin American MFIs, the AOL from theNGOs was US$769, while financial institutions recordedUS$1,026 (1.33 times the NGO loan size). This result is muchlower than the ratio obtained by Christen (2.5 versus 1.33), whichmay be the result of a selection bias problem, which is discussed indetail in the section on data.
Schreiner (2001) critiques the use of both AOL andAOL/PCGNP because they do not take into account other aspectsof loan size,4 especially term to maturity. Schreiner argues thatAOL is imperfect, because it measures the resources held in theterm of the loan but does not consider the length of the term tomaturity. Since finance is the exchange of resources through time,then loan size should account for it. Additionally, in many coun-tries, especially in poor countries, per capita GNP can be distortedby inequalities in income distribution. In countries with higherinequalities, per capita GNP exceeds both median GNP and thepoverty-line income (Schreiner, 2001). Hence, AOL/PCGNP maynot be a useful measure for cross-comparative analysis. Schreineralso criticizes the fact that the numerator and denominator pertainto different time frames. The numerator (AOL) is a flow disbursedin a specific moment, while the income (PCGNP) is generated inan entire year. Within a year, there can be more than one disburse-ment. Schreiner suggests an alternative measure to adjust for time:dollar-years of resources from loans over dollar-years of resources
Journal of Microf inance
Volume 7 Number 252
Commercia l i z ing Microf inance
Volume 7 Number 2
from annual income, if it were all saved (denoted as $-years loan/$-years income). Regrettably, there was not complete information onthe average disbursed loan for all the institutions under study;thus, AOL substitutes this variable in Schreiner’s original formula:
I regress three measures of loan size—the two used by Christenand the third suggested by Schreiner—on 7 independent variables,but adjusting two of the measures of loan size containing income:the AOL/PCGDP, and $-years loan/$-years income. In his critiqueof the use of either per capita GNP or GDP, Schreiner suggests theuse of poverty-line income or median income but recognizes thatthe first is measured in different ways across countries and that thedata for the second is hard to find. Therefore, I substitute percapita GDP by per capita GDP of the 20% poorest when measur-ing both AOL/PCGDP and $-years loan/$-years income. Thus, thenew measures are AOL/PCGDP20% and $-years loan/$-yearsincome20%.
The average income of the poorest quintile could be a betterindicator than per capita GNP in order to compare outreachamong MFIs. This indicator is closer to the target group that MFIsshould be serving, and probably, there are no problems of signifi-cant inequality within the group. Although there are almost nostudies on income distribution aimed specifically at the poorestquintile,5 this study assumes that income distribution among thelowest 20% is not as unequal as for the whole population. Forinstance, when using AOL/PCGDP and the value of 1 as the upperlimit usually used as the indicator of depth of outreach (Alfaro,1999), 24 out of 28 institutions would be classified as having a“deep” outreach; that is, their AOLs represent less than the averageincome. But when per capita GDP of the poorest 20% is used,then only three institutions may claim that their AOLs were lowerthan the income of the average person in the poorest quintile.
53
Average outstanding loan 12 2$-years loan/$-years income = Average term to matur ity 1
Per capita GDP / 2
This analysis suggests that most of the MFIs, whether they areNGOs or banks, are not reaching the very poor when using theseadjusted measurements of loan size. Contrary to the expectedresult, AOL/PCGDP and AOL/PCGDP20% are highly correlated(0.924). A possible explanation is that the income share held bythe lowest 20% across the ten countries included in the analysis isvery similar (mean= 3.43%, standard deviation= 0.95). Similarly,$-years loan/$-years income and $-years loan/$-year income20%are also highly correlated (0.9608). In fact, and less expected,AOL/PCGDP and $-years loan/$-year income also show a highcorrelation (0.8374), and when adjusting by GDP of the lowest20%, the correlation increases (0.9138), which suggests that, forthis specific analysis, accounting for time should not make muchdifference.
Finally, the main limitation of loan size measures as a “proxy”for poverty measurement emerges when the basic assumption—thesmaller the loan, the poorer the client—does not hold. Thisassumption is based on another assumption: people with access totraditional banking services do not find small loan sizes attractive,since they have to wait months or even years to get large loans(Woller & Woodworth, 2001). However, when access to credit isrestricted in an economy, there is a possibility that the well-off willbe willing to assume the high opportunity costs of borrowing smallamounts of money (Dunford, 2002; Hatch & Frederick, 1998).Loan size is the only available information from most MFIs and isused for the purpose of this analysis, despite the fact that somescholars and practitioners do not recommend its use due to itsweakness in accurately determining the poverty level of clients andbeneficiaries (Hatch & Frederick, 1998).
Independent Variables
Type of Institution. In his paper, Christen (2001) compares theloan size of regulated and nonregulated microfinance institutionsin Latin America and found substantial differences in loan sizebetween the two groups. Because regulated MFIs are associatedwith increasing commercialization, Christen asked whether com-
Journal of Microf inance
Volume 7 Number 254
Commercia l i z ing Microf inance
Volume 7 Number 2
mercialization has drifted the MFIs’ mission of reaching the poor-est of the poor. In his conclusion, Christen disregards mission driftand suggests that large differences in loan size may be caused byfactors such as choice of strategy, maturity of portfolio, or clientgroup. Commercialization, characterized by profitability, competi-tion, and regulation, has no effect.
To assess for the type-of-institution effect, I include a “dummyvariable” on whether the unit of analysis is a NGO (1) or not (0).From the initial sample of 30 Latin American MFIs, there are 11NGOs and 19 banks or nonbanking financial institutions, a groupthat I called “financial institutions.” Regrettably, the sample ismainly composed of regulated institutions—only three NGOs wereunregulated—and the simple dichotomy is not enough to character-ize the variety of MFIs operating in Latin America. The results onthe adjusted loan sizes for each group are surprising. The ratioAOL/PCGDP is larger for NGOs than for financial institutions(0.80 versus 0.56), and the ratio AOL/PCGDP20% is again largerfor NGOs than for financial institutions (5.50 versus 2.90). Asimilar outcome is also observed when using Schreiner’s loan sizemeasure. Given these large differences, and despite the fact thatMFIs are mostly regulated, it is still relevant to test for the type ofinstitution.
Age of the Institution. As mentioned in the previous section,the differences in loan sizes found by Christen may be caused bychoice of strategy, maturity of portfolio, client group, or a combi-nation of these causes. On choice of strategy, Christen argues that“larger loan sizes could simply be the result of deliberate strategyor choice . . . all the older, more established microfinance institu-tions (including in their previous incarnations as NGOs) in LatinAmerica started with an explicit objective to generate employmentin the urban microenterprise sector, so that their initial missionwas not reaching the poorest of the poor.” Christen mentions as achoice of strategy the choice of operating as a regulated or nonreg-ulated institution (instead of the NGO versus financial institutiondichotomy that is tested in this study), and in this case “large dif-ferences . . . may simply reflect the fact that the two groups started
55
out to serve quite different populations.” On the maturity of port-folio, Christen argues that “[w]hat appears to be mission drift mayalso be nothing more than the natural evolution of the average loanbalances of NGOs that transformed themselves into regulatedfinancial institutions . . . [t]hey all engaged in incremental lending,in which loan balances start well below the client’s ability to paythe installments and are subsequently increased through manyshort-term loans.” Dunford (2002), Christen et al. (1995), andJansson and Taborga (2000) offer similar arguments.
Two of these three factors have a common element: the age ofthe institution. Hence, years of operation are used to control for theeffect of time. In fact, Christen et al. (1995) consider that “in judg-ing whether a given institution has achieved extensive outreach,comparisons must be made with achievements of other institutions,keeping in mind the program’s age.” In this case, the predictionwould be: the older the institution, the larger the loan size.
Sustainability. Throughout this document it has been statedthat financial sustainability and depth of outreach are perceived ascontradictory objectives. The basic assumption is that lendingsmall credits to the poor carries a higher cost of operation, hencethe prediction would be: the larger the loan size, the more prof-itable and sustainable the institution. On this issue, Schreiner(2001) says, “greater loan size usually means more profitability forthe lender but less depth of outreach for the borrower.” He lateradds that “the drive for profits for the organization tends toimprove all aspects of outreach, except perhaps depth” (Schreiner,2002). Woller and Woodworth argue that “the unsatisfied creditdemand among the disadvantaged non-poor, the not-so-poor, andthe poor, together with the high costs of targeting and reaching thevery poor, created an almost irresistible pull for MCIs6 to moveupscale to wealthier and more profitable market segments.”
For this study it was not possible to find data on self-sufficiencythat excluded explicit or implicit subsidies, as Yaron suggests.Hence, a measure of Return over Assets (ROA) without theseadjustments is used as the sustainability variable, instead of Returnover Equity (ROE), which may be distorted by the leverage or
Journal of Microf inance
Volume 7 Number 256
Commercia l i z ing Microf inance
Volume 7 Number 2
differences in the financing structures between NGOs, non-bank-ing institutions, and banks.
Breadth of Outreach. For this study, breadth of outreach is thenumber of active borrowers. As breadth and sustainability are posi-tively related, then both are inversely related to depth, so the largerthe number of clients, the lower the depth or the larger the loansize. However, in absolute terms, the picture can still be optimistic.As Schreiner (2001) argues, wider breadth offsets depth, when aninstitution reaches “as many of the very poor as poverty-orientedorganization with narrow breadth,” even when recording highaverage loan balances.
Competition. According to Christen, “in regular markets, clas-sic enterprises usually respond to competitive pressures by offeringnew and better products at more competitive prices and byimproving productivity. As microfinance institutions increasinglyfind themselves operating in markets where competition abounds,their behavior more and more resembles that of classic enter-prises.” Does competition increase the loan size? Christen arguesthat commercialization, and therefore their characteristic compo-nents, does not have an effect on loan size. Hence, there should notbe any relationship between these two variables. I use the percent-age of concentration of the four largest MFIs by country: thehigher the level of portfolio concentration, the lower the competi-tive pressures. Concentration is measured as the market share heldby the four largest MFIs in a country, and is calculated with datafrom Christen (2001).
Gender. Depth of outreach has been also associated with gen-der distribution of the portfolio (Alfaro, 1999; Navajas, Schreiner,Meyer, Gonzales-Vega, & Rodriguez-Mesa, 2000; Bhatt & Tang,2001). Studies on women and development show that women arerelatively poorer than men; therefore, any institution engaged inreaching mostly women should provide smaller loans. In thisstudy, gender is measured as the percentage of women clients inthe portfolio.
Credit Methodology. Two broad methodologies have been reg-ularly used in microfinance: individual loans and group lending
57
(solidarity groups). Using the latter methodology, each memberguarantees the repayment of every other member’s portion, whichcreates social pressures within the group to avoid defaulting.Christen found that the tendency of Latin American MFIs duringthe last 10 years is toward an increasing number of individualloans. What would be the effect of this tendency on loan size? ForWoller and Woodworth, “the process of loan-group formation alsocan work to exclude the very poor. Lending groups typicallyassume joint liability for loan repayment, which can create anincentive to exclude the very poor, who are seen by other groupmembers as poorer credit risks.” This vision, however, contradictsthe generally accepted assumption that lending groups reachpoorer subjects of credit who do not have enough collaterals toapply for an individual loan. An analysis of five Bolivian MFIs car-ried out by Navajas et al. (2000) found that “the group lenders inBolivia reached the poorest better than individual lenders.”Besides, lending groups are mainly associated with microfinanceprograms aimed at women, and as it has been argued above,women are considered to be relatively poorer.
Usually, MFIs do not engage in only one credit methodology;rather, they use both. Then, in order to assess the impact of creditmethodology on loan size, individual loans as the percentage of theportfolio is used, with the prediction as follows: the larger the per-centage, the lower the depth of outreach and the larger the loan size.
Sources of Data
Information on most of the variables is drawn from each MFI andis mainly public. MFIs elaborate the primary data either for actualvariables used in this study or for their construction (e.g., loan sizemeasures and return over assets). Although sources of data werevarious, the majority of the information for the years 1999, 2000,and 2001 is available from the Microfinance Information ExchangeProgram (Mix) web page (www.themix.org), a not-for-profit privateorganization supported by CGAP-World Bank, the CitigroupFoundation, and other private foundations. Specifically, the dataare available from those institutions with high or full disclosure of
Journal of Microf inance
Volume 7 Number 258
Commercia l i z ing Microf inance
Volume 7 Number 2
information—rated by the Mix as 4 and 5 diamonds; however, notall the MFIs rated as 4 or 5 diamonds had complete data for thestudy. In total, there were 36 MFIs rated lower than 4 and 5 dia-monds, but only 28 MFIs had information on most of the variableseither from the Mix Market or from other sources. To fill the gapsof information, I used other sources, such as the web sites ofAccion International (www.accion.org), MFIs, and banking regula-tory agencies, as well as MFIs’ annual reports and audited financialstatements. Most of the annual reports and financial statementswere also available through the Mix Market in the form of pdf doc-uments. Because the data are presented or have been translatedfrom local currencies into US$ and contained in a period of fouryears, I did not adjust the financial statements by inflation norrestate them in a year-base currency, assuming that the statisticaleffect would be negligible.
Missing values on gender and credit methodology were substi-tuted in both cases by the mean obtained from the rest of thesample. Two additional institutions were added to the original 28MFIs; one from a case study written by the author (FinancieraCalpia, El Salvador), and the other from information released by abanking regulatory agency (Bangente, Venezuela). The only datanot generated by the MFIs were GDP, population, income shareheld by the lowest 20% of the population, and the average andyear-end exchange rate. The source of this information was theInternational Finance Statistics (CD-ROM) from the InternationalMonetary Fund (IMF).
Some comments on the data and the sample are relevant at thispoint. First, as the author constructed, fully or partially, some ofthe variables, there is the possibility of error. Second, although thesample represents only the 13.6% of the MFIs inventoried byChristen in 2001, there could be a selection bias problem becausethe sample was not randomly selected. As this is the only publicinformation available on Latin American MFIs for the purpose ofthis study, and most of the information was drawn from the MixMarket database, it is possible that this sample is substantially dif-ferent from the actual MFI population. The Mix Market promotes
59
transparency among MFIs worldwide, and the fact that only 3 outof 11 Latin American NGOs from this database are unregulatedcould be an indicator that most of the institutions reporting to theMix Market are following a more commercial-oriented strategythan the actual population of MFIs as a whole. In fact, two of thethree unregulated NGOs operate in Nicaragua, where, accordingto Christen, “commercialization has not entailed the transforma-tion of financial NGOs into licensed banking intermediaries . . .[s]purred by direct competition, commercialization is beginningeven though traditional profit-seeking entrepreneurs, such as com-mercial banks, have not yet entered the market.” For these reasons,it is possible that the results from this study cannot be generalizedto the entire population of Latin American MFIs and reflects moreaccurately the reality of commercial MFIs in the region.
Results
OLS was conducted to determine which of the seven variables arepredictors of loan size. For this study, three measures of loan sizewere used, resulting in three sets of models. Data screening allowedthe identification of outliers, and two institutions were eliminatedin each of the three sets: Compartamos and FMDR, both fromMexico. Compartamos is a regulated nonbanking institution, whileFMDR is an unregulated NGO. Therefore, the final databaseended up with a total of 28 observations, where only two wereunregulated NGOs—from Nicaragua—and eight were regulatedNGOs.
Model Containing AOL
The regression results for the model containing AOL (US$ perloan) as the dependent variable and seven independent variables donot indicate that the model significantly predicts loan size, R2=0.185, R2adj= -0.100, F (7,20) = 0.649, p[0.712. This modelaccounted for only 18.5% (zero when adjusting for degrees of free-dom) of the variance in loan size, and none of the coefficientsproved to be significant, suggesting that these independent vari-ables are not useful in predicting loan size in terms of absolutevalue—US$ per loan.
Journal of Microf inance
Volume 7 Number 260
Institution Country Year ofData
AOL(US$)
AOL/PCGDP
20%
$-years loan/ $-years income 20%
1 ACODEP Nicaragua 1999 291.00 5.652 24.452
2 ACTUAR-Tolima Columbia 2000 340.17 1.180 3.357
3 ACTUAR-Antioquia Columbia 2001 608.76 2.108 5.727
Table 1. Database of Selected Latin American MFIs (continued)
Commercia l i z ing Microf inance
Volume 7 Number 2 63
Models Containing AOL/PCGDP20%
In these models, AOL/PCGDP20% is the dependent variable andthe regression results indicate that the full model significantly pre-dicts loan size, R2 =0.57, R2adj= 0.42, F(7,20) = 3.790, p[0.01.This model accounts for 42% of the variance in loan size adjustedfor degrees of freedom, and three coefficients (age, sustainability,and competition) are significantly different from zero, suggestingthat they do have an effect on loan size. The reduced model is amore parsimonious one: only the three significant independent
Table 2. Unstandardized Coefficients from the Regression of Average Outstanding Loan (AOL) on Selected Independent Variables
Note: numbers in parentheses are t-values, except for F-value (degrees of freedom).* p [ 0.05 ** p [ 0.01 *** p [ 0.001
Independent Variable Model
Type of institution (NGO – Financial Inst.) -545.863(-1.526)
Age of the institution (years) 15.363(0.503)
Sustainability (ROA) 12.580(0.518)
Breadth of outreach (# clients) -0.0102(-1.072)
Competition (concentration) -6.103(-0.587)
Gender (% women as clients) -5.901(-0.485)
Credit methodology (% of individual loans) 5.213(0.760)
Constant 1,524.557(1.196)
R2 0.185Adjusted R2 -0.100F-value (model) 0.649
(7, 20)
Number of MFIs 28
Journal of Microf inance
Volume 7 Number 264
variables were included, and although R2 decreased, adjusted R2increased.
Models Containing $-years loan/income 20%
The last set of models include $-years loan/income of the lowest20% as the dependent variable. For this case, the regression resultsindicate that the full model significantly predicts loan size, R2=0.593, R2adj= 0.451, F(7,20) = 4.164, p[0.01. This model
Table 3. Unstandardized Coefficients from the Regression of the Ratio Average Outstanding Loan (AOL) to Per Capita GDP of the Lowest 20% on Selected Independent Variables.
Note: numbers in parentheses are t-values, except for F-value (degrees of freedom).* p [ 0.05 ** p [ 0.01 *** p [ 0.001
Independent Variable Model 1 (full) Model 2 (reduced)
Type of institution (NGO – Financial Inst.) 0.431 _____(0.251)
Age of the institution (years) -0.347* -0.334*(-2.360) (-2.520)
accounts for 0.451% of the variance in loan size corrected fordegrees of freedom, and again the same three coefficients from themodel containing AOL/PCGDP20% (age, sustainability, and com-petition) are significantly different from zero, suggesting that theydo have an effect on loan size. In a way similar to the previousmodel, the three significant independent variables were included ina separate model (2). For the reduced model, although R2decreased, adjusted R2 increased, as it was observed previously.Interestingly, adjusted R2 are very similar for both sets of models(0.472 versus 0.471).
Independent Variable Model 1 (full) Model 2 (reduced)
Type of institution (NGO – Financial Inst.) 1.349 _____(0.213)
Age of the institution (years) -1.623** -1.561**(-3.005) (-3.115)
Table 4. Unstandardized Coefficients from the Regression of the ratio $-years of resources from loan to $-year of resourcesfrom per capita GDP of the lowest 20% on Selected Independent Variables.
Note: numbers in parentheses are t-values, except for F-value (degrees of freedom).* p [ 0.05 ** p [ 0.01 *** p [ 0.001
Journal of Microf inance
Volume 7 Number 266
Conclusions
I assessed the effects of commercialization factors and other vari-ables that, according to the literature on microfinance, may alsoaffect loan size. Using data from diverse sources, the analysis on thefirst measure of loan size—average outstanding loan in US$—ledto a nonsignificant model: independent variables do not explainany variance in loan size. Because this measure of loan size has beenwidely criticized, additional models with different measures of loansizes were used.
Using the ratio of average outstanding loan to per capita GDPof the lowest 20%, the main finding was that the type of institu-tion has no significant effect on loan size. Using a modified ratioderived from Schreiner’s formula—dollar-years from borrowedresources to dollar-years from per capita income of the lowest20%—the results are similar. The same independent variables werethe significant ones in both sets of models: age of the institution,sustainability, and the level of competition. In addition, the type ofinstitution, breadth of outreach, gender, and credit methodologyturned out to be not significant as well.
Additional research could assess other possible predictors ofloan size, such as urban/rural scope (Thys, 2000), deposit deepen-ing, importance of nonfinancial products, or business strategies formicrofinance operations (i.e., downscaling, upscaling, etc.).Further studies may also include measures of average disbursedloan as the dependant variable. In this study, it was not possible tofind appropriate information to test for these factors. There is alsothe question of whether this analysis should follow a more dynamicapproach, in which changes in the unit of analysis should beassessed over time (3 or 5 years), as Schreiner suggests (2001, pp.22). This type of analysis could be more useful in understandingMFIs’ operations, but longitudinal information for five years iseven harder to gather.
Conservatively, these results should not be generalized to theentire Latin American MFI population. As I argued before, most ofthe information came from MFIs that seem to be engaged in amore commercial approach: they are reporting to the Mix Market,
Commercia l i z ing Microf inance
Volume 7 Number 2 67
an institution that is looking for and encouraging more disclosureof information and transparency. Part of its purpose is for investorsto make the better investment decisions based on available infor-mation, and for MFIs to obtain needed resources for growth.Therefore, it could be the case that the entire population of MFIsin Latin America is different from this sample, which in fact mayresemble instead the population of commercial MFIs.
The results deserve some comments, however. First, the sign ofthe coefficient for the age of the institution suggests a negativerelationship: the older the institution, the lower the loan size; thisfinding contradicts two of Christen’s arguments: the target groupof pioneering NGOs was not the poorest of the poor, but a higherincome group, and their engagement in incremental lending.Statistically, the process seems to be the other way around: newer par-ticipants may be serving higher income clients than older participants.
Second, the sign of the coefficient for the level of competitionindicates that the higher the concentration—or the lower the com-petition—the lower the loan size. If this variable accurately pre-dicts loan size, then more competition in a microfinance marketwill also result in larger loan sizes, suggesting that institutions willprobably search for more profitable clients.
Finally, the sign of the coefficient for sustainability (ROA)confirms an old belief in microfinance: there is a trade-off betweenprofitability and depth of outreach.
Notes
1. These institutions are ACODEP (Nicaragua), ACTUAR-Tolima (Colombia),
Yaron, J. (1992). Successful rural finance institutions (Discussion paper No. 150).
Washington, DC: World Bank.
Volume 7 Number 2
Building Economic Self-Reliance
The Trickle Up Program (TUP) is a US-based organizationengaged in microenterprise development for very poor1
households in fourteen core countries, including India.TUP achieves its mission, to enable the lowest income peopleworldwide to take the first step out of poverty, by providing
Trickle Up’s Microenterprise Seed Capitalfor the Extreme Poor in Rural India
Jan Maes and Malika Basu
Abstract: The Trickle Up Program is a US-based organization engaged in microen-
terprise development for very poor households in 14 core countries, including
India. Because it targets the most vulnerable sections of the population, such as the
rural landless, women-led households, people with disabilities, and economically
disadvantaged minorities, TUP employs a seed capital grant strategy to facilitate
its clients’ movement from absolute poverty toward economic self-reliance. TUP
clients cannot risk taking a loan because they have no spare income to make
payments if their enterprises do not generate an immediate profit. A conditional
grant, in contrast to credit, exposes its recipients to less risk and allows them to
grow a business with a longer payback period. This paper draws from a recent
study of the Alternative for Rural Movement, one of TUP’s partner agencies in
rural Orissa, India, and shows that its TUP clients moved successfully from a
position of extreme vulnerability to one of significantly improved economic
self-reliance.
Journal of Microf inance
Volume 7 Number 272
conditional seed capital, business training, and other relevant ser-vices essential to the launch of a microenterprise, by working inpartnership with local organizations. These partner agencies inte-grate TUP’s services into their model to achieve their own context-specific approach to poverty alleviation. Trickle Up refers to theindividuals selected for participation in the program as TUPentrepreneurs, even though in most cases this level of enterprisewould be better described as launching or expanding an income-generating activity. Very poor TUP households commonly engagein multiple income-generating activities and use the TUP seedcapital to capitalize both existing and new activities.
While a discussion among microfinance practitioners as towho constitutes the poor or very poor is ongoing, suffice it to saythat TUP’s local partners target the poorest and most vulnerablesections of the population residing in the communities they serve,including the rural landless, women-led households, people withdisabilities, and economically disadvantaged minorities. Thesepeople often cannot afford to take the risks associated with a loan,even though many are capable of running successful and profitableenterprises. Over the past two decades most microenterprise devel-opment and microfinance initiatives have been targeted at the so-called working poor, the majority of which are clustered just aboveand just below the poverty line. Most microfinance institutionsthat are driven by financial sustainability standards exclude thevery poor, because loans to the very poor are seen as too risky andtoo labor-intensive. Even microfinance programs that deliberatelytarget the very poor do not always manage to provide this targetgroup with access to financial services, because the very poor oftenexclude themselves from such programs or are excluded by lesspoor clients.
Jan Maes is a consultant in microenterprise development and impact assessment; from 2000 toApril 2005 he was a program officer and then a program evaluation officer with the TrickleUp Program. Email: [email protected]
Malika Basu is a freelance consultant in the field of rural and social development, andpresently a Ph.D. Fellow at the Institute of Social Studies (ISS), The Hague, The Netherlands.Email: [email protected]
Bui lding Economic Se l f -Rel iance
Volume 7 Number 2 73
TUP clients, on the other hand, typically belong to the verypoor living below the international US$1-a-day poverty line. SomeTUP clients, including those portrayed in this study, can belabeled the extreme poor,2 as they live on less than $0.50 a day (tak-ing into account purchasing power differences as with the interna-tional $1-a-day standard). Most microfinance practitioners wouldconsider these extreme poor people unsuitable for microloans orany microenterprise interventions, since they are unable to providefor even the most basic daily needs or cope with frequently occur-ring emergencies. Although they struggle to survive in this condi-tion of extreme vulnerability, owning little or no land or animalsand suffering for long periods of time from chronic food deficits andillnesses, Trickle Up believes that even the extreme poor are capableof running a successful microenterprise. The key ingredient ofTUP’s microenterprise development program is the provision of aseed capital grant, typically in the amount of $100, given in twoconsecutive installments, and based on certain conditions, to beexplained later in this paper. Trickle Up’s seed capital poses less riskand therefore represents a more acceptable option for the extremepoor to invest in the start-up or expansion of income-generatingactivities.
While the use of grants as a microfinance strategy is contro-versial, proponents agree with the Consultative Group to Assist thePoor (CGAP) that microgrants can be “the first step in a strategyto graduate the poor from vulnerability towards economic self-sufficiency” (Parker, 2001, p 7). The research reviewed in this paperreveals strong evidence that extremely poor households can achieveeconomic self-sufficiency after receiving seed capital grants, andthat access to a range of business and non-business support servicesprovided by local NGOs are at least as critical for success.
The objective of this paper is to understand the effectiveness ofthe TUP seed capital grants in the creation of profitable and sus-tainable income-generating activities, and to highlight additionalmicroenterprise program factors that facilitate progress from asituation of extreme poverty to one of improved economic self-reliance. This self-reliance can be typified by a sustainable increase
Journal of Microf inance
Volume 7 Number 274
in household income and productive assets, enabling a householdto continue to build up its economic strength. Finally, it should beemphasized that in its evaluation of the effectiveness of the TUPmodel, this paper focuses almost exclusively on the intended pri-mary program outcome, household economic empowerment, whilepaying less attention to the hypothesized link between economicprogress and the ultimate goal of social impact.
Methodology: A Brief Overview
At the time of this study in January 2005, TUP was working with19 partner agencies in India, mainly in the eastern states of UttarPradesh, Bihar, Jharkhand, West Bengal, and Orissa. The findingsin this paper are the result of a study conducted in rural Orissawith one of TUP’s partner agencies. Known as the Alternative forRural Movement (ARM), this agency is one of TUP’s most suc-cessful partners in Asia in moving a majority of their TUP clientsfrom extreme poverty to a situation of significantly improvedeconomic self-reliance.
The objective of the study was not to prove the impact ofTrickle Up seed capital grants on the economic capacity of theextreme poor, but rather to learn about the types of income-generating activities in which TUP entrepreneurs choose to investtheir seed capital, to understand their reasons for making certainbusiness decisions, and to assess how these income-generatingactivities contribute to the diversification and strengthening of thehousehold income portfolio.3 Therefore, the study methodology isbest described as a practitioner (as opposed to academic) approachto impact assessment. Through the use of focus group discussionsand a standardized survey, the research produced cost-effective andcredible information on the most important economic changesthat take place when TUP is implemented. The goal was also tounderstand the reasons for success or failure as well as the con-straints faced by TUP households when conducting their microen-terprise activities, thereby offering immediate insights as to howprogram operations can be improved in the future. By no meansdoes the research aim to attribute specific household changes to
Bui lding Economic Se l f -Rel iance
Volume 7 Number 2 75
certain program inputs or to distinguish between Trickle Up’s andthe local partner agency’s contributions towards achieving impact.The study leaves no doubt, however, that ARM’s own developmentactivities are at least equally as significant as its implementation ofTUP’s microenterprise program for achieving sustainable impacton a household’s economic portfolio and well-being.
ARM is a local Indian NGO that targets more than 50 villagesin Baliapal Block, which is part of the coastal district of Balasore inOrissa, India. In addition to its proven success in implementingTrickle Up, the primary reasons for choosing ARM for this studywere the following:
1. Its long-term association with TUP, which yielded a largepool of long-term TUP entrepreneurs, thus enabling theresearchers to gauge the sustainability of the economicchanges believed to be facilitated by TUP.
2. The variety of income-generating activities undertaken byTUP entrepreneurs in this area, which allowed for comparingthe utility of seed capital in initiating or expanding differentincome-generating activities.
3. The rural context in which ARM operates, which is com-mon for most of TUP’s target populations in India andworldwide.
In addition, ARM’s excellent track record with TUP’s microen-terprise development program made ARM a suitable organizationfor field-testing a quantitative survey on the use of TUP grants andits effect on the household income portfolio of TUP entrepreneurs.An analysis of these results is expected to provide the program staffat TUP headquarters and at the local partner agency with concreterecommendations to improve the program’s impact and cost-effectiveness. This is particularly important as partner agenciesmove to adapt the key program features, such as grant size andbusiness training, to the specific requirements of different income-generating activities.
The field study started with a focus group discussion withARM’s staff members who are directly involved in the implementa-
Journal of Microf inance
Volume 7 Number 276
tion of the Trickle Up program. This consultative process allowedfor taking up issues that were considered important by the staffand provided additional questions or phrasing for the question-naires and focus group discussions for TUP entrepreneurs. Thestaff also provided valuable feedback for translating and adaptingthe field questionnaire to local conditions. Since ARM implementsalmost all its development programs, including the Trickle UpProgram, through Self-Help Groups (SHGs),4 two such groupsthat had Trickle Up entrepreneurs among their members wereselected at random. The field study consisted of two in-depth focusgroup discussions with these SHGs and individual interviews withtheir TUP members. The group discussions focused on differentaspects of the Trickle Up program (selection, size of grant, andquality of training and business counseling) or issues related totheir own SHGs (savings amount and frequency, loan availability,and group meetings). Immediately after each focus group discus-sion, individual TUP entrepreneurs were interviewed for one hourusing a Household Income-generating Activities Survey, which is aset of mostly quantitative questions related to the nature and prof-itability of the various income-generating activities funded by TUPgrants and the role they play in the overall household income port-folio. These were conducted with the help of ARM staff, who actedprimarily as translators. One-third of the interviews were supple-mented with further qualitative questions that aimed to providemore in-depth insights into the motivations of TUP entrepreneursin relation to their business and investment decisions. Table 1 pro-vides details about the sample used during the study.
Table 1. Self-Help Groups and TUP Entrepreneurs in the StudySample
SHG TotalMembers
Number ofTUP Clients
Sample Size TUP Grant InstallmentsReceived
Kenduaria 18 11 7 1st in October 012nd in May 02
7 6 1st in October 012nd in May 02
Rashalpur 15
6 6 1st in January 042nd in August 04
Total 33 24 19
Bui lding Economic Se l f -Rel iance
Volume 7 Number 2 77
As is illustrated in Table 1, among the members of the two ran-domly selected SHGs, 11 (of 18) and 13 (of 15) were TUP entre-preneurs, of which 7 and 12 were interviewed, respectively. Theentire sample of 19 TUP entrepreneurs represents 6.3% of a totalof 300 entrepreneurs assisted by ARM during the last 3 years. Ofthese 19 TUP entrepreneurs, 13 received their seed capital grantnearly 3 years ago, while the remaining 6 received theirs 6 monthsago.
Trickle Up’s Seed Capital Approach toMicroenterprise Development for the Very Poor
Trickle Up partner agencies provide seed capital in two consecutive$50 installments to selected TUP entrepreneurs. While a grant mayappear contrary to current development thinking, the TUP modeldoes not begin or end with a seed capital grant, which constitutesonly one of four cornerstones of the integrated Trickle Upapproach to microenterprise development for the very poor. Theother three are careful selection of participants, business trainingand counseling, and continued access to capital through savings orloans. While TUP provides most of the financial inputs, it is thepartner agency’s role in selecting and training TUP entrepreneursand linking them to savings and loans that ensures long-term sus-tainability of their strengthened household income portfolios.Moreover, before describing the four cornerstones of the TUPmodel in more detail, it is important to mention ARM’s own devel-opment activities, which play a vital role alongside TUP’s contri-bution in moving households toward economic self-reliance.
Whereas TUP’s principal input to the business is the financialcapital to acquire business assets, ARM’s own programs addresshuman and social capital limitations that extremely poor peopleface in their efforts to build sustainable livelihoods. Like manyTUP partner agencies in India, ARM delivers the Trickle Up modelthrough SHGs, which are also the point of entry for other pro-grams, including group capacity building, advocacy, literacy train-ing, nonformal education, health, and sanitation, among others.ARM focuses on human capital development through education
Journal of Microf inance
Volume 7 Number 278
programs for adults and children and through a sophisticatedhealth program that includes health awareness training, access tobasic health services through a mobile clinic, and a life insuranceprogram. This strong focus on health is uncommon among TUPpartner agencies and strongly contributes to the success of ARM’smicroenterprise programs, as chronic illness continues to be a verycommon obstacle to microenterprise success by TUP entrepreneursworldwide. ARM also assists SHG members in building up theirsocial capital through group solidarity and mutual help, increasednegotiation power with local institutions, and linkages with busi-ness and market networks. ARM believes that a focus on the devel-opment of human and social capital of TUP entrepreneurs is vitalboth for improving the quality of life of the extreme poor and forimproving the entrepreneurs’ ability to run successful microenter-prises. ARM integrates these social safety net programs with thefour cornerstones of Trickle Up’s microenterprise program that aredescribed in the next sections.
Selection
Local partner agencies select new TUP entrepreneurs by using apoverty assessment tool that scores new applicants according to fivelocally relevant poverty criteria, identified by the partner agenciesthemselves. ARM’s poverty criteria include lack of land ownership(most TUP households are landless), illiteracy (80% of TUPentrepreneurs are illiterate), lack of access to credit at affordableinterest rates, official “Below Poverty Level” (BPL) status, andrural residence. Those who receive the highest score according tothese criteria (and thus experience the highest poverty) are eligiblefor participating in the program and receiving the seed capital.Since the poverty assessment tool selects households based on rel-ative poverty only, Trickle Up also focuses geographically oncountries with high poverty incidence according to the HumanDevelopment Index and on mostly rural areas within those coun-tries to ensure that it reaches the very poor worldwide.
In order to promote sustainable income-generating activities, astrong preference goes to business groups of at least two people,typically adult members of the same household who designate one
Bui lding Economic Se l f -Rel iance
Volume 7 Number 2 79
among them as their business leader. Since illness is often a majorobstacle to business success, having more than one person involvedimproves the continuity of the business. The motivation of thecandidates, although assessed in a much less formal way than theirpoverty, is in most cases an equally strong requirement to pass theselection process.
The Trickle Up Seed Capital Grant
Before participating in the Trickle Up program, most householdsare already involved in one or more undercapitalized and usuallyseasonal income-generating activity, while others derive theirincome exclusively from daily labor. In both cases capital is oftenthe most limiting factor to unleashing the profit potential of exist-ing or new income opportunities. Given their very low and irreg-ular incomes, the extreme poor cannot risk taking a loan to investin a microenterprise activity, because, as one of the women stated,they can never jeopardize the inadequate resources required to feedtheir children in case the profit of the business would not beenough to pay the loan. And even if profit is ensured, many ofthese income-generating activities are difficult to finance with aloan because they generate unpredictable returns or need an incu-bation period after investing in the required productive assets.Agricultural income-generating activities require an especially longlag period before actual production, which prevents immediateloan repayments. Finally, the very poor often need to consume asignificant part of their production, which leaves insufficient cashto pay back a loan.
TUP seed capital, in the form of two $50 grants, has the capac-ity to unlock latent profit opportunities, especially, as is the case atARM, when preceded by training in basic business concepts andfollowed by regular business counseling sessions. The seed capitalgrant is not a handout but is conditioned on a strong commitmentby the TUP entrepreneur. In order to receive the first seed capitalinstallment, she must attend training and, assisted by partneragency staff, prepare a business plan for her intended microenter-prise as well as commit to saving or reinvesting at least 20% of herprofits in business. After working for at least three months and
Journal of Microf inance
Volume 7 Number 280
completing a business report, a successful entrepreneur is eligiblefor a second $50 installment, which she can use to expand the orig-inal income activity or start a new one. The bulk of Trickle Up seedcapital is used to fund the expansion of existing undercapitalizedincome-generating activities, but some recipients use at least a por-tion of the TUP grant to start a new activity.
Business Training and Counseling
The seed capital grants are most effective when combined withappropriate business training, geared toward mostly illiterate TUPentrepreneurs. ARM’s field personnel organize training sessionsthat cover immediately relevant business topics, such as conduct-ing a simple feasibility study, estimating and calculating profits,marketing, reinvesting profits, and so on. Equally important isregularly encouraging entrepreneurs to think of their income-generating activities as businesses, many elements of which theyhave control over. After an initial business training in a group, sub-sequent follow-up counseling sessions are typically one-on-one;these sessions are vital to nurture self-confidence and to addressindividual and specific business issues. These sessions also enablefield staff to monitor the use of the capital for productive purposesaccording to the business plan and to assist entrepreneurs in calcu-lating their profits and reinvesting a portion in the business beforeusing the remainder to meet daily household needs.
Continued Access to Capital
The majority of TUP clients generate a profit within the first yearafter receiving the first grant, thereby increasing their overallhousehold income and strengthening their economic portfolio.Most partner agencies encourage or require TUP entrepreneurs toparticipate in formal or informal savings (and loan) programs.These programs can provide additional capital for new businessopportunities and help to protect group members against futureeconomic or natural shocks as well as prepare for costly life events,such as a marriage or the death or illness of one of their householdmembers.
Bui lding Economic Se l f -Rel iance
Volume 7 Number 2 81
At ARM, TUP entrepreneurs form SHGs that pool their peri-odic savings to provide loans to their own members and to serve ascollateral for bank loans, often three to four times the amount oftheir combined savings. While such savings-led microfinanceapproaches for the poor have been immensely successful, they tendto work less well with the extreme poor whose savings usually accu-mulate too slowly to provide sufficient capital to invest in prof-itable income-generating activities before a new disaster wipes outtheir savings. This study shows that the extreme poor can kick-startsustainable income-generating activities much faster if they havesufficient capital to invest in the minimum assets needed for theirmicroenterprise activities. When microcredit is too risky or notavailable to them, or when their savings rates are very slow, seed
Figure 1. Trickle Up’s Seed Capital Grant Approach
Grant funds
Training:
-TUP procedures-Business T o T
Tools: PAT, BP, BR
Technical Assistance
-BDS-Savings (and Loans)
AdministrativeSupport Trickle Up
Selection:
Very Poor
ConditionalSeed Capital
Business TrainingBusiness Planning
Monitoring:
-use of grant-business progress-savings andreinvestment
Non-TUP program
-SAVINGS and LOANS-Food assistnace-Agriculturaldevelopment-Education, skill training-Healthcare andsanitation
Other poverty dimensions:Health, Education, Literacy,Disability, Gender Inequality
Household
Conditions
Journal of Microf inance
Volume 7 Number 282
capital grants are a more effective alternative to provide the verypoor with this minimum amount of capital.
Figure 1 represents an overview of the Trickle Up seed capitalgrant approach. Central to this model are the acquisition of phys-ical (productive) capital through the use of seed capital grants andthe strengthening of human capital through business training. Asmentioned previously, however, the role of the partner agencyoften extends much further than the implementation of these twoTUP inputs. The quality and frequency of monitoring and coun-seling by the partner agency is also crucial for sustainable businesssuccess, as well as facilitating access to new markets for inputs aswell as products.
Improved Economic Self-Reliance
This study’s findings relate mostly to changes at the individualenterprise (or income-generating activity) level and at the broaderhousehold income portfolio level. At the enterprise level, impact isseen through changes in profitability, employment, assets, andlevel of production, while impact at the overall household econ-omy level becomes visible through changes in household income,labor productivity and dependency ratio, asset accumulation, andincome diversification. The Household Income-generatingActivities Survey focused on the uses of the seed capital grants, theunderlying decision-making factors, the diversification and prof-itability of household income-generating activities, and the accu-mulation of productive assets and savings.
Poverty Conditions and TUP Entrepreneur Data
The study took place in Baliapal Block in Balasore District, acoastal area in the northeast of Orissa, one of India’s poorest states.This predominantly agricultural area is prone to frequent naturaldisasters, such as cyclones, droughts, and floods. During the lastcensus in 2000, 74% of the households in Balasore District werebelow the poverty line (BPL), the official State poverty line set at324 Indian rupees (Rs)5 per capita per month, which translatesinto approximately 10 Rs per capita per day. The better-off among
Bui lding Economic Se l f -Rel iance
Volume 7 Number 2 83
these BPL households are small farmers (12%), followed by mar-ginal farmers (28%), and seasonal farm workers (60%) who haveno land except for their homestead. While most agriculture issubsistence-based, some farmers produce cash crops, such as betelleaves and coconuts. The extreme poor in Baliapal Block are pre-dominantly members of Scheduled Tribes6 (8%) and ScheduledCastes (23%), who constitute ARM’s main target population.
More than 500 SHGs have been created in Baliapal Block, 200of which have been formed with assistance from ARM in 40 vil-lages and hamlets. The majority of Trickle Up entrepreneursselected by ARM are landless and their main source of income isdaily wage labor, which pays an average of 45 Rs per day for menand 40 Rs for women and is available for fewer than 100 days eachyear. Even though some households manage to supplement thiswith paddy cultivation through leasing land or sharecropping,their harvest meets only home consumption needs for a maximumof two to four months. In this study, household income levels wereestimated by combining annual incomes calculated for each of thevarious income-generating activities taken up by a household,including labor and the household’s own food production. Theseestimates suggest that before entering the Trickle Up program, themajority of the sampled households (14 out of 19) belonged to theextreme poor, with daily per capita incomes below 4 Rs, which isequivalent to 25% of the international $1-a-day poverty line.
Table 2 below shows that two-thirds of the Trickle Up entre-preneurs in the sample were women. In the case of male-led
Table 2. TUP entrepreneur data
Category Male Female
Number 6 13Percentage 32% 68%
Average age 39 years 38 yearsAverage years in school 3.5 years 2.3 years
Can read 100% 46%Can add and subtract 100% 92%
Note: n = 19
Journal of Microf inance
Volume 7 Number 284
income-generating activities, female SHG members had beenselected for TUP, but they used their seed capital grant to sponsora business activity led by their husbands. The average age of bothmale and female TUP entrepreneurs was slightly below 40 years.Most men were literate and had attended school longer than thewomen, of whom less than 50% are literate. Both men and womencould add and subtract numbers.
Table 3 shows that the average household size in the samplewas six and had a dependency ratio (the number of income earnersdivided by total household members) of 0.6. Smaller families hadhigher dependency ratios and tended to rely proportionally moreon women to provide income. Four out of five households wereheaded by a married couple, and the majority of householdsbelonged to Scheduled Castes, the largest disadvantaged socialgroup in ARM’s target area.
Seed Capital Grant Use and Asset Accumulation
Of all Trickle Up entrepreneurs interviewed, only two used part ofthe seed capital for a different purpose than investment in produc-tive assets. One household had spent a portion of the grant to payoff a high-interest loan with a local moneylender, while anotherhad used a portion to pay for the children’s school expenses. Eventhough these actions by both households might have been goodlong-term investments affecting their economic potential, TUPguidelines allow the use of the seed capital grant only to purchaseincome-generating assets or to pay for business-related expenses.
Data on ARM entrepreneurs indicate that during the past fouryears the most common types of businesses supported by TrickleUp grants are paddy cultivation (17%), goat raising (12%), veg-etable cultivation (10%), rice processing (9%), bamboo and canework (7%), betel cultivation (6%), fishing (4%), poultry raising(4%), and leaf-plate making (4%). The majority of income-gener-ating activities are agriculture related (crop production and pro-cessing, fishing, and small animal husbandry), with the remainderinvolved in the production of simple household items, such as bas-kets. The participants in the survey (n=19) show a similar trend intheir choice of income-generating activities for TUP funding; themost frequently selected income-generating activity is paddy culti-vation (9), followed by rice processing (6), and followed in turn bybasket making (3), fishing (3), and trading fruits (3).
When asked what factors they had considered when selecting acertain income-generating activity, the most common responseswere market demand and profitability (18), advice from a familymember (10), and familiarity with the work or an example by oth-ers (9). Given their initial condition of food insecurity, manyinvested at least part of the seed capital in paddy cultivation andrice processing. These households typically keep a portion of theirharvest or processed product for home consumption, thus provid-ing them with an income in-kind rather than in cash. Paddy culti-vation remains popular, perhaps because of its importance for thehousehold’s own food security, even though it is by far the leastprofitable of all the income-generating activities analyzed in thestudy. Interestingly, the majority used only the second seed capitalinstallment, and in most cases only a portion of it, to either expandor start paddy cultivation enterprises. This seems to suggest thatthere are fewer profitable opportunities available to TUP house-holds when they receive the second grant or that they prefer toaddress food shortages by producing rice themselves rather thanbuying rice from enterprise income. Rice processing (dehusking)on the other hand generates better profits than paddy cultivationand is the most common income-generating activity funded by thefirst seed capital installment. The fact that this microenterprise
Journal of Microf inance
Volume 7 Number 286
activity can be done by women in their homes and requires fewskills probably explains its popularity.
One-third of TUP entrepreneurs used their seed capital amountexclusively to expand existing income-generating activities, whereastwo-thirds used at least one of the two grant installments to start anew income-generating activity. The TUP households participatingin the survey spent about 40% of the seed capital on long-termassets (tools, means of transportation, equipment, animals) and60% on working capital items (raw materials, inventory, agricul-tural inputs, transportation expenses). This ratio, however,depends strongly on the type of income-generating activity. Forinstance, betel-leaf cultivation requires almost exclusively long-term assets, while rice dehusking requires mostly working capital.
Two-and-a-half years after receiving the second grant disburse-ment, all households still owned the fixed assets they had originallypurchased with the TUP seed capital, and many had acquired addi-tional assets from subsequent profits and savings. This accumula-tion of long-term assets is a significant step toward self-reliance, asthe assets not only provide a secure source of income but alsoincrease a household’s resilience against economic shocks, as they
Type of Assets Purchased from Business ProfitsNumber of TUP
Households Percentage
Small tools or accessories, such as cooking utensils, hoes,plow, baskets, bas ins, barrels
12 63%
Tools, such asstoves, e quipment, machinery 10 53%
Means of transportat ion, such as a bicycle, pushcart 6 32%
Building or storage structure, including houseimprovements
3 16%
Minor investments for marketing,s uch as chair, tabl e,shed, or the like
4 21%
Ani mals, including livestock, poultry, fish 9 47%
Land, bought or leas ed 3 16%
Other 4 21%
Note: n = 19
Table 4. Reinvestment of Profits in Productive Assets by TUPEntrepreneurs
Bui lding Economic Se l f -Rel iance
Volume 7 Number 2 87
are typically the last assets to be sold in a crisis. Table 4 shows howTUP entrepreneurs have reinvested profits for investment in bothproduction and household assets.
More than half of those interviewed had acquired the follow-ing asset categories from their enterprise profits: small tools,utensils, and accessories; larger tools and equipment; and animals.An average household invested in 2.7 different types of assets, andonly one household was not able to reinvest any profits in newassets. These high reinvestment rates are a good indication that thenew and expanded income-generating activities have sustainedprofits for several years since the disbursement of the Trickle Upseed capital.
Profits and Diversification
Since most available income-generating activities are seasonal andtime is usually not a limiting factor for engaging in them, mosthouseholds conduct a certain income-generating activity for aslong as the season lasts. Therefore, rather than comparing dailyprofits of different income-generating activities, it makes moresense to evaluate their annual profits. Unlike time requirements,gender roles and the number of people required to run a businessimpose strong limits on the type of income activities householdscan choose from. For instance, fishing ideally requires three(preferably male) household members, whereas fruit vending canbe done by one male household member and rice dehusking by oneor more female members. A profitability analysis of the variousincome-generating activities selected by the TUP entrepreneursinterviewed shows that there is a significant variation in profitsamong different income-generating activities, but when consideredon a per capita basis, annual profits for the various income-generating activities are very similar. Table 5 provides a compari-son of profits for the most common income-generating activities inwhich those interviewed were engaged. Even though profits areannualized as explained above, they are shown as average dailyprofits by dividing the profit by 365 days, to better understandeach activity’s contribution to daily incomes, comparable to theinternational $1-a-day poverty line. The reader needs to keep in
Journal of Microf inance
Volume 7 Number 288
mind that these are not actual daily profits, since most income-generating activities are not conducted on a daily basis. For example,while an actual daily labor wage is 45 Rs (for men), the averagedaily labor wage is only 6 Rs, because agricultural wage labor isonly available for an average of 50 days during the year.
When considering the profitability of each income-generatingactivity, regardless of the number of people engaged in it, fruitvending (34.7 Rs per day) and fishing (33.1 Rs per day) are by farthe most profitable. As stated earlier, paddy cultivation providesthe lowest average daily income (3 Rs per day). However, thereis much less variation in average daily income for each income-generating activity when considering per-worker incomes: all buttwo provide average daily worker incomes between 7.5 Rs and 9.1Rs, a difference of only 21%. This suggests that annual profits arenot a strong discriminating factor for selecting an income-generat-ing activity. Only fruit vending, at 20.8 Rs per worker per day, issignificantly more profitable, and paddy cultivation, at 3 Rs perworker per day is significantly less profitable. In other words,compared to the average daily income of 6 Rs from labor, mostalternative income-generating activities (except rice cultivation)generate a higher average daily income (on an annualized basis).Since most households are underemployed before they receive theTUP grant, they often supplement rather than replace their laborwages with income from microenterprise activities, at least to theextent that agricultural labor and microenterprise activities canbe performed during different times. In addition to such time-management constraints, other factors, such as the composition ofthe household work force, caste and gender roles, and previous
IGA Type Fruit Vending FishingBetel Leaf
CultivationBamboo
Cane WorkRice
DehuskingVegetable
CultivationPaddy
CultivationAverage daily
profit per IGA 34.7 33.1 21.6 21.3 17.1 15.1 6
Profit ranking 1 2 3 4 5 6 7
Daily incomeper worker 20.8 9.1 8.7 8.5 8.3 7.5 3
Incomeranking 1 2 3 4 5 6 7
Table 5. Profit and Income in Kenduaria and Rashalpur Villages
Note: IGA = income-generating activity.
Bui lding Economic Se l f -Rel iance
Volume 7 Number 2 89
experience with an income-generating activity, are more important inthe selection of a microenterprise than its expected annual profits.
The study also revealed a marked increase in the diversificationof household income sources after the TUP seed capital interven-tion. Figure 2 shows the number of income-generating activitiesper household before and after TUP.7 The average number ofincome-generating activities per household before TUP was 2.1(median = 2) and after TUP increased by 41% to 2.9 (median = 3).In other words, an average household managed to add one newincome-generating activity to its household income portfolio, notonly increasing overall household income, but also decreasingrisk and vulnerability through diversification. On closer exami-nation, it appears that pre-TUP households with one income-generating activity added two new ones, while those with twoincome-generating activities added one new one (with one exceptionamong nine cases), and those with three or more income-generatingactivities before TUP added none. This strongly suggests that thecombination of three income-generating activities per household
0
1
2
3
4
5
6
1 2 3 4 5 6 7 8 9 10 11 12 13 14 15 16 17 18 19
# of IGAs added
# of IGAs before TUP
Figure 2. Diversification: Number of IGAs per Household
# of IGAs added
# of I GAs before TUP
Journal of Microf inance
Volume 7 Number 290
represents an optimal number. It also suggests that householdemployment not only improved but perhaps reached a maximum.
All nineteen respondents confirmed that their householdincome had increased since receiving the TUP grants. The averageincrease in household income for those households who added onenew income-generating activity to their economic portfolio was113%. The average increase in household income for those house-holds who added two new income-generating activities to theireconomic portfolio was 152%. See Figure 3 for a household annualincome distribution before and after TUP. Before TUP, the majorityof households were found in the two bottom income categories,below 5,000 Rs and between 5,000 and 10,000 Rs. After TUP,most households had moved up at least one category and all hadannual incomes above 5,000 Rs. Figure 4 shows daily per capitahousehold income data, which can be compared with the $1-a-dayinternational poverty line, equivalent to approximately 16 Rs atthe time of the survey in January 2005. Before TUP, the majorityof households had a per capita daily income of less than 4 Rs.After TUP, most households were in the 4 to 8 Rs and 8 to 12 Rs
0
2
4
6
8
10
12
<5,000 5-10,000 10-15,000 15-20,000 >20,000Annual HH Income (Rs.)
Number of HH
# before TUP
# after TUP
Figure 3. Household Annual Income Distribution (Rs)
# before TUP
# after TUP
Bui lding Economic Se l f -Rel iance
Volume 7 Number 2 91
categories. After TUP, the average daily per capita income level was7.1 Rs per day (roughly equivalent to $0.50 a day), and only onehousehold was able to cross the 16 Rs per day equivalent to theinternational $1-a-day poverty line. More telling than a compari-son with the international poverty line are the perceptions abouttheir poverty shared by TUP entrepreneurs themselves duringfocus group discussions. During these discussions the followingchanges were almost unanimously cited as the most significantones: reduced debt burden and ending of dependency on localmoneylenders; increased household income, especially during thelean period; and the ability to eat three meals a day instead of one,as was the case before.
Access to Capital
Since capital had been a limiting factor for expansion or start-up ofincome-generating activities, the seed capital grants enabled mostTUP entrepreneurs to reach a higher level of business activity thanbefore. Some had been in a perpetual state of indebtedness withlocal moneylenders, and surpluses in-kind or in cash could never
0
2
4
6
8
10
12
14
16
<4 4 to 8 8 to 12 12 to 16 > 16 Daily Income per Capita (Rs.)
Number of HH
# before TUP
# after TUP
# before TUP
# after TUP
Figure 4. Per Captia Daily Income Distribution (Rs)
Journal of Microf inance
Volume 7 Number 292
be realized because they were withheld by the moneylenders as pay-ments for high-interest loans. Even without this debt burden mosthouseholds never had enough cash flow to expand their workingcapital or to buy additional assets for an existing or new income-generating activity. As a result, the household labor force remainedlargely underutilized and income sources were mostly limited todaily wage labor and sharecropping, supplemented in some casesby the meager profits of undercapitalized microenterprises. Inalmost all these cases, the TUP seed capital injection boostedmicroenterprise profits by optimizing the amount of working cap-ital needed or by providing for the purchase of new fixed assets.Also, one-third of the interviewed households bought or repaired abicycle with TUP seed capital, and another 25% did the same withprofits subsequent to the TUP seed capital injection. The resultingincreased mobility enabled many to bypass middlemen and toaccess new markets for their products and their raw materials.
For each type of income-generating activity, a critical mini-mum amount of capital seemed to be necessary to jump-start thebusiness to a level that more fully employed household labor. Somemicroenterprises, such as basket making and rice dehusking,require less than $50 to enable the household to produce at maxi-mum capacity or to generate a surplus from the profits and gradu-ally increase inventory. In the case of basket weaving, for example,$10 was enough to purchase a stock of raw materials to last forweeks. In many cases, the ability to buy greater quantities of rawmaterials (bamboo or paddy for instance) enabled these microen-trepreneurs not only to bargain for lower bulk prices, but moreimportantly to buy raw materials at times when prices are low. Forinstance, the biggest investment to start a rice dehusking businessis equipment (a large boiling pot, a tarp to dry the boiled rice, anda scale with weights) and amounts to approximately 1,000 Rs or$20. The remaining cash amount from a grant is more than suffi-cient to purchase adequate amounts of paddy and firewood tooperate a profitable business for at least several weeks. After that,the TUP entrepreneur is able to gradually increase the inventory ofpaddy by reinvesting a portion of the profits.
Bui lding Economic Se l f -Rel iance
Volume 7 Number 2 93
In other instances, the $50 capital grant is insufficient, espe-cially for start-up businesses. For instance, betel leaf growersneeded more than the initial $50 to buy all the assets and betelsaplings necessary to start a minimum size betel vine. Given thehigh start-up cost as well as the required skills, only those whowere already engaged in betel leaf production before TUP used theseed capital to expand this type of income-generating activity.Moreover, one betel leaf producer borrowed additional moneyfrom her SHG to supplement the first TUP grant so as to increaseher investment. She later used the second grant to pay back thisloan. Finally, some income-generating activities simply require amuch higher investment than $50. Operating a grocery shop andtrading coconuts and bananas are good examples. None of the TUPentrepreneurs interviewed owned a grocery store, and only thosewho were already engaged in buying and selling fruits were able touse the TUP seed capital for expansion of this type of business.
Conclusions and Recommendations
TUP’s primary objective for this study was to better understand itsmicroenterprise development process and to learn how the TUPmodel could be improved and adapted within each local contextwhere the program is implemented. Therefore, rather than focus-ing on social impact, this paper was mostly concerned with howTUP entrepreneurs invest their seed capital grants, what types ofassets they buy with the grant money, and how they are able toimprove their household income portfolio. As TUP starts to betterunderstand and systematically analyze, beyond mere anecdotal evi-dence, the various determining factors for success of the microen-terprises it funds, it and its partner agencies can use these findingsto make program inputs more fitting to the partner agency’s owndevelopment approach and more relevant to each different socio-economic context as well as more fitting to the different types ofincome-generating activities that are available to would-be TUPentrepreneurs. This in turn can be expected to provide recommen-dations for increased impact and for a more cost-efficient program.
Journal of Microf inance
Volume 7 Number 294
Experience has shown that before participating in the TrickleUp Program, many extremely poor people are by necessity alreadyinvolved in various income-generating activities that are often sea-sonal, barely profitable, and undercapitalized. Others, such as therural landless, can only resort to labor as their source of income,but they often have the skills and interest to engage in certainincome-generating activities. Capital is often the key to unleashingthe profit potential of such income activities, but the high risksinvolved make loans unattractive to both lenders and entrepreneurs.Trickle Up’s capital grant eliminates most of these risks to theentrepreneurs who, in the case of ARM, have been able to expandexisting activities and start new income-generating activities,resulting in significantly increased household incomes. That thecapital grant plays a critical role in strengthening the householdincome portfolio is evident from the direct link that exists betweenthe investment of the grant in productive assets and the increasedprofits these assets in turn have generated. Whether the capitalgrants are the main factor in this process, however, is less certain,since ARM, like many Trickle Up partner agencies, provides arange of additional financial and nonfinancial services that maycontribute directly or indirectly to the sustainability and prof-itability of the income-generating activities funded by TUP grants.In the absence of a control group and a large sample size, it isimpossible to attribute impact to specific program elements. Butthe fact that ARM is one of TUP’s most successful partner agenciesin improving the economic capacity of extremely poor householdsis likely to be related to the type and quality of the services it pro-vides to its target clients in addition to the TUP inputs.
As for the role of capital itself, the study did not attempt tocompare the effectiveness of Trickle Up grants versus loans takenfrom SHG members’ own pooled savings in improving the house-hold income portfolio. But since it would take most SHG membersyears to save the equivalent amount of the TUP grant, it is easy tosee that a large one-time TUP grant represents a stronger potentialthan slowly accumulating savings for boosting household incomes.The fact that TUP entrepreneurs are saving two to three times
Bui lding Economic Se l f -Rel iance
Volume 7 Number 2 95
more than non-TUP SHG members also suggests that grants arecapable of improving household profits faster than just savingsalone. Nevertheless, it would be valuable to conduct furtherresearch to assess to what extent non-TUP SHG members, of thesame poverty level as TUP entrepreneurs, are able to increase theirhousehold incomes, relying on savings as their only source offinancing their income-generating activities.
When microcredit is too risky or not available and their ownsavings rate is limited, seed capital grants are an effective methodto provide the extreme poor with a minimal amount of capital tostart or improve income-generating activities. Moreover, grantsprovide more flexibility than loans for several microenterpriseactivities, especially in rural areas, as these activities often generateunpredictable returns or need an incubation period after investingin productive assets. In addition to making immediate loan repay-ments difficult, microenterprises that involve food productionoften provide the household with food for home consumption,leaving little or no products to be sold for cash to pay back a loan.
As mentioned before, ARM assists TUP entrepreneurs in vari-ous ways in their efforts to initiate or expand productive and sus-tainable income-generating activities. For instance, SHGmembership provides TUP entrepreneurs with an opportunity tosave as well as a platform to discuss their businesses with each otherand to jointly sort out difficulties that may be hindering theirincome-generating activities. TUP entrepreneurs also found theregular business counseling sessions with ARM staff very useful,and they recommended that these sessions cater more to theirneeds by addressing specific issues relevant to each different type ofincome-generating activity. As mentioned before, ARM’s nonbusi-ness services, such as healthcare and education, also play a crucialrole for achieving long-term economic progress by the extremepoor targeted for the TUP program.
The study points at several ways whereby TUP can increase theimpact of its programs and make them more cost-effective. Giventhe different amounts of seed capital required by different income-generating activities, TUP should consider varying the amount of
Journal of Microf inance
Volume 7 Number 296
seed capital according to business needs instead of the current one-size-fits-all approach of two $50 installments. In the case of highercapital needs for a certain business, TUP could disburse a higheramount for the first grant installment and a lower one for thesecond. Some of the evidence also suggests that in the currenttwo-installment system, the second $50 grant has less potential forimproving the household income than the first one. If furtherresearch confirms this, then increasing the first installment andpossibly eliminating the second has the potential to make the pro-gram not only more effective but also less costly. Some microen-terprise activities, as mentioned in the study, require a totalinvestment of less than $50. Reducing the amount of seed capitalfor these types of business therefore is justifiable but might seemunfair to those who engage in these business types. To address thisissue, TUP could consider providing all entrepreneurs with anequal amount of seed capital (for instance, $25 instead of the cur-rent $50 first installment), enough to invest in low-capital businesstypes, and to provide access to loans (in the case of ARM, from theSHG savings pool, for instance) for those who require a highercapital investment and can take on some risk. This or similar inno-vations (such as matching savings with a grant amount, forinstance) would not only increase the entrepreneurs’ ownership intheir businesses but also offer great potential to reduce overall pro-gram cost, of which a large portion is currently allocated to capitalgrant expenses.
The finding that the TUP entrepreneurs at ARM were able tosignificantly increase their production and profits after investmentof the grant in working capital and long-term assets suggests thattheir microenterprise activities were undercapitalized before.Moreover, since their per capita income levels were estimated to fallbelow $0.50 per day before TUP, they lived in extreme poverty.The TUP entrepreneurs themselves stated during focus group dis-cussions that they had led a hand-to-mouth existence, often withonly one meal a day for the entire family and virtually no cash sur-plus. In addition, many faced permanent debt and their money-lenders would demand any cash surplus as soon as it became
Bui lding Economic Se l f -Rel iance
Volume 7 Number 2 97
available. The seed capital grant enabled them to accumulate a crit-ical minimum of productive assets to reach a state of economicself-reliance, characterized by a significantly increased householdincome and employment level. Through increased microenterpriseprofits they were able to improve their food security from one mealto three meals a day, pay off long-term debts, and start saving.These households were able to shift their focus from consumptionand immediate survival to production and longer-term survival.
Whether these households are able to continue to accumulatewealth and invest in new profit opportunities remains to be seen.Several factors seem to indicate that their income has reached aplateau. First, almost all households in the study had arrived at a totalof three income-generating activities, which seems to present anoptimal household income portfolio in the given circumstances.Second, since the majority of microenterprise activities generatevery similar profits (annualized) and very few households were ableto specialize in only one microenterprise as their only source ofincome, there seems little room for expansion and improved profitsunless other factors such as increased demand, skill development,or technological innovations improve the profits of their microen-terprises. In order for these households to move further out ofpoverty, TUP and its partner agency ARM should explore theimpact potential of business development services, such as business-specific training, new ways to add value to product and services,and linking TUP entrepreneurs to new markets for their rawmaterials and products.
Notes
1. Recent US legislation defines the phrase very poor as those households living
in the bottom 50% below the nationally defined poverty line or those living on the
equivalent of less than $1 per day, which is the international poverty line, adjusted for
Purchasing Power Parity (PPP). While TUP does not formally measure the poverty
levels of its clients, the majority of its clients in India are believed to live significantly
below the international poverty line.
2. The TUP-assisted households in this study can be described as the extreme
poor because they all live below $0.50 per day (per capita income) and a majority live
on less than $0.25, based on poverty estimates derived from the annual income from
Journal of Microf inance
Volume 7 Number 298
their entire portfolio of income-generating activities, including labor and food pro-
duction for home consumption. Sebsted and Cohen (2000) distinguish among different
poverty levels: destitute (the bottom 10% below the poverty line), extreme poor (the
bottom 10–50%), moderate poor, vulnerable non-poor, and non-poor. In January
2005, when the study was conducted, the $1 per day international poverty line was
equivalent to approximately 16 Indian Rupees, compared to the market exchange rate
of 45 Rupees per $1.
3. In this study the household income portfolio is simply the set of income sources
within a household, which is much less encompassing than the term household eco-
nomic portfolio as defined by Chen and Dunn (1996). The household income portfo-
lios in this study are mostly agricultural in nature and consist of income-generating
activities (earning an income through selling a good or service), wage labor and
employment, and production for home consumption.
4. In India, a typical Self-Help Group is a voluntary group of 10–20 low-income
women who collectively save a monthly amount into a group fund. After a sufficient
period of internal lending, the group is able to access bank credit for larger needs.
Peer pressure is said to ensure regular repayment and accountability. Often SHGs
provide nonfinancial benefits to their members, who use their meetings as a forum to
discuss issues of mutual concern and resolve matters collectively. Many community
development NGOs in India aim to facilitate economic and social development by
targeting their programs to SHGs.
5. For the time frame of the study, which focused on incomes earned during the
last 12 months before the interviews took place, the average exchange rate was 47 Rs
per $1.00. Most income data in the study were either kept in local currency or con-
verted into dollars, adjusted for purchasing power parity (PPP), which takes into
account the local purchasing power of the Indian rupee.
6. The Indian constitution allows the government to compile a schedule (list) of
castes (Scheduled Castes, SC) and tribes (Scheduled Tribes, ST) who are economically
and socially disadvantaged and are therefore entitled to protection and specified ben-
efits under the constitution. Other Backward Castes (OBC) are also officially recog-
nized as being traditionally subject to exclusion, while still having a higher status than
Scheduled Castes and Scheduled Tribes.
7. Since SHG membership often precedes the TUP intervention by only a few
months, it would be misleading to suggest that the TUP program is solely responsible
for the observed changes in the household income portfolio. It is more likely that the
combined effects of SHG membership (giving members access to a range of services)
and TUP facilitated some of these changes.
Bui lding Economic Se l f -Rel iance
Volume 7 Number 2 99
References
Chen, M., & Dunn, E. (1996). Household economic portfolios. Paper submitted to
USAID by the AIMS Project. Washington, DC: Management Systems
International.
Parker, J. (2001). Linking microfinance and safety net programs to include the poorest:
Where does microfinance fit? (Consultative Group to Assist the Poor (CGAP)
Focus Note 20). Retrieved from www.cgap.org
Sebsted, J., & Cohen, M. (2000). Microfinance, risk management, and poverty. Study
submitted to USAID by the AIMS project. Washingon, DC: Management
Systems International.
Volume 7 Number 2
Microfinance Institutions inTransition
Fonkoze in Haiti Moves towardRegulated Banking Status
Michael Tucker and Winston Tellis
Abstract: Microfinance institutions (MFIs) established to provide the poor with
access to capital have typically operated outside of their countries’ regulated
banking environments. Many have relied on donor grants and low-interest funds
to support loan portfolios and social programs. As MFIs mature they aspire to
become more efficient and attain economic sustainability because hey under-
stand that greater numbers of the poor can be serviced by economically sustain-
able institutions. Many MFIs collect savings deposits but are often barred from
using them for loans by their countries’ laws. Fonkoze, an MFI in Haiti, has
sought regulated status, which would provide access to deposit assets and enable
Fonkoze to better compete with other MFIs, some of which are regulated sub-
sidiaries of commercial banks. In the midst of political and economic turmoil,
Haiti’s Central Bank has delayed Fonkoze’s transformation. A different solution
is now moving forward, with Fonkoze becoming two entities, Fonkoze Financial
Services and Fonkoze Foundation.
Most microfinance institutions (MFIs) have been outsideof or at least partially removed from the banking regula-tory system of their respective countries. The poor also
lack access to traditional forms of banking capitalization and arefrequently reliant on donor organizations, typically nongovern-
Journal of Microf inance
Volume 7 Number 2102
mental organizations (NGOs). One such NGO is Fonkoze, whichstarted in Haiti as an organization to help the poor and grew intoan MFI. Fonkoze started with an office in Port-au-Prince, the cap-ital of Haiti, and quickly expanded into an organization with 18branches throughout the country to meet rising demand from thepoor. From its inception in Haiti, Fonkoze has been financed by acombination of outright donations and loans at below marketinterest rates. As with many MFIs, adhering to the mission of pro-viding capital to the poor was more important than profits forFonkoze. Financing continuing and growing operations withoutaccess to depositor funds limited operations to whatever could beraised or borrowed from donors, necessitating continuous roundsof fund-raising. Like a growing number of MFIs, Fonkoze is in theprocess of making the transition from an MFI to a regulated bank-ing institution legally able to mobilize deposit capital for its loanportfolio. While transformations have been successfully negotiatedin other developing countries, Fonkoze is the first applicant fortransformation in Haiti. Each MFI contemplating transformationis in a unique situation, but there are similarities as well as country-specific differences that illustrate the promise and pitfalls ofbecoming a regulated financial institution.
Larger MFIs with operating assets in place may not be able torealize economies of scale without becoming regulated institutions.Expansion of loan portfolios that could be accommodated by MFIinfrastructure already in place may not be possible, due to fundingconstraints. Such constraints can be overcome with the establish-ment of or access to already existing savings deposits. Becoming aregulated bank would also mean focusing on profits. Since profitsare not the focus of all MFIs, some may not be candidates fortransformation to regulated institutions. MFIs with missions heavilytilted toward servicing the poor incur expenses far beyond those ofbanking operations that would make transformation to an opera-tionally profitable entity difficult if not impossible. In Bangladesh
Michael Tucker is a Professor of Finance at Fairfield University in Fairfield, Connecticut.Email: [email protected]
Winston Tellis is a Professor of Information Systems and Operations Management atFairfield University, in Fairfield, Connecticut. Email: [email protected]
Microf inance Inst i tut ions in Trans i t ion
Volume 7 Number 2 103
there was concern that a focus on profit-making could reduce ser-vice to the existing clientele, 90% of whom were women(Charitonenko & Rahman, 2002). Programs focusing on servingthe poorest can at best cover 70% of operating costs (Morduch,2000). Donors believe that as few as 5% of MFIs with a social wel-fare orientation may be able to attain financial sustainability.Fonkoze, with its mix of social and educational services as well aslending to the poor, has been a social-welfare-oriented MFI.Fonkoze plans to address mission drift, a preeminent issue in MFItransformation, by splitting its organization into a profitable bankwith plans for becoming regulated and a foundation that wouldcontinue as a separate organization for social services. Splitting thefunctions and the funding sources will set up a synergistic rela-tionship. The poor can receive rudimentary education and instruc-tion in running small businesses, making them more creditworthyborrowers from Fonkoze the foundation and eventually move on todoing business with Fonkoze the bank.
Competition can also be a motivating factor behind seekingregulated status. In Haiti, regulated banks have created spin-offs orhave directly entered microfinance. While their services differconsiderably from those offered by Fonkoze, over time and withperhaps government intervention, they could become dominantplayers in an altered lending environment.
Regulation means stepped up reporting requirements andaudited financial statements. For most MFIs receiving supportfrom multiple donors, financial reporting is nothing new. Theyoften need to satisfy multiple and time consuming reportingdemands. Some NGOs funding MFIs have also insisted on auditedstatements. Transformation to a regulated institution streamlinesthese reporting requirements while simultaneously making thoseloose requirements more stringent. Regulated institutions are sub-ject to far more scrutiny than unregulated MFIs. Regulation meanshigher standards, and the necessity of profitability translates intofocusing on greater operational efficiencies. Regulated unprofitablebanks cannot continue to function while losing money, unlikeunprofitable MFIs. Improving operational efficiency can be a good
thing for clients but may move regulated institutions away fromserving the more expensive clientele, the poorest of the poor. AsFonkoze moves steadily towards transformation, it has much tolearn from the experiences of similar organizations around theworld.
The first two sections of this paper trace the origins ofFonkoze and place it in the context of recent Haitian history. Thenext sections discuss and review microfinance institutions andbanking in other countries and how some of these MFIs havetransformed into regulated banks. The paper proceeds to examinethe banking regulatory body in Haiti, the National Bank of Haiti(BRH), followed by an overview of MFI competition in Haiti. Thefinal section and conclusion of the paper describe the impedimentsto Fonkoze’s transition toward transformation into a regulatedbank and how these impediments were overcome, allowing the for-mation of a new entity, Fonkoze Financial Services (FFS), a transi-tional entity that is partway to achieving that transformation.
Origins of Fonkoze in Haiti
Fr. Joseph Phillipe founded Fonkoze in 1994. One year later itbecame a foundation under Haitian law. Since it is a membershiporganization, only other organizations, with the exception of polit-ical parties, can be members of Fonkoze. Organizations with mem-bership in Fonkoze represent the organized poor. Governance isthrough a democratic General Assembly, with organizations havingmemberships greater than twenty-five sending two delegates andthose with fewer than twenty-five sending one. The delegates electnine members to a Board of Directors.
It was not until 1996 that funding levels began to rise andFonkoze began making loans to the poor. In 1996 an organizationof Haitians living in Canada donated $10,000, which was matchedby the Canadian government as seed capital for a loan portfolio.Soon after that an organization of women in Louisiana, USA,donated funds. In 1997, the Doen Foundation of the Netherlandsprovided a combination grant and loan of $100,000, allowingFonkoze to have a major impact on loans to the poor. To assist
Journal of Microf inance
Volume 7 Number 2104
Microf inance Inst i tut ions in Trans i t ion
Volume 7 Number 2
Fonkoze in Haiti, Fonkoze USA was formed in 1997 as an inde-pendent 501(c)3 charitable organization incorporated in theUnited States with a separate board of directors. Sixty-eight per-cent of Fonkoze’s loan portfolio is financed through Fonkoze USA.Funds raised in the United States have come from three sources:
• Progressive Donors: those making tax deductible donations.• Solidarity Investors: those who loan $1,000 or more for a
period of one year at little or no interest.• Dedicated Partners: individuals or organizations donating
expertise (Fonkoze, 2004).
Fonkoze requires that borrowers maintain savings depositaccounts, but because of Haitian banking regulations, it cannotmobilize those savings for any purposes. The savings are effectivelysegregated from Fonkoze’s other accounts by being held in separatecommercial bank accounts.
Meeting rising demand for loans had been possible with theparticipation of Fonkoze USA, international donors, and lenders.Political instability in Haiti in recent years, however, has increasedthe difficulty of maintaining donor funding. Satisfying differentreporting requirement of the various NGOs has also become increas-ingly burdensome particularly since there is no standardization.Gaining legal access to deposits in order to minimize and possiblyeven eliminate the need to continue to seek outside funding, whichis a time consuming and costly pursuit for management, would setFonkoze as a bank firmly on the road to self-sufficiency.
Deposits on hand were much greater than the loan portfolio inboth 2001 and 2002, reaching over 270% of the loan portfolio.Interest paid on deposits held by commercial banks in 2002 was5% per annum. Fonkoze charged borrowers upwards of 3% inter-est per month. The spread between rates charged and rates Fonkozewould need to pay depositors leaves considerable room to coveroperating expenses. Not all deposits would be available for loans.BRH set reserve requirements at 31%, well above the 8% standardset by the Basle Capital Accord of 1988 (Basle Committee, 1988).
105
Even at this level, considerable deposit funds would be available tofund a loan portfolio larger than current levels.
In 2001 and 2002 Fonkoze had net operating losses and sus-tainability ratios of 40% and 54% respectively. These numbers inisolation would seem to be poor indicators of the ability to survivewithout subsidies in the form of donations. Low sustainabilitymargins, however, reflect both expenditures serving the poor, suchas literacy and business practices classes, and a strategy of pur-chasing assets in preparation for the transformation into a largerregulated entity. Transformation would enable Fonkoze to utilizeeconomies of scale by tapping deposits. With fully staffed branchesthroughout the country and considerable fixed assets ready to beutilized, Fonkoze in 2002 was poised for regulated status andexpansion.
Recent Historical Background
Fonkoze was founded at one of the many turning points in Haitianhistory. A military coup had taken over the country from BertrandAristide, the first democratically elected president in Haiti’s his-tory, forcing him into exile. By September 15, 1994, havingexhausted diplomatic negotiations to reinstate the elected presi-dent, the United States along with twenty other countries decidedto intervene in Haiti (Ambassade d ‘Haïti, 2004). Four days latertroops landed, and coup leaders stepped down and left the country.On October 15, Aristide returned from exile and resumed whathad become an abbreviated presidency. In June 1995, former PrimeMinister René Préval was elected president to succeed Aristide,who could not succeed himself.
Parliamentary elections were held on May 21, 2000. Resultswere delayed and then in June Haiti’s top election monitor fled thecountry, casting doubt on the election’s legitimacy (AssociatedPress, 2000). Even with this hasty departure, local and interna-tional observers expressed a willingness to accept the electionresults as marred but legitimate. Opposition parties were less san-guine, continuing to express outrage. They accused formerPresident Aristide’s Lavalas Family Party of fixing the election to
Journal of Microf inance
Volume 7 Number 2106
Microf inance Inst i tut ions in Trans i t ion
Volume 7 Number 2
ensure an overwhelming victory prior to Aristide’s own run for thepresidency later in the year. Led by the United States, the interna-tional community rejected the May 2000 elections and subse-quently embargoed all aid to Haiti (CIA, 2004). The Haitianeconomy has been shrinking since, with approximately $500 mil-lion in aid suspended only worsening the plight of 80% of the pop-ulation already mired in extreme poverty (Janet Matthews, 2004).
In early 2004, unrest fomented by extremists, some of whomwere convicted murderers, participants in the prior military coup,and retreads from the Baby Doc Duvalier dictatorial regime of the1980s, led to the late-night February 29 departure of PresidentAristide under questionable circumstances. Chief Justice BonifaceAlexandre was sworn in as caretaker president (Janet Matthews,2004). New elections were scheduled for late 2005. The US mili-tary returned with a multinational force to restore order at least insome portions of the country. The Haitian government functionswere reconstituted without Aristide and the possibility of aresumption in aid with the promise of stability seemed imminentin mid-2004.
Corruption and lack of security were rampant before Aristide’sdeparture. In June 2003, Police Chief Jean-Robert Faveur resignedafter only a short time on the job. His predecessor had lasted onlythree months before he resigned after being accused of a 1991murder. With law enforcement minimal, Haiti has become a trans-shipment point for cocaine to Europe and the US, with 15% of allUS cocaine consumption passing through the country (JanetMatthews, 2004). In 2002 GDP was down 1.5% following a 1.7%decline in 2001. Inflation was down to 8.7% in 2002 from the2001 level of 14.2%. There was a run on bank deposits after arumor was spread that BRH would require forced conversion of allUS denominated deposits to Haitian gourdes. While exports in2002 held to 2001 levels, coffee exports, a mainstay of the ruraleconomy, continued to decline from the 1995 level of $25 millionto just $2.6 million. Manufacturing exports fell from $100 mil-lion to $85.9 million, although this was still considerably above1995’s $30 million. Imports were off by $77 million to $980.2
107
million, seven times the level of exports. US currency reservesdropped to $45 million, barely sufficient to cover two weeks ofimports. Foreign investment undaunted by political instability roseslightly in 2002 to $99.1 million, more than double the1995–1998 annual averages (Janet Matthews, 2004).
The budget deficit rose to 3% of GDP as taxes fell to just 5.3%of GDP, covering only 50% of government expenditures. The IMFin 2003 called for privatization of telecommunications and energyalong with substantial infrastructure improvements. It would bedifficult to imagine where the funds to accomplish any rebuildingwould come from other than foreign aid, which in 2001 had fallento $20.40 per capita from $43.40 in 1997, significant sums in acountry where average wages are $1.20 per day (CIA, 2004).
MFIs and Banking in Other Countries
Microfinance institutions’ ability to attract capital is in part depen-dent on the stability of the country’s political climate (Campion &White, 2001). Sri Lanka’s experience of political unrest impingingon commercial development (Charitonenko & de Silva, 2002)could be instructive to countries like Haiti undergoing similardisruption. Indonesia also endured sectarian violence, but thegovernment introduced enabling measures to assist in microfinancedevelopment (Afwan & Charitonenko, 2003). In Bangladesh,creating an MFI enabling environment is not the highest priorityof a government that has been faced with occasional instability.Even so, government subsidies do contribute to enhancing the41% of loanable funds that come from donations to MFIs(Charitonenko & Rahman, 2002).
Some countries, recognizing the lack of capital and bankingservices available to the poor, often encouraged and assisted theestablishment of institutions. In the Philippines the Rural BankingAct of 1952 promoted the establishment of rural banks. TheCentral Bank of the Philippines (Bangko Sentral ng Pilipinas, BSP)provided free technical assistance and access to loans at preferentialrates (Charitonenko, 2003). The way was open to entrepreneurs orcooperatives to own rural banks. That is not to say that Philippine
Journal of Microf inance
Volume 7 Number 2108
Microf inance Inst i tut ions in Trans i t ion
Volume 7 Number 2
rural banking was always successful or that government assistancewas not without a price. In the 1970s, BSP forced rural banks toact as a conduit for unsecured loans to rice farmers by threateningto fund new competitors if they did not cooperate. The loan pro-gram was a disaster, creating economic hardship and even bank-ruptcy for some rural banks. Similarly, Indonesia began deregulatingthe financial sector in the 1980s by liberalizing interest rates. Thegovernment has tried to strengthen the Central Bank since 1998(Afwan & Charitonenko, 2003). Sri Lanka addressed the issuesacross several areas: the policy environment, the legal framework,regulation and supervision, money and capital markets, and supportinstitutions. Sri Lankan government support was not always bene-ficial. Government subsidization and debt forgiveness significantlycompromised movement toward best business practices and sus-tainable viability of the microfinance industry (Charitonenko & deSilva, 2002).
The governments of Bangladesh, Chile, Sri Lanka, andIndonesia directly subsidized microfinance lending for selectedinstitutions, sometimes causing serious harm to those outside theorbit of such aid (Charitonenko & de Silva, 2002). In Chile, the focusof the subsidies was the country’s largest banks. MFIs werebypassed even though they had built a base of 81,000 loan clientsover ten years. Quickly, the three largest banks attracted 70,000microcredit clients (CGAP, 2001). NGO-established MFIs, lockedout of the subsidization program because it was open only to reg-ulated banks, eventually closed down. Many MFI employees endedup working for banks in their microcredit departments. Whileprofitability was not up to the standards of other sectors of Chileanbanks, efficiencies achieved by economies of scale aided by govern-ment subsidies made loans more available. More of the poor mayhave been assisted by the government subsidized expansion ofmicrofinance lending in the end, but the process destroyed existingMFIs.
Since MFIs are costly to operate, the ability to set interest rateshigh enough to cover operating expenses is crucial to survival.Government laws capping usury rates can be restricted to regulated
109
institutions or in some cases extend to all lending institutions inthe economy. In Nicaragua, where the microfinance industry hasgrown rapidly in both rural and urban areas, the legislature cappedall loan interest rates at such low levels, reportedly at the behest ofthe commercial banks in the country, that the survival of microfi-nance organizations was threatened. Since the cost of administer-ing small loans is higher for MFIs than the cost of administeringlarger sized bank loans, MFI profit margins are particularly sus-ceptible to the imposition of interest rate caps. In 1986, ACPGroup in Peru had become the largest MFI lender in Latin Americawith over $5.8 million in loans and better than nine thousand bor-rowers (Campion, Dunn & Arbuckle, 2001). To fight inflation, thegovernment capped interest rates at 32% in 1987, an extremelyunrealistic figure, as inflation rates climbed to over 7,000%. By thefollowing year ACP’s loan portfolio was below $100,000 and twoof its four branches had closed. Fujimori’s election led to reformsthat lifted the usury cap in 1990. ACP expanded its loan portfolioto $6.8 million and 19,100 clients. Though inflation was alsodown, ACP still had to charge an effective annual interest rate of125%. Without the ability to adjust interest rates, ACP would cer-tainly not have been able to expand or possibly even survive.
Progress and Challenges to MFI Transformation
Ideally a country’s political and economic climate should nurturenew financial institutions. Some specific legal and economic con-ditions that are seen as favorable to the growth and prosperity offinancial institutions include the following:
• The elimination of policies that inhibit transformation,such as rate caps on commercial institutions.
• The elimination of government sponsored loan programsthat undercut private and NGO sector loans.
• A legal system that allows for the creation, registration, andrepossession of claims against borrowers.
• Banking supervision that both regulates and assists in themobilization of savings.
Journal of Microf inance
Volume 7 Number 2110
Microf inance Inst i tut ions in Trans i t ion
Volume 7 Number 2
• The existence of both money markets for short-term creditand capital markets for longer term funds.
• The existence of institutions or the ability to create insti-tutions that compile credit information, credit rating, andcollections agencies.
• MFI trade organizations that provide training and technicalsupport (Campion & White, 2001).
Favorable conditions did exist in Sri Lanka, so much so thatmicrocredit saturation is reported to be around 80%. Some ofthese MFIs are at a fairly early stage of transformation. A fewNGO-sponsored MFIs were attempting to transform, but mostwere economically unsustainable. There is limited involvement inmicrofinance by commercial banks. Government policies and inter-ventions now discourage new entrants into microfinance andhinder the transformation of existing MFIs (Charitonenko & deSilva, 2002). Saturation of the microcredit market “Has led tomany cases of over-indebtedness and appears to be underminingthe primary incentive to repay . . . increasingly, clients appearwilling to default . . . safe in the knowledge they can access thefinancial services from one of its competitors if follow on loans arenot made available” (Wright, Christen & Matin, 2001). InBangladesh, the government estimates that 45% of the population,or 12.2 million families, are poor. If this estimate is correct, themicrocredit market is largely saturated, with MFIs reaching morethan 70% of the poor households (Charitonenko & Rahman,2002).
Bolivia was also fertile ground for MFIs. The number ofmicrofinance lenders reached such high levels in the 1990s thatborrowers began to obtain loans from one MFI to repay another(Rhyne, 2001). By 2002 as much as 34% of all Bolivian MFI loanportfolios were for borrowers with obligations at more than oneMFI. Insolvency at some institutions and excessive debt burdensforced the government to intercede.
The tendency to subsidize interest rates to borrowers and toforgive loans during adverse weather conditions was perhaps themost inhibiting factor faced by MFIs in Indonesia as they moved
111
towards transformation (Afwan & Charitonenko, 2003). Sri Lankawas also hampered by government intervention, which had a chill-ing effect on organizations considering transformation to regulatedstatus (Charitonenko & de Silva, 2002).
Many MFI boards and NGO sponsors are reluctant to considertransformation to regulated status, fearing that the founding mis-sion of serving the poor will be lost in the pursuit of profits.Focusing on profits can raise the size of the average loan, effectivelylocking out the poorest of the poor. By contrast, mission drift maybe low in semi-formal MFIs that are content with serving a local-ized market on a competitive basis (Charitonenko & de Silva,2002).
Indonesia had a sound regulatory framework, but with laxenforcement MFIs circumvented regulations banning the use ofsavings deposits to finance loans. Indonesia lacks deposit insur-ance—there is no deposit insurance institution—and public sav-ings have reached 70% of total bank assets, which makes thelending of deposits even more dangerous without appropriatesupervision and control. Indonesia also lacks a Credit InformationBureau and like Sri Lanka lacks microfinance training centers(Afwan & Charitonenko, 2003).
MFIs in Sri Lanka overemphasized the social mission, which inturn curtailed progress towards transformation. In Sri Lanka thereis a legacy of ad hoc debt forgiveness that damages the repaymentculture. Sri Lankan cooperatives mobilized over 1 billion SriLankan Rupees (US$11.2 million), but an inadequate legal andregulatory framework places customers’ funds at risk. Most MFIsin Sri Lanka consider transformation to a regulated bank as thebest survival option, but the high minimum capital requirement—500 Million Sri Lanka Rupees (US$5.6 million)—is likely to bedifficult to meet (Charitonenko & de Silva, 2002).
In Indonesia, transformation has allowed large scale, sustain-able microfinance outreach. Indonesian MFIs are averse to theterm transformation and instead invoke the phrase greater businessorientation. The more “business oriented” MFIs have a good recordin reaching the poor and have not experienced significant mission
Journal of Microf inance
Volume 7 Number 2112
Microf inance Inst i tut ions in Trans i t ion
Volume 7 Number 2
drift. However, MFIs have not had to deal with competition fromnew entrants.
Indonesia’s Bank Rakyat (BRI) is the largest microcredit insti-tution in the world. It is also 100% state owned. Such marketdominance can inhibit other MFIs from making the transition toregulated institutions that would entail greater scrutiny and report-ing requirements. Only a few Indonesian NGOs have made effortsto formalize their microfinance activities. Prohibited from mobi-lizing savings deposits for use in loan portfolios, they set up creditunions to circumvent the law. Moslem religious prohibitionsagainst usury are another impediment to lending practices inIndonesia. Here government-sponsored changes in the late 1990sto banking laws have paved the way to creative lending that accom-modated the ban on charging interest (Afwan & Charitonenko,2003). In the Philippines, restrictions on MFI access to mobilizingsavings are more flagrantly violated. Many MFIs regularly loan sav-ings, effectively challenging regulatory authorities to intervene(Campion & White, 2001).
In Peru, APC faced two choices when it considered transfor-mation to regulated status in 1994. One choice, Financieras,required capitalization of $3 million, less than the second choice ofthe traditional full-service bank, but Financieras was restrictedfrom offering savings accounts and other banking services(Campion, Dunn & Arbuckle, 2001). Later in 1994 legislationcreated a third alternative specifically designed for MFIs, theEDPYME, with an even lower capital requirement of $256,000.EDPYME organizations were to be a first step in a transformationprocess eventually leading to becoming a full service bank.Mobilizing savings deposits, however, was barred until the trans-formation was complete. The cautious step-by-step approachappealed to ACP until Fujimori, after attending a MicrofinanceSummit in 1997, proposed establishing a full-fledged microfinancebank in Peru. Rather than create a new MFI institution, Fujimorisaw ACP, the largest MFI, with capitalization exceeding the $5.6million minimum, as the logical choice. The new entity would alsobe permitted to collect passbook savings.
113
The Haitian Banking Sector
The National Bank of Haiti (BRH) was founded in 1880 but didnot assume the role of a national bank until 1934 (U.S.Department of the Army, 1989). Since then it has had multipleroles, including the issuance of Haitian currency, the gourde.Under 1979 legislation, BRH gained authority to control credit,and to set interest rates and reserve requirements. It exercised thatauthority in the 1980s to implement conservative monetary policyrequiring high reserves and low interest rates on loans made by thecountry’s commercial banks. This policy effectively limited creditavailability, slowing the economy and curtailing inflation.
The bulk of banking profits were made on the spread betweenthe interest rates banks could earn on their investments and whatthey paid out to depositors. With rates on deposits low, commer-cial banking was a money machine. In the 1980s imposed caps onloan rates made commercial bank lending unprofitable and unde-sirable, particularly when money could be made on the spreadbetween rates paid and investment returns. Private-sector lendingbeyond the purview of banking regulation supplied loans at veryhigh rates. The poor had access to loans only from loan sharks,who were often brutal in collecting overdue debts. It was not untilthe 1990s that NGO-sponsored microfinance institutions beganmaking loans available to the poor. MFIs were unregulated andoutside the imposed BRH rate caps, though not beyond a prohibi-tion barring access to deposits for their loan portfolios.
MFI Players in Haiti
There are many microfinance institutions in Haiti (see Table 1) butnone offers the type of services and geographical reach of Fonkoze.With branches in outlying rural areas, where 95% of its clients arelocated, Fonkoze serves the rural poor as a lender and as a depositinstitution, though those deposits are eventually transferred andheld by commercial institutions. Fonkoze’s average loan size is wellbelow average loans provided by other Haitian MFIs (Table 1)because of its dedication to serving the poor. Remittance services,
Journal of Microf inance
Volume 7 Number 2114
Microf inance Inst i tut ions in Trans i t ion
Volume 7 Number 2
i.e., money transfers from outside Haiti done affordably, as well asforeign exchange services are not found at other MFIs.
In the early 1990s Haitian bank regulators removed interestrate caps, motivating three commercial banks to offer microfinanceloans (Gonzalez, 2001). As in Chile, commercial banks were build-ing on the success of NGO-backed MFIs, but unlike in Chile, theonly help from the government was the lifting of interest rate capsto create a level playing field. With 80% of Haiti’s workforce self-employed (CIA, 2004), the market for small loans is large. Thesophistication of borrowers, however, is limited, as it is in SriLanka or Indonesia.
Legislation that removed interest rate caps from commercialbanks and lowered equity requirements opened the way for largescale commercial lending as well as the expansion of commercialbanks into microfinance (Accion International, 2000). In 2000,following these reforms, Sogebank, a major commercial bank, cre-ated Sogesol as a joint stock company to be its entrant in themicrofinance market. Sogesol planned to rely on AccionInternational for advice. Profits were to be the focus of Sogesolbusiness—not an unusual focus for a commercial bank but some-what different from the typical orientation of NGO-supportedMFIs that emphasized social benefits (Gonzalez, 2001). Anotherdeparture from NGO-run MFIs was Sogesol’s collateral require-ment. Loans would only be made to borrowers able to pledge
115
InstitutionOutstandingportfolio
No. ofactiveloans
Averageoutstandingbalance Interest rate (monthly)
ACME US$1 ,432 mil. 4283 US$334 3% flat + applicat ion fee
FHAF US$1 ,431 mil. 2951 US$484 N/A
FONDESPOIR US$1 ,126 mil. 3645 US$308 N/A
FONKOZE US$1 ,128 mil. 10000 US$113 3% + application fee
MCN US$3,152 mil 2500 US$1260 5% declining balance +application fee
Table 1. Comparison of Haitian MFIs (June 2002)
Source: Microfinanza Ltd. 2002 and Fonkoze
collateral, which could include appliances, beds, or other house-hold goods. Collateral requirements have locked the poor out ofcapital markets in the past, i.e., commercial bank loans. Borrowerswith collateral are not the poorest of the poor, making Sogesol’sclientele only slightly down market from Sogebank’s clients butunlike many of Fonkoze’s clients who lacked collateral, particularlyfirst-time borrowers. In its first year, Sogesol had 700 clients.Sogesol’s client base rapidly expanded to over 5500 clients, with aloan portfolio just under $2.2 million. While Sogesol was effec-tively a regulated MFI, the fact that it attained this status becauseit was a joint stock company owned by an already regulated com-mercial bank, Sogebank, did not offer any guidance or proceduresthat BRH could follow in reviewing Fonkoze’s application forregulated status.
Established in 1999 as a joint stock company, Micro CreditNational (MCN) is 50% owned by Haiti’s number two bank,Unibank S.A., and the remainder is held by three NGOs (IMI,2003). Loan sizes are large by MFI measures, averaging $1,000,though MCN also has low end loans and high end loans up to$20,000. Operations are in Port-au-Prince and ten other cities,with 36 loan officers. As of 2002, MCN’s loan portfolio was over$3.5 million and its clients numbered 2500.
In 1997 with assistance of loan guarantees from USAID,Banque de l’Union Haitienne, a commercial bank, established amicrofinance subsidary BUH to provide microcredit to the poor(USAID, 2003). By 1999 BUH had 14 branches, including 8 out-side of Port-au-Prince. BUH’s loan portfolio in 2002 was over $2.3million, with 3,000 active loans. Forty percent of BUH’s loans arein the Port-au-Prince market and the average loan is also at thehigher end: $1500 in Port-au-Prince and $783 elsewhere.
Association pour la Cooperacion avec la Micro (ACME) is anNGO-operated MFI founded by a Belgian professional in 1997(Microfinanza, 2002). Like Fonkoze, ACME is registered as anassociation in Port-au-Prince. Since it is not a regulated financialinstitution and is not owned by a commercial bank, it has limits onits sources of funds. It has managed to borrow from commercial
Journal of Microf inance
Volume 7 Number 2116
Microf inance Inst i tut ions in Trans i t ion
Volume 7 Number 2
banks, which insist on 100% equity to back loans to ACME. Withsuch loans composing the bulk of its funding, leverage to grow theloan portfolio is limited. Bank loans also charge interest rates of18–24%. To make up for these high rates and the high cost of doingbusiness, effective annual rates on ACME loans were 74–83% in2002 (Microfinanza, 2002). Rates consisted of a flat 3% monthlyrate plus fees. Borrowers seeking loans do not have to pledge col-lateral but they do need a fixed residence, a business that has beenin operation for six to nine months, and a loan guarantor who isnot an ACME client and who has an annual income at least triplethe loan amount requested. Nearly all loans are for six month peri-ods, averaging just over $500 in 2002. ACME puts a $2,000 capon loans. Twenty-four loan officers administer loans. Loans aremade on a commercial bank account from which borrowers with-draw money by ACME-issued check and to which borrowers makedeposits as payments. Clients perceive ACME as being friendlierthan banks and its staff as motivated and qualified. ACME pro-vides no other services, such as training in business practices orliteracy, both provided by Fonkoze. Incentives paid to loan officerssucceeded in lowering an 18.7% PAR (portfolio at risk) in 2000 tojust 4.48% in 2002. But the tilt of the incentives toward largerloans also resulted in 50% of the PAR being concentrated insmaller loans. Collecting on bad loans is a slow and tedious processdue to inefficiencies within the Haitian court system, but ACMEhas managed to collect on over 20% of the loans it writes off. In2002 ACME had a loan portfolio of $1.4 million and over 4300active loans (Microfinanza, 2002). It has also managed to attainsustainability; revenues exceeded costs in both 2001 and 2002.ACME recognizes the advantages of becoming either a cooperativeor a commercial bank but does not have plans to pursue regulatedstatus in the immediate future.
Interest rates on loans may be stated on a rate per month basisbut a hidden aspect of these loans that makes them less comparableis the principal to which the interest rate is applied. Sogesol’s 3%monthly rate appears comparable to Fonkoze’s loan rate (Table 1)but it is considerably higher. Sogesol borrowers repay principal
117
over the course of the loan installments but the interest they con-tinue to pay is on the initial amount borrowed. It is not interest onthe declining balance, typical of installment loans. Fonkoze bor-rowers pay interest only on the declining balance. For example,assuming both Sogesol and Fonkoze charge the same applicationfee and the total loan is $500 for six months at 3% per month, theeffect of Sogesol applying interest to the initial amount borrowedfor the entire six-month period and collecting equal installmentsresults in monthly payments of $98.33 versus $92.30 for Fonkoze’sloan. Sogesol’s actual monthly rate is 4.94%, which approximatesthe 5% rate charged by MCN on declining balances.
The launching of a new MFI trade organization in Haiti,DAI/FINNET, is a positive development. DAI/FINNET has begunto keep track of borrower credit information. One difficulty incompiling such information is that the poor often lack properaddresses. Note that one of ACME’s requirements is that borrow-ers have a residence with a fixed address.
Fonkoze: Planning a Commercial Transformation
Making the transformation in Haiti is more of a challenge than inmany other developing countries. Haitian capital markets arenonexistent, the legal system is in tatters, and BRH is largely with-out the means to properly supervise and regulate. In Haiti, the lackof infrastructure makes normal business decisions risky. If the judi-cial and supervisory agencies were functional, the governor of theCentral Bank would provide a list of instructions to the applicantMFI, which would guide the process through transformation.
MFIs seeking other avenues to access savings could have con-sidered becoming cooperative banks. In 2000, Caisses Populaires(CP) or savings cooperatives began expanding in Haiti. Govern-ment regulation created a boom in this banking segment with a2001 anti-money-laundering law that forced drug money fromcommercial banks into less regulated CPs (Microfinanza, 2002).Competition for deposits heated up, with promised interest rate of10–12% per month, much higher than annual rates offered by com-mercial banks. CP deposits reached $200 million. The pyramid
Journal of Microf inance
Volume 7 Number 2118
Microf inance Inst i tut ions in Trans i t ion
Volume 7 Number 2
scheme imploded when the volume of savings inflow slowed afterthe rush to move drug money into CPs. Soon interest rate pay-ments halted and CPs limited withdrawals. Rioting and even burn-ing of CPs followed. The government was forced to pay off someof the deposits but the reputation of cooperatives was tarnished.This black mark against savings cooperatives effectively eliminatedsuch a transformation alternative for Fonkoze.
With Haiti under siege internationally in 2001 and aid cut offfollowing the parliamentary elections of 2000, just when Fonkozebegan pursuing transformation, it was unlikely that Aristide couldhave undertaken an MFI transformation initiative. Transformationto become a regulated bank would have to be proposed and man-aged by Fonkoze and BRH. On May 28, 2001, Fonkoze wrote toGustave Flaubert, Haitian Minister of Finance and Economy; FritzJean, Governor of the Bank of the Republic of Haiti; and StaleyTheard, Haitian Minister of Commerce and Industry, proposing atransformation to a commercial bank. The new entity would bea stock company, with 40–49% owned by the foundation currentlymanaging Fonkoze. A minimum of 51% of the stock would beowned by Haitians. Dismissing the idea of becoming a cooperativein the letter, Fonkoze proposed a gradual process. First it wouldbecome a provisional commercial bank, with $500,000 depositedin escrow. Fonkoze would seek further funding to achieve full sta-tus as a commercial bank, with $3 million in equity.
Fonkoze reorganized itself into the Fonkoze Foundation andBank Fonkoze. There would be two distinct boards. The funds thatFonkoze USA raised for the bank were turned over to a new entity,Fonkoze LLC. Through a private offering memorandum, FonkozeLLC would in turn invest in Fonkoze SA, a holding company thatwould control the regulated Bank Fonkoze. With $2.5 million infunds raised, more than any prior Haitian bank had raised atstartup, Bank Fonkoze was well financed.
Fonkoze’s 2003 application for transformation to regulatedstatus languished in the waning months of the Aristide regime. In2004 Fonkoze management discovered that the application wasdismissed in an August 2003 BRH report which questioned the
119
capitalization of the proposed bank. The report was never deliveredto Fonkoze. The negative report revealed a basic misunderstandingof the complex structure of Fonkoze. Although Fonkoze was wellcapitalized, the main objection voiced in the report to moving for-ward with regulated status was doubt about Fonkoze’s ability tohonor its obligations in the event of financial failure.
Fonkoze’s board of directors, frustrated with the lack ofprogress, considered an alternative strategy that would providelegal access to savings deposits. MFIs in the Dominican Republicsimilarly barred from using savings deposits in their loan portfolioshad found a way to circumvent banking regulation. They accessedsavings by creating a new debt instrument to “sell” to the public.MFIs issued notes instead of deposit slips as a form of acknowl-edgement of the receipt of funds. Would-be depositors becamecreditors loaning money to the MFIs at fixed interest rates. TheMFIs could then legally use these “borrowed” funds to financetheir loan portfolios.
With the departure of Aristide and the installation of ActingPrime Minister Latortue, the possibility of moving forward withregulated status was reopened. Latortue was known to be favorablydisposed to MFIs—his daughter was an official with theConsultative Group to Assist the Poor (CGAP). In May of 2004Latortue assured Fonkoze that bureaucratic stumbling blockswould be removed. However, it soon became apparent that the newadministration and BRH had many other pressing issues toaddress, relegating Fonkoze’s application to further delay.
The board pursued the option of using a credit instrumentwith which to turn deposits into loans. A new entity, FonkozeFinancial Services (FFS), was created to supercede Fonkoze Bank asan interim step toward becoming a regulated bank. It was to handlethe new credit instruments. There would need to be training ses-sions for Fonkoze employees and new forms and procedures wouldneed to be designed. Following legal advice, Fonkoze conferredwith BRH and explained their intention of using credit instru-ments instead of deposit slips. BRH was amenable to the changebut went further with a simpler solution. Each existing depositor
Journal of Microf inance
Volume 7 Number 2120
Microf inance Inst i tut ions in Trans i t ion
Volume 7 Number 2
was simply to sign an agreement granting permission to Fonkoze tomanage their savings. The process of gaining access to depositswould not only be streamlined, it would effectively be approved byBRH.
Prior to transferring funds from Fonkoze LLC to FFS, LLCinvestors asked that a pilot project be run at two rural branchesand at a branch in Port-au-Prince. The change would be explainedto depositors and they would be asked for written approval. Ruraldepositors were unanimous in their approval, while 85% approvedin Port-au-Prince. The lower approval rating in Port-au-Prince wasmainly because some depositors were unable to consider the pro-posed change, due to time constraints. Fonkoze LLC authorizedconversion of the MFI to FFS, which would serve as a transitionalentity. The $2.5 million raised and currently in escrow in the USwould be released to Fonkoze LLC and eventually to FFS.Fonkoze would effectively obviate the urgent need to transforminto a regulated bank.
FFS was not required to adhere to banking regulations since itwould not be a regulated bank. Fonkoze’s board, however, contin-ued to focus on the need for best practices. Planning for a futuretransformation, the board mandated that the new entity act as if itwere regulated and meet BRH standards as well as internationalstandards under the Basle accords. BRH standards required 31% ofdeposits be held as reserves. The only exception to strict adherenceto BRH regulations would be that FFS would keep the 31%reserves in dollars and deposits in US banks rather than in Haitiancurrency on deposit with BRH.
Fonkoze has been reconstituted into two separate entities. Thefirst entity is a continuation of the original foundation, which willcontinue to provide educational programs for new borrowers andserve as an incubator for new branches by financing and operatingthem. A subset of the first entity will manage cooperative agricul-tural loans. Cooperative agricultural loans are a relatively newproduct in Haiti. Haitian farmers have been encouraged and givenhelp to grow crops for export, but there was no existing entity topurchase those crops and aggregate shipments. The agricultural
121
cooperatives lacked funding to carry-over the several month periodbetween buying crops from farmers and receiving payments fromoutside the country. Fonkoze entered into the business of provid-ing loans to agricultural cooperatives, initially with a loan guaran-tee program sponsored by USAID. That guarantee programexpired without any guarantees being invoked. The foundation willcontinue to provide cooperative loans. The second entity, FFS,will operate the established bank branches and manage savingsdeposits, foreign remittances, and foreign exchange. Small businessloans, which are typically longer-term, for larger amounts, and withmen being the predominant clientele, will be managed by FFS.
Fonkoze has used the Grameen model (Grameen, 2004) inorganizing its borrowers into solidarity groups of four or fiveclients. Under the Grameen model between 1996 and 2001 therewere 601 NGOs operating as MFIs in Bangladesh. The loan recov-ery rate had reached over 95% in 2001. There were over 8 millionborrowers and over 11 million active members in Bangladesh(Charitonenko & Rahman, 2002). Fonkoze clientele lack collat-eral; relying on solidarity groups for social collateral, as Grameendoes, creates incentives to make payments. Solidarity groups cen-tralize contact between credit officers and clients. The ability ofloan officers to meet with large groups of clients makes for greaterefficiency. Currently loan officers service 320 clients. Postregula-tory projections anticipate that experienced credit officers couldoversee thirteen centers consisting of a maximum of 520 clients.Fonkoze’s fully operational small branches typically include a man-ager, two credit officers, two cashiers, two security guards, and onecustodian. Managers are expected to handle up to 200 clients inaddition to other tasks.
Banco Solidario in Bolivia was an MFI that employed group-based lending exclusively prior to becoming the first MFI to makethe transition to a regulated institution. Bolivian MFI lendingquickly evolved toward individual loans, which in 2000 composed78% of loans, up from just 41% in 1997 (Rhyne, 2001). Fonkozebegan with group loans and until recently they composed 90% oflending activity, mainly to groups of entrepreneurial women.
Journal of Microf inance
Volume 7 Number 2122
Microf inance Inst i tut ions in Trans i t ion
Volume 7 Number 2
Solidarity groups went through education and literacy programstogether and borrowed together, albeit for different individualneeds. Graduates from solidarity groups were eligible for individ-ual loans. Graduates have successfully completed the second phaseof Fonkoze’s business training program and have previously repaidall their loans on time. It is likely that individual loans will makeup an increasingly greater portion of Fonkoze’s portfolio.
Becoming a regulated bank can often mean larger, more prof-itable loans and mission creep away from an emphasis on servingthe poor. Fonkoze’s strategy to avoid this is to leave the more char-itable, not-for-profit operations to the Foundation. The poor willcontinue to be served and perhaps served even better. One newFoundation-based program will provide loans to poorer womennot currently served by Fonkoze. The requirement for a savingsaccount will be postponed and dues will be paid over the course oftime. Loans will be made to solidarity groups in smaller sums andthe women will receive basic literacy and educational services.
Conclusion
The following continuum describes typical MFI progress towardtransformation:
• Adoption of a professional, businesslike approach to MFIadministration and operation.
• Progression towards operational and financial self-sufficiency.• Use of commercial sources of funds.• Operation as a for-profit formal financial institution subject
to regulation and supervision (Afwan & Charitonenko,2003).
Fonkoze has attained a professional and businesslike approach.It has been hampered from moving toward the second phase oftransition, sustainability, because of a lack of access to savingsdeposits and the need, defined by its mission, to provide social wel-fare programs. To continue to provide social welfare programs andattain profitability, Fonkoze’s board came up with a plan to divideFonkoze into two entities: the original foundation that would
123
focus on welfare programs and seek funding through donationsand a bank that would eventually attain regulated status.
Turmoil in Haiti and a lack of understanding of the complex-ity of Fonkoze’s tiered structure resulted in delay and denial of theinitial plan to become a fully regulated institution, even thoughfunding requirements were met. Fonkoze devised another plan thatwould create a transitional entity, Fonkoze Financial Services(FFS), which would circumvent the government ban against non-regulated institutions loaning savings. FFS was approved by BRH.Savings would be considered “loans” to Fonkoze by depositors andas such would then be legally available for its loan portfolio. Notonly did BRH approve of the plan, it suggested speeding up theprocess by simply obtaining approval from current depositors toallow FFS to manage their money.
FFS is a transitional vehicle which will conduct business as ifit were already a regulated institution while preparing for the finaltransformation into a commercial bank. That final transformationwill be delayed until a more stable political situation develops inHaiti. While this is not a predictable and smooth progressiontoward attaining transformation, as has been accomplished inother countries, Fonkoze has taken the first step to move throughthe transformation continuum as quickly as the political situationallows. FFS will for all intents and purposes function as if it werea regulated bank.
References
Accion International. (2000). Haiti: Finding hope in microcredit. Retrieved from
Afwan, I., & Charitonenko, S. (2003). Commercialization of microfinance: Indonesia.
Manila: Asian Development Bank.
Ambassade d ‘Haïti. (2004). Key dates in Haiti’s history. Washington DC. Retrieved
from http://www.haiti.org/keydate.htm.
Associated Press. (2000). Haiti’s top election official flees nation for U.S. New York
Times, June 19.
Basle Committee On Banking Supervision. (1988). International convergence of
capital measurement and capital standards. Basle. Retrieved in July from
http://www.bis.org/publ/bcbs04A.pdf
Journal of Microf inance
Volume 7 Number 2124
Microf inance Inst i tut ions in Trans i t ion
Volume 7 Number 2
Campion, A., Dunn, E., & Arbuckle, J. G. Jr. (2001). The transformation of Accion
Communitaria del Peru to Mibanco. Microenterprises Best Practices (MBP)
(October).
Campion, A., & White, V. (2001). NGO transformation. Microenterprises Best
Practices (June).
CGAP. (2001). Commercialization and mission drift: The transformation of microfi-
nance in Latin America (Occasional Paper). Washington, DC.
Charitonenko, S. (2003). Commercialization of microfinance: Sri Lanka. Manila: Asian
Development Bank.
Charitonenko, S., & de Silva, D. (2002). Commercialization of microfinance: Sri
Lanka. Manila: Asian Development Bank.
Charitonenko, S., & Rahman, S. (2002). Commercialization of microfinance:
Bangladesh. Manila: Asian Development Bank.
CIA. (2004). Haiti. CIA Factbook. Retrieved from http://www.cia.gov/cia/publica-
tions/factbook/geos/ha.html#Econ
Fonkoze. (2004). Retrieved from http://www.fonkoze.org/home.htm
Gonzalez, D. (2001). A Haitian bank takes its money to the streets. New York Times,
April 17.
Grameen Bank. (2004). Retrieved from http://www.grameen-info.org/
Internationale Micro Investitionen Aktiengesellschaft (IMI), Micro Credit National
S.A. (2003). Retrieved from http://www.imi-ag.com/projects/countries/
HAITI/index.html, December.
Janet Matthews Information Services. (2004). World of Information Country Report.
Quest Economics Database (March 2).
Microfinanza Ltd. (2002). Assessment of ACME, Haiti. Milan: Microfinanza Ltd.
Morduch, J. (2000).The microfinance schism. World Development, 28(4), 617–629.
Rhyne, E. (2001). Commercialization and crisis in Bolivian microfinance.
Microenterprise Best Practices. Bethesda, MD.
USAID (2003). Microcredit programs foster literacy and help thousands of microbusi-
nesses in Haiti. Retrieved from http://www.usaid.gov/our_work/global_
partnerships/gda/showcase/haiti_microcredit.pdf
U.S. Department of the Army. (1989). Haiti: monetary and exchange-rate policies.
Retrieved from http://countrystudies.us/haiti/46.htm
Wright, G., Christen, R., & Matin, I. (n.d.) ASA’s culture, competition and choice:
introducing savings services into a microcredit institution Retrieved from
http://www.ids.ac.uk/cgap/satic/2182.htm
125
Volume 7 Number 2
Microentrepreneurship andJob Creation
A Multiple-Case Study of HUDMicroenterprise Development AssistancePrograms in Upstate New York
James O. Bates
Abstract: This multiple-case study explores local government’s use of HUD-
funded microenterprise development assistance for job creation and self-
employment of low-to-moderate-income individuals. Respondent information
was reviewed and then supplemented with document analysis and interview
materials from earlier research on HUD microenterprise development assis-
tance programs in upstate New York. Because the number of local government
respondents who self-identified as providers of microenterprise development
assistance was small, it was not possible to generalize research findings to the
overall public microenterprise development sector. However, the study of this
phenomenon, although limited, does have implications for government micro-
finance instrumentalities and intermediaries and for future research on public-
sector microenterprise development efforts. Based on the participants’
self-report, it appears that both urban and rural HUD-sponsored microenterprise
development assistance programs create jobs and self-employment opportunities
for low-to-moderate-income persons using a myriad of strategies.
Since the end of World War II, the industrial economies of thenortheastern United States have undergone a fundamentalstructural change. Where automotive and manufacturing
industries were once dominant employers, today’s urban economies
Journal of Microf inance
Volume 7 Number 2128
James O. Bates is a career civil servant in the federal government and an adjunct facultymember at the State University of New York at Buffalo School of Social Work. Email:[email protected]
in the Northeast are now driven by growth in the service sector. Withthe change from a manufacturing-based economy to one that isservice oriented, many “living wage” employment opportunitieshave all but disappeared.
These changes, coupled with high unemployment and a shrinkingtax base, have compelled public-sector administrators to developlocal policies and programs that link business lending, on-the-jobtraining, education, and training programs to their communitydevelopment processes. These programs, albeit nascent, have createdmany noteworthy economic opportunities for low-to-moderate-income persons.
The Upstate New York Context
Job creation for and self-employment of low-to-moderate-incomepersons is an important policy option in New York State becauseNew York, like other states, has been experiencing an increase in thenumber of unemployed persons and working people earning lowwages. Prospects for such programs are particularly important inupstate New York, where poor economic conditions continue toexacerbate local social, economic, and political problems. New York’spoor economic conditions are evidenced in the notably high unem-ployment figures and poverty levels of non-New York City areas likewestern New York. In recent years, the weak upstate economy hasbeen a political rallying cry for national and local officials seekingpolitical office. The Center for Budget and Policy Priorities (2002)indicates that for the past two decades, the gap between high-incomeand low-income New York State families is significantly wide. Thereport, “Pulling Apart: A State-by-State Analysis of Income Trends”(Economic Policy Institute, 2002), shows that in New York State bythe late 1990s,
• The richest 20% of families had average incomes that were 12.8times as large as the poorest 20% of families.
Microentrepreneurship and Job Creat ion
Volume 7 Number 2 129
Journal of Microf inance
Volume 7 Number 2130
• The richest 20% of families had average incomes 3.1 times aslarge as the middle 20% of families.
The Economic Policy Institute’s estimate of the average in-come of families, expressed in 1990 dollars, shows that the averageincome of the bottom fifth of New York state families was$13,433 from 1978–1980, $12,871 from 1988–1990, and$12,639 from 1998–2000. The top fifth of New York state familiesearned $105,046 from 1978–1980, $134,061 from 1988–1990,and $161,868 from 1998–2000. From these figures it can beobserved that the bottom fifth of New York state families has grownrelatively poorer over time while the top fifth’s income has experi-enced nearly a 54 percent increase between 1978 and 2000 (p. 67).The increased income gap is partially due to the downsizing andoutmigration of many defense and manufacturing industries and toincreased job separations in low-wage retail and service sectors—job quits, layoffs, and firing.
Why HUD MicroenterpriseDevelopment Assistance
There are two reasons for using microenterprise development as a com-munity development policy tool: first, it is a method of optimizing theuse of indigenous resources for economic stabilization and growth;and second, it is a method of wealth generation for groups that havehistorically been economically isolated—welfare mothers, youth,unemployed persons, and immigrants. As “supply-side” economistsand planners have learned from the economic growth periods ofthe 1980s, “universal policies” fail to redistribute income toward thepoorest in our nation (Wilson, 1996). While this failure may bepartially explained by the skill mismatch between laborers andavailable jobs, it is also a function of social behaviors and practices likeracism, social exclusion, the crowding of the labor force in low-wageservice jobs, the indifference of multinational corporations to localsocial problems, and the absence of full-time work for the low-skilled.A targeted microenterprise development program may be one of thefew viable vehicles—in addition to a few innovative job training
Microentrepreneurship and Job Creat ion
Volume 7 Number 2 131
Journal of Microf inance
Volume 7 Number 2132
programs—for overcoming some of these challenges and increasingemployment opportunities for many low-income persons.
Although state and local governments must play a part indesigning and implementing a public-sector microenterprisedevelopment strategy, they are generally not able to pursue such astrategy on their own. There are several reasons for this, includingstaffing constraints, the large amount of financial resourcesrequired to overcome macroeconomic and human capital barriersfaced by the poor in the formal economy, and the inability of localgovernments to garner sustainable, broad-based political support formeans-tested programs targeted at the poor that may create fewjobs, have a potentially high failure rate, and provide limited taxbenefits. For this reason, many U.S. microenterprise developmentprograms are administered by not-for-profit organizations using avariety of funding streams (the Community Reinvestment Act;community foundation funding; Individual DevelopmentAccounts; religious, social, and economic justice funding; and gov-ernment grants). In some instances these agencies may act as themain instruments of local governments and community founda-tions, directly responsible for carrying out a multitude of publiclyauthorized community development activities.
In 1992, the Housing and Community Development Act of1974 was amended to include microenterprise development as anallowable activity under the Community Development Block Grant(CDBG) program. While this provision did not create a de factoset-aside for federally sponsored microenterprise developmentassistance, it did codify microenterprise development as an eligibleCDBG social and economic development activity. CDBG fundscould now be used for microloans, technical assistance, transportation,and child-care in support of entrepreneur training. HUD allocatesCDBG funds to each state on a formula basis to support communitydevelopment activities in support of low-to-moderate-incomehouseholds whose incomes are less than 80% of the area medianfamily income. Based on published information from theConsolidated Federal Funds Report (U.S. Bureau of the Census,2002), national CDBG obligations have exceeded $3.4 billion for
Microentrepreneurship and Job Creat ion
Volume 7 Number 2 133
the past five years. From this information, it seems that CDBG is aviable, accessible, and practical source of funding for microenterprisedevelopment programs.
Microenterprise: Toward aDefinition and Initiative
There is no general consensus about what constitutes a federallyrecognized microenterprise. The definition depends on the grantingagency and its objectives. For example, two agencies within the federalgovernment, the U.S. Agency for International Development(USAID) and the U.S. Department of Housing and UrbanDevelopment (HUD), define microenterprise differently. USAIDhas defined microenterprise as a business with a low level of assetsthat has fewer than ten employees (USAID, 2002). HUD on theother hand defines a microenterprise as any form of business thatemploys five or fewer employees, one or more of whom owns theenterprise (HUD, 2001). With the lack of consensus in mind, thisassessment will follow the HUD definition of a business thatemploys five or fewer employees, including the owner.
HUD regulations for microenterprise development programs,as codified under the 2002 Federal Code of Regulations 24CFR570.201 (o) state that municipalities can provide microentrepreneurs(HUD, 2002):
(i) credit, including, but not limited to, grants, loans,loan guarantees, and other forms of financial support,for the establishment, stabilization, and expansion ofmicroenterprises;
(ii) technical assistance, advice, and business support ser-vices to owners of microenterprises and persons devel-oping microenterprises; and
(iii) general support, including, but not limited to, peersupport programs, counseling, child care, transporta-tion, and other similar services, to owners of microen-terprises and persons developing microenterprises.
Journal of Microf inance
Volume 7 Number 2134
Thus, there are three classes of activities that are eligible forCDBG funds: (1) microenterprise establishment, (2) microenterpriseexpansion, and (3) microenterprise stabilization. Microenterpriseestablishment activities are designed to integrate disadvantagedgroups and nontraditional borrowers into the small business sector.These programs assist low-income and nontraditional borrowers toform viable businesses that will be owned and operated by entre-preneurs who otherwise have limited or no access to capital markets.
Microenterprise expansion activities attempt to increase an entre-preneur’s sales and income through extending credit or various formsof technical assistance to him or her. Technical assistance may includemarketing, bookkeeping, legal, managerial, and tax assistance. Theobjective of an expansion program is to create employment opportu-nities by affecting employers’ long-range demand for additional labor.1
Microenterprise stabilization activities attempt to improve themanagerial capacity of the entrepreneur or provide short-term creditto help increase sales and revenues. It is assumed that an increase insales or revenue will enable an entrepreneur to retain or create jobs.Local governments are compelled by HUD regulation to directmicroenterprise development assistance exclusively toward estab-lishment, expansion, or stabilization. In addition, HUD regulationsrequire that microloan borrowers create or retain jobs for low-to-moderate-income individuals.
Conventional public and quasi-public microenterprise develop-ment programs supported by CDBG focus activities on creditenhancement and lending. With regard to lending, four categories ofloans have been commonly made to microentrepreneurs: workingcapital loans, business development loans, purchase order financing,and inventory and equipment loans. Working capital loans allow anentrepreneur to pay suppliers and buy equipment. Business devel-opment loans are used for site acquisition, capital improvement,asset purchases, and working capital. Purchase order financing ismade available to businesses to make up for shortfalls in production.Inventory and equipment loans are for the purchase of fixed assets insupport of production.
Table 1: Community Mission Statement Summary for Microenterprise Development Programs
Name of funded community Mission statement summary
Cattaraugus County Offer a comprehensive support program in response to the diverse needs of the growing number of entrepreneursin Cattaraugus County.
Cayuga County Provide financial assistance to small new and existing businesses in the county, with emphasis on proposed new or retained job creation.
Columbia County Strengthen the city and county tax base through economicdevelopment and job creation, and assist businesses small and large with training and financial assistance.
Elmira Heights Educate individuals on the opportunities that exist in thevillage and allow them to utilize the available resources tomake Elmira Heights a more desirable community in which to live and work.
Greene County Provide training, technical assistance, and low-interest financing to support the start-up and expansion of microbusinesses.
Lewis County Create and retain jobs within Lewis County.
Little Falls URA plans, applies for, and administers community andeconomic development projects on behalf of the City ofLittle Falls.
Village of Mayville Provide sub–market rate low-interest financial assistance to microenterprises as well as additional business assistanceas may be required.
Niagara County Assist low-to-moderate-income entrepreneurs in startingor growing their microenterprises (defined as having 5 employees or less) by providing education, technical assistance, and access to a low-interest loan fund.
Oswego County Establish and implement sound economic developmentstrategies in order to enhance the economic vitality of Oswego County’s businesses, industries, and citizens, leading to an overall better quality of life.
Village of Saranac Lake Improve quality of life by providing state- and federal-funded economic development supported by village residents.
Wayne County Provide technical and financial assistance to start-up or expanding small businesses (5 or fewer employees) wherelow and moderate income jobs will be created or retained.
Journal of Microf inance
Volume 7 Number 2136
Lisa Servon and Timothy Bates (1998) have noted that providinga small business loan to a microentrepreneur will not by itself removethe barrier for small business creation. Entrepreneurs benefit from acombination of programs, including neighborhood planning, leader-ship training, business related training, access to capital and a highquality labor pool, and labor training programs. This is not to say thatmicrolending programs do not have their merit. Servon and Bates(1998) point out that, “when well-targeted and clearly focused, . . . it[microlending strategy] can be a critical vehicle for helping some low-income people to achieve economic self-sufficiency” (p. 437). AsServon points out, by their very nature, microlending programs act asa conduit for linking neighborhood residents and businesses to banks,business development centers, community-based organizations, andstate and local government agencies (Servon, 1996, p. 336). Thisstudy reinforces the importance of non-lending activities in microen-terprise development.
Research Questions
In the following section I lay out the research method used to reviewmicroenterprise development assistance projects in upstate New
Table 2: Microenterprise (M.E.) Development Program Characteristics
Name of funded Number of Program Value ofcommunity staff start-up date all loans
Cattaraugus County 2 1996 $1,687,579Cayuga County 0* 1993 $816,000Columbia County 1 1996 ----Elmira Heights 1 1996 ----Greene County 0* 1998 $332,998Lewis County 1 p.t. 1995 $852,000Little Falls 0* 1990 $357,829Village of Mayville 0 ---- $354,200Niagara County 4 1995 $1,340,600Oswego County 5* 1998 $195,000Village of Saranac Lake 1 1996 $189,500Wayne County 1 1994 $584,000
*Respondents report that the program is supplemented by municipal department staff.
Microentrepreneurship and Job Creat ion
Volume 7 Number 2 137
Journal of Microf inance
Volume 7 Number 2138
York. Next, I describe the missions of microenterprise developmentassistance programs. I then outline some specific program character-istics and performance indicators that address the following researchquestions:
• Who is the program serving?• How many people have been served?• How are clients performing?• Are there any recognizable patterns or themes among
upstate microenterprise development programs?
Methodology
The scope of the review included an examination of provideragency program documents and a structured survey. The survey wasfaxed to upstate New York municipal government grant recipientsunder the HUD Small Cities CDBG program. As the universe ofactive HUD-funded microenterprise development programs is noteasily identified through available information systems, municipalgovernment grant recipients were asked to self-identify themselves asoperators of a Small Cities CDBG subsidized microenterprise devel-opment program. Service providers were asked to supply informa-
Table 3: Performance of Microenterprise Development Program
Name of funded M.E. start-ups since Existing Number of Number ofcommunity program inception M.E.s served loans issued jobs created
Cattaraugus County 35 68 103 180Cayuga County 14 21 38* 120Columbia County 65 65 -0- indeterminableElmira Heights 14 --- 14 60Greene County 35 ~60 14 30Lewis County 15 15 40* 82Little Falls 10 5 15 43Village of Mayville 14 24 14 64Niagara County 70 157 64 265Oswego County 10 5 15 25Village of Saranac Lake -0- 12 12 39Wayne County 45 50 24 84
* In some instances, microentrepreneurs applied for and were issued multiple loans.
Microentrepreneurship and Job Creat ion
Volume 7 Number 2 139
Journal of Microf inance
Volume 7 Number 2140
tion about the loans issued, clients served, program accomplish-ments, and ancillary technical assistance provided to microentrepre-neurs. The survey consisted of approximately 34 open-endedquestions. It was modeled on a questionnaire used by the AspenInstitute’s 1999 Directory of U.S. Microenterprise Programs. Thisinformation was then supplemented with earlier unpublished origi-nal case-study research on this topic. The earlier research was in theform of structured interviews and documentation analysis of 15HUD microenterprise development program operators.
Research and Discussion
Twelve municipalities responded to the survey. All respondentsidentified themselves as practitioner agencies. Practitioner agenciesare defined as active agencies that provide loans, training, or techni-cal assistance directly to microentrepreneurs. Most practitioneragency microenterprise development programs were established inthe mid-1990s.
They operate with few staff people specifically dedicated tomicroenterprise development program operations. In some instances,programs are carried out by existing government community and
Table 5: Characteristics of Microenterprise Development Program Clients
Name of funded Percentage of Percentage of Percentage of Percentage ofcommunity AFDC/TANF low/mod* unemployed female
Cattaraugus County N/A 56 N/A ---Cayuga County --- 50–55 -- 23Columbia County N/A 61 1 50Elmira Heights --- 100 --- 50Greene County 10 60 10 50Lewis County --- 90 1 10Little Falls --- 13 7 13Village of Mayville 0 100 25 21Niagara County --- 58 --- 41Oswego County N/A 55 30 10Village of Saranac Lake 0 80 20 ---Wayne County 0 72 --- 39
* Low/Mod: persons whose incomes do not exceed 80% of the Median Family Income.
Microentrepreneurship and Job Creat ion
Volume 7 Number 2 141
Journal of Microf inance
Volume 7 Number 2142
economic development staff. Annual microenterprise developmentprogram operating budgets (survey question 14) ranged from$10,000 to $100,000. Program performance, as measured by reportedmajor agency achievements (survey question 32), varied among pro-grams. This may be partially explained by the fact that programdivisions and departments in respondent municipalities had differentprogram missions and operating requirements. Respondents listed thefollowing types of activities as major agency achievements:
• Program funding allowed the only grocery store serving theremote, rural community to remain open.
• The microenterprise program has filled empty stores,increased local employment, and educated individualswhile improving the overall community.
• The program has generated $1.6 million in leveragedloans.
• The program has enjoyed eight years of continuous suc-cess. Nearly 300 individuals and businesses have beenassisted. Forty-six loans have been made, for a total of over$1 million, with an acceptable charge-off rate for a high-risk portfolio.
• A county-wide program has been developed to train andsupport small business and microbusiness development inrural areas.
• There are 12 new businesses in town!!
The mission statements in Table 1 show that job creation ismerely one objective of microenterprise development. Filling vacantstorefronts, keeping essential services in communities, and intro-ducing new business opportunities into the area are also importantachievements for local governments. While the distinctions betweenreported major achievements are subtle, they represent significantlydifferent paradigmatic approaches to development—social planningand development versus economic development. This finding is rein-forced by the fact that a number of respondents consider improvingthe quality of life of residents to be their mission while others con-sider job creation and job retention to be their mission.
Microentrepreneurship and Job Creat ion
Volume 7 Number 2 143
All respondents with active microenterprise developmentprograms indicate that their programs have created or retainedjobs.2 Most respondent communities currently operate a revolvingloan fund (RLF) concomitantly with training and technical assistanceprograms. RLFs are locally administered, flexible debt instrumentsthat are capitalized by public and quasi-public entity grants and low-cost loans. RLFs provide affordable capital to microentrepreneursand nontraditional borrowers in the form of seed capital, bridgeloans, and gap financing. An entrepreneur uses a seed capital loan forbusiness start-up needs like real estate and equipment purchases. Abridge loan is a form of short-term debt that is assumed by an entre-preneur until permanent financing is put in place for such activities asthe development of new commercial properties or the renovation ofexisting properties for leasing and speculative development. The cur-rently available dollars in the RLFs of respondent communities rangefrom $25,000 to $866,000, and the total value for all loans issuedacross each RLF ranged from $189,500 to $1.6 million. The aggre-gate dollar value of loans distributed for all respondent microloanprograms since the inception of their programs is $9,815,206.
The primary forms of technical assistance are:
• Business training courses• Business planning assistance• Individual business counseling.3
One quarter of the respondents indicate that peer support andexchange, mentoring, and other forms of technical assistance are pro-vided to entrepreneurs. The majority of the respondents indicate thatthey use a collaborative process for carrying out their microenterprisedevelopment program. Only a small percentage of the respondentsindicate that their program is being carried out by a single govern-ment agency. Examples of collaboration cited by respondents are:
• We are the only agency in the county that offers trainingand technical assistance to small business; thereforebanks and other loan funds in the area refer their clientsto us. The Department of Labor even uses our classes asa requirement for their self-employment program.
Journal of Microf inance
Volume 7 Number 2144
• We work with borrowers to secure local bank funding;local planning staff assists with land use and environmentalissues, business groups, and real [sic] to help promote pro-grams.
• A 30-hour course is developed through CorningCommunity College Small Business Development Center.The Small Business Administration (SBA), local law firms,and local insurance agencies supply guest speakers.
• Some borrowers use the Small Business DevelopmentCenter (SBDC). The Urban Renewal Agency (URA)works with local banks to meet business needs.
• The village microenterprise program interacts with otherlenders to provide additional funding for qualified appli-cants to ensure access to conventional lending sources.
• Niagara County Community College coordinates class-room curriculum and provides some technical assistance.Business skills gained by program participants make theirbusinesses more bankable, and several participants haveobtained bank financing in addition to microloan fundfinancing.
• The Industrial Development Agency (IDA) provides 25%of each loan, using the HUD Microenterprise Program(MEP). IDA works for bank participation where possible.State University of New York (SUNY) Oswego SBDC con-tracted for microenterprise training.
Respondents were responsible for assisting 327 business start-upsand 482 existing businesses. As a result of this, 1,237 persons havebeen employed by microenterprises served by the program since itsbeginning. The number of loans issued by microenterprise develop-ment agencies ranges from 12 to 103, and the number of jobs cre-ated ranges from 25 to 265. Applicants were not requested toconvert positions to full-time equivalents; therefore, nothing furthercan be inferred from this description. Because these developmentsare not concentrated in a specific city within the region, it is diffi-cult to gauge the regional impact or macroeconomic implications ofthis change—despite the fact that they are noteworthy.
Microentrepreneurship and Job Creat ion
Volume 7 Number 2 145
The microloan programs’ general characteristics appear to beconvergent. Average loan amounts are in the $20,000 range. Theaverage rate is approximately 5%. Loan terms range from one toseven years. Interest rates ranged from 3% to 5%. The majority ofmicroenterprise programs reported income in the range of $30,000to $50,000. Most respondents report an 89% to 90% business suc-cess rate (survey question 22). One third indicated a success rate thatis less than 70%. Additionally, most respondents indicate that lessthan 10% of the loans are delinquent (survey question 24).
The respondent programs primarily serve low-to-moderate-income clients, including unemployed individuals. In three of therespondent communities, unemployed individuals account for nearly20% of the clients served. Most beneficiaries of microenterprisedevelopment program assistance are Caucasian. Between 95% and100% are Caucasian and 50% to 90% are male.
Conclusion
The results of this study appear to suggest that microenterprise devel-opment assistance is being used not only as a vehicle for general jobcreation but also as an employment strategy for low-to-moderate-income persons. Several microentrepreneurs were receiving some formof public assistance (unemployment benefits, TANF, etc.) prior toprogram participation.4 Most beneficiaries of HUD microenterprisedevelopment assistance in respondent communities are Caucasian,and several business start-ups were in rural areas. It seems that thereis a large need for entrepreneurship programs and community devel-opment services for microbusiness development in rural areas.Research involving framework development would be required toinvestigate this issue further. Respondent communities that viewthemselves as using microenterprise development programs toaddress quality-of-life issues implement and evaluate their programsslightly differently than municipalities that view themselves as merelyoperating a loan pool. This is evident in the way the programs arestaffed, coordinated, and self-evaluated in terms of achievements.Finally, municipalities that operate stand-alone programs cannot be
evaluated in the same manner as municipalities that offer assistance asan adjunct service in an existing institution. Scale, operating proce-dures, organizational systems, and staff capacity cannot be capturedby some of the standard measures of efficiency and program perfor-mance (average loan per staff, loan as a percentage of overall costs,etc.). Although many intangible benefits of microenterprise develop-ment have not been directly addressed through a limited survey ofprovider agencies and focused interviews such as this, it does raise thequestion “to what degree can microenterprise development be used tointegrate low-income and the under- and unemployed into our econ-omy?”5
Today, we are only able to measure that (1) HUD-assistedprograms have increased employment opportunities for low-to-moderate-income persons; and (2) these programs have producedsome achievements that are consistent with the diverse interest ofthe sponsoring local governments. In the future, more research mustbe done to understand this phenomenon and to refine the social rolethe public sector should play as these programs evolve in the future.
Responses to Select Survey QuestionsQuestion 9: For the purposes of this questionnaire, please select the response that bestdescribes your agency:
Assessment: All 12 respondents indicated that they were practitioner agencies,which are agencies that provide loans, training, and technical assistance directlyto microentrepreneurs.
Question 10: Number of microenterprise development staff:Assessment: Agencies had one or fewer microenterprise development programstaff each. In a few cases, microenterprise development activities were carried outby municipal government staff that also carried out other duties.
Question 11: Date of agency start-up:
Assessment: Two thirds of the agencies had started up operations by the mid 70s.
Question 12: Start-up date of HUD-assisted microenterprise development assistance
program:
Assessment: Three fourths of the HUD-assisted microenterprise development
assistance programs started between 1990 and 1996.
Question 14: Microenterprise development annual operating budget:
Assessment: Annual operating budgets for microenterprise development programs
vary from $10,000 to $100,000.
Question 15: Is your program still operational?
146 Volume 7 Number 2
Journal of Microf inance
Microentrepreneurship and Job Creat ion
Volume 7 Number 2 147
Assessment: All 12 respondents indicated that their programs were still operational.
Question 16: Dollar amount of loan capital fund:
Assessment: Loan Capital fund values range from $150,000 to $866,000.
Question 17: Sources of funding:
Assessment: The primary source of Loan Capital is the Community Development
Block Grant, followed by program income from Community Development Block
Grant loan repayments. The primary source of operating dollars is the Community
Development Block Grant, followed by program income from Community Devel-
opment Block Grant loan repayments.
Question 19: Target population:
Assessment: The target populations served by the program are low-to-moderate-
income individuals.
Question 20: (b) Number of business starts, (c) Number of existing businesses served
since the program start-up, and (d) Number of persons who have been employed by the
microenterprises you serve (including owners) since program start-up:
Assessment: (b) 327 business start-ups by programs, (c) 482 existing businesses
assisted by program, (d) 1,237 persons employed by microenterprises served by
the program since its beginning.
Question 22: What is the business success rate for your HUD-assisted microenterprise
program?
Assessment: Most microenterprise programs report an 89% to 90% business
success rate. One-third indicated a success rate that is less than 70%.
Question 23: What is the business failure rate for your HUD-assisted microenterprise
program?
Assessment: Most microenterprise development programs report a business failure
rate less than 15%.
Question 24: What are the loan repayment histories?
Assessment: Most respondents indicate that less than 10% of the loans are
delinquent.
Question 25: Who are the beneficiaries by race?
Assessment: Most beneficiaries by microenterprise development program are
white (between 95% and 100%).
Question 26: What are the percentages of beneficiaries by gender (% male, % female)?
Assessment: Most microenterprise program beneficiaries are male (between 50%
and 90%).
Question 27: How much income is being generated annually?
Assessment: The majority of the microenterprise programs reported income in
the range of $30,000 to $50,000. Two respondents had income in excess of
$150,000.
Question 29: What type of technical assistance do entrepreneurs receive—what type
Volume 7 Number 2
Book Review
Today’s microfinance industry is stepping beyond charitablesubsidies toward commercialization, from dependencytowards self-reliance. To speed and systemize the eradica-
tion of poverty, private capital has become more crucial formicrofinance institutions (MFIs). In their book, The Private Sectorin Development: Entrepreneurship, Regulation, and CompetitiveDisciplines, Michael U. Klein and Bita Hadjimichael encouragepractitioners and policy makers to enhance the private sector’s rolein a broad range of areas that impact development.
At times, the public has characterized private capital in povertyeradication as opportunistic, exploitative, even immoral. Klein andHadjimichael concede some abuse has occurred “by powerfulgroups” (p. 2). Yet, the recipients (the poor) feel that private firmsare important and more effective than alternatives. Klein andHadjimichael attribute this superiority to burgeoning ideas, com-petition, and best practices. Reminiscently, private sector industri-alization in the 19th century in the United Kingdom doubledaverage worker incomes in 60 years (p. 5). Likewise, in the lastdecade private sector technical and organizational progress doubled
The Private Sector in Development:Entrepreneurship, Regulation, andCompetitive Disciplinesby Michael U. Klein and Bita Hadjimichael
Richard Norton
Journal of Microf inance
Volume 7 Number 2150
average worker incomes in countries like Botswana, Chile, China,Ireland, Japan, Korea, and Thailand (p. 5).
The authors contend that the private sector’s role in the devel-opment agenda is to complement the efforts of the public sector tomeet the needs of poverty’s many dimensions. There is enoughmoney in the world today to eliminate poverty (pp. 9, 15).1 Thechallenge we face in eliminating poverty is not money but deliv-ery systems and incentives that ensure intended beneficiaries areserviced (p. 9). Combining social, political, and economic influ-ences and resources to eliminate poverty would enhance our abilityto create the infrastructure needed to reach the poorest of the poor.
The Private Sector in Development uses microfinance as anexample of facilitating access to financial markets for the poor.MFIs are highly capable and proven delivery systems of financialservices to the poor internationally. The authors note, “The effectof microfinancing is likely to be greatest when sensible, market-friendly reforms create a good business environment” (p. 84). MFIability to scale up is questioned when the authors observe,
Most people served continue to rely on subsidies, and risks ofexcessive subsidy dependence are clear. . . . The greatest chal-lenge is, thus, how to scale up the provision of microfinancingon a sustained commercially viable basis. . . . Large scalesolutions are, however, unlikely to be sustained unless largerfinancial institutions are able to downscale their operationsand serve the market for small credit and financing on a com-mercial basis—independent of continued subsidy. (pp. 84, 85)
Technology based solutions (credit cards and prepaid electroniccards to create credit history for the poor) and governmental solu-tions (improve property rights to create collateral options for thepoor) are suggested as vehicles to scale up microfinance.
Throughout the eight chapters of The Private Sector inDevelopment, Klein and Hadjimichael measure the success andfailures of a large mix of poverty-eliminating approaches. These
Richard Norton is Founder and President of Working World, Inc.
Book Review
Volume 7 Number 2 151
measures are substantiated by empirical research from the WorldBank and independent sources. The findings are well presented,with dozens of statistics, graphs, tables, and charts strategicallyplaced every few pages to enhance reader understanding.
To illustrate the need to alleviate poverty through effectivedelivery systems, market disciplines, and wise use of resources, theauthors draw conclusions from “Where Has All the EducationGone?” a research project conducted by Lant Pritchett in 1996.The study identified the correlation between education and percapita gross domestic product (GDP) growth from 1960 through1985. The research shows that educational capital growth in Asiawas about 2.7% and per capita GDP growth was about 4.1%. Incontrast, during the same time period Sub-Saharan Africa educa-tional capital growth was about 4.2% while per capita GDP growthwas only .6% (p. 7). The authors conclude that although adequateeducation is required for developmental growth, strong perfor-mance is best achieved when (1) human capital, (2) infrastructure,and (3) institutional frameworks are capable, with capabilitydefined as a function of these three components combined in mar-ket operations.
Further, “studies on the effect of foreign direct investment[FDI], the most powerful mechanism to transfer best practiceacross borders, suggest that its contribution is most significantwhen domestic capability is high” (pp. 7, 18, 19). Capability isshown to be high when competitive market approaches are prac-ticed. The private sector market approach facilitates innovation andcreates jobs and improvements in service-delivery and economicperformance—investment follows these conditions and per capitaGDP rises. Thus, education alone will not alleviate poverty.Effective market-like delivery systems must be set in place to scalethe eradication of poverty.
Throughout the book the authors emphasize job creation andthe investment climate in development models. They point outthat simply creating jobs is not enough to solve the world’s povertyepidemic—enterprises need to use best practices and jobs need tobe productive and raise standards of living. Research provides that
Journal of Microf inance
Volume 7 Number 2152
“State-owned enterprises or subsidized private firms have generallyfailed to deliver sustainable productivity growth” (p. 17). At thesame time, merely investing money into a developmental projecthas not proven to alleviate poverty. A firm’s capability and invest-ment must go hand-in-hand to ensure resources are used wiselyand improve economic performance. “The potentially biggest hopefor poverty reduction comes from mechanisms that transmit bestpractice to areas where the poor live and work. The private sectordevelopment agenda emphasizes the crucial contribution of com-petition in this regard. . . . Special assistance to fledgling entrepre-neurs through microcredit or business development services mayhelp speed up the diffusion of best practice” (pp. 127, 128). Kleinand Hadjimichael are deliberate in repeatedly reporting that com-petitive markets create the key drivers and incentives that encour-age organizations to become efficient, use best practices, innovate,invest, create productive jobs, and raise standards of living.
The discussion of competition and investment in developmentmarkets leads the authors to examine the pros and cons of financialsubsidies. At times, pro-poor intervention may require subsidies,and subsidies are in demand by both non-profit and for-profitorganizations as well as the beneficiaries of subsidies. In the case ofmicrofinance, subsidies assist institutions in reaching the extremelypoor where, historically, other organizations have been unsuccess-ful. The authors explain, however, that cost-benefit analysis shouldbe set in place when subsidies are used, as certain challenges arisewhen subsidies are granted. Although the cost of capital to organi-zations or individual beneficiaries appears to be less, donors, tax-payers, or investors absorb the true cost of capital. The authorspresent evidence that long term subsidized debt among privatefirms “results systematically in net negative economic outcomes”(p. 74). Further, other challenges like waste, inefficiency, anddiverting funds for private gain sometimes occur when subsidiesare issued. These challenges can be avoided if monitoring systems areset in place.
To remedy financial subsidy challenges, Klein and Hadjimichaelsuggest that information systems should be implemented to create
Book Review
Volume 7 Number 2 153
transparency and to assess credit opportunities. Regarding infor-mation systems the authors submit, “Informational problems makeit hard to recognize and assess credit opportunities and, thus, leadto some good deals being left on the table. If one can overcomethese information problems, the additional deals that would beconcluded can be expected to earn the full, unsubsidized cost ofcapital” (pp. 74–75). Moreover, “Transparency is further enhancedwhen subsidies are unbundled, as they would be in private com-petitive markets. Then the subsidies provided for a particular activ-ity could be calculated with some precision. In addition, resultscould be assessed” (pp. 164–165). Ultimately, The Private Sector inDevelopment argues, “Subsidies can be designed to be compatiblewith the market solution” (p. 129). Market solutions for subsidiesinclude establishing performance output goals, auctioning off theright to serve certain people of competing providers to the lowestsubsidy bidder, and allowing information to flow so donors canchoose the most deserving charities to provide subsidized funding.The authors also specify that “best practice appears highest if suchsupport measures are delivered in ways that are consistent withmarket principles and that do not create unsustainable dependenceon subsidies” (p. 128). Some approaches taken to promote devel-opment in the lives of the poor produce self-reliance while otherslead to dependence.
The authors conclude, “The role of entrepreneurs and marketsis critical for poverty reduction, because the key to rapid povertyreduction lies in transmitting advances in technology or organiza-tional improvements across the world” (p. 167). The book outlinesmethods for market mechanisms to be introduced where competi-tion will improve poverty reduction. The last chapter recognizesagain the question of whether or not the for-profit motive willundermine development work. The authors establish that evidenceproves for-profit market mechanisms are an integral part of thesolution, yet stress that in order to create sound markets, for-profitmotives need to be balanced between cooperation and competi-tion. In sum, competition and market mechanisms transmit bestpractices to create effective poverty-eliminating delivery systems.
The Private Sector in Development: Entrepreneurship, Regulation,and Competitive Disciplines holds true to its title. This work thor-oughly explores the private sector’s historical role in developmentwith hard evidence of the successes and failures of a variety ofpoverty-eliminating approaches. Klein and Hadjimichael’s sugges-tions for how the private sector can complement efforts under thedevelopment umbrella—for now and the future—are well articu-lated and provide practitioners and policy makers a platform fromwhich to discover effective ways to employ market mechanismswithin their respective areas of influence. Though the book doesnot focus primarily on the microfinance industry, the principleshighlighted make brilliant, practical contributions to support thecommercialization of microfinance.
The strongest poverty-eliminating principle in The Private Sectorin Development is clear: The private sector eradicates poverty andincreases the quality of life of the poor. The eradication of povertyis a macroeconomic challenge and necessitates the cooperation ofmany moving parts from both the public and private sectors influ-encing the social, political, and economic environment. If we areto halve poverty by 2015 (Millennium Development Goal[MDG]), the public sector should continually allow more oppor-tunities for the private sector to participate and play a larger rolein development.
Notes
1. “One perspective is provided by data from the annual Human Development
Report (HDR) published by the United Nations Development Programme (UNDP).
For some years, the report has presented estimates of the additional resources it would
take to meet all basic needs in the world. The HDR for 2000 puts the number at
US$80 billion per year (UNDP 2000). That figure translates to US$1,400 for each
of the richest 1 percent of people in today’s world.”