232


b
VOl.14, No.1, JuNe 2020 ISSN: 1993–5765
ISSue DOI:10.29270/JbS.2020.14.1(27) e-ISSN: 2521–2540
Journal of
Business
strategies
Pakistan – Mauritius
w w w . g r e e n w i c h . e d u . p k
i

ii
——————————————————————————————————————
Designed & Composed by Abdul Kalam
——————————————————————————————————————
Journal of Business strategies
ISSN: 1993-5765 (Print)ISSN: 2521-2540 (Online)
Frequency: 2 Issues per year
Research Papers by Journal of Business Strategies is licensed under a Creative Commons Attribution-NonCommercial 4.0 International License.Based on a work at http://www.greenwich.edu.pk/business-strategies/.Permissions beyond the scope of this license may be available at http://www.greenwich.edu.pk/.
Available at:
Journal of Business Strategies (JBS) is an international peer-reviewed, academicresearch journal published bi-annually by the Faculty of Management Sciences,Greenwich University Pakistan. The journal focuses on various business topicswhich cover Business Marketing, Management, Banking & Finance, Economics,Accounting, HR, Labor Laws and other inter-related subjects.
Journal of Business Strategies provides an academic platform for businessprofessionals and research scholars to contribute their original, unpublished andnovel researches in the diverse business fields stated above. Journal of Business
Strategies carries original, full-length research papers that reflect latest researchesand developments in both theoretical and practical aspects of national andinternational business studies.
iii
editorial Board
seema Mughal, t.i.
Vice-Chancellor/Patron
Prof. Dr. a.Q. Mughal, a.f., s.i.
Editor-in-Chief
Prof. Dr. Shafiq ur RehmanEditor
Dr. S. Khurram K. AlwiAssociate Editor
Dr. Mohan Devraj Assistant Editor
editorial advisory Board
Dr. Zornitsa YordanovaUniversity of National and World Economy
Sofia, Bulgaria
Dr. nirmal De silvaManagement Consultant, Nawala, Srilanka
Dr. rizwan tahirMcMaster University, Canada
Dr. f arooq MughalUniversity of Bath Claverton Down, UK
imran siddiquiBusiness Experts in Finance, USA
Dr. Baseer DurraniBusiness Administration, UK
Dr. sheheyar MalikAustralian Institute of Business
Adelaide, Australia
Prof. Dr. khalid M. iraqiVice Chancellor, University of KarachiKarachi
Dr. atif Sheffield Hallam University UK
Dr. rizwana BashirUCP
Dr. raza ali khanNED University, Karachi
Dr. Muhammad asimKarachi University of Business School, Karachi
Dr. syed ammad aliUniversity of Karachi, Karachi
Dr. nooreen MujahidUniversity of Karachi, Karachi
Dr. rummana ZaheerUniversity of Karachi, Karachi

iv
Journal of Business Strategies, Vol.14(1)
June 2020
editorial note
In this issue, the following research papers relating to, Organizationalbehavior, OCBs, CSR, BI and firm performance, Perceived Impact officedesign on performance, CPEC, and Impact of debt financing on firmperformance are presented.
teachers’ organizational Citizenship Behavior (OCBs) in Pakistan
The current research measures the organizational citizenship behaviorof university teachers in Pakistan. Further, it explored the differences inthe levels of the OCBs.
linking organizational Corporate social responsibility Practices and
organizational Citizenship Behavior in Pharmaceutical industry of
Pakistan
The present study examines how Organizational Corporate SocialResponsibilities (CSR)practice towards four different stakeholders oforganization including employees of organization, Government agencies,customers of organization and non-governmental institutions affectemployees’ organizational citizenship behavior (OCB).
Managing Change with an intervention of Psychological Contract
In this research paper the scholar explains that Organizations assesstheir feasibility to manage change by weighing its response and outcome,whereby humans seem most important. This study engaged mid-levelprofessionals with a working experience of either public or privateorganizations of Information and Communication Technologies inPakistan. It is revealed that the association of psychological contract andits fulfillment towards change management and willingness to change isquite posturing a positive impact.
Business intelligence and firm Performance:
assessing value and future directions in Pakistani firms
The purpose of study is to examine how Business Intelligence (BI)enhances the firm’s performance in Pakistani firms. Pakistan is agrowing country and BI is supposed to be in its initial stages inPakistan while the data about BI implementation and use in Pakistani

firms are also not available sufficiently, especially in statisticalpatterns. BI system quality is based on BI infrastructure, functionalityand self-service, that aids in getting a more serious competitiveadvantage and increasing firm performance by enhancing performancemeasurement capabilities.
Does Procedural justice leads towards the feelings of Compliance, and
Cooperation with, and empowerment of law enforcement agencies in
Pakistan: the Mediating role of Moral solidarity between police and
community
This paper aims to identify why or why not the police get support andcooperation from the public. Relational models of authority argue thatpeople measure the degree at which the police consider the moral valuesof groups by examining the equity of the processes they utilize practicetheir authority. Additionally, according to the approach of social identity,cooperation of the people along the dept. of police is encouraged incomponent by their decision that the police are archetypal representativeof the moral values of the groups.
examining the association of organizational Justice, Job Motivation
and organizational Citizenship Behavior
This study has examined the chain collaboration of organizationaljustice and job motivation for the management of better performance ofnurses through organizational citizenship behavior in the private hospitals,Hyderabad, Sindh.
Perceived impact of office Design on Performance of faculty:
evidence from faculty Members working with leading Higher
educations institutes of karachi
Office design is treated as one of the most important elements whichaffects employee performance and well-being. Researchers from all overthe globe are continuously striving to improve this issue throughsystematic research activities. Although in Pakistan research workassociated with this issue is not only rare but also does not havecompleteness and most of the articles are banking and telecom industries.Thus, there is potent need to analyze the impact of office design elementswith detailed perspectives of variables on larger population size. Thisstudy tries to combine variable inventory from prior studies and conductthe research on higher educational institutes which are most dominant partof higher education sector of Pakistan.
v

strategies for making CPeC inclusive for unskilled Workers
In the domain of the public-sector strategy prioritizing, very little workhas been done bearing the psychology and behavior of the unskilledworker in the country. The employment of unskilled labour is under-represented in majority of the countries that dot the globe. Notsurprisingly, documented statistical evidence of the World Bank Report2015 confirmed that the unskilled labour force in these economiesrepresented up to 50 to 65% of the informal and formal work force.
In our exploratory field study that was conducted in two SpecialEconomic Zones of Nowshera and Islamabad; we expose the economicand social flaws of the very foundations of labour markets in Pakistan.Hence, concluding that if policy-makers do not address the flaws urgently,the whole exercise of making SEZs will go in vain.
impact of Debt financing on firm Performance: a Case of Business
sector of Pakistan
It is essentially important to remove the ambiguity as to which measureof financing in a company’s capital structure proves as more favourablein improving its performance, or contrarily if there is no relevance ofcapital structure choice on the company’s value creation. For conductingthis study, a leverage ratio of Debt-to-Equity and performancemeasurements of Return-on-Assets, Return-on-Equity and Tobin’s-Q ratiohave been used as independent and dependent variables respectively tocheck for the impact of debt financing level on a firm’s performanceoutcomes.
In the next issue the burning theme is suggested “Economic andBusiness growth and Employment to All”.
Sincerely,
Prof. Dr. Shafiq ur RehmanEditor
Journal of Business Strategies
vi

Journal of Business Strategies, Vol.14(1)
June 2020
table of Contents
Page no.
teachers’ organizational Citizenship Behaviour in
Pakistan: an inter-university Comparison 01–16
Nauman A. Abdullah
linking organizational Corporate social responsibility
Practices and organizational Citizenship Behavior
in Pharmaceutical industry of Pakistan 17–36
Mohsin Yasin Khan, Waqar Akbar, and Madiha Shaikh
Managing Change with an intervention of
Psychological Contract 37–62
Shoaib Hyder, Sumaiya Syed, and Salman Bashir Memon
Business intelligence and firm Performance: assessing
Value and future Directions in Pakistani firms 63–98
Sumayya Arshad and Dr. Danish Ahmed Siddiqui
examining the association of organizational Justice,
Job Motivation and organizational Citizenship Behavior 99–122
Dr. Sadia Anwar, Homan Memon, and Dr. Noor Muhammad Jamali
Perceived impact of office Design on Performance of faculty:
evidence from faculty Members Working with leading
Higher educations institutes of karachi 123–144
Faisal Sultan
strategies for Making CPeC inclusive for unskilled Workers 145–162
Saira Ahmed, Sajid Bashir, and Vaqar Ahmed
vii

Does Procedural Justice leads towards the feelings of
Compliance, and Cooperation with, and empowerment of
law enforcement agencies in Pakistan: the Mediating
role of Moral solidarity between Police and Community 163–190
Sufian Fazal Khan and Dr. Danish Ahmed Siddiqui
impact of Debt financing on firm Performance:
a Case of Business sector of Pakistan 191–214
Aisha Yusuf and Dr. Abur Rehman Aleemi
About the Journal – Guidelines to the Authors 215–219
viii

teaCHers’ organiZational CitiZensHiP
BeHaViour in Pakistan: an inter-
uniVersitY CoMParison
nauman a. abdullah*
aBstraCt
The current research was conducted to measure the
organizational citizenship behaviours of university
teachers in Pakistan. Further, it explored the differences
in the levels of the OCBs of public sector and private
sector university teachers. Using quantitative approach
a descriptive survey research method was employed.
Through multistage stratified random sampling
technique, the data were collected. An adapted close-
ended questionnaire measured at a 5 point Likert scale
was administered. Validity and reliability were ensured
through expert opinions and a pilot study before the
actual data collection. After data cleaning, statistical
analyses were applied on 298 questionnaires in the
spreadsheet of SPSS version 22.0. Results revealed
significant differences in the levels of OCBs of different
university teachers. Further differences on analyzing
the demographic variables were observed. Practical
implications of the findings can be helpful for the
practitioners, policymakers, and university
administration.
Keywords: Organizational Citizenship Behaviours, University Teachers, Pakistan.
introDuCtion
Organizational Citizenship Behavior (OCB) has recently become aninteresting variable for research in the disciplines of educationaladministration and educational psychology.With roots in theorganizational behavior, this variable is of key value to the field ofeducation.
Tracing the history of OCB, Katz (1964) reported that to workefficiently and effectively there should be volunteer devotion to theinstitution. Bateman and Organ (1983) succeeded Katz’s point and coined
Journal of Business Strategies, Vol.14, No.1, 2020, pp 01–16 DOi:10.29270/JBS.14.1(20).01
1
__________________________________________________________________________________•Lecturer, Education, Virtual University of Pakistan, Lahore.
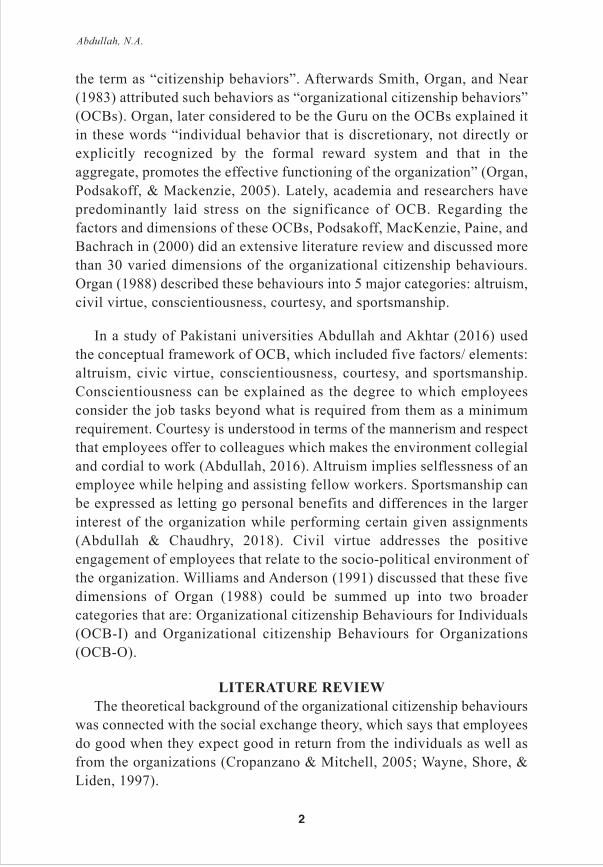
the term as “citizenship behaviors”. Afterwards Smith, Organ, and Near(1983) attributed such behaviors as “organizational citizenship behaviors”(OCBs). Organ, later considered to be the Guru on the OCBs explained itin these words “individual behavior that is discretionary, not directly orexplicitly recognized by the formal reward system and that in theaggregate, promotes the effective functioning of the organization” (Organ,Podsakoff, & Mackenzie, 2005). Lately, academia and researchers havepredominantly laid stress on the significance of OCB. Regarding thefactors and dimensions of these OCBs, Podsakoff, MacKenzie, Paine, andBachrach in (2000) did an extensive literature review and discussed morethan 30 varied dimensions of the organizational citizenship behaviours.Organ (1988) described these behaviours into 5 major categories: altruism,civil virtue, conscientiousness, courtesy, and sportsmanship.
In a study of Pakistani universities Abdullah and Akhtar (2016) usedthe conceptual framework of OCB, which included five factors/ elements:altruism, civic virtue, conscientiousness, courtesy, and sportsmanship.Conscientiousness can be explained as the degree to which employeesconsider the job tasks beyond what is required from them as a minimumrequirement. Courtesy is understood in terms of the mannerism and respectthat employees offer to colleagues which makes the environment collegialand cordial to work (Abdullah, 2016). Altruism implies selflessness of anemployee while helping and assisting fellow workers. Sportsmanship canbe expressed as letting go personal benefits and differences in the largerinterest of the organization while performing certain given assignments(Abdullah & Chaudhry, 2018). Civil virtue addresses the positiveengagement of employees that relate to the socio-political environment ofthe organization. Williams and Anderson (1991) discussed that these fivedimensions of Organ (1988) could be summed up into two broadercategories that are: Organizational citizenship Behaviours for Individuals(OCB-I) and Organizational citizenship Behaviours for Organizations(OCB-O).
literature reVieW
The theoretical background of the organizational citizenship behaviourswas connected with the social exchange theory, which says that employeesdo good when they expect good in return from the individuals as well asfrom the organizations (Cropanzano & Mitchell, 2005; Wayne, Shore, &Liden, 1997).
Abdullah, N.A.
2

Organizational Citizenship Behaviour (OCB) promotes organizationaleffectiveness (Yen & Neihoff, 2004) and it produces better results for theorganizations (Dick, Grojean, Christ, & Wieseke, 2006; Joireman, Daniels,George-Falvy, & Kamdar, 2006). Lower performances and higher turnoverrates are observed where OCBs lack (Lamude, 1994; Motowidlo, 2003).The antecedents and predictions of the construct of Organizationalcitizenship behaviours reflected that this variable is of pivotal significancein order to maintain the overall feel-good atmosphere in the institution aswell as for the wellbeing of the employees.
Maximum research studies have been conducted on OCB in the West,with USA, Australian, and European samples (Farh, Zhong, & Organ,2004). Research in other contexts, especially in Pakistan, is limited innumber. Naqib, Hanson, Bangert, Kannan, Sharma, and Ghaffar (2019)used the same five factors measured the levels of OCB in secondaryschools in Pakistan. They found out that OCB increases productivity ofteachers and school leaders. Ali and Siddiqui (2019) OCB in the corporatesector of Pakistan and found out that it has strong basis fromtransformational leadership. Khan, Yasir, Yusof, Bhatti, and Umar, (2017)studied OCBs in the academic staff of a public sector university inPakistan. Their study revealed that OCBs were present in a moderate levelin the 191 sampled faculty members. They also found its correlation withthe ethical leadership practices in that sampled university. These studiessignifies the role OCB in the institutions and their association withdifferent leadership roles and styles.
Besides these, there are other studies that have been conducted in therecent past in Pakistan that include OCBs. For example, Zhijie, Asghar,Gull, Shi, and Akbar (2019) studied the OCBs with other factors of jobstress and organizational politics in five universities of Faisalabad. Naeem,Malik, and Bano (2014) examined OCBs in pharmaceutical industry inPakistan. Rehman, Mansoor, Rafiq, and Rashid (2011) explored OCBswith leadership and training and development factors in corporate sectorof Pakistan. Ghaus, Lodhi, and Shakir, (2018) investigated OCBs alongwith Leader member exchange in seven public and seven private sectoruniversities in Pakistan. Khawaja (2017) studied OCBs with multiple othervariables in the health sector of a Pakistani province. This shows thatOCBs are studied with multiple other variables in different sectors,globally and in Pakistan, but entire focus on studying OCBs in educationsector is slightly missing.
Teachers’ Organizational Citizenship Behaviour in Pakistan
3

Hence, this research was carried out to explore the OCBs of teachersof the university sector in Pakistan. This study further explored thecomparison at inter-university level. This study is significant in reportingthe descriptive picture of the organizational citizenship behaviours in theuniversity sector of Pakistan. It is of importance to the teachers,administration, practitioners, and policy makers. It might also pave theway for new research in similar domains. The comparison of inter-university level has reflected upon the practices in both sectors. For thebetterment of the practices and training sessions, the findings of thisresearch may add substantially to the already available literature.
objectives of the study
Based on the review of the related literature and scope of the studyfollowing objectives were made:
1. Explore the levels of OCBs in university teachers of Punjab.
2. Find differences in the levels of OCBs at inter-university level interms of the sub-scales taken as altruism, conscientiousness,sportsmanship, civil virtue, and courtesy.
3. See the difference in the levels of OCBs at inter-university level inPunjab based on different demographic variables?
Aligned with the research objectives, the researchers made this studyfollowing research questions. (1) Do at inter-university level teachersdisplay a significant level of OCBs? (2) To what extent level of OCBsdiffer significantly in teachers of different universities of Punjab in termsof the sub scales taken as altruism, conscientiousness, sportsmanship, civilvirtue, and courtesy?(3) Do demographic variables provide any basis fora significant difference in the levels of OCBs displayed by teachers atdifferent universities of Punjab?
Methodology
For this study, descriptive survey method was employed. The data werecollected through a cross-sectional research design which aligned with thedescriptive survey method. The data were taken by the subjects at onepoint in time through a close-ended questionnaire.
sampling Design
Population of the study comprised of the universities that arerecognized by the Higher Education Commission (HEC) of Pakistan. The
Abdullah, N.A.
4

public and private sector universities of Punjab province of Pakistan werethe target population. Multistage stratified random sampling techniquewas employed. In the first stage, 1/3 (33%) of the universities wereselected randomly. Second stage sampling was done by randomly selecting1/3 (33%) faculties of the total faculties of those universities. Lastly, 1/3(33%) of the total teachers available in those faculties were randomlyselected by the researchers. A total of 410 university teachers was selectedas the sample in this research.
instrumentation
Organizational citizenship behavior scale (OCB-S) a five dimensionalinstrument for OCB was utilized in this study. Abdullah and Chaudhry(2018) also used the same tool and reported the reliability to be 0.83measured at Coefficient of Crobnbach Alpha and for each factor of OCBthe reliability was reported above 0.70. Abdullah and Akhtar (2016)adapted the tool for educational perspective and modified a few items tofit educational institutional context. They reported the factor wisereliability to be above 0.70 for each factor of the OCB-S. Hence this studyadopted the same tool used in that research.
Procedure
Data were taken personally through OCB-S on a close-ended Likerttype scale. The tool was assigned values of 5 to 1 for 5 representingstrongly agree and 1 represented strongly disagree. Ethical standardswere followed while data collection. Permission was sought throughletter duly signed by the concerned authorities of each university. Forpiloting purpose 30 questionnaires were got filled from teachers otherthan the actual sample of the study. The results of the pilotedquestionnaires were minutely observed to incorporate changes ifrequired. Finally, the data collection was made. Negative items werereversely coded and entered into the SPSS spreadsheet. In total, 312questionnaires were filled and received back with a response rate of76%. After data cleaning, 297 questionnaires were used for furtheranalysis and interpretations.By factor the reported reliability was 0.73for Altruism, 0.77 for Conscientiousness, 0.67 for Courtesy, 0.69 forCivil Virtue, and 0.68 for Sportsmanship.
results
The results of demographic variables of this empirical study in Punjabrevealed that out of 297 total subjects 159 respondents were males and
Teachers’ Organizational Citizenship Behaviour in Pakistan
5

138 respondents were females that conforms to the notion of the study of(Abdullah & Akhtar, 2016) about the incremental rise in the females inteaching profession at university level. Out of 297 respondents, almost85% (252) respondents were enjoying permanent job, it showed that in thePublic sector university teachers are hired as permanent faculty memberswhile only 15% (45) respondents were on a contract which was becauseof the hiring trend in private universities. The majority of the universityteachers in the sample of this study were Lecturers, which constitute58.6% (174) of the total sample. Assistant professors were 86 in numbermaking 29% of the sample, associate professors were 24 in number,whereas full professors were only 13 in this sample. This shows that upin the cadre, universities in Punjab have relatively lesser ratios of theteachers. In age, the category of 25-35 years showed high in number, 152respondents belonged to the said category which was encouraging asyoung persons were over whelmingly present in the teaching profession.MS/ M. Phil category illustrated 119 respondents, while 68 respondentswere Doctoral degree holders, 24 respondents were with Post docqualification. It showed the dominance of higher education degrees inuniversity teachers.
There were 203 teachers in the category of having experience from01-10 years, which is obvious because the majority of the respondentswere lecturers, 74 teachers were having experience ranging from 11 yearsto 20 years while 20 teachers were having an experience of above 20years. Married teachers were 189 and unmarried were 108 in number.Different universities of Punjab had various faculties. Differentdepartments were under different faculties in the universities; theresearcher took the common departments functional under variousuniversities and made eight (8) most common faculties in the selecteduniversities. In this sample, 87 teachers were belonging to the faculty ofArts & Humanities/ Behavioural & Social Science faculty. Managementsciences faculty had representation of 72 teachers, 41 teachers werebelonging to the pure sciences faculty, Computer and IT faculty had 23teachers, commerce faculty had 40 teachers, law faculty had 5, Lifesciences faculty showed 8, and Oriental learning/ language faculty had21 teachers representing them in this sample. From public sectoruniversities 196 made up the sample while 101 teachers were belongingfrom private sector universities of the Punjab, which reflected that privateuniversities had relatively less faculty members.
Abdullah, N.A.
6

The organizational citizenship behavior in university teachers of Punjabwas measured in terms of sub-scales like altruism, conscientiousness,courtesy, sportsmanship, and civil virtue. Item was mean scores andstandard deviations were calculated. The item wise mean scores werestatistically significant and were above three (3) which was taken as a cut-off score (Abdullah, 2019) for all positive items. The mean scores fornegative items were significantly below 3 which also meant that thesubjects of the study showed organizational citizenship behaviours in theuniversities.
On analyzing factor wise mean score in table 1, it was revealed thatuniversity teachers rated the conscientiousness factor of organizationalcitizenship behavior at the top (M= 4.21, SD= 0.57), followed by thecourtesy factor (M= 4.17, SD= 0.58), civil virtue (M= 4.16, SD= 0.69),altruism (M= 3.70, SD= 0.67) and sportsmanship factor at the last (M=2.42, SD= 0.66). All the negative items and having a mean score belowthe cut point of 3 reveals that the respondents did not rate those items high.
Table 1: By- factor mean score of OCB
When independent sample t-test was applied to the OCB in terms ofthe university type (public or private) in table 2, significant meandifference was revealed at p < 0.05. The effect size of the difference wasless i.e. 0.13. The mean score of public sector university teachers (M=73.17, SD= 6.34) was significantly more than that of private sector (M=71.22, SD= 8.20). It meant that the former were showing extraorganizational citizenship behavior.
Table 2: t-test on overall OCB with regard to university type
SR # OCB Factors M SD
01 Altruism 3.70 0.67
02 Conscientiousness 4.21 0.57
03 Sportsmanship 2.42 0.66
04 Courtesy 4.17 0.58
05 Civil Virtue 4.16 0.69
University type M SD df t p Effect size
Public 73.17 6.34 295 2.25 0.02 0.13
Private 71.22 8.20
Teachers’ Organizational Citizenship Behaviour in Pakistan
7

On further exploring the factor wise difference in the universityteachers of public sector and private sector in table 3. Independent samplet-test was applied on the altruism which revealed a significant meandifference at p < 0.01. The mean score of public sector university teachers(M= 18.8, SD= 3.24) on the factor altruism was significantly more thanthe mean score of private sector university teachers (M= 17.77, SD= 3.42).It means that the public sector university teachers show more altruism attheir workplaces than private sector university teachers.
Table 3: t-test on altruism sub scale of OCB with regard to university type
Table 4 displays Independent sample t-test on courtesy factor in terms ofthe university type (public and private). It revealed significant meandifferences at p< 0.05. The mean score of public sector university teachers(M= 12.70, SD= 1.71) was significantly more mean score than that of theprivate sector university teachers (M= 12.18, SD= 1.78). It means that publicsector university teachers showed more courtesy than the private counterparts.
Table 4: t-test on courtesy sub scale of OCB with regard to university type
Table 5 depicts independent sample t-test on the sportsmanship factorin terms of the gender of teachers. The results revealed significant meandifferences at p< 0.01. The mean score of male university teachers (M=12.58, SD= 3.45) was significantly more than the mean score of femaleuniversity teachers (M= 11.58, SD= 3.06) which meant that male teachersof universities show more sportsmanship than their female counterparts.
Table 5: t-test on the sportsmanship of university teachers on the basis ofgender
P < 0.01
University type M SD df t p Effect size
Public 18.88 3.24 295 2.72 0.007 0.16
Private 17.77 3.42
University type M SD df t p Effect size
Public 12.70 1.71 295 2.37 0.018 0.14
Private 12.18 1.78
Gender M SD df t p Effect size
Male 12.58 3.45 295 2.62 0.009 0.15
Female 11.58 3.06
Abdullah, N.A.
8

Table 6 displays independent sample t-test was applied on the courtesyfactor on the basis of job type (permanent or contract) significant meandifferences were revealed at p< 0.05. The mean score of permanentuniversity teachers (M= 12.61, SD= 1.72) was significantly more than thatof the contractual university teachers (M= 12.01, SD= 1.88). It meant thatteachers who were permanent showed more courteous behaviours at theworkplace than the teachers who were on contract basis.
Table 6: Independent sample t-test on the courtesy of university teacherson the basis of job type
On the basis of marital status of the university teachers the independentsample t-test was applied on civil virtue behaviours in table 7. Marriedteachers showed significantly more mean score (M = 8.46, SD= 1.37) ascompared to the mean score of teachers who are singles (M= 8.03, SD=1.41). The t-value was 2.53 significant at p < 0.05. It means that marriedteachers show more civil virtue behaviours than single teachers.
Table 7: Independent sample t-test on the civil virtue of university teacherson the basis of marital status
Table 8: One-way ANOVA on the OCB of university teachers on the basis
of universities
Table 8 illustrates that One-way ANOVA was applied on the OCBs ofuniversity teachers on the basis of different universities selected in thesample. It revealed significant differences at p value less than 0.05. Forfurther clarity Post HOC test of Tukey was applied.
Job type M SD df t p Effect size
Permanent 12.61 1.72 295 2.11 0.03 0.16
Contract 12.01 1.88
Marital status M SD df t p Effect size
Married 8.46 1.37 295 2.53 0.012 0.15
Single 8.03 1.41
Sum of Squares df Mean square f p Effect size
Between groups 1291.94 10 129.19 2.74 0.003 0.088
Within groups 13445.74 285 47.18
Total 14737.68 295
Teachers’ Organizational Citizenship Behaviour in Pakistan
9

Table 9: Post HOC test (Tukey)
Post hoc test of Tukey was further applied to explore the differences inthe universities in table 9. It revealed that the LCWU and GCUF wereshowing more mean score than the UCP. It is because the LCWU andGCUF are public sector universities and UCP is a private sector university.So it verifies the results of this study that public sector university teachersexpressed more OCBs as compared to the teachers of private sectoruniversities.
DisCussion
The present study was carried out to study in detail the organizationalcitizenship behaviours of university teachers of Punjab. This relativelylesser studied variable in educational settings in Pakistan is reported tohave multi-faceted significance in the educational institutions. For that,following research questions were followed in this research. Research
question1. Do at inter-university level teachers display a significant levelof OCBs? To answer this question, descriptive statistical techniques wereapplied. Through Mean scores and Standard Deviations the levels of OCBswere studied and the level was reported to be above the cut score, whichwas taken as 3, for all the positive items of the questionnaire. For thenegative items the OCB levels of the university teachers were well belowthe cut score 3, which means that university teachers showed significantlevels of OCBs in their respective universities. The results of this studyare aligned with (Ali & Sidique, 2019; Khan, et al. 2017). This finding isimportant to note here, as OCB is a relatively newer studied variable inuniversities, teachers reporting to be significantly showing OCBs in theuniversities is encouraging for the university administrators and furtheroutputs related with OCBs shall be studied in the future. Hence thisresearch question is achieved here.
Research question 2.To what extent level of OCBs differ significantlyin teachers of different universities of Punjab in terms of the sub scalestaken as altruism, conscientiousness, sportsmanship, civil virtue, andcourtesy? The most reported factor of the organizational citizenshipbehavior was conscientiousness, next was the factor courtesy, then came
University University Mean difference P
UCP LCWU -7.95 0.006
GCUF -7.47 0.017
Abdullah, N.A.
10

the factor civil virtue, followed by the factor altruism, the least significantfactor was sportsmanship. The findings are of significance for theadministrators and practitioners as this research illustrates that, universityteachers were showing more conscientiousness. However, these findingsare restricted to the sample and might not be generalizable to othersamples across Pakistan. As context and culture plays a defining role inthe behaviours therefore, results from other provinces might showsignificant disparities. There is also a limitation of the study that it doesnot probe the reasons behind this array of factors. A research determiningthe contributors toward these OCB factors is recommended by the author.
Research question 3.Do demographic variables provide any basis for asignificant difference in the levels of OCBs displayed by teachers atdifferent universities of Punjab?The results indicated that public sectoruniversity teachers were significantly more positive on displayingorganizational citizenship behaviours in the workplaces as compared tothe private sector university teachers. The factors such as altruism andcourtesy were high for the public sector university teachers. The resultsare congruent with the findings of Ghaus, Lodhi, and Shakir (2018), whichalso indicate the high levels of OCB in public sector. Another interestingfinding of the present study was that male teachers reported to be showingmore citizenship behaviours in terms of sportsmanship than the femaleteachers. The teachers who were permanent in the jobs were displayingmore citizenship behaviours in comparison to the teachers who were oncontract. Married teachers reported to be high on the civil virtuebehaviours in comparison to the female teachers. These findings are worthnoting for the university administration in similar settings as thesebehaviours were influenced by the demographic variables. These findingsdo have practical implications for the policy makers, as these results canbe utilized in training workshops and recruitment procedures.
ConClusions anD reCoMMenDations
The conclusions that have been drawn from this empirical evidenceinclude the positive sign of existence of the organizational citizenshipbehaviours in the university sector teachers in Pakistan. Much attentionand resources are given to bring positivity in the educational institutionsof Pakistan, these results would be helpful in portraying the groundrealities of university teachers in Pakistan. A comparison of public andprivate sector university teachers concluded that public sector andpermanent jobs bring positive behaviours in the teachers; hence they show
Teachers’ Organizational Citizenship Behaviour in Pakistan
11

more citizenship behaviours at their workplaces. The recommendationsfor policy makers and university administration were to consider thedemographic variables for promotion, duty allocation, and delegation ofauthority. The training sessions shall be conducted considering thesedemographic variables and further research are recommended to establishcausal relations for the organizational citizenship behaviours in theuniversity sector. This study serves as a contribution in the literature ofexisting OCBs of teachers it has implications for further research in termsof exploring correlations of OCBs with different organizational variablesespecially leadership styles of school leaders. The role of OCB inemployees’ performance and overall institutional performance also needsto be investigated.
Abdullah, N.A.
12

referenCes
Abdullah, N. A. (2019). Teachers’ satisfaction of principal’s perceivedleadership at elementary level. Journal of Social Science and
interdisciplinary Research, 8(1), 21-28.
Abdullah, N. A., & Chaudhry, A. Q. (2018). Organizational commitmentand organizational citizenship behavior of business employeesin telecommunication and automobile sector. Pakistan Vision,
19(2), 289-300. http://pu.edu.pk/images/journal/studies/PDF-FILES/Article_19_v19_2_18.pdf.
Abdullah, N. A. (2016). Organizational citizenship behavior in educationalsettings in Pakistan. Business Review, 11(2), 77-84.Online available at:http://businessreview.iba.edu.pk/articles/OrganizationalCitizenshipBehavior.pdf.
Abdullah, N. A., & Akhtar, M. M. S. (2016). Job satisfaction throughorganizational citizenship behavior: A case of university teachers atLahore. Alberta Journal of Educational Research, 62(2), 134-149.
Ali, Z., & Siddiqui, D. A. (2019). Transformational Leadership and OCB:Evidence from Pakistan. SSRN Electronic Journal. 1-29.http://dx.doi.org/10.2139/ssrn.3510650.
Bateman, T. S., & Organ, D. W. (1983). Job satisfaction and the goodsoldier: The relationship between affect and employee“citizenship”. Academy of Management Journal, 26, 587-595.
Cropanzano, R., & Mitchell, M. S. (2005), Social exchange theory: Aninterdisciplinary review. Journal of Management, 31(6), 874-900. http://dx.doi.org/10.1177/0149206305279602.
Dick, R. V., Grojean, M. W., Christ, O. & Wieseke, J. (2006). Identity andthe extra mile: Relationships between organizationalidentification and organizational citizenship behavior. British
Journal of Management, 17(4), 283-301. http://dx.doi.org/ 10.1-111/j.1467-8551.2006.00520.x
Farh, J. L., Zhong, C. B., & Organ, D. W. (2004). Organizational citizenshipbehavior in the People’s Republic of China. Organization Science,
15(2), pp. 241-253. http://dx.doi.-org/10.1287/orsc.1030.0051.
Teachers’ Organizational Citizenship Behaviour in Pakistan
13

Ghaus, B., Lodhi, I., & Shakir, M. (2018). Much of a Muchness? The Roleof Gender Similarity in a Relationship between LMX and OCB.Global Social Sciences Review, 3(4), 284-308.
Joireman, J., Daniels, D., George-Falvy, J. & Kamdar, D. (2006).Organizational citizenship behaviors as function of empathyconsideration of future consequences, and employee timehorizon: An initial exploration using an in basket simulation ofOCBs. Journal of Applied Social Psychology, 36(9), 2266-2292.http://dx.doi.org/10.1111/j.00219029.2-006.00103.x
Katz, D. (1964). The motivational basis of organizational behavior.Behavioural Science, 9, 131-133.
Khan, H., Yasir, M., Yusof, H. M., Bhatti, M. N., & Umar, A. (2017). Therelationship between ethical leadership and organizationalcitizenship behavior: evidence from Pakistan. City University
Research Journal, SE, 45-62.
Khawaja, S. F. (2017). Impact of spiritual intelligence on employee taskperformance and cob; mediating role of self-efficacy, moderatingrole of collectivist culture of Pakistan. Jinnah Business Review,
5(1), 34-45.
Lamude, K. G. (1994). Supervisors’ influence tactics for handlingmanagers’ resistance. Psychological Reports, 75(1), 371-374.http://dx.doi.org/10.2466/pr0.1994.75.1.371.
Mohammad, J., Habib. F. Q., & Alias. M. A., (2011). Job satisfaction andOrganizational Citizenship Behaviour: An empirical Study athigher Learning Institutions. Asian Academy of Management
Journal, 16(2), 149-165.
Motowidlo, S. J. (1984). Does job satisfaction lead to consideration andpersonal sensitivity? Academy of Management Journal, 27,910-915.
Motowidlo, S.J. (2000). Some basic issue related to contextualperformance and organizational citizenship behavior in humanresource management. Human Resource Management Review,
10(1).115-126.
Abdullah, N.A.
14

Motowidlo, S. J. (2003), Job Performance. In W. C. Borman, D. R. Ilgenand R. J. Klimoski (eds.), Handbook of Psychology: Industrialand Organizational Psychology, 12, 39-53. John Wiley: Hoboken,New Jersey.
Naeem, B., Malik, M. E., & Bano, N. (2014). Nurturing organizationalcitizenship behaviours by optimism subculture empirical evidencefrom Pakistan. Pakistan Economic and Social Review, 52(2), 175-186.
Naqib, M., Hanson, J., Bangert, A., Kannan, S., Sharma, S. & Ghaffar, A.(2019). Measuring Organizational Citizenship Behaviors (OCB)in Secondary Schools in Pakistan and a Comparison with Factorsof a School Growth Mindset Culture. international Journal of
Learning and Development, 9(2), 83-115.
Organ, D. W. (1988). Organizational citizenship behavior: The good
soldier syndrome. Lexington, MA: Lexington Books.
Organ, D. W. (1997). Organizational citizenship behavior: It’s constructclean-up time. Human Performance, 10(2), 85-97.
Organ, D. W., Podsakoff, P. M., Mackenzie, S. B. (2005). Organizational
citizenship behavior: its nature, antecedents and consequences.
Thousand Oaks, CA: Sage.
Podsakoff, P. M., MacKenzie, S. B., Paine, J. B., Bachrach, D. G. (2000).Organizational citizenship behaviors: A critical review of thetheoretical and empirical literature and suggestions for futureresearch. Journal of Management, 26(3), 513-563.
Podsakoff, N. P., Whiting, S. W., Podsakoff, P. M.& Blume, B. D. (2009).Individual- and organizational-level consequences of organizationalcitizenship behaviors: A meta-analysis. Journal of Applied
Psychology, 94(1), 122-128. http://dx.doi.org/10.1037-/a0013079.
Podsakoff, P. M. & MacKenzie, S. B. (1997). Impact of organizationalcitizenship behavior on organizational performance: A reviewand suggestion for future research. Human Performance, 10(2),133-151. http://dx.doi.org/10.1207/s15327043hup1002_5.
Podsakoff, P. M., MacKenzie, S. B., Paine, J. B., & Bachrach, D. G.
Teachers’ Organizational Citizenship Behaviour in Pakistan
15

(2000). Organizational citizenship behaviours: A critical reviewof the theoretical and empirical literature and suggestions forfuture research. Journal of Management, 26(3), 513-563.
Rehman, O., Mansoor, A., Rafiq, M. & Rashid, M. (2011). Training andDevelopment, Leadership Style and Empowerment Practices asDeterminants of Organization Citizenship Behavior in CorporateSector of Developing Country Pakistan. Far East Journal of
Psychology and Business, 4(2), 16-26.
Schnake, M. (1991). Organizational citizenship: a review, proposed model,and research agenda. Human Relations, 44(7), 735–759.
Smith, C. A., Organ, D. W., & Near, J. P. (1983). Organizationalcitizenship behavior: Its nature and antecedents. Journal of
Applied Psychology, 68, 655-663.
Wayne, S. J., Shore, L. M. & Liden, R. C. (1997). Perceived organizationalsupport and leader member exchange: A social exchangeperspective. Academy of Management Journal, 40(1), 82-111.http://dx.doi.org/10.2307/257021.
Williams, L. J., Anderson, S. E. (1991). Job satisfaction and organizationalcommitment as predictors of organizational citizenship and in-role behaviors. Journal of Management, 17(3), 601-617.
Yen, H. R. & Niehoff, B. P. (2004), Organizational citizenship behaviorsand organizational effectiveness: Examining relationships inTaiwanese banks. Journal of Applied Social Psychology, 34(8),1617-1637.http://dx.doi.org/10.1111/j.15591816.2004.tb02790.x
Zhijie, S., Asghar, M., Gull, N., Shi, R., Akbar, M. (2019). Perceivedorganizational politics impact on organizational citizenshipbehavior: Job stress in the teachers. Bio Cell, 43(6), 78-91.
Abdullah, N.A.
16

linking organiZational CorPorate
soCial resPonsiBilitY PraCtiCes anD
organiZational CitiZensHiP BeHaVior in
PHarMaCeutiCal inDustrY of Pakistan
Mohsin Yasin khan*, Waqar akbar**, and Madiha shaikh***
aBstraCt
The present study examines how Organizational
Corporate Social Responsibilities (CSR) practice
towards four different stakeholders of organization
including employees of organization, Government
agencies, customers of organization and non-
governmental institutions affect employees’
organizational citizenship behavior (OCB). Further
moderating role of employees’ perception of importance
of Corporate Social Responsibility (CSR) is also
examined. 357 employees working in pharmaceutical
industry of Pakistan participated in the study by giving
their input on self-administrated questionnaire. Using
the partial least square structural equation modeling,
the results reveal that dimensions of OCSR except for
OCSR towards Government have significant impact on
Organizational Citizenship behavior and the most
significant dimension among four is CSR towards NGOs
and Society. Further, Perceived importance of CSR has
no significant moderating effect on any of the 4
dimensions of CSR studied in this research. The results
are useful for policy makers at national and
organizational levels to craft the CSR policies at
national and international levels. Further the results
also help organizations to understand the importance
of CSR from employees’ perspective and prepare HR
strategies to align OCSR goals at strategic and
operational levels.
Keywords: Organizational Corporate Social Responsibility, Organizational Citizenship
Behaviors, importance of CSR, Pharmaceutical industry
Journal of Business Strategies, Vol.14, No.1, 2020, pp 17–36 DOi:10.29270/JBS.14.1(20).02
17
__________________________________________________________________________________*,**,***Shaheed Zulfiqar Ali Bhutto institute of Science & Technology, Pakistan.
e-mail: [email protected]

introDuCtion
CSR or Corporate Social Responsibility has never been in discussion thismuch as now it has been discussed these days. On one hand organizations arebecoming more and more aware of the significance of their (CSR) CorporateSocial Responsibilities and on other hand Government bodies, NGOs andother stakeholders, due to the issues like pollution, employment,discrimination etc., are continuously working hard for making organizationsto become more accountable about their social responsibilities towards all theconcern stakeholders and contribute as much as they can for the society theyare linked with (Saha, 2018; Sarfraz, Qun, Abdullah & Alvi, 2018). In thismodern era of Facebook, Twitter, WhatsApp etc., it can easily be observedthat people also have now become more aware of the benefits and dangers oflarge organizations, corporate social responsibilities of the companies. Sameis the case with companies, every organization besides being actingresponsibly and beside the pressures of different institutions, are nowaccepting the fact of gaining great number of benefits from these CSRactivities. It has no doubt become an effective tool for gaining marketingadvantage and brand creation. Just for an example, children in schools aretaught to take care of “Earth” by various do’s and don’ts and by CSRadvertisement of companies, companies can persuade / encourage children orchildren can persuade parents to buy products of the socially responsiblyorganization that they believe to be working for good of this earth. This is justan example of that at what level this corporate social responsibility of anyorganization can affect. Many people believe that corporate socialresponsibilities (CSR) are just another way of large organizations to covertheir negative contributions to the environment and other stakeholders, whichare compared to be very less than what their negative effects are but our debatehere in this paper is not about that.
As people and organizations both are becoming more and more awareof the role and importance of Corporate Social Responsibilities oforganizations and the fact that has been proven theoretically andempirically with the help of social identity theory, that employees not onlyidentifying themselves with their organization has increased theimportance of understanding the relationship of corporate socialresponsibility and employees’ behaviors but also impacts theirperformance in many ways like work-engagement, motivation, sense ofloyalty and job satisfaction too (Abane, 2016; John, Qadeer, Shahzadi &Jia, 2019). As for companies CSR practices are becoming their license of
Khan, M. Y., Akbar, W., and Shaikh, M.
18

legitimacy (Roeck & Delobbe, 2012), tools for gaining marketingadvantage and more importantly gaining competitive advantage by havingmotivated and committed employees. Consequently, organizations are nowinterested to explore more about corporate social responsibilities, asbesides considering it as their social and moral obligation they areinterested to utilize it as a behavioral tool for employees. As companiesare involved in different dimensions of corporate social responsibilitieslike towards internal external customers, government and non-governmental organizations etc. It is also needed to be investigated thatcorporate social responsibilities practices towards which stakeholder havemost impact on employees’ behaviors. Furthermore, the fact of employees’perception about corporate social responsibility effecting the behaviorshave also been evaluated in recent studies. As Saha (2018) mentioned thecomparison of managers from USA and South Africa holding differentperceptions for corporate social responsibilities. Manager from USA weremore inclined towards societal responsibilities of organizations compareto South African managers. Thus the moderating role of employees’perception about corporate social responsibility cannot be ignored. Severalstudies have been conducted to examine how CSR activities and OCBinfluences individual and organizational performance (Farid et al, 2019).Moreover, lot more studies are still continuing analyzing mediating roleof CSR in employee related behaviors.
As pharmaceutical sector of Pakistan has always been in discussion forboth positive and negative practices related to manufacturing, prices hikes,sales pressure etc. I myself being in this sector for about more than 7 yearsnow and being employed to three difference pharmaceutical firms haveobserved pharmaceutical firms acknowledging the importance of CSR andinvolved in various CSR practices. This may be because of the fact thatpharmaceutical sector is openly criticized for the reasons mentioned aboveand to lessen the effect of that, the pharmaceutical companies are moreinvolved in CSR and also market their activities more than others. Beingassociated to such sector, employees of pharmaceutical industry must havesome influence on their behaviors outcomes. Thus in line with previousstudy of Newman, et al., (2015) this study aims to contribute in literatureby highlighting the importance of organizational corporate socialresponsibilities practices and examine how such practices towards fourdifferent stakeholders of organization can affect attitudes and behaviorsof employee which in this study will be Organizational Citizenship
Linking Organizational Corporate Social Responsibility
Practices and Organizational Citizenship Behavior
19

Behaviors, moreover what is role of employees’ perception in effectingthe relationship of corporate social responsibility and organizationalcitizenship behavior. The four stakeholders include employees oforganization, Government agencies, customers of organization and non-governmental institutions. This study finds out the nature of relationshipbetween employee perceptions of corporate social responsibility towardsall four main stakeholders and Organizational Citizenship Behaviorseparately which allow us to evaluate that which specific CSR practicestowards difference stakeholders contribute positively / negatively to OCBsof employees and also which practices have the strongest relationship withOCBs. Finally, conclusion of this study can help organizations who arewilling to enhance the organization citizenship behavior of employeesthrough CSR by focusing on practices which have most influence on OCBsas are identified in this study.
literature reVieW
social identity theory
Social identity theory suggests that it is natural that people like to beidentified or want people to acknowledge their connection with any socialgroup etc. especially if it has positive reputation in society (Jenkins,2014). This connection can be of permanent or temporary nature for examplea connection associated by caste of a person will remain permanent for lifebut a connection made from working in a specific organization will be oftemporary nature as if employee left that organization the association withthat organization comes to end though he or she still can associate himselfwith that organization as an ex-employee (Hogg & Turner, 1985). Forexample, in countries like Pakistan and India if people belong to highercastes they do associate their caste title with their names and feel proud toshare it with others. Not only have that but if people are associated with anygrouped they also try to follow the specific behaviors of that group so thattheir relationship with that group is considered to be true and strong. Turker(2009) indicates individuals seek for a positive social distinctiveness tocreate psychosomatic exceptionality for one’s own group or to achieveintergroup uniqueness (Ashforth & Mael, 1989).
organizational Citizenship Behavior
Organizational Citizenship Behavior (OCB) is the concept first realizedin the decade of 70. This concept explains the discretionary behavior ofan employee which cannot be explained or related to any extrinsic
Khan, M. Y., Akbar, W., and Shaikh, M.
20

rewards. This behavior leads employees to perform duties or tasks whichtheir usual job descriptions do not require or which organizations do notusually enforce on employees (Abane, 2016). Organizational citizenshipbehavior of employees does not directly benefit them but they generallybenefit the team and the organizations. Many Studies have correlatedorganizational citizenship behavior with characteristics like altruism,courtesy, and conscientiousness of the company. This behavior on anemployee can also be a personality trait of an employee regardless of theany practices of organization or the employees’ colleague, but studies havefound high correlation between OCB and positive characteristics of thecompany e.g. CSR (Khan, et al., 2018; Rasool & Rajput, 2017; Abane,2016). Thus it can take out that perceived organizations positivecharacteristic lead employees towards organizational citizenship behavior.
Social Identity Theory and Organizational Citizenship Behavior
The concept of social identity theory works similarly in the case oforganizations (Hogg, Terry, & White, 1995). As people naturally associatethemselves with any social or demographical groups, employees of anyorganization also associate themselves with their respective organizations(Rehmani & Khokhar, 2018). As per Turker (2009) the concept ofassociating oneself with its respective organization is a critical aspect ofa person’s identity. If employees consider their organizations is a positivecontributor to the society they feel proud to be associated with thatorganization and they consider the contributions of the company andsuccess of the company as their own. This feeling of oneness pushesemployees to become more willing to contribute as much as they can orgoing extra mile for the organization. (Newman et al., 2015).
Corporate social responsibility
The whole concept of Corporate Social Responsibility or CSR is theproduct of the long-standing idea which believes that other than justmaximizing profits for shareholders the organization has some socialresponsibilities to people, environment, society and other stakeholders aroundthem(Carroll & Shabana, 2010). A more comprehensive definition of CSRquoted by Celik, Persson, and Tkáč (2018) from European Commission is
“CSR is a responsible approach of companies towards their impact on
society. A responsible approach is characterized by compliance with the
law and integration of environmental, social, ethical, human and
consumer rights into their business models”
Linking Organizational Corporate Social Responsibility
Practices and Organizational Citizenship Behavior
21

Luc (2016) state that CSR can ultimately lead to organization’s victoryif they are successful in handling the corporate operations in a way thatcan build an expectant influence on the society they operate. In its earlierform corporate social responsibility was considered to be limited to justcharitable endeavors of large organizations. In last two and half decadesits definition has been greatly transformed into a multi facet discipline.Now scope of corporate social responsibilities has been spread to differentstakeholders, they are mainly characterized into two categories first is forthe stakeholders inside the organizations referred to as Internal CSR andsecond is for the stakeholders present outside the environment of anorganization such as government agencies, non-profit organizationsworking for betterment of people and societies, environment etc. (Rasool& Rajput, 2017). However, it can be argued that among all the majorindustries operating in a country medicine or pharmaceutical industryholds a huge accountability in terms of opting socially acceptable andethical behaviors (Salton & Jones, 2015).
Dimensions of Corporate Social Responsibility
According to Cek and Eyupoglu (2019) CSR activities areauspiciously considered by individuals and employees in the currentcorporate environment and have become a crucial element especially indeveloping countries like Pakistan, India etc. As explained by Newman,et al. (2015) with the help of the findings of Turker (2009) analysis, thecorporate social responsibility to its stakeholders can be categorized asprimary stakeholder and secondary stakeholders. There are in total fourgroups of stakeholders in these two categories as primary groupcompromises of corporate social responsibility towards employees,corporate social responsibility towards customers and corporate socialresponsibility towards government, while the secondary groups ofstakeholders are social and non-social stakeholders. Empirical studieshave shown that corporate social responsibilities towards differentstakeholders results differently on the outcomes of employee’s behaviors(Abane, 2016; Newman, et al., 2015; Turker, 2009). As such, study ofNewman, et al., (2015) concluded that organizational corporate socialresponsibilities practices towards secondary stakeholders was highlycorrelated to organizational citizenship behavior than corporate socialresponsibilities practices towards primary stakeholders. A comparativestudy of (Abane, 2016) analysis reached to the conclusion that employeeperception of corporate social responsibilities with respect to government
Khan, M. Y., Akbar, W., and Shaikh, M.
22

and environment were strong compared to other stakeholders. Thus itsupports the necessity of studying CSR as per its different dimensionswhich in this study is four dimensions.
Corporate Social Responsibility towards Employees
Corporate social responsibility towards employees refers to fairpractices of organizations towards its employees. It may include settingmarket competitive salaries, fair treatment, respectable environment,special supports in situation of need (Malik & Nadeem, 2014). Ifemployees working in an organization feels that their organizationunderstands its responsibilities towards its employees then it will create apositive image of the organization both internally and external toorganization (Abane, 2016). In this regards Bartels, Peters, de Jong, Pruynand van der Molen (2010) also insisted that if the organizations areinvolved in CSR responsibilities employees do feel encouraged in a waythat they are a part of these activities by sharing similar values andcharacteristics respectively.
Corporate Social Responsibility towards Customers
Corporate social responsibility towards customers is considered to bemost significant in the group of three. Corporate social responsibilitytowards customers may include commitment fulfilling and keeping up torights of the customers etc. (Newman, et al., 2015), as employees of acompany are more located usually in one place the customers of acompany are spread over around the whole country and even beyond that.So if an organization has satisfied customers who are aware of company’spositive corporate social responsibilities, the customers will providepositive feedback about the organization to the people (Turker, 2009). Thiswill help in creating and maintaining a positive image of the organizationin the market and people will value the company and the employees whoare working in the respective company. Thus this will again like abovewill enhance organizational citizenship behavior of the employees assuggested by the empirical studies of (Abane, 2016; Newman, et al., 2015;Turker, 2009).
Corporate Social Responsibility towards Government
Corporate social responsibility towards government refers to anorganization’s compliance of legal and regulatory bodies. An organizationfulfilling the compliance to government’s regulation is ultimately workingfor better and safer environment and betterment of employees as
Linking Organizational Corporate Social Responsibility
Practices and Organizational Citizenship Behavior
23

government policies are meant for the same reasons and for the stability ofthe country. Multiple studies have evaluated the link of CSR towardsgovernment to employee outcomes (Turker, 2009; Newman, et al., 2015).Although studies establish that there is link between corporate socialresponsibility towards organizational citizenship behavior and employeesperformance but that was not comparatively significant than corporatesocial responsibilities to other stakeholders. However, Study of Abane(2016) found the link of corporate social responsibility towards governmentand society stronger in its study. In any case it can generally be realizedthat an organization working to become a compliant organization will havea positive image in employees, customers and in market. Thus it can bederived from social identity theory that this positive image will lead theemployees towards organizational citizenship behavior.
Corporate Social Responsibility towards NGOs and Society
Corporate social responsibility towards social and non-socialstakeholder is defined by Newman, et al. (2015) in their study as thosecorporate social responsibilities initiatives which are directed towards thoseentities which are not directly benefitted from the practice of organizationsuch as employees, internal & external customers etc. This group mayinclude non-governmental organization working for the betterment andstability of society and environment. These practices specially cost heavilyto the organization so it also gives the message to the stakeholders thatcompany is follows selflessly the aim of fulfilling the corporate socialresponsibilities even by sacrificing huge amount of profits (Newman, etal., 2015). Corporate social responsibilities towards social and non-socialstakeholders are usually comes in knowledge of masses as those non -governmental organizations never fail to acknowledge the contributions ofparticular organizations publically. Hence the effect of corporate socialresponsibilities towards social and non-social stakeholders has the mosteffect on responsible image creation of company. Empirical studies havealso confirmed this as in their study finds the corporate socialresponsibilities towards social and non-social stakeholders the strongestcontributor in employees’ organizational citizenship behavior and in theirperformance.
Conceptual framework and Hypothesis Development
Based on above literature review we have developed the conceptualframework in which Organizational Corporate social responsibility(Independent Variable) has been measured by four dimensions including
Khan, M. Y., Akbar, W., and Shaikh, M.
24

CSR towards employees, customers, government and NGO. Whereas,Organizational citizenship behavior has been measured as dependentvariable. Further Importance of CSR has been measured as moderatorbetween four dimensions of OCSR and OCB.
Figure 1: Conceptual Framework
Based on above literature we have developed the following hypotheses”
H1: There is a significant impact of CSR towards employees on organizational
citizenship behavior
H2: There is a significant impact of CSR towards employees on organizational
citizenship behavior
H3: There is a significant impact of CSR towards Government on organizational
citizenship behavior
H4: There is a significant impact of CSR towards NGO and Society on organizational
citizenship behavior
H5a: importance of CSR moderates the relationship between CSR towards
employees and Organization citizenship behavior
H5b: importance of CSR moderates the relationship between CSR towards
customers and Organization citizenship behavior
H5c: importance of CSR moderates the relationship between CSR towards
Government and Organization citizenship behavior
H5d: importance of CSR moderates the relationship between CSR towards
NGO & Society and Organization citizenship behavior
Linking Organizational Corporate Social Responsibility
Practices and Organizational Citizenship Behavior
25

MetHoDologY
In this research ontological stand is taken as there is single reality asthis research seeks to study the single reality of relationship betweenCorporate Social Responsibility and Organizational Citizenship Behavior(opposite to interpretivist where reality can be multiple). The variableswhich are studied here have objective characteristics and tangible realties;they also exist separate or independent of the subject (opposite tointerpretivism where reality is claimed to be socially constructed andresearcher and research are one). As this research is quantitative in nature(Interpretivist is used for qualitative researches) and to fulfill the objectiveof this research which is to investigate the relationship of corporate socialresponsibility practices and organizational citizenship behavior,hypotheses are made and tested (scientific method) and the data iscollected through self-administrated questionnaire. Further the data isstatistically analyzed for the relationships and its validity will also becheck statistically (in interpretivist the data is validated thru interviews).This research also aims to generalize it finding to other pharmaceuticalcompanies (in qualitative researches one cannot easily generalize orcompare the research). Thus this research best suits to positivist paradigm.This study is based on Social Identity Theory; hypotheses are developedon the basis of SIT that corporate social responsibility practices of acompany leads employees to organizational citizenship behavior. So thisstudy is using Deductive approach.
sample and instrument
The size of the sample determines the statistical precision of thefindings. The size of the sample is a function of change in the populationparameters under study and the estimation of the quality that is needed bythe researcher. Generally, larger samples result in more precise statisticalfindings (Abane, 2016). Three pharmaceutical companies of Karachi, therequired sample size was calculated. Total no. of employees of all threecompanies: 3400 sample size calculated: 357. Convenience samplingtechnique is used for both selection of companies and employees.Structured questionnaire is used to collect primary data. Questionnaire hasbeen adopted from the study of (Newman, et al., 2015; Abane, 2016).Questionnaire is also validated through pilot testing.
Data analYsis
SmartPLS3 (PLS-SEM) (Ringle, Wende, & Will, 2005) is used toanalyze the questionnaire and hypothesis testing. PLS-SEM is most
Khan, M. Y., Akbar, W., and Shaikh, M.
26

suitable technique (Hair et al, 2014) for studying path model. Internalconsistency reliability is tested by rational Cronbach’s alpha and then itwill also be tested through composite reliability which will overcome thelimitations of Cronbach’s alpha while distinguishing between variableindicators on the basis of outer loadings. Convergent validity is one of theway to ensure that all the variables and their items correlates with the otheritems of the same variable. There are mainly three ways to establish theconvergent validity, one is by average variance extracted also knows asAVE, second is Outer Loadings and third is composite reliability. Asmention in below table that in all of the three directions values appears inthe acceptable range and came out significant for conducting furtheranalysis. Later Regression analysis is used to test the relationship betweenemployee perceptions of CSR practices towards all 4 major stakeholdersand Organizational Citizenship Behavior.
Measurement Model
Convergent Validity and Item Reliability
Table 1 shows the outer loading statistics of all the items of thisresearch and we can see that value of outer loadings are all in theacceptable range which is above. 0.60. Thus, it is established thatconvergent validity is present. Further, the table shows the compositereliability statistics of all the variables, and since all are having values inacceptable range i.e. 0.70, thus it can be assumed that all the items of allthe variables have internal consistency and they are towards same idea.Finally, An AVE value of 0.50 or higher indicates that, on average, theconstruct explains more than half of the variance of its indicators.Conversely, an AVE of less than 0.50 indicates that, on average, more errorremains in the items than the variance explained by the construct. Thetable shows the all the variables have AVE of higher than 0.5.
Table 1: Outer loadings, Alpha, CR and AVE Measure-
ments
outer loading
values
Cronbach’s
alpha
Composite
reliability
average Variance
extracted (aVe)
CSR towardsCustomer
CSR1_1 0.736 0.824 0.894 0.738
CSR1_2 0.894
CSR1_3 0.800
CSR1_6 0.834
CSR towardsEmployee
CSR2_1 0.848 0.835 0.889 0.669
CSR2_2 0.839
CSR2_3 0.889
Linking Organizational Corporate Social Responsibility
Practices and Organizational Citizenship Behavior
27

Discriminant Validity
An indicator’s outer loadings on a construct should be higher than allits cross loadings with other constructs. It is used to establish thediscriminant validity which explains that the variable is only measuringwhat it is meant for measuring. Above table shows that all loadings torespective variable is higher than the other cross loading thus successfullyestablishing discriminant validity. One more conservative way to analyzethe discriminant validity is the Fornell – Larcker criterion. The logic ofthis method is based on the idea that a construct shares more variance withits associated indicators than with any other construct. Table 3 shows thatall constructs does have high value of variance with their own constructthen other variables.
Table 2: Cross Loadings
CSR towardsGovernment
CSR3_1 1.000 1.000 1.000 1.000
CSR towardsNGOs andSociety
CSR4_1 0.839 0.823 0.882 0.652
CSR4_2 0.823
CSR4_3 0.815
CSR4_6 0.751
Importance ofCSR
ICSR2 0.778 0.767 0.850 0.587
ICSR3 0.730
ICSR4 0.774
ICSR5 0.782
OrganizationalCitizenshipBehavior
OCB_1 0.756 0.857 0.897 0.637
OCB_4 0.792
OCB_6 0.743
OCB_7 0.864
OCB_8 0.829
Crossloadings
CSRtowards
Employee
CSRtowards
Customer
CSR towardsGovernment
CSR towardsNGOs and
Society
Importanceof CSR
OrganizationalCitizenshipBehaviour
CSR1_1 0.736 0.347 0.716 0.554 0.246 0.492
CSR1_2 0.894 0.394 0.494 0.619 0.390 0.735
CSR1_3 0.800 0.493 0.569 0.698 0.284 0.571
CSR1_6 0.834 0.408 0.501 0.595 0.354 0.704
CSR2_1 0.414 0.848 0.432 0.523 0.266 0.482
CSR2_2 0.412 0.839 0.344 0.307 0.262 0.455
CSR2_3 0.455 0.889 0.565 0.481 0.318 0.613
CSR3_1 0.676 0.532 1.000 0.672 0.315 0.655
CSR4_1 0.638 0.413 0.581 0.839 0.344 0.741
Khan, M. Y., Akbar, W., and Shaikh, M.
28

Table 3: Fornell-Larcker Criterion
structural Model
Evaluation of R2 Value
Table 4 shows that the R2 is significant based on the standardrecommendations by (Cohen, 1988) where he suggests that 0.02 -0.12 isweek, 0.13 -0.25 is moderate and 0.26 is considerable. The value of Rsquare in above table is 0.762 which means that variance in OrganizationalCitizenship Behavior the independent variable is explained by 76.3% bythe Dependent variables of perception of CSR.
Table 4: R2 Value
Hypothesis Testing
Table 5 and Table 6 provide the results of hypotheses. We appliedbootstrapping technique with 5000 samples to test the relation and latermoderating variables were also tested to find the moderating role ofimportance of CSR. Detail discussions on result is provided in separatesection below.
I II III IV V VI
(1) CSR towards Customer 0.859
(II) CSR towards Employee 0.499 0.818
(III) CSR towards Government 0.532 0.676 1.000
(IV) CSR towards NGOs and Society 0.514 0.749 0.672 0.808
(V) Importance of CSR 0.331 0.397 0.315 0.429 0.766
(VI) Organizational Citizenship Behaviour 0.610 0.778 0.655 0.774 0.504 0.798
R Square R Square Adjusted
Organizational Citizenship Behavior 0.762 0.752
CSR4_2 0.670 0.426 0.437 0.823 0.350 0.635
CSR4_3 0.567 0.449 0.718 0.815 0.353 0.566
CSR4_6 0.531 0.377 0.437 0.751 0.346 0.522
ICSR2 0.317 0.374 0.257 0.396 0.778 0.442
ICSR3 0.240 0.207 0.199 0.285 0.730 0.315
ICSR4 0.360 0.129 0.235 0.316 0.774 0.363
ICSR5 0.292 0.273 0.264 0.304 0.782 0.404
OCB_1 0.655 0.356 0.628 0.677 0.329 0.756
OCB_4 0.554 0.671 0.449 0.552 0.437 0.792
OCB_6 0.529 0.516 0.509 0.536 0.368 0.743
OCB_7 0.762 0.366 0.571 0.662 0.444 0.864
OCB_8 0.592 0.540 0.458 0.654 0.427 0.829
Linking Organizational Corporate Social Responsibility
Practices and Organizational Citizenship Behavior
29

Table 5. Hypothesis Testing (Direct Effect)
Table 6: Hypothesis Testing (Moderating)
DisCussion
CSR or Corporate Social Responsibility has never been in discussion thismuch as now it has been discussed these days. On one hand organizationsare becoming more and more aware of the significance of their (CSR)Corporate Social Responsibilities and on other hand Government bodies,NGOs and other stakeholders, due to the issues like pollution, employment,discrimination etc., are continuously working hard for making organizationsto become more accountable about their social responsibilities towards allthe concern stakeholders and contribute as much as they can for the societythey are linked with. As pharmaceutical sector of Pakistan has always beenin discussion for both positive and negative practices related tomanufacturing, prices hikes, sales pressure etc. Being associated to suchsector, employees of pharmaceutical industry must have some influence ontheir behaviors outcomes. This study is based on Social Identity Theory,hypotheses are developed on the basis of SIT that corporate socialresponsibility practices of a company leads employees to organizationalcitizenship behavior. So this study is using Deductive approach.
OriginalSample
(O)
StandardDeviation(STDEV)
T Statistics(|O/STDEV|)
CSR towards Customer -> OrganizationalCitizenship Behaviour
0.202 0.053 3.828
CSR towards Employee -> OrganizationalCitizenship Behaviour
0.325 0.062 5.210
CSR towards Government -> OrganizationalCitizenship Behaviour
0.054 0.063 0.851
CSR towards NGOs and Society ->Organizational Citizenship Behaviour
0.331 0.055 6.036
OriginalSample
(O)
StandardDeviation(STDEV)
T Statistics(|O/STDEV|)
Moderating Effect 1 -> OrganizationalCitizenship Behaviour
0.135 0.093 1.461
Moderating Effect 2 -> OrganizationalCitizenship Behaviour
0.036 0.081 0.446
Moderating Effect 3 -> OrganizationalCitizenship Behaviour
0.086 0.074 1.161
Moderating Effect 4 -> OrganizationalCitizenship Behaviour
-0.172 0.091 1.887
Khan, M. Y., Akbar, W., and Shaikh, M.
30

The above results of Smart PLS shows that T-Statistics value ofhypothesis 1 i.e. employees’ perception of CSR towards employee hassignificant correlation with organizational citizenship behavior having Tvalue of 5.210, which urges and exhibits consistency to the extantliterature that employee do feel proud and does impact their social identityby associating to such an organization which contributes to theirimmediate society well-being (De Roeck & Delobbe 2012; Bartels et al.2010). Hypothesis 2 i.e. Employees’ perception of CSR towardsCustomers leads to organizational citizenship behavior, although anexcessive studies has been conducted in similar domain highlighting astrong relation between CSR activities (Riketta, 2005) and otherdiscretionary behaviors of employees but less on the factors like OCB andperformance factors (Turker, 2009; Hofman & Newman, 2014). The aboveanalysis is evident that organizations CSR activities do impact itsimmediate customers and their loyalty exhibiting significant results withthe T value of 3.828.This may indicate that from social perspective aspectthat receiving positive word-of-mouth from customers regarding theirorganizational practices in relation to CSR activities employees do feelpride, superior and acknowledged on personal-level (Turker, 2009).Moreover especially in the context of pharma industry employee are indirect contact with the customers, therefore hearing positive views abouttheir companies can result as a motivation source and wish for stayingwith their current organization for longer term.
Considering hypothesis 3 i.e. Employees’ perception of CSR towardsGovernment leads to organizational citizenship behavior has comparativelyless significant T- value of 0.851as compare to other stakeholder dimensionsused in our study. The low t-values in Pakistani context may be due to thefact that general public their trust on regulatory bodies due to increasenumbers of corruptions scandals involving politicians and high rankinggovernment officials, therefore, according to the this study employees do notfeel a sense of pride by participating in any of corporate social activitiesdirected towards government (Gong & Wu, 2012). Hypothesis 4 i.e.Employees’ perception of CSR towards NGO’s and Society exhibits the mostfavorable behavior towards enhancing organizational citizenship behaviorexhibiting T- value of 6.036, as insisted by Lu (2009). In such a context, afirm’s CSR directed toward meeting legal and regulatory obligations isunlikely to engender higher levels of organizational identification andsubsequently impact on employee behavior.
Linking Organizational Corporate Social Responsibility
Practices and Organizational Citizenship Behavior
31

These results show that CSR plays a significant role in boostingemployee loyalty and can also result as of vital importance in terms ofgaining sustainable competitive advantage (Porter and Kramer, 2006;John, Qadeer, Shahzadi & Jia, 2019). Almost all dimensions of CSR exceptfor CSR towards Government all are significantly correlated toOrganizational Citizenship behavior and the strongest correlation is amongCSR towards NGOs and Society with Organizational citizenship behavior.It can also be observed from above results that moderating variable ofPerceived Importance of CSR has no significant moderating effect on anyof the 4 dimensions of CSR studied in this research.
ConClusions anD suggestions for future researCH
This study successfully established its hypothesis that CSR towardsdifferent stakeholders of organization leads to organizational citizenshipbehavior of an employee. However as per previous studies it wasunsuccessful in establishing the fact that perceived importance of CSRwill play an enhancing role in the correlation of CSR and OCB but wefound that this is not the case. There were few limitations to the study asthis study only took three companies in research as there are more than100 pharmaceutical companies present in the same city. So futureresearches should take more organizations into account.
Khan, M. Y., Akbar, W., and Shaikh, M.
32

referenCes
Abane, S. (2016). Employee Perceptions of Corporate SocialResponsibility (CSR) and Organisational Citizenship Behaviours(OCB) A Comparative Ghanaian (Doctoral Dissertation),University of Ghana.
Ashforth, B. E., & Mael, F. (1989). Social identity theory and theorganization. Academy of management review, 14(1), 20-39.
Bartels, J., Peters, O., de Jong, M., Pruyn, A., & van der Molen, M. (2010),‘Horizontal and Vertical Communication as Determinants ofProfessional and Organizational Identification. Personnel
Review, 39, 210–226.
Carroll, A. B., & Shabana, K. M. (2010). The business case for corporatesocial responsibility: A review of concepts, research andpractice. international Journal of Management Reviews, 12(1),85-105.
Cek, K., & Eyupoglu, S. Z. (2019). Does teachers’ perceived corporatesocial responsibility lead to organisational citizenship behaviour?The mediating roles of job satisfaction and organisationalidentification. South African Journal of Business Management,
50(1), 11.
Celik, R., Persson, J. & Tkáč, A. (2018). Who Cares?: A Comparison ofConsumer Perceptions of CSR Between Western and EasternEurope.
Cohen, J. (1988). Statistical Power Analysis for the Behavioral Sciences–Second Edition. 12 Lawrence Erlbaum Associates Inc. Hillsdale,New Jersey, 13.
De Roeck, K. & Delobbe, N. (2012). Do environmental CSR initiativesserve organizations’ legitimacy in the oil industry? Exploringemployees’ reactions through organizational identificationtheory. Journal of Business Ethics, 110(4), 397-412.
Farid, T., Iqbal, S., Ma, J., Castro-González, S., Khattak, A., & Khan, M.K. (2019). Employees’ perceptions of CSR, work engagement,and organizational citizenship behavior: The mediating effects
Linking Organizational Corporate Social Responsibility
Practices and Organizational Citizenship Behavior
33

of organizational justice. international Journal of Environmental
Research and Public Health, 16(10), 1731.
Gong, T., and Wu, A.M. (2012), ‘Does Increased Civil Service Pay DeterCorruption? Evidence from China,’ Review of Public Personnel
Administration, 32, 192– 204.
Hair, J., Joe, Sarstedt, M., Hopkins, L., & Kuppelwieser, V. (2014). Partialleast squares structural equation modeling (PLS-SEM) Anemerging tool in business research. European Business Review,
26(2), 106-121.
Hofman, P., & Newman, A. (2014), ‘The Impact of Perceived CorporateSocial Responsibility on Organizational Commitment and theModerating Role of Collectivism and Masculinity: Evidencefrom China,’ international Journal of Human Resource
Management, 25, 631– 652.
Hogg, M. A., & Turner, J. C. (1985). Interpersonal attraction, socialidentification and psychological group formation. European
Journal of Social Psychology, 15(1), 51-66.
Hogg, M. A., Terry, D. J., & White, K. M. (1995). A tale of two theories:A critical comparison of identity theory with social identitytheory. Social Psychology Quarterly, 255-269.
Jenkins, R. (2014). Social identity. Routledge.
John, A., Qadeer, F., Shahzadi, G., & Jia, F. (2019). Getting paid to begood: How and when employees respond to corporate socialresponsibility?. Journal of Cleaner Production, 215, 784-795.
Khan, M., Sarwar, S. & Khan, H. (2018). Impact of Corporate SocialResponsibility on Job Attitudes: Job Satisfaction andOrganizational Commitment of Banking Sector Employees ofPakistan. SEiSENSE Journal of Management, 1(3), pp.28-47.
Lu, X. (2009). A Chinese Perspective: Business Ethics in China Now andin the Future. Journal of Business Ethics, 86, 451– 461
Luc, J. (2016). Corporate Social Responsibility. Retrieved from http://sba-int.ch/1216- Corporate_Social_Responsibility
Khan, M. Y., Akbar, W., and Shaikh, M.
34

Malik, M. S. & Nadeem, M. (2014). Impact of corporate socialresponsibility on the financial performance of banks in Pakistan.international Letters of Social and Humanistic Sciences, 10(1),9-19.
Newman, A., Nielsen, I. & Miao, Q. (2015). The impact of employeeperceptions of organizational corporate social responsibilitypractices on job performance and organizational citizenshipbehavior: Evidence from the Chinese private sector. The
international Journal of Human Resource Management, 26(9),1226-1242.
Porter, M. E. & Kramer, M. R. (2006). Strategy and Society: The Linkbetween Competitive Advantage and Corporate SocialResponsibility. Harvard Business Review, 84(12), 78-92.
Rasool, I. & Rajput, A. (2017). The Impact of Perceived Internal CorporateSocial Responsibility on Organizational Citizenship Behavior: AMicro-Perspective Analysis. Business & Economic Review, 9(1),181-201.
Rehmani, M. & Khokhar, M.N. (2018). Leadership and OrganizationalCommitment: Mediating Role of CSR. Abasyn University
Journal of Social Sciences, 11(1).
Riketta, M. (2005). ‘Organizational Identification: A Meta-Analysis,’Journal of Vocational Behavior, 66, 358–384.
Ringle, C. M., Wende, S., & Will, A. (2005). SmartPLS 2.0 (beta):Hamburg.
Saha, S. (2018), Employee Perception Regarding Corporate SocialPerformance: A study of the selected Banking Company inBangladesh.
Salton, R., & Jones, S. (2015). The corporate social responsibility reportsof global pharmaceutical firms. British Journal of Healthcare
Management, 21(1), 21-25.
Sarfraz, M., Qun, W., Abdullah, M. & Alvi, A. (2018). Employees’perception of corporate social responsibility impact on employee
Linking Organizational Corporate Social Responsibility
Practices and Organizational Citizenship Behavior
35

outcomes: Mediating role of organizational justice for small andmedium enterprises (SMEs). Sustainability, 10(7), 24-29.
Turker, D. (2009). How corporate social responsibility influencesorganizational commitment. Journal of Business Ethics, 89(2),189-204.
Khan, M. Y., Akbar, W., and Shaikh, M.
36

Managing CHange WitH an interVention
of PsYCHologiCal ContraCt
shoaib Hyder*, sumaiya syed**, and
salman Bashir Memon***
aBstraCt
Organizations assess their feasibility to manage change
by weighing their response and outcome, whereby
humans seem most important. This study engaged two
hundred and ninety-two mid-level professionals with a
working experience of either public or private
organizations of information and Communication
Technologies in Pakistan. it is revealed that the
association of psychological contract and its fulfillment
towards change management and willingness to change
is quite posturing a positive impact. The study has
concluded that the psychological contract is a complete
subject line of commitments and promises, whereby the
response of employees during changing time depends
on their personality, situation and structure of change
process. Significantly, change rehearsal is obligatory
to the organization. Moreover, the extent of fulfillment
by both parties is a facilitating footstep towards
bringing effective change in an organization, and at all,
the intervention of psychological contract assists in
directing the individual learning for change adaptation
and organizational learning for change implementation.
Keywords: Change Management, Psychological Contract, Quantitative Study.
introDuCtion
Change in an organization is apparent (Cameron & Green, 2009).Organizations today assess their feasibility by weighing their responsetowards time-based changes (Rousseau & Tijoriwala, 1998) for itsprocesses, human resources and physicals (Doornmalen, 2011). Humansare most important (Rose, 1969) among three as they are alive and have aresponsible behaviour towards change management (CMT), whileprocesses and physicals do not respond (Dunphy & Stace, 1993).Individuals need appropriate facilitation for endorsement of change in an
Journal of Business Strategies, Vol.14, No.1, 2020, pp 37–62 DOi:10.29270/JBS.14.1(20).03
37
__________________________________________________________________________________*[email protected]; **[email protected]; [email protected]

organizational interface (Kramer, 2007). Organizations bring change tosupport performance (Smollan, 2017) and growth of itself and itsemployees (Ketzer, 2012). Bringing change would change the employeeexpectations and commitment towards the organization (Freese, Schalk,& Croon, 2007). The involvement of employee would link to what anemployee expects to provide to the organization and get in return from it(Coyle-Shapiro & Conwey, 2006; Doornmalen, 2011). This study is routedto the psychological contract (PC) of an individual. The reason to considerPC in an organization is to assess an array of obligations (Rousseau,Hansen, & Tomprou, 2018), so that an effective CMT may be rehearsed(Cummings, Bridgman, &Brown, 2015). It is a relatively significant todayto improve the interpersonal behaviour of employees and its organizationsimultaneously to strengthen and confirm expectations and obligationsduly formed by two towards each other (Guest & Conway, 2002). Thiswould also assist in establishing organizational objectives through thedefinition of employee-centric approaches to enhance contract fulfillment(Liao, Wayne, & Rousseau, 2016). PC would also enrich relationship oftwo (Aselage & Eisenberger, 2003; Freese, Schalk, & Croon, 2007), andit would help achieve the success of bringing and managing change in anorganization (Hyder, Syed, & Memon, 2019). PC expectations could bethe source of establishing competitive move (Dunphy & Stace, 1993). Thestudy is a worthy addition to the literature of Pakistan that tries to exploremeaningful factors between PC and CMT. It also provides organizationsand managers with empirical information of PC intervention to CMT formanaging change decisions with following objective of research: toexamine the extent of influence and intervention of PC, PCF and PCB toCMT, WTC and RTC.
Change Management
CMT is an approach to shift (Dunphy & Stace, 1993) employees,divisions or organization itself using predefined methods to redirectprocesses (Kanter, Stein, & Jick, 2003) and use of resources torestructure the organization for survival and growth (Smollan, 2017). Itrefers to planned modification (Galpin, 1996) of organizationalbehaviour towards each aspect or just one it deals with to improvefunctioning (Kramer, 2007). It is concerned with managing neworganizational goals and policies (Luecke, 2003), and implementation,continuation and development through a CMT course (Zimmer, 2015)that depicts all steps involved in intended transformation with possible
Hyder, S., Syed, S., and Memon, S. B.
38

restrictions (Smollan, 2017). CMT is a continuous process and its natureis quite practical (Armenakis & Bedeian, 1999) thus there is need tofocus on CMT models of different researchers to understand the termmore comprehensively.
Different change models have been presented but all direct to rehearsethe practice of change as a plan or a course to be adopted in anorganization (Schalk & Freese, 2002). Let us cite some of the majorchange models around six decades. It starts with the work of Lewin(1946), who put it into the context of unfreezing the abnormal behaviourand freezing it to normal by three steps. Kubler Rose (1969) expandedby five-stages model; arguing once a change is implemented an individualbegins to react first in denial and shock moving to depression andfrustration but once he is engaged in experiencing change he begins todecide for integration in change. Bullock and Batten's (1985) introduceda four-phase model; confirming that change is technical and needs to betechnically addressed through definition and monitoring. Judson (1991)provided with a five-step model to motivate the employees to adoptchange and reduce RTC.
Later, Kanter and colleagues (1992) identify change as a teninstructions-model to be executed; arguing that change is amultidimensional process and present almost everywhere, it cannot beavoided as per its stream of happening and execution. Dunphy & Stace(1993) proposes organizational transformation changes mission, corevalues, strategy and even way of interaction in an organization (Hyder,Syed, & Memon, 2019). Galpin (1996) evaluated change with culturalinfluences; evolving a new nine wedge (fixed) step model to alignchange with organizational culture. Kotter (1996) clarifies CMT as aneight-step transformational organization process in his book; applicableto organizations working in continuously changing environment.Armenakis & Bedeian (1999) build up a seven-step model almost closeto Lewin’s; enforcing change is continuous and is transmitted byorganizational willingness.
Revolving millennium brings; Senior (2002) categorizes the changeby its occurrence, how it arrives and by scale; prescribing the model ishighly applicable to change under investigation. Luecke (2003)examined connections of Lewin and Kotter model; proposed a newseven-step model that entity must adopt a structured way to bring
Managing Change with an intervention of Psychological Contract
39

change. Hiatt & Creasey (2003) provided with the ADKAR model thatrefers to creating awareness, enforcing desire, providing changeknowledge, training ability and finally reinforcing change forsustainability. Zimmer (2015) confirms change is a process or a courseand significantly involves eight-steps based on the commonality ofdifferent models cited above.
Each CMT model cited above confirms that it is the process that needsidentifying (Bullock & Batten, 1985), planning (Senior & Swailes,2010), communicating, implementing and reinforcing changecontinuously (Smollan, 2017) for effective CMT at the individual,divisional and organizational level (Zimmer, 2015). Further, CMT isabout to impose new skills to whoever works in the organization.Confirming change is a step ahead towards organizational developmentand sustainability (Smollan, 2017). Organizational behaviour hasauthenticated that an individual, individual-organization interface,organization itself and its processes concerning time are significantcontext to CMT (Moorhead & Griffin, 1989). A successful changebegins, when each of the above aspects is intervened in the changeprocess for effectiveness (Rothwell & Sullivan, 2005). The literaturerevealed that CMT is highly mediated by willingness and resistance(Kramer, 2007). As employees, today are more informed towards whatthey do and for what they are paid. Their savvy state is key to enforcean effective CMT (Smollan, 2017).
Willingness to Change
A factor that refers to the degree of readiness of achievingorganizational change (Armenakis & Bedeian, 1999). It is a behaviouralintention, depicted by an individual that triggers him towards optimisticacceptance for changing dimensions (Smollan, 2017) that is either natureof work, the practice of a process and even position (Metselaar, 1997).Willingness to change (WTC) can be promoted by effectivecommunication to employees, their participation in a change process,facilitating them to understand what the organization is going to do andfinally negotiating them based on their factors (Liao, Wayne, & Rousseau,2016) like attitude, age, designation, ability and commitment to work andorganization (Kramer, 2007).
resistance to Change
It is a factor that is opposite of WTC. It bisects change process and is
Hyder, S., Syed, S., and Memon, S. B.
40

about depicting employee pessimistic thoughts that bringing change willbring conflict for either their personal life (Metselaar, 1997) ororganizational position (Hiatt & Creasey, 2012). Moreover, psychologicalfactors like work stress, uncertainty in job issues, expertise effect as pergenerational difference (Smissen, Schalk, & Freese, 2013; Hyder, Syed,& Memon, 2019) and new work aspects would completely changedimensions of their PC after bringing change (Smollan, 2017). However,this is not so; RTC is supported by social factors(Freese, Schalk, &Croon, 2007) such as team involvement, trust (Hyder, Syed, & Memon,2019) and ambiguous informal meetings about change process must beavoided by managerial side (Luecke, 2003). It is no more than amisunderstanding of change context in employee mind that can bereinforced in optimism and reduced (Judson, 1991) by compensating theindividual desire towards WTC.
literature reVieW anD HYPotHesis
PC is an appropriate aspect of the working relationship (Rousseau,Hansen, & Tomprou, 2018) and human behaviour (Doornmalen, 2011).Notably, it emerged for the last two decades in organizations and iscontributing to the high significance of commitment (Coyle-Shapiro &Conwey, 2006). Keeping in view the insights of this variableorganizations today highly care and respect the contractual philosophy(Nery-Kjerfve & Wang, 2019) of what their employees think about workobligations (Maguire, 2003) assigned to them. This is what entitiesintend to consider employment PC when bringing a change. Theoreticalwork revealed that PC is in between an employee and employer (Kotter,1973) held by the employee to show optimism to his or job in responseto effective PC (Doornmalen, 2011). The optimism of individual triggershim or her towards added WTC and let him or her respond positively forCMT (Smollan, 2017; Rousseau, Hansen, & Tomprou, 2018).PC is aunique set of mutual expectations held by employees concerning theircommitments and claims (Sparrow & Cooper, 2003; Hyder, Syed, &Memon, 2019); that is why the organization is needed to rehearseeffectively CMT by endorsing employee's contribution (Guest, 1998),responsibility (Guest, 2004), exchange philosophy (Rousseau, 1989),promises & commitment (Schalk & Soeters, 2008), perceivedorganizational support (Coyle-Shapiro & Conwey, 2006), relationship(Kotter, 1973) and (Schein, 1965) and communication (Guest & Conway,2002). If an employee is more informed about PC, he would behave
Managing Change with an intervention of Psychological Contract
41

positively (Anderson & Schalk, 1998) and thus we can derive out thehypothesis as:
H1(a): PC is positively and significantly associated with CMT and WTC.
Different studies have put into context that PC is subjective (Hyder,Syed, & Memon, 2019) and holds more cognitive nature (Massingham,2013; Bankins, 2015) as it refers to individual expectations, beliefs andperception (Sparrow & Cooper, The Psychological Contract, 2003). Perhapsit may have a pessimistic response towards change when an employee isless informed about PC and this is what pushes him or her to behavenegatively (Griep & Vantilborgh, 2018). The hypothesis is thus drawn as:
H1(b): PC is negatively and significantly associated with RTC.
PC raises two aspects; first expectations are met called PC and secondexpectations are unmet called PCB (Robinson & Morrison, 2000). ThePCF refers to PC execution (Moore, 2014); where an individualperceives that his or her promises have been met (Coyle-Shapiro &Conwey, 2006). The perception here is a positive difference (Guest,2004) in actual versus expected outcomes. PCF is well-thought-out interms of trust and commitment towards the organization to ensureenhanced performance (Aselage & Eisenberger, 2003), inspire employeetrust about future completion of promises (Guest & Conway, 2002) byaffiliation side and willingness to carry out new assignments (Griep &Vantilborgh, 2018). All it reflects and helps in the manipulation ofemployee attitude (Doornmalen, 2011) towards CMT and WTC. Thehypothesis is thus drawn as:
H2(a): PCF is positively and significantly associated with CMT and
WTC.
Moreover, it is generally observed that PCF minimizes negativeresponses like frustration, disappointment and irritation (Hyder, Syed, &Memon, 2019). It has the strength to achieve effective employee decisionsand choices for job roles (Turnley & Feldman, 1998). It is seen as anaspect of job support that transits a PC for years and years (Guest, 2004)and that will ultimately contribute in depicting a negative response to therefusal of change as per two-way contractual philosophy. Thus, hypothesisH2(b) can be suggested:
H2(b): PCF is negatively and significantly associated with RTC.
Psychological contract breach (PCB) refers to PC breaking or
Hyder, S., Syed, S., and Memon, S. B.
42

violation (Robinson & Morrison, 2000; Sutton & Griffin, 2004); wherean individual perceives that his or her promises have not been met(Griep & Vantilborgh, 2018). The perception here is a negativedifference in actual versus expected outcomes (Arain, Hameed, &Farooq, 2012). PCB is well-thought-out in terms of discrepancies andmisunderstandings found towards the organization that depicts repeatedemployee shock (Griep & Vantilborgh, 2018), denial of work,frustration and irritation (Rose, 1969) towards present or may be futureassignments. All it reflects is to say NO! to transformation by employeeattitude towards the change process. Thus, breaching of contractualphilosophy from one side will lead to breaching by others (Turnley &Feldman, 2000) and a hypothesis can be drawn for depressing relationin between two.
H3(a): PCB is negatively and significantly associated with CMT and
WTC.
PCB, if not considered maximizes negative responses (Griep &Vantilborgh, 2018) that will lead to disturbance or violation ofemployment contract held between two parties (Aselage & Eisenberger,2003). The perceptions for PCB can be minimized by focusing on PCFcentral points, negotiations (Liao, Wayne, & Rousseau, 2016) anddiscussions with employees (Robinson & Morrison, 2000), so that tominimize the chances of RTC in an organization but on the other sidebreaching of contract at all levels leads to constructive support for RTC(Griep & Vantilborgh, 2018) and a hypothesis can be drawn as:
H3(b): PCB is positively and significantly associated with RTC.
The intervention of PC is a response of an employee for changecommitment (Maguire, 2003). It holds a good behavioural contribution(Lewin, 1947) of an employee and employer towards CMT as it considersboth parties for work arrangements, interaction (Guest & Conway, 2002),shared responsibility, mutual inducements (Rousseau, Hansen, &Tomprou, 2018) and even inspiration of trust (Rousseau, 1989) thatprovides individual commitment (Luecke, 2003) in bringing change in anorganization (see exhibit 1). The intervention also assists in erasingdistance and forming loyal relations between two (Liao, Wayne, &Rousseau, 2016) with respect and understanding (Rousseau, 1989). Itallows leaders or facilitators of change to balance and direct change in anorganization (Doornmalen, 2011; Smollan, 2017).
Managing Change with an intervention of Psychological Contract
43
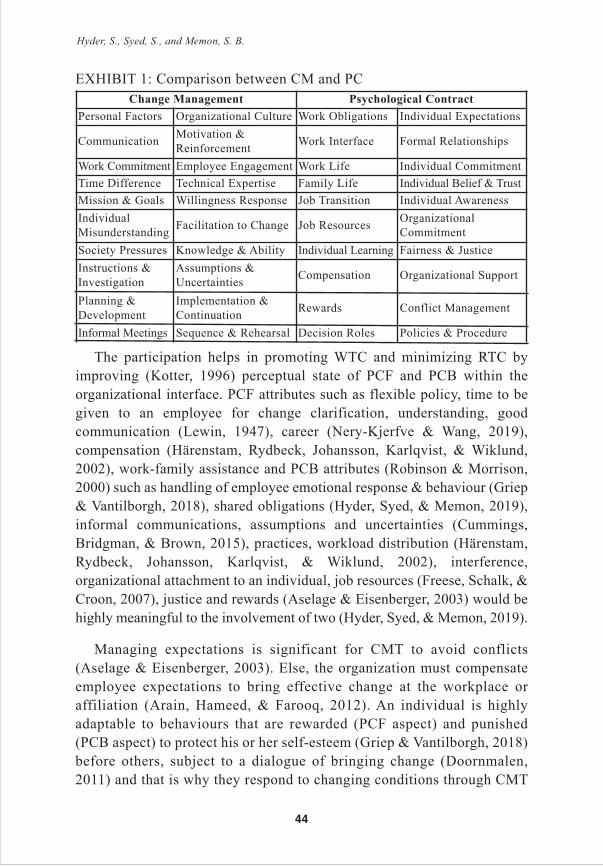
EXHIBIT 1: Comparison between CM and PC
The participation helps in promoting WTC and minimizing RTC byimproving (Kotter, 1996) perceptual state of PCF and PCB within theorganizational interface. PCF attributes such as flexible policy, time to begiven to an employee for change clarification, understanding, goodcommunication (Lewin, 1947), career (Nery-Kjerfve & Wang, 2019),compensation (Härenstam, Rydbeck, Johansson, Karlqvist, & Wiklund,2002), work-family assistance and PCB attributes (Robinson & Morrison,2000) such as handling of employee emotional response & behaviour (Griep& Vantilborgh, 2018), shared obligations (Hyder, Syed, & Memon, 2019),informal communications, assumptions and uncertainties (Cummings,Bridgman, & Brown, 2015), practices, workload distribution (Härenstam,Rydbeck, Johansson, Karlqvist, & Wiklund, 2002), interference,organizational attachment to an individual, job resources (Freese, Schalk, &Croon, 2007), justice and rewards (Aselage & Eisenberger, 2003) would behighly meaningful to the involvement of two (Hyder, Syed, & Memon, 2019).
Managing expectations is significant for CMT to avoid conflicts(Aselage & Eisenberger, 2003). Else, the organization must compensateemployee expectations to bring effective change at the workplace oraffiliation (Arain, Hameed, & Farooq, 2012). An individual is highlyadaptable to behaviours that are rewarded (PCF aspect) and punished(PCB aspect) to protect his or her self-esteem (Griep & Vantilborgh, 2018)before others, subject to a dialogue of bringing change (Doornmalen,2011) and that is why they respond to changing conditions through CMT
Change Management Psychological Contract
Personal Factors Organizational Culture Work Obligations Individual Expectations
CommunicationMotivation &Reinforcement
Work Interface Formal Relationships
Work Commitment Employee Engagement Work Life Individual Commitment
Time Difference Technical Expertise Family Life Individual Belief & Trust
Mission & Goals Willingness Response Job Transition Individual Awareness
IndividualMisunderstanding
Facilitation to Change Job ResourcesOrganizationalCommitment
Society Pressures Knowledge & Ability Individual Learning Fairness & Justice
Instructions &Investigation
Assumptions &Uncertainties
Compensation Organizational Support
Planning &Development
Implementation &Continuation
Rewards Conflict Management
Informal Meetings Sequence & Rehearsal Decision Roles Policies & Procedure
Hyder, S., Syed, S., and Memon, S. B.
44
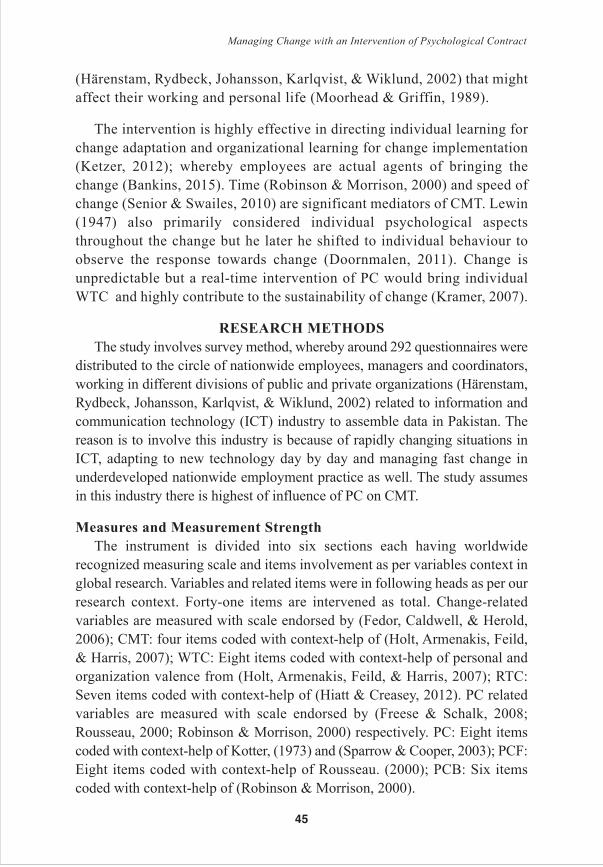
(Härenstam, Rydbeck, Johansson, Karlqvist, & Wiklund, 2002) that mightaffect their working and personal life (Moorhead & Griffin, 1989).
The intervention is highly effective in directing individual learning forchange adaptation and organizational learning for change implementation(Ketzer, 2012); whereby employees are actual agents of bringing thechange (Bankins, 2015). Time (Robinson & Morrison, 2000) and speed ofchange (Senior & Swailes, 2010) are significant mediators of CMT. Lewin(1947) also primarily considered individual psychological aspectsthroughout the change but he later he shifted to individual behaviour toobserve the response towards change (Doornmalen, 2011). Change isunpredictable but a real-time intervention of PC would bring individualWTC and highly contribute to the sustainability of change (Kramer, 2007).
researCH MetHoDs
The study involves survey method, whereby around 292 questionnaires weredistributed to the circle of nationwide employees, managers and coordinators,working in different divisions of public and private organizations (Härenstam,Rydbeck, Johansson, Karlqvist, & Wiklund, 2002) related to information andcommunication technology (ICT) industry to assemble data in Pakistan. Thereason is to involve this industry is because of rapidly changing situations inICT, adapting to new technology day by day and managing fast change inunderdeveloped nationwide employment practice as well. The study assumesin this industry there is highest of influence of PC on CMT.
Measures and Measurement strength
The instrument is divided into six sections each having worldwiderecognized measuring scale and items involvement as per variables context inglobal research. Variables and related items were in following heads as per ourresearch context. Forty-one items are intervened as total. Change-relatedvariables are measured with scale endorsed by (Fedor, Caldwell, & Herold,2006); CMT: four items coded with context-help of (Holt, Armenakis, Feild,& Harris, 2007); WTC: Eight items coded with context-help of personal andorganization valence from (Holt, Armenakis, Feild, & Harris, 2007); RTC:Seven items coded with context-help of (Hiatt & Creasey, 2012). PC relatedvariables are measured with scale endorsed by (Freese & Schalk, 2008;Rousseau, 2000; Robinson & Morrison, 2000) respectively. PC: Eight itemscoded with context-help of Kotter, (1973) and (Sparrow & Cooper, 2003); PCF:Eight items coded with context-help of Rousseau. (2000); PCB: Six itemscoded with context-help of (Robinson & Morrison, 2000).
Managing Change with an intervention of Psychological Contract
45

reliability and Validity
Internal consistency for the construct was checked with the computation ofalphas (Cronbach, 1951). exhibit 2 depicts the reliability of the instrument formodel evaluation; almost all of the Cronbach alpha values are above 0.70(Nunnally, 1978). Yet, values that tend to remain at the lowest of 0.35 are foundto be acceptable for measurement (Roberts & Wortzel, 1979) to uphold theprofessional meaning of constructs. AMOS based confirmatory factor analysis(CFA) were used to examine the validity of construct by assessing the percentageof total explained variance per dimension (Jöreskog & Sörbom, 1986; Jackson,Gillaspy, Jr, & Purc-Stephenson, 2009). The alpha values reported are higherthan 0.5 that indicates the acceptance of instrument survey validity of construct(Hair, Tatham, Anderson, & Black, 1998). However, exploratory factor analysiswas not preferred over confirmatory factor analysis so that to stay dependent oncontent validity rather than possible structures and their priorities; that ultimatelyensures the adequacy of concept and its items-set (Sekaran & Bougie, 2013).
EXHIBIT 2: Construct’s Internal Consistency
Data analYsis
The relationships for unlike perceptions (Bankins, 2015) andorganizational intentions involve the assumption of structural equationmodels (SEM) (Turnley & Feldman, 2000) or simply latent variable models(Hair, Tatham, Anderson, & Black, 1998) is used with the help of maximumlikelihood estimation (MLE) and AMOS (Jöreskog & Sörbom, 1986). SEMis almost effective at testing the models that are path-analytic with theintervention of several variables (Freese, Schalk, & Croon, 2007) and containunderlying constructs that use multiple items to be measured (Luna‐Arocas& Camps, 2007). MLE is used because departure tests from skewness,normality and kurtosis for all the variables involved were inside satisfactorystatistical limits (Klein & Moosbrugger, 2000). Additionally, the 292 samplesize in this study pertains to the range of 100 to 200 to use MLE procedures.
The overall model fitness was assessed with the reference to (Bollen,
Construct alpha (Cronbach) Variance explained (%)
Psychological Contract 0.821 0.041
Psychological Contract Fulfilment 0.881 0.250
Psychological Contract Breach 0.678 0.280
Change Management 0.583 0.032
Willingness to Change 0.872 0.220
Resistance to Change 0.821 0.019
Hyder, S., Syed, S., and Memon, S. B.
46

1989) for examining the multiple indices with a possibility of model fit toremain adequate on the single index but may be inadequate on numerousothers. Chi-square and the normed chi-square tests, the GFI (goodness of fitindex) and examination of root mean squared error of approximation(RMSEA) were used (Jöreskog & Sörbom, 1986; Turnley & Feldman, 2000).
Insignificant Chi-square (i-e p > 0.05) points to an adequate presentation ofthe all-inclusive set of relationships in the proposed model. But, for significantchi-square and high numerical degree of freedom, the worth of normed chi-square (either chi-square value or degree of freedom) may be used. The mostelastic acceptance value of normed chi-square must not be greater than 5, butcarefully it may rise above 3 (Pedhazur & Schmelkin, 1991). The GFI indexshould not drop down below 0.70 in a situation of complex models (Judge &Hulin, 1993). The RMSEA appraise the model fitness with the reference toeither correlation matrix or population covariance and RMSEA value below0.08 depicts a good approximation. Moreover, the CFI (comparative fit index)(Bentler, 1990) and NFI (normed fit index) (Bentler & Bonett, 1980) were alsoused, to investigate the study structure that best suits empirical data. The above-mentioned indexes should not drop below 0.90, but in a situation of complexmodels, 0.80 is the lowest-acceptable level for CFI and NFI (Hart, 1994).
EXHIBIT 3: Path Model
Managing Change with an intervention of Psychological Contract
47

The path diagram for proposed CMT and PC intervention model isdepicted in exhibit 3. The circles symbolize the connected perceivedvariables. The arrows indicate perceived variables that establish aconnection in latent and corresponding variables. The numeric that isallocated to each arrow display important standardized estimatedcoefficients. By referring to the intervention model, path analysis andmultivariate analysis were involved to associate theorized relationships(i.e. H1, H2….H3) between offered variables. Besides, the overall fitnessof the model was also examined. The study results confirm the structuralrelationship between CMT and PC factors with the significance of p-value< 0.05. The chi-square (χ2) displays model goodness.
EXHIBIT 4: Hypothesis Testing Results
* Gamma (�), ** t ≥ 1.96, *** p ≤ 0.05
The impact of study factors as shown in exhibit 4 with theirsignificance and acceptance. H1(a), H2(a) and H3(b) are supported andH1(b), H2(b) and H3(a) are not supported. The results, however,involves that the assumed relationships between PC, PCF and PCB havea significant impact on CMT and its inclined variables.The goodness-of-fit indexes confirms the validity measure of operational model withChi-Square = 1.907, RMSEA = 0.015, NFI = 0.878, CFI = 0.908 andGFI = 0.958; Even though flexible RMSEA and GFI levels wereattained. Before concluding to results, it is to be noted that all possiblepaths to link demographics with CMT and PC, the results are partiallysignificant. Further, concerning above results, following considerationsare drawn keeping in view the base status of γ and extendedconsideration towards t- value and p-value for hypotheses: Theassociation of PC is high towards CMT (γ =0.77) and lowest towardsWTC (γ =0.49) but positive and significant supporting H1(a) and lowest
Hypothesis Path association * γ **t-value ***p-value result
H1(a) CMT ← PC + 0.77 6.54 0.000 Supported
WTC ← PC + 0.49 3.32 0.002 Supported
H1(b) RTC ← PC - 0.50 1.17 0.378 Not Supported
H2(a) CMT ← PCF + 0.19 10.83 0.005 Supported
WTC ← PCF + 0.12 2.43 0.033 Supported
H2(b) RTC ← PCF - 0.12 0.98 0.481 Not Supported
H3(a) CMT ← PCB - 0.25 1.27 0.732 Not Supported
WTC ← PCB - 0.48 0.74 0.559 Not Supported
H3(b) RTC ← PCB + 0.49 6.64 0.004 Supported
Hyder, S., Syed, S., and Memon, S. B.
48

towards RTC (γ =0.50) and negative rejecting H1(b). The associationof PCF is lowest towards CMT (γ =0.19) and WTC (γ =0.12) butpositive and significant supporting H2(a) and lowest towards RTC (γ=0.12) and negative rejecting H2(b). The association of PCB is lowesttowards CMT (γ =0.25) and moderate towards WTC (γ =0.48), negativeand not significant rejecting H3(a) and moderate towards RTC (γ =0.49)and positive supporting H3(b).
DisCussion
The study completely revolved around the following question: To what
extent does content of employee psychological contract influence the
content of change management? The overall influence of the content ofPC to CMT is significant (Freese & Schalk, 2008; 1997; Pate, Martin, &Staines, 2000; Doornmalen, 2011; Turnley & Feldman, 1998). But themediating relationship for fulfillment or breach of the contract is partiallysupporting (Guest, 2004; Pate, Martin, & Staines, 2000; Hall & Moss,1998; Schalk & Freese, 2002) to study propositions. The results in Exhibit4 reveals that the hypotheses are partly confirmed. H1(a) and H1(b)provides that the association of PC towards the content of CMT and WTCis positive and significant (Schalk & Freese, 2002) but towards RTC isnegative and not significant (Pate, Martin, & Staines, 2000). This impliesby the confirmation of this study that the PC has higher grassroots(γ=0.77) embedded in CMT content(Rousseau & Tijoriwala, 1998),describing that the employee PC and his commitment (Coyle-Shapiro &Conwey, 2006) towards the organization and work obligations(Rousseau,Hansen, & Tomprou, 2018) can have better outcomes for CMT(Massingham, 2013) and WTC (γ =0.49), depending on the up-to-whatextent the employer's obligations towards employees are fulfilled (Herriot,Manning, & Kidd, 1997). Moreover, the same type of employees has noresistant force (γ =0.50) towards bringing the change in an organizationor work practice (Doornmalen, 2011).
H2(a) and H2(b) provides that the association of PCFtowards contentof CMT and WTC is positive and significant but towards RTC isnegative(Freese, Schalk, & Croon, 2007) and not significant(Härenstam,Rydbeck, Johansson, Karlqvist, & Wiklund, 2002). This implies that thefulfilment of the contract by employer side consistently leads to theoptimism of the employee(Kotter, 1973) and far longer towards theoptimism for bringing radical and meaningful changes(Nery-Kjerfve &Wang, 2019) that may ensure and strengthen the formal relationship in
Managing Change with an intervention of Psychological Contract
49

between the organization and its performance(Doornmalen, 2011). Thefulfilment of the contract by parties have fruitful results at all for both andnevertheless inverse in the case of RTC (Bankins, 2015). In Pakistan, thestatistics are not so good (γ =0.19, 0.12 & 0.12) but it is confirmed in theresults of this study as per the different studies have revealed andendorsed.
Additionally, the organization must rehearse the effective CMT(Smollan, 2017) by endorsing employee’s contribution (Guest, 1998),responsibility (Guest, 2004), exchange philosophy (Rousseau, 1989),promises and commitment (Schalk & Soeters, 2008), perceivedorganizational support (Coyle-Shapiro & Conwey, 2006), relationship(Kotter, 1973; Schein, 1965) and finally communication (Guest &Conway, 2002) in organization. The fulfilment of the contract may havea confident and favourable response by the employee side (Hyder, Syed,& Memon, 2019; Anderson & Schalk, 1998) towards the change processwhen an employee is more informed about the contractual philosophyand change precedents and their outcomes for the organization andemployee him or herself(Härenstam, Rydbeck, Johansson, Karlqvist, &Wiklund, 2002).
H3(a) and H3(b) provides that the association of PCB towards thecontent of CMT and WTC is negative (Doornmalen, 2011)and notsignificant but towards RTC is positive and significant (Turnley &Feldman, 1998). This implies that the breaching of the contract byemployer side surely leads to negativism of the employee(Kotter, 1973)and far longer towards the negativism for bringing radical and meaningfulchanges to organization or work and it may severely harm the organizationand its performance(Turnley & Feldman, 2000). The breaching of thecontract by parties has worsening results at all for both (Arain, Hameed,& Farooq, 2012). In Pakistan, the statistics confirm the same. Rationally,the same leads to bringing increased numeric (γ = 0.25, 0.48 &0.49) forRTC in an organization.
When a contract is violated and the employee is betrayed; he or shefeels aggressive and frustrated towards the organization for how he istreated (Turnley & Feldman, 1998; 2000). The employee perceives thatthe organization has violated the deal in terms of commitments, jobsecurity (Herriot, Manning, & Kidd, 1997) and individual development(Pate, Martin, & Staines, 2000). At large, the breaching of the contract has
Hyder, S., Syed, S., and Memon, S. B.
50

a pessimistic and stressful response by the employee side towards theorganization and the change process (Sutton & Griffin, 2004; Hyder, Syed,& Memon, 2019).
Employees are subject to reduce their responsibilities when anorganization increases change (Freese, Schalk, & Croon, 2007) but wefind something similar to outcomes of Rousseau (1995) that the responseof an employee during changing time depends on his or her personality,situation and structure of change process (Schalk & Freese, 2002). Thoughthe change creates uncertainty (Doornmalen, 2011) but employees forwhom the content of the contract is fulfilled will behave positively towardschange (Rousseau D. M., 1995). It is further explained that every singleemployee behaves and responds differently when the content of a contractis violated or breached (Smissen, Schalk, & Freese, 2013; Bankins, 2015). It also prevails in decreasing the role of the employee in the form offeeling changed in fulfilment of their formal obligations towards theorganization (Freese & Schalk, 2008).
ConClusion
PC is a subject line of commitments and promises (Sutton & Griffin,2004; Hyder, Syed, & Memon, 2019) their fulfillment and extent offulfillment by both of the parties is a facilitating footstep towards bringingeffective change in an organization (Anderson & Schalk, 1998). Further,the factors such as work responsibility, workplace environment (Schalk &Freese, 2002) and support (Moorhead & Griffin, 1989), identification ofemployee capabilities, spending in employee skill development (Turnley& Feldman, 1998), nature of work, practice of a process, even position(Metselaar, 1997) and a good-fit measuring reward-system are the keygadgets to promote WTC among employees to support CMT (Freese,Schalk, & Croon, 2007; Rothwell & Sullivan, 2005; Massingham, 2013).
PC is related to CMT in different forms; primarily it is quite dynamicin nature (Rousseau & Tijoriwala, 1998) that completely relies onrequirement of parties(Rousseau, Hansen, & Tomprou, 2018). It is alteredin the mind of an employee by change adaptation practice as per the lineof employer's obligations fulfilment (Herriot, Manning, & Kidd, 1997).Employees tend to form unspoken that are silent expectations aboutchange process (Coyle-Shapiro & Conwey, 2006). The need is to becautious for reverse and adverse effects in managing PC in theperseverance of CMT (Smissen, Schalk, & Freese, 2013). The enforcement
Managing Change with an intervention of Psychological Contract
51

and fulfilment of PC by organization proves to be the respect-giving factorto employees (Pate, Martin, & Staines, 2000; Doornmalen, 2011) and inreturn, employees tend to bond the organization as a better workplace(Anderson & Schalk, 1998) and perceive that the organization completelyinteracts them for PC changings (Smissen, Schalk, & Freese, 2013). Thisperceived interaction leads to shared work responsibility amongemployees at the workplace (Herriot, Manning, & Kidd, 1997). Employeesin this kind of favourable working environment compromise to changingsituations (Bankins, 2015) and this is exactly where the point intersectsand balances the line of expectations and inducements for employees intheir work contribution (Turnley & Feldman, 1998; Hyder, Syed, &Memon, 2019). This is how an organization can better manage andrehearse change through inspiring employee trust in a justified and fairworking environment (Pate, Martin, & Staines, 2000).
It can be concluded that the organization must identify, plan, implementand reinforce change and have enough information for CMT for effectiveoutcomes (Massingham, 2013; Schalk & Freese, 2002). Employeesperceive that change improves organizational and job efficiency(Freese,Schalk, & Croon, 2007). Employees are ready to behave positively upondifferent situations such as, when they trust their organization (Anderson& Schalk, 1998) they perceive change is completely communicated tothem and is an opportunity for them, they are given the training for changeadaptation and participation in the change process (Hall & Moss, 1998),change makes critical work process simple and easy forthem(Massingham, 2013) and finally it proves itself a gadget ofdifferentiating future and present from past (Rousseau, 1995). It can besimply stated that employees tend to change when they have fully receivedwhat they have expected in the contractual deal (Smissen, Schalk, &Freese, 2013). If all these situations hold untrue, then the employees resistchanging (Massingham, 2013). They feel stressful and uncertain in theircontractual deal (Smissen, Schalk, & Freese, 2013). They perceive thatthe change is troublemaking to organization and workplace(Massingham,2013) and it will surely be a conflicting state for the employees andorganization (Metselaar, 1997; Smollan, 2017).
Practical implications for Management
Certainly, the perpetual change in an organization (Cameron & Green,2009) depends on how the employees are going to react and rehearse it(Armenakis & Bedeian, 1999). As the literature exposed bringing change
Hyder, S., Syed, S., and Memon, S. B.
52

would change the employee expectations and commitments towards theorganization (Herriot, Manning, & Kidd, 1997); therefore, properindividual involvement and facilitation in CMT(Pate, Martin, & Staines,2000) either spoken or unspoken is required to make it successful in anorganization (Kramer, 2007). This is how the PC of an individual assist inimproving interpersonal behaviour of an organization and its employeesin promoting willingness and demoting RTC (Kramer, 2007). Besides this,the fulfilment of expectations and obligations in a contract (Freese, Schalk,& Croon, 2007) could be a sure source of establishing a competitive move(Smissen, Schalk, & Freese, 2013) through individual involvement(Dunphy & Stace, 1993).
The ADKAR model of (Hiatt & Creasey, 2012) to bring organizationalchange that has core PC dimensions is quite helpful in understanding themeaningful relationship for the intervention of PC towards CMT (Griep& Vantilborgh, 2018; Smissen, Schalk, & Freese, 2013). Improving thestate of employee level PC would surely bring positive outcomes (Turnley& Feldman, 1998) and improve the degree of readiness of achieving theorganization change (Armenakis & Bedeian, 1999). And this is possibleby negotiating with the employees for their factors (Smissen, Schalk, &Freese, 2013) like age, attitude, designation, ability, commitment (Pate,Martin, & Staines, 2000) to work and organization (Kramer, 2007), givingthem less work stress, uncertainty in job issues and no threat to theirsocial wellbeing or expertise (Schalk & Freese, 2002; Hyder, Syed, &Memon, 2019).
The PC holds a good behavioural contribution (Lewin, 1947) of anemployee and employer towards CMT in different aspects (Rousseau &Tijoriwala, 1998). It can lower the power distance between two inmanaging the change (Rousseau, 1989). Whereas; PCF and PCB hold agood and worse moral contribution in minds of the employee(Rousseau,1995) in an organization respectively for their consideration in CMT(Smissen, Schalk, & Freese, 2013; Bankins, 2015). PC is a source toreduce conflicts(Aselage & Eisenberger, Perceived organizational supportand psychological contracts: a theoretical integration, 2003). Itsinvolvement is highly meaningful (Rousseau, 1995) in directing theindividual learning for change adaptation (Hall & Moss, 1998) andorganizational learning for change implementation (Ketzer, 2012; Schalk& Freese, 2002).
Managing Change with an intervention of Psychological Contract
53

The study has used a general set of PC, and its aspects related to CMTand its dimensions. A more comprehensive list of the contents for PCconcerning CMT can be explored through qualitative study (Rousseau &Tijoriwala, 1998). The study has focused on individual employees in aspecific industry of Pakistan that may prevail in cultural and socio-economic differences in environment for researchers that evidences futureexamination in this area.
Hyder, S., Syed, S., and Memon, S. B.
54

referenCes
Anderson, N., & Schalk, R. (1998). The psychological contract inretrospect and prospect. Journal of Organizational Behavior, 19,637-647.
Arain, G. A., Hameed, I., & Farooq, O. (2012). Integrating WorkplaceAffect With Psychological Contract Breach and Employees’Attitudes. Global Business and Organizational Excellence,
31(06), 50-62.
Armenakis, A. A., & Bedeian, A. G. (1999). Organizational Change: AReview of Theory and Research in the 1990s. Journal of
Management, 25(03), 293-315.
Aselage, J., & Eisenberger, R. (2003). Perceived organizational supportand psychological contracts: a theoretical integration. Journal of
Organizational Behavior, 24, 491-509.
Bankins, S. (2015. A process perspective on psychological contractchange: Making sense of, and repairing, psychological contractbreach and violation through employee coping actions. Journal
of Organizational Behavior, 36(08), 1071–1095.
Bentler, P. M. (1990). Comparative Fit Indexes in Structural Models.Psychological Bulletin, 107, 238 - 246.
Bentler, P. M., & Bonett, D. G. (1980). Significance Tests and Goodness-of-Fit in the Analysis of Covariance Structures. Psychological
Bulletin, 88(03), 588 - 606.
Bollen, K. A. (1989). Structural Equations with Latent Variables. JohnWiley & Sons, Inc.
Bullock, R. J., & Batten, D. (1985). It’s just a phase we’re going through:a review and synthesis of OD phase analysis. Group &
Organization Management, 10(04), 383-412.
Cameron, E., & Green, M. (2009). Organizational Change. In E. Cameron,& M. Green, Making Sense of Change Management 2nd ed., (97-138). London and Philadelphia: Kogan Page Limited.
Coyle-Shapiro, J. A. M., & Conwey, N. (2006). Exchange Relationships:
Managing Change with an intervention of Psychological Contract
55

Examining Psychological Contracts and PerceivedOrganizational Support. Journal of Applied Psychology, 90(04),774-781.
Cronbach, L. J. (1951, September). Coefficient Alpha and the InternalStructure of Tests. Psychometrika, 16(03), 297-334.
Cummings, S., Bridgman, T., & Brown, K. G. (2015). Unfreezing changeas three steps: Rethinking Kurt Lewin’s legacy for changemanagement. Human Relations, 01-29.
Dunphy, D., & Stace, D. (1993). The Strategic Management of CorporateChange. Human Relations, 46(08), 905-920.
Fedor, D. B., Caldwell, S. D., & Herold, D. M. (2006, Febraury). The effectsof organizational changes on employee commitment: A multi-levelinvestigation. Personnel Psychology, 59(01), 1-29.
Freese, C., & Schalk, R. (1997). Tilburgse Psychologisch ContractVragenlijst [Tilburg Psychological Contract Questionnaire].Tilburg: Tilburg University.
Freese, C., & Schalk, R. (2008). How to measure the psychologicalcontract? A critical criteria-based review of measures. South
African Journal of Psychology, 38(02), 269-286.
Freese, C., Schalk, R., & Croon, M. (2007). The impact of organizationalchanges on psychological contracts. Personnel Review, 40(04),404 - 422.
Galpin, T. J. (1996). The Change Management Process. In T. J. Galpin,The human side of change: A practical guide to organization
redesign (pp. 1-16). San Francisco, California, USA: Jossey-BassPublishers: Wiley.
Griep, Y., & Vantilborgh, T. (2018, January). Let’s get cynical about this!Recursive relationships between psychological contract breach andcounterproductive work behaviour. Journal of Occupational and
Organizational Psychology, 91(2), 421-429. doi:https://doi.org/10.1111/joop.12201.
Guest, D. E. (1998). Is the psychological contract worth taking seriously?
Hyder, S., Syed, S., and Memon, S. B.
56
Journal of Organizational Behavior, 19, 649-664.
Guest, D. E. (2004). The Psychology of the Employment Relationship: AnAnalysis Based on the Psychological Contract. Applied
psychology: an international review, 53(4), 541–555.
Guest, D. E., & Conway, N. (2002). Communicating the PsychologicalContract: An Employer Perspective. Human Resource Management
Journal, 12(02), 22-38.
Hair, J. F., Tatham, R. L., Anderson, R. E., & Black, W. (1998).Multivariate Data Analysis with Readings (05 ed.). USA: Pearson.
Hall, D. T., & Moss, J. E. (1998). The New Protean Career Contract:Helping Organizations and Employees Adapt. Organizational
Dynamics, 26(03), 22 - 37.
Härenstam, A., Rydbeck, A., Johansson, K., Karlqvist, M., & Wiklund, P.(2002). Work Life and Organizational Changes and How Theyare Perceived by the Employees. In K. Isaksson, C. Hogstedt, C.Eriksson, & T. Theorell, Health Effects of the New Labour
Market (105-117). Springer Link.
Hart, P. M. (1994, June). Teacher quality of work life: Integrating workexperiences, psychological distress and morale. Journal of
Occupational and Organizational Psychology, 67(2), 109 - 132.
Herriot, P., Manning, W. G., & Kidd, J. M. (1997, June). The Content ofthe Psychological Contract. British Journal of Management,
08(02), 151–162.
Hiatt, J. M., & Creasey, T. J. (2012). Change Concepts. In J. M. Hiatt, &T. J. Creasey, Change Management - The People Side of Change
(13-49). Prosci Learning Center Publications.
Holt, D. T., Armenakis, A. A., Feild, H. S., & Harris, S. G. (2007). Readinessfor Organizational Change: The Systematic Development of aScale. Journal of Applied Behavioral Science, 43, 232-255.
Hyder, S., Syed, S., & Memon, S. B. (2019). Individual LevelGenerational Differences in the Development of PsychologicalContract: the Case of Pakistan. Journal of Business Strategies,
Managing Change with an intervention of Psychological Contract
57

13(01), 19 – 44. doi:10.29270/Jbs.2019.13.1
Judge, T. A., & Hulin, C. L. (1993, December). Job Satisfaction as aReflection of Disposition: A Multiple Source Causal Analysis.Organizational Behavior and Human Decision Processes,
56(03), 388 - 421.
Judson, A. S. (1991). Changing Behavior in Organizations: MinimizingResistance to Change. In A. S. Judson, Changing Behavior in
Organizations: Minimizing Resistance to Change. Business:Blackwell.
Kanter, R. M., Stein, B. A., & Jick, T. D. (2003). The “Big Three” Modelof Change. In R. M. Kanter, B. A. Stein, & T. D. Jick, Challenge
of Organizational Change: How Companies Experience it And
Leaders Guide it (pp. 03-17). The Free Press.
Ketzer, S. (2012). Why championing change? A research on the antecedents
of transformational leadership behavior in the context of
organizational change. (Master Thesis), The Netherlands:University of Twente, Faculty of Behavioral Sciences.
Klein, A., & Moosbrugger, H. (2000). Maximum likelihood estimation oflatent interaction effects with the LMS method. Psychometrika,
65(04), 457 - 474.
Kotter. (1973). The Psychological Contract: Managing the joining-upprocess. California Management Review, 15(3), 91-99.
Kramer, E. L. (2007). Using Lewin’s model of change as a basis for
organizational change. Tilburg University. Tilburg University.Lewin, K. (1947). Frontiers in Group Dynamics: Channels of Group Life;
Social Planning and Action Research. Human Relations, 01(02),143-153.
Liao, C., Wayne, S. J., & Rousseau, D. M. (2016, February). Idiosyncraticdeals in contemporary organizations: A qualitative and meta-analytical review. Journal of Organizational Behavior, 37(S1),S9 - S29. doi:10.1002/job.1959.
Luecke, R. (2003). Seven Steps to Change. In R. Luecke, Managing
Hyder, S., Syed, S., and Memon, S. B.
58

Change and Transition (31-50). Boston: Harvard BusinessReview Press.
Luna-Arocas, R., & Camps, J. (2007). A model of high performancework practices and turnover intentions. Personnel Review,
37(01), 26 - 46.
Maguire, H. (2003). The changing psychological contract: challenges andimplications for HRM, organisations and employees. Human
resource management: challenges and future directions, 87-103.
Massingham, P. (2013). The Relationship Between Contextual Factors,Psychological Contract, and Change Outcomes. Strategic
Change (Special issue: New Entrepreneurial Models), 157 - 173.
Metselaar, E. E. (1997). An overview of research on resistance to change.In E. E. Metselaar, Assessing the willingness to change (19-36).Amsterdam: Free University.
Moore, T. (2014). The impact of Psychological Contract Fulfillment on
Employee Engagement in the Millennial Generation: The Moderating
Effects of Generational Affiliation. Georgia State University, BusinessAdministration. Georgia: Georgia State University.
Moorhead, G., & Griffin, R. W. (1989). Learning, Perception andAttribution. In G. Moorhead, & R. W. Griffin, Organizational
Behavior (Second ed.). Boston, USA: Houghton MifflinCompany.
Moorhead, G., & Griffin, R. W. (1989). Organizational Change. In G.Moorhead, & R. W. Griffin, Organizational Behavior (Seconded., 701-726). Boston, USA: Houghton Mifflin Company.
Nery-Kjerfve, T., & Wang, J. (2019). Transfer from expatriate to localcontracts: a multiple case study of an unexpected careertransition. Human Resource Development international, 22(03),235 - 256. doi:https://doi.org/10.1080/13678868.2019.1570776.
Nunnally, J. C. (1978). Psychometric Theory. New York: McGraw-Hill.
Pate, J., Martin, G., & Staines, H. (2000). Exploring the relationship
Managing Change with an intervention of Psychological Contract
59
between psychological contracts and organizational change: aprocess model and case study evidence. Strategic Change,
09(08), 481 - 493.
Pedhazur, E. J., & Schmelkin, L. P. (1991). Measurement, Design, and
Analysis: An integrated Approach (Student Edition ed.). NewYork/London, USA/UK: Taylor and Francis.
Roberts, M. L., & Wortzel, L. H. (1979). New Life-Style Determinants ofWomen’s Food Shopping Behavior. Journal of Marketing,
43(03), 28-39.
Robinson, S. L., & Morrison, E. W. (2000). The Development ofPsychological Contract Breach and Violation: A LongitudinalStudy. Journal of Organizational Behavior, 21(05), 525-546.
Rose, K. (1969). Individual Change (Change Curve). In E. Cameron, &M. Green, Making Sense of Change Management Second ed.,(32-35). London and Philadelphia: Kogan Page.
Rothwell, W. J., & Sullivan, R. L. (2005). Models for Change. In W. J. Rothwell,& R. L. Sullivan, Practicing Organization Development, A Guide for
Consultants Second ed., (69-79). John Wiley & Sons, Inc.
Rousseau, D. M. (1989). Psychological and Implied Contracts in Organizations.Employee Responsibilities and Rights Journal, 02(02), 121–139.
Rousseau, D. M. (1995). Psychological contract in organizations.
Thousand Oaks: SAGE Publications, Inc.
Rousseau, D. M. (2000). Psychological Contract inventory: Technical
Report. Carnegie Mellon University, Pittsburgh, Pennsylvania.
Rousseau, D. M., & Tijoriwala, S. A. (1998). Assessing psychologicalcontracts: issues, alternatives and measures alternatives andmeasures. Journal of Organizational Behavior, 19 (SpecialIssue), 679 - 695.
Rousseau, D. M., Hansen, S. D., & Tomprou, M. (2018). A dynamic phasemodel of psychological contract processes. Journal of
Organizational Behavior, 39(9), 1081 - 1098. doi:https://doi.org/10.1002/job.2284.
Hyder, S., Syed, S., and Memon, S. B.
60

Schalk, R., & Freese, C. (2002). The Impact of Organizational Changeson the Psychological Contract and Attitudes Towards Work inFour Health Care Organizations. In K. Isaksson, C. Hogstedt, C.Eriksson, & T. Theorell, Health Effects of the New Labour
Market (129-143). Springer Link.
Schalk, R., & Soeters, J. (2008). Psychological Contracts around theGlobe: Cultural Agreements and Disagreements. In P. B. Smith,M. F. Peterson, & D. C. Thomas, The Handbook of Cross-
Cultural Management Research (pp. 117-135). SAGEPublications, Inc.
Sekaran, U., & Bougie, R. (2013). Research Methods for Business: A Skill-
Building Approach (06 ed.). John Wiley & Sons.
Senior, B., & Swailes, S. (2010). The Nature and Organizational Change.In B. Senior, & S. Swailes, Organizational Change (Fourth ed.,pp. 33-67). Essex, England: Pearson Education Limited.
Smissen, S. V., Schalk, R., & Freese, C. (2013). Contemporarypsychological contracts: How both employer and employee arechanging the employment relationship. Management Revue,
24(04), 309 - 327.
Smollan, R. K. (2017). Supporting staff through stressful organizationalchange. Human Resource Development international, 20(04),282-304. doi:https://doi.org/10.1080/ 13678868.2017.1288028.
Sparrow, P. R., & Cooper, C. L. (2003). New Generations: NewExpectations and New Problems. In P. R. Sparrow, & C. L.Cooper, The Employment Relationship Key challenges for HR
(44, 45, 59,). Butterworth-Heinemann, An imprint of Elsevier,Linacre House, Jordan Hill, Oxford.
Sparrow, P. R., & Cooper, C. L. (2003). The Psychological Contract. In P.R. Sparrow, & C. L. Cooper, The Employment Relationship Key
challenges for HR (28-52). Butterworth-Heinemann, An imprintof Elsevier, Linacre House, Jordan Hill, Oxford.
Sutton, G., & Griffin, M. A. (2004). Integrating expectations, experiences,and psychological contract violations: A longitudinal study of
Managing Change with an intervention of Psychological Contract
61

new professionals. Journal of Occupational and Organizational
Psychology, 77(04), 493 - 514.
Turnley, W. H., & Feldman, D. C. (1998). Psychological contractviolations during corporate restructuring. Human Resource
Management, 37(01), 71 - 83.
Turnley, W. H., & Feldman, D. C. (2000). Re-examining the effects ofpsychological contract violations: unmet expectations and jobdissatisfaction as mediators. Journal of Organizational Behavior,25 - 42.
Zimmer, E. (2015). Resistance to change: The bumpy way of a German
medium-sized enterprise in the industry of oil and natural gas
during its process of corporate re-structuring and change.
University of Twente; Technical University of Berlin.
Hyder, S., Syed, S., and Memon, S. B.
62

Business intelligenCe anD firM
PerforManCe: assessing Value anD
future DireCtions in Pakistani firMs
sumayya arshad* and Dr. Danish ahmed siddiqui**
aBstraCt
The purpose of study is to examine how Business
intelligence (Bi) enhances the firm’s performance in
Pakistani firms. Pakistan is a growing country and
Bi is supposed to be in its initial stages in Pakistan
while the data about Bi implementation and use in
Pakistani firms are also not many available,
especially in statistical patterns. Model and
questionnaire were adopted from Peters et al. (2016).
Bi system quality is based on Bi infrastructure,
functionality and self-service, that aids in getting a
more serious competitive advantage and increasing
firm performance by enhancing performance
measurement capabilities. Data is collected from 300
employees of varied firms in Karachi, where business
intelligence is being implemented. Outcomes were
analyzed through SEM-PLS. Results suggested that
Bi system quality enhances the performance
measurement capabilities, that raises the competitive
advantage and optimizing the firm carrying out.
Keywords: Bi Quality, Performance Measurement, Competitive Advantage, Firms
Performance.
introDuCtion
Background of the study
It has now-adays become the need for every organization to enforceBusiness Intelligence tools in their firms globally. At present, only thosefirms can live and enhance or keep up their offices which makes more useof technology in the right way. In Pakistan now the contest is also gettingon using BI tools and houses are shifting towards it.
Journal of Business Strategies, Vol.14, No.1, 2020, pp 63–98 DOi:10.29270/JBS.14.1(20).04
63
__________________________________________________________________________________*Research Scholar, Karachi University Business School, University of Karachi, Pakistan
**Associate Professor, Karachi University Business School, University of Karachi, Pakistan & Former Chairman.

BI is the processed pattern of data analytics that is used to arrive at adecision for any concern. Essentially, it is towards the decision making ofexecutive staff, higher management executives in any society. But inPakistan, currently, we don’t have BI implemented in many of theorganizations because it is evidently a new venture for many Pakistanifirms, but still, companies are implementing it and employing the toolslike Power BI, SAP, click sense, and they are doing wonders byimplementing BI in their respective clientele.
The process to implement business intelligence for any system isbroad. All forms of data are actually residing on multiple informationsources for example Share point, SAP, Oracle, SQL Server, and so onso, very first step all the data is actually integrated by shipping it into acentralized hub of data which is known as a data warehouse. Aftercreating this data warehouse where all the sources will integrate andactually shipping this information, dashboards or reports are constructedfor the executive management on the groundwork of the whole data ofthe system. Thus, these dashboards are actually the live reporting of thedata which is actually representing an obvious procedure. For example,Toyota Motors was facing the issue that when their supply chain or theirline of production get disturbed, there was no visibility where theproblem is actually residing so, they created a dashboard on which theexecutive management can see that how the production line is going onand in case of any problem at any point, for instance, if the problem isin supply chain or the warehouse or bar code or assembly line thedashboard can reflect the immediate condition or exact condition of thatpoint of time or assembly line so it figures out that where is the rootcause and they actually fix that problem at right time so, it fixes theproduction quality and improve the production quality through businessintelligence plus. In pharmaceuticals they are directly working onpredictive analysis and perspective analysis to forecast their upcomingquarterly sales, next year sale, this year’s closing sale and not only thesales and financial data, but they are also doing the whole warehousingand demand-supply, the supply chain concept using BI so they are themain ventures in which Pakistani companies are mainly working usingthe business word.
Globally organizations are using BI systems in firms of various sizes,as it help in enhancing functioning of organizations. Investment in BI
Arshad, S., and Siddiqui, D. A.
64

system implementation is increasing as the time is passing. Informationattained from BI system is more relevant and timely to deploy in strategiesand operations. It’s one of the challenge in implementation phase istechnical but it provides much business value.
It is easy for BI workers to work in global organizations. Moreover,most of the organizations that are working on this system do not sharemuch information for academic purposes and are reluctant because theyhave a fear of information leak to the competitors.
Problem statement
Organizations operating internationally do not conceive in theneighborhood of their hands, as their workers perform their businessesbeyond the edges. Thus, innovative systems are today getting interest inthe accumulation of information (BRAC, 2009).
As compared to other countries not much research is conducted inPakistan on the topic of BI, Khan et al. (2009).
Although, statistical data about BI is not a great deal available inPakistan and not about every sector of Pakistan. Because BIimplementation is now has become important for every business, but itsusage quality, implications, issues, the cost is not much availablestatistically.
Prior to the promotion of information technology (IT), it was nearlyimpossible to access the required information, hence businesses had tomostly rely on instincts. Investment in IT was focused on stand-aloneinformation Systems (IS) resulting in “islands of information” since theycould not be integrated with other IS. Mergers and acquisitionscomplicated the problem because the different companies were usingdifferent enterprise applications in carrying out the same function. It isevident firms in producing countries face constraints in areas such aseructation, expertise, and infrastructure (Melville et al., 2004).
The companies that implemented BI in Pakistan also don’t possess theresearch data to anticipate the future of their BI systems to adopt themeasures proactively and accordingly.
The focal point depend on worker capacity to take over arrangements.
Business intelligence and Firm Performance
65

gap analysis
Uncertainty exists on the link between IT contribution and firm’sperformance among researchers, hence the knowledge in this area remainsundeveloped and unsystematic (Melville et al., 2004; Ida et al., 2015;Vuksik & Popovic, 2013).
Previous researches shoes the factors that helps in successfulcompletion of BI and it’s impact on performance of related departmentssuch as supply chain. Some studies focus on leadership and culturenecessary to implement BI while others focus on organizationalcapabilities. Multiple publications explains BI benefits but still muchknowledge and information is needed to fill the gap.
Jourdan et al., (2008), describes the deficiencies of previous researchin utilization of organization resources for BI adoption. Moreover, BIcapabilities in relation to technical and operational aspects are also notdescribes in much research in elaborate manner. And above all, there is alack of scientific inquiry about the BI industry in Pakistan due to theunavailability of BI statistics and low expertise. A lot of the researchconducted globally in the field of BI does not focus on sensitivity aroundthe cultural component of BI user types as regards the uniqueness ofopinion in a particular state or area. Hence, the consideration of state-specific variance in study or opinion results on BI-related subjects holdsweight. So, to cover that gap, we aim to explore BI capabilities inPakistani firms.
research objectives
How BI quality enhances performance measurement practices,competitive advantage and strong performance in a growing nation likePakistan is surveyed. It is found that BI quality is dependent on BIII, BIF,and BISS. Alavi and Leidner’s (2001) suggested three dimensions of data,information, and knowledge, to relate BI quality. Theoretical model isexamined through a survey in which data is collected via questionnairefrom 300 employees of different firms, where commercial enterpriseintelligence is being implemented in Karachi. ted in Karachi. Results areanalyzed through SEM-PLS, which showed the positive association ofBI system quality with others.
research Question
1. How does BIII influence BIF?
Arshad, S., and Siddiqui, D. A.
66

2. How does BIF influence the BISS?3. What is the impact of BI quality on PMC? 4. How does the BI systems and PMC impact competitive advantage? 5. What is the relationship among Business intelligence and performanceof firms?
significance
This research will help us in exploring the role of BI in Pakistan andthe key drivers as well Khan, Amin, & Lambrou (2009). Our research willadd a piece of information on this topic and attaining more competitiveadvantage, and overall performance. This study is going to help in makingstrategies to implement BI in Pakistani organizations and also in thetechnical and operational decision making while implementing BI. As BIhas become the need of every organization today and in order to flourishand keep pace with existing technology it is indispensable.
literature reVieW
Bi infrastructure integration
Fast-paced technological challenges are faced by organizations. Tomeet those technological changes and arising issues strong infrastructurefor Business Intelligence is needed. Seufert & Shiefer (2005) studied thoseinfrastructure requirements and real-time business analytics integration inbusiness operations. Findings suggested that any deficiency in integrationas well results in inefficient outcomes. Architecture is also suggested thatcan salvage time and helps in making determinations.
Herschel & Jones (2005) emphasizes on the importance of integrationof BI. So, BI can be considered a Knowledge Management subset. BItechnologies are more mature, but BI needed a backup of knowledge baseand BI integration needs the right knowledge management as well.
BI implementation strategies and purpose are too studied byGangadharan and Swami (2004) and found that organizations always needaccess to information and monitoring of natural processes andperformance for hunting down an organization efficiently.
Bi functionality
Rouhani & Savoji (2016) examined the decision support organizationand its advantages for firms. The decision support organization is the corepart of BI. For seeing the connection between the decision support system,
Business intelligence and Firm Performance
67
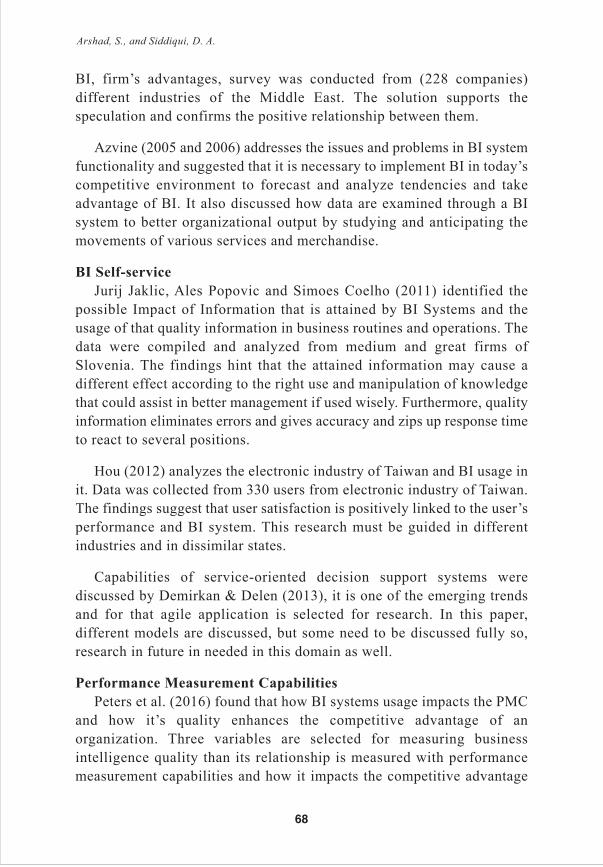
BI, firm’s advantages, survey was conducted from (228 companies)different industries of the Middle East. The solution supports thespeculation and confirms the positive relationship between them.
Azvine (2005 and 2006) addresses the issues and problems in BI systemfunctionality and suggested that it is necessary to implement BI in today’scompetitive environment to forecast and analyze tendencies and takeadvantage of BI. It also discussed how data are examined through a BIsystem to better organizational output by studying and anticipating themovements of various services and merchandise.
Bi self-service
Jurij Jaklic, Ales Popovic and Simoes Coelho (2011) identified thepossible Impact of Information that is attained by BI Systems and theusage of that quality information in business routines and operations. Thedata were compiled and analyzed from medium and great firms ofSlovenia. The findings hint that the attained information may cause adifferent effect according to the right use and manipulation of knowledgethat could assist in better management if used wisely. Furthermore, qualityinformation eliminates errors and gives accuracy and zips up response timeto react to several positions.
Hou (2012) analyzes the electronic industry of Taiwan and BI usage init. Data was collected from 330 users from electronic industry of Taiwan.The findings suggest that user satisfaction is positively linked to the user’sperformance and BI system. This research must be guided in differentindustries and in dissimilar states.
Capabilities of service-oriented decision support systems werediscussed by Demirkan & Delen (2013), it is one of the emerging trendsand for that agile application is selected for research. In this paper,different models are discussed, but some need to be discussed fully so,research in future in needed in this domain as well.
Performance Measurement Capabilities
Peters et al. (2016) found that how BI systems usage impacts the PMCand how it’s quality enhances the competitive advantage of anorganization. Three variables are selected for measuring businessintelligence quality than its relationship is measured with performancemeasurement capabilities and how it impacts the competitive advantage
Arshad, S., and Siddiqui, D. A.
68

of the firm. It is necessary to adopt it in this fast paced technological andcompetitive era.
Okkonen (2014) researched the triangle of performance measurement,knowledge management and BI systems which revealed that due to rapidlychanging market and technological environment, variety of new challengesand issues have arisen and to cope with the new technologies must beimplemented through proper knowledge management techniques, whileperformance measurement capabilities must be enhanced at the same timeby making appropriate use of BI systems. It was proven through resultsthat knowledge management, performance measurement and BI systemsare positively correlated with each other and best works in collaboration.
Vuksic Bach and Popovic (2013) critically took the interview frommanagers and employees of the banking and telecommunication sector. 4organizations are selected for data collection, 2 from telecommunicationand 2 from the banking sector where each is categorized as an earlyadopter or late adopter of BIS and BPM technology and their impact ontheir performance is measured accordingly. Interview questions are alsomade accordingly and on an organizational level not on functional at thedepartmental level. The results indicated that there is a need forcommitment by employees to improve the sales and business processes, afirm cannot solely rely on BIS and BPM for better productivity.
Competitive advantage
BI in SMEs is studied by Miyamoto (2014) by focusing on the role ofcompetitive forces in Japanese culture. For competitive advantage,Michael Porter’s five forces model is examined through the researchframework in SME’s, That how these five forces have the influence to gaincompetitive advantage along with the integration and application of BIsystems. The sample is gathered randomly through different databases ofJapanese businesses. The findings indicate that IT has becomeindispensable in carrying out each and every activity of the supply chainas it adds much value. Because of gaining competitive advantage, thecompany must offer something very timely and customer oriented that canbe possible only through technological channels.
firm’s Performance
The article by AlešPopovič, BorutPuklavec, Tiago Oliveira, (2018)focused on how BIS impacts the performance of the firm. Data was
Business intelligence and Firm Performance
69

collected from one hundred and eighty-one small and medium enterprisesand analyzed through PLS-SEM. The research findings revealed That BIShas a partial influence on performance of firms and BIS usage by managersand employees in a firm.
Caseiro (2018) is directly focused on BI with innovation and networklearning as a mediator. Data is collected from 228 European firms that arejust startup. The results of this research show that BI has a positive impacton all variables and organizational performance.
Arefin (2015) examines how organizational structure, processes,culture, and strategy influences the organizational performance andeffectiveness with BI as a mediator. Data is collected from two hundredand twenty-five organizations in Bangladesh. The research findingsindicated effectiveness along business intelligence system’s effectiveness.
tHeoretiCal fraMeWork
Business Intelligence systems are believed to be most usable and canbe termed as the need of the time. BI infrastructure integration can bereferred as data quality. BI functionality refers to the quality of theapplications that process data into in formation. BI self-service and inperformance measurement capabilities such information is mediatedcognitively. Then, in competitive advantage, which brings up to superiorbusiness unit performance as compare to competitors (Grafton et al.,2010). And in final stage, the effect on productivity and execution isvalued.
Bi Quality
BI infrastructure integration (BIII) refers to the processes andstructures of the database. BIII first connects primary data sources tothe structure. When BIII is “low”, data is not integrated inspreadsheets. When BIII is “high”, it is a “common” in databaseconfiguration.
BI functionality is the serviceability of an application for interactionand usage with other data (Peng, 2007). When BI functionality is “low”,reduced interaction occurs in spreadsheet. But, when BI functionality is“high”, interaction and speed also becomes fast (Ariav, 1992). Therefore,BI functionality provides ease of piloting as well as authentic and precisedata for use. Thus: H1. BI infrastructure integration BI
Arshad, S., and Siddiqui, D. A.
70

functionality.
The concept of self service is originated her that is the frequencyof private usage of a BI application (Hou, 2012). BI self-service is lowwhen managers use it lees because of less usage. And it is high whenit is used more frequently by managers.
It is observed from literature of other studies that BI functionalitytends to increases the self-service. Because when interface is efficientand features are user friendly, managers are more likely to use it againand again. And can rely on the data shown on dashboards. So, H2. BIfunctionality BI self-service.
Bi Quality & PMC
PMC (Performance measurement capabilities) shows how managersare using measurement tools to maintain or alter a business unit forenhancing performance. (Simons, 1995). PMC has two different styles,diagnostic or interactive which works with cybernetic feedback loopprocesses, which also links BI to PMC (Otley, 2012). According toHuber (1991) “entity learns if, through its processing of information,the range of its possible behaviors is changed” and “an organizationonly learns if any of its units acquire knowledge that it recognizes aspotentially useful to the system”, it links BI functionality with PMC.It leads to: H3. BI functionality performance measurementcapabilities.
When features are user friendly and easy to use then the self-servicewill be greater, that also increases the PMC because managers have moreinteraction with the system and dashboards, it will be easier for them tomeasure the performance. Shollo (2015). Thus: H4. BI self-service
performance measurement capabilities.
links to Competitive advantage
PMC must be capable to enhance competitive advantage. Data istransferred to all layers of power structure during performancemeasurement. Agreeing to the knowledge-based perspective, in whichresources are immobile and heterogeneously distributed amongstcompetitors, value creation can be a beginning of relatively persistentcompetitive advantage (Grant, 1996). As such: H5. Performancemeasurement competitive advantage.
Business intelligence and Firm Performance
71

links to firm’s Performance
Côrte (2017) discussed that gaining competitive advantage is the onlyway to sustain in the market, which can be attained by using data analyticstactfully which leads to better performance of the firm. It is clear if thecompany is not getting enough competitive advantage, then its underperforming or not matching the market criteria.
Researchers have bought forth various IT resources that can generatea competitive advantage. These resources include IT strategy, ITinfrastructure and IT human capital (Yogev et al., 2013). Melville et al.(2004) observed that when the correct IT is functional within the rightbusiness process, the outcome is increased organizational performance andimproved processes. According to Olszak (2014). Accordingly, the finalhypothesis is: H6. Competitive advantage firm’s performance.
As, BIII, BIF, and BISS provide the base for BI quality intheoretical model. BIF and BISS together have an impact onperformance measurement capability, which affects competitiveadvantage, which subsequently impacts on firm performance.
Figure 1 Theoretical Model
industry analysis
Many companies are using BI technology in Pakistan and as time passedmore firms are moving towards it because it’s the way to get a competitiveadvantage and in the future, it’s going to become a need. BI is not applied inmany of the firms in Pakistan and it is seemingly a brand new task for plentyof Pakistani firms, but still, businesses are imposing it and using it like Power
Arshad, S., and Siddiqui, D. A.
72

BI, SAP, click sense, and achieving their targets more effectively.
The BI system to put into effect for any enterprise intelligence forany endeavor is somehow extensive. All kinds of facts are lying onmultiple data resources for example Share Point, SAP, Oracle, SQLserver, and so on.
Toyota motors was dealing with the issue that when their supply chainor their line of production get disturbed, there was no visibility whereinthe problem is residing so, they created a dashboard on which the executivemanagement can see that how the production line is going on and in caseof any trouble at any point, as an instance if the trouble is in delivery chainor the warehouse or bar code or meeting line the dashboard can reflect theimmediate situation or exact condition of that point or assembly line so itwill help to find out that wherein the reason and that is really effective inrestoring that hassle at inappropriate time so, it helps in restoration of theissue and saving them time and cost and enhancing the performance.
Pakistani pharmaceuticals firms are currently working on the predictiveanalysis and perspective analysis to forecast their upcoming income, next12 months sale, this year’s ultimate sale and no longer only the sales andeconomic facts but they may be additionally managing the wholewarehousing and supply chain, etc. SAP also suggested various BIsystems, to compete globally (Gate, 2011).
MetHoDologY
sampling
300 responses are collected using convenience method of sampling fromPakistani employees, especially of Karachi are targeted in sampling, 130responses were collected online and 170 are collected on paper for analysis.
instrument
The questionnaire consists of two principal parts, Section A consists ofquestions regarding the demographics of a respondent, including age,gender, working experience, and professional level. The age limit givento have opted from the nominal scale is 21-30 years to 60 and above.Respondents are classified on gender bases as male and female. For settingthe working experience range is provided from more than one year to 16and above. While the professional level is encompassing non-managerialstaff as well as first-line, middle and top-level management respectively.
Business intelligence and Firm Performance
73

Section B is composed of 26 main questions to measure 6 variables byLikert scales of five point in which 26 main items are adapted, first fivequestions are to measure BI infrastructure integration (IV), five for BIfunctionality (IV), two for BI self- service (IV), five for performancemeasurement capabilities (DV), five for competitive advantage (DV) andfour for firm performance (DV). Respondents could agree or disagree onthe provided five-points Likert type scale.
The questions are designed accordingly for conducting research and toget the required information and provide feasibility to achieve theobjective of research.
Measurement scales
The table below shows independent and dependent variables in which26 items are adapted. Independent variable comprises of BI infrastructureintegration, BI functionality, BI self-service whereas Dependent Variablecomprises of performance management capabilities, competitiveadvantage and firm’s performance.
The five items of BI infrastructure integration (IV) were adapted fromthe source Lior Fink, Nir Yogev and Edir Even (2016). Five Items of BIfunctionality (IV), two items of BI self- service (IV), the five items ofperformance measurement capabilities (DV) were adapted from Peters(2016). Three points of competitive advantage (DV) are adopted fromPeters (2016) while the other 2 items are adopted from Schilke (2014).Firm’s Performance (DV) having 4 items that were adapted from ElbashirCollier, & Davern (2008).
Table 1: Measurement ScalesVariable Measument Sources Number of Items
Business IntelligenceInfrastructure
Computed by the Author Lior Fink,Nir Yogev and Edir Even (2016)
5
Business IntelligenceFunctionality
Peters (2016) 5
Business IntelligenceSelf Service
Peters (2016) 2
Performance ManagementCabilities
Peters (2016) 5
Competitive Advantage Peters (2016)Schilke (2014)
32
Firm’s Performance Elbashir (2008) 4
Arshad, S., and Siddiqui, D. A.
74

Data analYsis
Demographic information
Table 2: Respondents Profile
The demographic data indicates that our most of respondents are male,69% and female respondents are 41%. The most of the respondents, 74%are between 21 to 30 years of age, while 16.33% are from the age set of31 to 40 years. 5.33% are from the age group of 41 to 50, 3.33% are inbetween 51 to 60 years of age and 1% are 60 and above. The most ofrespondents, 50.33% have working experience of 1-5 years while 18.66%are giving birth experience of less than 1 year. 16% of respondents haveexperience of 6-10 years, 7.33% of respondents have experience of 11-15years and 7.67% of respondents have experience of 16 and above years.The professional level of respondents is non- managerial staff, first-coursemanagement, middle-stage management, top-level management that is16.67%, 40%, 32.33%, and 9% respectively.
name of Demographic Demographic features frequency Percentage
Age 21-30 222 74%
31-40 49 16.33%
41-50 16 5.33%
51-60 10 3.33%
60 and above 3 1%
Gender Male 207 69%
Female 93 31%
Experience Less than 1 year 56 18.66%
1-5 years 151 50.33%
6-10 years 48 16%
11-15 years 22 7.33%
16 and above 23 7.67%
Professional Level Non-managerial Staff 50 16.67%
First line management 120 40%
Middle level Management 103 34.33%
Top level Management 27 9%
Business intelligence and Firm Performance
75

Descriptive statistic
Table 3: Descriptive Statistic
Variables Questions
Descriptive stats Confirmatory factor analysis
Mean st.Dev.outer
loadingt stats P Values
Business IntelligenceInfrastructureIntegration
1 BIII1 4.127 0.961 0.842 33.313 0.000
2 BIII2 4.097 0.960 0.882 58.685 0.000
3 BIII3 4.103 1.023 0.790 23.534 0.000
4 BIII4 4.053 1.025 0.849 44.180 0.000
5 BIII5 4.167 0.927 0.805 27.580 0.000
Business IntelligenceFunctionality
6 BIF1 3.977 1.024 0.849 40.064 0.000
7 BIF2 3.977 0.978 0.851 49.608 0.000
8 BIF3 3.960 0.999 0.860 39.224 0.000
9 BIF4 3.970 1.008 0.850 38.796 0.000
10 BIF5 3.910 1.030 0.831 35.150 0.000
Business IntelligenceSelf- service
11 BIS1 3.860 0.891 0.887 45.358 0.000
12 BIS2 3.850 0.987 0.913 79.234 0.000
PerformanceManagementCapabilities
13 PMC1 3.907 0.882 0.739 22.535 0.000
14 PMC2 3.787 1.024 0.848 44.143 0.000
15 PMC3 3.870 0.905 0.770 24.750 0.000
16 PMC4 3.820 0.880 0.759 23.785 0.000
17 PMC5 3.837 0.893 0.728 18.280 0.000
CompetitiveAdvantage
18 CA1 3.887 0.942 0.811 32.756 0.000
19 CA2 3.850 0.984 0.842 37.056 0.000
20 CA3 3.817 0.985 0.859 45.154 0.000
21 CA4 3.837 0.961 0.828 30.450 0.000
22 CA5 3.803 0.975 0.816 29.542 0.000
Firm’s Performance 23 FP1 3.863 1.032 0.869 52.102 0.000
24 FP2 3.930 0.969 0.854 47.629 0.000
25 FP3 3.870 1.000 0.878 44.761 0.000
26 FP4 3.863 1.064 0.803 26.054 0.000
Arshad, S., and Siddiqui, D. A.
76

The board presents the mean and standard deviation of the variablesstarting it with BI quality that is our independent one, which has furthersplit up into three parts mediating BI Infrastructure Intelligence, BIFunctionality, BI Self-Service mediating the relationship between BIquality and firms’ performance whereas all three BI quality measures havegreater influence on Performance Management Capabilities i.e. Thevariable which enhances competitive advantage and enhancing firms’performance as a result. The mean of the variables mentioned above rangefrom 3.803 to 4.167 and SD from 0.880 to 1.064
Similarly, the mean of all the five items of the variable i.e. BIInfrastructure Intelligence range from 4.053 to 4.167 whereas SD 0.927to 1.025 There are five items of the mediator Performance ManagementCapabilities and all the value of the mean range from 3.820 to 3.907 andSD 0.880 to 1.024 Likewise, the five items from Competitive Advantageand their mean value range from 3.803 to 3.887 and SD range from 0.942to 0.985. Nevertheless, the firms’ performance, which is our dependentvariable, the mean and the SD value of all four items of a firm’sperformance are in the range 3.863 to 3.930 and 0.969 to 1.064
Concisely the most significant mean and SD are from the variable BIInfrastructure Intelligence BIII5 4.167 and SD 0.927 which clearly showsthat this item has more impact on BI quality and firms’ performance ascompared to other items, on the other hand, mean and SD of the variableCompetitive advantage CA5 3.803 and 0.975 which clearly revealed thatthis item has lowest mean.
In the above table, all the factor loadings of the variable’s items exceed0.05 range from 0.728 to 0.913, similarly, all the T values of the items areabove the desired value i.e. T>1.96 between 18.280 to 79.234 whereas Pvalues of the items are significant range i.e. P<0.01.
structural equation Modeling
We have used SEM for our research and Smart PLS. In addition, toassess the indirect and direct impacts testing was performed. The job of(SEM) is crucial for testing hypothesis and the bootstrapping and othercalculation methods. It used to assess the basic connection amongexogenous and endogenous factors. So as to check all immediate impacts,a strategy has been executed which is bootstrapping (Shrout, 2002).
Business intelligence and Firm Performance
77

Measurement of Outer Model
To find the reliability and validity, we performed a test of convergentvalidity and discriminant validity by using Smart PLS.
Factors Loading Significant
CFA is mentioned is descriptive analysis. Below 0.5 constructs are not necessaryto mention in table while constructs with the loading of 0.5 are considered as strong.
Reliability and Convergent Validity
For the core reliability and steadiness of data, we use Cronbach’s alpha byfollowing Anderson and Gerbing (1988) and for the validity as per Hair et al. (2006).
Table 4: Reliability & Convergent Validity
Table 6 shows the Cronbach’s value for BIII (0.890), BIF (0.903), BISS(0.766), PMC (0.828), CA (0.888), FP (0.874). Scales are reliable becausethey are above threshold of 0.70 Hair, (2010).
The composite reliability values are ranging from 0.87 to 0.93 whichexceeds the bound of 0.7 which is indicating towards its reliabilityBagozzi & Yi (1988).
The AVEs range from 0.593 to 0.810, which is greater than 0.5 henceshowing its reliability (Chin, 1998).
Discriminant Validity:
Table 5: Discriminant ValidityVariables Bif Biii Biss Ca fP PMC
Bif 0.848
Biii 0.776 0.834
Biss 0.701 0.636 0.900
Ca 0.662 0.644 0.601 0.831
fP 0.659 0.655 0.649 0.748 0.852
PMC 0.664 0.652 0.647 0.686 0.710 0.770
Cronbach’sAlpha
CompositeReliability
AVE
BI Infrastructure integration 0.890 0.919 0.696
BI functionality 0.903 0.928 0.720
BI self-service 0.766 0.895 0.810
Performance management capabilities 0.828 0.879 0.593
Competitive advantage 0.888 0.918 0.691
Firm’s Performance 0.874 0.913 0.725
Arshad, S., and Siddiqui, D. A.
78

Table shows that the discriminant validity is achieved as the values areless than 1 which illustrates that this term is easily matched.
Model fit Measures
The measurement model has a good fit.
Table 6: Model Fit
Hypothesis testing
Bootstrapping is done for the testing of hypothesis in SEM, it gives theconsistent and stable results. T values for structural model is obtainedthrough bootstrapping. Path diagram is shown in figure 2. At 95%confidence level where alpha is 0.05 shows that relation is strong and tvalue is greater than 1.96 and p value is less than 0.05.
structural Model
Figure 2: Structural Model
fit summary
saturated Model estimated Model
srMr 0.056 0.134d_uls 1.105 6.312d_g 0.524 0.651Chi-square 925.779 1.058369nfi 0.834 0.811
Business intelligence and Firm Performance
79

With the help of bootstrapping, all the extracted values (Table 5, pathcoefficient values and T statistics values of direct effects) clarify that BIinfrastructure integration (β = 0.778; t = 29.330), BI functionality (β = 0.702;t = 19.135), BI self service (β = 0.415; t = 7.104), performance measurementcapabilities (β = 0.356; t = 6.047), competitive advantage (β = 0.689; t =17.940) and Firm’s Performance (β = 0.748; t = 22.713) are having directpositive relationship, leading to the acceptance of all hypothesis.
Table 7: Path Coefficients & T Values
result
According to the table 9, all hypothesis from H1 to H6 are wellsupported as a positive and significant relationship is seen.
Table 8: Hypothesis Testing
In order to measure the significance, the H1, H2, H3, H4, H5, and H6were expressed as T=29.330, 19.135, 7.104, 6.047, 17.940 and 22.713respectively (T >1.96) whereas P<0.05.So, consequently, we are acceptingthese hypotheses as well since all values meeting the criteria.
As shown in table 9, It is found that BIII has a positive associationwith BIF which is consistent with H1. Whereas, BIF has a positiveassociation with both BISS and PMC that are consistent with H2and H3 respectively. Subsequently, PMC have a positive associationwith both BIF and BISS, which is consistent with H4 and the PMC
original
sample (o)
sample Mean
(M)
standard
Deviation
(stDeV)
t statistics
(|o/stDeV|)
Biii ––––> Bif 0.776 0.778 0.026 29.330
Bif ––––> Biss 0.701 0.702 0.037 19.135
Bif ––––> PMC 0.415 0.415 0.058 7.104
Biss ––––> PMC 0.356 0.356 0.059 6.047
PMC ––––> Ca 0.686 0.689 0.038 17.940
Ca ––––> fP 0.748 0.748 0.033 22.713
Hypothesis Constructs t statistics (|o/stDeV|) P Values status
1 Biii ––––> Bif 29.330 0.000 Accept
2 Bif ––––> Biss 19.135 0.000 Accept
3 Bif ––––> PMC 7.104 0.000 Accept
4 Biss ––––> PMC 6.047 0.000 Accept
5 PMC ––––> Ca 17.940 0.000 Accept
6 Ca ––––> fP 22.713 0.000 Accept
Arshad, S., and Siddiqui, D. A.
80

enhance the CA, consistent with H5. Finally, the competitiveadvantage has a positive linkage with firm’s performance, showingconsistency with H6.
Table 9: Specific Indirect Effects
Mediating Effect
To find the mediation between BII and BISS first we will analyze adirect effect between BIII and BI Functionality having β=0.77 then anothereffect of BI Functionality and BI Self-Service will be carried out.Findingsshowed as on β=0.70 and when mediated by BI Functionality β=0.54which shows significant mediation. To analyze the mediation of PMCbetween BIF and competitive advantage, we will identify a relationshipamong BIF and PMC having β=0.41 then another effect of PerformanceManagement Capabilities on competitive advantage will be carried out.Results revealed as on competitive advantage having β=0.69, and whenit’s mediated by Performance Management Capabilities β=0.28 whichestablishes a significant mediation. Also, mediation between BIII andcompetitive advantage will be tested via BI Functionality and PerformanceMeasurement Capabilities which shows positive relations having β=0.22.The mediating effect between BI Self Service and competitive advantagewill be carried out via Performance Measurement Capabilities β=0.24which is a good mediation.
Afterward another mediating test between BI Functionality andcompetitive advantage through BISS and PMC having β=0.17 then another
Original Sample (O) T Statistics P Values
BIII ––––>BIF ––––>BISS 0.544 13.669 0.000
BIF ––––>PMC ––––>CA 0.285 5.976 0.000
BIII ––––>BIF ––––>PMC ––––>CA 0.221 5.615 0.000
BISS ––––>PMC ––––>CA 0.244 5.867 0.000
BIF ––––>BISS ––––>PMC ––––>CA 0.171 5.659 0.000
BIII ––––>BIF ––––>BISS ––––>PMC ––––>CA 0.133 5.352 0.000
BIF ––––>PMC ––––>CA ––––>FP 0.213 5.422 0.000
BIII ––––>BIF ––––>PMC ––––>CA ––––>FP 0.165 5.102 0.000
PMC ––––>CA ––––>FP 0.513 11.118 0.000
BISS ––––>PMC ––––>CA ––––>FP 0.182 5.382 0.000
BIF ––––>BISS ––––>PMC ––––>CA ––––>FP 0.128 5.131 0.000
BIII ––––>BIF ––––>BISS ––––>PMC ––––>CA ––––>FP 0.099 4.864 0.000
BIII ––––>BIF ––––>PMC 0.322 6.687 0.000
BIF ––––>BISS ––––>PMC 0.249 6.018 0.000
BIII ––––>BIF ––––>BISS ––––>PMC 0.193 5.749 0.000
Business intelligence and Firm Performance
81
mediating process will be done between. BII and competitive advantagevia BIF, BISS, and PMC having β=0.13.Similarly, BI Functionality andfirm’s performance will be tested through PMC and CA findings clearlyshow a positive relationship as β=0.21 Afterwards BIII and firm’sperformance mediated through BI Functionality, PerformanceMeasurement Capabilities and competitive advantage as β=0.21 which isa significant one. Another relationship between Performance MeasurementCapabilities and firm’s performance mediated via competitive advantageresults revealed β=0.51. Similarly, BI Self-Service and firm’s performancewill be mediated by PMC and CA hence β=0.18. Nevertheless, themediation test between BI Functionality and firm’s performance carriedout through BIF, BISS, PMC and CA and the result indicated a positivesignificant mediation i.e. β=0.12. BIII and firm’s performance mediationtest done through BIF, BISS,PMC and CA whilst findings revealed β=0.09.Another mediating test between BIII and PMC through BIF and foundβ=0.32. One mediation test is also carried out between BIF and PMCthrough BISS hence the results revealed a positive impact as β=0.24.
Finally, the last mediation test is done BIII and PMC through BIF andBISS as β=0.19 which defines there is obviously a mediation.
ConClusion
We carried out this research to investigate how BI quality enhancesthe PMC, competitive advantage, firm’s performance. BI quality wasmeasured through BIII, BIF, and BISS, which brings up to independentand feasible usage of the BI system by managers specifically inPakistani firms. Right implementation and handling of BI improves theperformance measurement capabilities that help in getting a bettercompetitive advantage, which ultimately increases the performance of thefirm.
The research was causal and the data was gathered by conducting asurvey via questionnaire. 300 responses are collected from employees ofdifferent firms where BI is being implemented to test the hypothesis. Thedata analysis shows, the relationship among variable is strong and positive.Still, due to various reasons, such as low expertise and unavailability ofBI statistics, there is not enough information specifically focusing onPakistan that’s why we conducted this research. BI system is increasingfirm performance in Pakistani firms. Global BI’s perspective has alsoinfluenced the BI industry in Pakistan.
Arshad, S., and Siddiqui, D. A.
82

The data through questionnaires from various Pakistani firms isgathered in research. Various employees dealing with BI on a regular basisand their responses.
In conclusion, based on the findings, this research proposes a practicalrecommendation. It is suggested for Pakistani firms to diagnose whichareas regarding their usage of the Business intelligence system need to beimproved with regards to their carrying out objectives. Afterward, theycan modify their BI system in response to the diagnosis and invest morein BI to sustain in a competitive marketplace.
As new events are being stood up in BI so more variables must bestudied for future inquiry. Employee’s behavior towards BI adoption andupcoming challenges of BI in Pakistan are potential topics to be focusedfor future research work.
Business intelligence and Firm Performance
83

referenCes
Abernethy, M. A. & Brownell, P. (1999). The role of budgets inorganizations facing strategic change: an exploratory study.Acc. Organ. Soc. 24(3), 189-204.
Alavi, M., & Leidner, D. E. (2001). Review: knowledge managementand knowledge management systems: conceptual foundationsand research issues. MiSQ. 25(1), 107-136.
Anderson, J.C., & Gerbing, D.W. (1988). Structural equation modeling inpractice: A review and recommended two-step approach.Psychological Bulletin, 103(3), 411-423.
Andrew F. H. (2013). introduction to Mediation, Moderation, and
Conditional Process Analysis: A Regression-Based Approach.
New York, NY: The Guilford Press.
Ariav, G., (1992). Information systems for managerial planning andcontrol: a conceptual examination of their temporalstructure. J. Manag. inf. Syst. 9(2), 77-98.
Armstrong, J.S., Overton, T., (1977). Estimating nonresponse biasin mail surveys. J. Mark. Res. 14 (3), 396-402.
Arefin, M.S., Hoque, M.R., & Bao, Y.(2015). The impact of businessintelligence on organization’s effectiveness: an empirical study.Journal of Systems and information Technology, 17(3), 263-285.
Asadi S., Ida, & Shanks, G. (2015). How Business Analytics SystemsProvide Benefits and Contribute to Firm Performance?. ECiS
2015 Completed Research Papers. Paper 12.iSBN 978-3-00-
050284-2.
Azvine, B., Cui, Z., Nauck, D.D., & Majeed, B. (2006). Real time businessintelligence for the adaptive enterprise. In The 8th IEEEinternational Conference on E-Commerce Technology and The
3rd iEEE international Conference on Enterprise Computing, E-
Commerce, and E-Services (CEC/EEE’06) 29-29. IEEE.
Azvine, B., Cui, Z., & Nauck, D.D. (2005). Towards real-time businessintelligence. BT Technology Journal, 23(3), 214-225.
Arshad, S., and Siddiqui, D. A.
84

Bagozzi, R., & Yi, Y. (1988). On the evaluation of structural equationmodels. J. Acad. Mark. Sci. 16(1), 74-94.
Banerjee, M., & Mishra, M. (2017). Retail supply chain managementpractices in India: A business intelligence perspective. Journal
of Retailing and Consumer Services, 34, 248-259.
Barclay, D. R., Thompson, R., & Higgins, C. (1995). The partialleastsquares approach to casual modeling: personal computeradoption and use as an illustration. Technol. Stud. 2, 285-324.
Barney, J.B. (1991). Firm resources and sustained competitiveadvantage. J. Manag. 17 (1), 99-120.
Baron, R.M., & Kenny, D.A. (1986). The moderator-mediatorvariable distinction in social psychological research:conceptual, strategic, and statistical considerations. J. Pers.
Soc. Psychol. 51(6), 1173-1182.
Barua, A., & Mukhopadhyay, T. (2000). Information technology andbusiness performance: Past, present, and future. In: Zmud RW.
Framing the Domains of iT Management: Projecting the Future
Through the Past (65-84). Cincinnati, Ohio: Pinnaflex EducationResources; 2000.
Baum, J. R., & Wally, S. (2003). Strategic decision speed and firmperformance. Strateg. Manag. J. 24(11), 1107-1129.
Bhatt, G.D., & Grover, V. (2005). Types of information technologycapabilities and their role in competitive advantage: anempirical study. J. Manag. inf. Syst. 22 (2), 253-277.
Bisbe, J., & Otley, D. (2004). The effects of the interactive use ofmanagement control systems on product innovation. Acc.
Organ. Soc. 29 (8), 709-737.
Bisbe, J., Batista-Foguet, J. M., & Chenhall, R. (2007). Definingmanagement accounting constructs: a methodological noteon the risks of conceptual misspecification. Acc. Organ.
Soc. 32(7), 789-820.
Bollen, K. A., & Stine, R. (1990). Direct and indirect effects:
Business intelligence and Firm Performance
85

classical and bootstrap estimates of variability. Sociol.
Methodol. 20 (1), 115-140.
Burton-Jones, A., Straub Jr., D.W., 2006. Reconceptualizing systemusage: an approach and empirical test. inf. Syst. Res. 17 (3),228-246.
BRAC (Business Application Research Center). (2009). The Bi Survey 8:
The World’s Largest Bi Survey by Nigel Pendse’. www.bi-survey.com.
Caseiro, N., & Coelho, A. (2019). The influence of Business Intelligencecapacity, network learning and innovativeness on startupsperformance. Journal of innovation & Knowledge, 4(3), 139-145.
Chapman, C., & Kihn, L. A. (2009). Information system integration,enabling control and performance. Acc. Organ. Soc. 34(2),151-169.
Chaudhuri, S., Dayal, U., & Narasayya, V. (2011). An over view of businessintelligence technology. Commun. ACM 54(8), 88-98.
Chenhall, R.H. (2003). Management control systems design withinits organizational context: Findings from contingency-based research and directions for the future. Acc. Organ.
Soc. 2(2-3), 127-168.
Cheung, G.W., & Lau, R.S. (2008). Testing mediation and suppressioneffects of latent variables. Organ. Res. Methods 11(2),
296-325.
Chin, W. W. (1998). The partialleast squares approach to structuralequation modeling. In: Marcoulides, G.A. (Ed.), Modern
Methods for Business Research (195-336). LawrenceErlbaum Associates, Mahwah, NJ.
Chin, W. W. (2010). How to writeup and report PLS analysis. InVinzi, V. E., Chin, W. W., Henseler, J., Wang, H. (Eds.),Handbook of Partial Least Squares - Concepts, Methods
and Applications in Marketing and Related Fields, (655-
690). Springer, Berlin, Heidelberg.
Arshad, S., and Siddiqui, D. A.
86

Clark, T. D., Jones, M. C., & Armstrong, C. P. (2007). The dynamicstructure of management support systems: theory development,research focus and direction. MiSQ. 31(3), 579-615.
Cramer, D. (1997). Basic Statistics for Social Research - Step-By-Step
Calculations & Computer Techniques Using Minitab.
London: Psychology Press.
Côrte-Real, N., Oliveira, T., & Ruivo, P. (2017). Assessing business valueof Big Data Analytics in European firms. Journal of Business
Research, 70, 379-390.
DeCarlo, L.T. (1997). On the meaning and use of kurtosis. Psychol.
Methods 2 (3), 292-307.
Demirkan, H., & Delen, D. (2013). Leveraging the capabilities of service-oriented decision support systems: Putting analytics and big datain cloud. Decision Support Systems, 55(1), 412-421.
DeLone, W. H., & McLean, E. R. (2003). The DeLone and McLeanmodel of information systems success: aten-year update. J.
Manag. inf. Syst. 19(4), 9-30.
Dilla, W., Janvrin, D. J., & Raschke, R. (2010). Interactive datavisualization: new directions for accounting informationsystems research. J. inf. Syst. 24(2), 1-37.
Dillman, D.A., (2007). Mail and internet Surveys: The Tailored
Design Method. New York: Wiley.
Dodson, G., Arnott, D., & Pervan, G. (2008). The use of business
intelligence systems in Australia. ACIS 2008 Proceedings.The Australasian Conference on Information SystemsChristchurch, New Zealand.
Doll, W.J., & Torkzadeh, G. (1988). The measurement of end-usercomputing satisfaction. MiS Q. 12 (2), 259-274.
Elbashir, M. Z., Collier, P. A., & Davern, M. J. (2008). Measuring theeffects of business intelligence systems: The relationship betweenbusiness process and organizational performance. international
Business intelligence and Firm Performance
87

Journal of Accounting information Systems, 9(3), 135-153.
Elbashir, M. Z., Collier, P. A., & Sutton, S. G. (2011). The role oforganizational absorptive capacity in strategic use ofbusiness intelligence to support integrated managementcontrol systems. Account. Rev. 86 (1),155-184.
Elbashir, M. Z., Collier, P. A., Sutton, S. G., Davern, M. J., & Leech, S.A. (2013). Enhancing the business value of business intelligence:The role of shared knowledge and assimilation. Journal of
information Systems, 27(2), 87-105.
Eidizadeh, R., Salehzadeh, R., & Chitsaz Esfahani, A. (2017). Analysingthe role of business intelligence, knowledge sharing andorganisational innovation on gaining competitive advantage.Journal of Workplace Learning, 29(4), 250-267.
Emmanuel, C., Otley, D., & Merchant, K. (1990). Accounting for
Management Control. London: Springer.
Fedorowicz, J., & Konsynski, B. (1992). Organization supportsystems: bridging business and decision processes. J.
Manag. inf. Syst. 8(4), 5-25.
Ferreira, A., & Otley, D. (2009). The design and use of performancemanagement systems: An extended frame work for analysis.Manag. Account. Res. 20(4), 263-282.
Fornell, C., & Larcker, D. F. (1981). Evaluating structural equationmodels with unobservable variables and measurement error.J. Mark. Res. 18(1), 39-50.
Foster, S., Hawking, P., & Stein, A. (2005). Business intelligencesolution evolution: adoption and use. Bus. intell. J. 10(4),
44-54.
Gangadharan, G. R., & Swami, S. N. (2004). Business intelligencesystems: design and implementation strategies. in 26th
international Conference on information Technology interfaces,
2004. (139-144). iEEE.
Garg, V. K., Walters, B.A., & Priem, R.L. (2003). Chief executive scanning
Arshad, S., and Siddiqui, D. A.
88

emphases, environmental dynamism and manufacturingperformance. Strateg. Manag. J. 24(8), 725-744.
Gate, A. (2011). Business intelligence management reaches Pakistan.http://knol.google.com/k/amanda-gate-58/business-intelligencemanagement/17b3he6epltgo/22#.
Grafton, J., Lillis, A. M., & Widener, S. K. (2010). The role ofperformance measurement and evaluation in buildingorganizational capabilities and performance. Acc. Organ.
Soc. 35(7), 689-706.
Grant, R. M. (1996). Prospering in dynamically-competitiveenvironments: organizational capability as knowledgeintegration. Organ. Sci. 7(4), 375-387.
Green, S. G., & Welsh, A.M. (1988). Cybernetics and dependence:reframing the control concept. Acad. Manag. Rev. 13(2), 287-304.
Grublješič, T., & Jaklič, J. (2015). Business intelligence acceptance: Theprominence of organizational factors. information Systems
Management, 32(4), 299-315.
Hair. Jr., J. F., Black., W. C., Babin., B. J., Anderson., R. E., & L.Tatham.,R. (2006). Multivariant Data Analysis. New Jersey: PearsonInternational Edition.
Henri, J. F. (2006). Organizational culture and performancemeasurement systems. Acc. Organ. Soc. 31(1), 77-103.
Herschel, R. T., & Jones, N. E. (2005). Knowledge management andbusiness intelligence: the importance of integration. Journal of
Knowledge Management, 9(4), 45-55.
Hina, S. (2017). Business Intelligence Solution for Food Industry. Journal
of Basic & Applied Sciences, 13, 442-447.
Hou, C. K. (2012). Examining the effect of user satisfaction on system usageand individual performance with business intelligence systems: Anempirical study of Taiwan’s electronics industry. international
Journal of information Management, 32(6), 560-573.
Business intelligence and Firm Performance
89

Howard, P., (2003). Analytics Volume 1: An Evaluation and
Comparison. U.K: Bloor Research, Milton Keynes.
Huber, G.P. (1991). Organizational learning: the contributingprocesses and the literatures. Organ. Sci. 2 (1), 88-115.
Hulland, J. (1999). The use of partial least square (PLS) in strategic
management research: A review of four recent studies.
Strateg. Manag. J. 20 (2), 195-204.
IşıK, Ö., Jones, M. C., & Sidorova, A. (2013). Business intelligencesuccess: The roles of BI capabilities and decision environments.information & Management, 50(1), 13-23.
Jarvis, C. B., Mackenzie, S. B., & Podsakoff, P. M. (2003). Acriticalreview of construct indicators and measurement modelmisspecification in marketing and consumer research. J.
Consum. Res. 30, 199-218.
Jourdan, Z., Rainer, R. K., & Marshall, T. E. (2008). Business intelligence:An analysis of the literature. information Systems Management,
25(2), 121-131.
Jr., J. F. H., Matthews, L. M., Matthews, R. L., &Sarstedt, M. (2017). PLS-SEM or CB-SEM: updated guidelines on which method to use.international Journal of Multivariate Data Analysis, 1(2), 107.
Jr., H., Ringle, C. & Sarstedt, M. (2011). PLS-sem: Indeed a silver bullet. The
Journal of Marketing Theory and Practice. 19, 139-151.
Jr., H., & Black, W.C., Babin, B., Anderson, R., & Tatham, R.L. (2010).SEM: An introduction. Multivariate data analysis: A globalperspective. Multivariate Data Analysis: A Global Perspective.(629-686).
Keen, P. G. W. (1991). Shaping the Future: Business Design
Through information Technology. Harvard Business SchoolPress, Harvard.
Kogut, B., & Zander, U. (1992). Knowledge of the firm,combinative capabilities, and the replication of technology.
Arshad, S., and Siddiqui, D. A.
90

Organ. Sci. 3(3), 383-397.
Khan, A., Amin, N., & Lambrou, N. (2009). Drivers and barriers toBisuness Intelligence Adoption: A case of Pakistan. in European
and Mediterranean Conference on information Systems 2010.Abu Dhabi, UAE, 1-23.
Kohli, R., & Devaraj, S. (2003). Measuring information technologypayoff: a meta-analysis of structural variables in firm-levelempirical research. inf. Syst. Res., 14(2), 127-45.
Lee, M. T., & Widener, S. K. (2016). The performance effects of using
business intelligence systems for exploitation and exploration
learning. J. inf. Syst. http://dx.doi.org/10.2308/ isys-51298.
Lee, J., Elbashir, M.Z. Mahama, H., & Sutton, S.G. (2014).Enablers of top management team support for integratedmanagement control systems innovations. int. J. Account.
inf. Syst. 51(1), 1-25.
Leidner, D.E., & Elam, J.J. (1995). The impact of executiveinformation systems on organizational design, intelligence,and decision making. Organ. Sci. 6(6), 645-664.
Liang, H., Saraf, N., Hu, Q., & Xue, Y. (2007). Assimilation ofenterprise systems: the effect of institutional pressures andthe mediating role of top management. MiSQ. 31(1), 59-87.
Libby, T., & Lindsay, R. M. (2010). Beyond budgeting or budgetingreconsidered? A survey of North American budgetingpractice. Manag. Account. Res. 21(1), 56-75.
MacKinnon, D. P., Lockwood, C. M., & Williams, J. (2004). Confidencelimits for the indirect effect: distribution of the product andresampling methods. Multivar. Behav. Res. 39(1), 99-128.
Maiga, A. S., Nilsson, A., & Jacobs, F.A. (2013). Extent ofmanagerial IT use, learning routines, and firmperformance: a structural equation modeling of theirrelationship. int. J. Account. inf. Syst. 14 (4), 297-320.
Malmi, T., & Brown, D.A. (2008). Management control systems as
Business intelligence and Firm Performance
91

a package - opportunities, challenges and researchdirections. Manag. Account. Res., 19 (4),287-300.
Mata, F. J., Fuerst, W. L., & Barney, J. B. (1995). Information technologyand sustained competitive advantage: are source-basedanalysis. MISQ. 19(4), 487-505. Mintzberg, H., 1978. Patternsin strategy formation. Manag. Sci. 24(9), 934-948.
Mehta. (2009). Describes limited IT budgets, lack of availability ofmanpower and IT resources, and volatile business conditions.
Melville, N., Kraemer, K., & Gurbaxani, V. (2004). Review:Information Technology and Organizational Performance:An Integrative Model of IT Business Value. MiS Quarterly.
28, 283-322.
Mithas, S., Ramasubbu, N., & Sambamurthy, V. (2011). Howinformation management capability influences firmperformance. MiS Q. 35 (1), 237-256.
Miyamoto, M. (2015). Application of competitive forces in the businessintelligence of Japanese SMEs. international Journal of Management
Science and Engineering Management, 10(4), 273-287.
Moore, D. L., & Tarnai, J. (2002). Evaluating non response error inmail surveys. In: Groves, R.M., Dillman, D.A., Eltinge, J. L.,Little, R. J. A. (Eds.), Survey Non Response. 197-211. NewYork: Wiley.
Naranjo-Gil, D., & Hartmann, F. (2007). Management accountingsystems, top management team heterogeneity and strategicchange. Acc. Organ. Soc. 32(7), 735-756.
Negash, S., & Gray, P. (2008). Business intelligence. In Handbook ondecision support systems, 2, (175-193). Berlin: Springer,Heidelberg.
Nelson, R.R., & Winter, S.G. (1982). An Evolutionary Theory of
Economic Change. Belknap Press, Cambridge, M.A.
Netemeyer, R. G., Bearden, W.O., & Sharma, S. (2003). ScalingProcedures: Issues and Applications. Thousand Oaks: Sage.
Arshad, S., and Siddiqui, D. A.
92

Nonaka, I. (1994). A dynamic theory of organizational knowledgecreation. Organ. Sci. 5(1), 14-37.
Nunnally, J. C. (1978). Psychometric Theory. New York: McGraw-Hill.
Oh, W., & Pinsonneault, A. (2007). On the assessment of thestrategic value of information technologies: conceptual andanalytical approaches. MiS Q. 31 (2), 239-265.
Otley, D.T., & Berry, A.J. (1980). Control, organisation andaccounting. Acc. Organ. Soc. 5 (2), 231-244.
Olszak, C. M. (2014). Towards an understanding business intelligence. Adynamic capability-based framework for Business Intelligence.Federated Conference on iEEE, (1103-1110).
Okkonen, J., Pirttimäki, V., Hannula, M., & Lönnqvist, A. (2002). Triangleof Business Intelligence, Performance Measurement andKnowledge Management. in iind Annual Conference on
innovative Research in Management, (May 9-11), Stockholm,Sweden.
Peng, J., Viator, R.E., & Buchheit, S. (2007). An experimental studyof multi-dimensional hierarchical accounting data: drill-down paths can influence economic decisions. J. inf. Syst.
21(2), 69-86.
Peters, M. D., Wieder, B., Sutton, S. G., & Wakefield, J. (2016). Businessintelligence systems use in performance measurement capabilities:Implications for enhanced competitive advantage. international
Journal of Accounting information Systems, 21, 1-17.
Podsakoff, P.M., & Organ, D.W. (1986). Self-reports in organizationalresearch: problems and prospects. J. Manag. 12 (4), 531-544.
Podsakoff, P. M., MacKenzie, S. B., Lee, J. Y., & Podsakoff, N. P.(2003). Common method biases in behavioral research:acritical review of the literature and recommendedremedies. J. Appl. Psychol. 88 (5), 879-903.
Podsakoff, P. M., MacKenzie, S. B., & Podsakoff, N. P. (2012).Sources of method bias in social science research and
Business intelligence and Firm Performance
93

recommendations on how to control it. Annu. Rev. Psychol.
63, 539-569.
Popovič, A., Puklavec, B., & Oliveira, T. (2019). Justifying business intelligencesystems adoption in SMEs: Impact of systems use on firm performance.industrial Management and Data Systems, 119(1), 210-228.
Popovič, A., Hackney, R., Coelho, P. S., & Jaklič, J. (2012). Towardsbusiness intelligence systems success: Effects of maturity andculture on analytical decision making. Decision Support Systems,
54(1), 729-739.
Preacher, K. J., & Hayes, A. F. (2008). Asymptotic and resamplingstrategies for assessing and comparing indirect effects inmultiple mediator models. Behav. Res. Methods, 40(3), 879-891.
Raheela. A., Saman, H., & Sukaina, M. (2017). Department of Computer
Science & Software Engineering, NED University of Engineering& Technology, Karachi, Pakistan.
Ranjan, J. (2008). Business justification with business intelligence. Vine,
38(4), 461-475.
Rai, A., Patnayakuni, R., & Seth, N. (2006). Firm performanceimpacts of digitally enabled supply chain integrationcapabilities. MiS Q. 30 (2), 225-246.
Ravichandran, T., & Lertwongsatien, C. (2005). impact of information
systems resources and capabilities on firm performance: are
source-based perspective. 23rd Inter-national Conference onInformation Systems, Barcelona, Spain.
Ray, G., Muhanna, W. A., & Barney, J. B. (2005). Informationtechnology and the performance of the customer serviceprocess: are source-based analysis. MiSQ. 29(4), 625-652.
Ringle, C. M., Wende, S., & Will, S. (2005). Smart PLS 2.0 (M3) Beta.Hamburg: Hamburg University of Technology.
Ringle, C. M., Sarstedt, M., & Straub, D. W. (2012). Editor’scomments: acritical look at the use of PLS-SE Min MISquarerly. MiSQ. 36(1), iii-xiv.
Arshad, S., and Siddiqui, D. A.
94

Rouhani, S., & Savoji, S. R. (2016). A success assessment model for BItools implementation: an empirical study of banking industry.international Journal of Business intelligence Research (iJBiR),
7(1), 25-44.
Rubin, E., & Rubin, A. (2013). The impact of business intelligencesystems on stock return volatility. information & Management,
50(2-3), 67-75.
Sangari, M. S., & Razmi, J. (2015). Business intelligence competence,agile capabilities, and agile performance in supply chain: Anempirical study. The international Journal of Logistics
Management, 26(2), 356-380.
Schilke, O. (2013). On the contingent value of dynamic capabilities forcompetitive advantage: The nonlinear moderating effect ofenvironmental dynamism. Strategic Management Journal, 35(2),179-203.
Schläfke, M., Silvi, R. & Möller, K. (2013), A framework for businessanalytics in performance management. international Journal of
Productivity and Performance Management, 62 (1), 110-122.
Schubert, P., Williams, S. P., & Woelfle, R. (2011). SustainableCompetitive Advantage in E-Commerce and the Role of theEnterprise System. international Journal of Enterprise
information Systems, 7(2), 1-17. doi: 10.4018/jeis.2011040101.
Seah, M., Hsieh, M., & Weng, Pu-D. (2010). A case analysis of Savecom:The role of indigenous leadership in implementing a businessintelligence system. international Journal of information
Management. 30. 368-373. 10.1016/j.ijinfomgt.2010.04.002.
Seufert, A., & Schiefer, J. (2005). Enhanced business intelligence-
supporting business processes with real-time business analytics.
In 16th International Workshop on Database and Expert SystemsApplications (DEXA’05) (919-925). IEEE.
Shollo, A., & Galliers, R. D. (2015). Towards an understanding of therole of business intelligence systems in organisationalknowing. inf. Syst. J. http://dx.doi.org/10.1111/isj.12071.
Business intelligence and Firm Performance
95

Shrout, P.E., & Bolger, N. (2002). Mediation in experimental and non-experimental studies: new procedures and recommendations.Psychol. Methods 7 (4), 422-445.
Simons, R. (1990). The role of management control systems increating competitive advantage: new perspectives. Acc.
Organ. Soc. 15 (1), 127-143.
Simons, R. (1991). Strategic orientation and top management attentionto control systems. Strateg. Manag. J. 12(1), 49-62.
Simons, R. (1994). How new top managers use control systems aslevers of strategic renewal. Strateg. Manag. J. 15 (3), 169-189.
Simons, R. (1995). Levers of Control: How Managers Use
innovative Control Systems to Drive Strategic Renewal.Boston: Harvard University Press.
Simons, R., Davila, A., & Kaplan, R. S. (2000). Performance
Measurement and Control System for implementing
Strategy. Prentice Hall, Upper Saddle River, N. J. Taylor,A. B., MacKinnon, D.P.
Tein, J. Y. (2008). Tests of the three-path mediated effect. Organ.
Res. Methods 11 (2), 241-269.
Teece, D.J., Pisano, G., & Shuen, A. (1997). Dynamic capabilities andstrategic management. Strateg. Manag. J. 18 (7), 509-533.
Tessier, S., & Otley, D. (2012). A conceptual development ofSimons’ levers of control framework. Manag. Account. Res.
23 (3), 171-185.
Thomas, J. B., Sussman, S. W., & Henderson, J. C. (2001).Understanding “strategic learning”: Linking organizationallearning, knowledge management and sense making. Organ.
Sci. 12(3), 331-345.
Torres, R., Sidorova, A., & Jones, M. C. (2018). Enabling firm performancethrough business intelligence and analytics: A dynamic capabilitiesperspective. information & Management, 55(7), 822-839.
Arshad, S., and Siddiqui, D. A.
96

Tourangeau, R., Rips, L.J., & Rasinski, K., (2000). The Psychology of
Survey Response. Cambridge: Cambridge University Press.
Trieu, V. H. (2017). Getting value from Business Intelligence systems: A reviewand research agenda. Decision Support Systems, 93, 111-124.
Trkman, P., McCormack, K., De Oliveira, M. P. V., & Ladeira, M. B.(2010). The impact of business analytics on supply chainperformance. Decision Support Systems, 49(3), 318-327.
Turban, E., Sharda, R., Aronson, J., & King, D. (2008). Business
intelligence: A Managerial Approach, Pearson Prentice Hall.
Vandenbosch, B. (1999). An empirical analysis of the associationbetween the use of executive support systems and perceivedorganizational competitiveness. Acc.Organ.Soc.24(1),77-92.
Vandenbosch, B., & Higgins, C. A. (1995). Executive support systemsand learning: a model and empirical test. J. Manag. inf. Syst.
12(2), 99-131.
VomBrocke, J., Braccini, A. M., Sonnenberg, C., & Spagnoletti, P.(2014). Living IT infrastructures-an ontology-basedapproach to aligning it infrastructure capacity and businessneeds. int. J. Account. inf. Syst. 15 (3), 246-274.
Vukšic, V. B., Bach, M. P., & Popovic, A. (2013). Supporting performancemanagement with business process management and businessintelligence: A case analysis of integration and orchestration.international Journal of information Management, 33(4), 613-619.
Wade, M., & Hulland, J. (2004). The resource-based view andinformation systems research: review, extension andsuggestions for future research. MiSQ. 28(1), 107-142.
Werner, V., & Abramson, C. (2003). The Critical Business Need to ReduceElapsed Time. Bus. intell. J, 8.
Wetzels, M., Odekerken-Schröder, G., & van Oppen, C. (2009).Using PLS path modeling for assessing hierarchialconstruct models: guide lines and empirical illustration.MiS Q. 33(1), 177-195.
Business intelligence and Firm Performance
97

Wamba, S. F., Gunasekaran, A., Akter, S., Ren, S. J. F., Dubey, R., &Childe, S. J. (2017). Big data analytics and firm performance:Effects of dynamic capabilities. Journal of Business Research,
70, 356-365.
Widener, S. K. (2007). An empirical analysis of the levers of controlframe work. Acc. Organ. Soc. 32(7), 757-788.
Wold, H. (1982). Soft modeling: the basic design and someextensions. Systems Under Indirect Observations:Causality, Structure, Prediction. K. G. Joreskog and H.Wold, Amsterdam, North-Holland, 1-54.
Wieder, B., Ossimitz, M., & Chamoni, P. (2012). The impact of businessintelligence tools on performance: a user satisfaction paradox.international Journal of Economic Sciences and Applied
Research, 5(3), 7-32.
Yeoh, W., & Koronios, A. (2010). Critical success factors for businessintelligence systems, Journal of Computer information Systems,
50 (3), Spring, 23-32.
Yigitbasioglu, O. M., & Velcu, O. (2012). Are view of dashboards inperformance management: implications for design andresearch. int. J. Account. inf. Syst. 13(1), 41-59.
Yogev, N., Even, A., & Fink, L. (2013). How Business Intelligence CreatesValue. international Journal of Business intelligence Research,
4(3), 16-31.
Ziora, A. C. L. (2015). The Role of Big Data Solutions in the Managementof Organizations. Review of Selected Practical Examples.Procedia Computer Science, 65, 1006-1012.
Arshad, S., and Siddiqui, D. A.
98

eXaMining tHe assoCiation of
organiZational JustiCe, JoB MotiVation
anD organiZational CitiZensHiP
BeHaVior
Dr. sadia anwar*, Homan Memon**, and
Dr. noor Muhammad Jamali***
aBstraCt
This study has examined the chain collaboration of
organizational justice and job motivation for the
management of better performance of nurses through
organizational citizenship behavior in the private hospitals,
Hyderabad, Sindh. This study is explanatory in nature, which
pursues to explain the collaboration of relationship of the
variables that are setup for analysis. The respondents are
nurses who have at least one-year experience in two private
hospitals of Hyderabad. The stratified random sampling
method was selected in this research study. The sample size
was based on 234 nurses. The process of collection of data
was finalized by using questionnaires. The Structural
Equation Models (SEM) was used as an analytical tool for
the testing of the hypothesis with the help of program
analysis of moment structure (AMOS) version 24. The study
found that the two factors of organizational justice named
distributive and procedural has a positive and significant
influence on the performance of nurses. The work motivation
has also positive and significant influences on the
performance of nurses concluding with Organizational
Citizenship Behavior. As a result, the verdicts can be
valuable for the two private hospitals specifically in
Hyderabad region to develop the performance of nurses.
Keywords: Distributive Justice, Job Motivation, Organizational Citizenship Behavior, Organizational
Justice, Procedural Justice.
introDuCtion
An effective and efficient organization is recognized from its high
Journal of Business Strategies, Vol.14, No.1, 2020, pp 99–122 DOi:10.29270/JBS.14.1(20).05
99
__________________________________________________________________________________*Assistant Professor, institute of Commerce, University of Sindh, Jamshoro, Pakistan. [email protected]
**Research Fellow, institute of Commerce, University of Sindh, Jamshoro
***Professor, institute of Commerce, University of Sindh, Jamshoro

quality and a virtuous performance of its human assets. Among themhospital is one of that organization which manages a great humanresources. This service organization is exclusive in regards of humanresources, and deals in huge amount of capital, science, technology, rulesand strategies. The hospitals are known as such organizations because ofits large need of capital investment for the fulfillment of its requirements.Technology and science are the essential part of it, as hospitals haveexpensive and sophisticated equipment which are required to get updatetime to time because of their various disciplines to face the challenges thatmay happen in this sector.
The services offered by the hospitals can be maintained only if it has agood rule, policies and strategies that are interconnected with each other.This can only be achieved by a good performance of the human resourcesavailable in the hospitals. This human capital of hospitals is categorizedinto three sectors, that is, certified experts, managerial and the custodian.Certified experts’ deals with the healing process of patients through besttreatments. This category is based on doctors, nurses, pharmacologists,nutritionists and others. The category of managerial members deals withthe assistance of the certified experts predominantly by maintaining a goodhospital’s management, specifically, operational administrators,accountants and others. The custodian comes in that category of humanresource factor that deals as warden, laundress, cleaner and porter etc. (Wu& Chiu, 2018; Ariani, 2012; Mangkunagara, 2000).
Among all these three categories the nurses play a vital role in ahospital. Though, the quality service accomplish by the nurses are mainlydepends on the interaction process between nurses and patients, withassociates and towards the concern hospitals. Such influentialcollaboration of nurses lay down a trend of the ideal performance whileproviding best services, which is according to the anticipations of theorganization, and also explores an extra-ordinary reputation of nurses. Inthe organizations, this extra role behavior is known as an organizationalcitizenship behavior. In recent time, this organizational citizenshipbehavior has turn into one of the international strategic issues that isseeking a huge attention.
The performance of a hospital is crucially depending on theorganizational citizenship behavior of nurses (Wu & Chiu, 2018; Ariani,2012; Eisenberger, et al., 1990). The organizational citizenship behavior
Anwar, S., Memon, H., and Jamali, N. M.
100

occurs as a natural behavior that is beyond the job description (Jiang,Gollan, & Brooks, 2017; Organ, 1994). The positive influence oforganizational citizenship behavior on the company assures the value-added performance of the human resources that provides the virtuousservices to the shareholders of the company. Though the elements that mayhave influential effect on the organizational citizenship behavior in anorganization include organizational justice along with the collaboration ofjob motivation(Singh & Singh, 2019; Ariyani, Haerani, & Maupa, 2016;Greenberg & Colquitt, 2005). It is simple to understand because whenemployees feel secured at their workplaces, then only they can accomplishtheir jobs effectively and efficiently. In the same way, when employeeswill get high motivation from the organization, the employees will givetheir best performance to achieve the targets of the organization. Likewise,with the feeling of secured and motivated the employees will consequentlyprovide good service, vice versa to the organization.
One of the factor in arise of organizational citizenship behavior (OCB)majorly depend on the attitude shown by every individual for themotivation they receive in shape of remunerations, promotionalopportunities, organizational culture, associations with supervisors, andrelationships with other employers. The organizations always struggle todevelop the high quality behaviors of workforces in order to achieve thetargeted aims of the corporation. The decline in organizational citizenshipbehavior is sometimes because of the aspects that are not being metaccording to the expectations of the employees. This can be easilymaintained by motivating the employees, by providing best workingconditions, self-control, working environment, instructions, training andothers. The organizational justice implies the view of employees aboutfairness at the workplace (Singh & Singh, 2019: Chan & Lai, 2017;Greenberg & Colquitt, 2005). A number of policies can be adopted by theorganizations to improve employee performance by achieving high qualityorganizational citizenship behavior among employees through maintainingorganizational justice and motivation according to the expectations ofemployees.
Though, the above discussed circumstances have not been achieved insome private hospitals of Hyderabad like Agha Khan and Maajee Hospital.While at the time of collection of the survey questionnaires some factscame around in regards of less pleasant relationship between companionnurses. This may happen because of the work division among morning,
Examining the Association of Organizational Justice,
Job Motivation and Organizational Citizenship Behavior
101

afternoon and evening duties. Such problems take place because of someirresponsible nurses who ignore the schedule of the hospitals. Moreover,also the uncomfortable relationship between supervisors and peers werefound at some places. The nurses were not satisfied from the salarypackages that they were receiving from the hospitals. Some other problemslike limited promotion and lack of transparency was analyzed whichdecreased the morality factor among the nurses which can be considereda major factor for the improvement of work quality. Such reasons weredetermined features that influence the organizational citizenship behaviorof nurses in the concerned hospitals. This research study, will explorethese factors furthermore to improve the performance of nurses in thesetwo hospitals. Thus, the purpose of this research is to analyze the chaincollaboration of factors of Organizational justice and Job Motivation onthe Organizational Citizenship Behavior in Agha Khan and MaajeeHospital, Hyderabad, Sindh.
literature reVieW
organizational Citizenship Behavior and organizational Justice
A huge literature emphasized organizational justice as a substantialinterpreter of employee behavioral responses and reactions includingorganizational citizenship behavior (Singh & Singh, 2019; Chan & Lai,2017; Karriker &Williams, 2009; Cohen-Charash & Spector, 2001;Beugré, 1998). The constructive benefits of organizational justice inorganizations deals in long run that stand-in encouraging and developingworking attitudes among the employees(Vainieri, Ferrè, Giacomelli, &Nuti, 2017; Cohen-Charash & Spector, 2001). There is a strong harmonythat workforces both worth and mandate justice from their organizations(Singh & Singh, 2019; Chan & Lai, 2017; Cropanzano, Byrne, Bobocel,& Rupp, 2001).
A manifest factor to elucidate the effects of organizational justice in theorganization is social exchange theory (SET), which highlights thecommunal exchanges of means from time to time (Colquitt & Zipay, 2015;Cropanzano & Mitchell, 2005; Blau, 1964). The social exchanges in theorganizations are frequently evident through human resource assistances,such as incomes, promotions, and information, which reciprocates thebehavior of employees by means of determination, benevolence, andperformance (Wu & Chiu, 2018; Foa & Foa, 1980). Though, as long workforces have confidence inequitable decision outcomes as distributive justice,
Anwar, S., Memon, H., and Jamali, N. M.
102

along with the procedures involved in such decisions are unbiased asprocedural justice, the exchanges will continue in terms of high qualitybehaviors (Chan & Lai, 2017; Colquitt, Baer, Long, & Halvorsen-Ganepola,2014; Colquitt et al., 2013; Thibaut & Walker, 1975; Adams, 1965).
This research is based to explore the key improvements required in thedomain of organizational justice and organizational citizenship behavior.Thus, the researchers have emphasized on the major factors distributiveand procedural justice through which the response of the employees inassociation with organizational structures, strategies, and official incentiveprovision decisions can be analyzed for long run effects. Some of theresearches explores that both distributive and procedural justice haveinformal impact in the organizations, due to the favorable atmospheremaintained by the executives, in regards of sharing information andsometime being respectful and courteous to the employees (Mattaet al.,2017; Scott, Garza, Conlon, & Kim, 2014).
Distributive justice highlights the equality in allocations of out comescomprising reimbursements, promotions and in official obligation(Karriker & Williams, 2009). However, the procedural justice deals withthe fairness of the procedure in terms of strategies, policies and standardsfor the determination of best results (Chan & Lai, 2017; Cohen-Charash& Spector, 2001; Lind & Tyler, 1988). Once the employees feel satisfiedin justice, their quality performance will be promoted through faith, belief,revelation and constructive behavior ((Li, Zhang, Zhang, & Zhou, 2017;Lam, et al., 2013). Though the citizenship behavior reveals servingvoluntarily, ethically, and interacting with subordinates to improveperformance in the organization for the betterment of employees (Li,Zhang, Zhang, & Zhou, 2017; Lam et al., 2013; Konovsky & Pugh, 1994;Niehoff & Moorman, 1993). Therefore, the researcher assume that thefactors of organizational justice namely distributive and procedural justiceplays an influential role in the development of organizational citizenshipbehavior. Thus, when employees feel satisfied from the expected andacceptable sources of justice, they get enthused to perform citizenshipbehaviors because of the organizational justice in the organizations.
Work Motivation and organizational Citizenship Behavior
The term motivation has an origin from the expression to move,progress or ambition a task to accomplish with success. Among the factorsof organizational resources, the human resource is the most imperative for
Examining the Association of Organizational Justice,
Job Motivation and Organizational Citizenship Behavior
103

the organization’s competitive advantage (Rizwan et al., 2010). Theperformance of employers determined by many aspects like personnelappraisal, motivation, remuneration and reimbursements, job satisfaction,job security and training for the development of employees. The structureof organization, strategies of company, organizational culture, relationshipwith subordinates but the element of motivation is having a greatinfluencing impact on the performance of employees.
To lead the high level of employee performance and commitment,aspiring managers use motivation technique to achieve the organizationalgoals. Highly motivated human resource is quick to respond in fulfillmentof their responsibilities as a result; they become determined to meet theobjectives of the organization. Manzoor (2012) is of the opinion that noany human resource provides their services without cost or any incentive.Though, they look for high compensations, therefore the higher authoritiesin this regard should satisfy their employees by providing them theirdesirable remunerations. Among all the motivational factors money has agreat significance, no any other motivator can be more influential thanmoney in the enhancing the employee behavior (Sara et al., 2004). It has agreat dominant character that fascinate, motivate and maintain higher levelsof employees’ performance (Manzoor, 2012). Rewards are the sources ofjob satisfaction among employees that enhance the quality of employeeperformance through organizational citizenship behavior (Kalimullah etal., 2010). Such supplementary encouragements make personnel moredetermined because of the extra outlays they receive other than the salaries.To establish the high level of performance among employees it is veryessential for employers to understand the concepts of motivation (Ganta,2014). Motivation can encourage the performance of employees in differentways likewise it supports in managing the citizenship behavior ofemployees, accomplish the goals of the organization, create jobsatisfaction, promotes the efficiency of employees, provide assistances toboth employers and peers to achieve their individual goals, inspires teamsynchronization and ensures organizational citizenship behavior byencouraging the human resource.
Though in literature, organizational citizenship behavior has been foundvery beneficial in many organizations, it is significant to found the factorsthat are engage in organizational citizenship behavior in the place of work.Some of the researches have explored that individual factors lead to
Anwar, S., Memon, H., and Jamali, N. M.
104

organizational citizenship behavior has been broadly characterized into threeareas: individual traits of personality, individual attitude towards fairnessperception and qualities of a leadership (Singh & Singh, 2019; Borman,Penner, Allen, & Motowidlo, 2001; Pillai, Schriesheim, & Williams,1999;Konovsky & Organ,1996; Organ & Ryan,1995; Bateman & Organ, 1983).The perceived faithfulness towards rules, organizational justice imitatesuitable decision perspectives that has great influence on several essentialjob-related standards, comprising job attitudes of an individual, personalappraisal, deviance and citizenship along with return of outcomes from eachunit-level (Singh & Singh, 2019; Colquitt et al., 2013; Colquitt, Conlon,Wesson, Porter, & Ng, 2001). However, no any research is foundinvestigating the chain collaboration of factors of organizational justicenamely distributive and procedural along with job motivation towards theorganizational citizenship behavior in the context of Pakistan. For thefulfillment of this gap, the researchers proposed to explore the factors oforganizational justice with job motivation towards the organizationalcitizenship behavior among the nurses engage in Agha Khan and MaajeeHospital, Hyderabad, Sindh, Pakistan.
Conceptualization and Development of Hypotheses
factors of organizational Justice and organizational Citizenship
Behavior
Organizational justice is considered as a significant element forevaluations of employee in the organizations (Colquitt et al., 2013). Theperception of justice explores the work outcomes as employees come todevelop commitments to respond the fair treatment, received from thedecision-making authorities, in the form of positive and constructiveattitudes, determination, and productive work behaviors towards theorganizations(Singh & Singh, 2019; Cropanzano & Byrne, 2001;Konovsky, 2000; Blau, 1964). Although, employees are concerned withany just or unjust treatment received by them to react with positive ornegative approach, therefore the perception of justice can also improve orreduce (Park et al., 2015; Jones & Skarlicki, 2013; Hausknecht et al.,2011). The individuals can improve their perception about justice whenthey found their situation as being treated fairly, likewise reasonableincrease in pays, increased input into decisions, however this can movereciprocal if they found their situations treated less fair in the way ofunjustified pay cuts, decreased input beseeched. In this research it isexplored that the organizational justice is changed systematically
Examining the Association of Organizational Justice,
Job Motivation and Organizational Citizenship Behavior
105
meaningful, not random, fluctuations and therefore useful for prediction(George & Jones, 2000; Chan, 1998).
Thus, the concern of organizational justice is based on the perceptionof employees about the fair treatment they receive in return from theirjobs, on the basis of distributive justice and procedural justice (Colquitt,2001). The distributive and procedural justices emphasize on specificquality of outcomes distributive and the process of decision making. Thiscan be considered as the role of the organization strategies and proceduresthat assure each employer in an organization will follow equivalentevaluation and performance standards. While comparing the distributiveand procedural justices, the subordinates’ perception of fairness receivesfrom the higher authorities based on the chronological routinecollaboration can be easily managed if the concerned authorities fulfilltheir responsibilities in rational manners. Several researches explore thedistributive and procedural justice as a key factor of organizational justicehas a great impact on employers approaches and performances in regardsof behaviors (Chan & Lai, 2017; Ambrose & Schminke, 2009; Williams,Pitre, & Zainuba, 2002; Colquitt, Conlon, Wesson, Porter, &Ng, 2001;Moorman, 1991). In some other research studies the organizationalmarvels in concern of organizational justice have focus on diversedynamics (Rubenstein, Allen, & Bosco, 2017; George & Jones, 2000).However, the conceptualization of researcher proposed, that employeesapply the factors of distributive justice, procedural justice and jobmotivation to make sense of justice events in their job career. Moreover,employees analyze from these factors of organizational justice andmotivation about the organizational authorities which assist them topredict about their future. Thus, organizational justice can be consideredas an essential factor in organizational citizenship behavior (Singh &Singh, 2019; Organ, 1988). The two theories social exchange theory andequity theory are the origin for enlightening the relationship betweenorganizational citizenship behavior and organizational justice(Singh &Singh, 2019; Rubenstein et al., 2017; Moorman 1991; Adams, 1965; Blau,1964). According to equity theory employees take efforts to adjust theirstruggles in order to reduce the anxiety that has been produced due toinequity they receive from the organization (Adams, 1965). Results ofsuch fairness or unfairness act of higher authorities can be the cause rootof organizational citizenship behavior (Singh & Singh, 2019; Organ,1988). However, the theory of social exchange well-thought-out the
Anwar, S., Memon, H., and Jamali, N. M.
106

significance of organizational citizenship behavior as an interchange ofrelationships among employees and employers (Moorman, 1991; Organ,1990). With the support of literature, the employees satisfied with the fairtreatment of authorities incline to participate in organizational citizenshipbehavior (Chan & Lai, 2017; Wong et al., 2006). When the employeesfound themselves as valuable resource, the fairness in procedures canperform as a channel to communication. The welfare of the employees inthe organizations are also sustained by the employers by means oforganizational citizenship behavior (Chan & Lai, 2017; Niehoff &Moorman, 1993; Lind & Tyler, 1988). Whereas, the employees sufferingfrom discrimination or inequality would pull out their organizationalcitizenship behavior or make their struggles limited to accomplish thecontract based obligations of organization (Fassina et al., 2008). A numberof research studies have established the affirmative relationship amongthe factors of organizational justice that is distributive and proceduraljustice with the organizational citizenship behavior. The anticipation oforganizational citizenship behavior can be explored by distributive andprocedural justice that has a positive relationship based on fair interactivebehavior of employers ((Li et al., 2017; Karriker & Williams, 2009;Colquitt et al.,2001; Cohen-Charash & Spector, 2001). Subsequentlyhuman resources are more motivated to fulfill their responsibilities andremain faithful to their organizations by interchange in a fair workingenvironment when they receive fair outcomes (Chan & Lai, 2017; Karriker& Williams, 2009; Zapata-Phelan et al., 2009; Cropanzano & Mitchell,2005), thus, the relationship between organizational citizenship behaviorand distributive and procedural justice was hypothesized as follows: H1 Distributive Justice has a substantial impact on the performance of
nurses towards organizational citizenship behavior.
H2 Procedural Justice has a substantial impact on the performance of
nurses towards organizational citizenship behavior.
Job Motivation and organizational Citizenship Behavior
From the extent literature review the relationship between motivationand organizational citizenship behavior was found very strong andaffirmative. Huge literature of organizational behavior explores that theorganizational citizenship behavior is based on motivational attitude ofemployees that assures organizational citizenship behavior develops dueto motivation (Davila & Finkelstein, 2013; Ariani, 2012). Some of theresearchers are of the opinion that employees engaged in organizational
Examining the Association of Organizational Justice,
Job Motivation and Organizational Citizenship Behavior
107
citizenship behavior depends on the perception of authorities developedfor the motivation of employee and to accomplish their expectations (Allen& Rush, 1998). As a result, the expectation that there is a substantialimpact of sources of motivation in the development of relationshipbetween employee organizational citizenship behavior was furtherexplored (Ghanbari & Eskandari, 2013). Conferring to organizationalcitizenship behavior dimensions and a meta-analysis conceptualization thehighly correlated relationship between motivation and organizationalcitizenship behavior was recognized with no obvious distinction inrelationships with the most popular set of organizational citizenshipbehavior precursors (LePine, Erez & Johnson, 2002; Organ, 1988). Thus,with the assistance of intrinsic motivation the employers encourage theirundertakings in a satisfying work environment for themselves and for theirsubordinates. Thus, it can be assumed that employers who enjoy their workare more likely to assist others and create a helping working climate andwhile finding organizational citizenships behaviors as pleasurable.Preceding researches indicated that there is a negative impact of extrinsicmotivation on organizational citizenships behaviors, for the reason thatthe extrinsic motivation is based on the component of social reward likewages, salaries remuneration however the organizational citizenshipsbehaviors cannot be provided from such formal rewards by the higherauthorities (Barbuto et al., 2000; Barbuto & Scholl, 1999). This conceptwas sustained by Herzberg’s motivation theory that explores the factorsof extrinsic rewards have not much strong motivation level, its presencecan only avoid the dissatisfaction of employees. Though, current researchstudy demonstrates that intrinsic motivation has excessive influence onorganizational citizenships behaviors without ignoring the impact ofexternal motivation. Both the intrinsic as well extrinsic motivation incorporation improves and supports the organizational citizenshipsbehaviors (Ibrahim & Aslinda, 2014). The intrinsic conditions andextrinsic rewards both can motivate the employees in same manner andthis can provide top priority to the organizational citizenship behavior.According to the opinion of Organ (1997) employees practice indirect andinformal views about future rewards in their decisions to perform incertain organizational citizenship behaviors. Though, the highly motivatedemployees are found highly committed to contribute in the success oforganization and execute the organizational citizenship behaviors (Ibrahim& Aslinda, 2014). Consequently, the elements that can have mediating rolelike perceived organizational support, job satisfaction, psychological
Anwar, S., Memon, H., and Jamali, N. M.
108

empowerment, job involvement, employee engagement, organizationaljustice and the combination of intrinsic and extrinsic motivation based onexpectancy theory of Herzberg’s Two Factor theory, that may ground thebasis for high level of organizational citizenship behavior. Thus, thecorrelation among job motivation and organizational citizenship behaviorwas hypothesized such as:
H3 Job motivation has a substantial impact on the performance of nurses
towards organizational citizenship behavior.
researCH MetHoDologY
This research study has taken place to examine the association betweenorganizational justice factors such as distributive, procedural and jobmotivation factors and organizational citizenship behavior. The adoptionof cross-sectional approach is implemented in which the data was collectedthrough a survey questionnaire.
Population and Procedure
Population of this research study are all nurses in 10 patient wards at AghaKhan Hospital and 8 patient wards at Maajee Hospital. Through randomsampling the data was collected from the nurses on duty. The purpose behindthis study is to examine the association among the factors of organizationaljustice that are distributive and procedural along with the factor of jobmotivation towards the organizational citizenship behavior in private sectorhospitals. Distribution of survey questionnaire was completed by the directpersonal visit to the participants. The collection of primary data in this study
Examining the Association of Organizational Justice,
Job Motivation and Organizational Citizenship Behavior
109

were obtained using a closed ended questionnaire. The consent from theparticipant to participate in this research study was taken through a formalconsent form along with the covering letter explaining the purpose of thisresearch, then the questionnaires were dispatched to individual separately.Thus, the responses of this survey questionnaire was measured on the basis offive point Likert scale where 1 specifies the concern of strongly disagree, 2exposes the level of disagree, 3 expresses the degree of uncertainty, 4 exploresthe agreed level of response, however 5 directs the concern of strongly agree.
Measurement scales
The application of independent variables by the researchers aredistributive, procedural, and job motivation along with the demographicinformation about the respondents and the organizational citizenshipbehavior was observed as dependent variable. With the assistance of five-point Likert scale, the variables were measured through various items toanalyses the responses of the respondents.
Distributive justice- This independent variable was analyzed byconsuming four items that were formerly settled by Leventhal (1976) andfurther modified by Colquitt, et al., (2001).
Procedural justice- This independent variable was explored with theusage of seven-item scale settled by Colquitt (2001), initially based onLeventhal (1976) and Thibaut and Walker (1975).
Job Motivation-This scale was measured six items adapted by theindex scale that was developed by Smith, Kendall & Hulin (1969).
organizational citizenship behavior-Aneight-item scale was used tomeasure respondents’ organizational citizenship behavior moderated byPodsakoff et al. (1990).
Demography-The demographic scale was based on age, years ofworking, gender, marital status, and educational level.
Data analYsis anD results
The analyses of data were accomplished by using Statistical Packagefor Social Sciences (SPSS) version 24.0 for windows and Analysis ofMoment Structures (AMOS).
Anwar, S., Memon, H., and Jamali, N. M.
110

assessment of reliability
The authorization of reliability known as internal consistency of thesurvey questionnaire items was confirmed through Cronbach’s alpha.Where, the overall reliability was found to be 0.87, according to Georgeand Mallery, (2003) which is considered as excellent. Though, thereliability of other factors were found satisfactory (Table 1).
Table 1: Reliability of Factors N= 234
Descriptive statistics
The observation of mean and standard deviation explores the significanceof collection and distribution for a data set that has been gathered from therespondents. The range of mean was observed among 2.12 to 3.11. Althoughthe range of standard deviation persisted among 1.09 to1.52 (Table 2).
Table 2: Descriptive Statistics N=234
Note: M=mean, SD=standard deviation.
structural Modeling testing
Through the technique of Structure Equation Modeling (SEM) thisresearch study has approve the relationships between the dependent andindependent variables. However, the values of fit indices put forward thatall the indicators of model fitness indicate the endorsed values (Marsh &Hocevar, 1985; Hair et al., 2006) (Table 3). As a result, the fitness ofmodel expresses the chain collaboration of distributive justice, proceduraljustice, job motivation on organization citizenship behavior. Moreover,the covariance among the variables was also assured along with factorloadings (Figure 1).
s.no. Variables Variable Code alpha
1 Distributive justice DJ .89
2 Procedural justice PJ .88
3 Job motivation JM .78
4 Organizational citizenship behavior OCB .82
s.no. Variables M sD
1 Distributive justice 2.74 1.40
2 Procedural justice 2.12 1.52
3 Job motivation 3.09 1.26
4 Organizational citizenship behavior 3.11 1.09
Examining the Association of Organizational Justice,
Job Motivation and Organizational Citizenship Behavior
111
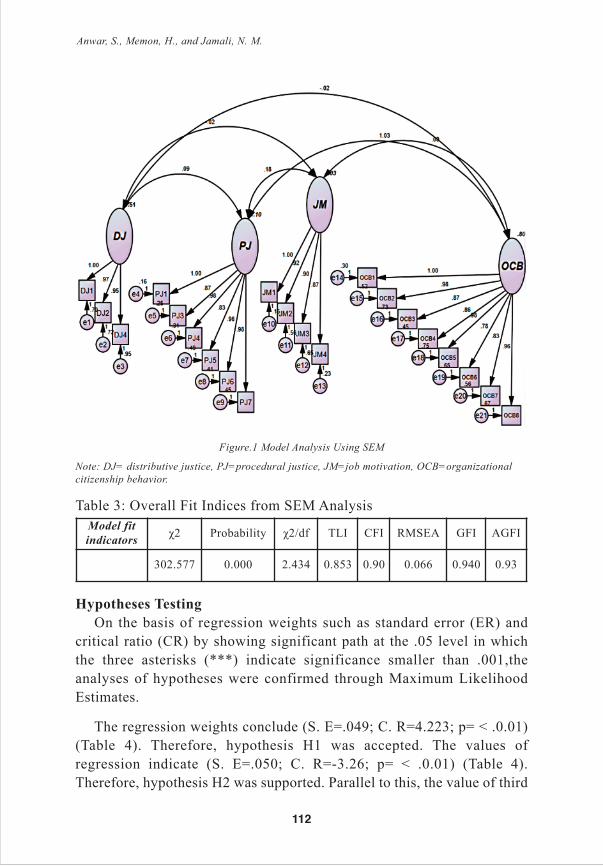
Figure.1 Model Analysis Using SEM
Note: DJ= distributive justice, PJ=procedural justice, JM=job motivation, OCB=organizational
citizenship behavior.
Table 3: Overall Fit Indices from SEM Analysis
Hypotheses testing
On the basis of regression weights such as standard error (ER) andcritical ratio (CR) by showing significant path at the .05 level in whichthe three asterisks (***) indicate significance smaller than .001,theanalyses of hypotheses were confirmed through Maximum LikelihoodEstimates.
The regression weights conclude (S. E=.049; C. R=4.223; p= < .0.01)(Table 4). Therefore, hypothesis H1 was accepted. The values ofregression indicate (S. E=.050; C. R=-3.26; p= < .0.01) (Table 4).Therefore, hypothesis H2 was supported. Parallel to this, the value of third
Model fit
indicatorsχ2 Probability χ2/df TLI CFI RMSEA GFI AGFI
302.577 0.000 2.434 0.853 0.90 0.066 0.940 0.93
Anwar, S., Memon, H., and Jamali, N. M.
112

hypothesis in the regression weights were (S. E= .043; C. R= .080; p= >0.932) (see Table 4). As a result, H3 was rejected.
Table 4: Regression Weights
Note: SE=standard error, C. R= critical ratio, p=significance level
DisCussion anD ConClusion
This research study was conducted to examine the association of factorsof organizational justice and job motivation towards organizationalcitizenship behavior. To accomplish this purpose, a survey questionnairewas adopted to analyses the organizational citizenship behavior amongnurses of private hospitals in Sindh, Pakistan. The overall reliability wasmaintained as .87, whereas the reliability of other factors were also foundsatisfactory.
The survey questionnaires that were received by the researcher fromthe respondents, was having total number of items. In the initial stage ofreturn questionnaire, total number of items was 25 (distributive justice =4,procedural justice=7, job motivation=6 and organizational citizenshipbehavior=8). In the process of Exploratory Factor Analysis (EFA) someinappropriate items such as 2 from procedural justice, 1 from distributivejustice and 2 items from the job motivation were not loaded above thesuggested value of factor loading 0.5 (Hair et al., 2006). Although all (8)items of organizational citizenship behavior factor were loaded above thevalue of .5 (Hair et al., 2006). Thus, the items that were not loaded wereexcluded from the further analysis of this research.
The proposed H1 distributive justice has a significant influence on theperformance of nurses towards organizational citizenship behavior. Theanalyses of this research confirm the significant influence on theperformance of nurses towards the organizational citizenship behavior in
Dependent Variable PathIndependent
VariablesEstimate S.E. C.R. P
H1OrganizationalCitizenship Behavior
<==Distributive
justice.278 .049 4.223 ***
H2OrganizationalCitizenship Behavior
<==Procedural
justice.159 .050 3.26 ***
H3OrganizationalCitizenship Behavior
<==Job
motivation.030 .043 .080 .932
Examining the Association of Organizational Justice,
Job Motivation and Organizational Citizenship Behavior
113
Hyderabad, Sindh, Pakistan. These results are consistent with researcherslike Cohen-Charash & Spector, (2001); Cropanzano & Mitchell, (2005);Karriker & Williams, (2009); Zapata-Phelan et al., (2009) & Singh &Singh (2019) who confirmed the positive relationship between distributivejustice and organizational citizenship behavior. Thus, the proposed H2procedural justice has a significant influence on the performance of nursestowards organizational citizenship behavior. The outcomes of this reserachwere also supported by the various scholars such as Cohen-Charash &Spector, (2001); Cropanzano & Mitchell, (2005); Karriker &Williams,(2009); Zapata-Phelan et al., (2009); Singh & Singh (2019) according towhom procedural justice has also positive relationship with organizationalcitizenship behavior.
Regarding the results of final hypothesis H3, the regression weightsexplored the non-significant relationship between job motivation andorganizational citizenship behavior. Thus such negative results areaccording to the Barbuto and Scholl, (1999); Barbuto et al. (2000); &Ahmed & Khan, (2016). These researchers have also discussed thepositive and negative relationship between job commitment andorganizational citizenship behavior. In conclusion, the analyses of thisresearch study determined from the model analysis through structuralequation modeling that there is a significant influence of distributive andprocedural justice on the performance of nurses towards organizationalcitizenship behavior. Whereas, there is no significant influence wasfound of job motivation towards organizational citizenship behavioramong the nurses of private hospitals in Hyderabad, Sindh, Pakistan.This may be due to the fact that the relationship between fellow nurseswas less pleasant, because of the division of work among morning,afternoon and evening duties. Some other complications may includedue to the irregularities of some nurses. Furthermore, one of the factcould be the less coordination among the employers and subordinates.One of the important factor that was explored was the dissatisfaction ofthe nurses from the salary packages that they receive. Along with aboveconcluded problems, some other are as follow like limited promotionand lack of transparency that demotivate the morality of the nurses inassuring their quality of work. On the basis of above findings, bothhospitals should make developments toward the variables like jobmotivation to enhance the performance of nurses in their hospitals.Along with this they must undertake such policies and procedures that
Anwar, S., Memon, H., and Jamali, N. M.
114

optimize the performance of nurses. As a result, still there is muchremain to be done by these two hospital in increasing the performanceof nurses in regards of enhancement of organizational citizenshipbehavior.
Examining the Association of Organizational Justice,
Job Motivation and Organizational Citizenship Behavior
115

referenCes
Adams, J. S. (1965). Inequity in social exchange. In L. Berkowitz (Ed.),Advances in Experimental Social Psychology. 267-299. NewYork: Academic Press.
Alhaji, I. A., & Yusoff, W. F. W. (2012). Does Motivational FactorInfluence Organizational Commitment and Effectiveness? AReview of Literature. Journal of Business Management and
Economics, 3 (1), 1-9.
Allen, T. D., & Rush, M. C. (1998). The effects of organizational citizenshipbehavior on performance judgments: A field study and a laboratoryexperiment. Journal of Applied Psychology, 83(2), 247–260.
Ambrose, M. L., & Schminke, M. (2009). The role of overall justicejudgments in organizational justice research: A test of mediation.Journal of Applied Psychology, 94, 491–500.
Ariani, D. W. (2012). Relationship Motives, Personality, and OrganizationalCitizenship Behavior in Academic Staffs in Indonesia. international
Journal of Business and Social Science, 3(20), 311–319.
Ariani, Dorothea W. (2012). Comparing motives of organizationalcitizenship behavior between academic staffs universities andteller staffs banks in Indonesia. international Journal of Business
and Management,7(1).
Ariani, D. W. (2012). Relationship Motives, Personality, and OrganizationalCitizenship Behavior in Academic Staffs in Indonesia. international
Journal of Business and Social Science, 3(20), 311–319.
Ariyani, I., Haerani, S., & Maupa, H. (2016). The Influence ofOrganizational Culture, Work Motivation and Working Climateon the Performance of Nurses through Job Satisfaction,Organizational Commitment and Organizational CitizenshipBehavior in the Private Hospitals in Jakarta, Indonesia. Scientific
Research Journal (SCiRJ), iV(VII), 15–29.
Bateman, T. S., & Organ, D. W. (1983). Job satisfaction and the goodsoldier: The relationship between affect and employeecitizenship. Academy of Management Journal, 26, 587–595.
Barbuto, J. E., & Scholl, R. W. (1999). Leaders motivation and perception
Anwar, S., Memon, H., and Jamali, N. M.
116

of followers motivation as predictors of influence tactics used.Psychological Reports, 84, 1087-1098.
Barbuto, J. E., Fritz, S. M., & Marx, D. (2000). A field study of twomeasures of work motivation for predicting leaders’transformational behavior. Psychological Reports, 86, 295-300.
Borman, W. C., Penner, L. A., Allen, T. D., & Motowidlo, S. J. (2001).Personality predictors of citizenship performance. international
Journal of Selection and Assessment, 9, 52–69.
Beugré, C. D. (1998). Managing fairness in organizations. Westport CT:Greenwood Press.
Blau, P. M. (1964). Exchange and power in social life. New York: Wiley.
Chan, D. (1998). The conceptualization and analysis of change over time:An integrative approachincorporating longitudinal mean andcovariancestructures analysis (LMACS) and multiple indicatorlatent growth modeling (MLGM). Organizational Research
Methods,1, 421-483.
Chan, S. H. J., & Lai, H. Y. I. (2017). Understanding the link betweencommunication satisfaction, perceived justice and organizationalcitizenship behavior. Journal of Business Research, 70, 214–223.
Cohen-Charash, Y., & Spector, P. E. (2001). The role of justice inorganizations: A meta-analysis.Organizational Behavior and
Human Decision Processes, 86(2), 278–321.
Colquitt, J. A., Conlon, D. E., Wesson, M. J., Porter, C. O., & Ng, K. Y.(2001). Justice at the millennium: A metaanalytic review of 25years of organizational justice research. Journal of Applied
Psychology, 86, 425-445.
Colquitt, J. A., Noe, R. A., & Jackson, C. L. (2002). Justice in teams:Antecedents and consequences of procedural justice climate.Personnel Psychology, 55, 83-109.
Colquitt, J. A., Scott, B. A., Rodell, J. B., Long, D. M., Zapata, C. P.,Conlon, D. E., Wesson, M. J. (2013). Justice at the millennium,a decade later: A meta-analytic test of social exchange and affect-based perspectives.Journalof Applied Psychology, 98, 199-236.
Examining the Association of Organizational Justice,
Job Motivation and Organizational Citizenship Behavior
117

Colquitt, J. A., Baer, M. D., Long, D. M., & Halvorsen-Ganepola, M. D.K. (2014). Scale indicators of social exchange: A comparison ofrelative content validity. Journal of Applied Psychology, 99, 599-618.
Colquitt, J. A., & Zipay, K. P. (2015). Justice, fairness, and employeereactions. Annual Review of Organizational Psychology and
Organizational Behavior, 2, 11.1-11.25.
Cropanzano, R., & Mitchell, M. S. (2005). Social exchange theory: Aninterdisciplinary review. Journal of Management, 31, 874 -900.
Cropanzano, R., Byrne, Z. S., Bobocel, D. R., & Rupp, D. E. (2001).Moral virtues, fairness heuristics, social entities, and otherdenizens of organizational justice. Journal of Vocational
Behavior, 58, 164-209.
Davila, M. C., & Finkelstein, M. A. (2013). Organizational Citizenshipbehavior and wellbeing: preliminary results. international
Journal of AppliedPsychology, 3(3), 45-51.
Eisenberger, R., Huntington, R., Hutchison, S., & Sowa, D. (1986).Perceived organizational support. Journal of Applied Psychology,71, 500-507.
Fassina, N. E., Jones, D. A., & Uggerslev, K. (2008). Relationship clean-up time: Using meta analysis and path analysis to clarifyrelationships among job satisfaction, perceived fairness, andcitizenship behaviors. Journal of Management, 34(2), 161–188.
Foa, E., & Foa, U. (1980). Resource theory: Interpersonal behavior asexchange. In K. J. Gergen, M. S. Greenberg, & R. H. Willis(Eds.), Social exchange: Advances in theory and research: 77-94. New York: Plenum Press.
George, J. M., & Jones, G. R. (2000). The role of time in theory and theorybuilding. Journal of Management, 26, 657-684.
Ghanbari, S., & Eskandari, A. (2013). Organizational Climate, JobMotivation and Organizational Citizenship Behavior.international Journal of Management Perspective, 1(3), 1–14.
Greenberg, J., & Colquitt, J. A. (2005). In N. J. (Ed.), Handbook of
Anwar, S., Memon, H., and Jamali, N. M.
118
organizational justice (eds.). Lawrence Erlbaum Associates.
Hausknecht, J. P., Sturman, M. C., & Roberson, Q. M. (2011). Justice asa dynamic construct: Effects of individual trajectories on distalwork outcomes. Journal of Applied Psychology, 96, 872-880.
Ibrahim, M. A., & Aslinda, A. (2013). Relationship betweenOrganizational Commitment and Organizational CitizenshipBehavior (OCB) at government owned corporation companiesJournal of Public Administration and Governance.
Jiang, Z., Gollan, P. J., & Brooks, G. (2017). Relationships betweenorganizational justice, organizational trust and organizationalcommitment: a cross-cultural study of China, South Korea andAustralia. international Journal of Human Resource
Management, 28(7), 973–1004. http://doi.org/10.1080/09585192.2015.1128457
Jones, D. A., & Skarlicki, D. P. (2013). How perceptions of fairness canchange: A dynamic model of organizational justice.Organizational Psychology, 3, 138-160.
Karriker, J. H., & Williams, M. L. (2009). Organizational justice andorganizational citizenship behavior: A mediated multifocalmodel. Journal of Management, 35(1), 112–135.
Konovsky, M. A. (2000). Understanding procedural justice and its impacton business organizations. Journal of Management, 26, 489-511.
Konovsky, M. A., & Pugh, S. D. (1994). Citizenship behavior and socialexchange. The Academy of Management Journal, 37(3), 656–669.
Konovsky, M. A., & Organ, D. W. (1996). Dispositional and contextualdeterminants of organizational citizenship behavior. Journal of
Organizational Behavior, 17,253–266.
Lam, L. W., Loi, R., & Leong, C. (2013). Reliance and disclosure: Howsupervisory justice affects trust in supervisor and extra-roleperformance. Asia Pacific Journal of Management, 30, 231–249.
LePine, J. A., Erez, A., & Johnson, D. E. (2002). The nature anddimensionality of organizational citizenship behavior: A critical
Examining the Association of Organizational Justice,
Job Motivation and Organizational Citizenship Behavior
119
review and met analysis. Journal of Applied Psychology, 87(1),52-65.
Leventhal, G.S. (1980). What should be done with equity theory, in K.J.Gergen, M.S. Greenberg and R.H. Illis (Eds.): Social Exchange:
Advances in Theory and Research, 27–55. New York: Plenum.
Li, X., Zhang, J., Zhang, S., & Zhou, M. (2017). A multilevel analysis ofthe role of interactional justice in promoting knowledge-sharingbehavior: The mediated role of organizational commitment.industrial Marketing Management, 62, 226–233. http://doi.org/10.1016/j.indmarman.2016.09.006
Lind, E. A., & Tyler, T. R. (1988).The social psychology of proceduraljustice. New York: Plenum.
Manzoor, Q. (2012). Impact of Employees Motivation on OrganizationalEffectiveness. European Journal of Business and Management,
3, (3), 36-44.
Marsh, H. W., & Hocevar, D. (1985). Application of confirmatory factoranalysis to the study of self-concept: First- and higher orderfactor models and theirinvariance across groups,. Psychological
Bulletin, 97, 562–582.
Matta, F. K., Scott, B. A., Colquitt, J. A., Koopman, J., & Passantino, L.G. (2017). Is consistently unfair better than sporadically fair? Aninvestigation of justice variability and stress. Academy of
Management Journal, 60, 743-770.
Meyer, M., Ohana, M., & Stinglhamber, F. (2018). The impact ofsupervisor interpersonal justice on supervisor-directedcitizenship behaviors in social enterprises: a moderatedmediation model. international Journal of Human Resource
Management, 29(20), 2927–2948.
Moorman, R. H. (1991). Relationship between organizational justice andorganizational citizenship behaviors: Do fairness perceptionsinfluence employee citizenship. Journal of Applied Psychology,
76(6), 845–855.
Naumann, S. E., & Bennett, N. (2002). A case for procedural justice
Anwar, S., Memon, H., and Jamali, N. M.
120

climate: Development and test of a multilevel model. Academy
of Management Journal, 43, 881-889.
Niehoff, B. P., & Moorman, R. H. (1993). Justice as a mediator betweenmethods of monitoring and organizational citizenship behavior.The Academy of Management Journal,36, 527–556.
Organ, D. W. (1988). Organizational citizenship behavior: The goodsoldier syndrome. Lexington, MA: Lexington Books.
Organ, D. W., & Ryan, K. (1995). A met analytic review of attitudinal anddispositional predictors of organizational citizenship behavior.Personnel psychology, 48(4), 775-802.
Organ, D. W. (1997). Organizational citizenship behavior: It’s constructclean-up time. Human Performance, 10,85-97.
Park, S., Sturman, M. C., Vanderpool, C., & Chan, E. (2015). Only timewill tell: The changing relationships between LMX, jobperformance and justice. Journal of Applied Psychology, 100,
660-680.
Pillai, R., Schriesheim, C. A., & Williams, E. S. (1999). Fairnessperceptions and trust as mediators for transformational andtransactional leadership: A two-sample study. Journal of
Management, 25, 897–933.
Podsakoff, N. P., Whiting, S. W., Podsakoff, P. M., & Blume, B. D. (2009).Individual-and Organizational level consequences oforganizational citizenship behaviors: A meta-Analysis. Journal
of Applied Psychology, 94(1), 122-141.
Rizwan, K. U., Farooq, S. U., & Ullah, M. (2010). The RelationshipBetween rewards and Employee Motivation in CommercialBanks of Pakistan. Research Journal of international Studies,14, 37-52.
Rubenstein, A. L., Allen, D. G., & Bosco, F. A. (2017). What’s Past (and Present)Is Prologue: Interactions Between Justice Levels and TrajectoriesPredicting Behavioral Reciprocity. Journalof Management, XX(X),014920631772810. http://doi.org/10.1177/0149206317728107
Scott, B. A., Garza, A., Conlon, D. E., & Kim, Y. J. (2014). Why do
Examining the Association of Organizational Justice,
Job Motivation and Organizational Citizenship Behavior
121

managers act fairly in the first place? A daily investigation of hotand cold motives and discretion. Academy of Management
Journal, 57, 1571-1591.
Shah, N., Anwar, S., Iran Z., (2017). The impact of organisational justiceon ethical behaviour. international Journal of Business
innovation and Research,12(2), 240–258.
Singh, S. K., & Singh, A. P. (2019). Interplay of organizational justice,psychological empowerment, organizational citizenshipbehavior, and job satisfaction in the context of circular economy.Management Decision, 57(4), 937–952.
Smith, P. C., Kendall, L., & Hulin, C. L. (1969). The measurement of
satisfaction in work and retirement. Chicago, IL: Rand McNally.
Thibaut, J. and Walker, L. (1975) Procedural Justice: A Psychological
Analysis, Hillsdale, NJ: Lawrence Erlbaum Associates.
Vainieri, M., Ferrè, F., Giacomelli, G., & Nuti, S. (2017). Explainingperformance in health care: How and when top managementcompetencies make the difference. Health Care Management
Review, 1–12.
Williams, S., Pitre, R., & Zainuba, M. (2002). Justice and organizationalcitizenship behavior intentions: Fair rewards versus fairtreatment. Journal of Social Psychology, 142, 33–44.
Wong, Y. T., Ngo, H. Y., & Wong, C. S. (2006). Perceived organizationaljustice, trust, and Ocb: A study of Chinese workers in jointventures and state-owned enterprises. Journal of World Business,
41, 344–355.
Wu, I. L., & Chiu, M. L. (2018). Examining supply chain collaboration withdeterminants and performance impact: Social capital, justice, andtechnology use perspectives. international Journal of information
Management, 39, 5–19. http://doi.org/10.1016/j.ijinfomgt.2017.11.004.
Zapata-Phelan, C. P., Colquitt, J. A., Scott, B. A., & Livingston, B. (2009).Procedural justice, interactional justice, and task performance:The mediating role of intrinsic motivation. Organizational
Behavior and Human Decision Processes, 108(1), 93–105.
Anwar, S., Memon, H., and Jamali, N. M.
122

PerCeiVeD iMPaCt of offiCe Design on
PerforManCe of faCultY: eViDenCe
froM faCultY MeMBers Working WitH
leaDing HigHer eDuCations institutes
of karaCHi
faisal sultan*
aBstraCt
Office design is treated as one of the most important
elements which affects employee performance and well-
being. Researchers from all over the globe are
continuously striving to improve this issue through
systematic research activities. Although in Pakistan
research work associated with this issue is not only rare
but also does not have completeness and most of the
articles are banking and telecom industries. Thus, there
is potent need to analyze the impact of office design
elements with detailed perspectives of variables on
larger population size. This study tries to combine
variable inventory from prior studies and conduct the
research on higher educational institutes which are most
dominant part of higher education sector of Pakistan.
SMART PLS has been incorporated for data analysis
and predicted that entire ranges of office design
elements are significant on the performance of faculty
members of higher educational institutes. Although
relationship with supervisors as a moderator is
diminishing the impact of variables of office design and
sometimes changes the effect from positive to negative.
Keywords: Office Design, Higher Educational Sector, HEis and Employee Performance
introDuCtion
Most of the times work environment and office ergonomics are the twomajor elements which shape up employee productivity (Sehgal, 2012).Although in between these two, office design is an element which mightfoster productivity at employee as well organizational level (El-Zeiny,2012). Although employee productivity is prime dependent variable in
Journal of Business Strategies, Vol.14, No.1, 2020, pp 123–144 DOi:10.29270/JBS.14.1(20).06
123
__________________________________________________________________________________*Assistant Professor, KASBiT, Karachi

industrial & organizational psychology (Borman,2004) but workingcondition of an average office is causing exhaustion and fatigue(Chandrasekar, 2011). Similar has been also indicated by Riaz, Shoaib andSarfraz (2017) that workplace design is a major barrier for employeeproductivity rather than optimal arrangement of accessories. Study of Riazet al. (2017) also indicated poor workplace design actually hurts employee’shealth and well-being which ultimately resulted in decrease in productivity.
stateMent of ProBleM& DeliMitations
It has been observed that firms are reluctant to invest in office designfacilities as they seem to be cost centered for most of the organizations(Jaffri, 2015). Similar is valid for Pakistan where the companies are notpaying desired attention towards office design (Hameed & Amjad, 2009).Although Jaffri (2015) indicated that adequate facilities of office designmight able to induce level of employee productivity. Study also indicatedthat researchers must increase their focus towards office design throughvariation in data collection approaches.
Similarly, has been highlighted by Riaz et al., (2015) that there is asevere need of research on office design facilities with respect to Pakistanthrough taking other industries than IT. Hence studies based on othersector than IT (Riaz et al., 2017; Ullah, Mughees & Mirza, 2018), Telecom(Ullah et al., 2018) & Nadra (Jaffri, 2015), and different regions (Jaffri,2015) are optimal to induce learning and applicability of results (Jaffri,2015). Therefore to conduct study effectively research process has beenlinked with higher education sector, as the sector is treated as one of themost important sector for the development of any economy. Similarfindings are associated with Pakistan, where higher education sector isalso dominated by higher educational institutions (HEI’s). Although thereis a significant lacking of professionalism and skills in teachers henceproducts of the sector aren’t as per required standards (Asghar, 2019).
tHeoretiCal fraMeWork
This is supported by Parveen, Sohail, Naeem, Azhar, and Khan (2012) thatmaintenance of temperature is essential for work performance. On the otherhand, experiment conducted by Ulrich (2002) to introduce flowers and plantsat workplace induces the importance of color of workplace. Ulrich (2003) alsoindicated the impact of colors on innovative thinking and techniques appliedby male and female employees for solving problems. Although Sarode andShirsath (2012) posited that lightening, noise, color & air quality are the
Sultan, F.
124

elements of office design which are interconnected with each other.
On the contrary study of Sehgal (2012) conducted in India usefurniture, noise, temperature, lighting and spatial arrangement forevaluating employee productivity. The model is similar as the model ofthe study used by Hameed and Amjad (2009) for evaluating the employeeproductivity in banking sector of Pakistan. The variable inventory ofHameed and Amjad (2009) replicated by Sehgal (2012) to indicateimportance of office design in India’s scenario and also replicated byAkhtar Ali Salman Ur-Rehman and Ijaz (2014) in telecom sector ofPakistan. Although Parveen et al. (2012) indicated that elements of workenvironment must be treated differently and must not be treated as the partof office design. Thus, it has been revealed that employee performancehas been affected by variable associated with office design as well as workplace, but Parveen et al. (2012) uses furniture and temperature as the majoroffice design elements and communication and workload and relationshipwith boss as the major elements of work environment.
Study of Manggo (2014) conducted in Indonesia uses color, natural airquality, Lightening, noise, spatial arrangement, furniture and work-flowas the major variables of office design. Contrary to these latest studyconducted in Pakistan by Jaffri (2015) uses furniture, noise, lightening &spatial arrangement are the major determinants of office design. Similarlystudy of Sultan et al. (2016) uses noise, air-quality, lightening, color,office–furniture, office-equipment, communication and spatialarrangements as variable inventory. Contrary to these Saha (2016)indicated ten variables including lightening, temperature, noise, air-quality, furniture and spatial arrangement in addition with work-space,privacy, individual-design & aroma. Though recent work of Riaz et al.(2017) uses furniture, equipment, lightening, noise, temperature andspatial arrangements as the indicator of employee lesser productivity &discomfort. Pickson Bannerman and Ahwireng (2017) also uses samenumber of variables to indicate impact of office design on employeeproductivity with reference to Ghana. Although their variable inventoryis composed of one variable from work-environment and two of thevariables are general design and workplace décor, which are not focusedby most of the studies due to their generic nature. Hence variablesconsidered potent are spatial arrangements, workplace flexibility andcomfort, space available to office, state of furniture, state of equipment’s,room temperature and air quality, lightening and level of noise.
Perceived impact of Office Design on Performance of Faculty
125
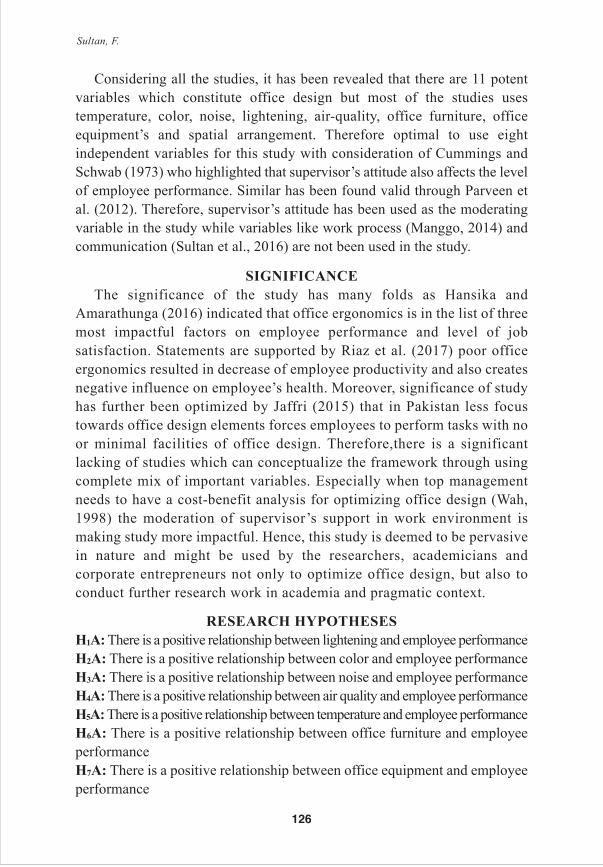
Considering all the studies, it has been revealed that there are 11 potentvariables which constitute office design but most of the studies usestemperature, color, noise, lightening, air-quality, office furniture, officeequipment’s and spatial arrangement. Therefore optimal to use eightindependent variables for this study with consideration of Cummings andSchwab (1973) who highlighted that supervisor’s attitude also affects the levelof employee performance. Similar has been found valid through Parveen etal. (2012). Therefore, supervisor’s attitude has been used as the moderatingvariable in the study while variables like work process (Manggo, 2014) andcommunication (Sultan et al., 2016) are not been used in the study.
signifiCanCe
The significance of the study has many folds as Hansika andAmarathunga (2016) indicated that office ergonomics is in the list of threemost impactful factors on employee performance and level of jobsatisfaction. Statements are supported by Riaz et al. (2017) poor officeergonomics resulted in decrease of employee productivity and also createsnegative influence on employee’s health. Moreover, significance of studyhas further been optimized by Jaffri (2015) that in Pakistan less focustowards office design elements forces employees to perform tasks with noor minimal facilities of office design. Therefore,there is a significantlacking of studies which can conceptualize the framework through usingcomplete mix of important variables. Especially when top managementneeds to have a cost-benefit analysis for optimizing office design (Wah,1998) the moderation of supervisor’s support in work environment ismaking study more impactful. Hence, this study is deemed to be pervasivein nature and might be used by the researchers, academicians andcorporate entrepreneurs not only to optimize office design, but also toconduct further research work in academia and pragmatic context.
researCH HYPotHeses
H1a: There is a positive relationship between lightening and employee performanceH2a: There is a positive relationship between color and employee performanceH3a: There is a positive relationship between noise and employee performanceH4a: There is a positive relationship between air quality and employee performanceH5a: There is a positive relationship between temperature and employee performanceH6a: There is a positive relationship between office furniture and employeeperformanceH7a: There is a positive relationship between office equipment and employeeperformance
Sultan, F.
126
H8a: There is a positive relationship between spatial arrangements andemployee performanceH9a: Negative Supervisor Attitude& Leadership Style does moderates therelationship between office equipment and employee productivityH10a: Negative Supervisor Attitude & Leadership Style does moderatesthe relationship between spatial arrangements and employee productivity
literature reVieW
Khedkar and Pawar (2015) indicated that organizations willing tosurvive in this massive era of competition must focus on health andhappiness of their workforce. This will also aid management as withoutproper office design facilities management might failed to utilize optimalcapacities of workforce (Sehgal, 2012). Linking this statement with thestatement of problem, researchers deemed to use reference of Ajala (2012)which indicated that office design varies from one company to another(Khedkar & Pawar, 2015). Although effective facilities associated withoffice design are always resulted in attraction, satisfaction, motivation &retention of employees. This is valid as office design is efficient in makingpeople happy while working & also provide them pride and purpose toreach goals as per their capacities and standards (Saha, 2016). Althoughto device effective office design and facilities, management mustunderstand that how workplace affects behavior of employees & how workforce behavior is correlated with performance at workplace (Parveen etal., 2012). Studies addressing office design elements are conducted allover the globe and highlighted elements which are creating positiveimpacts and negative impacts on employees (Sarode & Shirsath, 2012).Although Riaz et al. (2017) indicated need of further studies on officedesign elements therefore the literature will address all the potent variableshighlighted by prior studies and theoretical framework.
lightening
Artificial light is treated as important element in office as well as in anylearning environment (Knez & Hygge, 2001). One of the initial studies onoffice design facilities indicated that considerable increase in indoorlightening at workplace is treated as the efficient technique to enhance levelof productivity (Abdou, 1997). Lightening has also numerous intangiblebenefits as it decreases rates of accident and also optimizes employeemorale (Liaqat, Chang, Gani, Ab Hamid, Toseef, Shoaib & Alli, 2017).Similar has been evident through Ahmad Khan and Ali (2016), that lighthas been directly associated with the level of performance of employees.
Perceived impact of Office Design on Performance of Faculty
127

Study also indicated that the relationship exists as lightening systemdoes not only affect eyes but also has a correlated with headache andnervous complaints. Hence it is legitimate to believe Riaz et al. (2017)that lightening is a significantly important factor in creating conducingwork environment. Similar has been revealed by Yusof et al. (2017) thatpoor lightening facilities create more drastic effect on productivity of maleemployees.
Color
Kamarulzaman Saleh Hashim Hashim and Abdul-Ghani (2011)indicated that color is defined as visual phenomenon which we observedue to prompt of light. It is treated as one of the ecological factor whichaffects employee performance at workplace (Vischer, 1989). Eiseman(2006) posited that there is no question regarding the significance of colorin workplace in fact its structure and shades influence functions performedin offices (Guest & Van Laar, 2000). This is found to be valid as everyonehas own way to experience color as reaction towards color is linked toone’s education, socio-economic level, culture & genetics. Thus color hasa potent impact on the level of productivity of individual working in anyorganization (Kamarulzaman et al., 2011). Use of color will also makeworkplace more attractive, efficient to work as well as attractive ifmanagement in corporate facilities in accordance with its employees(Eiseman, 2006).
noise
Riaz et al. (2017) indicated that there are several studies whichindicated impact of noise on performance of employees. Although it istermed as non-tolerate able element associated with office design(Kamarulzaman et al., 2011). This statement is valid as noise does not onlyinclude discussion and words but also noise made by machines and toolsused in office (Kamarulzaman et al., 2011 & Loewen & Suedfeld, 1994).This is legitimated by the experiment conducted by Toftum LundKristiansen and Clausen (2012), which indicated that increase in noiseleads to decrease in level of productivity. Similar has been indicated bythe study of Jaffri (2015) that most disastrous element for employeeproductivity exits in the form of noise which is produced by speeches,telephones and traffic etc.
Although effect of noise on the level of productivity is based upon ofintensity of sound, duration, exposure to sound and also on nature of task
Sultan, F.
128

that needs to be performed. Smith, (1989) also indicated that noise hasdifferent impact on both the genders as indicated by Amina and Amjad(2009), that female prefer chatting and discussion and hence they areable to work better as compared to their counterparts in noisyenvironments.
air Ventilation
Quality of office design is of immense importance as employee spedextensive time inside their offices (Dorgan & Dorgan, 2005). Good airquality in offices does not only decrease health complaints, but alsooptimizes the level of productivity (Dalbokova & Krzyzanowski, 2002).Similar has been indicated by Ahmad et al. (2016) that quality ofproduction is optimized due to good indoor air quality. Hence there issufficient evidence to believe Dorgan and Dorgan (2005) that occupants’level of productivity is negatively related with poor indoor air quality.
temperature
Study of Montgomery (2004) highlighted the provision made by WorldHealth Organization (WHO) that maximum limit of temperature at anyworking place is 24ºC. This provision has been made as raise intemperature might diminish productivity through affecting Shaken BabySyndrome (SBS) symptoms and decreased satisfaction with air quality(Hygge & Knez, 2001). Sparks, Cable, Doran, and Maclaren (2005), alsoindicated that increase of temperature might harm performance ofemployees. Although recent work by Riaz et al. (2017) makes someinsertion that length of the task & duration for which employeeexperiences increased level of temperature also have significance impacton performance.
Seppanen Fisk and Lei (2006) conducted an experiment to check theimpact of temperature on employee productivity through excluding theimpact of poor ventilation. This has been done to avoid anymisunderstanding regarding the impact of poor temperature, as thecombination temperature and poor ventilation produce drastic effect onperformance. The experiment indicated decrease in level of productivityby 2% with increase of 1ºC from 25ºC to 32ºC and no impact onproductivity when temperature ranges between 21ºC to 25ºC.
Experiment conducted by Seppanen et al. (2006) also indicated thatincrease in temperature has strongest correlation with work performed inlaboratories as there is requirement of intense focus on task.
Perceived impact of Office Design on Performance of Faculty
129

office furniture
Productivity of employee has also been supplemented with officefurniture and it is legitimate to believe elements like desk, chairs &drawers etc has ability to influence employee productivity (Sehgal, 2012).This impact found significant for countries like Pakistan, as employeespent significant time in close contact with office furniture (Akhtar et al.,2014), although there is minimal attention towards the impact endorsedby office furniture (Sehgal, 2012).
Therefore, legitimate to believe Ahmad et al. (2016), who declare officefurniture as important element in fostering organizational productivitythrough optimizing the comfort level for employees. On the other hand,office furniture is also marked as third important most elements in the listof office design elements and hence must be treated carefully bymanagement (Akhtar et al., 2014). Yusof et al. (2017) also indicated thatnon-ergonomics furniture might lead to increase of health issues and thuslevel of productivity declines. Thus management must pay concerntowards ergonomics of office furniture at the time of purchase (Sehgal,2012), as this is found to be effecting employee even when other elementsof office design are absent or ineffective (Jaffri, 2015).
office equipment
Office equipment is defined as the sum of all devices which arerequired in office to perform required requirements (Sultan et al., 2016).Although the selection of office equipment is one of the most difficulttasks as the selection must be coherent with the preference of the personwho is going to use these (Cullen, 2002). Similar found to be true throughMumuni and Sam (2014) that use of modern equipment in offices isdirectly associated with the performance although performance varies withrespect to the knowledge of use and understanding from one employee toanother.
spatial arrangement
Al-Omari and Okasheh (2017) indicated that office layout is consideredas one of the most important measure to optimize level of productivity ofemployees. Moreover, lack of privacy in office setting might result inincrease of stress in employees (Saha, 2016). Although office environmentalso requires proper interaction of employees in order to enhance sharingof knowledge and information (Haynes, Suckley & Nunnington, 2017).Although some of the tasks require complete absence of distraction and
Sultan, F.
130

thus it is optimal to believe office layout must be a hybrid of multipletypes of design to deal effectively with the issue of privacy. This is validnot only to obsolete distraction but also to address the concern of privacywhich varies person to person (Saha, 2016). These indications are alsofound valid through Al-Omari and Okasheh (2017) that in recent era thereis a requirement better and effective ways to induce work throughmanaging flexible work environment.
researCH MetHoDologY
Research Methodology is the set of parameters which are undertakenby researchers to highlight relationship among all the important aspectsof their research (Brannick and Roche, 1997). Therefore, this studycombines the parameters highlighted by Saunders, Lewis, Thornhill, andWilson (2009), Saunders and Bezzina (2015) and Sekaran and Bougie(2016) with research gaps found in the area of office design fromterritories of Pakistan.
research Design
The philosophy incorporated with the study is epistemology, as it istreated as philosophy of knowledge (Saunders, Lewis, & Thornhill, 2007).Other researchers like Bryman, Beker, and Sempik (2008), indicatedepistemology as “As an issue concerns the question of what is (or shouldbe) regarded as acceptable knowledge in a discipline” (p.13). The researchstance for this study was post-positivism, as the study tries to combinevariables, techniques, methods and data from different sources tochallenge the existing knowledge (John & Gray, 2010). Research strategyincorporated is survey, method of data collection is mono-method(Saunders et al., 2007 Saunders & Bezzina, 2015) and purpose of studywas correlational (Sekaran & Bougie, 2016).
Time horizon was cross-sectional (Saunders et al., 2015) and studysetting was non-contrived in order to collect data through field-experimentwith moderate researcher’s interference (Sekaran & Bougie, 2016).Furthermore, to comply with the reliability issues study followsVimalanathan and Babu (2017) and works on descriptive statistics beforeanalyzing results through inferential statistics. Proceeding further it hasalso been noticed that prior studies on office design uses software likeSPSS and AMOS etc, but to associate properly with the theoreticalframework this study incorporates SMART PLS. This has been done asseven variables of this study has never been tested by single study and
Perceived impact of Office Design on Performance of Faculty
131

study also based on industrial analysis through incorporating data frommajor HEIs. Thus, legitimate to use SMART PLS to ensure the essence oftheory building approach (Hwang, Malhotra, Kim & Tomiuk, 2010).
sampling Design
In accordance with statement of problem the study has been conductedfrom HEI operating in Karachi, extensively focused upon impact of officedesign on faculty performance. Thus, the population for this study is entirelist of faculty members (permanent), teaching in HEIs of Karachi. Moreoverstudy also uses the reference of prior studies like Hameed and Amjad (2009),Riaz et al. (2017) and Sultan et al. (2016) to use simple random sampling.Although, tracing of adequate sample size was quite difficult as the study isfocused towards theory building approach and faculty of higher educationalinstitute is much difficult to trace (i.e. permanent faculty). Thus, to manageissue effectively study takes the reference of Parveen et al. (2012) to usesample of 150 faculty members of higher educational institutes offeringdegrees in management sciences. List of higher educational institutes fromwhich data has been gathered are SZABIST, IoBM, KASBIT, PAF-Kiet andDadabhoy etc. Although faculty has tough schedule, therefore, after takingconsent data is collected through using Google docs which enableresearchers to send questionnaire via email.
Questionnaire
The questionnaire has been developed in accordance with Hameed andAmjad (2009), as it is based on five points Likert scale to measure effectof office design on employee productivity.
The technique of data collection is supplemented with five points likertscale, followed by Riaz et al. (2017). Although unlike Riaz et al. (2017)this study focused intensively on office design on employee productivityrather than on employee productivity and employee health. Thequestionnaire also follows indications given by Amirazar Azarbayjani DayThariyan Stearns and Brentrup (2017) and Parveen et al. (2012) etc.
statistiCal testing anD analYsis
This section is based on gauging of results in order to show impact ofvariables (independent and moderating) on dependent variable. Thissection also includes detailed analysis of each table in order to provideproper understanding regarding concept which has been introducedthroughout the paper. The section is based on analysis of descriptivemodels as well as inferential models. Descriptive analysis is made through
Sultan, F.
132
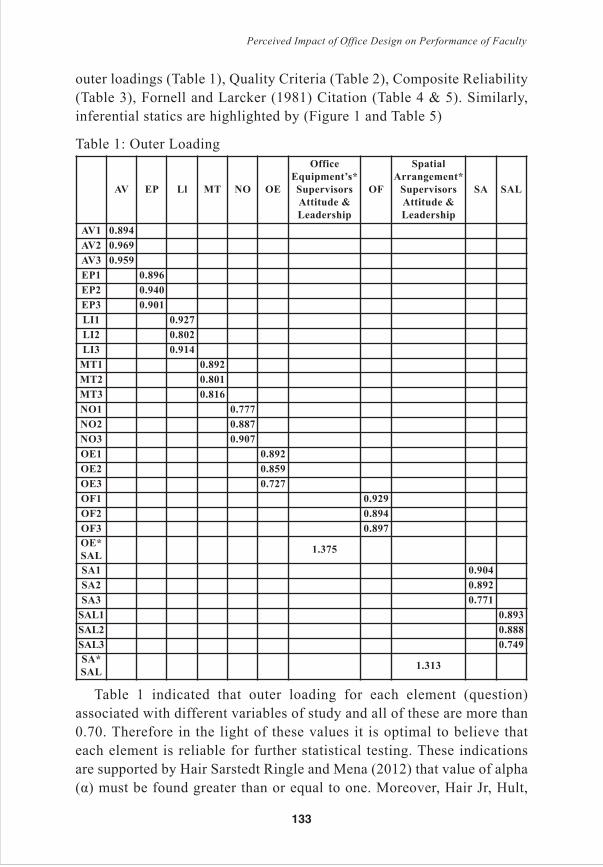
outer loadings (Table 1), Quality Criteria (Table 2), Composite Reliability(Table 3), Fornell and Larcker (1981) Citation (Table 4 & 5). Similarly,inferential statics are highlighted by (Figure 1 and Table 5)
Table 1: Outer Loading
Table 1 indicated that outer loading for each element (question)associated with different variables of study and all of these are more than0.70. Therefore in the light of these values it is optimal to believe thateach element is reliable for further statistical testing. These indicationsare supported by Hair Sarstedt Ringle and Mena (2012) that value of alpha(α) must be found greater than or equal to one. Moreover, Hair Jr, Hult,
aV eP ll Mt no oe
office
equipment’s*
supervisors
attitude &
leadership
of
spatial
arrangement*
supervisors
attitude &
leadership
sa sal
aV1 0.894
aV2 0.969
aV3 0.959
eP1 0.896
eP2 0.940
eP3 0.901
li1 0.927
li2 0.802
li3 0.914
Mt1 0.892
Mt2 0.801
Mt3 0.816
no1 0.777
no2 0.887
no3 0.907
oe1 0.892
oe2 0.859
oe3 0.727
of1 0.929
of2 0.894
of3 0.897
oe*
sal1.375
sa1 0.904
sa2 0.892
sa3 0.771
sal1 0.893
sal2 0.888
sal3 0.749
sa*
sal1.313
Perceived impact of Office Design on Performance of Faculty
133

Ringle and Sarstedt, (2016) that point having lesser than 0.7 values mustbe deleted if the delete is fruitful for overall reliability of the variable.
Table 2: Quality Criteria and Model Fit
Table 2 indicated that value of R-Square is 0.754 and value of AdjustedR-Square is 0.719 which are sufficient enough to define model is majorlypredicted by independent variables and there is minimal level of multi-collinearity in the variables. This is coherent with the analysis providedby Hair Sarstedt and Ringle (2011), that 0.75 is the value treated assubstantial for R-Square asthe value indicated predictive accuracy for themodel (Henseler, Ringle & Sinkovics, 2009) Table 3 indicated that valuesof Cronbach’s alpha are more than 0.70 for each variable and value ofDillon-Goldstein’s rho is also more than 0.70 as well as values ofCronbach’s alpha.
Table 3: Construct Reliability
Similarly values of AVE for all the variables shown through table 3 are morethan 0.5, therefore it is legitimate to consider overall construct reliable enoughfor further statistical testing. In order to validate the analysis made for Table 3
r square r square adjusted
employee Performance 0.754 0.719
Cronbach’s
alpharho a
Composite
reliability
average
Variance
extracted
(aVe)
air-Ventilation (aV) 0.935 0.936 0.959 0.886
employee Performance (eP) 0.899 0.900 0.937 0.833
lightening (ll) 0.856 0.858 0.913 0.779
Maintenance of temperature (Mt) 0.791 0.842 0.875 0.701
noise (no) 0.820 0.827 0.894 0.738
office equipment’s (oe) 0.769 0.792 0.867 0.687
oe * sal 1.000 1.000 1.000 1.000
office furniture (of) 0.892 0.898 0.933 0.823
sa* sal 1.000 1.000 1.000 1.000
spatial arrangements (sa) 0.818 0.831 0.893 0.736
supervisors attitude & leadership (sal) 0.801 0.833 0.882 0.716
Sultan, F.
134

it is important to link the analysis with the following illustration. HussainFangwei Siddiqi and Shabbir (2018) indicated that Cronbach’s alpha (α) &construct reliability are used to evaluate internal consistency while Dillon-Goldstein’s rho is more appropriate tool for the analysis of reliability than α&its value must be more than 0.70 (Ravand and Baghaei, 2016).
Similarly construct reliability is a better tool for the analysis ofreliability than α (Hussain et al., 2018). Ab Hamid Sami and Sidek (2017)further indicated that value for AVE must be greater than or equal to 0.5in order to validate construct validity.
Table 4 indicated that no value for any variables is relating with eachother. This can be verified as there is no value which reaches 0.85 at thejunction of two variables. (Alarcon, Sanchez, Olavide, 2015). Theseindication regarding parameters of HTMT are supported by Hair Jr et al.(2017) that values below 0.85 are appropriate enough to declare HTMTRatio fit. Therefore, legitimate to declare model appropriate enough ashighlighted by Hair Jr Sarstedt Ringle and Gudergan (2017) for testing asentire range of constructs are not correlating with each other.
Table 4: HTMT (Heterotrait-Monotrait Ratio)
aV eP ll Mt no oe
office
equipment’s*
supervisors
attitude &
leadership
of sal sa sal
aV
eP 0.513
li 0.322 0.449
Mt 0.550 0.758 0.534
no 0.561 0.606 0.679 0.633
oe 0.526 0.637 0.654 0.614 0.629
office
equipment’s*
supervisors
attitude &
leadership
0.289 0.342 0.342 0.424 0.408 0.345
of 0.496 0.651 0.528 0.642 0.607 0.701 0.337
spatial
arrangement
M supervisors
attitude &
leadership
0.254 0.344 0.336 0.315 0.343 0.336 0.741 0.278
sa 0.423 0.430 0.579 0.545 0.580 0.721 0.311 0.540 0.291
sal 0.512 0.670 0.577 0.678 0.659 0.720 0.467 0.659 0.350 0.526
Perceived impact of Office Design on Performance of Faculty
135

Table 5 indicating p-values for all the independent variables are lesserthan 0.05 and values for all the variables are more than 1.97. Hence inthe light of these parameters it is legitimate to indicate office designelements are creating significant impact on the performance of facultymembers of HEIs of Karachi. These concluding remarks are coherent withHair Jr et al. (2016), that in order to generate inference on the bases of t-values it is legitimate to highlight the relation between variables if t-valueis more than 1.97.Although the negative sign in regression weights(Original Sample) of air ventilation and spatial arrangements indicatedthat these two variables are affecting employee performance negatively.Hence lack of indoor lightening and spatial arrangements (open offices)are producing negative impact on the performance level of facultymembers of HEIs. Although the moderation (Supervisor’s NegativeAttitude and Leadership), is diminishing the impact of office equipmentand spatial arrangements and making the impact of office equipment andspatial arrangement negative.
Table 5: Path-Coefficient and Total Effect
original
sample
(o)
sample
Mean
(M)
standard
Deviation
(stDeV)
t statistics
(|o/stDeV|)
P
Values
aV –––> eP 0.074 0.437 0.056 2.604 0.037
ll –––> eP -0.140 -0.130 0.071 1.984 0.048
Mt –––> eP 0.384 0.383 0.072 5.329 0.000
no –––> eP 0.189 0.177 0.089 2.113 0.035
oe –––> eP 0.134 0.130 0.059 2.271 0.024
oe* sal –––> eP 0.094 0.090 0.048 1.940 0.053
of –––> eP 0.179 0.184 0.064 2.814 0.005
sa* sl –––> eP -0.067 -0.067 0.058 1.152 0.250
sa –––> eP -0.128 -0.120 0.054 2.363 0.019
sal –––> eP 0.167 0.170 0.078 2.144 0.033
Sultan, F.
136

Figure 1: Outer Loadings and Regression weights for office design elements
ConClusion
Study indicated that there is a significant role of office design elementson the performance of faculty operating in higher educational institutes.All the potent variables from the construct of office design has been testedfor the first time in territories of Pakistan and result are significant enoughto declare these variables are potent in higher education sector of Pakistan.Results are completely coherent with Riaz et al. (2017) that there ispositive impact of furniture, equipment, lightening, temperature andspatial arrangements on employee productivity. Results are also similar tothe results of Hameed and Amjad (2009) which indicated noise; lightening;temperature; air quality and spatial arrangement all are creating significantimpact on employee performance. One of the minor difference betweenthis and Hameed and Amjad (2009) is the recent study indicated thepositive impact of office furniture on employee performance of HEIs ofKarachi. On the other side recent study is much unique in terms of results
Perceived impact of Office Design on Performance of Faculty
137

from Jaffri (2015) which indicated there is no effect of any of the officedesign element except office furniture on the performance of employees.
Jaffri (2015) indicated that all the required elements of office designwere absent from the office facilities available at NADRA and employeesare performing work through using their own capacities, abilities andinterests. Similarly, results are extensively changed in comparison toSultan et al. (2016) which indicated that there is no effect of lightening,color, air-quality, spatial arrangements and noise on performance ofemployees. Therefore, results of paper are important mainly due to thefollowing reasons on productivity of permanent faculty members of HEIs:
1. Entire range of variables are found to be significant on theperformance of faculty
2. Moderation has been from variable inventory of work-environmentand the results are found to be predominant, as moderator is able tochange the impact yielded previously.
3. Last but not the least; results are important as these are highlightedthrough larger sample size which is reflecting the presentation ofmost of the HEIs operating in Karachi.
reCoMMenDations& future areas for researCH
After detailed analysis of data collected it has been recommended thatHEIs must not only take care office ergonomics but consider politics andsupervisor’s attitude and leadership style.
This is legitimate to create optimal impact of facilities on performanceof faculty moreover study also recommended that organizational justicemight also incorporated as the moderating element in office design studies.This will aid researchers in determining role of distributive justice,procedural justice and interactional justice on the performance of faculty.
Sultan, F.
138

referenCes
Abdou, O. A. (1997). Effects of luminous environment on worker productivity inbuilding spaces. Journal of Architectural Engineering, 3(3), 124-132.
Ahmad, N., Khan, S., & Ali, F. (2016). An Investigation of WorkplaceEnvironment in Karachi Textile Industry towards Emotional Health.Journal of independent Studies and Research, 14(1), 63-78.
Ajala, E. M. (2012). The influence of workplace environment on workers’welfare, performance and productivity. The African Symposium.
Akhtar, N., Ali, S., Salman, M., Ur-Rehman, A. & Ijaz, A., (2014). InteriorDesign and its Impact on of Employees’ Productivity in TelecomSector, Pakistan. Journal of Asian Business Strategy, 4(6), 74-82.
Al-Omari, K., & Okasheh, H. (2017). The Influence of Work Environmenton Job Performance: A Case Study of Engineering Company inJordan. international Journal of Applied Engineering Research,12(24), 15544-15550.
Amirazar, A., Azarbayjani, M., Day, J., Thariyan, E., Stearns, E., &Brentrup, D. (2017). Questionnaire Survey on Factors InfluencingOccupants’ Overall Satisfaction on Different Office Layout in aMixed-Humid Climate. ARCC 2017: Architecture of Complexity,Amirazar/Azarbayjani/Day/Thariyan/Stearns/Brentrup.
Asghar, A. (2019). The Future of Higher Education in Pakistan.The Economist, http://www.pakistaneconomist.com/2019/01/21/future-of-higher-education-in-pakistan/
Becker, F. (2002). Improving organizational performance by exploitingworkplace flexibility. Journal of facilities management, 1(2), 154-162.
Borman, W. C. (2004). The concept of organizational citizenship. Current
Directions in Psychological Science, 13(6), 238-241.
Borman, W. C., & Motowidlo, S. M. (1993). Expanding the criterion domainto include elements of contextual performance. Personnel Selection
in Organizations; San Francisco: Jossey-Bass, 71-98.
Brannick, T., & Roche, W. K. (Eds.). (1997). Business research methods:strategies, techniques and sources. Oak Tree Press.
Perceived impact of Office Design on Performance of Faculty
139
Bryman, A., Becker, S., & Sempik, J. (2008). Quality criteria forquantitative, qualitative and mixed methods research: A viewfrom social policy. international Journal of Social Research
Methodology, 11(4), 261-276.
Chandrasekar, K. (2011). Workplace environment and its impact on organizationalperformance in public sector organizations. international journal of
enterprise computing and business systems, 1(1), 1-19.
Chin, W. W. (1998). The partial least squares approach to structural equationmodeling. Modern methods for business research, 295(2), 295-336.
Cullen, S. (2002). The perfect office machines. Office Solutions, 19(8), 18-18.
Cummings, L. L., & Schwab, D. P. (1973). Performance in organizations:
Determinants & appraisal. Good Year Books.
Dalbokova, D., & Krzyzanowski, M. (2002). Environmental healthindicators: development of a methodology for the WHOEuropean Region. Statistical Journal of the United Nations
Economic Commission for Europe, 19(1, 2), 93-103.
Dorgan, C. B., & Dorgan, C. E. (2005). U.S. Patent No. 6,842,760.Washington, DC: U.S. Patent and Trademark Office.
Eiseman, L. (2006). Color: Messages and meanings: A Pantone color
resource. Hand Books Press.
El-Zeiny, R. M. A. (2012). The interior design of workplace and its impact onemployees’ performance: A case study of the private sector corporationsin Egypt. Procedia-Social and Behavioral Sciences, 35, 746-756.
Evans, G. W., Cohen, S., Stokols, D., & Altman, I. (1987).Handbook ofenvironmental psychology. Handbook Environmental Psychology.
Fornell, C., & Larcker, D. F. (1981). Structural equation models withunobservable variables and measurement error: Algebra and statistics.
Guest, S., & Van Laar, D. (2002). The effect of name category and discriminabilityon the search characteristics of color sets. Perception, 31(4), 445-461.
Hair Jr, J. F., Hult, G. T. M., Ringle, C., & Sarstedt, M. (2016). A primer on partial
least squares structural equation modeling (PLS-SEM). Sage publications.
Sultan, F.
140

Hair Jr, J. F., Sarstedt, M., Ringle, C. M., & Gudergan, S. P. (2017). Advanced issues
in partial least squares structural equation modeling. Sage Publications.
Hair, J. F., Ringle, C. M., & Sarstedt, M. (2011). PLS-SEM: Indeed, a silverbullet. Journal of Marketing theory and Practice, 19(2), 139-152.
Hair, J. F., Sarstedt, M., Ringle, C. M., & Mena, J. A. (2012). An assessment ofthe use of partial least squares structural equation modeling in marketingresearch. Journal of the academy of marketing science, 40(3), 414-433.
Hameed, A., & Amjad, S. (2009). Impact of office design on employee’s productivity:a case study of banking organizations of Abbottabad, Pakistan. Journal of
Public Affairs Administration and Management, 3(1), 1-13.
Hansika, W. A. M., & Amarathunga, P. A. B. H. (2016, December). Impactof Office Design on Employees’ Productivity; A Case Study ofBanking Organizations of North Western Province in Sri Lanka.In University of Sri Jayewardenepura, Sri Lanka, 13th
international Conference on Business Management (iCBM).
Haynes, B. P. (2008). The impact of office comfort on productivity.Journal of Facilities Management, 6(1), 37-51.
Haynes, B., Suckley, L., & Nunnington, N. (2017). Workplace productivityand office type: An evaluation of office occupier differences basedon age and gender. Journal of Corporate Real Estate, 19(2), 111-138.
Henseler, J., Ringle, C. M., & Sinkovics, R. R. (2009). The use of partialleast squares path modeling in international marketing. In New
challenges to international marketing (pp. 277-319). EmeraldGroup Publishing Limited.
Heschong, L. and Wright, R. L. (2002). Daylighting and Human Performance:Latest Findings, in Proceedings of the 2002 ACEEE Summer Study on
Energy Efficiency in Buildings, Pacific Grove, California, 8.91-8.104.
Hussain, S., Fangwei, Z., Siddiqi, A., Ali, Z., & Shabbir, M. (2018). Structuralequation model for evaluating factors affecting quality of socialinfrastructure projects. Sustainability, 10(5), doi:10.3390/su10051415.
Hwang, H., Malhotra, N. K., Kim, Y., Tomiuk, M. A., & Hong, S. (2010). Acomparative study on parameter recovery of three approaches to structural
Perceived impact of Office Design on Performance of Faculty
141

equation modeling. Journal of Marketing Research, 47(4), 699-712.
Hygge, S., & Knez, I. (2001). Effects of noise, heat and indoor lightingon cognitive performance and self-reported affect. Journal of
Environmental Psychology, 21(3), 291-299.
Jaffri, S. L. B. (2015). Impact of Office Design over the EmployeesProductivity (A Case Study of NADRA). South Asian Journal of
Management, 9(2), 43-48.
Johnson, B., & Gray, R. (2010). A history of philosophical and theoreticalissues for mixed methods research. Sage Handbook of Mixed
Methods in Social and Behavioral Research, 2, 69-94.
Kamarulzaman, N., Saleh, A. A., Hashim, S. Z., Hashim, H., & Abdul-Ghani,A. A. (2011).An overview of the influence of physical officeenvironments towards employee. Procedia Engineering, 20, 262-268.
Khedkar, E. B., & Pawar, P. Y. (2015). Review of literature on organizationalergonomics. international Journal of Advanced Research in
Computer Science and Management Studies, 5(4), 454-458.
Liaqat, M., Chang, V., Gani, A., Ab Hamid, S. H., Toseef, M., Shoaib, U., & Ali,R. L. (2017). Federated cloud resource management: Review anddiscussion. Journal of Network and Computer Applications, 77, 87-105.
Loewen, L. J., & Suedfeld, P. (1992). Cognitive and arousal effects ofmasking office noise. Environment and Behavior, 24(3), 381-395.
Manggo, I. (2014). Analysis of Workplace Ergonomics on Employee Performancein PT. BNI (Persero) Tbk. Main Branch Office Manado. Jurnal EMBA:
Jurnal Riset Ekonomi, Manajemen, Bisnisdan Akuntansi, 2(3), 632-643.
Mumuni, I. A., & Sam, A. H. (2014). Modern Office Technology and thePerformance of the Professional Secretary in ContemporaryOrganization in Ghana. Journal of information and Knowledge
Management, 3(4), 52-57.
Network, B. B. (2008). BNET business dictionary.
Parveen, S., Sohail, M. M., Naeem, F., Azhar, Z., & Khan, S. H. (2012).Impact of office facilities and workplace milieu on employees’
Sultan, F.
142

performance: A case study of Sargodha University. Asian Journal
of Empirical Research, 2(4), 96-117.
Pickson, R. B., Bannerman, S., & Ahwireng, P. O. (2017). Investigatingthe Effect of Ergonomics on Employee Productivity: A CaseStudy of the Butchering and Trimming Line of Pioneer FoodCannery in Ghana. Modern Economy, 8(12), 1561-1574.
Ravand, H., & Baghaei, P. (2016). Partial least squares structural equation modelingwith R. Practical Assessment, Research & Evaluation, 21(11), 1-16.
Riaz, A., Shoaib, U., & Sarfraz, M. S. (2017). Workplace Design and Employee‘sPerformance and Health in Software Industry of Pakistan. international
Journal of Advanced Computer Science and Applications, 8(5), 542-548.
Roelofsen, P. (2002). The impact of office environments on employeeperformance: The design of the workplace as a strategy for productivityenhancement. Journal of facilities Management, 1(3), 247-264.
Saha, S. (2016).A Study on Impact of Workplace Design on Employee’sProductivity in Selected IT Companies in Pune Region. international
Journal of Business and General Management, 5(1), 2319-2267.
Sarode, A. P., & Shirsath, M. (2012). The factors affecting employee workenvironment & it’s relation with employee productivity.international Journal of Science and Research, 3(11), 2735-2737.
Saunders, M. N., & Bezzina, F. (2015). Reflections on conceptions ofresearch methodology among management academics. European
Management Journal, 33(5), 297-304.
Saunders, M., Lewis, P., & Thornhill, A. (2007). Research methods.Business Students.
Saunders, M., Lewis, P., Thornhill, A., & Wilson, J. (2009). Businessresearch methods. London: Financial Times, Prentice Hall.
Sehgal, S. (2012). Relationship between work environment andproductivity. international Journal of Engineering Research and
Applications, 2(4), 1992-1995.
Sekaran, U., & Bougie, R. (2016). Research methods for business: A skill
Perceived impact of Office Design on Performance of Faculty
143

building approach. John Wiley & Sons.
Seppanen, O., Fisk, W. J., & Lei, Q. H. (2006). Effect of temperature on task
performance in office environment (No.LBNL-60946). Berkeley, CA(US): Ernest Orlando Lawrence Berkeley National Laboratory.
Smith, A. P. (1985). The effects of different types of noise on semantic processingand syntactic reasoning. Acta Psychologica, 58(3), 263-273.
Sparks, S. A., Cable, N. T., Doran, D. A., & Maclaren, D. P. M. (2005).The influence of environmental temperature on duathlonperformance. Ergonomics, 48(11-14), 1558-1567.
Sultan, M. F., Zafar, M. R. & Anila (2016). Office Design and its impacton employees’ productivity: Evidence from Islamic Banks ofKarachi. international Journal of Scientific and Research
Publications, 6(6), 335-342.
Toftum, J., Lund, S., Kristiansen, J., & Clausen, G. (2012). Effect of open-plan office noise on occupant comfort and performance. in 10th
international Conference on Healthy Buildings.
Ullah, K., Mughees, M., Mirza, F. M., & Shakoor, U. (2018). Exploringthe Link between Workplace Environment and Workers’Satisfaction: IT & Telecom Industry of Islamabad, Pakistan. The
Pakistan Journal of Social issues, 9(1).
Vimalanathan, K., & Babu, R. T. (2017). A Study on the Effect ofErgonomics on Computer Operating Office Workers in India. JErgonomics, 7(5), doi:10.4172/2165-7556.1000211.
Vischer, J. C. (2007). The concept of environmental comfort in workplaceperformance. Ambiente Construido, 7(1), 21-34.
Wah, L., (1998). The power office. Management Review, 87(5), 10-14.
Yusof, H. S. M., Said, N. S. M., & Ali, S. R. O. (2016). A study of organizationalculture and employee motivation in private sector company. Journal
of Applied Environment and Biology Sciences, 6(3S), 50-54.
Sultan, F.
144

strategies for Making CPeC inClusiVe
for unskilleD Workers
saira ahmed*, sajid Bashir**, and Vaqar ahmed***
aBstraCt
in the domain of the public-sector strategy prioritizing,
very little work has been done bearing the psychology
and behavior of the unskilled worker in the country. The
employment of unskilled labour is under-represented in
majority of the countries that dot the globe. Not
surprisingly, documented statistical evidence of the
World Bank Report 2015 confirmed that the unskilled
labour force in these economies represented up to 50 to
65% of the informal and formal work force. Being a
part of the undocumented workforce, it is difficult to
measure the value-added contribution of this informal
sector in Pakistan. Moreover the Special Economic
Zones (SEZs) being planned and designed under CPEC
will allow for increased participation and inclusion of
the unskilled labour (only after relevant training) for
those residing there and in the peripheries. in our
exploratory field study that was conducted in two
upcoming SEZs of Nowshera and islamabad; we expose
the economic and social flaws of the very foundations
of labour markets in Pakistan. Hence, concluding that
if policy-makers do not address the flaws urgently, the
whole exercise of making SEZs will go in vain.
Keywords: Pakistan, CPEC, Special Economic Zones (SEZs), Unskilled Labour.
introDuCtion
The employment of unskilled labour is under-represented in majorityof the countries that dot the globe. Not surprisingly, documented statisticalevidence of the World Bank Report 2015 confirmed that the unskilledlabour force in these economies represented up to 50% of the informal andformal work force. For example, in Latin America it was found to be39.8%, where as in Uruguay 75% of the workers were involved in informal
Journal of Business Strategies, Vol.14, No.1, 2020, pp 145–162 DOi:10.29270/JBS.14.1(20).07
145
__________________________________________________________________________________*Assistant Professor, Faculty of Management Sciences, Capital University of Science & Technology, islamabad
**HoD, Department of Business Studies, Namal institute, Mianwali
***Joint Executive Director, Sustainable Development Policy institute, islamabad

work. Similarly, 24.3% females in Brazil represented the unskilledworkforce, as compared to 58.3% in Honduras. Moving towards SouthEast Asian Countries, excluding China, it was indicated that unskilledemployment in all reported countries ranged from minimum 42.3% to amaximum of 83.6%.
In the case of Pakistan, as per the 2019 International Labour Organization(ILO) Report on Pakistan’s Labour Policy, almost 22 million of theemployed labor force is earning its livelihood in streets and the governmenthas no record of it. This unskilled sector accounts for 43.3% of the totallabor force (Amir, 2016). These informal workers can be categorized as self-employed, casual wage workers, family based petty traders, paid employeesfor informal enter prices, home based workers, street vendors, vehicledrivers, and casual agricultural and non-agricultural workers.
Being a part of the undocumented workforce, it is difficult to measurethe value-added contribution of this informal sector in Pakistan. Moreoverthe special economic zones being planned and designed under CPEC willallow for increased participation and inclusion of the unskilled labour(only after relevant training) residing there and in the peripheries. Indirectestimation approaches on the basis of employment, and hours worked arebeing used to estimate the contribution unskilled workers, but they do notallow for documenting robust findings. Moreover, previous studies doneby international donors signified that the contribution of unskilled labouraccounts for nearly 30% of total income, and over 40% of total urbanincome. Consequently, it has been widely recognized that the contributiondue to this to gross domestic product (GDP) is of prime significance.
importance of special economic Zones in Poverty alleviation and
economic growth
Setting up Special Economic Zones (SEZs) is key to economic growthof any region via increased employment opportunity which not onlypositively impact GDP growth rate but also play a significant role inpoverty alleviation. In 2017, SEZs of Dominican Republic has generated166,000 direct and approximately 250,000 indirect jobs in the region,majority of which comprised of low-skilled workers. To fill theemployment gap Government of Dominican Republic has signedagreements for skill development with Universities and institutions.Similarly, there are currently 500 SEZs in Latin America and the Caribbeanregion employing approximately 1 million people (United Nations, 2019).
Ahmed, S., Bashir, S., and Ahmed, V.
146

The increase in employment opportunities is not just limited to theseareas only, India has reported to generate 178,000 jobs from SEZs within10 years of establishment of first SEZ (Aggarwal, 2007) and anticipatedto have these number tripled and raised to approximately 15,75,452 byDecember 2009.This has created a need to invest more in filling these jobsby local people through skill development (Raheem, 2011).
However, in India since 2006 there have been observed 90% increasein employment opportunities. Total increase in employment rate isreported in 2008- 2009 is 3,87,439 whereas it raised to 13, 50, 071 in2013- 2014. Besides already skilled workers, most of the labor employedwas semi–skilled and un-skilled workers. This economic shift with theestablishment of SEZs in India has greatly impacted GDP growth,alleviation of poverty and decreasing unemployment rate (Das, 2017).
The similar and better examples can be found in developing countrieslike China, where an increase of 10 million employment opportunities isreported from 2002 to 2006. In 2006 alone China has employed 40 millionpeople in different SEZs (Agarwal, 2010).
economic stability and Human Development
The development of Human Resource for socio-economic stability isevident and human capital is considered the greater asset of a country. Thehuman resource greatly impacts the development outcome of a nation(Castleman, 2016). Singapore has practically implied this philosophy ofHuman development and reap its benefits as world 1st biggest competitiveeconomy with the score of 84.5% leaving behind US besides havinglimited natural resources and a smaller area (World Economic Forum,2019). Back in 1996, Singapore plan ahead to reach this stage by signingagreements and investing in Human skill development. Even with verylimited human resource and outsourcing it from other countries stillSingapore managed to sustain its position as biggest emerging worldeconomy in the presence of other developing economies like US andEurope. The competition was not low but planning ahead has paid off.
CPeC and inclusion of unskilled labor
China Pakistan Economic Corridor (CPEC) is bringing these opportunitiesof economic growth to Pakistan. Reaping its benefits is greatly dependent uponeffective policy making in mobilizing and developing human resource.Unfortunately, as reported in World Bank 2015 Annual report, Pakistan has
Strategies for making CPEC inclusive for Unskilled Workers
147
disappointed international donors with miserable performance in humandevelopment area. CPEC is opening new doors of economic growth forPakistan, by keeping in view the human potential Pakistan currently hold with64% of young people age between 25-30 years, the greatest number ever in itshistory (United Nations Development Programme, 2018). Besides up gradationof skilled workers, the reported 43.3% of unskilled-labor force can play a hugerole in economic growth of Pakistan if invested and skilled well in time.
A number of studies have been undertaken to study several aspects of theunskilled labour in Pakistan. However with the advent of the China PakistanEconomic Corridor (CPEC), we have a special opportunity to see the potentialbenefits. There is a dire need to study this issue in order to firstly assess theawareness that unskilled workers have about CPEC and Pakistan’s new foreignand trade relations in this regard. Existing studies empirically examinedvarious aspects of unskilled labour sector such as; skill development,constraints on the growth, wage rates, embracing capital-intensity, and laborproductivity. A considerable vacuum in the line of these studies is that theywere based on a very small sample including urban locations only, thus theirresults could not be generalized via representative sampling. Representativesampling will allow for a fresh and apt comparison between urban and ruralareas because we will be selecting the Special Economic Zone of the capitalterritory of Islamabad and the Rashakai Economic Zone, M-1, Nowshera. Thereason for choosing these is essentially the ultimate urban-rural mix of theserelatively better technology-literate cities.
It is also important to note that as per the Dawn newspaper of13thMarch 2017, it is very essential that communities at the grassroots beinvolved in this massive growth initiative to set-up Special EconomicZones (SEZs) otherwise one tends to generate hostility of the masses.
At the moment, unskilled labour (mostly informal workers) is hardlyable to access social protection and social welfare in Pakistan. However,once part of the formal labour force of the Special Economic Zones(SEZs), the unskilled labour-force will be able to access both. Hence ourpriori expectation is that the social impact of CPEC will be very positive.
research Questions
In this study we pose the following questions:
1. What is the estimated size of unskilled labour in the regionsmentioned above?
Ahmed, S., Bashir, S., and Ahmed, V.
148
2. Identify the skill gap of this labour vis-à-vis expected demand inSEZs
3. Which specific training interventions would be required to enablethis currently unskilled labour to ensure inclusion in to SEZs fromthe grass root level?
the precise expected research outcomes of this policy study are as
follows:
1. Demonstrate the career-enhancing socio-economic characteristicsof unskilled labour force under CPEC.
2. Via exploratory study, give insight to the factors which influencethese labourers to work mostly in informal sectors and theirpotential contribution to the federal and provincial tax-net once theybecome part of the formal labour force.
MetHoDologY
A total of 250 respondents participated in this open interview study.Seventeen respondents belonged to the Federal State (Islamabad).Respondents primarily belonged to the province of Punjab, from KhyberPakhtunkhawa, and a few respondents were from Sindh, Azad Kashmir,and Gilgit Baltistan. At the 30th interview data reached saturating, andthemes started repeating, thus stopped conducting interviews. Therespondents who participated in this exploratory study were presentedaccording to; gender, age group, religion, education, job occupation, andprovince. A complete descriptive demographic, and geographic data ofrespondents was summarized in Table 1.
A large part of our findings includes the discussion around current skillsgap, investment for acquiring skills as per future demand will be addressedthrough open ended questions posed to current and potential employerorganizations in the above mentioned regions.
We may also consider other variables after carefully looking at therecent literature on labour market impact of public investment.
The questionnaire will undergo a pilot and before being fullyimplemented on-site. Responses from the team will be validated throughrandom on-site visits. The survey link will also be shared with theemployers of the sample workers. Henceforth, cross-sectional wage
Strategies for making CPEC inclusive for Unskilled Workers
149

function shall be estimated which shall explain the interesting determinants.
results
This section discussed results on; initial inquiry, managerialimplications, and implications for government policy makingin light of“CPEC inclusive for Unskilled Labor Force in Pakistan”. The actualresults obtained were based on open interview session, conducted witheach of the respondent on a one-to-one basis in this exploratory endeavor.
oBJeCtiVitY anD reliaBilitY
Being an exploratory study, it pertains to human involvement andinterpretations. Keeping this in view, the researchers focused onobjectivity, as a fundamental component of analysis. This was concernedwith the overall quality of the coding process of complex data especiallythat received from open interview responses.
Hence, systematic procedures using MAXQDA 12 for organizing data,and interpreting themes were adopted. Transcripts were manually codedusing spread sheet method, and were planned and implemented at theoutset.This ensured accurate and consistent coding behavior across thecoders. This also helped in reducing personal bias in this study.
Table 1: Demographic and Geographic Summary of RespondentsMajor segmentation
Variables
Category frequency Percentage
%
geographic
Region Federal Capital 1707 56,7%
Punjab 03 23.4%
Nowshera 01 10.0%
Sindh 01 03.3%
Gilgit Baltistan 01 03.3%
Azad Kashmir 03.3%
Demographic
Gender Male 18 60%
Female 12 40%
Age 35-40 18 60.0%
40-45 07 23.4%
45-50 04 13.3%
50-60 01 03.3%
Education Bachelors 09 30%
Masters 21 70%
Doctor
Ahmed, S., Bashir, S., and Ahmed, V.
150

Source: Developed from the Qualitative Field Report.
Coding
A four step manual process was used for coding the spread sheet. Atfirst, all the 30 interviews were transcribed on a separate sheet. At second,each segment of text which ended with a full stop, and a segment of textwhich had a comma in between was treated as a single cognitive unit. Atthird, each sentence starting from left to right was numbered separately.At fourth, each page was given a separate page number. Table 2established the criteria for coding the spread sheet manually.
Table 2: Criteria for Coding the Spread Sheet
The analysis for this qualitative endeavor was designed to search foremerging themes, within the segmented interview transcriptions. Sixhundred and twenty seven (627) units of raw texts were identified usingthe manual spread sheet method. These six hundred and twenty seven(627) units of raw themes were coded in to forty (40) groups ofcoding/themes called theme list. The overall emerging groups of codingthemes for “Making CPEC Inclusive for Unskilled Labor Force inPakistan” are presented in Appendix A.
As presented in Appendix A, the entire seven hundred and twenty eight(728) units of raw text were coded using the criteria in Table 2. All of thesethemes were categorized into clusters. A brief summary of severalinterviews conducted is presented in the following paragraphs:
When asked about the reason for unskilled labor in Islamabad, andRashakai Economic Zone M1, Nowshera, chosen interviewees respondedas follows;
Interviews (I) All the 30 interviews would be coded separately.
Unit (U)A segment of text which ends with a full stop, and a segment of text whichhas a comma in between is treated as a single cognitive unit.
Lines (L) Each sentence written from left to right would be numbered separately.
Pages (P) Each page would be given a separate page number.
Job/Occupation Private Sector 22 73.3%
Government Sector 08 26.7%
Own Business
Others
Strategies for making CPEC inclusive for Unskilled Workers
151
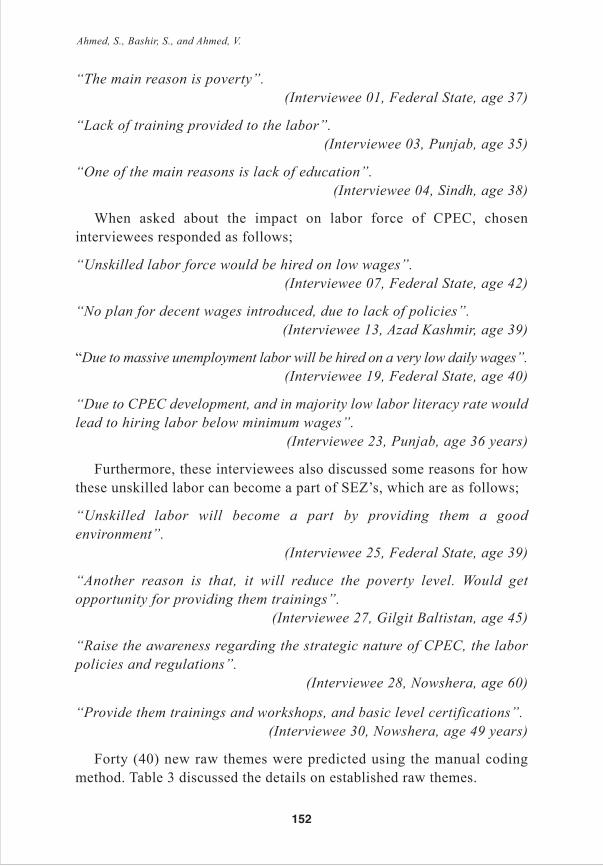
“The main reason is poverty”.
(interviewee 01, Federal State, age 37)
“Lack of training provided to the labor”.
(interviewee 03, Punjab, age 35)
“One of the main reasons is lack of education”.
(interviewee 04, Sindh, age 38)
When asked about the impact on labor force of CPEC, choseninterviewees responded as follows;
“Unskilled labor force would be hired on low wages”.
(interviewee 07, Federal State, age 42)
“No plan for decent wages introduced, due to lack of policies”.
(interviewee 13, Azad Kashmir, age 39)
“Due to massive unemployment labor will be hired on a very low daily wages”.
(interviewee 19, Federal State, age 40)
“Due to CPEC development, and in majority low labor literacy rate would
lead to hiring labor below minimum wages”.
(interviewee 23, Punjab, age 36 years)
Furthermore, these interviewees also discussed some reasons for howthese unskilled labor can become a part of SEZ’s, which are as follows;
“Unskilled labor will become a part by providing them a good
environment”.
(interviewee 25, Federal State, age 39)
“Another reason is that, it will reduce the poverty level. Would get
opportunity for providing them trainings”.
(interviewee 27, Gilgit Baltistan, age 45)
“Raise the awareness regarding the strategic nature of CPEC, the labor
policies and regulations”.
(interviewee 28, Nowshera, age 60)
“Provide them trainings and workshops, and basic level certifications”.
(interviewee 30, Nowshera, age 49 years)
Forty (40) new raw themes were predicted using the manual codingmethod. Table 3 discussed the details on established raw themes.
Ahmed, S., Bashir, S., and Ahmed, V.
152

Table 3: Raw Themesno. theme frequency %
001 Belong to Poor Backgrounds. 4 10%
002 Minimal Government Involvement. 1 2.5%
003 Lack of Education. 1 2.5%
004 Unattractive Remuneration Package. 2 5%
005 Lack of Non-Financial Incentives. 1 2.5%
006 Large Scale Unemployment. 1 2.5%
007 Lack of Opportunities. 1 2.5%
008 Hiring on Minimum Wages. 3 7.5%
009 Capacity Building Programs. 1 2.5%
010 Unclear Policies. (Especially about BISP) 1 2.5%
011 Minimum Wage Incentive. 1 2.5%
012 Non-Financial Allowances. 1 2.5%
013 Health Insurance. 1 2.5%
014 Job Security. 3 7.5%
015 Skilled Level Training Programs. 4 10%
016 Introduce Poly Technical Colleges. 1 2.5%
017 Conduct Workshops. 1 2.5%
018 Employee Awareness Programs. 1 2.5%
019 Motivation Workshops. 1 2.5%
020 Fair Reward System. 1 2.5%
021 Facilitate Workers. 1 2.5%
022 Labor Advisory Group. 2 5%
023 Safe and Healthy Environment. 1 2.5%
024 Consider Labor Concerns. 1 2.5%
025 Regular Briefings on Policies. 1 2.5%
026 Build a Welfare Program for Labor. 1 2.5%
027 Proper Engagement Plan. 3 7.5%
028 Lack of Direction for Labor Force. 1 2.5%
029 Financial Aid Programs. 1 2.5%
030 T.A/D.A for Labor. 1 2.5%
031 Campaign of Benefits for Skilled Labor Force. 2 5%
032 Labor Certification Programs. 1 2.5%
033 Self-Development Programs. 1 2.5%
034 Technical Training Courses. 3 7.5%
035 Collaborate with NGO’s. 1 2.5%
036 Personal Interaction with Individuals. 1 2.5%
037 Provide Appropriate Working Environment. 1 2.5%
038 Offer Diplomas in Engineering Fields. 1 2.5%
039 Over Time Bonuses. 1 2.5%
040 Provide Accommodation. 1 2.5%
Strategies for making CPEC inclusive for Unskilled Workers
153

While analyzing Table 3 established on raw themes for “Making CPEC
inclusive for Unskilled Labor Force in Pakistan” it was identified that,out of 30 respondents, 4 respondents each mutually agreed and emphasizedthat, individuals not working for skilled labor were from poorer backgrounds, thus needed skilled level training programs. 3 respondents eachgave high weightage to themes such as; hiring on minimum wages, jobsecurity issues, proper engagement plan, and technical training courses.
2 respondents’ views were directed towards unattractive remunerationpackages, whereas 2 emphasized the significance of labor advisory group.In comparison, 2 gave high weightage to conducting a campaignhighlighting the benefits of skilled labor force. The remaining 14respondents came up with themes such as; minimal governmentinvolvement, lack of education, non-financial incentives, large scaleunemployment, lack of opportunities, unclear policies, unclear wageincentive, minimal health insurance, lack of labor awareness programs,fair reward system, safe and healthy environment, labor certificationprograms, self-development programs, overtime bonuses, andaccommodation issues.
However, while viewing the forty (40) established themes in Table 3 itwas also observed that, majority of the themes were overlapping.Therefore, further analysis was conducted by the researcher to merge thesethemes into more clear, and established domains in accordance with thefield of economics. While doing so, 6 broader themes were identified.Table 4 presented the emerging themes in 6 clusters. The next sectionwould discuss the managerial implications for this study.
Table 4: Emerging Themes
no Cluster Wise themes
theme 1 Basic necessity of life issues.
001 Belong to Poor Backgrounds.
002 Lack of Education.
theme 2 Minimal government support.
003 Large scale unemployment.
004 Lack of Opportunities.
005 Unclear Policies.
theme 3 Capacity Building Programs.
006 Introduce Poly Technical Colleges.
Ahmed, S., Bashir, S., and Ahmed, V.
154

Managerial implications
The managerial implications for this study are discussed keeping inview Table 4. Provision of basic necessities of life, sufficient governmentsupport, capacity building programs, safe and healthy work environment,remuneration packages, and motivation exercises have a favorableimpact towards making CPEC inclusive for unskilled labor force inPakistan. Furthermore, all the six predicted themes were related toacquiring, and exhibiting a prosperous work culture. Therefore, it isnecessary for CPEC to develop and implement strategies which wouldreduce the unethical and long-standing work practices prevailing in theindustrial sector of Pakistan. Furthermore, the industrial sector whilepromoting these six predicted themes must emphasize on thesehighlighted issues as a medium for satisfying labor internal motives suchas; self-respect and self-esteem. CPEC must underplay the long-termbenefits associated with labor force.
In a similar vein, a second long term industrial strategy could be that,genuine production and manufacturing business owners start offering a
007 Conduct Workshops.
008 Technical Training Courses.
009 Offer diploma in engineering fields.
010 Regular briefing on policies.
theme 4 safe and Healthy Work environment.
011 Health insurance.
012 Providing accommodations.
013 Employee Awareness Programs.
theme 5 remuneration Package.
014 Over time bonuses.
015 T.A/D.A for labor.
016 Build a welfare program for labor.
017 Non-financial benefits.
018 Fair reward system.
theme 6 Motivation exercises.
019 Provide appropriate work environment.
020 Personal interaction with individuals.
021 Initiating self-development programs.
022 Job Security.
Strategies for making CPEC inclusive for Unskilled Workers
155
safe and healthy work environment, with favorable remunerationpackages. This would create an environment of competition amongstmajor players in the manufacturing and production industry. Subsequently,leading to building a skilled labor force, and would reduce the demand ofunskilled labor in Pakistan. This strategy has been successfully imbeddedin countries such as; Malaysia, Singapore, Indonesia, and China. Anotherspillover advantage of this strategy would be that, it would protect therights of skilled labor force in Pakistan, in comparison to the prevailingundefined labor working environment. The next section would discuss theimplications for policy making.
implications for Policy
The following implications for policy making were suggested:
It was found in this study that, individuals in Pakistan classed as laborshad mixed feelings on working as a part of labor force in production andmanufacturing industries. Reasons for such an attitude were the absenceof defined labor policies. Also, generally the labor force was not fullyaware about the benefits of working as a skilled individual. The policymakers in this context should arrange programs and seminars on benefitsof skilled labor force, using electronic media for the general public, ineducational institutions and other forums. These programs and seminarwould help in creating awareness about the greater benefits of working asa skilled labor force, hence changing their attitude towards negativeindustry practices.
Habits and attitudes developed at early age do not change at adulthood.Therefore the policy makers should also target Kindergarten and primaryschools children in attitude formation programs. As a consequence, thesechildren at adulthood would have a positive attitude towards labor workpractices, and hence they would be reluctant to indulge in negative andunfair work circles.
It may also be pointed out that besides manufacturers, policy makersare equally responsible for unfair, and unethical work practices. Thereforethe government enforcing regulations should not be restricted toprosecuting the manufacturers, but their horizon should be expanded tothe law setting, and reinforcing institutions as well. Subsequently, thepolicy makers should explicitly communicate to the public theconsequences of indulging in informal and unethical work practices. For
Ahmed, S., Bashir, S., and Ahmed, V.
156
this purpose, they should use mass media and all other possible sources.Thought provoking advertisements such as individuals being caught andjailed, and family members cutting sorry figure towards the family wouldalso act as deterrent in promoting skilled labor force practices. It may bepointed out that, similar thought provoking advertisements are shown inPakistan in the context of electricity stealing.
In an eastern, and Islamic country like Pakistan, it was expected, thatthemes such as basic necessities of life, minimal government support,capacity building programs, safe and healthy work environment,remuneration packages, and motivation exercises have positive attitudetowards making CPEC inclusive for unskilled labor force in Pakistansuccessful. This really poses a challenge to the policy makers. Due to theavailability of unskilled informal labor force in Pakistan, individuals don’tpossess the required skills to meet the 21st century challenges in the fieldof technology, and innovation. A majority of the workers earned theirlivelihood outside the economic cycle. The policy makers in this contextcould appoint appropriate spokesmen for communicating to the massesthat, indulging in informal labor practices had a negative impact on theeconomic growth of Pakistan (Asif, 2011). The same messages could alsobe part of Friday Sermon by these Islamic Clerics.
The above discussed strategies would be expensive. In developingeconomies like Pakistan, funding for such programs would always be amajor issue. Therefore, a special fund for these activities could be created.Since, all the major manufacturers in Pakistan lose towards these unethicalpractices, therefore these major companies should contribute toward thissuggested fund.
liMitations anD future researCH
This exploratory study has several limitations and opportunities forfuture research. To start with, the study has mainly focused on labor forcein Federal State (Islamabad), few provinces of Punjab, Nowshera, Sindh,Azad Kashmir, and Gilgit Baltistan. Future studies could explore otherrural areas of Pakistan as well. Since it was also found that unskilled laborforce practices vary from one country to the other. Therefore, acomparative study of two or more countries would bring further insightin understanding how to engage unskilled labor force in country wideprojects. This study has measured the views of employees working ingovernment offices. Since it was also found that, the views vary between
Strategies for making CPEC inclusive for Unskilled Workers
157

government and private employees, future research could incorporate morethan one category of employees.
appendix a actual Coding sheet; Coder 1 Interviewee (1-8)Codes: Part. = Participant or IntervieweeP= page, L= line(s)
theme
nothemes
Part.1
Part.2
Part.3
Part.4
Part.5
Part.6
Part.7
Part.8
001Belong to PoorBackgrounds.
L1,P 1
L16,P3
L 91,P10
L97,P11
002Minimal GovernmentInvolvement.
L 1,P1
003 Lack of Education.L2,P1
004 UnattractiveRemuneration Package.
L 35,P5
L92,P10
005 Lack of Non-FinancialIncentives.
L 39,P5
006 Large ScaleUnemployment.
L64,P7
007 Lack of Opportunities.L76,P9
008 Hiring on minimumwages.
L 79,P9
L96,P12
L111,P14
009 Capacity BuildingPrograms.
L112,P14
010 UnclearPolicies.L 128,P14
011Minimum WageIncentive.
L160,P16
012 Non-FinancialAllowances.
L161,P16
013 Health Insurance.L 129,P14
Ahmed, S., Bashir, S., and Ahmed, V.
158

Coder 1 Interviewee (9-16)Codes: Part. = Participant or IntervieweeP= page, L= line(s)’
theme
nothemes
Part.9
Part.10
Part.11
Part.12
Part.13
Part.14
Part.15
Part.16
014 Job Security.L176,P18
L295,P26
L323,P28
015Skilled Level TrainingPrograms.
L188,P18
L318,P27
L324,P28
L343,P29
016Introduce PolyTechnical Colleges.
L225,P20
017 Conduct Workshops.L296,P26
018 Employee AwarenessPrograms.
L 308,P26
019 Motivation Workshops.L333,P28
020 Fair Reward System.L 334,P28
021 Facilitate Workers.L319,P27
022 Labor Advisory Group.L 321,P27
L325,P28
023Safe and HealthyEnvironment.
L 364,P30
024Consider LaborConcerns.
L344,P29
025Regular Briefings onPolicies.
L347,P29
026Build a WelfareProgram for Labor.
L353,P29
Strategies for making CPEC inclusive for Unskilled Workers
159

Coder 1 Interviewee (17-24)Codes: Part. = Participant or IntervieweeP= page, L= line(s)
theme
nothemes
Part.17
Part.18
Part.19
Part.20
Part.21
Part.22
Part.23
Part.24
027Proper EngagementPlan.
L379,P32
L467,P41
L504,P43
028Lack of Direction forLabor Force.
L 381,P32
029Financial AidPrograms.
L399,P34
030 T.A/D.A for Labor.L405,P34
031 Campaign of BenefitsforSkilled Labor Force.
L447,P38
L 476,P41
032Time to TimeCertification for Labor.
L449,P38
033Self-DevelopmentPrograms.
L457,P39
034Technical TrainingCourses.
L342,P32
L405,P34
L459,P39
035 Collaborate with NGO’sfor Training ponsorships.
L475,P41
036Personal Interactionwith Individuals.
L480,P41
037Provide AppropriateWorking Environment.
L504,P43
038Offer Diplomas inEngineering Fields.
L504,P43
039 Over Time Bonuses.L538.P45
040 ProvideAccommodation.
L539,P45
Ahmed, S., Bashir, S., and Ahmed, V.
160

referenCes
Amir, F. (2016). ‘CPEC and Regional Integration’ Paper Presented in 32ndAnnual General Meeting and Conference of the PSDE on China-Pakistan Economic Corridor and Regional Integration,(December 13-15, 2016), Islamabad.
Asif F (2011) ‘Pakistan’s Ties with Central Asian States Irritants andChallenges’ Pakistan Institute for Peace Studies.
Agarwal, A. (2010). Economic impacts of SEZs: Theoretical approachesand analysis of newly notified SEZs in India. Dehli, India:Department of Business Economics, University of Delhi.
Aggarwal, A. (2007). Impact of special economic zones on employment,poverty and human development. impact of special economic
zones on employment, poverty and human development. ICRIERWorking Papers, Indian Council for Research on InternationalEconomic Relations.
Baker, E.S., & Edwards, R. (2012). How many qualitative interviews isenough? Expert voices and early career reflections on samplingand cases in qualitative research. Proceedings for the National
Centre for Research Methods Review Paper, London (Baker,E.S., & Edwards, R.; Ed.),pp. 1-42.
Creswell, J.W. (Ed). (2012). Educational Research, Planning, Conducting,
and Evaluating Quantitative and Qualitative Research. Libraryof Congress Cataloging-in-Publication Data, U.S.A.
Creswell, J.W., & Miller, D.L. (2000). Determining Validity in QualitativeInquiry. Theory into Practice, Taylor and Francis, 39(3), 124-130.
Castleman, T. (2016). The role of human recognition in development.Oxford Developmental Studies, 135-151.
Das, C. (2017). Special Economic Zone and its impact on LDC (LessDevelop. international Journal of Humanities & Social Science
Studies (iJHSSS), 226-240.
Dworkin, S.L. (2012). Sample Size Policy for Qualitative Studies UsingIn-Depth Interviews. Journal of Behavior, 41, 1319–1320.
Elmusharaf, D.K. (2012). Qualitative Data Collection Techniques.
Strategies for making CPEC inclusive for Unskilled Workers
161

Training Course in Geneva 2012, University of Medical Science& Technology.
Hancock, B. (2002). An introduction to Qualitative Research. Hancock,Beverley, Trent Focus Group.
Johanson, G.A., & Brooks, G.P. (2009). Initial Scale Development:Sample Size for Pilot Studies. Educational and Psychological
Measurement, 70(3), 394-400.
Raheem, A. A. (2011). Impact of special economic zone (spz) on humandevelopment and poverty reduction: an Indian experience.international journal of multidisciplinary research, 1(7).
Talanquer, V. (2014). Using Qualitative Analysis Software to Facilitate
Qualitative Data Analysis. University of Arizona, United States.
Wargo, W.G. (2013). Qualitative Data Analysis (Coding) of Transcripts.Academic Information Center. Retrieved from website:http://www.academicinfocenter.com/qualitative-data-analysis-coding-of-transcripts.html.
Waweru, P.K. & Omwenga, D.J. (2015). The Influence of StrategicManagement Practices on Performance of Private ConstructionFirms in Kenya. international Journal of Scientific and Research
Publications, 5(6), 1-36.
United Nations. (2019). The World investment Report: Special Economic
Zones. Geneva: United Nations publication.
United Nations Development Programme. (2018). Unleashing the
potential of a young Pakistan. Retrieved from HumanDevelopment Reports: http://hdr.undp.org/en/content/unleashing-potential-young-pakistan
World Economic Forum. (2019). The Global Competitiveness Report. Geneva.
Ahmed, S., Bashir, S., and Ahmed, V.
162

Does ProCeDural JustiCe leaDs toWarDs
tHe feelings of CoMPlianCe, anD
CooPeration WitH, anD eMPoWerMent of
laW enforCeMent agenCies in Pakistan:
tHe MeDiating role of Moral
soliDaritY BetWeen PoliCe anD
CoMMunitY
sufian fazal khan* and Dr. Danish ahmed siddiqui**
aBstraCt
This paper aims to identify why or why not the police
get support and cooperation from the public. Relational
models of authority argue that people measure the
degree at which the police consider the moral values of
groups by examining the equity of the processes they
utilize to practice their authority. Additionally,
according to the approach of social identity, the
cooperation of the people along with the dept. of police
is encouraged in component by their decision that the
police are archetypal representative of the moral values
of the groups. Combining both approaches in a single
theoretical framework, we applied Sunshine & Tyler’s
(2003) model, on citizens’ feelings about Pakistani Law
enforcement agencies (LEA). in this, we hypothesized
that procedural justice aligned police and citizen moral
values in form of moral solidarity. This moral solidarity
in turn effect LEA’s effectiveness through increased
cooperation from citizens as their feelings of
Compliance and Cooperation with LEAs increased
along with the people’s will to give power to
them.Practical cogency and was developed by carrying
out a review and survey by using a close-ended
questionnaire. For analysis Research Data was
gathered from 296 citizens of Karachi and examined by
utilizing CFA (confirmatory factor analysis) and SEM
(structured equation modeling). The research has
Journal of Business Strategies, Vol.14, No.1, 2020, pp 163–190 DOi:10.29270/JBS.14.1(20).08
163
__________________________________________________________________________________*Research Scholar, Karachi University Business School, University of Karachi, Pakistan. [email protected]
**Associate Professor, Karachi University Business School, University of Karachi, Pakistan

utilized a non-probability purposive sampling technique
while data was analyzed employing PLS-SEM by
utilizing the Smart PLS version 3.2.8. The findings of
the research showed that moral solidarity has a positive
significant effect on orientation towards policing,
whereas the law of procedure has a major decisive
effect on moral solidarity and orientation towards
policing. Moreover, moral solidarity has a
complementary mediating impact among the law of
procedure and orientation towards policing. Findings
also showed that moral solidarity alone as well as
along with Orientation towards Policing seems to have
a major and decisive mediation in the impact of justice,
cooperation, and empowerment. Community policing
encourages that, instead of the incident-oriented
method that has continued to dominate in tandem with
the professional model, the problem-solving attitude of
police be embraced.
keywords: Moral Solidarity, Procedural Justice, Orientation towards Policing, Mediation Analysis,
PLS-SEM.
introDuCtion
The maintenance and management of the social order are undoubtedlyone of the major functions of the legal authorities (Sunshine & Tyler,2003). However, there are certain limitations to the management of thissocial order and thus it does not succeed to reflect on the full motivationalarray that expects to develop reactions of people on social authorities. Theresearchers have more focus on the judgments of people based on identity(Bradford, 2016) and also on their belief regarding social justice (Bradford& Creutzfeldt, 2018).
According to the sociological theorists, people evaluate the penallaw or criminal agents like the courts and police based on thecommunities according to the level to which the community moralvalues are represented by them and how much they show these valuesin their actions and in giving punishments to the guilty one (Jackson &Gau, 2016). The punishment to the guilty one is considered to be animportant element because when certain violations remain unpunishedin a society, it generates the authority of the moral structures to shapethe behavior of social members. When the group norms are violated,
Khan, S. F., and Siddiqui, D. A.
164

the identity of that group gets damaged and this raised a question amongthe group members regarding the group status and their values too. Thelegal authorities are those that safeguard their moral values. They givecertain punishments to the guilty one and thus it is expected that theywould get their community’s support too (Maxwell, Moore, Fontaine,& Smith, 2019).
There has been consistent research that claims that the followers morewillingly accept their leaders’ decisions and they support these leaderswhen these followers know that the leaders make decisions about them ina fair way (Ottu & Okurame, 2016). These findings have shown thatprocedural fairness is necessary for leaders (Pehrson, Devaney, Bryan, &Blaylock, 2017).
Moreover, as stated by Kochel, Parks, and Mastrofski (2013), the publichas faith regarding the visions and productivity of the department ofpolice, and specifically, the capability to capture and penalize the culpritwas the main cause for addressing the violations and misdeeds to thedepartment of police. Furthermore, several people don’t endorse thedepartment of police for the reason of their lacking efforts towardsprotecting the fundamental assets and rights of the public. So these,fundamental causes could direct the public towards mistrusting anddisbelieving and lower stage of support and the observance to thedepartment of police (Ullah & Ibrar, 2019).
The term strategy and policy relates to a team of individuals whoestablish enforcement of the law in the community by enhancing andconducting to their finest capabilities that are defined as the first repliertowards any disorder from the public. Likewise, it has been declared thatno department could give service and facilities in the absence of thesupport and assistance from the majority of the people (Ullah & Ibrar,2019). For example, Ullah, Hussain, Alam, and Akhunzada (2016)highlighted that the back and assistance of the department of police isessential to preserve and retain support and acquiescence and maintainlaw enforcement at the peak level. There were numerous issues in the stateof Pakistan and along with the absence of governance and there aresuchlike intense issues that could cripple the entire arrangement andsystem. By way of illustration, the main issue in the department of policein the state of Pakistan is that police could not give primary defenses tothe individuals and public, however, the department of police could aren’t
Does Procedural Justice Leads Towards The Feelings of Compliance,
and Cooperation with, and Empowerment of Law Enforcement Agencies in Pakistan
165

very much efficient in providing sufficient construct to give and holds thesystem of law enforcement (Siddiqi, Butt, & Afzaal, 2014).
A police department in the state of Pakistan has been confrontingvarious issues in the rouse of various acts of terrorism such as the absenceof refuges and wealth and education and training and insufficientmachinery. The ratio of offenses and criminal acts has bounced in the lastten years and enforcement of law being appeared to be disassembled asthe department of Police doesn’t have advanced technical equipment andthe essential and necessary expertise and abilities as well (Abbas, 2004;Ullah & Ibrar, 2019). Besides, Abbas (2004); Ullah and Ibrar (2019)declared that the effectiveness of the police department has beenconsidered as deterioration every day and has been presented as below tothe needed mark.
The review based on the theory of procedural justice, specificallywithin-group involvement paradigm shape. Blader and Tyler (2009); Tylerand Blader (2000, 2003), recognizes that procedures of societalindividuality are a major intellectual mediator among ideas and visions ofthe fairness of procedures, supporting the dept. of police and respect andloyal with the rule and regulation (Tyler, 1990, 2006; Tyler, Goff, &MacCoun, 2015). Henceforth, the current study had aimed to examine theeffects of procedural justice towards moral solidarity and orientationtowards policing which further effects empowerment, compliance, andcooperation.
tHeoretiCal fraMeWork anD HYPotHesis
DeVeloPMent
social identity theory
In collaborating the hypothesis and idea, H. E. Tajfel (1978) (incooperation with their students which are graduate John Turner) claimedthat reciprocities of human scopes on exchequer from being merely inter-individual in the view of this to merely inter-cluster on the other (Tajfel& Turner, 1979). Simply inter-individual reciprocities (which Turner andTajfel considered to be unusual) engages public associating in which thepublic associate totally as delegates of their groups, as well as wheresomeone’s peculiar and personal features are swamped through thesaliency of the membership of one group (Tajfel & Turner, 1979). It wasclaimed in the research that gliding forms the inter-individual to the inter-cluster end of the range outcomes within modifications in how the public
Khan, S. F., and Siddiqui, D. A.
166

watch one another and themselves. Illustrating the work regarding thecognition of the society Tajfel and Wilkes (1963), Tajfel claimed that thesimple procedure of creating prominent ‘ we and them’ disparities variatesthe way public watch one another. When differences in classes areprominent, public noticeably increases similarities inside the group(almost similar) and increase disparities between the group (distinct fromothers) (Hogg, Terry, & White, 1995). Classes merely variate the waypublic watch themselves, in the vision that it enables a various stage ofsomene’s personal idea.
self-Categorization theory
The theory of social identity claimed that linkages of the workgroupwere controlled by the cooperation of cerebral, inspirational as well associally historical observations. Turner and other working employeesdesired to intricate and improve the cerebral factor of the specific theory(Hogg & Terry, 2000). Thereby, they intended to take over the workgroupemphasis onthe theory of social identity and to remark on to theprocedures of intragroup as well (Turner & Reynolds, 2011). By the theoryof societal categorization (incorporating self-classes) happen as anoperation of both fit and availability (Oakes, 1987; Oakes, Turner, &Haslam, 1991). Fit relates to the scope to which societal classes arediscerned to reflect and consider the reality of society; that’s the scope towhich they are viewed to be indicative of variances of the actual world(Turner & Reynolds, 2011). Personals could discern a huge stage of fit ifthe class difference optimizes discerned inter-class variations and reduceswithin-class differences (comparable fit). This specific precept -judged toas target contrast proportion- certainly owes a highbrow liability toclassical art on classification, in the context that it claims that classes makein a specific pattern that enhances commonalities of an intraclass andvariances of an interclass (Trepte & Loy, 2017).
Moral solidarity and orientation towards learning
Sunshine and Tyler (2003) aimed to demonstrate that the individuals’cooperation with the department of police is encouraged as the police arethe prototypes of representing the value of the teams’ morale. It alsoshowed that people assess the level at which the police show the valuesof teams’ morale by the relationship model of command are found toengage, people who are not sure about their status in the team are foundto be more powerfully disturbed about the problems of procedural justicethan about the problems of distributive justice (Pehrson et al., 2017).
Does Procedural Justice Leads Towards The Feelings of Compliance,
and Cooperation with, and Empowerment of Law Enforcement Agencies in Pakistan
167

Moreover, Ottu and Okurame (2016) found that the covariance analysissuggested that being morally solid and how justice was perceived weresignificantly associated and explaining the collaboration to fight terrorism.But it was found that the social identity was not found to have a significantassociation with the support of the citizens in fighting terror and crime.The findings also concluded that there was no variation in gender insupport of the citizen to fight terror and crime (Murphy, Cramer, Waymire,& Barkworth, 2018).
H1. Moral solidarity has a significant effect on orientation towards
policing.
Procedural Justice and Moral solidarity
Bradford and Creutzfeldt (2018) found that there was a significantrelationship among perception of procedural justice and result like a wholeperception of equity, the reliability and credibility of service of theombudsman as well as accepting the decisions. However, it was also foundthat the relationships are widely indifferent in the countries of the UK andGermany, however, irrespective of this, all factors constant, participantsfrom Germany showed more compatibly more positive views (Jackson &Gau, 2016). The data also added a fine distinction to the present studieson procedural justice and recommends that the domestic circumstancesplay a significant part. It is recommended that the domestic culture ofjustice provides toward a model of regulation that escorts the perceptionof individuals’ and behavior injustice, quasi-justice as well as theassociated environment, whereas, Radburn, Stott, Bradford, and Robinson(2018) found that the reason as to how the perception of the respondentsabout the activities of police was impacted by the social categories in adramatic manner as well as that the relational identity of the police wasmediating the association among the intention of cooperating with thepolice and the judgment of procedural fairness instead of the category ofsuperordinate. The second experiment repeated and widened the resultsby illustrating how the procedural fairness perceptions were significantlyimpacted by stages of the identity of the in team demonstrating (Maxwellet al., 2019).
H2. Procedural justice has a significant effect on moral solidarity.
Procedural Justice and orientation towards Policing
In the first place, verifiable inside many ebbs and flow examine isthe possibility that procedural justice is a general and ontological
Khan, S. F., and Siddiqui, D. A.
168

antecedent to social distinguishing proof, some way or anotherunmistakable from the dynamic social settings inside which thosedecisions are made (Lipponen, Wisse, & Perälä, 2011). PJT explore isintroduced on the possibility that individuals discover the police prettymuch reasonable relying upon how officials act, however, the relevantedge against which these decisions are made shows up, certainly in anyevent, as comprehensively consistent (Pósch, 2020). As Waddington,Williams, Wright, and Newburn (2015) put it there is a basicpresumption of “a rational unitary, open standard of what is adequateand palatable in police lead”. Interestingly, Haslam, Reicher, and Platow(2010) contend that rules administering Justice are not all-inclusive butrather relative in that they can be fundamentally adjusted as an outcomeof gathering enrollment with the end goal (Bradford, Murphy, &Jackson, 2014).
Conversely, those whose status is high and secure should put moreweight on issues of distributive equity. Further, socially minimalindividuals will be less worried about the status because their low statusis clear; they additionally will concentrate on distributive equity (Tyler &Lind, 1990). This hypothesis has been developed based onproceduraljustice theory (PJT) which identifies that police do make actualize legalenvironment and tries to make people believe by their actions towardstheir legal or legitimize positive values with the relationship of assistanceand compliance of the people so that it increases the orientation towardspolicing (Gangl, 2003; Murphy, Sargeant, & Cherney, 2015). Hence, withthe above-mentioned reasons, the study has hypothesized that:
H3. Procedural justice has a significant effect on orientation towards
policing.
Procedural Justice, Moral solidarity, and orientation towards
Policing
For quite a long time, the examination has considered the subject ofwhat makes legitimate procedures fair and satisfactory to those included.Two particular segments are usually recognized. First, there are resultrelated concerns. On this record, individuals who have been engaged witha legitimate procedure or strategy ask themselves “did I get the result Ineeded” (result favorability) and additionally “do I think I got a similarresult as others in my circumstance” (impression of equivalent treatment)(Sunshine & Tyler, 2003). On the off chance that the responses to these
Does Procedural Justice Leads Towards The Feelings of Compliance,
and Cooperation with, and Empowerment of Law Enforcement Agencies in Pakistan
169

inquiries are sure they are probably going to feel that the procedureconcerned was itself fair and proper; be happy with both it and the leader;be eager to acknowledge the choice came to; and be bound to comply withthe (future) guidelines of the position figure and the direction towards thepolicing with the incorporation of moral solidarity (Durkheim, 1986). Thishypothesis has been developed based on procedural justice theory (PJT)which states that people only believe towards police when people havegot their desired and deserved share of justices and it creates a sense ofharmony and solidarity among the group which as a result eventuallyincreases their orientation towards police (Gangl, 2003; Murphy et al.,2015). Hence, with the above-mentioned reasons, the study hashypothesized that:
H4.Procedural justice has a significant effect on orientation towards
policing with the mediating effect of moral solidarity.
orientation towards Policing and empowerment
Empowerment is a series of steps intended to improve the degree ofautonomy and self-determination in persons and societies, to allow themto serve their interests in a responsible and self-determined manner,operating in their power (Clonan-Roy, Jacobs, & Nakkula, 2016). Whenthe public considers the police as credible, they are most likely to help thepolice in reducing violence (i.e. investigating violence or asking forassistance). Citizens may be helping police as they believe police aresuccessful at handling violence and social chaos (Triantafillou & Nielsen,2001). When the police are seen as successful, the support that the policehave to provide will be perceived by the public as more valuable becauseit will have a better potential to contribute to tangible outcomes (Wang,2013). This indicates that individuals carry out instrumental authoritytests, collaborating alongside the police because they consider that thepolice cope efficiently alongside group concerns and conflicts. The publicviews police as trustworthy, most likely to empower the police to carryout their policing duties, and less likely to attempt and limit police actionor hinder police activity (Gasper & Davies, 2018). The current hypothesishas been developed using self-categorization theory which postulates thatpeople work on their gatherings and try to adapt to evaluate their self-esteem (Turner, Hogg, Oakes, Reicher, & Wetherell, 1987). Thus, thisstudy has hypothesized that:
H5. Orientation towards policing has a significant effect on empowerment.
Khan, S. F., and Siddiqui, D. A.
170

orientation towards Policing and Compliance
The term compliance identifies the degree to which people cooperatewith someone and do accordingly to their command. Also, when peoplerefer to some authority as legitimate then it has been deemed that peoplewill try to comply with their terms willingly. Similarly, Tyler (1997) statedthat when the courts and police are legitimate and trustworthy in the eyesof people so then people will easily comply with their wishes anddirectives. Also, the major element is that the current motivation has beentermed as different from the belief that a person is likely to be caught andthen tried to be punished for not following the law. Also, authorities aretrying to make people accept that authorities have granted legitimacy tothe police to react towards any disobedient of law and fight against thecrime (Segrave & Ratcliffe, 2017). So, people try to obey and followpolice because police are legal and represent law respectfully andpowerfully; hence, to feel compliance with police it is also necessary tofeel compliance withthe law as well (Farren, Hough, Murray, & McVie,2018). The aspect of legal legitimacy might help in understanding the levelof variation in self-reported compliance because people tend to respectand treat the law equally; as people try to follow rules even if people donot comply with the law (Murray et al., 2020). This hypothesis has beendeveloped using self-categorization theory which states that this theoryhelps people in identifying the characteristics and activities of thegathering or a group which eventually led towards examine and know theirqualities (Turner et al., 1987). Hence, with the above-mentioned reasons,the study has hypothesized that:
H6. Orientation towards policing has a significant effect on compliance.
orientation towards Policing and Cooperation
It has been acknowledged that by restricting their role with criminalactivity, police expect more from individuals than simply their ability todefer to rule (Adamonienė & Ruibytė, 2017). The police do wantneighborhood leaders to partake in constructive activities that are helpingthe police combat crime. New reports make it clear that without thecooperation of city members the police cannot successfully monitor crimeand disorder (Nalla, Meško, & Modic, 2018). In other words, as peopleconsider the police as credible, they are more likely to agree to policeaction willingly, and less likely to contest it (Roberts, 2018). Greatercoordination would help police to more easily and efficiently perform their
Does Procedural Justice Leads Towards The Feelings of Compliance,
and Cooperation with, and Empowerment of Law Enforcement Agencies in Pakistan
171

regulatory position. Legitimacy is related to the intrinsic sense oflegitimacy of people, which thus encourages voluntary, cooperativebehavior (Nivette & Akoensi, 2019). When people consider the police astrustworthy they are more likely to contact them and investigate incidentsor to donate their time in their neighborhoods’ to collaborate for them(Kochel, 2018). This hypothesis has been developed by using self-categorization theory in which people believe that by understanding theperspective and attending their gatherings will help in better know andcooperate with others (Turner et al., 1987). Thus, this study hashypothesized that:
H7. Orientation towards policing has a significant effect on cooperation.
Figure 1: Research Framework
Design anD MetHoDs
sampling Design
This research estimated that it is required that 60 responses have tocollect based on N(10) formula Hair, Ringle, and Sarstedt (2011) as 6(10)is equal to 60, therefore, the researcher collected a sample of 296 responses.The non-probability purposive sampling technique is a kind of samplingtechnique where the researcher gathers the information from the populationthat can provide abundant and accurate data. The non-probability purposivesampling technique was used as this research needs that the data providessignificant information as it is collected from experts in the industry(Westland, 2010). The target population of the study consisted of thecitizens of Karachi that have encountered an experience with Sind police.
Khan, S. F., and Siddiqui, D. A.
172

instrument
The five-point Likert scale questionnaire was utilized for the collectionof data. The five-point Likert scale was used as it allows the research toincrease the overall response rate because it creates less confusion. Thedata was collected using the survey methodology. The survey method iswhere respondents are asked questions face to face using the questionnaireadopted for the study. The method of the survey allows the researcher togather the information in lesser time as well as it is also cost-effective andit can also be easy to administer by the researcher. This research used theself-administered questionnaires for the collection of data.
Seven measures for procedural justice were adapted from Sunshine andTyler (2003) based on a five-point Likert scale including “How often dopeople receive the outcomes they deserve under the law when they dealwith the police?”. Five measures for empowerment were adapted fromSunshine and Tyler (2003) based on a five-point Likert scale including“The police should have the right to stop and question people on thestreet”. Ten measures for cooperation were adapted from Sunshine andTyler (2003) based on a five-point Likert scale including “call the policeto report a crime occurring in [they’re] neighborhood”. Seven measuresfor compliance were adapted from Sunshine and Tyler (2003) based on afive-point Likert scale including “where to park your car legally”. Sevenmeasures for moral solidarity were adapted from Sunshine and Tyler(2003) based on a five-point Likert scale including “The law is usuallyconsistent with the values of the people in [my] neighborhood about whatis right and wrong”.
Data analysis
The present research used the PLS-SEM (partial least squares-structuralequation modeling) technique for the analysis of the data. The PLS-SEMis a kind of structural equation modeling where the researcher evaluatesthe correlation as well as the cause and impact linkage among the elementsof the research model (Chin, Thatcher, Wright, & Steel, 2013). The partialleast squares structural modeling technique allows the researcher toevaluate the complex relationships between the research variableseffectively and much ease. The PLS-SEM also can robustly control moredescription variables, whereas also providing higher predictive accuracy(Ringle, Sarstedt, & Straub, 2012). The PLS-SEM technique was used withthe help of the SmartPLS software version 3.2.8.
Does Procedural Justice Leads Towards The Feelings of Compliance,
and Cooperation with, and Empowerment of Law Enforcement Agencies in Pakistan
173

results anD finDings
Demographic Profile of the respondents
The demographic profile of the respondents showed that there were atotal of 296 responses. Of the 110 (37.2%) were males and 186 (62.8%)were females. Also, 46 (15.5%) were aged from 18 to 24, 218 (73.6%)were aged from 24 to 33 and 32 (10.8%) were aged from 35 to 44.Moreover, 190 (64.2%) were graduates, 96 (32.4%) were post-graduatesand 10 (3.4%) had other qualifications. Lastly, 8 (2.7%) earned 25000PKR or below, 178 (60.1%) earned 25001 to 50000 PKR, 105 (35.5%)earned 50001 to 75000 PKR and 5 (1.7%) earned 75000 PKR and above.
Variab-
les and
factors
Questions
Descriptive
stats
Confirmatory factor
analysis
MeanStandarddeviation
outer
loading
t
stats
P
Values
Moral
soli-
darity
The police in [my] neighborhoodact in ways that are consistent with[my] own moral values about howpeople should be treated.
3.42 1.16 0.95 166.46 0.00
The values of most police officersare very similar to my own
2.81 1.37 0.95 166.17 0.00
I think that most police officerswould respect my value.
2.97 1.25 0.94 74.26 0.00
I think that most police officerswould value what I contribute to myneighborhood
3.72 0.89 0.74 22.73 0.00
Com-
pliance
where to park your car legally 3.97 0.74 0.94 173.34 0.00
how to legally dispose of trash and little 4.01 0.66 0.90 66.35 0.00
not taking inexpensive items fromstores or restaurants without paying
4.26 0.44 0.87 50.24 0.00
Not using drugs such as marijuana. 4.19 0.39 0.80 26.22 0.00
Coop-
eration
call the police to report a crimeoccurring in [their] neighborhood
3.82 0.93 0.72 16.04 0.00
Help the police to find someonesuspected of committing a crime.
4.05 0.62 0.80 36.36 0.00
call and give the police informationto help the police solve a crime
3.99 0.89 0.89 62.63 0.00
spend some of [they’re] time helpingnew police officers by showing themaround [their] neighborhood
4.28 0.61 0.62 16.15 0.00
Be willing to serve on a neighborhoodcommittee to discuss problems in[their] neighborhood with the police.
4.39 0.61 0.91 74.72 0.00
Khan, S. F., and Siddiqui, D. A.
174

In the above table moral solidarity has 4 items loaded. The first item“The police in [my] neighborhood act in ways that are consistent with
[my] own moral values about how people should be treated.” has a meanvalue of 3.42 and a standard deviation of 1.16. Its outer loading was 0.95and was found statistically significant (166.46, p<0.05). The second item“The values of most police officers are very similar to my own” has a meanvalue of 2.81 and a standard deviation of 1.37. Its outer loading was 0.95and was found statistically significant (166.17, p<0.05). The third item “i
think that most police officers would respect my value.” has a mean valueof 2.97 and a standard deviation of 1.25. Its outer loading was 0.94 andwas found statistically significant (74.26, p<0.05). The fourth item “i think
that most police officers would value what i contribute to my
neighborhood” has a mean value of 3.72 and a standard deviation of 0.89.Its outer loading was 0.74 and was found statistically significant (22.73,p<0.05).
In the above table, compliance has 4 items loaded. The first item “where
to park your car legally” has a mean value of 3.97 and a standard deviation
em-
power
The police should have the power todecide which areas of the city shouldreceive the most police protection
3.53 1.08 0.87 12.02 0.00
Because of their training andexperience, the police are best ableto decide how to deal with crime inyour neighborhood
3.45 1.10 0.85 11.70 0.00
The police should have the power todo whatever they think is needed tofight crime.
3.53 1.05 0.90 13.41 0.00
If we give enough power to thepolice, they will be able toeffectively control crime.
3.98 0.84 0.66 10.78 0.00
Proce-
dural
Justice
make decisions about how to handleproblems in fair ways
4.32 0.54 0.77 22.72 0.00
treat people fairly 4.14 0.80 0.89 36.58 0.00
How often do people receive theoutcomes they deserve under thelaw when they deal with the police?
4.11 0.76 0.76 13.98 0.00
Are the outcomes that people receivefrom the police better than theydeserve, worse than they deserve, orabout what they deserve under the law?
4.32 0.79 0.78 15.20 0.00
Does Procedural Justice Leads Towards The Feelings of Compliance,
and Cooperation with, and Empowerment of Law Enforcement Agencies in Pakistan
175

of 0.74. Its outer loading was 0.94and was found statistically significant(173.34, p<0.05). The second item “how to legally dispose of trash and
little” has a mean value of 4.01 and a standard deviation of 0.66. Its outerloading was 0.90and was found statistically significant (66.35, p<0.05).The third item “not taking inexpensive items from stores or restaurants
without paying” has a mean value of 4.26 and a standard deviation of 0.44.Its outer loading was 0.87 and was found statistically significant (50.24,p<0.05). The fourth item “not using drugs such as marijuana.” has a meanvalue of 4.19 and a standard deviation of 0.39. Its outer loading was 0.80and was found statistically significant (26.22, p<0.05).
In the above table, cooperation has 5 items loaded. The first item “call
the police to report a crime occurring in [their] neighborhood” has a meanvalue of 3.82 and a standard deviation of 0.93. Its outer loading was 0.72 andwas found statistically significant (16.04, p<0.05). The second item “help
the police to find someone suspected of committing a crime.” has a meanvalue of 4.05 and a standard deviation of 0.62. Its outer loading was 0.80 andwas found statistically significant (36.36, p<0.05). The third item “call and
give the police information to help the police solve a crime” has a mean valueof 3.99 and a standard deviation of 0.89. Its outer loading was 0.89and wasfound statistically significant (62.63, p<0.05). The fourth item “spend some
of [they’re] time helping new police officers by showing them around [their]
neighborhood” has a mean value of 4.28 and a standard deviation of 0.61.Its outer loading was 0.62and was found statistically significant (16.15,p<0.05). The fifth item “be willing to serve on a neighborhood committee to
discuss problems in [their] neighborhood with the police.” has a mean valueof 4.39 and a standard deviation of 0.61. Its outer loading was 0.91 and wasfound statistically significant (74.72, p<0.05).
In the above table empower has 4 items loaded. The first item “The
police should have the power to decide which areas of the city should
receive the most police protection” has a mean value of 3.53 and a standarddeviation of 1.08. Its outer loading was 0.87 and was found statisticallysignificant (12.02, p<0.05). The second item “Because of their training
and experience, the police are best able to decide how to deal with crime
in your neighborhood” has a mean value of 3.45 and a standard deviationof 1.10. Its outer loading was 0.85 and was found statistically significant(11.70, p<0.05). The third item “The police should have the power to do
whatever they think is needed to fight crime.” has a mean value of 3.53and a standard deviation of 1.05. Its outer loading was 0.90 and was found
Khan, S. F., and Siddiqui, D. A.
176

statistically significant (13.41, p<0.05). The fourth item “if we give enough
power to the police, they will be able to effectively control crime.” has amean value of 3.98 and a standard deviation of 0.84. Its outer loading was0.66and was found statistically significant (10.78, p<0.05).
In the above table procedural justice has 4 items loaded. The first item“make decisions about how to handle problems in fairways” has a meanvalue of 4.32 and a standard deviation of 0.54. Its outer loading was 0.77and was found statistically significant (22.72, p<0.05). The second item“treat people fairly” has a mean value of 4.14 and a standard deviation of0.80. Its outer loading was 0.89 and was found statistically significant(36.58, p<0.05). The third item “How often do people receive the outcomes
they deserve under the law when they deal with the police?” has a meanvalue of 4.11 and a standard deviation of 0.76. Its outer loading was 0.76and was found statistically significant (13.98, p<0.05). The fourth item“Are the outcomes that people receive from the police better than they
deserve, worse than they deserve, or about what they deserve under the
law?” has a mean value of 4.32 and a standard deviation of 0.79. Its outerloading was 0.78 and was found statistically significant (15.20, p<0.05).
Figure 2: PLS Algorithm using SmartPLS version 3.2.8
Table 2: Fornell and Larcker (1981) CriterionCoMP CooP eMP Ms PJ
Compliance 0.878
Cooperation 0.422 0.795
Empower 0.281 0.305 0.824
Moral Solidarity 0.170 0.292 0.498 0.897
Procedural Justice 0.326 0.631 0.388 0.201 0.804
Does Procedural Justice Leads Towards The Feelings of Compliance,
and Cooperation with, and Empowerment of Law Enforcement Agencies in Pakistan
177

In the above table, bold values are the squared-root of AVE for eachlatent construct while these bold values were higher than other constructsin the model. Henceforth, discriminant validity using Fornell and Larcker(1981) has been achieved.
Table 3: Heterotrait-Monotrait (HTMT) Ratio
Following the recommended threshold of Henseler, Hubona, and Ray(2016); Henseler, Ringle, and Sarstedt (2015), the HTMT ratio should bebelow than 0.85 for considerable discriminant validity. Herein, the abovetable showed that all latent constructs have an HTMT ratio of less than0.85 and therefore, discriminant validity using Heterotrait-Monotrait(HTMT) ratio has been achieved.
structural equation Modelling
To test the study hypothesis we have used the structural equationmodel (SEM) whereas the testing has been gone through Smart PLSsoftware. Moreover, to evaluate the indirect and direct effects of all theconstructs the testing was done. The use of (SEM) structural equationmodel has been observed to be a foremost procedure that has been usedbelow different regression models and methods (Baron & Kenny, 1986).It used to evaluate the structural relationship between exogenous andendogenous variables. It includes factor analysis and multivariateanalysis. Moreover, the equation of regression targets at explaining eachconstruct to assess the cause and effect relationship while all of thefactors in the causal model could demonstrate their cause and effect atthe exact time. Likewise, the idea of using this model ensures to applythe technique of bootstrapping which has been viewed as reasonable forboth small and large sample sizes and does not require any kind ofindirect effect (Hayes, 2013). To check all direct and indirect effects, atechnique has been implemented which is known as bootstrapping(Shrout & Bolger, 2002).
CoMP CooP eMP Ms PJ
Compliance
Cooperation 0.468
Empower 0.306 0.318
Moral Solidarity 0.233 0.342 0.478
Procedural Justice 0.303 0.723 0.369 0.207
Khan, S. F., and Siddiqui, D. A.
178

Table 4: Hypothesis-Testing
Above table for hypothesis-testing using PLS-SEM path analysisshowed that moral solidarity (0.295, p < 0.01) has a positive significanteffect on orientation towards policing, whereas procedural justice has asignificantly positive effect on moral solidarity (0.201, p < 0.01) andorientation towards policing (0.558, p < 0.01). Moreover, the mediatingeffect of moral solidarity (0.059, p < 0.01) has also been found positivelysignificant between procedural justice and orientation towards policing.According to Zhao, Lynch Jr, and Chen (2010), moral solidarity hascomplementary mediation between procedural justice and orientationtowards policing.
Figure 3: PLS Bootstrapping using SmartPLS version 3.2.8
Mediation analysis
The following table has shownthe results of the mediation analysis.
estimate Prob.
Moral Solidarity ––> Orientation towards Policing 0.295 0.000
Procedural Justice ––> Moral Solidarity 0.201 0.000
Procedural Justice ––> Orientation towards Policing 0.558 0.000
Procedural Justice ––> Moral Solidarity ––> Orientation towards Policing 0.059 0.000
estimate Prob.
Moral Solidarity ––> Orientation towards Policing ––> Compliance 0.227 0.000
Procedural Justice ––> Moral Solidarity ––> Orientation towards Policing––> Compliance
0.046 0.000
Procedural Justice ––> Orientation towards Policing ––> Compliance 0.428 0.000
Moral Solidarity ––> Orientation towards Policing ––> Cooperation 0.242 0.000
Procedural Justice ––> Moral Solidarity ––> Orientation towards Policing––> Cooperation
0.049 0.000
Does Procedural Justice Leads Towards The Feelings of Compliance,
and Cooperation with, and Empowerment of Law Enforcement Agencies in Pakistan
179

The above table has shown orientation towards policing (0.027, p<0.01)has a positive and significant mediation effect between moral solidarity andcompliance. The moral solidarity and orientation towards policing (0.046,p<0.01) have positively and significantly mediated the relationship betweenprocedural justice and compliance. The orientation towards policing (0.428,p<0.01) has positively and significantly mediated the relationship betweenprocedural justice and compliance. The orientation towards policing (0.242,p<0.01) has positively and significantly mediated the relationship betweenmoral solidarity and cooperation. Also, moral solidarity and orientationtowards policing (0.049, p<0.01) both with double mediation positively andsignificantly affect the relationship between procedural justice andcooperation. The orientation towards policing (0.458, p<0.01) has a positiveand significant mediation effect between procedural justice and cooperation.The orientation towards learning (0.189, p<0.01) has a positive andsignificant mediation effect between moral solidarity and empowerment.The moral solidarity and orientation towards learning (0.038, p<0.01) bothhave positively and significantly mediated the relationship with proceduraljustice and empowerment. The orientation towards learning (0.356, p<0.01)has a positive and significant mediated effect between procedural justiceand empowerment. The moral solidarity (0.059, p<0.01) has a positive andsignificant mediated effect between procedural justice and orientationtowards policing.
ConClusion anD reCoMMenDations
Procedural justice has a major decisive effect on orientation towardspolicing with the mediating effect of moral solidarity. Furthermore, thepresent study determines that Citizens in a community work with policebecause they believe that police act in harmony with the community andsupport and uphold community standards through their social regulationacts. However, people who think police use equal methods to assert theirjurisdiction often have greater moral unity with the police. Therefore, onemanner in which the police should show that they represent communityvalues is to demonstrate procedural fairness through their acts.
Procedural Justice ––> Orientation towards Policing ––> Cooperation 0.458 0.000
Moral Solidarity ––> Orientation towards Policing ––> Empower 0.189 0.000
Procedural Justice ––> Moral Solidarity ––> Orientation towards Policing––> Empower
0.038 0.000
Procedural Justice ––> Orientation towards Policing ––> Empower 0.356 0.000
Procedural Justice ––> Moral Solidarity ––> Orientation towards Policing 0.059 0.000
Khan, S. F., and Siddiqui, D. A.
180

As indicated by the approach of social identity, individuals react togroup specialists when they see those specialists as prototypical agents oftheir gathering (Hogg, 2001). In the current study, we propose thatindividuals in network communication to the police when they feel thatthe police are standing in solidarity with the community and are supportingand shielding standards of the network in their social administrativeactivities. The discoveries of this examination bolster that contention.Individuals go along more completely with the police, cooperate with themall the more firmly, and empower them all the more exceptional when theythink the police share their virtues (Dagger, 1997).
This worth based connection is particular from individuals’instrumental association with specialists. Individuals likewise conform tothe law when they feel that they are probably going to be gotten andrebuffed for neglecting to do as such (Franck, 1999). Along with that, theyalso make cooperation with the police if they feel that the police arepowerful in managing wrongdoing (Tyler, 2004).
Further, our discoveries recommend that individuals’ level ofrecognition with their community shapes their feeling of moral solidarity.The individuals who relate to their community feel more prominentsolidarity with the police, accepting that the police share their qualitiesand the estimations of those in their gathering (Jackson et al., 2012).
Moreover, individuals who think the police practice their power withreasonable processes likewise feel more noteworthy good solidaritytowards police. Accordingly, one way in which the police can show thatthey reflect network esteems is to show procedural justice in theiractivities. This finding is predictable with different investigationsrecommending that acting decently additionally upgrades policeauthenticity (Sunshine & Tyler, 2003).
People use procedural justice knowledge according to the hierarchicalmodel of authority to show both the position of their group and their statuswithin that group Tyler and Blader (2000); Tyler and Lind (1990)Ourresults endorse this claim by showing that those people who believe thepolice are reasonably exercising their authority often demonstrate that theyidentify with their society and that the police represent the moral valuesof that culture. The police construct their moral standing as representativesof the group by acting fairly (Tyler & Huo, 2002).
Does Procedural Justice Leads Towards The Feelings of Compliance,
and Cooperation with, and Empowerment of Law Enforcement Agencies in Pakistan
181

The ones whose distinguishing proof with the community is moderateare found, as anticipated, to put the best weight on the procedural justiceof police activities while deciding their convictions about their ethicalsolidarity towards police. To a more noteworthy degree than others, theyconclude that the police share the community’s virtues when they thinkthe police utilize reasonable methods in practicing their position. Theindividuals who are distinguished most firmly with the community areprogressively sure of their status and spot more prominent load on issuesof distributive justice, which is increasingly instrumental (Lind & Tyler,1988; Tyler, 1994).
reCoMMenDations
This concept relies heavily on the articulation of police values that involvethe involvement of citizens in the security and quality of neighborhoodlife issues. Some of the recommendations are: firstly, community policingencourages that, instead of the incident-oriented method that has continuedto dominate in tandem with the professional model, the problem-solvingattitude of police be embraced. Emergency calls will still be dealt withimmediately and police officers will still spend a great deal of their timedealing with individual cases. Police officers, though, should still attemptto identify the underlying causes that relate to single and repeatedaccidents. After determining the reasons, officers should use them to trackand prevent future accidents.
The examination causes the Authorities to comprehend that there isn’tonly the need of being fair yet additionally to be viewed as fair. Thisimplies they have to have straightforward methods and to clarify thosemethodologies and the choices that create through them in manners thatpermit individuals to comprehend both what they have to do when thechoice and how the choice will be made.
Furthermore, police should also understand the Neighborhood wantsissues and goals to meet their needs. And this can only be accomplishedby focusing on routine interaction and communication between policeofficers and residents to develop a mutually beneficial relationship. In thiscontext, the idea that police officers are supposed to find creative ways ofsolving challenges in the neighborhood must be emphasized. Communitypolice emphasize the relationship that should occur between police andpeople to improve their quality of life.
Khan, S. F., and Siddiqui, D. A.
182

liMitations anD future researCH
Before we finish up, we should take note that the flow study has asignificant number of limitations or constraints characteristic in large scalecommunity examination. For example, although drawn from a huge,different geographic example, the cross-sectional nature of as far aspossible causal inference. For instance, we make the case that the qualityof character with one’s ethnic subgroup and impression of policepredisposition may bring about a hesitance to cooperate with the police.In any case, the cross-sectional nature of our information doesn’t permitus to test whether police predisposition and ethnic gathering personalityprompt diminished participation, or whether uncooperative people are lessinclined to see police well or are bound to distinguish firmly with theirethnic subgroup.
Some of the recommendations for future researchers are: firstly, thefuture researcher can take a larger sample size as the current sample sizeis small. Secondly, Future researchers can collect data from other cities ofPakistan as well to reduce the issue of generalizability. Further, the futureresearcher may also focus on other types of justice to check their impacton orientation towards policing. Moreover, a qualitative research approachcan also be used to collect data so that the researcher can get a betterunderstanding of this topic. The research may also opt for two models thatare presented in the study more directly.
Does Procedural Justice Leads Towards The Feelings of Compliance,
and Cooperation with, and Empowerment of Law Enforcement Agencies in Pakistan
183

referenCes
Adamonienė, R., & Ruibytė, L. (2017). Evaluation of performance ofleaders in lithuania police organization by applying commonassessment framework.
Ahmad, S. (2019). Pakistani policewomen: Questioning the role of genderin circumscribing police corruption. Policing and Society, 1-15.
Baron, R.M., & Kenny, D.A. (1986). The moderator–mediator variabledistinction in social psychological research: Conceptual,strategic, and statistical considerations. Journal of Personality
and Social Psychology, 51(6), 1173.
Blader, S.L., & Tyler, T.R. (2009). Testing and extending the groupengagement model: Linkages between social identity, proceduraljustice, economic outcomes, and extrarole behavior. Journal of
Applied Psychology, 94(2), 445.
Bradford, B. (2016). The dog that never quite barked: Social identity andthe persistence of police legitimacy. Changing Contours of
Criminal Justice, 29.
Bradford, B., & Creutzfeldt, N. (2018). Procedural justice in alternativedispute resolution: Fairness judgments among users of financialombudsman services in germany and the united kingdom.Journal of European Consumer and Market Law, 7(5), 188-200.
Bradford, B., Murphy, K., & Jackson, J. (2014). Officers as mirrors:Policing, procedural justice and the (re) production of socialidentity. British Journal of Criminology, 54(4), 527-550.
Chin, W.W., Thatcher, J.B., Wright, R.T., & Steel, D. (2013). Controllingfor common method variance in pls analysis: The measured latentmarker variable approach New Perspectives in Partial Least
Squares and Related Methods (231-239): Springer.
Clonan-Roy, K., Jacobs, C.E., & Nakkula, M.J. (2016). Towards a modelof positive youth development specific to girls of color:Perspectives on development, resilience, and empowerment.Gender issues, 33(2), 96-121.
Dagger, R. (1997). Civic virtues: Rights, citizenship, and republican
Khan, S. F., and Siddiqui, D. A.
184

liberalism: Oxford University Press on Demand.
Durkheim, E. (1986). An introduction to four major works. Beverly Hills:CA: Sage Publications.
Farren, D., Hough, M., Murray, K., & McVie, S. (2018). Trust in the policeand police legitimacy through the eyes of teenagers Minority
Youth and Social integration (167-192): Springer.
Fornell, C., & Larcker, D.F. (1981). Structural equation models withunobservable variables and measurement error: Algebra andstatistics. Journal of Marketing Research, 18(3), 382-388.
Franck, T.M. (1999). The empowered self: Law and society in the age of
individualism: Oxford University Press Oxford.
Gangl, A. (2003). Procedural justice theory and evaluations of thelawmaking process. Political Behavior, 25(2), 119-149.
Gasper, R., & Davies, A. (2018). Revisiting the potential of communityempowerment within uk neighbourhood policing meetings.Policing and Society, 28(2), 223-241.
Hair, J.F., Ringle, C.M., & Sarstedt, M. (2011). Pls-sem: Indeed a silverbullet. Journal of Marketing theory and Practice, 19(2), 139-152.
Haslam, S.A., Reicher, S.D., & Platow, M.J. (2010). The new psychology
of leadership: identity, influence and power: Psychology Press.
Hayes, A.F. (2013). Methodology in the social sciences. Introduction tomediation, moderation, and conditional process analysis: Aregression-based approach: Guilford Press New York, NY.
Henseler, J., Hubona, G., & Ray, P.A. (2016). Using pls path modeling innew technology research: Updated guidelines. industrial
Management & Data Systems, 116(1), 2-20.
Henseler, J., Ringle, C.M., & Sarstedt, M. (2015). A new criterion forassessing discriminant validity in variance-based structuralequation modeling. Journal of The Academy of Marketing
Science, 43(1), 115-135.
Hogg, M.A. (2001). A social identity theory of leadership. Personality and
Does Procedural Justice Leads Towards The Feelings of Compliance,
and Cooperation with, and Empowerment of Law Enforcement Agencies in Pakistan
185

Social Psychology Review, 5(3), 184-200.
Hogg, M.A., & Terry, D.I. (2000). Social identity and self-categorizationprocesses in organizational contexts. Academy of Management
Review, 25(1), 121-140.
Hogg, M.A., Terry, D.J., & White, K.M. (1995). A tale of two theories: Acritical comparison of identity theory with social identity theory.Social Psychology Quarterly, 255-269.
Jackson, J., Bradford, B., Hough, M., Myhill, A., Quinton, P., & Tyler,T.R. (2012). Why do people comply with the law? Legitimacyand the influence of legal institutions. British Journal of
Criminology, 52(6), 1051-1071.
Jackson, J., & Gau, J.M. (2016). Carving up concepts? Differentiatingbetween trust and legitimacy in public attitudes towards legalauthority. interdisciplinary Perspectives on Trust (49-69):Springer.
Kochel, T.R. (2018). Applying police legitimacy, cooperation, andcollective security hypotheses to explain collective efficacy andviolence across neighbourhoods. international Journal of
Comparative and Applied Criminal Justice, 42(4), 253-272.
Kochel, T.R., Parks, R., & Mastrofski, S.D. (2013). Examining policeeffectiveness as a precursor to legitimacy and cooperation withpolice. Justice Quarterly, 30(5), 895-925.
Lind, E., & Tyler, T. (1988). Critical issues in social justice. The socialpsychology of procedural justice. New York, NY, US: PlenumPress. http://dx. doi. org/10.1007/978-1-4899-2115-4.
Lipponen, J., Wisse, B., & Perälä, J. (2011). Perceived justice and groupidentification. Journal of Personnel Psychology.
Maxwell, C.D., Moore, A.M., Fontaine, J., & Smith, J. (2019). Statusinfluences on perceptions of procedural justice: A test of thegroup value model among intimate partner violence arrestees.international Journal of Comparative and Applied Criminal
Justice, 1-17.
Khan, S. F., and Siddiqui, D. A.
186

Murphy, K., Cramer, R.J., Waymire, K.A., & Barkworth, J. (2018). Policebias, social identity, and minority groups: A social psychologicalunderstanding of cooperation with police. Justice Quarterly,
35(6), 1105-1130.
Murphy, K., Sargeant, E., & Cherney, A. (2015). The importance ofprocedural justice and police performance in shaping intentionsto cooperate with the police: Does social identity matter?European Journal of Criminology, 12(6), 719-738.
Murray, K., McVie, S., Farren, D., Herlitz, L., Hough, M., & Norris, P.(2020). Procedural justice, compliance with the law and policestop-and-search: A study of young people in England andScotland. Policing and Society, 1-20.
Nalla, M.K., Meško, G., & Modic, M. (2018). Assessing police–community relationships: Is there a gap in perceptions betweenpolice officers and residents? Policing and Society, 28(3), 271-290.
Nivette, A.E., & Akoensi, T.D. (2019). Determinants of satisfaction withpolice in a developing country: A randomised vignette study.Policing and Society, 29(4), 471-487.
Oakes, P.J. (1987). The salience of social categories. Rediscovering the
social group: A Self-Categorization Theory, 117-141.
Oakes, P.J., Turner, J.C., & Haslam, S.A. (1991). Perceiving people asgroup members: The role of fit in the salience of socialcategorizations. British Journal of Social Psychology, 30(2), 125-144.
Ottu, I.F., & Okurame, D.E. (2016). Influence of social identity, justiceperceptions and moral solidarity on citizen’s cooperation againstterrorism in nigeria. international Journal of Social Sciences,
10(4).
Pehrson, S., Devaney, L., Bryan, D., & Blaylock, D.L. (2017). Beyondgroup engagement: Multiple pathways from encounters with thepolice to cooperation and compliance in northern ireland. PloS
one, 12(9).
Does Procedural Justice Leads Towards The Feelings of Compliance,
and Cooperation with, and Empowerment of Law Enforcement Agencies in Pakistan
187

Pósch, K. (2020). Prying open the black box of causality: A causalmediation analysis test of procedural justice policing. Journal of
Quantitative Criminology, 1-29.
Radburn, M., Stott, C., Bradford, B., & Robinson, M. (2018). When ispolicing fair? Groups, identity and judgements of the proceduraljustice of coercive crowd policing. Policing and Society, 28(6),647-664.
Ringle, C.M., Sarstedt, M., & Straub, D. (2012). A critical look at the useof pls-sem in mis quarterly.
Roberts, J.W. (2018). The perception of community oriented policing froma law enforcement organization’s perspective.
Segrave, M., & Ratcliffe, J. (2017). Community policing: A descriptiveoverview.
Shrout, P.E., & Bolger, N. (2002). Mediation in experimental andnonexperimental studies: New procedures and recommendations.Psychological methods, 7(4), 422.
Siddiqi, M.U.A., Butt, K.M., & Afzaal, M. (2014). Politicized policing inPakistan: A constructivist study of problems of policing in Lahore.
Sunshine, J., & Tyler, T.R. (2003). Moral solidarity, identification with thecommunity, and the importance of procedural justice: The policeas prototypical representatives of a group’s moral values. Social
Psychology Quarterly, 66(2), 153.
Tajfel, H., & Turner, J.C. (1979). An integrative theory of social conflict.The social psychology of intergroup relations, 2, 33-47.
Tajfel, H., & Wilkes, A.L. (1963). Classification and quantitativejudgement. British Journal of Psychology, 54(2), 101-114.
Tajfel, H.E. (1978). Differentiation between social groups: Studies in the
social psychology of intergroup relations: Academic Press.
Trepte, S., & Loy, L.S. (2017). Social identity theory and self-categorization theory. The international Encyclopedia of Media
Effects, 1-13.
Khan, S. F., and Siddiqui, D. A.
188
Triantafillou, P., & Nielsen, M.R. (2001). Policing empowerment: Themaking of capable subjects. History of the Human Sciences,
14(2), 63-86.
Turner, J.C., Hogg, M.A., Oakes, P.J., Reicher, S.D., & Wetherell, M.S.(1987). Rediscovering the social group: A Self-categorization
Theory: Basil Blackwell.
Turner, J.C., & Reynolds, K.J. (2011). Self-categorization theory.Handbook of Theories in Social Psychology, 2(1), 399-417.
Tyler, T.R. (1990). Why people obey the law: Procedural justice.Legitimacy, and Compliance.
Tyler, T.R. (1994). Psychological models of the justice motive:Antecedents of distributive and procedural justice. Journal of
Personality and Social Psychology, 67(5), 850.
Tyler, T.R. (1997). Procedural fairness and compliance with the law. Revue
Suisse D Economie Politique et de Statistique, 133, 219-240.
Tyler, T.R. (2004). Enhancing police legitimacy. The annals of the
American academy of political and social science, 593(1), 84-99.
Tyler, T.R. (2006). Restorative justice and procedural justice: Dealing withrule breaking. Journal of Social issues, 62(2), 307-326.
Tyler, T.R., & Blader, S.L. (2000). Cooperation in groups: Procedural
justice, social identity, and behavioral engagement: PsychologyPress.
Tyler, T.R., & Blader, S.L. (2003). The group engagement model:Procedural justice, social identity, and cooperative behavior.Personality and Social Psychology Review, 7(4), 349-361.
Tyler, T.R., Goff, P.A., & MacCoun, R.J. (2015). The impact ofpsychological science on policing in the united states: Proceduraljustice, legitimacy, and effective law enforcement. Psychological
science in the public interest, 16(3), 75-109.
Tyler, T.R., & Huo, Y. (2002). Trust in the law: Encouraging public
cooperation with the police and courts: Russell Sage Foundation.
Does Procedural Justice Leads Towards The Feelings of Compliance,
and Cooperation with, and Empowerment of Law Enforcement Agencies in Pakistan
189

Tyler, T.R., & Lind, E.A. (1990). Intrinsic versus community-based justicemodels: When does group membership matter? Journal of Social
issues, 46(1), 83-94.
Ullah, F., Hussain, S., Alam, H., & Akhunzada, Z.U. (2016). Factorsinfluencing police image in public (a study of university studentsperception in KPK Pakistan). Pakistan Journal of Criminology,
8(3), 134.
Ullah, F., & Ibrar, M. (2019). Effectiveness of police public servicesmechanism in crime reduction in Khyber Pakhtunkhwa, Pakistan.Pakistan Journal of Criminology, 11(1).
Waddington, P.A., Williams, K., Wright, M., & Newburn, T. (2015).Dissension in public evaluations of the police. Policing and
Society, 25(2), 212-235.
Wang, X. (2013). Empowering the frontline police officers to cope withpolice social service role strain in china. international Journal
of Criminology and Sociology, 3, 20-45.
Westland, J.C. (2010). Lower bounds on sample size in structural equationmodeling. Electronic Commerce Research and Applications,
9(6), 476-487.
Zhao, X., Lynch Jr, J.G., & Chen, Q. (2010). Reconsidering baron andkenny: Myths and truths about mediation analysis. Journal of
Consumer Research, 37(2), 197-206.
Khan, S. F., and Siddiqui, D. A.
190

iMPaCt of DeBt finanCing on firM
PerforManCe: a Case of Business seCtor
of Pakistan
aisha Yusuf* and Dr. abur rehman aleemi**
aBstraCt
it is essentially important to remove the ambiguity as to which
measure of financing in a company’s capital structure proves
as more favorable in improving its performance, or contrarily
if there is no relevance of capital structure choice on the
company’s value creation. For conducting this study, a
leverage ratio of Debt-to-Equity and performance
measurements of Return-on-Assets, Return-on-Equity and
Tobin’s-Q ratio have been used as independent and dependent
variables respectively to check for the impact of debt
financing level on a firm’s performance outcomes. Firm age
and size have been controlled for, in order to improve the
reliability of the results. The sample comprises of 50 business
firms of Pakistan, listed on the stock exchange, divided into
the sectors of service and manufacturing, and the data has
been collected for six years, from 2013 to 2018. Fixed Effects
Regression analysis is used for the balanced panel data,
which yields that debt financing has a significantly positive
impact on firm performance for manufacturing sector
companies, while for the service sector, this impact is
insignificant. Because of the manufacturing sector, the whole
business industry achieves high results on the performance
indicators, and since the debt-to-equity ratio is a notable
contributor to this achievement, debt financing is found to be
beneficial for company’s operating activities. Therefore, this
paper holds major implications for corporate boards to
combine feasible proportions of debt and equity when making
financing decisions, and for shareholders and creditors to
choose whether to make investments in a potential firm.
JEL Classifications: G320, C100, M000
Keywords: Capital structure, Debt financing, Firm performance, Manufacturing sector, Service sector
Journal of Business Strategies, Vol.14, No.1, 2020, pp 191–214 DOi:10.29270/JBS.14.1(20).9
191
__________________________________________________________________________________*Research Assistant, ioBM.
**Assistant Professor, ioBM.

introDuCtion
Background of the study
Considered as an inexpensive financing method, debt financing offersvarious benefits to organizations such as tax saving. However, accordingto some researchers, it might portray a negative picture of the organizationhaving no or less finances of its own and more of others. According toHarris & Raviv (1991), “debt financing is always related to the trade-offbetween costs and benefits, and there is an optimum level of debt beyondwhich the costs may exceed the associated benefits”. Therefore, it iscrucial for an organization to achieve this level in order to make the mostout of its profitability prospects.
The capital structure-performance outcome link for a firm has been a subjectof much popularity among contemporary researchers. Capital structure is thepool of debt and equity proportions a firm maintains, for utilization in variedfirm operations. Modigliani & Miller (1958) theorized that in a perfect capitalmarket, capital structure does not bear any influence over the performance ofa firm. This supposition served a great input in capital structure theories.However, the drawback brought about by this theory pertains to itsunreasonable assumptions, being that costs of transaction and taxes are non-existent, the opportunities for all investors to become debtors or creditors areequal, and the market is informational efficient. With debt as the financingsource, there is lower amount of tax to be paid due to interest payments,therefore fully debt comprising capital structure would be an ideal scenario(Modigliani & Miller, 1963). But markets in the real world are very differentand complex than the above mentioned unreasonable assumptions, and docomprise of imperfections, agency and other costs and information asymmetry(Greenwald, Stiglitz, & Weiss, 1984; Greenwald & Stiglitz, 1993; Jensen &Meckling, 1976; Stiglitz, 1988; Myers & Majluf, 1984).
Various characteristics are associated with each type of finance, suchas time period, ownership and control and source of generation. Scale offirms often defines the type of finance they require to continue operations,and there is a major role of the governing board in choosing theappropriate financing technique. Hence, it needs to be looked into whetherfinancing structure impacts firms’ financial performance in the bestinterests of the stakeholders.
Problem statement
There exists a lot of variation in the capital structure of different
Yusuf, A., and Aleemi, A. R.
192

companies in Pakistan with respect to the composition of Debt and Equity.It is ambiguous as to which form of finance proves beneficial in terms ofeconomic outcomes. Therefore, it is important to know if havingconsiderable debt in the structure improves the performance of a firm, withrespect to specific sectors, so that this mode of financing can be widelyutilized.
scope of the study
The scope of this study lies in serving as key inferences for variousstakeholders of the firm. Managers and executives would be able toimplement the most efficient capital structure ratios with regard to thefirm’s performance outcomes, ease of availability and confidence ofshareholders and debt holders. This confidence itself would build upthrough the better figures on the financial statements of the firm. Lastly,favorable and timely carved out debt policies would lead to minimizationof the risk of financial distress and other faults.
research Questions
In order to determine the role of debt financing, this study will answerthe following research questions:
1. How much impact does the debt mode of financing have on a firm’sperformance ratios, when the age and scale of the varied firms arecontrolled for?
2. How does this impact differ through the service and manufacturingsectors of the industry?
3. Should firms in Pakistan go for debt financing and reap its benefitsto continue or expand their operations?
study Design
Following is the structure this paper is designed in. After the abovepresented Introduction, the next section gives a detailed account of paststudies conducted in the similar area under Literature Review along withthe proposed hypotheses, followed by the methodological model andtechniques. The next section would describe the Results of the techniquesapplied, proceeding with the Discussion as compared to past studies. Thefinal section represents Conclusion to the study proceeded byRecommendations drawn for relevant stakeholders.
literature reVieW
Debt financing
Concerning the financial leverage-profitability relationship for an
impact of Debt Financing on Firm Performance
193

organization, a vast majority of studies conducted have yielded mixedresults. Majumdar & Chhibber (1999), in their study, analyzed thisrelationship using debt ratio as the predictor variable and Return-on-Assetsas the outcome variable proxied for firm performance over a six yearperiod for the Indian companies belonging to different sectors, whichresulted in an inverse association between the two indicators. Similarly,in a study based on Swedish SMEs through five industry sectors, fixedeffects and three stage least squares models were used, which confirmedthat all forms of debt negatively impact the profitability of a firm(Yazdanfar & Ohman, 2015). Muritala (2012) showed in his study that afirm’s performance ratios are negatively influenced by its ratio of debt.This study suggested that for a feasible capital structure, asset tangibilityought to be given due consideration because organizations can savethemselves from financial constraint with more tangible assets. Otherstudies concluding for a negative influence of financial leverage onfinancial performance include the contributions of Goddard, Tavakoli, &Wilson (2005), Salim & Yadav (2012), and Pakistani studies by Sheikh &Wang (2011) and Ahmad, Salman, & Shamsi (2015). Pertaining to a studyon Pakistani cement sector, in which the sample comprised of the stockexchange quoted corporations with seven-year data for the cross-sections,the analysis showed that Debt Financing (gauged through Debt-to-Assetsratio) negatively influences performance of corporations, gauged throughthe Return-on-Assets ratio (Ahmad & Ali, 2016).
As for companies in the U.S, Simerly & Li (2000) analyzed 700 largefirms, the results of which showed that financial leverage can have animpact in positive or negative direction, depending on the overall businessenvironment. On the other hand, Mesquita & Lara (2003) carried out theirstudy on differentiated types of debt in Brazilian service companies andconcluded that the Return-on-Equity ratio of profitability maintainedassociation with short-term debt in positive direction, however theprofitability ratio was inversely related to long-term debt. Nawaz &Ahmad (2017) carried out their study on types of debt analyzing thePakistani petroleum sector, which yielded that both long and short termdebt either associate with firm performance negatively (considering Returnon Assets) or insignificantly (Return on Equity).
Jensen (1986) developed a perspective of free cash flow, according towhich performance of a firm has positive association with firm’s leverage,as managers are increasingly under pressure of making investments in
Yusuf, A., and Aleemi, A. R.
194
positive Net Present Value (NPV) projects, the reason being that they areliable to make payments to the creditors in future. Another effect offinancial leverage is that higher leverage serves as a monitoring and controlmechanism, which is able to reduce the agency problem likely to arisebetween managers and shareholders, as managers would then strive to paythe issued debt before striving for gains of personal interest (Hutten, 2014).
Additionally, varied sectors have been analyzed by authors in Africancountries of Ghana (Abor, 2005), Rwanda (Harelimana, 2017) and Kenya(Karuma, 2018) respectively, all of which resulted in capital structure offirms having positive relationship with their financial performance.Considering the reverse causality pertaining to how firm performanceaffects financial leverage, Shah & Khan (2017) conclude for negativeimpact of profitability, which means that as firms become more profitable,their capital structure tends to lower on debt. In the same study, it wasshown that this capital structure leverage is impacted in a positive directionby factors such as firm size, assets tangibility and the non-debt tax shield.
As regards recent studies are concerned, Aziz & Abbas (2019)conducted their research on the non-financial sector of Pakistan, in whichthey concluded for detrimental impact of debt financing on corporateperformance, irrespective of duration of the debt. The study recommendedfor keeping the level of debt to a minimum proportion and depend on ownfinancing method. Giving an account of emerging economies, consideringnon-financial companies in Vietnam using different measures of debtfinancing, to check for an exhaustive impact of debt on performance, theanalysis through dynamic statistical techniques and employment ofdifferent variables as controls for greater reliability, also resulted innegative effect of debt financing on performance of companies. Similarly,a study on Indian companies in the manufacturing sector took into accountthe debt to equity ratio, agency cost indicators and financial performancevariables, which resulted in debt financing negatively affectingperformance (Pandey, & Sahu, 2019). This leverage in capital structurewas found to positively affect (increase) administrative expenses, whileno effect was shown on the ratio of sales to assets. These are the proxiesused for measuring agency costs, that is, costs incurred by the governingboard in resolving the agency issue between managers and shareholders.In consideration of policy implication, the study recommended forstrengthening and regulating ownership structure instead of debtconcentration.
impact of Debt Financing on Firm Performance
195

firm Performance
According to Neely, Gregory, & Platts (2005), measuring performancerelates to determining the level of effectiveness and efficiency of anactivity. Organizations are entities that set goals for themselves, planaccordingly, allocate resources and then evaluate to what extent thetargeted objectives were achieved. For this reason, measuring anorganization’s performance for the function of controlling is ofindispensable importance (Bititci, Carrie, & McDevitt, 1997). However,the problem arises as to ascertain which performance measure to use foranalysis, out of innumerable existing measures. The two broadestclassifications of these measures are Accounting-based and Market-based,with the former pertaining to short term and past performance, while thelatter category relating to long term and ensuing performance. One of themost appropriate and extensively used accounting-based measures isReturn on Assets (ROA), which depicts the state of utilization of assetsthrough shareholder equity (Klapper & Love, 2002; Haniffa & Hudaib,2006; Ibrahim & AbdulSamad, 2011). Another performance tool underaccounting-based measures deemed exhaustive and used widely byresearchers (e.g. Al Manaseer, Al-Hindawi, Al-Dahiyat, & Sartawi, 2012;Obiyo & Lenee, 2011; Rouf, 2011; Yasser, Entebang & Mansor, 2011;Chamberlain, 2010) is Return on Equity (ROE), which gauges theproportion of a firm’s income as a ratio of shareholder equity. Amongmarket-based measures, Tobin’s Q ratio has been analysed by majority ofresearchers because of its accurate nature (e.g. Shah & Hussain, 2012;Karaca & Ekşi, 2012; Kang & Kim, 2011; Leung & Horwitz, 2010). Thisratio compares a firm’s market value to its book value and depicts a truepicture of the firm’s financial performance in the contemporary market.
In a nutshell, an appropriate performance measure should be such thatrepresents the most accurate and overarching impression, and providesbasis for comparison over various time periods, therefore this study usesa combination of different measurements.
firm size
According to Bain (1951) and Richard, Barnett, Dwyer, & Chadwick(2004), performance of a firm is expected to be positively affected by sizeof the firm, due to the reason that larger firms, in general, have theadvantage of economies of scale over smaller firms and therefore havemore power and reach in the market. However, there are studies thatconclude for a negative relationship between the two variables, theorizing
Yusuf, A., and Aleemi, A. R.
196
that larger-scale firms are usually controlled by managers who are self-oriented rather than firm oriented, and who are likely to meet the goal ofutility maximization primarily, before working after profit / valuemaximization (Pervan & Višić, 2012). Another argument in the context ofnegative association between firm size and firm performance is that thereexists corporate bureaucracy in large-sized firms. This has the tendencyto bring the competence level of a firm to a downward sloping curvepertaining to changes in the external business environment and reactingto those changes promptly.
firm age
According to the review of a vast literature, no consensus has beenestablished as to the impact of a firm’s age on its performance. Firms thatare older are more experienced, and therefore, undoubtedly it is expectedthat they would have higher earnings as compared to the firms that areyounger, as they are yet in the starting and / or growing phase of thebusiness cycle. However, just like large-sized firms, old aged firms arealso on the verge of corporate bureaucracy, more prone to becoming slack,and reaching towards the ending phase of the business cycle (Smith,Smith, & Verner, 2006).
lagged Performance Variables
Another control measure used in the study is the lagged value ofperformance variables, since the debt financing-corporate financialperformance relationship is deemed as having a dynamic nature, ratherthan fixed or static. This argument is supported by many research studies,stating the variation in the current performance of a firm may significantlybe explained/determined by its past performance (e.g. Shah & Khan,2017).
theoretical Basis
This theory is most closely connected to the Trade-off theory.According to this theory, when a firm needs to choose between the capitalstructure components of equity and debt, it makes a comparison of costsattached to and prospective benefits of each type of financing. An exampleof costs related to debt-comprising structure is financial distress, whileone of the benefits it brings is the tax advantage at total or marginal level.
Another theory, called as the Pecking Order Theory by Donaldson(1961) forms the basis of this study. This theory is deeply rooted indecisions related to financial structure of firms, and was modified in later
impact of Debt Financing on Firm Performance
197

years by Myers & Majluf (1984). It states that a company’s priority is toutilize internal funds for financing purposes. Once they are depleted, thecompany issues debt, and when any more debt issuance becomes nonfeasible, it goes for equity financing. External ownership is brought intothe company as the last resort, and this prioritization is done based on theidea of least effort, or least aversion.
When a firm’s value increases due to issuance of new equity, managersare presumed to exploit this rise in valuation to their own advantage, whilethe investors seek overall advantage for the firm with which return oninvestments would be optimal and future prospects would increase.Pertaining to this idea, Jensen & Meckling (1976) gave the AgencyTheory, which states that there is conflict of interest between principal(owners/investors) and agent (managers). These differing motives can bealigned by the corporate board, usually by offering incentives to themanagers called as agency costs (Hill & Jones, 1992). In order to identifyif an agency issue exists, corporations usually perform a litmus test, thatis comparing their Return on Assets with Return on Equity. MaximizingROA is the goal of firm’s management, while maximizing ROE is the goalof shareholders. If both of them appear to be in opposing directions, thereis possibility of an agency issue. However, altering the capital structurethrough creation of debt can act as a remedial measure, as suggested byrecent research, because this scenario would result in more liabilitiestowards creditors, and additional earnings would be paid out to them onpriority basis, before managers invest them in self profitable projects.
Hypotheses
H1: “Return-on-Assets ratio does not bear influence from the Debt-to-
Equity ratio of a firm”
H2: “Return-on-Equity ratio does not bear influence from the Debt-to-
Equity ratio of a firm”
H3: “Tobin-Q ratio does not bear influence from the Debt-to-Equity ratio
of a firm”
H4: “Return-on-Assets ratio does not bear influence from the Debt-to-
Equity ratio of a Manufacturing sector business firm”
H5: “Return-on-Equity ratio does not bear influence from the Debt-to-
Equity ratio of a Manufacturing sector business firm”
H6: “Tobin-Q ratio does not bear influence from the Debt-to-Equity ratio
of a Manufacturing sector business firm”
H7: “Return-on-Assets ratio does not bear influence from the Debt-to-
Yusuf, A., and Aleemi, A. R.
198

Equity ratio of a Service sector business firm”
H8: “Return-on-Equity ratio does not bear influence from the Debt-to-
Equity ratio of a Service sector business firm”
H9: “Tobin-Q ratio does not bear influence from the Debt-to-Equity ratio
of a Service sector business firm”
ConCePtual MoDel
The conceptual model developed for the study is as follows:
Figure 1. Conceptual Model
MetHoDologY
sample and Data
This study is focused on a broad range of organizations across Pakistan.The sample comprises of companies listed on the stock exchange, due tothe availability of vast data on financial analysis of these publiccompanies. A large number of researchers (e.g. Marinova, Plantenga, &Remery, 2015) use similar scope in their studies. Companies in the dataset belong to the sectors of service industry and Manufacturing
industry. All these companies are members of the Pakistan BusinessCouncil (PBC), which is the largest representative body of businesscompanies in Pakistan. The data for the independent, dependent andcontrol variables has been obtained from the financial statements and
impact of Debt Financing on Firm Performance
199

annual reports of these companies. The data is a balanced panel, whichincludes values for 50 firms through six years, that is 2013 to 2018.Pertaining to the included cross-sections, time periods and variables, thetotal number of observations included is 1,800.
study Variables
Table 1: Variable Description
statistical techniques
For the statistical analysis of our Balanced Panel Data, Fixed EffectsRegression is used. With the Hausman test of specification, we reject thenull hypothesis that a random effects regression is consistent, as theprobability value obtained is 0.00. Hence the model of fixed effects isregarded as suitable.
One argument is that the performance of a firm determines the level ofdebt financing, as it attracts better and more creditors. Therefore, as aremedial measure to eliminate the reverse causality, one year lagged valuesof the dependent variables are used.
Following are the regression models run for the data:
For the total sample
ROA = α + β1DE_Ratio + β2FirmSize + β3FirmAge + β4ROA1 + β5Indus + ei,t + ui + ut (1)
ROE = α + β1DE_Ratio + β2FirmSize + β3FirmAge + β4ROE1+ β5Indus + ei,t + ui + ut (2)
TOBINQ = α + β1DE_Ratio + β2FirmSize + β3FirmAge + β4TOBINQ1 + β5Indus+ ei,t + ui + ut (3)
Description
independent
Variable
Debt to EquityRation
The financial ration indicating the relative proportion ofshareholders’ equity and debt used to finance acompany’s assets, calculated as Total Liabilities of acompany divided by its Shareholder Equity.
Dependent
Variables
Return on Assets Net Income divided by Total Assets at the end of the year
Return onEquity
Profit After Tax divided by Total Equity shares in issueat year end
Tobin’s Q Market Capitalization plus Total Debt divided by TotalAssets of the Company
Control
Variables
Firm Size Natural logarithm of Total Assets of the company
Firm Age Number of years since the company was incorporated
Tobin’s Q-1 One-year lagged value of Tobin’s Q
ROA-1 One-year lagged value of ROA
ROE-1 One-year lagged value of ROE
Yusuf, A., and Aleemi, A. R.
200

For each industry sector
ROA = α + β1DE_Ratio + β2FirmSize + β3FirmAge + β4ROA1 + ei,t + ui + ut (4)
ROE = α + β1DE_Ratio + β2FirmSize + β3FirmAge + β4ROE1 + ei,t + ui + ut (5)
TOBINQ = α + β1DE_Ratio + β2FirmSize + β3FirmAge + β4TOBINQ1 + ei,t + ui + ut (6)
results anD DisCussion
Table 2: Descriptive Statistics for the Total Sample
According to the descriptives in Table 2, the mean value of Return onAssets for the 50 companies for six years is 0.087 (8.7 per cent), whichshows that the performance of the companies in the sample has been high,as ROAs above 5 per cent are generally considered good. Similarly, themean Return on Equity amounts to 0.24 (24 per cent), with ROEs of 15-20 per cent being generally considered good. However standard deviationof 0.532 for ROE means that the values in the data set are farther awayfrom the mean, on average. There is large amount of variation in thecompany figures for this variable. Tobin’s Q mean value is 2.662, whichdepicts success of the overall industry, because the value is greater thanone, and this shows that the market value of a company is higher than thebook value of its assets.
With the whole business sector singularly taken into account, thecapital structure leverage in terms of debt to equity ratio is 4.045 per centon average. The mean age that the companies can be characterized with is48 years and according to firm size mean, they can be classified as largebusinesses.
Descriptive statistics
Variable n Mean sD Median Min Max
Dependent
ROA 300 0.087 0.096 0.059 -0.08 0.679
ROE 300 0.24 0.532 0.169 -0.496 7.47
Tobin-Q 300 2.662 3.241 1.378 0.576 25.42
independent
SE_Ratio 300 4.045 5.57 1.324 0.05 28.24
Controls
Firm Size 300 10.579 0.749 10.40 9.12 12.45
Firm Age 300 48.16 29.88 46.00 1.00 155
Industry 300 0.62 0.486 1.00 0.00 1.00
impact of Debt Financing on Firm Performance
201

Table 3: Descriptive Statistics for Service Sector
The sub-sample of service firms comprises of 19 cross-sections. Thetwo measures of firm performance depict low mean values (ROA equalsto 3.3 per cent and ROE equals to 14.6 per cent), while Tobin’s Q indicateslong-term success of the sector (Value of ratio is greater than one, that is,1.139). The firms are 53.5 years old on average and have a large size ofbusiness scale (identified using antilog of 11.16). The debt to equity ratio,on average, equals to 8.18 per cent.
Table 4: Descriptive Statistics for Manufacturing Sector
The sub-sample of manufacturing firms comprises of 31 cross-sections.All the three measures of firm performance depict high mean valuesindicating success of the sector (ROA equals to 12 per cent, ROE equals to29 per cent and Tobin’s Q ratio is 3.59). The firms are almost 45 years oldon average and own assets worth more than 16 billion rupees (calculatedusing antilog of 10.2), signifying large size of the business scale.
Descriptive statistics
Variable n Mean sD Median Min Max
Dependent
ROA 114 0.033 0.037 0.018 -0.058 0.1427
ROE 114 0.146 0.102 0.142 -0.218 0.492
Tobin-Q 114 1.139 0.229 1.05 0.645 1.86
independent
SE_Ratio 114 8.186 6.876 6.86 0.41 28.24
Controls
Firm Size 114 11.16 0.768 11.31 9.57 12.45
Firm Age 114 53.5 36.92 55.5 7.00 155
Descriptive statistics
Variable n Mean sD Median Min Max
Dependent
ROA 186 0.12 0.106 0.101 -0.08 0.679
ROE 186 0.29 0.665 0.186 -0.496 7.47
Tobin-Q 186 3.59 3.827 2.178 0.576 25.42
independent
SE_Ratio 186 1.507 2.059 0.795 0.05 16.03
Controls
Firm Size 186 10.219 0.449 10.259 9.12 11.07
Firm Age 186 44.88 24.13 45.00 1.00 124
Yusuf, A., and Aleemi, A. R.
202

Table 5: Correlation Analysis for the Total Sample
Correlations analysis was carried out for the total sample in order tocheck for the degree of association among the variables of concern.
Firstly, the predictor variable, Debt-to-Equity ratio, resulted in negativemoderate relationship with Return-on-Assets and negative weakrelationship with Q ratio, however it was not found to be significantlyrelated with Return-on-Equity.
As regards the control variables, Return-on-Assets and Q ratio maintainnegative moderate association with size of the firm, while significantrelationship resulted neither between ROA and firm’s age nor Q ratio andfirm’s age. Similarly, the ratio of Return-on-Equity has negative but weakassociation with size of the firm, while ROE and age of the firm have norelationship with each other.
Firm age and size are significantly related to the D/E Ratio, with agehaving a weak negative correlation and size having very strong positivecorrelation value, which implies that as the firms get older, they makelesser use of debt financing, however, with increase in the firm’s scale,more debt ratio is preferred. Age and size have significant positiverelationship with each other, which indicates that the larger firms are alsothe older ones.
Correlations
ROA ROE Tobin-Q DE_Ratio Firm Size Firm Age Industry
ROA 1
Prob. ——-
ROE 0.483 1
Prob. 0.00 ——-
Tobin-Q 0.571 0.568 1
Prob. 0.00 0.00 ——-
DE_Ratio -0.378 0.076 -0.166 1
Prob. 0.00 0.184 0.0039 ——-
Firm Size -0.345 -0.1 -0.291 0.706 1
Prob. 0.00 0.082 0.00 0.00 ——-
Firm Age 0.086 0.04 0.054 -0.128 0.173 1
Prob. 0.135 0.489 0.349 0.026 0.0025 ——-
Industry 0.437 0.138 0.368 -0.582 -0.615 -0.14 1
Prob. 0.00 0.016 0.00 0.00 0.00 0.0152 ——-
impact of Debt Financing on Firm Performance
203
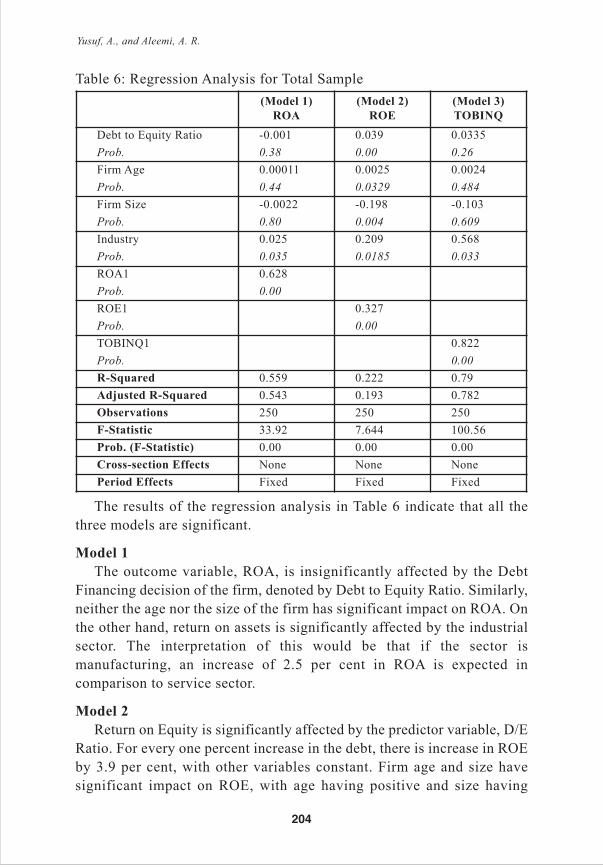
Table 6: Regression Analysis for Total Sample
The results of the regression analysis in Table 6 indicate that all thethree models are significant.
Model 1
The outcome variable, ROA, is insignificantly affected by the DebtFinancing decision of the firm, denoted by Debt to Equity Ratio. Similarly,neither the age nor the size of the firm has significant impact on ROA. Onthe other hand, return on assets is significantly affected by the industrialsector. The interpretation of this would be that if the sector ismanufacturing, an increase of 2.5 per cent in ROA is expected incomparison to service sector.
Model 2
Return on Equity is significantly affected by the predictor variable, D/ERatio. For every one percent increase in the debt, there is increase in ROEby 3.9 per cent, with other variables constant. Firm age and size havesignificant impact on ROE, with age having positive and size having
(Model 1)
roa
(Model 2)
roe
(Model 3)
toBinQ
Debt to Equity Ratio -0.001 0.039 0.0335
Prob. 0.38 0.00 0.26
Firm Age 0.00011 0.0025 0.0024
Prob. 0.44 0.0329 0.484
Firm Size -0.0022 -0.198 -0.103
Prob. 0.80 0.004 0.609
Industry 0.025 0.209 0.568
Prob. 0.035 0.0185 0.033
ROA1 0.628
Prob. 0.00
ROE1 0.327
Prob. 0.00
TOBINQ1 0.822
Prob. 0.00
r-squared 0.559 0.222 0.79
adjusted r-squared 0.543 0.193 0.782
observations 250 250 250
f-statistic 33.92 7.644 100.56
Prob. (f-statistic) 0.00 0.00 0.00
Cross-section effects None None None
Period effects Fixed Fixed Fixed
Yusuf, A., and Aleemi, A. R.
204

negative impact. For one year increase in the firm’s age, ROE tends toincrease by 0.25 per cent, and the increase in firm size by one unit valueof assets leads to 19.8 per cent decrease in ROE. Industrial affiliation alsohas significant impact on ROE, which means that if the sector ismanufacturing, an increase of 20.9 per cent in ROE is expected incomparison to service sector.
Model 3
As for the firm performance variable of Tobin’s Q, D/E Ratio holdsinsignificant impact. The age and size of the firm also hold insignificanteffect on Tobin’s Q ratio, while the ratio is significantly and positivelyaffected by industrial sector, and signifies that there would be increase inthe Q ratio by ratio of 0.568 if the affiliation of the firm is with themanufacturing sector as opposed to the service industrial sector.
Table 7: Regression Analysis for the sub-sample of Service Sector
For the Service Sector Regression Analysis, Table 7 indicates that allthe three models are significant. The predictors in Model 1 explain 59.5
(Model 1)
roa
(Model 2)
roe
(Model 3)
toBinQ
Debt to Equity Ratio -0.0013 0.039 0.0335
Prob. 0.063 0.00 0.26
Firm Age -0.000027 0.0025 0.0024
Prob. 0.75 0.0329 0.484
Firm Size 0.0005 -0.198 -0.103
Prob. 0.92 0.004 0.609
ROA1 0.633
Prob. 0.00
ROE1 0.66
Prob. 0.00
TOBINQ1 0.82
Prob. 0.00
r-squared 0.629 0.518 0.703
adjusted r-squared 0.594 0.474 0.675
observations 95 95 95
f-statistic 18.25 11.58 25.5
Prob. (f-statistic) 0.000 0.000 0.000
Cross-section effects None None None
Period effects Fixed Fixed Fixed
impact of Debt Financing on Firm Performance
205

per cent of variation in return on assets, while 47.4 per cent of variationin return on equity is explained by the predictors in Model 2. Theexplanatory power of Model 3 is 67.5 per cent.
Model 1 shows that ROA for service firms is significantly affected bythe Debt to Equity Ratio of the firms. The impact is negative, whichindicates that with one percent increase in D/E Ratio, ROA decreases by0.13 per cent, keeping other variables constant. On the contrary, neitherthe age nor the size of the firm has significant impact on ROA. Model 2outcome variable, Return on Equity, is insignificantly affected by thepredictor variable, D/E Ratio. Similarly, there is no change in ROE of aservice firm as an impact of its age or size. For the performance variableof Tobin’s Q (Model 3), all the independent and control variables holdinsignificant impact.
Table 8: Regression Analysis for the sub-sample of Manufacturing Sector
Regression Analysis of the Manufacturing Sector sample, Table 8, indicatesthat all models for the three respective dependent variables are significant. The
(Model 1)
roa
(Model 2)
roe
(Model 3)
toBinQ
Debt to Equity Ratio -0.0013 0.187 0.172
Prob. 0.66 0.00 0.0165
Firm Age 0.0002 0.0051 0.0051
Prob. 0.316 0.007 0.417
Firm Size -0.0011 -0.145 0.086
Prob. 0.93 0.147 0.799
ROA1 0.62
Prob. 0.00
ROE1 0.199
Prob. 0.003
TOBINQ1 0.812
Prob. 0.00
r-squared 0.449 0.445 0.766
adjusted r-squared 0.419 0.415 0.753
observations 155 155 155
f-statistic 14.90 14.90 59.79
Prob. (f-statistic) 0.000 0.000 0.000
Cross-section effects None None None
Period effects Fixed Fixed Fixed
Yusuf, A., and Aleemi, A. R.
206

predictors in Model 1 explain 41.9 per cent of variation in return on assets,while the predictors in Model 2 explain 41.5 per cent of variation in return onequity. As for Model 3, 75.3 per cent of variation in Tobin’s q ratio is explainedby the predictors, which indicates a very high explanatory power of the model.
The first model shows that ROA for firms in the manufacturing sector isinsignificantly affected by the Debt-to-Equity Ratio, age and size of the firms.Return on Equity, from Model 2, however, bears positive impact by thepredictor variable, D/E Ratio, with every one percent increase in the Debt Ratiocausing 18.7 per cent increase in ROE. The age of the firm also positivelyinfluences ROE. When the manufacturing firm grows old by one year, ROEtends to increase by 0.51 per cent. There is no change in ROE of the firm as animpact of its size. Considering the ratio of Tobin’s Q (Model 3), D/E Ratioholds significant impact, and for every one percent increase in the DebtFinancing ratio, Tobin’s Q increases by ratio of 0.172. Contrarily, neither theage nor the size of the manufacturing firm significantly influences Tobin’s Q.
On the basis of above results, Hypothesis 1, 3, 4, 8 and 9 are retained, whileHypothesis 2, 5, 6 and 7 stand rejected because the impact is significant.
DisCussion
The analysis for our study shows that Debt financing bears its influenceon performance of business firms, but only partially. While this influenceis significant on the Return on Equity ratio, the other two performanceindicators hold no significant impact from the ratio of Debt to Equity. ROEof Pakistani business firms in general improves as financial leverageincreases, which is in accordance to the findings of a Brazilian study byMesquita & Lara (2003), in which short term debt was found to positivelyimpact ROE. This result, however, is in contrast to the study of Nawaz &Ahmad (2017), which accounted for insignificant impact of debt on ROE.The second analysis in our study was carried out on the sub-sample ofPakistani service sector business firms. Under this step, debt financingresulted in negative influence on Return on Assets ratio, while the otherperformance ratios remained insignificant. Our study confirms the findingsof Majumdar & Chhibber (1999), Nawaz & Ahmad (2017) and Muritala(2012), where debt proportion is negatively associated with ROA ratio. Asthird step of the analysis, the manufacturing sector of business firms wastaken into account, where the most impact of debt ratio was evident. Here,the two ratios, Tobin’s Q (market based measurement) and ROE (accountingbased measurement) both were found to be positively affected by debt
impact of Debt Financing on Firm Performance
207

financing. Very less number of studies in the literature have resulted in sucha positive association, so our findings point towards a different direction. Forinstance, the studies of Abor (2005), Harelimana (2017), and Karuma (2018)show this uniformly directed association, while the latest studies on emergingcountries show otherwise (e.g. Aziz & Abbas, 2019; Pandey & Sahu, 2019).
In a way, it can be said that agency issue does not seem to exist in oursampled companies. The reason behind this deduction is the comparisonof firms’ Return on Assets with their Return on Equity ratios. Both theperformance indicators flow in the same direction, whether increasing ordecreasing, for majority of the firms over the six-year period. Thisdisproves the litmus test of identifying conflict of motive between theprincipal (maximizing ROE) and the agent (maximizing ROA).
Regarding the control variables employed in all of our models, neithersize of the firm nor the age held any significance in altering itsperformance. The reason behind this result could be that the firms in oursample were all majorly large sized with respect to total assets, also therewas not much variation in years since the companies were incorporated andthey were more or less of similar ages. Irrespective of the cause of thisinsignificance, our results are in contrast to the findings of Richard, Barnett,Dwyer, & Chadwick (2004), Pervan & Višić (2012), and Smith, Smith, &Verner (2006). Richard et al. (2004) explain for a positive associationbetween firm size and performance, while Pervan & Višić (2012)’s studyconcluded for a significant but differing direction in this regard. The studyby Smith et al. (2006) shows negative impact of a firm’s age on itsperformance due to varied reasons of bureaucracy, slackness, maturity, etc.
ConClusion
This study is based on the impact of capital structure of firms with regard tothe level of financing through debt, on their financial performance. Debtfinancing holds both its costs and benefits, majorly in terms of financial distressand tax saving respectively. Modigliani and Miller’s (1958) capital structureirrelevancy paper has led to much attention of researchers towards the marketvalue of a firm as affected by its capital structure choice in real world scenario.The goal of the firms is to maximize shareholder wealth and obtain high prestigein the market, in order to attract investors and creditors by building confidencein them. Therefore, it is of utmost importance to look at how financing decisionsof a firm affect its performance indicators, so that maximum profitability canbe achieved through an optimal capital structure.
Yusuf, A., and Aleemi, A. R.
208

The sample taken into account for conducting the study is comprised ofbalanced panel data, with 50 cross sections that are Pakistani firms in thebusiness industry, further divided into the service and manufacturing sectors,and 6 annual periods that are from year 2013 to 2018. Performance of thefirms is gauged through the variables of Return on Assets, Return on Equityand Tobin’s Q ratio (dependent variables), while Debt to Equity ratio(independent variable) is used as proxy for debt financing. Control variablesof firm age, firm size in terms of net assets criterion, and one-year laggedvalues of the dependent variables are also used to eliminate probableinfluences from these sources on the predictor-outcome variable impact. Foranalysis of the data, fixed period effects regression is used, and separatemodels are developed for each of the three firm performance indicators, underthe total industry sample and two sub-samples of different sectors respectively.
The analysis shows that the Debt to Equity ratio has significant positiveimpact on ROE, but not ROA or Tobin’s Q with regard to the businessindustry as a whole. As for the service sector, D/E Ratio has significantnegative impact on ROA, but insignificant impact on the other twovariables. Lastly, ROE and Tobin’s Q ratio are significantly and positivelyaffected by D/E Ratio of a firm in the manufacturing sector, however ROAbears no significant effect from the debt financing ratio. All in all, themanufacturing sector is more successful in terms of firm performance andcontributes a substantial success factor to the whole business industry ofPakistan, and since the values for its performance ratios are reasonablyaffected by the level of debt it holds in the capital structure, debt financingis deemed to be beneficial for the company in value creation.
reCoMMenDations
The recommendations drawn from the results of this paper are majorlyfor corporate boards of firms. Firstly, increment in the level of debt incapital structure would serve as an alternative to agency costs, called as“protective covenants”. Because creditors would be the recipients of extraearnings by firms, managers would not be able to exploit finances.Secondly, having a greater debt to equity proportion would result in taxsaving for firms due to additional expense of paying interest to creditors,therefore firms should take maximum advantage of this facility. As regardsPakistan, the facility of obtaining debt financing is very cheap andcommonly available nowadays and is extended by various governmentaland private organizations on easy terms.
impact of Debt Financing on Firm Performance
209

referenCes
Abor, J. (2005). The effect of capital structure on profitability: anempirical analysis of listed firms in Ghana. The Journal of Risk
Finance, 6(5), 438-445.
Ahmad, N., & Ali, M. (2016). Impact of Capital Structure on Firm’sFinancial Performance: Cement Industry of Pakistan. European
Journal of Business and Management, 8(4), 115-119.
Ahmad, N., Salman, A., & Shamsi, A. (2015). Impact of financial leverage onfirms’ profitability: An investigation from cement sector ofPakistan. Research Journal of Finance and Accounting, 6(7), 75-80.
Ahmed Sheikh, N., & Wang, Z. (2011). Determinants of capital structure:An empirical study of firms in manufacturing industry ofPakistan. Managerial Finance, 37(2), 117-133.
Al Manaseer, M. F. A., Al-Hindawi, R. M., Al-Dahiyat, M. A., & Sartawi, I. I.(2012). The impact of corporate governance on the performance ofJordanian banks. European Journal of Scientific Research, 67(3), 349–359. Retrieved from http://www.europeanjournalofscientificresearch.com
Aziz, S., & Abbas, U. (2019). Effect of Debt Financing on FirmPerformance: A Study on Non-Financial Sector of Pakistan. Open
Journal of Economics and Commerce, 2(1), 8-15.
Bain, J. S. (1951). Relation of profit rate to industry concentration:American manufacturing, 1936–1940. The Quarterly Journal of
Economics, 65(3), 293-324.
Bititci, U., Carrie, A., & McDevitt, L. (1997). Integrated performancemeasurement systems: A development guide. international
Journal of Operations & Production Management, 17(5), 522–534. https://doi.org/10.1108/01443579710167230
Chamberlain, T. W. (2010). Board composition and firm performance:Some Canadian evidence. international advances in economic
research, 16(4), 421-422. https://doi.org/10.1007/s11294-010-9271-2
de Mesquita, J. M. C., & Lara, J. E. (2003). Capital structure andprofitability: the Brazilian case.
Yusuf, A., and Aleemi, A. R.
210

Donaldson, G. (1961). Corporate Debt Capacity, Harvard UniversityPress, Cambridge, MA.
Goddard, J., Tavakoli, M., & Wilson, J. O. (2005). Determinants ofprofitability in European manufacturing and services: evidencefrom a dynamic panel model. Applied Financial Economics,15(18), 1269-1282.
Greenwald, B. C., & Stiglitz, J. E. (1993). Financial market imperfectionsand business cycles. The Quarterly Journal of Economics,108(1), 77-114.
Greenwald, B. C., Stiglitz, J. E., & Weiss, A. (1984). Informationalimperfections in the capital market and macro-economicfluctuations.
Haniffa, R., & Hudaib, M. (2006). Corporate governance structure andperformance of Malaysian listed companies. Journal of Business
Finance and Accounting, 33(7-8), 1034-1062. https://doi.org/10.1111/j.1468-5957.2006.00594.x
Harelimana, J. B. (2017). Effect of Debt Financing on BusinessPerformance: A Comparative Study between I&M Bank AndBank of Kigali, Rwanda. Global Journal of Management and
Business Research.
Harris, M., & Raviv, A. (1991). The theory of capital structure. The
Journal of Finance, 46(1), 297-355.
Hill, C. W., & Jones, T. M. (1992). Stakeholder-agency theory. Journal of
Management Studies, 29 (2), 131-154. https://doi.org/10.1111/j.1467-6486.1992.tb00657.x
Hutten, E. (2014). The influence of leverage on firm performance: a
corporate governance perspective (Bachelor’s thesis). Universityof Twente.
Ibrahim, Haslindar, & AbdulSamad, F. A. (2011). Corporate governancemechanisms and performance of public-listed family-ownershipin Malaysia. international Journal of Economics and Finance,3(1), 105–115. DOI: 10.5539/ijef.v3n1p105
impact of Debt Financing on Firm Performance
211

Jensen, M. C. (1986). Agency costs of free cash flow, corporate finance,and takeovers. The American Economic Review, 76(2), 323-329.
Jensen, M. C., & Meckling, W. H. (1976). Theory of the firm: Managerialbehavior, agency costs and ownership structure. Journal of
Financial Economics, 3(4), 305-360. https://doi.org/10.1016/0304-405X(76)90026-X
Kang, S. A., & Kim, Y. S. (2011). Does earnings management amplify theassociation between corporate governance and firmperformance? Evidence from Korea. international Business &
Economics Research Journal, 10(2), 53-66. https://doi.org/10.19030/iber.v10i2.1793
Karaca, S. S., & Ekşi, İ. H. (2012). The relationship between ownershipstructure and firm performance: An empirical analysis overİstanbul Stock Exchange (ISE) Listed Companies. international
Business Research, 5(1), 172–181. DOI: 10.5539/ibr.v5n1p172
Karuma, M. N. (2018). Effect of Debt Financing on Financial Performanceof Manufacturing Firms in Nairobi Securities Exchange.Strategic Journal of Business & Change Management, 5(2).
Klapper, L., & Love. I. (2002). Corporate governance, investor protection,and performance in emerging markets. Washington, DC. UnitedStates: World Bank. Mimeographed document.
Leung, S., & Horwitz, B. (2010). Corporate governance and firm valueduring a financial crisis. Review of Quantitative Finance and
Accounting, 34(4), 459-481. https://doi.org/10.1007/s11156-009-0141-z
Majumdar, S. K., & Chhibber, P. (1999). Capital structure andperformance: Evidence from a transition economy on an aspectof corporate governance. Public Choice, 98(3-4), 287-305.
Modigliani, F., & Miller, M. H. (1958). The cost of capital, corporationfinance and the theory of investment. The American Economic
Review, 48(3), 261-297.
Modigliani, F., & Miller, M. H. (1963). Corporate income taxes and the cost ofcapital: a correction. The American Economic Review, 53(3), 433-443.
Yusuf, A., and Aleemi, A. R.
212

Muritala, T. A. (2012). An empirical analysis of capital structure on firms’performance in Nigeria. international Journal of Advances in
Management and Economics, 1(5), 116-124.
Myers, S. C., & Majluf, N. S. (1984). Corporate financing and investmentdecisions when firms have information that investors do nothave. Journal of Financial Economics, 13(2), 187-221.
Nawaz, K., & Ahmad, N. (2017). The effect of corporate governance andcapital structure on firms’ performance: Investigation onpetroleum sector in Pakistan. Journal of independent Studies and
Research, 15(1), 51-68.
Neely, A., Gregory, M., & Platts, K. (2005). Performance measurementsystem design: A literature review and research agenda.international Journal of Operations & Production Management,
25(12), 1228–1263. https://doi.org/10.1108/01443570510633639
Obiyo, O. C., & Lenee, L. T. (2011). Corporate governance and firmperformance in Nigeria. iJEMR, 1(4), 1–12. Retrieved fromhttp://ijemr.in/
Pandey, K. D., & Sahu, T. N. (2019). Debt financing, agency cost and firmperformance: Evidence from India. Vision, 23(3), 267-274.
Pervan, M., & Višić, J. (2012). Influence of firm size on its businesssuccess. Croatian Operational Research Review, 3(1), 213-223.
Richard, O. C., Barnett, T., Dwyer, S., & Chadwick, K. (2004). Culturaldiversity in management, firm performance, and the moderatingrole of entrepreneurial orientation dimensions. Academy of
Management Journal, 47(2), 255-266.
Rouf, M. A. (2011). The relationship between corporate governance andvalue of the firm in developing countries: Evidence fromBangladesh. The international Journal of Applied Economics and
Finance, 5(3), 237–244. DOI: 10.3923/ijaef.2011.237.244
Salim, M., & Yadav, R. (2012). Capital structure and firm performance:Evidence from Malaysian listed companies. Procedia-Social and
Behavioral Sciences, 65, 156-166.
impact of Debt Financing on Firm Performance
213

Shah, M. H., & Khan, A. (2017). Factors determining capital structure ofPakistani non-financial firms. international Journal of Business
Studies Review, 2(1), 46-59.
Shah, S. Z. A., & Hussain, Z. (2012). Impact of ownership structure onfirm performance evidence from non-financial listed companiesat Karachi Stock Exchange. international Research Journal of
Finance and Economics, 84, 6-13.
Simerly, R. L., & Li, M. (2000). Environmental dynamism, capitalstructure and performance: a theoretical integration and anempirical test. Strategic Management Journal, 21(1), 31-49.
Smith, N., Smith, V., & Verner, M. (2006). Do women in top managementaffect firm performance? A panel study of 2,500 Danishfirms. international Journal of productivity and Performance
management, 55(7), 569-593.
Stiglitz, J. E. (1988). Why financial structure matters. Journal of Economic
Perspectives, 2(4), 121-126.
Yasser, Q. R., Entebang, H., & Mansor, S. A. (2011). Corporategovernance and firm performance in Pakistan: The case ofKarachi Stock Exchange (KSE) -30. Journal of Economic and
international Finance, 3(8), 482–491. http://dx.doi.org/10.2139/ssrn.2551636
Yazdanfar, D., & Öhman, P. (2015). Debt financing and firm performance:an empirical study based on Swedish data. The Journal of Risk
Finance, 16(1), 102-118.
Yusuf, A., and Aleemi, A. R.
214

215
Journal of Business strategies
about the Journal
Journal of Business Strategies (JBS) is an international peer-reviewed,
academic research journal published by the Faculty of Management Sciences,
Greenwich University Karachi. JBS is published bi-annually in December and
June every year. The journal publishes academic research articles concerning
business needs, trends and future perspectives. JBS disseminates innovative
research comprising of vast array of fields and sub-fields related to business
studies so that the academia and industry can benefit from the emerging
opportunities stimulated by technological, societal and global change. Researchers
from diversified subject areas related to business studies, including but not limited
to, Business Marketing, Management, Finance, Accounting, Economics,
Corporate Governance & Management, Econometrics, Branding and Advertising,
Micro & Macro Economic issues and other related disciplines are invited to
publish their contributions.
scope & Mission
Journal of Business Strategies (JBS) heralds the research discourse among academic
researchers, business executives and other intellects about advances in Business
Management practices, specifically those stimulated by Information Technology and
Innovation, which intend to transform the societal and economic structure. JBS provides
an academic platform for business professionals and research scholars to contribute
their original, unpublished and novel researches in the diverse business fields.
Plagiarism Policy
Journal of Business Strategies (JBS) has no tolerance policy against plagiarism.
All submitted manuscripts are scanned for similarity Index (SI) through the
plagiarism detection software. If the similarity index of the text is more than the
acceptable threshold i.e. 18% (including references, bibliography), the paper is
rejected or returned back to the authors for modification. Please refer to the Ethical
Guidelines for authors for the journal for further details regarding plagiarism.
author guidelines
JBS accepts and prefers manuscript on the following basic criteria:
• Novelty
• Innovativeness
• Originality
• Robust/Advanced Methodology
Before submission:
• Before Submission of an article, author(s) should carefully read the Publication
Ethics, Open Access policy and Plagiarism Policy of the Journal.
• When received, manuscripts are first evaluated in terms of quality and fit with
the Statement of Editorial Policy.
• Author(s) should ensure that the work is original, has not been published
previously and it is not under consideration for publication elsewhere.
• Articles must report new theoretical and/or empirical results that have not been
published previously. If the manuscripts employ data that are expressed in another
manuscript, Editor must be informed of this at the time of the submission.
• Article must not have been previously submitted to JBS for review. If the
manuscript, or an earlier version of it, was previously rejected by JBS, this
information must be clearly communicated by the corresponding author to the
Editor at the time of submission.
• The only exception to the “previous publication” rule is a paper included in a
conference proceeding, where the paper is work in progress toward the
manuscript submitted to JBS. In this case, the Author must inform the Editor
about the conference details, and the title of the conference proceedings
publication. JBS will have the copyright to all published articles.
• Publication must be approved by all author(s) of the paper through undertaking
216

(available on the Journal’s website).
• Author(s) should carefully list and order their names on the first page of the
article. JBS allows maximum three (03) authors/co-authors for each
manuscript. An author’s name will not be added or deleted after submission.
• Articles should be in English but JBS welcomes manuscripts from authors whose
first language is not English. Manuscripts must be formatted according to the JBS
format. Authors of poorly worded manuscripts are advised to seek professional
editing assistance prior to submission otherwise the paper may be desk rejected.
• Manuscripts will not be accepted after the closing date mentioned in the ‘Call
for Papers’ for each edition.
• Author(s) should communicate the Editor/Editorial through emails only,
regarding paper publication status and related matters.
• The review process may take from eight weeks to twenty four months
depending upon response from the reviewers and compliance from authors.
After satisfactory review, the editorial board accepts the paper for publication.
• All papers are published under Creative Commons Attribution 4.0
International (CC BY 4.0) license.
Manuscript submission:
• Author(s) may submit an article through the journal’s online submission system or
through an email as a word file. In case of online submission, author(s) are required
to Sign up. On successful registration, author can upload the article. Alternatively,
an article may be sent through email at [email protected].
• The email submissions should be sent along with the covering letter (available
on website), giving unabbreviated names and email addresses of all the
authors, indicating the corresponding author and certifying that the paper has
neither been, nor will be sent elsewhere for publication.
• Authors should note that all submitted articles are refereed through a double-
blind peer review process which means that author’s identities remain
unknown to reviewers and vice versa throughout the reviewing process.
217

• Articles should be about 6,000 to 9,000 words. Word count includes everything:
abstract, text, endnotes, references, tables, figures and appendices.
• Articles should be formatted in single or double spacing, in Times New
Roman, size 12 font.
• The first page should contain the full title of the article and full names and
affiliations of all authors including email address of the corresponding author.
• The format of the manuscript should be as follows:
i. Abstract (up to 250 words)
ii. Keywords (up to 06 words)
iii. Introduction
iv. Literature Review
v. Research Methodology
vi. Results and Conclusion
vii. Research Recommendations (if any)
viii. Acknowledgement (if any)
ix. References (APA 6th Style)
• Research notes should be under 4,000 words, including everything in the
manuscript. Research notes should have the same rigor, style and tone as full-
length articles. Research notes are diverse from articles in their contribution
as they cover a specific audience, are more technical.
• References should be verifiable and cited in the text by the last name of the
author (all authors, if max four, the first author and et al when more than four)
followed by the year, in descending chronological order. All references in the
bibliography should be listed in alphabetical order of the authors last names
followed by date of publication and other complete details.
• There should be at least 20 references given in the manuscript. References
should be cited from new/latest studies. Anonymous (Anon) references are not
accepted. The Journal follows APA 6th referencing style.
• The manuscript should include all necessary and complete information within
218

the main text, not as footnotes & Endnotes.
• Authors will make sure that all tables, graphs, and diagrams are in black and white
in Times New Roman, font size 10. Tables in picture format will not be accepted.
• Manuscripts not following the guidelines will be returned immediately without
review.
after acceptance:
• Authors will be notified about the acceptance / rejection of the paper through email.
• Accepted manuscript will be sent to the corresponding author for final proof
reading. No editing or proofreading will be allowed after publication of an article.
Publication ethics
• The Higher Education Commission of Pakistan has prepared Publication
Ethics guidelines for all its approved Journals. This journal follows these
guidelines which are available at www.greenwich.edu.pk/publications/jbs
219

Pakistan – Mauritius
Call for Papers
The editorial team of the Journal of Business Strategies (JBS), initiates
a “Call for Papers” in all areas of Business Management. We welcome high
quality original research papers, survey papers, case studies, review papers
and extended version of scholarly articles presented in conferences, for
forthcoming issue of JBS to be published in December 2020. The last date
for submission for the upcoming issue is November 10, 2020. Manuscripts
received after the deadline will not be considered for publications.

221

222


![Spectroscopy Letters Volume 26 issue 3 1993 [doi 10.1080_00387019308011552] S. S. Kandil; L. H. Madkour -- Synthesis and Characterization of 2,2-Biimidazole Complexes of Oxoca](https://static.documents.pub/doc/80x56/55b1c234bb61eb7a678b45ea/spectroscopy-letters-volume-26-issue-3-1993-doi-10108000387019308011552-s-s-kandil-l-h-madkour-synthesis-and-characterization-of-22-biimidazole-complexes-of-oxoca-55bda33107f3b.jpg)


![Journal of Archaeological Research Volume 1 Issue 3 1993 [Doi 10.1007%2Fbf01326535] G. a. Clark -- Paradigms in Science and Archaeology](https://static.documents.pub/doc/80x56/577cc0831a28aba7119063ce/journal-of-archaeological-research-volume-1-issue-3-1993-doi-1010072fbf01326535.jpg)


