Joint Implementation Quarterly JiQ JiQ JiQ JiQ JiQ JiQ JiQ JiQ Editor’s note Magazine on the Kyoto Mechanisms Vol. 15 - No. 1 • April 2009 - Groningen, the Netherlands In this issue 1 Editor’s note 2 Implementing Green Invest- ment Schemes 5 Economic Crisis and Russia: Boom or Bust for JI? 6 Link between Environmental Regulation and Competitive Performance in the Chemical Industry in Northern Italy 10 CDM Technology Focus: Biodiesel 13 IARU Copenhagen Con- gress Warning: “Worse than IPCC worst-case” 15 Reports 16 JIQ Meeting Planner 2009 is an important year for climate policy making. By the end of this year, in Copenhagen an agreement has to be concluded which would form the basis of the successor of the Kyoto Protocol. When we compare the present situation with that of a year ago, it is striking to see how quickly things have changed. en, we were worried about high oil prices and this concern dominated the G-8 meeting in Japan. Also at the International Energy Week in Paris several presentations were showing high oil prices as a structural economic problem and a reason to switch to low-carbon technologies. en, we were also concerned about high food prices due to the biofuel revolution. en, there was hope that the EU ETS market prices would remain high as s support for low-carbon energy technologies. is year, many things are different. e acceleration of the financial market problems has caused an economic contraction and oil price drop. Consequently, EU ETS prices decreased as well. e ‘good news’, if we can call it that way, is that due to lower industrial production, GHG emissions have decreased. However, at the same time, there have been concerns that the present economic situation may also result in lower investments in low-carbon technologies. What is the present status of climate change policies? Good news came from Brussels where the European Commission reported that during 2007 ETS installations had more CO 2 emissions than allowances, so that the market was (finally) short. At the same time, however, Deutsche Bank and Daiwa expect lower ETS prices for 2020. Official UNFCCC data presented on 23 April shows that during 2007 the GHG emissions of industrialised countries rose by 0.9% (among others Australia and Ukraine not included) compared to 2006 emission levels. In comparison to 1990, industrialised countries have, as a group, reduced their GHG emissions by 2.1%. Kyoto Protocol Parties alone (without USA, Belarus and Turkey) reduced emissions by 14%. e grand final of this year will obviously be the COP and COP-MOP sessions in Copenhagen. Many negotiators are getting worried about the work that remains to be done between now and December. An important stimulus to this process could come from Washington and President Obama has proposed a US emissions cut by roughly 15% by 2020 from present levels, so that the USA would be back to the emissions level of 1990. is seems less ambitious than the EU’s proposal (-20% or -30% below 1990), but given the recent past in the USA Obama’s plan would be an important breakthrough. At least politically, and this is where things become risky. After all, the US problems with the Kyoto Protocol started when the US negotiators in Kyoto overstepped their mandate given by the House of Representatives (-7% instead of stabilisation). e next months will be decisive for the mandate US negotiators will get before leaving for Copenhagen. Whatever the outcome of all ongoing processes will be, it is fair to say that the amount of work that is being done is impressive, as well as all the creativity that people show to bring all countries on board again in a new climate coalition. Discussions seem more fundamental and do not stop at negotiations on national emission ceilings for industrialised countries. Instead, it is good to see that there is a much stronger focus on how low-carbon technologies can be transferred to developing countries, which includes an improved Handbook for Technology Needs Assessment and increased access to financial resources. When Copenhagen results in a solid agreement on technology transfer to developing countries, then, by May next year, we might conclude again: “it is striking to see how quickly things have changed.” In a positive direction, of course. the JIQ editors ISSN: 1877-606X
Transcript
Join
t Im
plem
enta
tion
Qua
rter
ly
JiQJiQJiQJiQJiQJiQJiQJiQ
Editor’s note
Magazine on the Kyoto MechanismsVol. 15 - No. 1 • April 2009 - Groningen, the Netherlands
In this issue
1 Editor’s note2 Implementing Green Invest-
ment Schemes5 Economic Crisis and Russia:
Boom or Bust for JI?6 Link between Environmental
Regulation and Competitive Performance in the Chemical Industry in Northern Italy
10 CDM Technology Focus: Biodiesel
13 IARU Copenhagen Con-gress Warning: “Worse than IPCC worst-case”
15 Reports16 JIQ Meeting Planner
2009 is an important year for climate policy making. By the end of this year, in Copenhagen an agreement has to be concluded which would form the basis of the successor of the Kyoto Protocol.
When we compare the present situation with that of a year ago, it is striking to see how quickly things have changed. Then, we were worried about high oil prices and this concern dominated the G-8 meeting in Japan. Also at the International Energy Week in Paris several presentations were showing high oil prices as a structural economic problem and a reason to switch to low-carbon technologies. Then, we were also concerned about high food prices due to the biofuel revolution. Then, there was hope that the EU ETS market prices would remain high as s support for low-carbon energy technologies.
This year, many things are different. The acceleration of the financial market problems has caused an economic contraction and oil price drop. Consequently, EU ETS prices decreased as well. The ‘good news’, if we can call it that way, is that due to lower industrial production, GHG emissions have decreased. However, at the same time, there have been concerns that the present economic situation may also result in lower investments in low-carbon technologies.
What is the present status of climate change policies? Good news came from Brussels where the European Commission reported that during 2007 ETS installations had more CO2 emissions than
allowances, so that the market was (finally) short. At the same time, however, Deutsche Bank and Daiwa expect lower ETS prices for 2020. Official UNFCCC data presented on 23 April shows that during 2007 the GHG emissions of industrialised countries rose by 0.9% (among others Australia and Ukraine not included) compared to 2006 emission levels. In comparison to 1990, industrialised countries have, as a group, reduced their GHG emissions by 2.1%. Kyoto Protocol Parties alone (without USA, Belarus and Turkey) reduced emissions by 14%.
The grand final of this year will obviously be the COP and COP-MOP sessions in Copenhagen. Many negotiators are getting worried about the work that remains to be done between now and December. An important stimulus to this process could come from Washington and President Obama has proposed a US emissions cut by roughly 15% by 2020 from present levels, so that the USA would be back to the emissions level of 1990. This seems less ambitious than the EU’s proposal (-20% or -30% below 1990), but given the recent past in the USA Obama’s plan would be an important breakthrough. At least politically, and this is where things become risky. After all, the US problems with the Kyoto Protocol started when the US negotiators in Kyoto overstepped their mandate given by the House of Representatives (-7% instead of stabilisation). The next months will be decisive for the mandate US negotiators will get before leaving for Copenhagen.
Whatever the outcome of all ongoing processes will be, it is fair to say that the amount of work that is being done is impressive, as well as all the creativity that people show to bring all countries on board again in a new climate coalition. Discussions seem more fundamental and do not stop at negotiations on national emission ceilings for industrialised countries. Instead, it is good to see that there is a much stronger focus on how low-carbon technologies can be transferred to developing countries, which includes an improved Handbook for Technology Needs Assessment and increased access to financial resources.
When Copenhagen results in a solid agreement on technology transfer to developing countries, then, by May next year, we might conclude again: “it is striking to see how quickly things have changed.” In a positive direction, of course.
the JIQ editors
ISSN: 1877-606X
2
Join
t Im
plem
enta
tion
Qua
rter
ly •A
pril
2009
Implementing Green Investment Schemes: Options, first experiences and the way forward
Andreas Tuerk1 and Diana Urge-Vorsatz2
IntroductionAs of April 2008, the frontrunners in the field of Green Investment Schemes (GIS) Hungary and Latvia were followed by the Czech Republic, Ukraine, Romania and Poland as these countries implemented legislation on GIS. In addition, Bulgaria and Lithuania have demonstrated interest in the mechanism. So far, the size of GIS transactions which have been disclosed formally and/or informally is over 100 Mio of assigned amount units (AAUs). Japan has been the largest buyer so far having purchased more than 70 million tonnes. Currently, Japan is the only country that allows also non-governmental entities to purchase AAUs from other countries, as companies under a voluntary national action plan can use AAUs for meeting their voluntary targets. Although prices of AAU transactions are rarely disclosed, the highest price heard for AAUs is believed to be about €16, while the lowest on record was €6, the average price is believed to be around €10.
The concept of GIS The concept of Green Investment Schemes has been introduced to enhance the environmental integrity of International Emission Trading (IET) of Assigned Amount Units (AAUs) by governments (as included in Article 17). IET as a mechanism was undermined by the excessive number of (AAUs) allocated to CEE countries and the Russian Federation in the first round of Kyoto commitments, so that trade in AAUs without a specific, dedicated underlying emission reduction activity was often considered ‘hot air’
During the last ten months there has been an increasing number of GIS deals involving Hungary, Latvia, Slovakia, the Czech Republic and Ukraine as seller countries and Austria, the Netherlands, Spain, Belgium and Japan, as buyer countries. While GIS could be a superior Carbon Finance mechanism in Central and Eastern European countries, some of the recent deals have given rise to serious concerns regarding their environmental integrity.
1 JOANNEUM RESEARCH, Institute of Energy Research, Elisabethstrasse 5, 8010 Graz, Austria, Tel: +43 316 876 1337, Mobile: +43 699 1 876 1337, Fax: +43 316 876 9 1316
2 Diana Ürge-Vorsatz, Center for Climate Change and Sustainable Energy Policy (3CSEP), Central European University, Nádor utca 9, 1051 Budapest, Hungary, Tel.: +36 1327 3092, Fax: +36 1327 3031, E-mail: [email protected]
trade. GIS transactions, on the other hand, combine a transfer of AAUs with an activity which has a positive effect on GHG emission reductions, e.g. an energy efficiency project in the built environment which is financed with revenues from selling AAUs.
Most of the potential AAU buying countries, such as the EU-15 and Japan, have expressed that they do not intend to achieve their compliance by purchasing surplus AAUs which are not the result of real emission reduction activities. GIS is therefore a self-imposed, binding commitment by potential AAU seller countries to fulfil conditions set by potential buyers. There are no international legal regulations regarding GIS and thus the way GIS can be set up is extremely flexible: it only depends on how the buying and selling countries formulate a transaction. This substantial flexibility, especially as compared to the other KP flexibility mechanisms, offers major new opportunities: it could potentially “correct” the shortcomings of other carbon finance mechanisms for certain project types and be a testing ground for the development of new carbon financing mechanisms such as voluntary schemes in developing countries. However, the flexibility of GIS also poses significant risks: environmental integrity is harder to assure without a robust international legal and institutional frameworks designated for this purpose.
Potential AAUs supply The Central and Eastern-European countries, together with Russia and Ukraine, have an estimated 6.5 billion surplus of AAUs for the first Kyoto commitment period, whereas the estimated demand AAUs amounts to around 900 Mt. It is currently unclear though how many AAUs will actually come to the market in a greening quality that is acceptable for the buyers. Russia in particular, could flood the market through AAU supply. So far, Russia has indicated it will not sell its excess AAUs, but
3
Join
t Im
plem
enta
tion
Qua
rter
ly •A
pril
2009
preferably bank these for use during the next commitment period. This bankability, however, although formally allowed by the Kyoto Protocol will depend on the outcome of the Copenhagen negotiations at COP-MOP 5/ COP-15 and whether the current AAU banking provisions are changed. There are also intensive ongoing discussions in the Russian Government on how to deal with the AAU surplus.
Possible role of GIS for emission reductions in CEE countriesFrom the start of its development in 1992 (when the UNFCCC was adopted) JI concept was considered a win-win-win concept for both sides involved. Investments in low-carbon technologies in lower-cost countries would help industrialised countries to meet their commitments in a cost-effective manner, while host countries would be supported in following a sustainable development path. This win-win objective was explicitly included in the CDM definition in the Kyoto Protocol. However, JI and CDM have largely failed to deliver in some of the mitigation areas with high sustainability benefits. These areas include, but are not limited to, energy efficiency in buildings, small- and medium-scale bioenergy utilisation, transportation and forestry projects, which not only have very significant mitigation potentials in CEE countries, but also substantial social, political and economic co-benefits, including improved social welfare, fuel poverty reduction, and reduced energy dependence. Several host countries in Central and Eastern Europe, including Latvia, Hungary, the Czech Republic and Ukraine are targeting these areas in their GIS schemes.
What is the advantage of GIS compared to JI?Although Track 1 JI gives the host country significant freedom regarding Monitoring, Reporting and Verification (MRV) and the definition of additionality (mainly because MRV is the responsibility of the host and investors countries), the requirement for measurable and additional emission reductions is still a key element in the project cycle. This has even resulted in some CEE countries adopting Track 1 procedures which are similar to Track 2 which was required by a number of buyers of the credits. Consequently, some of the CEE countries cannot make use of the relative freedom of JI Track 1 and for these countries GIS may be an attractive alternative, especially for those project types that are difficult to realize under JI Track 2, such as small-scale projects for which individual GHG accounting through baseline determination and MRV is relatively complex and costly. For the CDM, such
small-scale activities have now become eligible under programmes of activities.
While programmatic approaches can also be implemented under JI, it is unlikely that they will play a role in CEE countries, as JI is developed by the private sector which has little incentive to carry out complex project types whilst there are simpler ones (i.e. larger-scale) available. In addition, under JI Track 2 there are no guidelines so far how to carry out programmatic projects. Most of the host countries therefore are implementing project and programmatic approaches and use GIS to test these new approaches. In addition, more freedom regarding MRV under GIS than under JI Track 1 and 2 can lower transaction costs and allow effectiveness in high-priority target areas that MRV requirements of JI have severely affected. Furthermore, under GIS AAUs can be sold now for emission reductions in the future, it can therefore accommodate investments with very long payback times. Project types that require long payback times include, for example, the thermal retrofit of buildings or land-use projects.
GIS allows not only “hard greening” referring to activities in which the greening process can deliver measurable and quantifiable emission reduction units, but also ‘soft greening’ if the activities have non-quantifiable and non-measurable emission reductions, such as capacity building or awareness raising, which areas normally lack public finance. ‘Hard greening’ GIS projects come closest to JI, where the so-called greening ratio of GHG emission reductions and emission reduction credits transferred must be 1:1, whereas soft greening GIS could have a greening ration of AAU>GHG reductions. While Hungary and Latvia promise to use almost all revenues from AAU-sales for hard greening projects, Poland, Ukraine, and Romania will use more AAU-funds for soft greening measures, which could imply lower prices. Whether GIS is associated with hard or soft greening activities also depends on the AAU buyers; some of them have a preference that their money is spent on measurable GHG reduction measures as they fear misuse of the allocated funds.
Soft greening does not necessarily weaken the GIS contribution to sustainable development, though. For example, GIS could enable countries to allocate AAUs for projects that are not cost-effective (and would thus not be implemented under JI or normal market conditions) but could be of long term strategic importance. Buyer countries do not seem to insist on a high greening ratio as long as GHG emission reduction accounting and verification are
4
Join
t Im
plem
enta
tion
Qua
rter
ly •A
pril
2009
implemented according to the agreement between a seller and a buyer and regular reports about the greening activities are produced.
Ensuring the environmental credibility of GISAs mentioned earlier, GIS gives substantial flexibility, especially as compared to the KP flexibility mechanisms, and allows new and simple approaches in project areas where JI/CDM have failed. Ensuring environmental integrity of the system, however, is crucial for the credibility of the scheme. As a rigorous MRV as in the CDM could hamper GIS in important priority target areas, simplified, innovative MRV methods are needed, such as calculations confirmed by random checks, using ISO standards, etc. In order to ensure environmental integrity through additionality, but avoiding the pitfalls of CDM, also here simpler and innovative approaches are needed. For example, the Hungarian GIS is set up in a way that provides finance only for investment types that would otherwise not have taken but are important for the climate: building retrofits are supported to efficiency levels that are not attractive under other financing schemes, but that lay the foundations of a low-carbon building stock. On the other hand, lenience towards additionality is emerging by some of the host countries. Such trends raise significant environmental concerns about the system.
Recent developments and the way forwardWhile some of the GIS host countries, such as Hungary and Latvia, have credible GIS schemes in place, current developments, however, have given rise for concerns. In a number of recent deals, including an AAU sale from Slovakia, the “greening” of the revenue was unclear. However, none of these deals so far seem to have involved European governments as buyers. For some CEE countries the presently serious budgetary problems may be an incentive to sell AAUs very quickly with a low greening factor or no greening at all so that the revenues are used for other than environmental purposes. This entails the risk that the overall carbon price level on international markets (flexibility mechanisms and the EU ETS) reduces.
Due to the potentially far higher supply than demand in this market, however, buyers can significantly influence the environmental integrity and the supply–balance relation of the system by insisting on purchasing AAUs which are clearly backed by credible greening and can prevent the market from being flooded with AAUs with non- or questionably greening origins. As the GIS market is currently not transparent and a market overview is more based on
rumours than on information, more public disclosure (from buyer and seller countries) regarding AAU transactions (similar to public disclosure of CDM and JI PDDs) would be crucial for a better understanding of the GIS schemes and to enable a more serious debate on this new mechanism.
However, since, as mentioned above, GIS is a self-imposed mechanism, based on the Kyoto Protocol no international measures can be taken to guarantee the environmental integrity of projects. Consequently, only the countries involved can ensure that GIS is sensibly and intelligently used for meeting AAU demand and supply without flooding the market and reducing international carbon market prices. Increased transparency in GIS transactions would be a first step in placing this common interest on top of individual country benefits.
Background study on GIS
The Central European University, Budapest, Joanneum Research, Graz and PointCarbon carried out a major study on GIS convened by Climate Strategies. The report can be found at: The Central European University, Budapest, Joanneum Research, Graz and PointCarbon carried out a major study on GIS convened by Climate Strategies, the report can be found at:
With 93 projects in the Track 2 pipeline and almost two years after establishing the domestic framework for project approval, the Russian government is yet to sign off a single project. This has led to a lot of frustration amongst project developers and hosts. What can be the main reasons for this paradoxical situation – so much potential and so little realisation?
Several factors can help explain the seemingly lack of interest in JI in Russia, as well as Russian reluctance to get the papers signed for the projects that have actually been developed. An important issue, which has been difficult to understand outside Russia, is that even though it can be documented that many potential JI projects are profitable by themselves, the size of the potential JI funding flows are small compared to the huge energy export revenues, and large investment projects considered by major Russian corporations over the last decade.
Combined with the centralization of decision-making in the big companies, this means that JI have had a big problem getting the necessary attention of top management. Significant, we believe, is also the mismatch of the level of actors involved in JI: the government should take an initiative to approve projects which provide funding for the private sector. Also some types of JI projects and the uncertainties around them may have spurred reluctance in the bureaucracy to take personal responsibility for approving projects that may turn out later to be questionable. What JI certainly has been lacking in Russia is high level attention vital to such decision-making processes. Thus, the relevant officials continue to wait for a signal from the high political level.
The global economic crisis reached Russia towards the end of 2008, and has already had a huge impact on the manufacturing industry. A significant share
Joint Implementation was expected to provide a significant financial flow to Russia, since the potential for projects improving the environmental performance in industry as well as the housing and communal sector was seen as very large. This was the prevalent opinion after Kyoto outside Russia, but also inside the country there were many optimists.
of the capacity is now either operated on partial capacity or has been halted altogether. One might think that the economic crisis could have a positive impact on the chances of JI approvals in Russia, though. Now that the government is struggling with the crisis and the low price of oil, the revenue from JI, however insignificant it may have seemed when the oil revenues were flooding in, could regain some attractiveness. Also some of the important large companies, such as Gazprom, may find JI a useful mechanism to gain savings from their energy costs to ease the burden put to the business by the crisis.
Pointing in the opposite direction is the fact that some potential JI investments are part of broader investment projects carried out by the project host. Besides, due to the economic crisis investment across the board is being slashed. This means that the JI ‘portion’ can also be negatively affected. Moreover, one of the main forces behind JI in Russia, foreign project developers, may start giving up and focusing on the more functional sources of ERUs and CERs.
Even if one should conclude that on balance the financial crisis is positive for JI in Russia, the new situation will not solve all the current problems holding JI back. Even though the revenues may become more attractive for the high-level policy-makers, the bureaucracy of the approval process remains and may provide counter-incentives. Also the fact that the government is not going to receive any of the revenues directly remains and does not give a strong incentive to prioritize the JI approval process.
The results of JI in Russia as of today are indeed poor, and the whole story with development of a framework and procedures looks fruitless and almost embarrassing. Seeing this, the Russian government may want to approve some projects before the end of the first commitment period. However, should the foreign project developers give up on Russia due to the general financial hazards, the Russian government could really lose its momentum with JI. If a ‘time trigger’ mechanism exists, hopefully it will not work too late for the project developers who have to face the additional uncertainties caused by the present economic downturn.
6
Join
t Im
plem
enta
tion
Qua
rter
ly •A
pril
2009
The Link between Environmental Regulation and Competitive Performance in the Chemical Industry in Northern Italy:First Findings from the EMPIRE Project
Francesco Testa12 and Fabio Iraldo12
1 CESISP Center for the Development of Product Sustainability, Via all’Opera Pia 15, 16145 Genova, Italy2 Sant Anna School of Advanced Studies, Piazza Martiri della Libertà 33, 56127 Pisa, Italy
The Chemical sector in the Padania RegionThe chemical sector represents an important economic sector in Italy: it is composed of 23,034 local units employing about 400,000 employees. 63% of these enterprises and 67% of Italian chemical employees work in the country’s northern area – Padania Region (source: ISTAT data 2005). The 14,513 chemical sector units operating in the region represent over 5% of all Padania local units (the engineering and textile-tanning units are the most represented, together exceeding 40%). Moreover, the chemical sector has been growing between 1995 and 2000 by around 3% (productivity index), while textile-tanning showed a decrease of 11,4%.
Many aspects of the EU environmental legislation exert an influence on the activities of the chemical firms and therefore on their performance. In particular, the environmental legislation that is most specific to the chemical industry and has the greatest potential competitive impact focuses on the following topics:• Air and water pollution from plants, • Waste management,• Major accidents.
European regulation includes several Directives that define limits to atmospheric pollutants, such as emissions from power-generation plants, and aqueous effluent from process plants, such as heavy metals and chlorinated organics. EC Directives aimed at specific industry segments, such as titanium dioxide producers and choralkali plants, are also in place. For instance, the IPPC (Integrated Pollution Prevention and Control) Directive 96/61/EC has a broad impact on the chemical industry; it requires Member States to implement proper authorisation and monitoring
processes for compliance, and it imposes the use of BAT (Best Available Techniques).
The research approach In order to investigate and analyze the link between environmental regulation and competitive performance of companies, we carried out several interviews with environmental managers, with the aim of retrieving information related to the performances of firms operating in the market segment of “chemicals for the building and construction sector”. The questionnaire used to carry out the investigation was structured in three main sections: • Organization features; • Public environmental policy;• Competitive performances.
Box 1. The Empire project
The EMPIRE project aims at studying the interplay between environmental regulation and market forces with respect to the building and construction industry. The project is funded by SKEP ERA-NET (Scientific Knowledge for Environmental Protection) and is carried out by a consortium of three research institutes: CESISP (Center for the Development of Product Sustainability), Copernicus Institute – University of Utrecht and CARMA -Centre d’Animation Régional en Matériaux Avancés. The methodological approach proposed aims at enriching the ongoing debate on the links between environment and market forces by way of a thorough and in-depth assessment, on one hand, of the effects of environmental policies on competitiveness and, on the other hand, of the impact of these policies on the behaviour of companies and consumers, specifically related to the building sector. The present article aims at presenting the findings emerging from one of the case studies carried out within the project: a study on chemicals for building sector in Padania Region (Northern Italy).
The article presents the first findings of a study on “The Link between Environmental Regulation and Competitive Performance in the Chemical Industry in Northern Italy”. The study is carried out under the EMPIRE project. For a backgroud explanation of the project, the reader is referred to Box 1.
7
Join
t Im
plem
enta
tion
Qua
rter
ly •A
pril
2009
Figure 1. Sample distribution
Figure 2. Impact of environmental policy regime
The sampling process was carried out in three steps. In the first step we selected the NACE codes that potentially refer to the investigated sector (chemical for building is not so well-defined by the Statistical classification of economic activities in the European Union). In the second step we requested the list of all active organizations classified with the selected codes from the Italian Chamber of Commerce. These organisations are located in the four Regions of the Padania area (Piedmont, Lombardy, Veneto and Emilia Romagna). In the third step we made a random sampling and identified 25 organizations to interview.
Figure 1 shows the distribution of the sample in term of age and dimension of interviewed organizations.
The stringency of the environmental policy regimeIn order to analyse the stringency of the environmental policy regime, we asked the organizations to assess a set of environmental policy instruments in terms of their impacts on own organization’s production activities. The set of environmental policy instruments included direct regulations (i.e. input bans, technology and performance based standards), economic instruments (i.e. emissions and input taxes, tradable emissions permits) and soft instruments (i.e voluntary agreements, demand information measures, green public procurement).
The results show clearly the higher relevance of direct regulations, in term of impact on the organization’s production activities. In fact, if we consider how many organizations perceive which policy instruments have a very important impact on their own activities, we find that technology-based standards (such as BAT quoted in the IPPC regulation) and performance-based standards (defined for examples in air emission or wastewater discharge permits) are the most effective policy instruments (75% and 79% of respondents perceive the impact of the standards as very important).
Typical economic instruments such as emission or effluent taxes or charges, input/output taxes and tradable emissions permits or credits are perceived to have a relevant impact, but lower than direct regulation (between 43% and 55% of respondents state that these instruments have a very important impact).
The third emerging consideration refers to the soft instruments. The organizations interviewed did not
8
Join
t Im
plem
enta
tion
Qua
rter
ly •A
pril
2009
consider these instruments as very important with respect to their production activities. This is probably due to the low support that public authorities are providing to their diffusion. An exception to this low perception is certainly the instrument of “green public procurement (GPP)” (56% of respondents state that the GPP has a very important impact on production activities). The recent environmental policies carried out by both the European Commission (see the Directive 2004/18/EC and 2004/17/EC) and the Italian Government (at central and local level) have strongly supported the diffusion of this tool among the public authorities. As a consequence, the knowledge and the perception of GPP as a market opportunity has increased among public bodies’ suppliers.
Furthermore, in order to obtain a measure of the global perception regarding the stringency of the environmental policy regime, we asked the environmental managers to describe the environmental policy regime to which their organization is subject. The 28% of the respondents hold that the current environmental policy regime is not particularly stringent because the generated obligations can be met relatively easily. On the opposite, the 32% of the respondents perceive the environmental policy regime as very stringent because it has a great influence on decision-making by the top management.
The effects of environmental policies on competitiveness Literature and previous studies emphasise that many aspects of the EU environmental legislation can exert an influence on the operational activities of the firms and, therefore, on their performance (Brunnermeier and Cohen, 2003; Ambec et al., 2007). Our study aims at confirming these results, by testing whether the effects of environmental regulation on firms’ competitiveness is statistically supported.
Firstly, we investigated if there is a statistically significant correlation (by means of Spearman test) between the different measures of competitiveness and the degree of environmental policy stringency, as perceived by sampled organizations. In order to measure the policy stringency, we used the answers to the question: How would you describe the environmental policy regime relevant to your facility?; and: How many times has your organization been inspected?
Secondly, we investigated whether the form of regulation has an influence on the way in which
environmental regulation affects competitiveness, according to the Porter’s theory (Porter and Van der Linde, 1995). For this reason, we selected two environmental policy instruments for each category:• input bans and performance standards for direct
regulation (command and control);• input and emissions taxes for economic
instruments; and• demand information measures and GPP for soft
instruments.
From the analysis of the results of the Spearman correlation test, it emerges that the more stringent policies are, the higher are the investments in environmental technologies and products, as well as the better is the business performance generated by green products (however, this last correlation is not strongly supported at a statistical level).
As to the effects of the different forms of environmental regulation on competitiveness, some interesting evidence emerges. On one hand, the relevance of direct regulation seems to be correlated to the innovation performance, even if the correlation test between input bans and innovation investments is not strongly significant. On the other hand, the relevance of voluntary instruments such as GPP and demand information measures are strongly correlated with reputation and weakly correlated (just demand measures) with technicians competence.
This information seems to indicate that the soft instruments are used as marketing tools, in order to improve the corporate image on the market, but they are not able to produce an economic benefit for the organizations. Regarding the economic instruments, there is a correlation between the relevance of emissions taxes and the increase of personnel motivation and technicians competence.
After the description of the results emerged in the correlation matrix (see Table 1), we focused on the analysis of effect of environmental policy stringency on some measure of competitiveness. Using ordered probit models we tested if the perceived policy stringency affects the amount of investments in technical or product innovation, as well as the performance of green products. The results indicate that there is a positive relationship between the stringency of environmental policies and the technical innovation at the firm level. It has been found that the higher is the level of perceived stringency, the higher is the number of environmental inspections and, finally, the more likely it becomes that an organization increases its investments in
9
Join
t Im
plem
enta
tion
Qua
rter
ly •A
pril
2009
technical innovation. The test statistics show that the different measures of policy stringency explain the technical innovation with a pseudo-R2 of 0.47, and the chi2 test is in the 95% significance interval. The positive relation of “perceived policy stringency” and innovation, as well as, of the number of inspections and innovation, are significant at 95%. Furthermore, the relationship between the relevance of input bans on investment in environmental technologies is positive but not strongly supported at a statistical level.
ConclusionsPorter and Van der Linde (1995) and Porter (1990) suggest that environmental regulations are potentially beneficial to firms, as they give incentives to change their production routines (technological or process innovation) in such a way that it leads to compliance and reduced costs through decreased resource inputs or increased efficiency. It can even lead to new marketable products (the “Porter hypothesis”). Such innovations may well offset the costs of compliance. Porter (1991) has gone on to suggest that if one country adopts stricter environmental regulations than its competitor-countries, the resulting increase in innovation will enable that country to become a net exporter of the newly developed environmental technologies.
Our study seems to support this hypothesis, confirming that, at perception level (even if we also
Table 1. Spearman correlation test among policy stringency measures and competitive performance measure
use inspection frequency as measure of environmental policy stringency), a higher pressure of environmental regulation stimulates organisations to increase their investments in technological innovation. The emerging evidence should, however, be further investigated using quantitative data and a larger sample in order to overcome the two main limits of the present study.
*** p < 0.01 ** p < 0.05 * p < 0.1
ReferenceBrunnermeier S.B., Cohen M.A. (2003),
“Determinants of environmental innovation in US manufacturing industries”, Journal of Environmental Economics and Management, Vol. No. 45, pages 278-293.
Ambec, S., Johnstone, N., Lanoie, P., Laurent-Lucchetti, J. (2007), Environmental Policy, Innovation and Performance: New Insights on the Porter Hypothesis, Working Paper GAEL.07, Laboratoire d’Economie Appliquée de Grenoble.
Porter M. E., van der Linde C. (1995), “Toward a New Conception of the Environment Competitiveness Relationship” Journal of Economic Perspectives, Vol. No. 9, pages 97-118.
Porter M. E. (1991), “America’s Green Strategy”, Scientific American, n. 168.
Porter M. E. (1990), The Competitive Advantage of Nations, New York, The Free Press
10
Join
t Im
plem
enta
tion
Qua
rter
ly •A
pril
2009
CDM Technology FocusThe EU-funded research activity ENTTRANS describes energy technologies that could con-tribute to GHG emission reduction. JIQ describes these technologies in a series of articles.
Biodiesel
Box 1. Biodiesel production process
Biodiesel from fatty acid methyl esters (FAME) can be produced by a variety of esterification technologies, though most processes follow a similar basic approach. First the oil is filtered and pre-processed to remove water and contaminants. If free fatty acids are present, they can be removed or transformed into biodiesel using pre-treatment technologies. The pre-treated oils and fats are then mixed with an alcohol (usually methanol) and a catalyst (usually sodium or potassium hydroxide). The oil molecules (triglycerides) are broken apart and reformed into esters and glycerol, which are then separated from each other and purified. The resulting esters are biodiesel.
Biofuels have an organic origin and since they are liquid, they are compatible with current vehicle engines and blendable with current fuels. They can be derived from agricultural sources such as sugarcane, beets, maize, energy-rich herbaceous plants, vegetable oils (such as rapeseed oils, sunflowerseed oils, etc.), agricultural waste, lumber offcuts and manure.
The two most prevalent biofuels are ethanol (produced from sugar or starch crops) and biodiesel (produced from vegetable oils or animal fats). Ethanol accounts for about 90% of total biofuel production, while biodiesel accounts for the remaining share. Biodiesel generally refers to methyl esters made by transesterification, a chemical process that reacts a feedstock oil or fat with methanol and a potassium hydroxide catalyst (see Box 1). Co-products are crushed bean ‘cake’, which is an animal feed, and glycerine, which is a valuable chemical used for many types of cosmetics, medicines and foods. As with ethanol, biodiesel can be blended in low ratios (5-10%) with petroleum-based diesel fuel without any modification to conventional diesel engines. Alternatively it can be used in a pure form (B100).
Substituting fossil fuels with biofuels does not take place on a 1:1 volume basis, however, since biofuels have a lower energy content.
Although the use of biofuels is not limited to the transport sector alone, application in this sector gained a lot of attention over the last decades due to higher oil prices, successful application of sugarcane based ethanol in Brazil and an increasing share of the transport sector in worldwide GHG emissions. Besides, only a small amount of, for example, European biodiesel is used for non-transportation purposes. Therefore, this articles focusses mainly on biodiesel for transport.
Biodiesel and GHG emission reductionIn 1950 there were only 70 million vehicles (cars, trucks, and buses) on the roads worldwide. In 2003 there were about ten times as many: 700 million vehicles (RRI, 2004). This explains the transport sector’s significant share in energy-related CO2 emissions: about 25% worldwide. According to the IEA (2004) worldwide emissions from transport activities will increase by almost 170% during the period up to 2030. The increase in CO2 emissions in the EU are expected to be attributable to transportation for 90% 1990 and 2010.
Biofuels have the potential to reduce GHG reductions in the order of 20-50% compared with petroleum fuels according to the IEA. Virtually all of the CO2 emitted by vehicles during combustion of biofuels does not contribute to new emissions, because the CO2 is already part of the ‘fixed’ carbon cycle (i.e. only the amount of CO2 absorbed by plants is emitted during combustion). Well-to-wheels CO2-eq. emissions can be lowered to near zero through application of second generation biofuels (e.g. enzymatic hydrolysis of cellulose to produce ethanol).
IEA scenarios developed for the USA and the EU indicate that near-term targets of up to 6% displacement of petroleum fuels appear feasible.
Energy potentialBiofuels have the potential to reduce security of supply concerns and are mentioned by many countries as an important reason to start pioneering this business. Of the world’s poorest countries, 38 are net oil importers, and 25 of these import all of their oil. In many smaller and poorer nations, 90% or more of the total energy consumption originates from imported fossil fuels, whereas in general substantial opportunities exist to develop a domestic
RRI (2004), The Market for Alternative Fuel Vehicles, 1st edition, December.
IEA (2004), World Energy Outlook 2004, IEA/OECD, Paris, France.
11
Join
t Im
plem
enta
tion
Qua
rter
ly •A
pril
2009
biofuels industry due to often favourable climatic circumstances.
Sustainable development benefitsIn addition to GHG abatement, blending biofuels with petroleum fuels generally brings about a reduction in SO2 emissions, particulate matter and carbon. Biodiesel could play an important role in improving urban air quality and phasing out lead-based and otherwise toxic fuel additives. Moreover, the uptake of biofuel production is likely to increase farmer’s incomes and strengthen rural economies through job creation. As a country embarks on growing biofuel feedstock it can even become a net exporter of liquid fuels and earn foreign exchange instead, like Brazil does nowadays. In fact, the production of biofuels already affects agricultural commodity markets, most notably in Brazil. About 50% of its sugar cane crop was dedicated to producing ethanol in 2005 and is held partly responsible for the price uptake in worldwide sugar prices. In the EU, more than 20% of the rapeseed crop provided about 1% of EU transport fuel in the form of biodiesel that very same year.
DisbenefitsBiofuels will only reduce GHG emissions if the feedstock is cultivated sustainably. For example, biofuels production from low-yielding crops, with heavy inputs of fossil fuels, on previously wild grasslands or forests, and/or processed into fuel using fossil energy, potentially emits more GHGs than petroleum (Worldwatch Institute, 2006).
Another (potential) disbenefit relates to the availability of land. According to the Worldwatch Institute (2006), the absence of strong, well-implemented policies, particularly in developing countries with tropical forests, already leads to environmental degradation and social conflict.
Availability of the technology,First generation biofuels are applied by a number of countries such as the USA and Brazil where production costs of biofuels are competitive with gasoline. Compared with some of the technologies being developed to produce ethanol and other biofuels, the biodiesel production process involves well-established technologies that are not likely to change significantly in the future.
Still, the (relative) use of biofuels for transport is quite low, a notable exception being Brazil with an about 30% share in total gasoline demand. Even in the USA where ethanol is successfully produced from corn, biofuels only account for some 2%. The ability to generate fuels from lignocellulosic materials (second or next generation biofuels) such as plant stalks, leaves, and wood are considered a major innovation thought to dramatically increase biofuel production in the future. According to the Worldwatch Institute (2006), substantial government R&D investment is currently being allocated towards the further development of such technologies, especially in the US and Canada.
Market potential and social acceptabilityIn the EU, biodiesel is the main biofuel produced and consumed and accounts for 80% of EU biofuels production. Biodiesel production in the EU has increased from 1.9 million tonnes in 2004 (appr. 90% of world production) to nearly 3.2 million tonnes in 2005 (a 65% increase). From 2002 to 2004, biodiesel production grew with 30-35% annually. However, biodiesel production remains rather concentrated and is mainly seen in the former EU-15. Nevertheless, the number of EU countries with a biodiesel industry has nearly doubled in 2005, from 11 to 20 in 2005.
Germany is the world leader in biodiesel production and use and growth in 2005 was largely driven by growth in Germany, which is amongst others based on a 100% fuel tax exemption for B100. Its widespread refuelling stations network (1,500) provides the necessary backbone infrastructure. France and Italy are other important biodiesel producers. Figure 1 indicates how World production of biodiesel has quadrupled since 1975 (Worldwatch Institute, 2006).
Requirements for a successful implementation of the technologyIn the case of Brazil, high oil prices triggered the Brazilian Government to support the use and production of ethanol from sugar cane in mobility. Although ethanol as a fuel can compete with gasoline in Brazil, in most countries it is not yet economical to switch from using fossil fuel to biofuels. For such a transition, long-range, and coordinated policies
Worldwatch Institute, 2006. Biofuels for transportation: Global Potential and Implications for Sustainable Agriculture and Energy in the 21st Century, Extended Summary, Washington: Worldwatch Institute in cooperation with the Agency for Technical Cooperation (GTZ) and the Agency of Renewable Resources (FNR).
<http://www.worldwatch.org/node/4078>
12
Join
t Im
plem
enta
tion
Qua
rter
ly •A
pril
2009
are needed. Such factors should be addressed in an integrated approach throughout the biofuel value chain and should comprehend:• Political support;• Legislative support;• Fiscal support;• Financial support;• Administrative support;• Technological development; and• Information, education and training.
Such factors should not only be addressed domestically. For example, facilitation of the international trade in biofuels is important which would leave developing countries with opportunities to become a net exporter of biofuels. Likewise, a market should be developed for resultant by-products of the biofuel production process, which will further bring down costs, necessary to compete with fossil fuels.
Finally, in order to provide biofuels to the consumer, proper infrastructural arrangements should be in place, i.e. availability of biofuels should be ensured. In this respect the production of so-called flexible-fuel (flex-fuel) vehicles seems to provide a valuable alternative if such arrangements are not in place and detrimental for the further development of the use of biofuels in transportation.
Barriers and incentivesOne of the main barriers towards the further applicability of biofuels is provided by the price of crude oil and the pace at which biofuel technologies are further developed (e.g., efficiency of the conversion process), which would make them (more) competitive with fossil fuels.
Related hereto is the fact that government subsidies on fossil fuels prevail, especially in developing
countries, to make gasoline available to its citizens at affordable costs. This puts biofuels at a disadvantage. Moreover, international trade in biofuels is hampered by import duties and tariffs, for example on ethanol (€0.08 on ethanol is applicable for the EU).
Other barriers or limitations for future biofuel production are the availability of suitable land and water resources. Growing competition for land and water resources, aquifer depletion, soil erosion, and the (eventual) loss of biologically rich ecosystems, such as tropical forests provide concerns that have yet to be addressed. Several studies show differing results as to the extent to which biofuels can sustainably replace biofuels in light of land use constraints. Generally, countries that consume large quantities of transportation fuels have limited land available for biomass feedstock. Increased biofuel production may drive up food prices, which may be beneficial for farmers, but not for the urban poor.
Finally, because the recognition of non-market benefits is often the driving force behind efforts to increase their use, public information campaigns could further inform government, business and citizens in order to make such not-easy-to-quantify benefits quantifiable.
Incentives for biofuel production are rising oil prices, national energy security concerns, CO2 abatement objectives, the desire to increase farm incomes, and new and improved technologies. Moreover, local air pollution is increasingly perceived of as a major health issue throughout the (developed and developing) world. This perception is most likely to grow further due to: more information about the adverse health implications of bad air quality; increasing attention to local air quality; and an increasing number of people living in (mega) cities (almost 5 billion by 2030).
Policies can put to work on an operational level through specific incentives. The following gives an overview of policies that have demonstrably fostered biofuel production and use:• Blending mandates;• Tax incentives;• Government purchasing policies;• Support for Biofuel-compatible infrastructure
and technologies• R&D especially into ‘next-generation’ biofuels
derived from lignocellulosic biomass material;• Public education and outreach;• Reduction of counterproductive subsidies; and• Investment risk reduction for next generation
facilities.
Figure 1. World biodiesel production, 1975-2005 (million litres)
13
Join
t Im
plem
enta
tion
Qua
rter
ly •A
pril
2009
According to IPCC, the concentration of GHG in the atmosphere would need to stay below the level of 450 ppm in order to prevent average global temperatures from rising by more than 2oC above pre-industrial levels, which is considered a maximum temperature increase to avoid irreversible damage to global climate and ecosystems and which has become an official policy objective of the EU (note that an increase in CO2 concentration to 550 ppm is projected to lead to an average temperature increase of ~6oC).1
The latest scientific knowledge on climate Change was presented and discussed at the Copenhagen IARU International Scientific Congress “Climate Change: Global Risks, Challenges and Decisions” and it indicates that the world is on a GHG emissions trajectory which is worse then the IPCC worst case scenario presented by the IPCC Fourth Assessment Report in 2007. As a consequence, the IARU congress made clear that there is a risk of severe disruption of the climate system.
Also other studies, for example at the Tyndall Climate Change Centre, point out that under current trajectories the world either must instigate an immediate and radical reversal in existing GHG emission trends or accept global temperature rises well beyond 4°C3 (note that the last ice age was equivalent to a drop in global temperatures of 5°C). The ability of current environmental and social systems to withstand such extremes is unknown.
IARU Copenhagen Congress Warning: “Worse than IPCC worst-case”
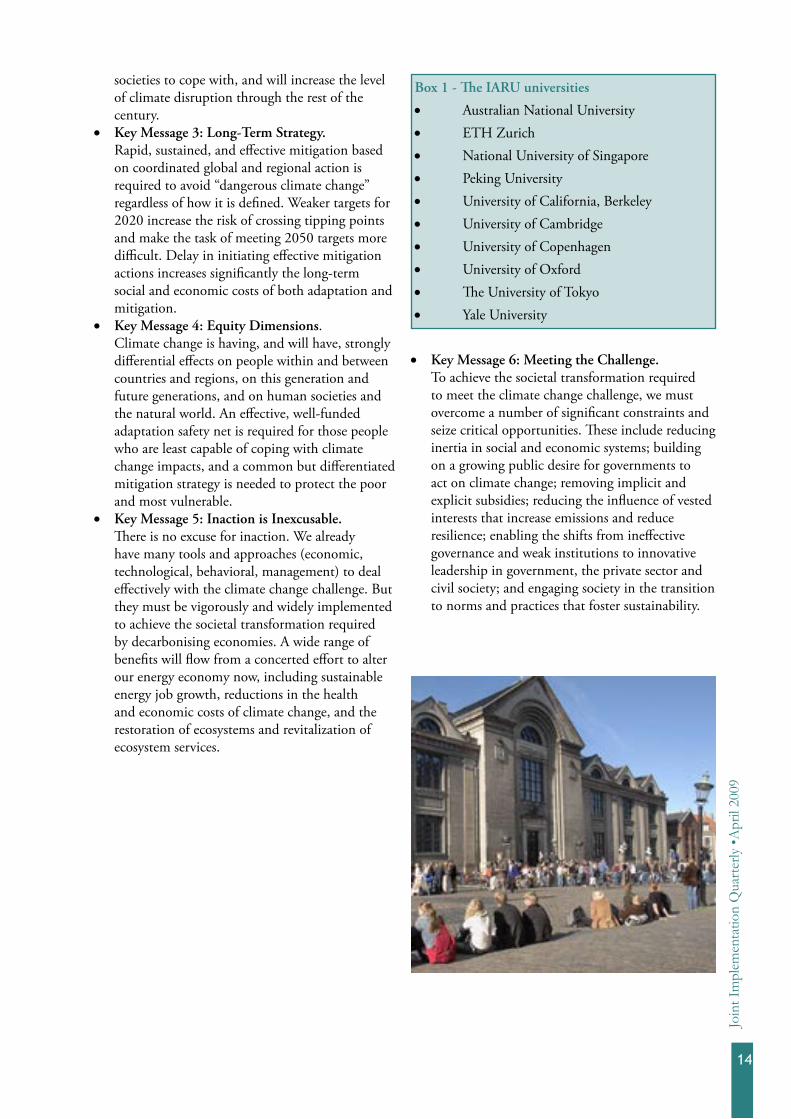
Climate change and the accompanying threat of ocean acidification from anthropogenic emissions of GHG are among the most daunting environmental problems confronting the world today. On 10-12 March of this year, the International Alliance of Research Universities (IARU) organised an International Scientific Congress on climate Change: “Climate Change: global risks, Challenges & Decisions”. The congress was held at the University of Copenhagen.
The IARU congress ended with six key message statements formulated as a result of the conference. These messages will be fed into the COP-15 meeting in Copenhagen by the end of this year. They are listed below (as in the press release of the IARU congress, http://climatecongress.ku.dk/newsroom/congress_key_messages/):
• Key Message 1: Climatic Trends. Recent observations confirm that, given high
rates of observed emissions, the worst-case IPCC scenario trajectories (or even worse) are being realized. For many key parameters, the climate system is already moving beyond the patterns of natural variability within which our society and economy have developed and thrived. These parameters include global mean surface temperature, sea-level rise, ocean and ice sheet dynamics, ocean acidification, and extreme climatic events. There is a significant risk that many of the trends will accelerate, leading to an increasing risk of abrupt or irreversible climatic shifts.
• Key Message 2: Social disruption. The research community is providing much more
information to support discussions on “dangerous climate change”. Recent observations show that societies are highly vulnerable to even modest levels of climate change, with poor nations and communities particularly at risk. Temperature rises above 2oC will be very difficult for contemporary
1 Staying below the 450 ppm concentration level would help in preventing average global temperatures from rising by more than 2oC above pre-industrial levels, which is considered a maximum temperature increase to avoid irreversible damage to global climate and ecosystems and which has become an official policy objective of the EU (note that an increase in CO2 concentration to 550 ppm is projected to lead to an average temperature increase of ~6oC).
2 International Alliance of Research Universities (IARU) International Scientific Congress “Climate Change: Global Risks, Challenges and Decisions”, Copenhagen, March 2009.
societies to cope with, and will increase the level of climate disruption through the rest of the century.
• Key Message 3: Long-Term Strategy. Rapid, sustained, and effective mitigation based
on coordinated global and regional action is required to avoid “dangerous climate change” regardless of how it is defined. Weaker targets for 2020 increase the risk of crossing tipping points and make the task of meeting 2050 targets more difficult. Delay in initiating effective mitigation actions increases significantly the long-term social and economic costs of both adaptation and mitigation.
• Key Message 4: Equity Dimensions. Climate change is having, and will have, strongly
differential effects on people within and between countries and regions, on this generation and future generations, and on human societies and the natural world. An effective, well-funded adaptation safety net is required for those people who are least capable of coping with climate change impacts, and a common but differentiated mitigation strategy is needed to protect the poor and most vulnerable.
• Key Message 5: Inaction is Inexcusable. There is no excuse for inaction. We already
have many tools and approaches (economic, technological, behavioral, management) to deal effectively with the climate change challenge. But they must be vigorously and widely implemented to achieve the societal transformation required by decarbonising economies. A wide range of benefits will flow from a concerted effort to alter our energy economy now, including sustainable energy job growth, reductions in the health and economic costs of climate change, and the restoration of ecosystems and revitalization of ecosystem services.
Box 1 - The IARU universities
• Australian National University• ETH Zurich• National University of Singapore• Peking University• University of California, Berkeley• University of Cambridge• University of Copenhagen• University of Oxford• The University of Tokyo• Yale University
• Key Message 6: Meeting the Challenge. To achieve the societal transformation required
to meet the climate change challenge, we must overcome a number of significant constraints and seize critical opportunities. These include reducing inertia in social and economic systems; building on a growing public desire for governments to act on climate change; removing implicit and explicit subsidies; reducing the influence of vested interests that increase emissions and reduce resilience; enabling the shifts from ineffective governance and weak institutions to innovative leadership in government, the private sector and civil society; and engaging society in the transition to norms and practices that foster sustainability.
15
Join
t Im
plem
enta
tion
Qua
rter
ly •A
pril
2009
Reports
Carbon and Climate Law Review, 2009. Reforming the CDM - Institutions and Governance, Vol. 3, No. 1, edited by Karl Upston-Hooper, Micheal Mehling and Elisabeth DeMarcoThis issue of Carbon and Climate Law Review is fully devoted to the topic of Reforming the CDM. It highlights a number of questions and addresses several issues that play a role in the negotiations leading to COP-15 and COP-MOP-5. It has aimed at an appropriate balance to achieve fair but effective regulation. The editors suggest that any substantive reform of the CDM and its bodies should be preceded by a thorough debate about the desired normative goals of such reform with all key stakeholders.
Further information: Ms Christina Kickum, CCLR Executive Editor, Lexxion Verlagsgesellschaft mbH, tel.: +49 30 814 50 6 15, e-mail: [email protected]; www.lexxion.de.
Castro, P. and A. Michaelowa, 2009. Would preferential access to the EU ETS be sufficient to overcome current barriers to CDM projects in LDCs? <www.climatestrategies.org/our-research/category/39/133.html>This paper addresses the question whether preferential access to the carbon market is sufficient to overcome current barriers to CDM development in Least Developed Countries (LDCs). For LDCs, the paper concludes that a restriction limiting the supply of CERs from CDM projects registered after 2012 to just LDCs, would not have an importantimpact if the existing barriers for project implementation in these countries are not overcome.
Michaelowa, A., 2009. Discounting CERs to avoid CER import cCaps <www.climatestrategies.org/our-research/category/39/135.html>Discounting the value of CERs has been proposed as a possible approach for addressing some of the shortcomings of the CDM. It could be used to compensate for non-additional CDM projects; to increase the incentive for advanced developing countries to move from the CDM to own mitigation commitments; and to improve the competitiveness of less developed countries as hosts for CDM projects. This paper finds that discounting has an impact on the competitiveness of individual CDM host countries in the carbon market, as it affects their
abatement cost curves. It could become an instrument for incentivising advanced developing countries to leave the CDM and engage in other farther-reaching climate-related commitments, as a result of the resulting CER cost increases. However, even with discounting, Least Developed Countries remain unimportant in terms of abatement potential if the financial, technical and institutional barriers to CDM development in these countries are not overcome.
Müller, B. (2009). Additionality in the Clean Development Mechanism: Why and What?<http://www.oxfordenergy.org/pdfs/EV44>This paper considers current practice and concludes that there is really no reason for the current differentiated treatment between offset generation in Annex B and offset generation in non-Annex I, where only the former is subject to (investment) additionality tests.
The paper suggests that a trend-projection interpretation of additionality – which does not require investment or any other analyses of decision making processes – be used wherever possible. Where it is not possible, such as in the case of ‘green-field’ projects or in the absence of stable trends, the investment additionality tests should be dropped from the unavoidable scenario analysis to level the playing field. This would make the CDM not only fairer, but more transparent, without infringing on the environmental integrity of the regime.
Okubo, Y. and A. Michaelowa, 2009. Subsidies for CDM: past experience with capacity building, Climate Strategies <www.climatestrategies.org/our-research/category/39/132.html>Given the lack of CDM activities in least developed countries, subsidization of CDM projects has beensuggested as a remedy. To date, the only experience with subsidies in the CDM context has beenrelated to capacity building funded by donor agencies. The paper finds that targeted capacity building programs, such as establishment of the DNA have been successful, but project development support did not really deliver in most of thecountries.
Seres, S. (2008). Analysis of Technology Transfer in CDM Projects, prepared for UNFCCC Registration and Issuance Unit, in consultation with E. Haites.This report analyses the claims of technology transfer made by project participants in PDDs for 3296 registered and proposed CDM projects.
16
Join
t Im
plem
enta
tion
Qua
rter
ly •A
pril
2009
27-29 May 2009, Carbon Expo 2009 - Global Carbon Market Fair & Confer-ence, Barcelona, SpainOrganised by World Bank, International Emissions Trading Association, Fira Barcelona and Kölnmesse.Contact: Ms Julia Schmidt and Ms Kristina Kuschmann, press team Carbon Expo, email: [email protected]; Internet: www.carbon-expo.com.
1-12 June 2009, UNFCCC SB sessions and AWG Bonn, GermanyThirtieth sessions of the UNFCCC Convention subsidiary bodies - SBSTA and SBI, eighth session of the AWG-KP and sixth session of the AWG-LCA Contact: http://unfccc.int/meetings/items/2654.php
16-17 June 2009, ADB High-level Dialogue, Manilla, PhilippinesHigh-level Dialogue: Climate Change in Asia and the Pacific: a development challenge.Contact: Ms Elizabeth del Mundo, ADB, tel.: +632 632 6788, e-mail: [email protected]
24-26 August 2009, Climate Change & Business, Melbourne, Australia5th Australia-New Zealand Climate Change and Business ConferenceContact: www.climateandbusiness.com
14-16 September 2009, Nairobi, KenyaInternational Workshop on Small-scale Wind Energy for Developing Countries.Contact: Prof. Joseph M. Keriko, Inst. of Energy and Environmental Technol-ogy, Nairobi, Kenya, e-mail: [email protected]
AbbreviationsAAU Assigned Amount UnitAIJ Activities Implemented Jointly under the pilot phaseAnnex A Kyoto Protocol Annex listing GHGs and sector/source categoriesAnnex B Annex to the Kyoto Protocol listing the quantified emission limitation or reduction commitment per PartyAnnex I Parties Industrialised countries (OECD, Central and Eastern European Countries, listed in Annex I to the UNFCCC)Annex II Parties OECD countries (listed in Annex II to the UNFCCC)non-Annex I Parties Developing countriesCCS Carbon Dioxide Capture and StorageCDM Clean Development MechanismCDM EB CDM Executive BoardCER Certified Emission Reduction (Article 12 Kyoto Protocol)COP Conference of the Parties to the UNFCCCDOE Designated Operational EntityDNA Designated National AuthorityERs Emission ReductionsERPA Emission Reduction Purchase AgreementERU Emission Reduction Unit (Article 6 Kyoto Protocol)EU ETS European Union Emissions Trading SchemeEUA European Union Allowance (under the EU ETS)GHG Greenhouse GasIET International Emissions TradingITL International Transaction LogJI Joint ImplementationJISC Joint Implementation Supervisory CommitteeKP Kyoto ProtocolLULUCF Land Use, Land-Use Change and ForestryMethPanel Methodology Panel to the CDM Executive BoardMOP Meeting of the Parties to the Kyoto ProtocolPIN Project Information NotePDD Project Design DocumentSBSTA UNFCCC Subsidiary Body for Scientific and Technological AdviceSBI UNFCCC Subsidiary Body for ImplementationUNFCCC UN Framework Convention on Climate Change
The Joint ImplementationQuarterly is an independentmagazine established to exchangethe latest information on theKyoto mechanisms and emissionstrading. JIQ is of special interest topolicy makers, representativesfrom business, science and NGOs,and staff of internationalorganisations involved in theoperationalisation of the Kyotomechanisms, including emissionstrading.
Chief Editor:Prof. Catrinus J. JepmaUniversity of Groningen/ OpenUniversity, Dept. of Economics, the Netherlands
Editors:Wytze van der GaastAnna van der Gaast-WitkowskaEise Spijker
International Advisory Board:Prof. José Goldemberg, Universidade de Sao Paulo,BrazilProf. Thomas Ch. Heller Stanford Law School, USAProf. Richard Samson Odingo, University of Nairobi, KenyaDr. R.K. Pachauri
Tata Energy Research Institute, India
Mr. Michel Picard Lafarge, France
Prof. Maciej Sadowski IEP, Poland
Dr. Ye Ruqiu State Environmental Protection Administration, China
JIQ contact information:Joint Implementation NetworkEnergy Business PlazaLaan Corpus den Hoorn 3009728 JI GroningenThe Netherlandstel.: +31 50 5248430fax: +31 50 309 6814e-mail: [email protected]: www.jiqweb.org