61


Vol. 22, No. 2, July, 2014
(Published in October 2016)
BANGLADESH JOURNAL OF
RADIOLOGY AND IMAGING
Annual Subscription : Tk. 200.00 for local and US$ 20.00 for Overseas Subscribers
Official Publication of Bangladesh Society of Radiology and Imaging33, Topkhana Road, Meherba Plaza, L-5th Floor, Dhaka-1000, Bangladesh
Phone : 8613189, 9126995E-mail: [email protected] Website: www.bsribd.org
EDITORIAL BOARD
Editor in Chief :
Prof Abu Saleh Mohiuddin
Co-Editors:
Dr Shamim Ahmed
Prof Shibendu Mojumder
Col Zoherul Islam
Executive Editor:
Prof Md Mizanur Rahman
Executive Members:
Prof Md Enayet Karim
Prof Mahfuzur Rahman
Prof Farid Ahmed
Dr Delwar Hossain
Dr Mobarak Ali
Dr Sarwar Ramiz
Dr Syed Maksumul Haque
Dr Nilkantha Paul
Dr Mahmud Uz Jahan

EXECUTIVE COMMITTEE
President
Prof Syed Mizanur Rahman
Vice - President
Prof Brig Gen (Rtd) Jahangir AlamProf Md Enayet Karim
Prof Abu Saleh Mohiuddin
Secretary General
Prof Dr Md Mizanur Rahman
Treasurer
Prof Shibendu Mojumder
Joint Secretary
Dr Shahryar Nabi
Organizing Secretary
Dr Md Shahidul Islam
Office Secretary
Dr Md Khalilur Rahman
Scientific Secretary
Dr Shamim Ahmed
Secretary for International Affairs
Prof Salahuddin Al Azad
Entertainment Secretary
Dr Bishwajit Bhowmick
Members
Dr Md MofizullahDr Syed Maksumul HaqDr Bibekananda HalderDr Mahmood-Uz-Jahan
Dr Robindranath Sarker (Robin)Dr Fatema Doza
Dr Sushanta Kumar SarkarDr Bidoura TanimDr Asish Sarkar
BANGLADESH SOCIETY OF
RADIOLOGY AND IMAGING

Bangladesh Journal of Radiology and Imaging a
biannual (January and July) journal, is the official
Journal of Bangladesh Society of Radiology and
Imaging.
Each issue will include original articles, review
articles, case reports and any other articles of
interest in Radiology and Imaging.
Manuscripts must be in English and should be
submitted to the Editor.
The manuscript should be in accordance with
the modified Vancouver (Ref. Bangladesh J of
Radiol 1993; (Vol. 1(1): 27-34 and be submitted in
two copies with two sets of illustrations.
Manuscripts should be accompanied by a
covering letter from the author who will be
BANGLADESH JOURNAL OF
RADIOLOGY AND IMAGING
Prof Nazrul Islam
Prof Hashem Ali
Prof Rezaul Mostofa
Prof ASQM Sadeque
Prof MA Bashar
Prof MI Mondol
Prof (Big Gen Rtd) Chowdhury Abdul Gaffar
Prof Abdul Matin Khan
Prof Syed Abdul Matin
Prof Akhter Uddin Ahmed
Prof MA Quddus
Prof M Mahabubur Rahman
Prof Nasiruddin Miah
Prof (Big Gen Rtd) Jahangir Alam
Prof (Big Gen Rtd) Zuberul Islam
Prof Shafiqur Rahman
ADVISORY BOARD
Information for Contributors
responsible for correspondence regarding
manuscripts.
Papers will be accepted for publication provided
they are submitted solely with Bangladesh
Journal of Radiology and Imaging and are
subject to review and editorial decisions.
Statement and opinion expressed in papers are
those of author(s) and the editor(s) or publisher
bears no responsibility of such matter.
All decisions to accept, revise or refer a paper
will be made by the editorial board.
The paper which will not be accepted for
publication will not be returned back to the
author. No reprint will be provided.

INSTRUCTION TO AUTHORS
Authors are requested to follow Vancouver’s
style (N Engl J Med 1997; 336: 309-15) of writing
as outlined below, while submitting articles for
publication in BSRI Journal.
Preparation of manuscript : Typed
manuscript on white bond paper in quadruplicate
with margins of 2.5 cm is to be submitted.
Double spacing should be used throughout.
Pages are to be numbered consecutively,
beginning with the title page in the right upper
corner of each page.
Title page : The title page should contain the
title of the article, rank, name of authors with
academic qualification, word count of text and
abstract. It should also contain the name and
address of the author with whom
correspondence is to be made. The full name with
serial order of the authors written in write corner
as superscript. e.g., Calvin a Shadaw1, Mohammad
Selim Newas2 will be the format of placing the
name of the authors below be title.
Abstract : The abstract should be unstructured
and should state the purpose of the study orinvestigation, basic procedure, main findings and
the principal conclusion. It should be limited to
300 words for a review article. For original and
leading article, it should be less than 250 words.
For case report and short communication it
should not exceed 150 words.
Text : The text of the article should be divided
into sections with the following heading;
introduction, materials and methods, results,
discussion and conclusion.
Size of the article / Text : The size of review
article should be less than 3,000 wordsexcluding the abstracts, tables, illustrations,references and acknowledgment. For originalarticle or leading article it should be within
2,000 words. For case report the upper limit
should be 1000 words. For short communication
it should not exceed 600 words.
Tables and Illustrations : Tables and
illustrations should be self-explanatory and
supplementary but not duplication of the contents
of the text. Each table / illustration is to be typed
on a separate sheet, numbered in Roman
numeric and attached at the end of the test.
Tables should not have more than 3 horizontal
lines and no vertical lines. Photographs should
be clear, glossy and uncounted, diagrams and
graphs are to be in Indian ink. The number should
not exceed 10 for review article, 06 for original
article and 03 for a case report.
Acknowledgement : Only those persons who
have made substantial contributions to the article
should be acknowledged.
Reference: References are to be numbered
consecutively in the order in which they appear in
the text. Number of references for review article
should be less than 50 and for original article less
than 25. For case report and short communication
it should be less than 10. The forms of the
references should be as per examples below :
References from Journal : References should
be written according to the following sequence e.g.
authors (s) name, subject, name of Journal with
year of publication, volume number, page ‘
number. If there are six authors or less, names of
all the authors should be written. When there are
seven authors or more the first three names will
be listed and then word “et al” to be added. `
Example : Calne L, Swells J D, Somford RD, et al.
Further observation on renal transplantation in
man from cadaveric donors. BMJ 1996; 218: 1345-
1351.
References from books and monograph : In
case of personal authors(s) reference should be
written in the following sequence : author(s) name,
name of the books, number of edition, place by
publication, name of the publisher, year of
publication, pages, Example : Rhoder AJ. Text
Book of Virology. 5th ed. Balgimpore : Wilkins;
1968. P 469-465. In case of reference from books
edited by one and chapter written by some one;
the reference should be written in the following
sequence : name of author(s) name of chapter, name

of editor, name of books, place of publication, name
of publisher, year of publication, pages.
Examination : Insel PA. Analgesics antipyretics,
and anti-inflammatory agents. In: Gilman AG, Rall
TW. Nies AS, Tailor P, Editors, The
Pharmacological Basis of Therapeutic Singapore :
Pergamon Press; 199. p. 638-661.
Reference from dissertation or thesis : The
reference should be made in the following
sequence : name of author(s), subject, place of
publication, name of institute, year of study,
pages, Example :Tableb NA Bacteriological study
of diarrhoea in Bangladesh Thesis). Dhaka,
IPGM&R 1990. 65-90.
Reference of articles of magazines : The
reference should be made in the following
sequence : name of author(s), name of the
subject, name of the magazine, year and date,
pages. Example : Touche B. Annals of Medicine :
The santa claus culture. The new York 1991;
Sep. 4: 66-81.
Number of Authors : the number of authors
should be limited to 04, 05, and 08 for case
report, review article and original articles
respectively.
Check List : The authors should deposit the
following documents to the editorial board.
a. Letter of submission / forwarding letter.
b. A certificate stating that the contents of the
articles has not been published in any journal
and it has not been submitted to any otherjournal for publication.
c. A certificate from the head of the institutionwhere the original work has been done.
d. A specified certificate given by HigherHeadquarters.
e. Title - 05 copies
f. Abstract - 05 copies
g. Text of article - 05 copies
h. Table and illustration duly numbered
i. References
j. Compact Disc (CD) / Pendrive
k. Bio-data of principal authors.
Misc :
a. Preferably from one author there should not bemore than two case reports and one reviewarticle in a single issue of journal
b. Corresponding author’s & other authors ‘ nameand address should be printed in left lower cornerof the first page of the article.
CONTENTS
Editorial
l PACS (Picture archiving and communication system) 53Mariyam Sultana
Original Articles
l Comparison of Superior Mesenteric Arterial Index in Diabetic Patients with 55Pancreatic Calculi Before and After Meal and Those of Control Subjects
Fahmida Yeshmine, Mahbuba Hussain, Sharmistha Dey, Md Towhidur Rahman,
Abu Saleh Mohiuddin, Rehnuma Jahan, Khabir Ahmed, Shafiul Azam
l Correlation between Volume of Hippocampal Formation & Age, Sex of 60Adult Subjects with Normal MRI of Brain
Md Towrit Reza, Misbah Uddin Ahmed, Shahryar Nabi, Md Shahidul Islam, Khadija Begum,
Mohammed Mahbub Ullah, AKM Golam Kabir, Khabir Ahmed, Sushanta Kumar Sarkar
l Performance of Magnetic Resonance Imaging in the Diagnosis of 68Tuberculous Spondylitis
Nazma Farzana Chowdhury, Md Mizanur Rahman, Robindranath Sarker,
Maj Maksuda Khanom, Gopal Chandra Saha, Akanda Fazle Rabbi, Md Anisur Rahman
l Evaluation of Accuracy of Transvaginal Sonography in Diagnosis of 74Adenomyosis with Histopathological Correlation
Tarana Yasmin, Mashah Binte Amin, Sheuly Begum, Asish Kumar Sarkar, Aurobindo Roy,
Md Anisur Rahman Khan, Md Khalilur Rahman
l Role of Color Doppler and High Resolution Sonography in the Prediction of 81Malignant Thyroid Nodules with Cyto and Histo-pathological correlation
Maksuda Begum, Molla Ershadul Haque, Mahbub Alam, Shahidul Islam, Rasheda Pervin
Bidoura Tanim, Md Anisur Rahman
l Evaluation of Outcome of Management of Giant Cell Tumour of Bone by 88Curettage, Chemical Cauterization and Morcellized Bone Graft in Sandwich
Technique Augmentation with Bone Cement
Imam Gaziul Haque, Hasan Masud, Sk Nurul Alam, M Sajjad Hossain,
Shahryar Nabi, Shamim Ahmed
Case Reports
l Macrodystrophia Lipomatosa - Case Report 93Fonindra Nath Paul, Mohammad Mizanur Rahman, Md Anisur Rahman Khan,
Dosth Mohammad Lutfur Rahman, Zannatul Ferdous
l Isolated Polysplenia in Adult Patient-A Case Report with Review of the Literature 96Ashraf Uddin Khan, Mariyam Sultana, Shibendu Majumder
l Carotid Cavernous Fistula (CCF): A Case Report 100Syed Zoherul Alam
l Orbital Plexiform Neurofibroma – A Case Report 103Zinat Nasrin, Abul Khair Ahmedullah, Fonindra Nath Paul
BANGLADESH JOURNAL OF
RADIOLOGY AND IMAGING
Volume 22 Number 2 July, 2014

BANGLADESH JOURNAL OF RADIOLOGY AND IMAGING 2014; VOL. 22(2): 53
EDITORIAL
According to Journal of the American Medical
Informatics Association Volume 1 Number 5 Sep /Oct 1994 the summary of the Benefits of the PictureArchiving and Communication System (PACS) are
• Category 1- benefits to the diagnostician
- Improved access to current patient records.
- Improved access to patient history records
- File integrity and speed of retrieval
- Better diagnosis
• Category 2- benefits to the referring physician
- Better patient management/earlierintervention
- Better patient outcome in reduced lengthof stay
- Reduced legal costs due to maladminis-tration claims based on loss of films, lackof patient history, etc.
• Category 3-benefits to the patient
- Reduced radiation exposure from x-rayequipment
- Shorter examination times
- Reduced radiation exposure as a result ofless need for retakes of images
- Reduced patient inconvenience inattending hospitals for examinations andreexaminations
- Reduced chance of adverse reaction tocontrast agents
• Category 4- benefits to the hospital
- Better communication with physicians
- Better hospital administration & bettertraining of radiology and other studentsthrough access to on-line image files andto digital teaching files
- Greater staff retention
The traditional film based system existing inBangladesh is facing array of shortcomings anddrawbacks such as high turnaround time, film loss
PACS (Picture archiving and Communication System)
... Continuation from previous issue
and high cost of generation, storage and transport:
as is noted in many countries. PACS have the
potential for immense rationalization of operations
in radiology and hence for the improvement of
health care, as well as the return of investments.The combined PACS-RIS-HIS web browsertechnology can access images through a short termPACS server and can display them even onordinary desktop personal computers. This hasprovided a cheap and easy means of reviewingimages with much ease. Moreover, the facility ofremote and multiple accesses of all digital imagesand image manipulation, cases can be sharedthrough e-mail or other means and can be usedfor teaching also.
In spite of huge benefits, the practical applicationof such a system is indeed not straight forward fora developing nation with limited resources. Thepractical implications of the lack of basictechnology, network infrastructure, qualifiedpersonnel, strategy and legal backing need to beaddressed very carefully. Consideration must begiven to local issues, improvement of basictechnology, organizational factors, staffing, humanaspects and attitude, policy and legislation forproper implementation of the system
We can confidently assume the near future, wherethe ongoing film based systems inevitably will becomeobsolete in such a way that one may search the “last
remaining film” in the “dark room museum”.
Mariyam Sultana
Medical Officer
Department of Radiology & Imaging,
Dhaka Medical College Hospital
References :
1. Shawn H. Becker, Ronald L. Arenson . Costs andBenefits of Picture Archiving and CommunicationSystems. Journal of the American MedicalInformatics Association. 1994; 1:5.
BANGLADESH JOURNAL OF RADIOLOGY AND IMAGING 2014; VOL. 22(2): 55-59
ORIGINAL ARTICLES
Abstract
Objective: This study was performed to compare
superior mesenteric Arterial Resistive Index in
diabetic patients with pancreatic calculi before and
after meal and those of control subjects. Method:
This cross sectional study was attempted on 80
subjects aged 16 to 36 in the Department of
Radiology & Imaging, BIRDEM from January
2012 to December 2013. Out of them 38 diabetic
patients with pancreatic calculi were considered
as case group and 42 healthy subjects as control
group with compatible age, sex and weight. To
eliminate the bias Doppler study was performed
first by the investigator herself and subsequently
confirmed by a senior radiologist in the
Department of Radiology & Imaging, BIRDEM.
Doppler findings were recorded from superior
mesenteric artery. Result: In this study the mean
fasting RI was 0.85 with standard deviation (SD)
±0.02 and their range was from 0.89 to 0.82 in
control group. In case group the mean RI was 0.79
with standard deviation (SD) ±0.03 and their range
was from 0.74 to 0.85. The fasting mean RI
difference were found statistically significant
(p<0.05) between control group and case group in
unpaired t-test.The mean postprandial RI was 0.72
with standard deviation (SD) ±0.04 and their range
was from 0.80 to 0.66 in control group. In case
group the mean RI was 0.74 with standard
Comparison of Superior Mesenteric Arterial
Index in Diabetic Patients with Pancreatic
Calculi Before and After Meal and Those of
Control SubjectsFAHMIDA YESHMINE1, MAHBUBA HUSSAIN2, SHARMISTHA DEY3, MD TOWHIDUR RAHMAN3,
ABU SALEH MOHIUDDIN4, REHNUMA JAHAN5, KHABIR AHMED6, SHAFIUL AZAM7
1. Assistant Professor, Dept. of Radiology & Imaging, BIRDEM, Dhaka, 2. Registrar, Dept. of Radiology & Imaging,
BIRDEM, Dhaka, 3. Assistant Professor, Dept. of Radiology & Imaging, BIRDEM, Dhaka, 4. Professor and head of
the Dept. of Radiology & Imaging, BIRDEM, 5. Consultant, Department of Obs & Gynae, Square Hospital Limited.
6. Senior Consultant, Department of Radiology & Imaging, Noakhali 250 Bedded General Hospital. 7. SeniorConsultant, Department of Radiology & Imaging, Narayanganj 300 Bedded General Hospital.
deviation (SD) ± 0.049 and their range was from
0.84 to 0.68. The postprandial mean RI difference
were statistically significant (p<0.05) between
control and case group in unpaired t-test.
Conclusion: In this study it can be concluded
that there is statistically significant difference in
reduction of Superior Mesenteric Arterial
Resistive Index before and after meal evaluated
by Duplex Color Doppler Ultrasound in diabetic
patients with pancreatic calculi compared to healthy
subjects.
Key word: Diabetic patient with pancreatic calculi
- Duplex Color Doppler Ultrasound - Superior
mesenteric artery.
Introduction
In developing countries peculiar forms of diabetes
associated with under nutrition have been reported
since the beginning of the century. Conflicting
criteria and various clinical presentation of the
disease lead to confusion in proper characterization
of these forms of diabetes.
According to WHO and American Diabetic
Association (ADA) classification (1985) etiologically,
Diabetes Mellitus is of five types: 1. Insulin
Dependent Diabetes Mellitus 2.Non-Insulin
Dependent Diabetes Mellitus 3. Malnutrition
Related Diabetes Mellitus(MRDM) 4. Gestational

Diabetes Mellitus and 5. Diabetes associated with
other condition and syndrome.1
MRDM has again been subdivided in two groups.
1) Fibro-calcific Pancreatic Diabetes (FCPD) and
2) Protein Deficient Diabetes Mellitus (PDDM).
Pancreatic Calculi with Diabetes is also known as
Fibro-calcific Pancreatic Diabetes (FCPD). In 1997,
WHO and ADA expressed that FCPD is secondary
diabetes. Pancreatic calculi develop from calcium
deposits as result of chronic pancreatitis and can
block the pancreatic duct which connects the
pancreas with small intestine. The flow of digestive
enzymes released by pancreas cannot pass into the
intestine and its secrated hormones that regulate
blood sugar can be affected.
Most of the patients are in age of 10-30 years when
the diagnosis is made but FCPD may occur in
infants, children and elderly.2,3 The clinical picture
of FCPD consists of the four cardinal features ;
abdominal pain , pancreatic calculi , maldigestion
leading to steatorrhoea and diabetes.
The diagnosis of FCPD is usually made during
investigations for pain in the abdomen. Test of
pancreatic structure includes: Ultrasound,
Endoscopic Ultrasonography, Computed
Tomography, Endoscopic Retrograde Cholangio-
pancreatography (ERCP) and Magnetic Resonance
Cholangiopancreatography (MRCP).4
The diagnosis is based on combination of clinical
evaluation and imaging studies. In advanced
disease, a plain film of abdomen or a computerized
tomography may show pancreatic calcification and
establish the diagnosis. In early case demonstration
of ductal changes through ERCP or MRCP will
establish the diagnosis. Pancreatic function tests
are indeed the most sensitive test to detect the
earliest changes in exocrine pancreas but they may
be abnormal in any causes of pancreatic inefficiency
e.g. cystic fibrosis and necessarily chronic
pancreatitis. Many approaches have been used to
determine the etiology of pancreatic disease and
have strengths and limitations. Histology remains
the gold standard for defining pathology but this
approach is limited by danger of pancreatic biopsy.
In a study by Anderson it was found that an
ultrasound scanning combined with the pulsed
doppler technique can non-invasively monitor the
alterations in blood flow velocity.5 Applied to the
superior mesenteric artery (SMA), the method
confirms that blood flow in this vessel increases in
response to a meal.
Hornum et al observed that blood flow in SMA
increases after meal due to vasoactive effect of the
decomposed food but in exocrine pancreatic
insufficiency the digestion of food is compromised6.
Patients with end stage chronic pancreatitis are
characterized by mal-digestion due to exocrine
pancreatic insufficiency; the reduced intra luminal
food digestion is mirrored in the mesenteric blood
flow. These patients would show less postprandial
increased in mesenteric blood flow. The Resistive
Index (RI) in the SMA was determined before and
after meal. The RI reflects the downstream
circulatory resistance, giving a precise description
of hyperaemia. Patients with exocrine pancreatic
insufficiency unexpectedly had lower fasting RI
than control, 0.818 vs. 0.851 respectively.
Postprandial there was significantly less decrease
in RI (less increase in flow) in patients with
exocrine pancreatic insufficiency than control, 0.055
vs. 0.099. There was a significant trend for a less
pronounced postprandial disease in RI with more
impaired pancreatic function. The postprandial shift
in Doppler velocity pattern might be used in the
diagnosis and monitoring exocrine pancreatic
insufficiency.
The diagnosis of extent and nature of blood flow
abnormality is important in the evaluation and
management of FCPD patients. Intra arterial digital
subtraction angiography has been considered the
gold standard in diagnostic imaging for the
evaluation of SMA but it is invasive and expensive7.
Ultrasound is now both competitive and
complementary to angiography for many arterial
Bangladesh Journal of Radiology and Imaging Vol. 22(2): July 2014
56

investigations even when the circulation is
seriously compromised8.
Material & Method
This cross sectional study was carried out in the
Dept. of Radiology & Imaging, BIRDEM from
January 2012 to December 2012. This study
included 38 diabetic patients with pancreatic
calculi, sent from Dept. of Gastroenterology,
BIRDEM, clinically, biochemically & radiologically
confirmed as case group and 42 healthy patients
as control group. The equipment used was
Siemens Sonoline machine with 3.5 MHz
transducer. Gray scale imaging was performed
first to obtain an overview anatomy of pancreas
and superior mesenteric artery. Then Doppler
study was done.
Prior to the commencement of this study the
research protocol was approved by the Ethical
Committee. The objective of the study had been
discussed in details with the case & control group
before they decided to enroll themselves in the
study. It was assumed that all information and
records would be kept confidential and the
procedure would be helpful for both the surgeon
and the patient in making rational approach in
the case management. Color Doppler study and
spectral analysis of superior mesenteric artery
were performed first by the investigator herself
and subsequently confirmed by a radiologist of the
department separately to eliminate biased
judgment.
Data were collected from primary source starting
from the clinical history, Duplex color Doppler
findings, and spectral analysis by predesigned
structured data collection sheets. Statistical
analyses of the results were done by computer
software device statistical packages for social
scientists (SPSS). The results were presented in
tables. For significant difference unpaired t-test
and Chi square tests were used. A ‘p’ value <0.05
was considered significant.
Result:
Total 80 subjects were included in this study
according to the criteria mentioned in material
and method. The findings derived from data
analysis are given below.
Table I
RI of the study subjects (Control = 42, Case = 38)
Subjects Control Case Statistical Analysis
Fasting [ Mean ± SD] 0.85 ± 0.02 0.79 ± 0.03 p = 0.003
Range (Max. – Min.) 0.07(0.89 - 0.82) 0.11 (0.85–0.74)
Postprandial [ Mean ± SD] 0.72 ± 0.04 0.74± 0.049 p = 0.046
Range (Max. – Min.) 0.26 (0.80 – 0.66) 0.16(0.84–0.68)
P value of <0.05was considered significant
Table II
Decrease in RI of the study subjects before and after meal (Control = 42, Case = 38)
Subjects Mean ± SD Range (Max. – Min.) Statistical Analysis
Control 0.10 ± 0.05 0.11(0.16-0.05) p = 0.0275
Case 0.04 ± 0.047 0.06 (0.11-0.05) p = 0.0275
p value of <0.05was considered significant
Comparison of Superior Mesenteric Arterial Index in Diabetic Patients Fahmida Yeshmin et al
57

Discussion
This cross sectional study was done to compare
the Resistivity Index (RI) of Superior Mesenteric
Artery (SMA) in clinically diagnosed patients of
Pancreatic Calculi with Diabetes and control
healthy patients in order to observe the decrease
of blood flow in superior mesenteric artery after
meal in both groups, in the Dept. of Radiology &
Imaging, BIRDEM. For this purpose 38 cases and
42 controls were enrolled as subjects. Duplex Color
Doppler sonography of SMA was carried out in both
groups to measure the Resistivity Index (RI).
Observations of the study were analyzed to
compare the RI values of SMA of case and control
group.
RI was used to characterize downstream
circulatory resistance in the SMA. It was calculated
from two Doppler shift frequencies measured in
the same image and was independent of the angle
of insonation. Regarding decrease of RI, it was
observed that RI decreased about 0.01 with a
standard deviation (SD) ±0.05 and their range was
from 0.16 to 0.05 in control group whereas in case
group, RI decreased 0.04 with a standard deviation
(SD) ±0.047 and their range was from 0.11 to -0.05.
Unpaired t-test revealed that the difference in
decrease of RI was found statistically significant
(p<0.05) between control and case group. The mean
fasting RI was 0.85 with standard deviation (SD)
0.02 and their range was from 0.89 to 0.82 in
control group which is in agreement with results
from other studies conducted by other authors also6,9,10. In case group the mean RI was 0.79 and the
fasting RI was from 0.74 to 0.85. The fasting mean
RI difference was found statistically significant
(p<0.05) between control and case group. This result
is very much similar to the study conducted by
Hornum et al where the fasting RI in the SMA
was significantly lower than controls, 0.82 in both
groups. This suggests a more dilated vascular bed
peripherally in the SMA territory in the fasting
state in patients with chronic pancreatitis. This
has not been previously reported, and further
studies are needed to confirm this incidental
observation. It could be speculated that in chronic
pancreatitis the mechanisms that regulate the flow
in the SMA are adapted to a weaker stimulus from
the digested food components. If other studies
confirm this observation, it might be considered
worthwhile to determine RI in the SMA routinely
in all fasting upper abdominal studies, or at least
in studies without an obvious diagnosis. An
unusually low RI would suggest undetected
abdominal pathology like inflammatory bowel
disease or chronic pancreatitis. After the meal RI
decreased less (downstream resistance decreased
less) in patients with pancreatic calculi compared
to patients with preserved exocrine function or to
healthy controls. The mean postprandial RI was
0.72 compared to case group where the mean RI
was 0.74. The fasting RI difference was found
statistically significant (p<0.05) between control
and case group.
The study confirms the hypothesis of a reduced
postprandial increase in SMA flow in patients with
exocrine pancreatic insufficiency. Further studies
are needed to evaluate whether the meal induced
shift in RI in the SMA can be used in the diagnosis
and monitoring of chronic pancreatitis.
Conclusion:
From the finding of the present work it is
conceivable that pancreatic calculi affects the
mesenteric arterial flow which can be detected by
non invasive Duplex Color Doppler imaging which
may help in proper patient management . However
further study can be carried out by including large
number of study subjects along with CT/MRangiography.
References
1. WHO study group report on DiabetesMellitus. WHO Technical Report series no727, Geneva WHO 1985.
2. Mohan V, Ramachandran A, BishwanathanM 1989, “Childhood Onset FIbrocalculousPancreatic Disease”, Assoc Physician India,vol. 37,pp. 342-345.
3. Mohan V, Suresh S, Suresh et al 1989,”Fibrocalculous Pancreatic Diabetes inElderly”, Assoc Physician India, vol. 37, pp342-345.
4. Mohan V, Nagalotimath SJ, Yajnik CS et al1998, “Fibrocalcific Pancreatic Diabetes”,
Metabe, vol. 14, pp. 153-170.
Bangladesh Journal of Radiology and Imaging Vol. 22(2): July 2014
58

5. Anderson TC, Pederson JF, Nordentoft T,
Olsen O 1999, “Fat and mesenteric blood
flow”, Scand J Gastroenterol , vol. 34, pp. 894-
897.
6. Hornum M, Larsen S, Olsen O, Pedersen J F
2006, “Duplex Ultrasound of the SuperiorMesenteric Artery in Chronic Pancreatitis”,
The British Journal of Radiology, vol. 79, pp.
804-807.
7. Abnay A, Bedi VS, Indrajit IK, Souza JD 2003,“Evaluation and Management of PeripheralArterial Disease in Type 2 Diabetes Mellitus”,
In J Diab Dev Ctries, vol. 23, pp. 62-66.
8. Goss DD 2001, Limb Arteries, In: Meire H,
Cosgrove D, Dewbury K, Farrant P, Clinical
Ultrasound : A Comprehensive Text, 2nd
edition. Churchill Living Stone, Philadelphia,
vol. 2, pp. 1001-1034.
9. Yekeler E, Danalioglu A, Movasseghi B,
YIlmaz S, Karaca C, Kaymakolgu S, Acunas
B 2005, “Crohn Disease Activity Evaluated by
Doppler Ultrasonography of the Superior
Mesenteric Artery and the Affected Small
Bowel Segments”, Ultrasound Med, vol. 24,
pp. 59-65.
10. Perko MJ 2006, “Duplex Ultrasound for
Assessment of Superior Mesenteric Artery
Blood Flow”, Eur J Vasc Endovasc Surg, vol.
21, pp. 106-117.
Comparison of Superior Mesenteric Arterial Index in Diabetic Patients Fahmida Yeshmin et al
59

BANGLADESH JOURNAL OF RADIOLOGY AND IMAGING 2014; VOL. 22(2): 60-67
Correlation between Volume of Hippocampal
Formation & Age, Sex of Adult Subjects with
Normal MRI of BrainMD TOWRIT REZA1, MISBAH UDDIN AHMED2, SHAHRYAR NABI3, MD SHAHIDUL ISLAM3,
KHADIJA BEGUM4, MOHAMMED MAHBUB ULLAH5, AKM GOLAM KABIR6 , KHABIR AHMED7,
SUSHANTA KUMAR SARKAR8
1. Consultant Radiology (CC), Faridpur Medical College Hospital, Faridpur, 2. Associate Professor, Department of
Radiology & Imaging, Mymensingh Medical College & Hospital, Mymensingh, 3. Assistant Professor, Department
of Radiology & Imaging, Dhaka Medical College & Hospital, Dhaka, 4. Medical Officer, Department of Radiology &
Imaging, Mymensingh Medical College & Hospital, Mymensingh, 5. Radiologist, National Institute of Cardiovascular
Diseases and Hospital (NICVD) Dhaka. 6. Assistant professor, Department of Radiology & Imaging, National
Institute of Neuroscience, Dhaka, 7. Senior consultant, Department of Radiology & Imaging, Noakhali 250 beddedGeneral Hospital, 8. Assistant Professor, Department of Radiology & Imaging, Shaheed Tajuddin Ahmad Medical
College, Gazipur, Dhaka.
Abstract:
Objective: To find out the correlation between MRI
measured volume of hippocampal formation with
age, sex of adult individuals.
Methodology: This descriptive study was carried
out on 47 healthy adult subjects referred to the
Department of Radiology and Imaging of National
institute of Ophthalmology (NIO) for evaluation of
brain with different complaints during July 2009
to June 2011. Detailed history, clinical
examinations with special attention to nervous
system and volume of hippocampal formation were
measured by MRI. Unpaired t-test and Pearson’s
correlation coefficient were used to assess the
correlation between hippocampal formation with
age by using the Statistical Package for Social
Sciences version 20.0 for Windows (SPSS Inc.,
Chicago, Illinois, USA).
Result: Majority (27.7%) the subjects were in 4th
decade and the mean age was 37.5±12.5 years. Male
female ratio was 1.5:1. The mean volume was
3984±164mm3 with range from 3406 to 4227 mm3
in the whole study subjects. A significant negative
Pearson’s correlation coefficient (r= -0.566; p=0.002)
was observed between volume of hippocampus
formation with age in male subject, but no
correlation (r =0.204; p=.237) was found in female
subject. The mean (±SD) volume of hippocampus
formation was 4182±31.1 mm3 in 2nd decade and
3926±141.1 mm3 in 6th decade and onward in male
subjects, which was significantly (p<0.05) less in
older age group in male subjects. Similarly, in
female subjects, the mean (±SD) volume of
hippocampus formation was 3843±68.59 mm3 in 2nd
decade and 3963 mm3 in 6th decade and onward in
female subjects. The mean volume of hippocampus
formation was almost similar in early age and older
age in female subjects.
Conclusion: There is an association between
hippocampal formation with age in male i.e. the
volume decline with age increased in male appeared
to be linear but no correlation observed in female
subjects.
Key Word: Hippocampal formation, MRI brain,
volume change, temporal lobe.
Introduction
The hippocampal formation is a compound
structure in the medial temporal lobe of the brain.
There is currently no consensus concerning which
brain regions are encompassed by the term, with
some authors defining it as the dentate gyrus, the
hippocampus proper and the subiculum1 and others
including also the pre-subiculum, para-subiculum
and entorhinal cortex2. The hippocampal formation
is thought to play a role in memory and control ofattention. The neural layout and pathways within
the hippocampal formation are similar in all
mammals.

Correlation between Volume of Hippocampal Formation & Age, Sex of Adult Subjects Md Towrit Reza et al
61
Magnetic Resonance Imaging (MRI) provides a non-
invasive method for investigating brain
morphology. Within the medial temporal lobe,
special attention has been paid to the hippocampus
(HC) and amygdala (AG) because of their role inmemory, depression, emotion and learning3.Volume changes in these areas have been observedin conjunction with certain disease states, such astemporal lobe epilepsy (TLE), Alzheimer’sdementia, mild cognitive impairment,schizophrenia, post-traumatic stress disorder anddepression. Its volume, morphology, innerstructure and functions are of scientific and clinicalinterest4.
Magnetic resonance imaging (MRI) has become themethod of choice for the examination of
macroscopic neuro-anatomy in vivo due to excellent
levels of image resolution and in between tissue
contrasts. MRI is a widely employed tool in neuro-
radiological workup regarding changes in brain
anatomy, volumes and cerebral function including
the hippocampus5. A wide variety of software
packages are available for viewing and appraisingMR images, for reformatting the images in threedimensions so as to obtain sections with a
particular orientation through the body and for
making both simple and more sophisticated
measurements of regions of interest, compartments
and individual structures.
Aging has also been shown to result in gray mattervolume loss of the overall brain, including the HCwith regard to gender specificity, results suggestlarger shrinkage for men of brain gray matter. Asignificant negative correlation with age for bothleft and right HC was found in men but not inwomen. The volume decline in men appeared tobe linear, starting at the beginning of the thirdlife decade and approximating 1.5% per annum. Itwas shown that changes with age occurred mostly
in the head and tail of the HC. There is also
significant difference between male and female
hippocampus. This finding underscores the need
to include socio-demographic variables in functional
and anatomical MRI designs3.
This study is designed to find out the correlation
between MRI measured volumes of hippocampal
formation with that of age & sex of an adult
individual.
Materials and Methods:
This descriptive study was carried out on 47 adult
subjects aged from 18-69 years referred to the
Department of Radiology and Imaging of National
institute of ophthalmology (NIO) for evaluation of
brain with different complaints during July 2009
to June 2011. Adult subjects without known
temporal lobe pathology and both sexes were
included in this study. Adult subjects who had MRI
detected pathology with special attention to
temporal lobe was excluded from the study. Prior
to the commencement of this study, the research
protocol was approved by the thesis committee
(Local Ethical Committee). The aims and objective
of the study along with its procedure, alternative
diagnostic methods, risk and benefits were
explained to the subjects in easily understandable
local language and then informed consent were
taken from each subjects. It was assured that all
records would be kept confidential and the
procedure would be helpful for both the physician
and patients in making rational approach regarding
management of the case. At first all subjects were
evaluated with detailed history and clinical
examinations with special attention to nervous
system. Their MRI findings were evaluated and
volumes of hippocampal formation were measured
among these cases.
Procedure of MRI Measurement of Volume
of Hippocampal Formation:
MR image acquisition. MRI scans were obtainedusing a Siemens Magnetom Avanto 1.5T systemwith a standard radio frequency head coil (NationalInstitute of ophthalmology). T1-weighted imaging
offers the greatest clarity between grey matter,
white matter and CSF, and is therefore used for
quantitative MRI studies of brain morphology,
particularly of individual brain structures. For the
purpose of this study, only the FLASH 3D scanswere used. These volumes were acquired using athree-dimensional (3-D) spoiled gradient echoacquisition with sagittal volume excitation. The
square field of view for the sagittal images was
220 mm superior-inferior by 220 mm anterior-
posterior.
Assessment of HC volume. In short, the following
procedures for delineation of HC were used. The

Bangladesh Journal of Radiology and Imaging Vol. 22(2): July 2014
62
most posterior part of the HC was defined as the
first appearance of ovoid mass of gray matterinferio-medial to the trigone of the lateral ventricle(TLV). The lateral border of the HC at this pointwas the TLV, whereas medially, the border of theHC was identified by white matter. Furtheranterior, an arbitrary border was defined for thesuperior and medial border of the HC, todifferentiate HC gray matter from the gray matterof the Andreas Retzius gyrus, the fasciolar gyrus,and the crus of the fornix. This border was definedby drawing a vertical line from the medial end ofthe TLV inferiorly to the para-hippocampal gyrusand a horizontal line from the superior border ofthe quadro-geminal cistern to the TLV. The inferiorborder of the HC at this point was again identifiedby white matter.
Manual techniques of HC volume
measurement. Tracing methods used to tracethe HC using a mouse driven cursor throughout adefined number of MR sections. The transect areas,determined by pixel counting within the tracedregion, are summed and multiplied by the distancebetween the consecutive sections traced toestimate the volume. Whilst tracing methodsrepresent the most commonly used tool to estimatebrain structure volume on MR images.
After collecting all the necessary information
regarding the study, data was collected in a pre-
designed structured data collection sheets. Data
was collected from clinical history and Magnetic
Resonance Imaging (MRI). Statistical analyses
were carried out by using the Statistical Package
for Social Sciences version 20.0 for Windows (SPSS
Inc., Chicago, Illinois, USA). The mean values were
calculated for continuous variables. The
quantitative observations were indicated by
frequencies, percentages and bar diagram.
Unpaired t-test was used to analyze the continuous
variables, shown with mean and standard
deviation. The Pearson’s correlation coefficient was
used to assess the correlation between hippocampal
formations with age and presented in graph. A “p”
value <0.05 was considered as significant.
Results
The mean age was 37.5±12.5 years varied from 18to 69 years and 13(27.7%) the subjects were in 4th
decade followed by 12(25.5%) were in 3rd decade,10(21.3%) were in 5th decade, 6(12.8%) were in 6th
decade, 4(8.5%) were in 2nd decade and the lowestnumber 2(4.3%) were observed in 7th decade. Outof 47 individual, 28(59.6%) and 19(40.4%) weremale and female subjects respectively. Male femaleratio was 1.5:1.
The volume of hippocampal formation wasmeasured in mm3 and they were divided into twogroups and found that most (53.2%) of the volumeof hippocampal formation were <4000 mm3 and
rest 22(46.8%) were ≥4000 mm3 and the mean
volume was 3984.19±164 mm3 with range from
3406 to 4227 mm3.
Correlation between volume of hippocampal
formation (mm3) in male subjects and age (n=28).
Fig 1: Scatter diagram showing significant negative
Pearson’s correlation coefficient (r=-0.566; p<0.05)
between volume of hippocampal formation with age
in male subject.
Correlation between volume of hippocampal
formation (mm3) in female subjects and age (n=19).
Fig.-2: Scatter diagram showing the no significant
Pearson’s correlation coefficient (r=0.204;p>0.05)
between volume of hippocampal formation with age
in female subjects.

Correlation between Volume of Hippocampal Formation & Age, Sex of Adult Subjects Md Towrit Reza et al
63
Discussion
This study was done to assess the role of MRI in
volume measurement of hippocampal formation
and to find out the correlation between MRI
measured volume of hippocampal formation with
age and sex of an adult individual. Most (27.7%)
the subjects were in 4th decade and the mean age
was 37.5±12.5 years with range from 18 to 69 years.
In this present study it was observed that 59.6%
were male and 40.4% were female subjects, which
closely resembled with Sullivan6 study, where the
authors enrolled 21 to 70 years healthy subjects.
Similarly, other authors have observed almost
similar age range in adult subjects, which support
the present study7,8,9,10. In a study Jonsson11
showed that male female ratio was almost 2:1,
which is consistent with the current study. Female
predominant studies were observed by some
authors12,13,14,15,16. Free et al17 observed the
volume of hippocampus formation range from 2240
to 3480 mm3, which is less with the current study,
this may be due to geographical variations, racial
influences, ethnic differences, genetic causes and
different lifestyle may have significant impacts on
hippocampus formation.
Table I
Distribution of the male and female subjects according to their different age group and respective MRI
measured mean hippocampal volume
Age n=28 Volume (mm3) in male subjects n=19 Volume (mm3) in female subjects
(years) n Mean±SD Min-Max n Mean±SD Min-Max
Up to 20 2 4182±31.1 4160-4204 2 3843±68.59 3794-3891
21 – 30 6 4105±123.5 3870-4227 6 3809±240.7 3406-4109
31 – 40 6 4040±152 3838-4225 7 4021±36.4 3951-4055
41 – 50 7 4068±150.1 3735-4161 3 4003±48.22 3976-4072
51 – 60 5 4006±44.45 3982-4085 1 3963 3963-3963
>60 2 3727±12.02 3718-3735 -
Total 28 4023.9±155.7 3718-4227 19 3926.7±162.1 3406-4109
The mean (±SD) volume of hippocampal formation was 4182±31.1 mm3 in 2nd decade and 3926±141.1
mm3 in 6th decade and onward and the difference was statistically significant (p<0.05) in male subjects.
In female subjects it was 3843±68.59 mm3 in 2nd decade and on the other hand one patient was found in
6th decade and her volume of hippocampal formation was 3963mm3.
Diagrammatic picture of hippo-
campus formationShowing MR measured pixels(317 Pixels) of hippocampulformation of a 38 years old malesubject
Showing MR measured pixels(270 Pixels) of hippocampulformation of a 23 years old malesubject

Bangladesh Journal of Radiology and Imaging Vol. 22(2): July 2014
64
A significant (p=0.002) negative correlation (r = -
0.566) was observed between volume of
hippocampus formation with age in male subject,
but no correlation (r =0.204; p=.237) was found in
female subject. Sullivan et al6 mentioned in their
study that hippocampal volumes significantly
correlated with age, which decreased significantly
with each age (p<0.01). Similarly, Starkman et al18
showed hippocampal formations (HF) volume
negatively correlated with age, which suggests an
association between reduced HF with age increase
in male subjects. In another study Pruessner et
al3 found a significant negative correlation with
age for both left and right HC in men (r=-0.47 and
-0.44, respectively) but not in women (r = 0.01 and
0.02, respectively). Almost similar relation also wasobtained by Free et al17 which closely resembledthe present study.
In male subjects the volume of hippocampus
formation showed a significant (p<0.05) decline with
increased age, however the mean volume of
hippocampus formation was almost similar in early
age and older age in female subjects, no significant
(p>0.05) difference was observed in this study. In
a study, Walhovd et al19 reported that the mean
volumes of hippocampal per decade for the total
sample and showed the estimated percentage of
change in each structure per decade based on the
raw volumes. The mean volume of hippocampal
was in a decline with age increase per decade in
male subject but no relation was found in female
subject. Study results by Pruessner et al3 suggest
a significant gender difference with regard to HCvolume decline with aging in early adulthood inadult subjects.
However, although men showed a consistent
decline between the third and fifth decade of life
with regard to hippocampal volume, women in this
age range remained almost constant. The
calculated volume decline in men corresponds to
an annual loss of 1.5%. In another study, Jernigan
et al 20 showed first, that the age-related
hippocampal formation volume decline begins early
in adulthood. Although previous studies reported
a decline of brain volume beginning at the end of
the second life decade, it was so far unknown
whether this would also be true for structures of
the medial temporal lobe or, more specifically, the
HC. Jack et al21 reported a volume decline of the
hippocampal formation with an annual rate of 1.5%
for both men and women in a group of healthy
elderly ranging from 70 to 89 years. Coffey et al22
showed a smaller volume loss of 0.3% per annum
for the amygdaloid– hippocampal complex in
healthy adult volunteers and Kaye et al23 described
a volume decline of 2.1% in the hippocampal
formation per year in healthy subjects 84 years
and older.
The findings of the present study suggest that the
age-related hippocampal formation volume decline
in men starts at the beginning of the third life
decade. Second, the hippocampal formation volume
decline with age is gender specific. Earlier studies
suggested gender differences with regard to age
related volume decline of brain structures but not
the HC. Interestingly, Gur et al24 reported an
almost identical correlation for volume decline of
hippocampal formation volume for men in the same
age range; for women, they reported a smaller yet
significant decline of total hippocampal formation
volume as well. Although some studies 25,26
reported stronger temporal lobe volume decline
with age in men than in women, others found no
gender differences27 or reported greater temporal
lobe atrophy in women than in men28.
One study, Golomb et al29 reported that men havemore atrophy in the HC assessed volume declineon a four-point scale. Also, the authors did notdiscuss the age onset of the hippocampal formationvolume decline. The present study extends
previous findings by showing that the hippocampal
formation volume is susceptible to gender-specific
age-related decline starting in early adulthood and
it further allows estimation of the annual volume
loss of this structure. Third, morphometric changes
of the hippocampal formation volume with age
seem to be located mostly in the head and tail of
the hippocampal formation volume, as revealed
by the voxel-based regressional analysis. This is
the first study to show region specificity of age-
related processes within the hippocampal
formation volume in humans. Jack et al21 showed
that the HC volume head might be most susceptible
to the influences of aging.

Correlation between Volume of Hippocampal Formation & Age, Sex of Adult Subjects Md Towrit Reza et al
65
In the man, shrinkage of the hippocampal volume
with an expansion of the adjacent ventricles would
explain the observed results. Other possibilities
include pathological or inflammatory processes
within the cells of the HC, which have been found
to cause a signal decrease in T1 images30,31.
Vymazal et al32 mentioned in their study that
changes in the iron content of cells can have a
significant impact on the MR signal, and these
might be age-related.
However, the changes within the hippocampal
volume were observed only at the border and not
throughout the structure, favoring a volume
decline as a possible explanation. In the women,
the signal-intensity increase could reflect an
increase in white matter, which is supported by
the notion that the increase occurred in regions
where white matter bands border the hippocampus.
In fact, most of the studies22,33 investigating HC
volume changes with age have chosen elderly
populations. Finally, it needs to be addressed which
functional consequences this finding might have.
However, to test for possible gender differences in
hippocampal volume morphology and its
association with memory function, gender needs
to be included as an independent variable in the
respective study designs.
Conclusion
From the findings in this study in can be concluded
that there is an association between hippocampal
formation with age in male i.e. the volume decline
with age increased in male appeared to be linear
but no correlation observed in female subjects.
References:
1. Martin, JH (2003). “Lymbic system and
cerebral circuits for emotions, learning and
memory”. Neuroanatomy: text and atlas(third ed.). McGraw-Hill Companies. p. 382.
2. Amaral D, Lavenex P 2007, “Hippocampalneuroanatomy”. In Anderson, J; Morris, R;Amaral, D et al. The hippocampus book (firsted.). New York: Oxford University Press.p. 37.
3. Pruessner JC, Collins DL, Pruessner M and
Evans AC 2001, ‘Age and gender predict
volume decline in the anterior and posterior
hippocampus in early adulthood’, The journal
of neuroscience, vol. 21, no. 1, pp.194-200.
4. Geuze E, Vermetten E, Bremner JD 2005,
‘MR-based in vivo hippocampal volumetrics:
2. Findings in neuropsychiatric disorders’,
Psychiatry. vol.10, no.2, pp.160-84.
5. Theysohn JM, Kraff O, Maderwald S,
Schlamann MU, de Greiff A, Forsting M, Ladd
SC, Ladd ME And Gizewski ER 2009, ‘The
human hippocampus at 7T – In vivo MRI’,
Hippocampus, vol.19, pp. 1-7.
6. Sullivan, Marsh, Mathalon, Lim and
Pfefferbaum 1995, ‘Age-Related Decline in
MRI Volumes of Temporal Lobe Gray Matter
But Not Hippocampus,’ Neurobiology of
Aging, Vol. 16, No. 4, pp. 591-606.
7. Gunning –Dixon FM, Head D, McQuain J,
Acker JD, Raz N 1998, ‘Differential aging of
the human striatum: a prospective MR
imaging study’, Am. J. Neuroradiol, vol.19,
pp.1501-15
8. Luft AR, Skalej M, Schulz JB, Welte D, Kolb
R, Burk K, Klockgether T, Voight K 1999’,
‘Patterns of age-related shrinkage in
cerebellum and brainstem observed in vivo
using three-dimensional MRI volumetery.
Cereb’, Cortex, vol. 9, pp.712-721.
9. Good CD, Johnsrude IS, Ashburner J, Henson
RN, Fristonm KJ, Frackwiak RS 2001, ‘A
voxel-based morphometric study of ageing in
465 normal adult human brains’,
Neuroimage, vol. 14, pp.21-36.
10. Raz N, Gunning-Dixon F, Head D, Williamson
A, Acker JD 2001, ‘Age and sex difference in
the cerebellum and the ventral pons: a
prospective MR study of healthy adults’, Am.
J. Neuroradiol, vol. 22, pp. 1161-1167.
11. Jonsson EG, Edman-Ahlbom B, Sillen A,
Gunnar A, Kulle B, Frigessi A et al. 2006,
‘Brain derived neurotrophic factor gene
(BDNF) variants and schizophrenia: an
association study. Prog. Neuropsycho-
pharmacol’, Biol. Psychiatry, vol. 30, pp.924-
933.

12. Raz N, Gunning-Dixon F, Head D, Rodrigue
KM, Williamson A, Acker JD, 2004a, ‘Aging,
sexual dimorphism, and hemispheric
asymmetry of the cerebral cortex:
replicability of regional differences in volume
Neurobiol’, Aging, vol. 25, pp. 377-396.
13. Walhovd KB, Fjell AM, Reinvang I,
Lundervold A, Dale AM, Eilertsen DE, Quinn
BT, Salat D, Makris N, Fischl B 2005a, ‘Effects
of age on volumes of cortex, white matter and
subcortical structures’, Neurobiol. Aging, vol.
26, pp. 1261-1270.
14. Marcus DS, Wang TH, Parker J, Csernansky
JG, Morris JC, Buckner RL 2007, ‘Open
Access Series of Imaging Studies (OASIS):
cross-sectional-sectional MRI data in young,
middle aged, nondemented, and demented
older adults’, J Cogen. Neurosci, vol. 19, pp.
1498-1507.
15. Espeseth T, Westlye lTT, Fjell AM, Walhovd
KB, Rootwelt H, Reinvang I, 2008’,
‘Accelerated age-related cortical thinning in
healthy carriers of apolipoprotein E epsilon
4’, Neurobiol. Aging, vol. 29, pp. 329-340.
16. Nesvag R, Lawyer G, Varnas K, Fjell AM,
Walhovd KB, Frigessi A, Jonsson EG, Agartz
I 2008, ‘Regional thinning of the cerebral
cortex in schizophrenia: effects of diagnosis,
age and antipsychotic medication’, Schizophr,
Res, vol. 98, pp.16–28.
17. Free SL, Bergin PS, Fish DR, Cook MJ,
Shorvon SD, Stevens JM 1995, ‘Methods for
normalization of hippocampal volumes
measured with MR’, Americal Journal of
neuroradiology, vol.16, pp. 637-643.
18. Starkman MN, Gebarski SS, Berent S and
Schteingart DE 1992, ‘Hippocampal
Formation Volume, Memory Dysfunction,
and Cortisoi Levels in Patients with Cushing’s
Syndrome’, BIOL PSYCHIATRY, vol. 32,
pp.756-765.
19. Walhovd KB, Westlye LT, Amlien I, Espeseth
T, Reinvang I, Razc N, et al. 2009, ‘Consistent
neuroanatomical age-related volume
differences across multiple samples’,
Neurobiology of Aging, NBA-7344, no. 17.
20. Jernigan TL, Press GA, Hesselink JR 1990,
‘Methods for measuring brain morphologic
features on magnetic resonance images:
validation and normal aging’, Arch Neurol,
vol. 47, pp. 27–32.
21. Jack CR Jr., Petersen RC, Xu Y, O’Brien PC,
Smith GE, Ivnik RJ, Tangalos EG, Kokmen
E 1998, ‘Rate of medial temporal lobe atrophy
in typical aging and Alzheimer’s disease’,
Neurology, vol. 51, pp. 993–999.
22. Coffey CE, Wilkinson WE, Parashos IA 1992,
‘Quantitative cerebral anatomy of the aging
human brain: a cross-sectional study using
magnetic resonance imaging’, Neurology, vol.
42, pp.527–536.
23. Kaye JA, Swihart T, Howieson D, Dame A,
Moore MM 1997, ‘Volume loss of the
hippocampus and temporal lobe in healthy
elderly persons destined to develop
dementia’, Neurology, vol.48, pp.1297–1304.
24. Gur RC, Turetsky BI, Matsui M, Yan M,
Bilker W, Hughett P, Gur RE 1999, ‘Sex
differences in brain gray and white matter in
healthy young adults: correlations with
cognitive performance’, J Neurosci, vol.19,
pp.4065–4072.
25. Cowell PE, Turetsky BT, Gur RC, Grossman
RI, Shtasel DI, Gur RE 1994, Sex differences
in aging of the human frontal and temporal
lobe’, J Neurosci, vol.14, pp.4748–4755.
26. Raz N, Gunning FM, Head D, Dupuis JH,
McQuain J, Briggs SD, Loken WJ, Thornton
AE, Acker JD 1997, ‘Selective aging of the
human cerebral cortex observed in vivo:
differential vulnerability of the prefrontal gray
matter’, Cereb. Cortex, vol. 7, pp.268-282.
27. Coffey CE, Lucke JF, Saxton JA, Ratcliff G,
Unitas LJ, Billig B, Bryan RN 1998, ‘Sex
differences in brain aging: a quantitative
magnetic resonance imaging study’, Arch
Neurol, vol. 55, pp.169 –179.
Bangladesh Journal of Radiology and Imaging Vol. 22(2): July 2014
66

28. Murphy DGM, DeCarli C, McIntosh AR, Daly
E, Mentis MJ, Pietrini P, Szcepanik J,
Schapiro MB, Grady CL, Horwitz B, Rapoport
SI 1996, ‘Sex differences in human brain
morphometry and metabolism: an in vivo
quantitative magnetic resonance imaging and
positron emission tomography study on the
effect of aging’, Arch Gen Psychiatry, vol. 53,
pp.585–594.
29. Golomb J, de Leon MJ, Kluger A, George AE,
Tarshish C, Ferris SH 1993, ‘Hippocampal
atrophy in normal aging: an association with
recent memory impairment’, Arch Neurol,
vol. 50, pp.967–973.
30. Baenziger O, Martin E, Steinlin M, Good M,
Largo R, Burger R, Fanconi S, Duc G, Buchli
R, Rumpel H 1993, ‘Early pattern recognition
in severe perinatal asphyxia: a prospective
MRI study’, Neuroradiology, vol. 35, pp.
437– 442.
31. Kreft B, Dombrowski F, Block W, BachmannR, Pfeifer U, Schild H 1999, ‘Evaluation ofdifferent models of experimentally inducedliver cirrhosis for MRI research withcorrelation to histopathologic findings’, InvestRadiol, vol. 34, pp.360 –366.
32. Vymazal J, Hajek M, Patronas N, Giedd JN,Bulte JW, Baumgarner C, Tran V, Brooks RA1995, ‘The quantitative relation between T1-weighted and T2-weighted MRI of normal graymatter and iron concentration, J Magn Reson
Imaging, vol. 5, pp.554 –560.
33. Jack Jr CR, Theodore WH, Cook M,McCarthy G 1995, ‘MRI-based hippocampalvolumetrics: data acquisition, normal rangesand optimal protocol’, Magn Reson Imaging,
vol.13, pp.1057–1064.
Bangladesh Journal of Radiology and Imaging Vol. 22(2): July 2014
67

Abstract:
Objective: The objective of the study was to see
the diagnostic performance of MRI in the evaluation
of tuberculous spondylitis.
Methodology: This cross sectional study was
carried out among 40 patients in the Department
of Radiology & imaging, Dhaka Medical College
Hospital (DMCH) in Collaboration with Department
of Neurosurgery and Pathology, DMCH during the
period of 1st July 2011 to 30th June 2013. Clinically
suspected patients of tuberculous spondylitis who
was referred for MRI scan of spine were purposively
selected. MRI diagnosis was compared to
histopathological diagnosis.
Result: The validity of MRI scan in the evaluation
of tuberculous spondylitis was shown by sensitivity,
specificity, accuracy, positive and negative
predictive value which were 92.86% , 83.33% , 90%,
92.86% , 83.33% respectively.
Conclusion: MRI scan can be regarded as a good
imaging modality for the diagnosis of tuberculous
spondylitis.
Introduction:
Tuberculosis is one of the most contagious diseases
causing morbidity and mortality¹. Tuberculous
spondylitis is an infection involving one or moreof the components of the spine, namely thevertebral body, intervertebral disc and ligaments,para-vertebral soft tissues, and the epidural space.The causative organism belongs to one of the
different strains of Mycobacterium tuberculosis².
In the developing countries, the disease commonly
affects children and young adults and tends to be
more aggressive in extent and abscess formation.
Consequently, neurologic complications and spinal
deformities are seen frequently. In the developed
Performance of Magnetic Resonance Imaging in
the Diagnosis of Tuberculous SpondylitisNAZMA FARZANA CHOWDHURY1, MD MIZANUR RAHMAN2, ROBINDRANATH SARKER3, MAJ
MAKSUDA KHANOM4, GOPAL CHANDRA SAHA5, AKANDA FAZLE RABBI6, MD ANISUR RAHMAN7
1. Radiologist, STS Life Care Centre,. 2. Professor and Head, Department of Radiology and Imaging, DMC.3. Associate Professor, DMC. 4. Classified Radiologist, CMH, Dhaka. 5. Radiologist, Narsinghdi District Hospital6. Associate Professor, DMC, 7. Assistant Professor, Department of Radiology and Imaging, Rajshahi MedicalCollege Hospital.
countries, musculoskeletal tuberculosis is
uncommon, but its incidence is reported to be
greater in older individuals³.
Tuberculous spondylitis is typically more indolent
than pyogenic osteomyelitis. Untreated patients
develop progressive vertebral collapse with
anterior wedging and gibbus formation4.The
kyphotic deformity is caused by collapse in the
anterior spine. A cold abscess can occur if the
infection extends to adjacent ligaments and soft
tissues5. Paraplegia may be a result of spinal cord
compression from liquid or casseous pus,
inflammatory granulation tissue of active disease
or kyphotic deformity in the late stage of disease.
Therefore, early diagnosis and establishment of
treatment are necessary for avoiding this long term
disability6.
Magnetic resonance (MR) imaging is effective in
the early diagnosis of tuberculous spondylitis. Italso detects lesions, which may not be apparenton plain radiograph7. High contrast resolution,direct multi-planar imaging, usefulness indetecting marrow infiltration, and ease by whichintra-dural disease can be assessed are definite
advantages. On MR images, vertebral intra-osseous
abscesses, para-spinal soft tissue abscesses that
extended beyond the confines of disc collapse,
spinal deformity (gibbus), skip lesions
encroachment on spinal canal and nerve roots,
and involvement of the posterior elements are
all readily detectable. Enhanced MR studies are
particularly useful for characterizing tuberculous
spondylitis. Rim enhancement around intra-
osseous and para-spinal soft tissue abscess had not
been demonstrated in other spinal infection8. The
two most reliable MRI findings suggesting
tuberculous spondylitis were thin and smooth
BANGLADESH JOURNAL OF RADIOLOGY AND IMAGING 2014; VOL. 22(2): 68-73

enhancement of the abscess wall and welldefined para-spinal abnormal signal9. The studywas designed to establish MRI as a usefulmodality for diagnosis and evaluation oftuberculous spondylitis .
Materials and Methods:
This cross sectional study was carried out on 40patients in the Department of Radiology andImaging, DMCH in collaboration withDepartment of Neurosurgery and Pathology,DMCH, during the period of 1st July 2011 to 30th
June 2013. Consecutive cases were collectedpurposively who fulfilled the inclusion criteria. Theinclusion criteria were clinically suspected patientsof tuberculous spondylitis. Exclusion criteria were(a) Patients who refused to undergo operativetreatment (b) Non-availability of histopathogicalreport.
Prior to commencement of this study, theresearch protocol was approved by the ethicalcommittee of DMC. Informed consent was takenfrom each patient. Data was collected by pre-designed data collection sheet. All other necessarydata were collected from history sheet andinvestigation papers. A 0.3 Tesla open MRImachine (AIRIS – II - HITACHI) was used. Imageswere taken of T1WI, T2WI and T1 contrastsequence in sagittal, axial and coronal plane.
Pre and post contrast MRI scans were evaluatedby the researcher and a senior radiologist. Patientswho underwent operation, histo-pathologicalreports were collected. Out of 43 cases, 3 wereexcluded from the study due to unavailability ofhistopathological report and refused to dooperation. Finally MRI findings of 40 patients werecompared with histopathological diagnosis.
Statistical analysis of the results were obtained by
using window based computer software device
with statistical Packages for Social Sciences
(SPSS-15).
Results:
Total 40 patients were included in this study.
Among the patients 28 (70.0%) were male and 12
(30.0%) were female. Male to female ratio was
2.33:1 .The mean± SD of age was 36.52±13.86 years
with a range of 12 to 70 years. Highest number of
patient (40.0%) were in the age group of 31-40 years
followed by 41-50 years (20.0%), 21–30 years
(15.0%), 11–20 years (12.5%), 51–60 years (7.5%)
and above 60 years (5.0%).
Most common presentation was back pain (87.5%)
followed by neurological deficit (75.0%). Other
clinical presentations included fever and kyphosisin 55.0% and 42.5% respectively. Spinalinvolvement of 2 (5.0%) were cervical, 25 (62.5%)were thoracic, 13 were (32.5%) lumbar. No onehad sacral involvement. Among the patients 5(12.5%) had single, 19(47.5%) had two, 12 (30.0%)had three and 4 (10.0%) had more than threevertebral body involvement. Ninety percent (36)of the patients presented with vertebral collapse.All patients had altered marrow signal intensityof involved vertebrae. Six patients (15.0%) hadposterior element involvement. Eighteen (45.0%)patients had kyphosis and 28 (70.0%) patients hadend plate disruption. Disc involvement and signalchange (high signal intensity of disc in T2WI) werepresent in 35 (87.5%) patients. Well defined andill-defined Para-spinal abnormal signal werepresent in 32 (82.0%) and 7 (18.0%) respectively.Margin of abscess wall was thin & smooth in 30(77.0%) patients and thick & irregular in 9 (23.0%)patients. MRI features of cord compression andcord compression with myelopathy was present in
19 (47.5%) and 10 (25.0%) patients respectively.
MRI diagnosis 28 (70.0%) was tuberculous
spondylitis, 7 (17.5%) were pyogenic spondylitis and
rest 5 (12.5%) were spinal metastasis.
Histopathological diagnosis of 28 (70.0%) patients
was tuberculous spondylitis, 8 (20.0%) were
pyogenic spondylitis and rest 4 (10.0%) were spinalmetastasis .Out of all cases 28 were diagnosed astuberculous spondylitis by MRI and among them
26 were confirmed by histopathology. They were
true positive. Two cases were diagnosed as having
tuberculous spondylitis by MRI but not confirmedby histopathology. That was false positive. Out of12 cases of non-tuberculous spondylitis which wereconfirmed by MRI, 2 were confirmed astuberculous spondylitis and 10 were non-tuberculous spondylitis by histopathology. Theywere false negative and true negative respectively.
Sensitivity, specificity, positive predictive value,negative predictive value and accuracy of MRI inthe diagnosis of tuberculous spondylitis were92.86%, 83.33%, 92.86%, 83.33% and 90.00%respectively.
Performance of Magnetic Resonance Imaging in the Diagnosis Nazma Farzana Chowdhury et al
69

Table I
Relationship of MRI and histopathological
diagnosis of patient
MRI Histopathology Total
Positive Negative
Positive 26 (92.9)* 02 (16.7) 28 (70.0)
Negative 02 (07.1) 10 (83.3) 12 (30.0)
Total 28 (100.0) 12 (100.0) 40 (100.0)
*Figure within parentheses indicates in columnpercentage.
Table II
Showing the validity test results
Value (%)
Sensitivity 92.86
Specificity 83.33
PPV (Positive predictive value) 92.86
NPV (Negative predictive value) 83.33
Accuracy 90.00
Fig 1 : Tuberculous spondylitis of L5 - S1,
(a,b,c)
Magnetic resonance image of the lumbo
sacral spine in a 35 years old female
presented with low back pain,
(a) Pre – Gadolinium T1 – weighted,
(b) T2 - weighted in sagittal plane show
altered marrow signal intensities of
L5 and S1 vertebral bodies with
prevertebral abscess,
(c) Post - Gadolinium T1 - weighted in
sagittal plane shows heterogenous
enhancement of involved vertebra as
well as thin and smooth enhancement
of prevertebral abscess.
Fig 2 : Tuberculous spondylitis of D7 (a, b,
c). MRI of the thoracic spine in a 40
years old female presented with back
pain,
(a) Pre – Gadolinium T1 - weighted.
(b) T2 - weighted in sagittal plane showaltered marrow signal intensities ofD7 vertebral body with cordcompression. Adjacent hyper-hypointense prevertebral abnormalsignal and epidural mass are present,
(c) Post - Gadolinium shows heterogenousenhancement of D7 vertebral bodiesas well as thin and smooth rimenhancement of prevertebral andepidural abscess.
Bangladesh Journal of Radiology and Imaging Vol. 22(2): July 2014
70

Discussion:
Spondylitis is the most common osseous
manifestation of Mycobacterium tuberculi
infection. Although treatable, it continues to cause
significant mortality and morbidity. Early diagnosis
through familiarity with its imaging characteristics
is essential to permit rapid treatment and prevent
potential life-limiting consequences10.
In the present study, out of 40 patients Male and
female were 28 (70.0%) and 12 (30.0%) respectively.
The ratio between male and female was 2.33:1.Bajwa11 evaluated the role of MRI in assessingthe extent of disease in spinal tuberculosis in adescriptive study and out of 60 cases in their study33 were males (55%), 27 were female (45%). Sinanet al12 in their study reported that the majority(n=18, 60%) of the 30 patients were males.
In the present study, the mean age ± SD was 36.52± 13.86 years with a range of 12 to 70 years. Sinan
et al12 in their study reported that the majority of
the 30 patients were males was in the 30-49 year
age group (43%). Bajwa11 evaluated the role of MRI
in assessing and mean age which was 33 years
with a range of 14-36 years.
Most common presentation was back pain (87.5%)followed by neurological deficit (75.0%). Otherclinical presentation included fever and spinaldeformity/kyphosis which were 55.0% and 42.5%respectively. Cormican et al¹³ in their study
reported that back pain, neurological, and
constitutional symptoms were present in 100%,
29%, and 38% respectively. Sinan et al12 in their
study reported that the most common clinical
presentation was backache (73.3%) followed by
fever (63.3%) and malaise (36.6%). Bajwa11 in their
study showed that the most common symptom was
backache in 38 cases (63%). Spinal cord
compression was found in 16 cases (26.6%).
MRI of patients showed that out of 40 patients,
site of spinal involvement of 2 (5.0%) was cervical,
25 (62.5%) was thoracic, 13 (32.5%) was lumbar.
No one had sacral involvement. Among the
patients 5 (12.5%) had single, 19(47.5%) had two,
12 (30.0%) had three and 4 (10.0%) had more than
three vertebral bodies involvement. Ninety
percent (36) presented with vertebral collapse. All
patients had altered marrow signal intensity of
involved vertebrae. Six patients (15.0%) had
posterior element involvement. Eighteen (45.0%)
patients had kyphosis and 28 (70.0%) patients had
end plate disruption. Disc involvement and signal
change (high signal intensity of disc, T2W1) were
present in 35 (87.5%) patients. Well-defined and
ill-defined paraspinal abnormal signal were
presents in 32 (82.0%) and 7 (18.0%) respectively.Margin of abscess wall were thin & smooth in 30(77.0%) patients and thick & irregular in 9 (23.0%)patients. MRI features of cord compression andcord compression with myelopathy were presentin 19 (47.5%) and 10 (25.0%) patients respectively.Bajwa11 in their study showed that the most
commonly affected level was thoracolumbar spine
(45%). Kotze and Erasmus14 in a study found that
typical findings of vertebral column involvement
Fig 3 : Tuberculous spondylitis of D8 – D9
(a, b, c) Magnetic resonance image of the
thoracic spine in 12 years old boy, presented
with back pain and spinal deformity.
(a) Precontrast T1- weighted.
(b) T2- weighted in sagittal plane shows
wedge shaped collapse of D9 vertebra
with altered marrow signal intensity.
Adjacent prevertebral well defined
abnormal signal and kyphotic deformity
is seen.
(c) Post contrast coronal T1 weighted
image show thin and smooth rim
enhancement of paraspinal abscess.
Performance of Magnetic Resonance Imaging in the Diagnosis Nazma Farzana Chowdhury et al
71
(a) (b) (c)

were seen in all patients, namely a) Multiple levels
involvement, b) Paravertebral abscesses and c)
Thoracic spine involvement more than the lumbar
spine. In their study nearly in all cases
intervertebral disc involvement was noted and
Posterior longitudinal ligaments were intact in all
but 1(One) patient, even though there was some
elevation in a number of patients. Abscess walls
were also found to be thick instead of thin as
expected. Bajwa11 in their study showed that spinal
cord compression was found in 16 cases (26.6%)
and most commonly affected level was
thoracolumbar spine (45%) and only 3 cases (5%)
were having more than one level involvement.
Other findings of tuberculosis spine were reduced
intervertebral disc space (95% cases), wedge
collapse of the body in 18 (30% cases), complete
destruction of the body in 12 (20% cases), para-
spinal abscess in 24 (40% cases), calcification in 18
(30% cases) and cord compression in 16 cases
(26.6% cases).
In the present study out of 40 patients, 28 (70.0%)
were diagnosed by MRI as tuberculous spondylitis,
7 (17.5%) were pyogenic spondylitis and rest 5
(12.5%) were spinal metastasis. Out of 40 patients,
histopathological diagnosis in 28 (70.0%) was
tuberculous spondylitis, 8 (20.0%) pyogenic
spondylitis and rest 4 (10.0%) were spinal
metastasis. Harada et al15 in a study concluded
that MR imaging is a very useful technique for
differentiation of tuberculous spondylitis from
pyogenic spondylitis.
Among the 28 cases of tuberculous spondylitis, 26
cases was true positive and 2 cases were false
positive. Among non-tuberculous spondylitis 2
cases were false negative and 10 were true
negatives. In the present study sensitivity,
specificity, positive predictive value, negativepredictive value and accuracy of MRI in thediagnosis of tuberculous spondylitis were 92.86%,83.33%, 92.86%, 83.33% and 90.00% respectively.
Jung et al.9 in their study reported that sensitivity,
specificity, and accuracy of MRI in the diagnosis of
tuberculous spondylitis were 100% (20/20), 80% (16/
20), and 90% (36/40). Danchaivijitr et al 6 reported
that the overall sensitivity and specificity of MRI
for spinal tuberculosis were 100% and 88.2%
respectively. They reported that the most useful
three MR imaging features with high sensitivity
and specificity (> 80%) were endplate disruption
(100%, 81.4%), paravertebral soft tissue (96.8%,
85.3%), and high signal intensity of intervertebral
disc on T2WI (80.6%, 82.4%). In their study they
also reported that high sensitivity but low specificity
signs in MRI included bone marrow edema (90.3%,
76.5%), bone marrow enhancement (100%, 42.5%),
posterior element involvement (93.5%, 76.5%),
canal stenosis (87.1%, 26.5%), and spinal cord or
nerve root compression (80.6%, 38.2%) and low
sensitivity but high specificity features in MRI were
intervertebral disc enhancement (63.3%, 84.2%),
vertebral collapse (58.1%, 85.3%), and kyphosis
deformity (67.7%, 82.4%).
Conclusion:
The current study showed that MRI can be used
as a reliable tool with which we can assess
tuberculous spondylitis and can plan the
subsequent appropriate management in majority
of cases.
References:
1. Gonzalez-Martín J, García-García JM,Anibarro L, Vidal R, Esteban J, Blanquer R,Moreno S, Ruiz-Manzano J. ConsensusDocument on the Diagnosis, Treatment andPrevention of Tuberculosis. Arch Bron-
coneumol. 2010; 46(5):255-274.
2. Sharif HS, Morgan JL, al Shahed MS, alThagafi MY. Role of CT and MR imaging inthe management of tuberculous spondylitis.Radiol Clin North Am.1995; 33(4):787-804.
3. Moorthy S and Prabhu NK. Spectrum of MRImaging Findings in Spinal Tuberculosis.AJR. 2002 ; 179: 979-983.
4. Osborn AGDiagnostic Neuroradiology. 1st ed.India, Mosby; 2009. 822
5. Hidalgo JA. Pott Disease, [online].2011 [Lastupdated 2012 Jul 13, cited 2012 Nov6].Available from: http://emedicine.medscape.com/article/226141
6. Danchaivijitr N, Temram S, ThepmongkholK, Chiewvit P. ‘Diagnostic accuracy of MRimaging in tuberculous spondylitis’, Med
Assoc Thai. 2007; 90(8):1581-1589.
Bangladesh Journal of Radiology and Imaging Vol. 22(2): July 2014
72

7. Akman S, Sirvanci M, Talu U, Gogus A,
Hamzaoglu A. Magnetic resonance imagingof tuberculous spondylitis. Orthopedics; 2003.26(1):69-73.
8. Sharif HS .Role of MA imaging in themanagement of spinal infections. AJR. ; 1992.158:1333-1345.
9. Jung NY, Jee WH, Ha KY, Park CK, ByunJY. Discrimination of Tuberculous Spondylitisfrom Pyogenic Spondylitis on MRI. AJR.2004;182(6):1405-1410.
10. Currie S, Galea-Soler S, Barron D,Chandramohan M, Groves C. MRIcharacteristics of tuberculous spondylitis. Clin
Radiol. 2011; 66(8):778-787.
11. Bajwa GR . Evaluation of the role of MRI inspinal Tuberculosis: A study of 60 cases. Pak
J Med Sci. 2009; 25(6): 944-947.
12. Sinan T, Al-Khawari H, Ismail M, Ben-Nakhi
A, Sheikh M. Spinal tuberculosis: CT and MRI
features. Ann Saudi Med 2004;24(6):437-441.
13. Cormican L, Hammal R, Messenger J,
Milburn H. Current difficulties in the
diagnosis and management of spinal
tuberculosis. Postgrad Med. 2006; 82(963):
46-51.
14. Kotze DJ and Erasmus LJ. MRI findings in
proven Mycobacterium tuberculosis (TB)
spondylitis, SA Journal of Radiology. 2006;
12(1): 6-12.
15. Harada Y, Tokuda O, Matsunaga N. Magnetic
resonance imaging characteristics of
tuberculous spondylitis vs. pyogenic
spondylitis. Clin Imaging. 2008; 32(4):303-309.
Performance of Magnetic Resonance Imaging in the Diagnosis Nazma Farzana Chowdhury et al
73

Abstract :
Background : Adenomyosis is a common
condition that predominantly affects women in the
late reproductive years. Because of nonspecific
nature of the clinical presentation, the diagnosis is
traditionally not made prior to surgery. Pelvic
sonography, particularly since the introduction of
the transvaginal approach, has provided a new tool
for the detection of adenomyosis.
Objectives: The purposes of this cross sectional
study was to determine the sensitivity, specificity,
accuracy, positive predictive value and negative
predictive value of Transvaginal sonography (TVS)
in the diagnosis of adenomyosis.
Materials and methods: This study was carried
out in the department of Radiology and Imaging
of Enam Medical College and Hospital during
January 2014 to May 2015. Transvaginal
sonography was done in 135 women suspected of
having adenomyosis. Among them hysterectomy
and histopathology were done only in 102 cases.
TVS findings and histopathological reports analysis
was done using SPSS-13.
Results: According to our study the sensitivity of
TVS was 92.4%, specificity 88.8%, positive
predictive value (PPV) 93.8%, negative predictive
value 86.4% and accuracy 91% in the diagnosis of
adenomyosis. Conclusion: With the validity test
results, it can therefore be concluded that TVS
provide an accurate diagnosis of adenomyosis.
Key Words: Adenomyosis, Transvaginal
sonography (TVS)
Evaluation of Accuracy of Transvaginal
Sonography in Diagnosis of Adenomyosis with
Histopathological CorrelationTARANA YASMIN1, MASHAH BINTE AMIN 2, SHEULY BEGUM3, ASISH KUMAR SARKAR4,
AUROBINDO ROY5, MD ANISUR RAHMAN KHAN6, MD KHALILUR RAHMAN7
1 & 2 Assistant Professor, Department of Radiology & Imaging, Enam Medical College & Hospital (EMCH). 3.Associate Professor, Department of Gynecology & Obstetrics, EMCH. 4. Medical Officer, Department of Radiology& Imaging, BSMMU, 5. Radiologist, Dhaka Medical College Hospital (DMCH), 6. Assistant Professor, Departmentof Radiology & Imaging, Dhaka Medical College Hospital, 7. Associate Professor, Department of Radiology &Imaging, Dhaka Medical College Hospital
Introduction:
Adenomyosis is defined by the presence of ectopic
endometrial glands and stroma within the
myometrium. The presence of ectopic endometrial
glands and stroma induces a hypertrophic and
hyperplastic reaction in the surrounding
myometrial tissue. Adenomyosis is a fairly common
gynecological condition. The reported frequency
of this condition varies widely, ranging from 5% to
70% 1,2 . Adenomyosis is most commonly present
in women within the older reproductive age group.
Most patients with adenomyosis are asymptomatic.
Symptoms related to adenomyosis include
dysmenorrhea, dyspareunia, chronic pelvic pain,
and menstrual meno-metrorrhagia. Physical
examination may reveal an enlarged, tender
uterus. Adenomyosis can also be associated with
other conditions, such as leiomyoma, endometrial
polyps, and endometriosis3. The establishment of
the clinical diagnosis of adenomyosis is difficult
because of its vague presenting symptoms and
diagnosis without histo-pathological confirmation
is difficult to obtain. The preoperative diagnosis of
adenomyosis remains elusive, although the use ofsonography and MR imaging improves thediagnosis. The evaluation of endovaginalsonography in the diagnosis of adenomyosis hasreceived attention, with small series reporting
sensitivities and specificities of up to 87% and 98%
respectively 4,5,6,7. Because sonography is
frequently the initial imaging study in these
patients, improving the diagnosis of this disease
with sonography is important. If the correct
diagnosis is established uterus conserving therapy
is possible whereas hysterectomy is the definitive
BANGLADESH JOURNAL OF RADIOLOGY AND IMAGING 2014; VOL. 22(2): 74-80

treatment for debilitating adenomyosis. With
advent of high resolution sonography adenomyosis
can be diagnosed with a high degree of accuracy.
The purpose of this study was to evaluate the
accuracy of transvaginal sonography in the
diagnosis of adenomyosis and to characterize the
most commonly seen sonographic features.
Materials and Methods:
This cross sectional study was carried out in the
department of Radiology and Imaging of Enam
Medical College and Hospital from January 2014
to May 2015. Patients were referred for pelvic
sonography by gynecologists for a variety of
standard indications. Adenomyosis was suspected
and TVS was done in 135 cases. Out of these, 102
cases were included in the study as this patient
group had undergone hysterectomy and had histo-
pathological evaluation reports for review.
Patients were evaluated via transabdominal
ultrasonography followed by transvaginal
sonography as clinically indicated. The scans were
performed using a 3.5 MHz variable focus trans-
abdominal probe and subsequently by a 5-8 MHz
variable focus trans-vaginal probe. Color Doppler
interrogation was used during the study period.
The diagnosis of adenomyosis was made
prospectively at the time of the original scan.
We analyzed these women by recording age,
menstrual symptoms and associated symptoms for
clinical evaluation. Clinical indications of
hysterectomy were also recorded. Transvaginal
sonographic findings were recorded.
Histopathological reports of the hysterectomy
specimens were compared with trans-vaginal
sonographic findings.
Result:
A total 102 cases are included in this study. Age of
the patients ranged from 31 to 55 years. The largest
group was of peri-menopausal age (41-45 years)
contributing 44 % of total case in the study. Mean
(± SD) age of the patients was 42.7 ± 4.1 years.
(Table I)
Table I
Distribution of respondents according to age
(n= 102)
Age No of respondents Percentage (%)
31 -35 12 12
36-40 23 22
41-45 45 44
46-50 18 18
51-55 4 4
Main complaints included dysmenorrhea in 54 (52.9
%) cases followed by menorrhagia in 31 (30.4 %)
cases, irregular P/V bleeding in 15 (14.7%), lower
abdominal pain 12 (11.7%) and dyspareunia in 05
(4.9%) cases.
On per-vaginal examination tender bulky uterus
was found in 44 (43.14 %) cases followed by bulky
uterus 34 (33.33 %) cases, unhealthy cervix 02
(1.96%). Uterus was found normal in 22 (21.56%)
cases.
TVS findings showed that 65 (63.73 %) cases were
adenomyosis, 25(24.50 %) cases were fibroid, 05(4.9
%) were endometrial polyp, 04(3.92 %) were
endometrial hyperplasia and 3 (2.94 %) case were
cervicitis. (Table II)
Table II
Distribution of respondents according to TVS
findings. (n= 102)
Ultrasonographic No of Percentage
diagnosis (TVS) respondents (%)
Adenomyosis 65 63.73
Fibroid 25 24.50
Endometrial polyp 5 4.90
Endometrial hyperplasia 4 3.92
Cervicitis 3 2.94
Sonographically adenomyosis were diagnosed in
65 cases having following criteria – Commonest
uterine shape was globular, found in 35(53.84 %)
cases. Asymmetrical myometrial thickening was
seen in 45(69.23 %) cases. Heterogeneous
myometrial echotexture were present in 55 (84.62
Evaluation of Accuracy of Transvaginal Sonography in Diagnosis of Adenomyosis Tarana Yasmin et al
75

%) cases, Myometrial cyst was present in 50 (76.92
%) cases, increased myometrial vascularity was
observed in 43(66.15 %) cases, Endometrial
striation was present in 40 (61.54 %) cases.
Myometrial endometrial interface was absent in
30 (46.15 %) cases and 37 (56.92 %) cases had
indistinct endometrium. Other findings are shown
in Table III & (Figure 1 – 8)
Table III
Distribution of respondents according to TVS
features of adenomyosis (n= 65)
TVS features of No of Percentage
adenomyosis respondents (%)
Uterine size
Globular shape 35 53.84
Bulky uterus 24 36.92
Normal size 6 9.23
Myometrial thickness
Asymmetrical 45 69.23
Normal 20 30.77
Myometrial echotexture
Heterogeneous 55 84.62
Homogeneous 10 15.38
Myometrial cyst
Present 50 76.92
Absent 15 23.07
Myometrial vascularity
Increased 43 66.15
Normal 22 33.85
Endometrial striation
Present 40 61.54
Absent 25 38.46
Myometrial endometrial interface
Present 30 46.15
Absent 35 53.85
Endometrial stripe
Indistinct 37 56.92
Normal 28 43.08
Fig.-1 : Globular shaped uterus
Fig.-3: Heterogeneous myometrium
Fig.-2: Bulky uterus
Bangladesh Journal of Radiology and Imaging Vol. 22(2): July 2014
76

Associated sonographic findings with adenomyosis
were fibroid in 14 (21.53 %), endometrial polyp in
07 (10.77 %), endometrial hyperplasia in 05 (7.69%),
endometrioma in 04 (6.15 %) and cervicitis in 03
(4.62 %) cases.
Sonographically 65 lesions were benign. Among
the benign lesions 61 (93.85 %) cases were also
proved benign histopathologically and 04 (6.15 %)
other than adenomyosis. Among the 37 cases who
were sonographically diagnosed having diseases
other than adenomyosis, 05 (13.51 %) were
diagnosed as adenomyosis and 32 (86.49 %) were
other than adenomyosis. (Table-IV)
Fig.-4: Asymmetric myometrial thickness
Fig.-5: Myometrial cyst
Fig.-6: Endometrial Striation
Fig.-7: Indistinct endometrium
Fig.-8: Adenomyosis with fibroid
Evaluation of Accuracy of Transvaginal Sonography in Diagnosis of Adenomyosis Tarana Yasmin et al
77

In diagnosis of adenomyosis TVS showed that
the sensitivity was 92.4%, specificity 88.8%, positive
predictive value (PPV) 93.8%, negative predictive
value 86.4% and accuracy was 91.0%. (Table V).
Table V
Validity test for adenomyosis.
Validity test parameters value
Sensitivity 92.4%
Specificity 88.8%
Positive Predictive Value(PPV) 93.8%
Negative PredictiveValue(NPV) 86.4%
Accuracy 91%
Discussion :
Adenomyosis is characterized by an irregular endo-
myometrial junction, with endometrial glands and
stroma extending into the myometrium. When
adenomyosis involves the myometrium in a diffuse
manner, symmetric uterine enlargement is seen.
This occurs primarily as a result of smooth muscle
hypertrophy, in which the smooth muscle
interdigitates around endometrial glands and
stroma. If the adenomyosis is focal, uterine
enlargement may be asymmetric. The reason why
smooth muscle undergoes hypertrophy and
encircles areas of adenomyosis is unknown2.
Classically the clinical triad of uterine enlargement,
dysmenorrhea, and menorrhagia suggests
adenomyosis. However, the symptoms are so
nonspecific that the diagnosis is made
preoperatively in fewer than half of patients
undergoing hysterectomy8. But now-a-days the
advent of endovaginal US has substantially
improved the ability to diagnose adenomyosis.
Different US features of adenomyosis have been
reported in the literature, including uterine
enlargement, globular uterus, asymmetric
thickening of the anterior or posterior myometrial
wall, heterogeneous poorly circumscribed areas
within the myometrium, anechoic lacunae or cysts
of varying sizes, increased echotexture of the
Myometrium and linear endometrial striations 9,10.
In this study most patients were in 41-45 age group
(44%) with mean age of 42.7 ± 4.1 years. Most
frequent presenting complaints were
dysmenorrhea (53%) followed by menorrhagia
(30%). Most common pervaginal examination
findings were tender bulky uterus (43.14 %).
In our study common diagnostic sonological
findings were Globular shaped uterus in 35 (54%)
cases followed by bulky uterus in 24(37%) cases,
asymmetrical myometrial thickening in 45(69%)
cases. Heterogeneous myometrial echotexture
were seen in 55 (85%) cases. Myometrial cyst was
present in 50(77%) cases. 43 (66%) cases showed
increased myometrial vascularity. Endometrial
striation was present in 40 (62%) cases. Myometrial
endometrial interface was lost in 30 (46%) cases
and 37 (57%) cases had indistinct endometrium.
Different studies showed presence of cystic spaces
in the myometrium and posterior wall thickening
on pelvic sonography as features of
adenomyosis11,12,13,14. Ttransvaginal sonography
similarly describes cystic spaces and also shows
the finding of heterogeneous zones in the
myometrium as indicative of adenomyosis 4,5,6,7,
15. Sensitivities and specificities of endovaginal
sonography for the diagnosis of adenomyosis were
in the range of 80–87%4 and 74–96%7, respectively,
where presence of cystic spaces in the myometrium
was used as the diagnostic criteria. One author
Table IV
Showing distribution of adenomyosis by TVS and Histopathology (n=102)
Ultrasonographic findings Histopathological findings Total
Adenomyosis Others
Adenomyosis ( 65) 61 (93.85 %) 04 (6.15%) 65
Others(37) 05 (13.51 %) 32 (86.49%) 37
Total 66 36 102
Bangladesh Journal of Radiology and Imaging Vol. 22(2): July 2014
78

differed too, saying that the most common
sonographic finding in patients with adenomyosis
to be a uterus with a diffuse heterogeneous
echotexture (85%)6.
Our experience is similar to that reported by Fedele
and associates5. These investigators reported 80%
sensitivity and 74% specificity for transvaginal
sonography to detect diffuse adenomyosis5.
Reinhold and coworkers also reported a sensitivity
of 86%, specificity of 86%, PPV of 71%, and NPV of
94% in a group of 29 patients with pathologically
proven adenomyosis6. Botsis and colleagues
reported a sensitivity of 80% with a specificity of
90% in a group of 48 patients with diffuse
adenomyosis16. Brosens and coauthors reported a
sensitivity of 86% and specificity of 50% for the
use of transvaginal sonography in the identification
of adenomyosis17. Walsh and colleagues initially
noted the presence of small cystic spaces as an
important finding in patients with adenomyosis11.
Botsis and coworkers, who noted the existence of
lacunae in 83% of patients with adenomyosis16.
Reinhold and colleagues found 53% of patients with
a histologic diagnosis of adenomyosis had
myometrial cysts6. Our study also demonstrated
that the endometrial stripe was indistinct and
“shaggy” in appearance with adenomyosis in
37(57%) cases. The presence of a poorly defined
endometrial stripe may be more frequent in
patients with adenomyosis.1,18
In this study we found associated sonographiic
findings with adenomyosis were fibroid 14 (22%),
endometrial polyp 07 (11%), endometrial
hyperplasia 05 (8%), endometrioma 04 (6%),
cervicitis 03 (4%). Gynecology literature shows
that 60–80% of patients diagnosed with
adenomyosis show other pelvic pathology,
including fibroids, endometriosis, endometrial
polyps, and endometrial hyperplasia 19.
On tranvaginal sonogram, adenomyosis was
diagnosed in 65 (64%) cases and other than
adenomyosis in 37(36%) cases. Sonographically
65 lesions were adenomyosis, out of these
61(93.9%) were also proved histopathologically and
04 (6.1%) other than adenomyosis. Out of 37
sonographically diagnosed other lesions, 32
(86.5%) were also proved histopathologically but
05 (13.5%) cases were adenomyosis .According to
our study result sensitivity was 92.4%, specificity
88.8%, positive predictive value (PPV) 93.8%,
negative predictive value 86.4% and accuracy was
91% in diagnosis of adenomyosis by transvaginal
songrphy .
According to our study transvaginal sonography
has significant sensitivity, specificity, accuracy,
positive predictive value and negative predictive
value in the diagnosis of adenomyosis. Our study
was also comparable to other similar studies. So
we can conclude that transvaginal sonography is a
sensitive imaging tool in diagnosis of adenomyosis.
Conclusion :
Adenomyosis is a common finding in women of
reproductive age. Most women with adenomyosis
are asymptomatic. The diagnosis of adenomyosis
by sonography has been well defined and has
diagnostic capabilities comparable to MRI.
According to our study transvaginal sonography is
significantly sensitive, specific and accurate in the
diagnosis of adenomyosis. When a diagnostic
imaging modality is required for suspected
adenomyosis, Transvaginal sonography can be used
as an initial investigation due to its efficacy, safety,
and lower cost.
References:
1. Azziz R: Adenomyosis: Current perspectives.
Obstet Gynecol Clin North Am 16:221, 1989
2. Kurman RJ: Benign diseases of the
endometrium. In Blaustein A (Ed): Pathology
of the Female Genital Tract. 2nd Edition. New
York, Springer-Verlag, 1984, p 297
3 Bromley B, Shipp TD, Benacerraf B.
Adenomyosis: sonographic findings and
diagnostic accuracy. J Ultrasound Med 2000;
19:529–534.
4. Fedele L, Bianchi S, Dorta M, et al.
Transvaginal ultrasonography in the
differential diagnosis of adenomyoma versus
leiomyoma. Am J Obstet Gynecol 1992;
167:603–606
5. Fedele L, Bianchi S, Dorta M, Arcaini L,
Zanotti F, Carinelli S. Transvaginal
Evaluation of Accuracy of Transvaginal Sonography in Diagnosis of Adenomyosis Tarana Yasmin et al
79

ultrasonography in the diagnosis of diffuse
adenomyosis. Fertil Steril 1992; 58:94–97
6. Reinhold C, Atri M, Mehio A, et al. Diffuse
uterine adenomyosis: morphologic criteria
and diagnostic accuracy of endovaginal
sonography. Radiology 1995; 197: 609–614
7. Atzori E, Tronci C, Sionis L. Transvaginal
ultrasound in the diagnosis of diffuse
adenomyosis. Gynecol Obstet Invest 1996;
42:39–4
8. Lee NC, Dicker RC, Rubin GL, et al:
Confirmation of the preoperative diagnoses
for hysterectomy. Am J Obstet Gynecol 1984;
150:283,
9. Hirai M, Shibata K, Sagai H. Transvaginal
pulsed and color Doppler sonography for the
evaluation of adenomyosis. J Ultrasound Med
1995; 14:529-532
10. Kepkep K, Tuncay YA, Göynümer G, Tutal
E. Transvaginal sonography in the diagnosis
of adenomyosis: which findings are most
accurate? Ultrasound Obstet Gynecol 2007;
30:341–345.
11. Walsh JW, Taylor KJ, Rosenfield AT. Gray
scale ultrasonography in the diagnosis of
endometriosis and adenomyosis. AJR 1979;
132: 87–90
12. Bohlman ME, Ensor RE, Sanders RC.
Sonographic findings of adenomyosis in the
uterus. AJR 1987; 148:765–766
13. Siedler D, Laing FC, Brooke J, et al. Uterineadenomyosis: a difficult sonographicdiagnosis. J Ultrasound Med 1987; 6: 345–349
14. Murao F, Hata K, Shin K, et al.Ultrasonography for the diagnosis ofadenomyosis. Acta Obstet Gynaec Jpn 1986;38:2073–2077
15. Ascher SM, Arnold LL, Patt RH, et al.Adenomyosis: prospective comparison of MRimaging and transvaginal sonography.Radiology 1994; 190: 803–806
16. Botsis D, Kassanos D, Antoniou G, et al:Adenomyoma and leiomyoma: Differentialdiagnosis with transvaginal sonography. J
Clin Ultrasound 26:21, 1998
17. Brosens JJ, De Souza MN, Barker FG, et al:Endovaginal ultrasonography in the diagnosisof adenomyosis uteri: Identifying thepredictive characteristics. Br J Obstet
Gynaecol 102:474, 1995
18. Marcus CC: Relationship of adenomyosis uterito endometrial hyperplasia and endometrialcarcinoma. Am J Obstet Gynecol 82:408, 1961
19. Vercellini P, Ragni G, Trespidi L, et al.Adenomyosis: a déjà vu? Obstet Gynecol Surv
1993; 48:789–794
Bangladesh Journal of Radiology and Imaging Vol. 22(2): July 2014
80

Abstract:
Objective of this study was to determine whether
color Doppler interrogation of a thyroid nodule can
aid the prediction of malignancy. We obtained color
Doppler images of thyroid nodules undergoing
sonography along with guided FNAC.62 patients
of solitary thyroid nodules were evaluated.
Sonographic findings relevant to benign and
malignant nodules were recorded and correlated
with cytological & histo-pathological findings. The
color Doppler appearances of each nodule were
graded from 0 (zero) for no visible flow up to 4(Four)
for extensive intra nodular flow. Out of 62,40 cases
were diagnosed as benign and 22 cases were
malignant.52 nodules were solid and among solid
nodules 18 were found as malignant.The prevalence
of malignancy was more in solid nodules which
were hyper-vascular having extensive intra-nodular
vascularity.The color characteristics of thyroid
nodules,however, cannot be so much useful to
predict or exclude malignancy confidently because
14% of solid non hyper-vascular nodules were found
as malignant.So it becomes predictive for
malignancy only when multiple signs are
simultaneously present in a thyroid nodule and
FNAC or biopsy is needed for confirmation.
Keywords: Solitary thyroid nodule, High
resolution sonography, Color Doppler.
Introduction:
Thyroid nodule is a discrete lesion and a common
clinical condition. Solitary thyroid nodules are
commonly present in up to 50% of the elderly
Role of Color Doppler and High Resolution
Sonography in the Prediction of Malignant
Thyroid Nodules with Cyto and Histo-
pathological correlationMAKSUDA BEGUM1, MOLLA ERSHADUL HAQUE2, MAHBUB ALAM3, SHAHIDUL ISLAM4,
RASHEDA PERVIN5, BIDOURA TANIM6, MD ANISUR RAHMAN7
1. Assistant professor of Radiology & Imaging, National Institute of Traumatology and Orthopedic Rehabilitation(NITOR), 2. Assistant Professor, Department of orthopedics, Shaheed Suhrawardy Medical College, 3. IndoorMedical Officer, NICRH, 4. Associate Professor & Head, Department of Radiology & Imaging, NITOR, 5. Radiologist,NITOR, 6. Assistant Professor, Department of Radiology & Imaging, National Institute of Ophthalmology (NIO)Hospital, Dhaka, 7. Assistant Professor, Department of Radiology & Imaging, Rajshahi Medical College Hospital
population. Up to 20% thyroid nodules are found
clinically by palpation and up to 70% in sonographic
studies1.
Solitary thyroid nodule is common in females than
males with a ratio of 5:1 and prevalence mainly
depends on age, sex, iodine intake, diet and
environmental exposure. Though solitary thyroid
nodule is common in women, malignancy is
common in men2.
The high resolution sonography is effective in
discovery of large number of new thyroid nodules
which are obscured clinically. Gray scale and color
Doppler sonography are used to differentiate
benign from malignant nodules. Several gray scale
sonographical characteristics have found to be
highly suggestive of malignancy including micro-calcifications and irregular margins. Thyroid glandis one of the most vascular organs in the body.Color Doppler flow imaging is permitted to assessthe blood supply in addition to morphology. SoDoppler may be useful in detecting type of
pathology. High frequency transducers (7-12 MHz)
are used for thyroid imaging.
Rich vascularization of thyroid gland can be easily
seen, which is most pronounced at the upper and
lower pole. Mean diameter of the artery is 1-2 mm.
The veins may be up to 8 mm in diameter. Peak
systolic velocities are 20-40 cm/sec in major thyroid
arteries and 15-30 cm/sec in intra parenchymal
arteries3.
Doppler examination can also be used to monitor
the response to therapy in the patients of grave’s
BANGLADESH JOURNAL OF RADIOLOGY AND IMAGING 2014; VOL. 22(2): 81-87

disease. Following treatment significant decrease
in vascularity and the velocities of thyroid vessels
are seen. Several reports have described no
correlation between presence of flow on color
Doppler sonography and malignancy, particularly
when color flow is considered as an isolated
criterion 4. Others have suggested that a pattern
of either spotty intra-nodular flow or hyper vascular
central flow on color Doppler may be associated
with malignancy 5. Prediction of malignancy using
sonography still remains difficult. Since there is
overlap of sonographic features between benign
and malignant thyroid nodules, it is not possible
to distinguish a benign follicular adenoma from
follicular carcinoma by sonography. FNAC, core
biopsy, frozen section, vascular and capsular
invasion can only be evaluated on histological
specimen, so sonographic features are usually
corroborated with histopathology for
differentiating various thyroid nodules 6.
Color Doppler findings that may be useful in
differentiation, is the distribution of the vessels.
Quantitative analysis of flow velocities is not
accurate in differentiating benign from malignant
nodules. With presently available high resolution
color Doppler systems some degree of vascularity
is demonstrated in all nodules. Two types ofvascular distribution are seen: a) Nodules withperipheral vascularity and b) Nodules with internalvessels, which may or may not be associated withperipheral vessels 7.
Objectives: The purpose of this study was to
determine whether color Doppler sonography can
be used to diagnose or exclude malignancy in a
thyroid nodule.
Materials and Methods:
This cross sectional prospective study was
conducted in the department of Radiology &
Imaging, NICRH, Dhaka in collaboration with
department of Otolaryngology, Surgery & Medical
Oncology. We performed color Doppler Sonography
of all thyroid nodules which were referred for high
resolution sonography with clinically suspected
thyroid nodule.
The study was carried out during the period of
January 2011 to December 2012. Total 62 cases
clinically with solitary thyroid nodules were
selected for this study. Detail history about the
illness, chief complaints, family history, history of
radiation exposure in the neck region, weight gain
or loss and heat intolerance was recorded.
Inclusion Criteria:
All clinically diagnosed patients with solitary
thyroid nodule at or above the age of 18 years were
included in the study.
Exclusion criteria:
Pateint with diffuse thyroid disease or with
previous H /0 any malignancy were excluded from
the study. Nodules of <1 cm size were also excluded
because the recommended measurement for USG
guided FNAC is 1.5 cm8.
Method of performing examination:
Sonography of neck was performed by using
SIEMENS ACCUSON x 300 and SIEMENS G50
with 5-10 MHZ transducers. After localizing the
nodule following features were noted: Internal
consistency (solid/purely cystic/ mixed solid &
cystic), echogenicity in relation to the adjacent
thyroid parenchyma, margin, presence of
calcification, peripheral sonolucent halo and
presence and distribution of blood flow signals.
Thyroid nodules were diagnosed as benign or
malignant on the basis of sonographic features.
Later the findings were correlated with USG guided
FNAC findings. Biopsy reports were compared in
few patients who underwent surgery. Enlarged
lymph nodes were detected and noted.
The collected data was analyzed using window
based computer software device with packages for
social sciences (SPSS-15). For the validity of study
outcome, sensitivity, specificity, accuracy, positive
predictive value and negative predictive values of
USG was calculated out after confirmation by
FNAC and histopathology.
Parameters were optimized in all cases to show
slow flow. All color images were obtained before
FNAC. Color flow in each nodule was characterized
without knowledge of cytologic or pathologic
findings by the consensus of at least 2 of 3 staff
Bangladesh Journal of Radiology and Imaging Vol. 22(2): July 2014
82
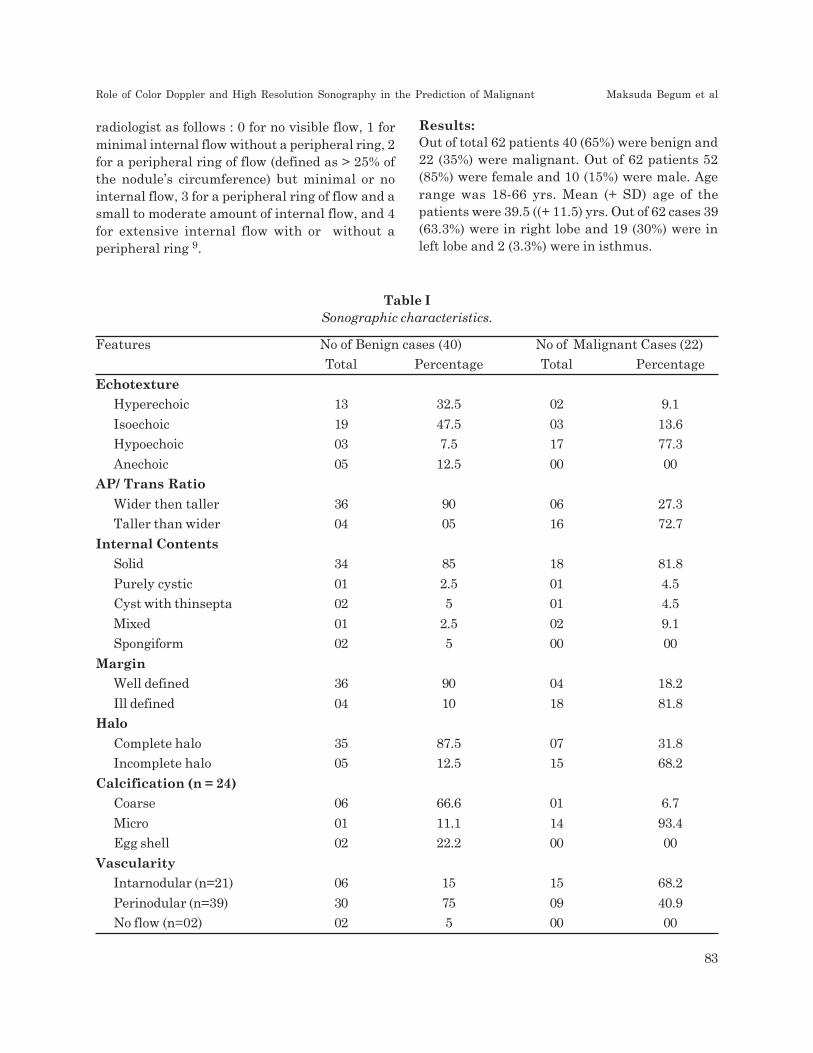
radiologist as follows : 0 for no visible flow, 1 for
minimal internal flow without a peripheral ring, 2
for a peripheral ring of flow (defined as > 25% of
the nodule’s circumference) but minimal or no
internal flow, 3 for a peripheral ring of flow and a
small to moderate amount of internal flow, and 4
for extensive internal flow with or without a
peripheral ring 9.
Results:
Out of total 62 patients 40 (65%) were benign and
22 (35%) were malignant. Out of 62 patients 52
(85%) were female and 10 (15%) were male. Age
range was 18-66 yrs. Mean (+ SD) age of the
patients were 39.5 ((+ 11.5) yrs. Out of 62 cases 39
(63.3%) were in right lobe and 19 (30%) were in
left lobe and 2 (3.3%) were in isthmus.
Table I
Sonographic characteristics.
Features No of Benign cases (40) No of Malignant Cases (22)
Total Percentage Total Percentage
Echotexture
Hyperechoic 13 32.5 02 9.1
Isoechoic 19 47.5 03 13.6
Hypoechoic 03 7.5 17 77.3
Anechoic 05 12.5 00 00
AP/ Trans Ratio
Wider then taller 36 90 06 27.3
Taller than wider 04 05 16 72.7
Internal Contents
Solid 34 85 18 81.8
Purely cystic 01 2.5 01 4.5
Cyst with thinsepta 02 5 01 4.5
Mixed 01 2.5 02 9.1
Spongiform 02 5 00 00
Margin
Well defined 36 90 04 18.2
Ill defined 04 10 18 81.8
Halo
Complete halo 35 87.5 07 31.8
Incomplete halo 05 12.5 15 68.2
Calcification (n = 24)
Coarse 06 66.6 01 6.7
Micro 01 11.1 14 93.4
Egg shell 02 22.2 00 00
Vascularity
Intarnodular (n=21) 06 15 15 68.2
Perinodular (n=39) 30 75 09 40.9
No flow (n=02) 02 5 00 00
Role of Color Doppler and High Resolution Sonography in the Prediction of Malignant Maksuda Begum et al
83

Table II
Color flow characteristics of the nodules
Color type No of Benign cases (40) No of Malignant Cases (22)
Total Percentage Total Percentage
0 02 5 00 00
1 20 50 01 4.5
2 07 17.5 03 13.7
3 12 30 03 13.7
4 03 7.5 11 50
Pictures of color Doppler sonographic features:
Pictures of gray scale sonographic features:
Case 1: Follicular adenoma
having complete peripheral halo
Case 2: Mixed nodule of
Follicular carcinoma.
Case 3: Follicular carcinoma
having incomplete peripheral halo
Case 4: Extensive intra-
nodular flow of Follicular
carcinoma.
Case 5: Partial peri-nodular
flow of Follicular adenoma.
Case 6: Extensive peri-nodular flow
of Follicular adenoma.
Bangladesh Journal of Radiology and Imaging Vol. 22(2): July 2014
84

Table III
Cyto and histopathological diagnosis.
Benign Lesions Total 40 Percentage
Follicular adenoma 22 55
Nodular hyperplasia 11 27.5
Colloid nodule 07 17.5
Malignant Lesions Total 22 Percentage
Papillary carcinoma 15 68.18
Follicular carcinoma 07 31.8
Medullary carcinoma 00 ——-
Discussion
Sonography is a choice of investigation in
evaluating thyroid nodules. Many sonographic
features have been described to differentiate benign
and malignant nature of the nodule. The present
study was done on 62 patients.
The present study showed 85% of benign nodules
are solid, whereas 81.8% of malignant nodules are
solid. The study done by Hegde et al showed that
most benign and malignant nodules are solid,
making it difficult to use this criterion for
differentiating the two.10
In the present study, 90% of nodules had well-
defined margins and 10% of nodules with ill-defined
margins were benign and 81.8% of the nodules
having ill-defined margins and 18.2% with well-
defined margins were malignant nodules. The
study done by Papini E et al showed that nodule
having well defined margin were benign and nodule
having ill-defined margin were mostly malignant
nodules11.
In the present study 87.5% of the nodules which
had peripheral complete halo were benign nodules
and 68.2% of the nodules which had peripheral
incomplete halo were malignant nodules. The study
done by Wienke et al showed that in 93.7% benign
nodules there were peripheral complete halo and
in 83.3 % malignant nodules there was peripheral
incomplete halo12. In the present study coarse
calcification were seen in 66.6 % and peripheral
egg shell calcification in 22.2 % of benign nodules
and micro-calcification was seen in 93.4 % of
malignant nodules. The study done by Wienke et
al also showed that coarse calcification was seen
in 72% and peripheral egg shell calcification were
seen in 35% of benign nodules, whereas micro-
calcifications were seen in 16% of malignant
nodules12.
In the present study perinodular vascularity was
seen in 75 % of benign nodules and 40.9 % of
malignant nodules, whereas Intra nodular
vascularity was seen in 68.2 % of malignant nodules.
The study done by Propper et al showed that
perinodular vascularity is seen in benign nodules
and intra nodular vascularity is seen in malignant
nodules.13
In the present study of 62 cases of solitary thyroid
nodules, Sonographic diagnosis was made as benign
in 42 cases and 40 cases were confirmed as benign
by histopathology. Remaining 2 cases were
diagnosed as malignant by histopathology.
Sonologically these 2 cases showed features of
benign nodule such as AP/TRANS ratio < 1,
isoechoic nodule, well defined, peripheral thick
complete halo.
In the present study of 62 cases, Sonographic
diagnosis was made as malignant in 25 cases, 22
cases were confirmed as malignant by
histopathology. Remaining 3 cases were diagnosed
as benign by histopathology. Sonologically these 3
cases showed features of malignant nodule such
as AP/TRANS > 1, mixed nodule, peripheral
incomplete halo and intra-nodular vascularity.
Gray scale sonography in our study showed a
sensitivity of 83.5%, Specificity of 87.2%, Accuracy
of 76.9 %, Positive predictive value of 72.5% and a
Negative predictive value of 91.7%.
The sonographic mismatch of predicting benign
and malignant nodules in the present study was
mainly noted in cases of follicular adenoma and
follicular carcinoma. They both differ only in the
vascular and capsular invasion which is very
difficult to diagnose on sonography. Hence in such
cases histo-pathological examination only gives the
correct diagnosis.
In present study, sonography was able to
differentiate benign from malignant nodules with
sensitivity of 83.5% and specificity of 87.2 % which
Role of Color Doppler and High Resolution Sonography in the Prediction of Malignant Maksuda Begum et al
85

correlates with above study. The study done by
Som et al showed that sonography has a sensitivity
of 75 % and specificity of 83 % in differentiating
benign from malignant nodules.14
This study examined the role of color Doppler
sonography in thyroid nodules and our results
showed that both the solid nature and extensive
internal blood flow are strong points in favor of
malignancy. Indeed, the combination of hyper
vascularity and a solid nature had a high likelihood
of malignancy (41.9%) in our series. In a larger
study of more than 100 patients with cold nodules,
a hypervascular pattern alone was not a statistically
significant finding for the prediction of
malignancy15. Another large study that included
30 cases of papillary carcinoma found no significant
difference in the color flow patterns of benign
versus malignant nodules16. Another large study
of 300 cold nodules, which compared color Doppler
with Power Doppler sonography including 20 cases
of papillary carcinoma had results similar to ours,
with a hypervascular color Doppler pattern
common but not diagnostic of papillary cancer.
About 30% of the hypervascular solid nodules
(those with color type 3) in our series were benign.
In addition, about 14% of the non hypervascular
solid nodules were malignant.
Conclusion:
From the present study it was noted that
sonographic features such as wider than taller in
shape, isoechogenicity / hyperechogenicity, purely
cystic nodule / cystic with thin septa / spongiform
appearance, well defined margins, peripheral
complete halo, egg shell / coarse calcification and
perinodular vascularity are highly predictive of
benign nodules.
Sonographic features such as taller than wider
shape, marked hyperechogenicity or
hypoechogenecity, ill-defined margins, peripheral
incomplete halo, micro-calcification and intra-
nodular vascularity with or without peri-nodular
vascularity are highly predictive of a malignant
nodule.
Sonography is specific (83:5%) and sensitive (87.2
%) in differentiating benign from malignant nodule.
But the role of color Doppler sonography in the
evaluation of a thyroid nodule for malignancy has
not been defined successfully. In conclusion, solid
hypervascular thyroid nodules have a higher risk
of malignancy than cystic or non hypervascular
lesions. However, the color Doppler characteristics
of a thyroid nodule cannot be used to predict or
exclude malignancy confidently, rather it becomes
predictive for malignancy only when multiple signs
are simultaneously present in a thyroid nodule,
and FNAC or biopsy is needed for confirmation.
References:
1. Baier ND, Hahn PF, Gervais DA, Samir A,
Halpern EF, Mueller PR, et al. Fine needle
aspiration biopsy of thyroid nodules:
Experience in a cohort of 944 pts. AJR 2009;
193:1175-1179.
2. Parvin S, Al-Azad S ,Sarker AK ,Shimu F,
Anisul Moula. “Ultrasonographic Evaluation
of Echogenic Thyroid Nodule with
Histopathological Correlation” Bangladesh
Journal Of Radiology and Imaging 2009;
Vol.17 (2) :46-51.
3. Clark K, JJ C, Scola F .Color Doppler
sonography : anatomic and physiologic
assessment of the thyroid . J Clin Ultrasound
1995; 23:215-223. Medline
4. Shimamoto K, Endo T, Ishigaki T, Sakuma
S, Makino N. Thyroid nodules: evaluation
with color Doppler ultrasonography. J
Ultrasound Med 1 993; 1 2:673-678.
5. Kerr L. High resolution thyroid ultrasound:
the value of color Doppler ultrasound. Q1994
; 12: 21-43, CrossRef
6. Tsrgaye B, Ergete W. Histopathologic pattern
of thyroid disease. Med J 2003; 80(10); 525-
528.
7. Cerbone G ,Spieza S, Colao A, et al.Power
Doppler improves the diagnostic accuracy of
color Doppler ultrasonography in cold thyroid
nodules : follow-up results. Horm Res 1999;
52:19-24. CrossRef Medline.
8. Burch HB, Jose RM, Smile SR, Iyengar
KR.The role of imprint cytology in intra-
Bangladesh Journal of Radiology and Imaging Vol. 22(2): July 2014
86

operative diagnosis of thyroid swelling. Indian
J Pathol Microbiol 2002; 45(4):393-396.
9. Holden A. The role of colour and duplexDoppler ultrasound in the assessment ofthyroid modules. Australas Radiol 1995;39:343-349. Medline.
10. Hedge A, Gopinathan A, Abu Bakar A, OoiCC, Koh YY, Lo RH. A method in the madnessin ultrasound evaluation of thyroid nodules.Med J 2012; 53(11): 766-773.
11. Papini E, Guglielmi R, Bianchini A. Risk ofmalignancy in non-palpable thyroid nodules:predictive value of ultrasound and color-Doppler features. J Clin Endocrinol Metab.
2002; 87:1941-6.
12. Wienke JR, Chong WK, Fielding JR, Zou KH,Mittelstaedt CA. Sonographic features ofbenign thyroid nodules: inter-observerreliability and overlap with malignancy. J
Ultrasound Med. 2003; 22:1027-31.
13. Propper RA, Skolnick ML, Weinstein BJ,Dekker A. The non-specificity of thyroid halosign. J Clin Ultrasound. 1980; 8:129-32.
14. Som PM, Curtin HD, Mancuso AA. An
imaging-based classification for the cervical
nodes designed as an adjunct to recent
clinically based nodal classifications” Arch
Otolaryngol. Head Neck Surg. 1999; 125
(4):388-96.
15. Rago T, Vitti P, Chiovato S, et al. Role ofconventional ultrasonography and color flow-
Doppler sonography in predicting malignancy
in “cold” thyroid nodules. Eur J Endocrinol
1998; 1 38:41-46. Abstract
16. Pacella C, Cuglielmi R, Fabbrini R, et al.
Papillary carcinoma in small hypoechoic
thyroid nodules, predictive value of echo color
Doppler evaluation : preliminary results. J
Exp Clin Cancer Res 1998; 17:127-128.medline
Role of Color Doppler and High Resolution Sonography in the Prediction of Malignant Maksuda Begum et al
87

Evaluation of Outcome of Management of Giant
Cell Tumour of Bone by Curettage, Chemical
Cauterization and Morcellized Bone Graft in
Sandwich Technique Augmentation with Bone
CementIMAM GAZIUL HAQUE1, HASAN MASUD2, PROF SK NURUL ALAM3, M SAJJAD HOSSAIN4,
SHAHRYAR NABI5, SHAMIM AHMED6
1. Associate Professor, NITOR, Dhaka, Bangladesh. 2. Associate Professor, NITOR, Dhaka, Bangladesh. 3. Professor
& Ex-Director (RTD), NITOR, Dhaka, Bangladesh. 4. Professor (RTD) NITOR, Dhaka Bangladesh. 5. Assistant
Professor, Department of Radiology & Imaging, Dhaka Medical College. 6. Associate Professor, Department of
Radiology & Imaging, Dhaka Medical College, Dhaka
Abstract:
Of ample of treatment modalities, successfulness
of treatment is based on reduced rate of local
recurrence and gratifying functional outcome of
joints. The virtues of this surgical technique, in
spite of extended curettage and chemical
cauterization are on the use of morcellized graft
and adjuvant bone cement. The bone cement exerts
a) tumerocidal effect by heat dispersion and toxic
free radicals b) provide immediate load bearing
stability and c) easy earlier detection of local
recurrence due to its radio-opaque property. So the
study incorporating this treatment modality reflects
toward the formulation or to validate updated
classic option as well as innovate new avenues of
preferred method of treatment. This descriptive
cross sectional study was conducted in the National
Institute of Traumatology & Orthopaedic
Rehabilitation (NITOR), Sher-E-Bangla nagar,
Dhaka during the period of January 2003 to
December 2004. This study lacks in statistical
significance test due to small sample size and strict
inclusion criteria. In this study, total number of
patient was 11 and mean age was 30.18 years. 07
(63.63%) were female and rest 04 (36.36%) were
male. Most of the tumour was on distal femur
(54.55%) and proximal tibia (36.36%). On
Enneking’s and Campanacci scale stage II disease
was seen in all 11 cases. One patient developed
superficial infection. The outcome of treatment was
categorized using MSTS rating system scale. The
mean follow up time was 8.5 months and one case
was followed up for 24 months, no recurrence was
demonstrated.
Introduction:
Sir Astlay Cooper (in 1981 AD) was the first to
describe the Giant cell tumour and the term was
popularized by Joseph Bloodgood in 1912. Virchow
in 1962 agreed that Giant cell tumour are usually
benign but might recur or become malignant.
Giant cell tumour of bone is a distinct, locally
aggressive primary neoplasm, composed of oval
or plumb spindle shaped mononuclear cells that
fuse to form the giant cells. It is a tumour of
uncertain origin but recent concept is associated
with over expression of osteoprotegerin ligand
(OPGL), stimulator of osteoclast that appear in the
epiphysis of mature bone commonly in the distal
femur proximal tibia, distal radius, proximal
humerus but other bones may also be affected. It
is hardly seen before closure of the epiphysis in
that region and characteristically it extends up to
the subarticular bone plate 1. It is uncommon in
short tubular bones of hands and feet, extremely
rare in vertebral bodies but sacrum is the most
common site in axial skeleton 2. More than half of
the tumours occur about the knee. Giant cell
tumour accounts for only 4-5% of primary bone
tumour in United States and 20% in China.
National Institute of Traumatology & Orthopaedic
Rehabilitation (NITOR), Dhaka reported 17.6% of
primary bone neoplasm from the work-up of
tumour registry 3. In most series, there is female
predominance, though 5 to 75 years of age being
reported; 70% to 80% occurring between the age
of 20 and 40 years 4.
BANGLADESH JOURNAL OF RADIOLOGY AND IMAGING 2014; VOL. 22(2): 88-92
.

Campanacci et al have recently developed similar
staging system based on combined radiographic
presentation and histologic grading that is helpful
in planning the initial surgical approach to any
specific lesion5. There are no such obvious clinical,
radiographic or histologic parameters to predict
the tendency of any lesion to recur or to
metastasize4. They often recur and may become
malignant after unsuccessful surgical removal6.
The Mayo Clinic and Memorial Hospital reported
true malignant Giant cell tumour to be 2.6% &
1.9% respectively7. Secondary malignant Giant cell
tumour, mostly sarcoma viz. Osteosarcoma,
Malignant fibrous histocytoma or Fibrosarcoma
may occur following irradiation4. Recurrence or
more persistence of the lesion usually occurs within
3 years following treatment8.
In the 19th century, routine amputation was theprocedure. But with the advent of surgicaltechniques, curettage alone or with bone graftinghas been reported with local recurrence rate
between 17 - 55%. The recurrence with
cementation is reported to about 8% and Wide
excision or amputation has the recurrence rate of
0-5%.9
Patients & Methods:
Cases were selected with strict inclusion criteria
namely Giant cell tumour located at the end of
tubular bones. Enneking stage II, proved by biopsy
irrespective of age and sex using non-probability
or purposive sampling technique and data were
collected using semi-structured questionnaire and
observation checklist. Collected data were checked
and coded as per required and was analyzed in
computer with the help of statistical package for
social science(SPSS) version 11.2.This particular
descriptive cross sectional study was conducted in
National Institute of Traumatology and
Orthopaedic Rehabilitation during the period of
January ‘2003 to December’ 2004 to evaluate the
outcome of management.
Justification of the Study :
In spite of couples of modalities of surgical
treatment, due to eventual risk of higher rate of
local recurrence, this adequate and efficient
technique tailing the recurrence rate quite reduced
or even to absent making the patient disease free
as well as permit themselves to share toward the
development of national economy and productivity.
So these studies implicate toward the formulation
or to validate optimal treatment protocol, provide
scientific record for further study and in innovation
of new avenues of preferred method of treatment.
Surgical Technique for Study Subject:
Operations are carried out under General and or
spinal anaesthesia with non-Esfnarch tourniquet.
Conventional longitudinal incisions for the affected
site were followed. Wide exteriorization was made
by cortical window through the most lytic and
accessible location. After wide exteriorization and
aggressive curettage, the soft tissue were covered
and protected with Vaseline gauze or saline soaked,
clean, sterile mob.
In the curretted tumour cavity, Hydrogen peroxide
was poured and kept it there up to the period of
end of bubbles emitted. Then it was cleared and
sucked out. The dry tumour cavity was treated
with chemical cauterization by means of sterile
cotton tipped swab stick soaked with 100% phenoland touched it to the exposed bone tumour bedkeeping it there for 20-30 seconds. The blackenedcauterized cavity surface was ringed with 70% ethylalcohol for 3-4 minutes to wash away the phenoland thereafter was sucked out. Vigorous lavage
with copious amount of isotonic saline was done
and was sucked out. Later on, manually made
morcellized autogenous bone graft was laid down,
packed tightly and uniformly on the chondral site
of the cavity. Single layer (3-4 mm thickness) of
gelfoam (spongostan) was then laid down over this,
Gelfoam (spongostan) inserted so (sandwich) in
between graft / cement interface, absorbs heat,
protect the graft. Finally the rest of the cavity was
filled and packed tightly with acrylic cement and
the area was irrigated with normal saline reducing
its local warmth. In all cases, close drain was
inserted on the surface of the bone, were usually
maintained for 3-4 days. The incision was closed,
inner one by delayed absorbable suture (vicryl 2/
0) and the outer skin apposed by monofilament
proline with interrupted stitch without mere
tension. After reconstruction or primary closure,
local skin condition was carefully assayed by its
Evaluation of Outcome of Management of Giant Cell Tumour of Bone by Curettage Imam Gaziul Haque et al
89

colour, circulatory status by needle prick and
documented accordingly.
Post Operative Care: Initially the limb was kept
on long leg posterior plaster slab and on third
generation parental Cephalosporin for subsequent
4-5 days, after that treatment was continued with
oral second generation Cephalosporin. Following
attenuation in drain amount, the tube was
removed usually 4-5 days later with asepsis care.
Limb was kept elevated, muscle building and
stretching exercises were started within the limit
of pain and tender loving care.
Skin stitches were removed on 12-14th post
operative day in all cases of this series, slab was
replaced by cast, and patients were discharged
advising non weight bearing ambulation with
axillary crutch, muscular exercises with
continuation of oral 2nd generation Cephalosporin
for further 3 weeks, advised to attend to follow up
clinic.
Follow up of the Study Subject: Usually the
casts were maintained 6-8 weeks even 10 weeks
depending upon the site and extent of the tumour.
Following removal, gentle active ROM exercises
were advised and continued accordingly. In
addition, patient was also asked to attend the
follow up clinic at 1-2 months interval for the first
6 months and at 3-4 months interval for the next
one year and later was followed at half yearly
interval on the subsequent years, using clinical
evaluation and x-ray findings as tools. Usually local
recurrences appear between 6 months to 3 years
following treatment; so follow up protocol was
scheduled intensely for the first 3 years.
Results: This descriptive cross sectional study was
accomplished to evaluate the outcome of treatment
of giant cell tumor by aggressive curettage,
chemical cauterization, morcellized hone graft in
sandwich technique and augmentation with bone
cement. The study subjects (patients) were treated
in NITOR during the period of January ‘2003 to
December’ 2004. Findings were analyzed based on
dependent and independent variables namely age
and sex distribution, location of the tumour ;
functional outcome were categorized as good, fair
or poor based on complications following surgery
and local recurrence using MSTS scales as with
the assistance of work of Alam10.
Table - I
Age distribution of the patients. (n=11)
Mean age = 30.18 (±SD 10.17) Yrs
Age Group (In yrs) No. of Patients Percentage
16-20 3 27.27
21-30 2 18.18
31-40 4 36.37
41-46 2 18.18
Total 11 100.00
Table - II
Location of Giant Cell Tumour
Site No. of patients Percentage
Distal end of femur 6 54.55
Proximal end of Tibia 4 36.36
Distal end of Tibia 1 9.09
Total 11 100.00
Table -III
Clinical presentation (Sign-Symptoms) of Giant
cell tumour
Clinical presentations No of Percen-
patients tage
Pain 11 100
Enlarging mass 10 90.91
Difficulty in joint motion 8 72,73
Tenderness 6 54.55
Muscle atrophy 4 36.36
Swelling of the adjacent joint 2 18.18
Multiple response
Fig.-1: Pie diagram showing the Post operative
status
Bangladesh Journal of Radiology and Imaging Vol. 22(2): July 2014
90

Table -IV
Final outcome of management of Giant cell tumour
Grade No of patients Percentage
Good 7 63.64
Fair 3 27.27
Poor 1 9.09
Total 11 100.00
Table - V
Distribution of patients by grading of outcome of
management and location of Giant cell tumour
Grading of Location Total
out come Lower end Upper end Lower endof femur of tibia of tibia
Good 4 3 - 7
Fair 1 1 1 3
Poor 0 0 1 1
Total 5 4 2 11
Discussion:
Efficacious treatment of giant cell tumour is based
on adequacy of the removal of tumour and use of
adjuvant to determine local recurrence at earlier.
Above all, the surgical technique is the most
important predictor detecting local recurrence. Nodoubt, early treatment is worthwhile like otherbenign and malignant bone lesions. The goal iscomplete eradication of tumour, preservation ofjoint function as well as salvage of the limb. Theoptimal treatment is a matter of controversy andchoices are versatile but the goal is to reduce therate local recurrence. Out of several modalities,this protocol of treatment is an efficient andoptimal one showing reduced local recurrencewhich is about 8% unlike simple curettage with orwithout bone graft which exhibits local recurrenceof 27 to 50%, and radical excision and amputationrepresenting local recurrence of 0 to 5% 9,11.
So toward planning a treatment protocol, a surgeonmust decide whether to perform intra-lesionalexcision (curettage) salvaging joint and limb orradical excision (Amputation), whether to useadjuvant therapy to eradicate residual microscopic
disease and what material to be used to fill the
resultant defect. The merits of this technique in
respect of superiority are as follows:-
1. Wide extorization making a cortical window
allows complete removal through curettage.
2. Use of 100% phenol during cauterization
coagulates protein, damages DNA.
3. Use of morcellized bone graft (Autogenous +
Allogenic) having reduced bone to bone
interface offers better and early graft
incorporation providing Osteoinductive
stimulous to the chondral site restoring normal
load bearing mechanics.
4. Gelfoam inserted in graft-cement interface
absorbs heat from polymerization of bone
cement protects the chondral graft (morcellized)
from thermal insult. Efficacy of the cement is
not merely filling the defect but also it exerts
tumoricidal effect by heat dispersion, extend
tumour margin clearance by released toxic free
radicals from monomer diffusion. As bone
cement is radiolucent, it facilitates earlier, easy
detection of recurrence. Moreover it provides
immediate mechanical stability and makes the
rehabilitation speedy.
5. Overall functional results were gratifying. Most
of the cases were in the lower femur and upper
end of the tibia 90.91%. In this series, a slight
female predominance though the patients were
from 15 - 50 years of age (Mean age = 30.18yrs).
20 yrs - 40yrs (54.55%) age gr. showed higher
prevalence. In the present study, maximum
follow up was up to 25 months and minimum
of 02 months (mean 8.5 months), but no
recurrence was demonstrated. The weakness
of the study imparted that this was a small
piecemeal study, strict inclusion criteria, the
numbers available were not sufficient to
provide enough power to detect statistical
significance in regard of recurrence between
groups. The data presented here have the
potential to contribute to multi-institutional
studies and meta-analysis. So, in conclusion,
this attempt, a third one can initiate wide
spectrum study in the field of Giant cell tumour
management in future in context of Bangladesh.
Evaluation of Outcome of Management of Giant Cell Tumour of Bone by Curettage Imam Gaziul Haque et al
91

References:
1. Apley AG. Solomon I. 2001. Apliys System of
Orthopaedics and Fractures. 8th edition.
Butterworth - Heinemann Ltd. 175-176.
2. Dorfman, HD.1998. Bone tumour. Mosby inc.
Philadelphia:550.
3. Talukder MS. 1975. Bone Tumor Registry’ in
Bangladesh.
4. Eckrdt, JJ. And Grogan, TJ. 1986. Giant Cell
Tumor of Bone. Clinical orthopaedics and
related research, 204. 45 –57.
5. Campanacci, M. Baldini, N. Boriani, S. and
Sundnese. A. 1987. Giant Cell Tumour of
Bone. The journal of bone and joint surgery,
69(A):ppl06-l 13.
6. Turek, SL. 1984 Orthopaedic Principles and
Their Applications. 4th ed., J.B. Lippincott
Company, Philadelphia, Vol-1 611-638.
7. Cooper, KL. Eckrdt. JJ, Unni, KK And Sim,
HI. 1980. Mam Clinic tumour rounds. BenignGiant Cell Tumor of Bone, 3(11): 142-1148.
8. Carnesale, PC. 1992. Malignant Tumors ofBone. Cambell’s Operative Orthopaedics. 8lh
edn, Vol.1.253-256.
9. Stefano, A. Bini, MD. Kan Gill, MD. AndJames. O. Johnston, MD. 1995. Giant CellTumor of Bone-curettage and cementreconstruction. Clinical Orthopaedics and
related research* 32 K 245-250.
10. Alam. SN. 1985. Evaluation of the Result ofOperative Treatment of Giant Cell Tumourof Bone. The journal of Orthopaedic Society
oj Bangladesh. 20:23-57.
11. Blackle. HR. Wunder, JS. Davis, AM. White,LM. Kandel, R. and Bell, RS. 1999. Treatmentof Giant-Cell Tumors of Long Bones withCurettage and Bone-Grafting. The Journal of
bone and joint surgery, 81 (A), 6:pp. 811-820.
Bangladesh Journal of Radiology and Imaging Vol. 22(2): July 2014
92

Abstract:
Macrodystrophia lipomatosa is a rare cause of
congenital macrodactyly. It can be confused with
other common causes like congenital lymphedema.
Usually it presents with loss of function and
cosmetic problems.
We here report a case of “Macrodystrophia
lipomatosa” who attended Dhaka medical college
hospital with progressive disproportionate
enlargement of the middle finger of right hand.
She underwent debulking operation twice. The
patient had no pain or neurovascular symptoms
and there was no family history of extremity
gigantism. Plain radiograph demonstrated splayed,
elongated, broadened phalanx with soft tissue
swelling along the volar and dorsal aspect of middle
finger of right hand, along with palmer angulation
of that finger. MR images revealed proliferation of
fatty tissue in the same areas, as seen in plain
radiograph with signal intensity similar to that of
subcutaneous fat. Histopathology revealed
abundant adipose tissue with some interspersed
fibrous tissue.
Keywords: Macrodystrophia lipomatosa(MDL).
Macrodactyly.
Introduction:
Macrodystrophia lipomatosa is a rare cause of
congenital macrodactyly, characterized by
progressive proliferation of all mesenchymal
elements with a disproportional increase in fibro
adipose tissue1. Almost always unilateral and can
involve both the upper extremities (usually in the
distribution of the median nerve with the index
and middle fingers most commonly involved) and
CASE REPORTS
Macrodystrophia Lipomatosa - Case ReportFONINDRA NATH PAUL1, MOHAMMAD MIZANUR RAHMAN2, MD ANISUR RAHMAN KHAN3,
DOSTH MOHAMMAD LUTFUR RAHMAN4, ZANNATUL FERDOUS5
1. Junior Consultant, Department of Radiology & Imaging, TB Hospital, Shyamoli, Dhaka. 2. Professor and Head
of Department of Radiology & Imaging, Dhaka Medical College. 3. Assistant Professor, Department of Radiology &
Imaging, DMC. 4. Junior Consultant, Department of Radiology & Imaging, 500 bedded General Hospital, Dhaka.
5. Radiologist, Dhaka Medical College & Hospital
in the lower extremities (usually in the distribution
of planter nerve)2,3. Though the exact etiology of
MDL is not known, various hypothesis exist,
including alteration of somatic cells during limb
bud development, disturbed fetal circulation,
variable form of neurofibromatosis, lipomatous
degeneration, trophic influence of tumified nerve,
in utero disturbance of growth limiting factor or
an error in segmentation. It is usually diagnosed
at birth or during the neonatal period1,2,4.
Case report:
An 11 years old right hand dominant female child
was referred to radiology department for X-ray of
right hand because of excessive growth of her
middle finger that had enlarged gradually since
birth. She had undergone two operations to debulk
the lesion. The patient denied having any pain or
neurovascular symptoms and there was no family
history of extremity gigantism. On physical
examination, non-tender, disproportionately
enlargement of middle finger was found. There
was no overlying cutaneous change, pitting edema
or bruit. The patient was able to use the hand well
and had adequate grip. A plain radiograph
demonstrated splayed, elongated, broadened
phalanx with soft tissue swelling along the volar
and dorsal aspect of middle finger of right hand,
along with palmer angulation of that finger.
Extraction of fat was done through an incision
placed over the dorsum of the middle finger.
Pathological examination of the material revealed
abundant adipose tissue with some interspersed
fibrous tissue.
BANGLADESH JOURNAL OF RADIOLOGY AND IMAGING 2014; VOL. 22(2): 93-95

Both T1W andT2W MRI images revealed
proliferation of fatty tissue on the volar and dorsal
aspect of the middle finger with signal intensity
similar to that of subcutaneous fat with palmer
angulation of the affected digit.
Discussion:
Macrodystrophia lipomatosa (MDL) is uncommon,
congenital, non hereditary localized gigantism
involving usually 2nd or 3rd digits of hand or foot
corresponding to the median and medial planter
nerve supply upper and lower limb respectively5.
Occasionally it involved the entire limb.
Macrodystrophia lipomatosa, this term was first
used by Feriz in 1925 to describe unilateral
overgrowth of the lower limb1. In 1967 Barsky
described it is worth nothing that MDL is
essentially analogous to static localized gigantism5.
Though the exact etiology of MDL is not known,
various hypothesis exist, including alteration of
somatic cells during limb bud development,
disturbed fetal circulation, variable form of
neurofibromatosis, lipomatous degeneration,
trophic influence of tumified nerve, in utero
disturbance of growth limiting factor or an error
in segmentation. It is usually diagnosed at birth
or during the neonatal period 1,2,4.
MDL is characterized by a marked increase all
mesenchymal elements. This is dominated by
adipose tissue in a fine network involving
periosteum, bone marrow, nerve sheath, muscle
and subcutaneous tissue1. It is usually presents at
birth and recognized associated anomalies include
syndactyly, polydactyly, brachydactyly or
clinodactyly. Association with small osseous
protuberance, which resembles osteochondromas
and lipoma in other parts of the body, has also
been reported. The disease is almost always
unilateral, with an equal incidence in males and
female. The growth velocity may differ from digit
to digit and the abnormal growth usually ceases
at puberty. The lower extremity is frequently
involved than upper extremity. The abnormal area
is usually along a specific sclerotome1,5.
Different imaging modalities such as plan
radiography, USG, CT scan and MRI have a rolein the evaluation of MDL. Plain radiographyusually suffices and demonstrates splayed,lengthened and broadened phalanges called
mushroom like appearance with periosteal and
endosteal bone deposition1,5. The overlying soft
tissues are markedly overgrown and within the
soft tissues focal lucent areas representing fat may
be seen, which is characteristic1,6. Both USG and
CT scan can be used to demonstrate the
proliferation of the fat along the nerve territory1.
MRI easily demonstrates the excessive fibro fatty
tissue, which has signal characteristics similar to
X-ray hand shows
elongated, Broadened,
Splayed Phalanges with
surrounding excessive soft
tissue shadow of middle
finger.
Photograph of right hand shows
soft tissue swelling causing
enlargement of middle finger
(local gigantism).
Sagital T1W MRI image reveals
proliferation of fatty tissue (arrows)
on the volar aspect of the middle
finger with signal intensity similar to
that of subcutaneous fat; there is
palmer angulation of the affected digit.
Bangladesh Journal of Radiology and Imaging Vol. 22(2): July 2014
94

subcutaneous fat that is high signal on T1W,
intermediate signal on T2W and low signal on fat
suppressed sequences. The fat in MDL is not
encapsulated. The fibrous strands within the fatty
tissue are seen as low signal intensity linear
strands on T1W images1.
Histopathology shows an abundant increase in
adipose tissue scattered in fine, mesh like fibrous
tissue7.
Differential diagnosis includes (a) Neuro-
fibromatosis, (b) Fibrolipomatous hamartoma of
the median or ulnar nerve, where fatty tissue
accumulates within nerve sheath rather than in
the region, (c) Vascular malformation like
Haemangioma including Maffucci syndrome,
arterio-venous malformation (AVM), Klippel-
Trenaunay-weber syndrome, (d) Chronic
hyperaemia as in Juvenile rheumatoid arthritis,
haemophilia, (e) Hemi-hypertrophy as in Beckwith
Wiedemann syndrome and (f) Russel-Silver
dwarfism5.
Although MDL is considered a progressive form of
macrodactyly (i.e. the growth of the affected parts
is faster than the rest of the body) the growth halts
at puberty5. Surgical intervention is the treatment
of choice for MDL. The main surgical principle of
treating these lesions is to improve the cosmetic
appearance while preserving the neurological
function as much as possible. Through judicious
and planned multiple debulking operations and
partial amputations, good results can be achieved.
However, surgery should be delayed until the
patient’s growth is complete, if the deformity is
not very serious and if no neurological symptoms
are present1.
Complications of MDL include mechanical problems
secondary to degenerative joint disease, or
neurovascular compression due to large
osteophytes. Overzealous debulking procedures
can also lead to nerve injury, the reported incidence
ranged from 30% to 50%. A localized recurrence
rate is about 33% to 60% 1,7.
Conclusion:
MDL is progressive hamartomatous enlargement
of the fibro fatty tissue involving all the layers of
soft tissue. The purpose of this case report is to
create awareness that MDL should be considered
in the differential diagnosis of progressive
disproportionate enlargement of a finger. Plain
radiography usually suffices. Both USG and CT
scan can be used to demonstrate the proliferation
of the fat along the nerve territory. MRI easily
demonstrates the excessive fibro fatty tissue and
the fibrous strands within.
The diagnosis of the above described case is
accomplished on the basis of clinical presentation
and imaging findings on X-ray and MRI.
References:
1. V. Singla, V Virmani, P Tuli, P Singh and N
Khandelwal. Case report: Macrodystrophia
lipomatosa-Illustration of two cases. Indian
J Radiol Imaging. Nov 2008; 18(4):298-301.
2. http://en.wikipedia.org/wiki/Macrodystrophia
lipomatosa.
3. Bailey EJ, Thompson FM, Bohne W, Dyal C.
Macrodystrophia lipomatosa of the foot: a
report of three cases and literature review.
Foot ankle Int. 1997 Feb; 18(2):89-93.
4. AB Goldman and JJ Kaye: macrodystrophia
lipomatosa: Radiographic Diagnosis Am. J.
Roentgenology, Jan 1977; 128(1): 101-105.
5. http://radiopedia. Org/articles/ macrody-
stropha-lipomatosa.
6. Rizwan a Khan, Shagupta Wahab, Ibne Ahmed
and Rajendra S Chana.macrodystrophi
lipomatosa: four case reports: Indian Journal
of Pediatrics 2010, 36:69 doi: 10. 1186/1824-
7288-36-69.
7. Jae Hyun Kwon, So Young Lim, and Ha Seong
Lim. Macrodystrophia lipomatosa: Arch Plast
Surg. May 2013; 40(3):270-272.
Macrodystrophia Lipomatosa - Case Report Fonindra Nath Paul et al
95

Abstract
The polysplenia syndrome (PSS) is a form of situs
ambiguous with multiple spleen, cardiac anomalies,
abdominal heterotaxia, short pancreas, major
venous system and bronchial malformations. It is
a rare syndrome, more often found in childhood,
and only the 10% of the patients that do not have
cardiac anomalies can reach adulthood. Isolated
polysplenia is rather exclusively rare having no other
associated anomaly but multiple spleen. We present
a 52 year old male patient with low grade fever
and mild abdominal pain, who was referred to
Radiology & Imaging Department for USG of whole
abdomen from Out Patient Department. In USG
no single spleen was found; rather multiple soft
tissue masses having echo texture comparable with
spleen were identified in the splenic fossa. A
confirmatory CT scan was performed and
polysplenia was diagnosed. To exclude any
associated anomaly echocardiogram and CT scan
of chest were performed. As no other anomaly was
detected the final diagnosis was made as a case of
isolated polysplenia.
Key words: Polysplenia, splenic nodules, USG,
CT scan.
Introduction
Isolated polysplenia is the single entity that
describes the presence of multiple aberrant splenic
nodules without any associated organic
malformations .Whereas, the polysplenia syndrome(PSS) is a type of situs ambiguous characterized
by left isomerism1,2, conformed by a group of
visceral anomalies of unknown etiology, in which
the presence of multiple aberrant splenic nodules
and wide range of organic malformations exist.
Helwig is credited with describing the Heterotaxia
(polysplenia) syndrome in 1929.The abnormalities
Isolated Polysplenia in Adult Patient – A Case
Report with Review of the LiteratureASHRAF UDDIN KHAN1, MARIYAM SULTANA2, SHIBENDU MAJUMDER3
1 Assistant Professor, Department of Radiology & Imaging, Shaheed Suhrawardy Medical College and Hospital
(ShSMCH). 2 Medical Officer, Department of Radiology & Imaging, Dhaka Medical College Hospital 3. Professor &
Head of department of Radiology & Imaging, Shaheed Suhrawardy Medical College and Hospital (ShSMCH).
that integrate the PSS are wide3; the most constant
– in addition to the polysplenia – are cardiac
malformations, thickening and interruption of the
vena cava, along with abdominal heterotaxia.
Although its presentation is less constant, the
presence of a short pancreas and genitourinary
malformations has also been described. It is a
frequent alteration that is detected mainly in
childhood, 40% of the affected patients reach 2
years of age and the majority dies before the 5th
year4. 5 to 10% lack cardiac involvement, which
allows them to reach adulthood5.
Case report
A 52 year old male, non diabetic, non hypertensive
presented with a 10 days history of low grade fever
and mild abdominal pain in medicine OPD. On
examination no organomegaly was found.
Abdomen was soft and non-tender. No respiratory
distress or palpitation was present. The patient
was referred to Radiology & Imaging Department
for USG of whole abdomen.
In USG no single spleen was found; rather five
soft tissue masses having echotexture comparable
with spleen was identified in the splenic fossa. Each
splenic nodule revealed its own hilum, having
separate artery and vein; confirmed by Color
Doppler. No abdominal lymph-adenopathy was
seen. Abdominal aorta and IVC were in normal
position and appearance. Liver was found in normal
position and echotexture. No sign of any other
organic malformation or heterotaxia was seen.
Confirmatory CT scan was performed and about
five splenic nodules were found in splenic fossa.
Axial and reconstruction sagittal, coronal images
are shown here (figure 1, 2, 3)
BANGLADESH JOURNAL OF RADIOLOGY AND IMAGING 2014; VOL. 22(2): 96-99

Fig.-1 : Axial images
Fig.-2: Sagittal images
Fig.-3 : Coronal images
Fig.-34 : B-mode showing splenic nodules F-5: Color Doppler showing splenic hilar vessels
Isolated Polysplenia in Adult Patient – A Case Report with Review of the Literature Ashraf Uddin Khan et al
97

Single splenic artery arising from abdominal aorta
was found to be branched to give supply in each
splenic nodule, which is evident in USG with Color
Doppler (Fig.- 4)
Thus polysplenia was diagnosed.
Then the patient was advised for echocardiogram
and chest CT scan to explore any other associated
abnormality. Echocardiogram showed normal
findings. No evidence of any congenital or acquired
anomaly was seen.
Chest CT scan showed no aberrant lobe or fissure.
No obstructive or inflammatory or neoplastic
lesion was seen. The case was finally categorized
as isolated polysplenia, as no other organic
malformation could be identified other than
multiple splenic nodules.
Discussion
Usually polysplenia demonstrates as a rare
syndrome involving multiple organ malformation.
According to literature the PSS is a congenital
abnormality usually diagnosed in the childhood
stage because almost half of the cases (41%) display
serious cardiac abnormalities which are frequently
fatal, being the most frequent ones interauricular
and/or interventricular communication,
transposition of great vessels, stenosis or
pulmonary atresia and dextrocardia4,5.
Since 5 to 10% of the cases lack cardiac damage or
only present a small alteration, it allows the
patients to reach adulthood5. PSS in the adult
produces unclear manifestations; the presence of
polysplenia, situs ambiguous or situs inversus
(21%) is enough to establish the diagnosis1,2,3;
which is generally unsuspected and thus fortuitous
in nature2,3.
The case we presented here has the characteristics
of only one organ malformation that is the
polysplenia. The unique sign of the isolated
polysplenia is the presence of multiple spleens,
ranging from 2 to 16. Five splenic nodules were
found in this case primarily located throughout
the superolateral aspect of left kidney.
Among the vascular anomaly hypoplasia of the
inferior vena cava with absence of its intrahepatic
segment is described6.
The cardiovascular system is the part of the fetal
anatomy that most frequently suffers from
congenital pathology7.A wide range of cardiac
anomaly including hypoplastic left heart syndrome,
tricuspid atresia, single ventricle, transposition of
great arteries, interruption of the aortic arch,
double aortic arch, right-sided aortic arch etc are
described. However in our case no cardiac anomaly
was detected, most fortunate for the patient.
When the alteration involves the pancreas, a
diminution in its dimensions takes place (short
pancreas)8,9,10. By USG and CT scan all of these
anatomical alterations are excluded. The other
alterations include the development of bilateral
lobulated lungs (60%) and genitourinary
malformations like renal agenesis, hypoplastic
kidneys, and duplication of thex collector collecting
systems, which were luckily absent in this case.
The malformations of our patient were limited to
the spleen, which is not symptomatic. This makes
a good result for the patient in the medium to long
term with a favorable prognosis.
References
1. Vaughan TI, Hawkins LP, Elliot LP.
Diagnosis of polysplenia syndrome. Radiology
1971; 101: 511-518.
2. Gayer G, Apter SS, Jonas T, et al. Polyspenia
syndrome detected in adulthood. Report of
eight cases with review of the literature.
Abdominal Imaging 1999; 24: 178-184.
3. Vossen PG, Van Hedent EF, DegryseHR ,et
al. Computed tomography of the polysplenia
syndrome in the adult. Gastrointestinal
Radiology1987; 12: 209-211.
4. Mclhenny. Biliary atresia and polysplenia
syndrome.AJR 1996: 271-272.
5. Abramson SJ, Berdon WE, Altman RP, et al.
Biliary atresia and non cardiac poli-splenic
Bangladesh Journal of Radiology and Imaging Vol. 22(2): July 2014
98

syndrome: US and surgical considerations.
Radiology1987; 163: 377-379.
6. Ito K, Matsunaga N, Mitchell D, et al. Imaging
of congenital abnormalities of the portal
venous system. AJR 1997; 168: 233-237.
7. Chiappa E. The impact of prenatal diagnosis
of congenital heart disease on pediatric
cardiology and cardiac surgery. J Cardiovasc
Med 2007; 8:12–6.
8. Sener RN, Alper H. Polysplenia syndrome: A
case associated with transhepatic portal vein,
short pancreas anf left inferior vena cava withhemiazygous continuation. Abdominal
Imaging 1994; 19: 64-66.
9. Hadar H, Gadoth N, Herskovitz P, et al. Shortpancreas in polysplenia syndrome.ActaRadiol1991; 32: 299-301.
10. Herman TE, Siegel MJ. Polysplenia syndromewith congenital short pancreas. AJR 1991;156: 799-800.
Isolated Polysplenia in Adult Patient – A Case Report with Review of the Literature Ashraf Uddin Khan et al
99

Abstract:
Carotid Carvernous Fistula (CCF) is an abnormal
communication between the internal or external
carotid arteries and the cavernous sinus. Abnormal
communications may occur due to traumatic or
spontaneous etiology. This results in the short
circuiting of the arterial blood with the venous
system of the cavernous sinus. Direct CCF
represents 70-90%. Dural carotid cavernous fistula
occurs commonly in middle aged to elderly women.
Traumatic carotid cavernous sinus fistula occurs
more commonly in young individual. Nearly all
patients experience progressive occular
complications. A 39 years old lady presented with
protrusion & redness of right eye ball and swelling
of eyelids. She also had complaints of visual
disturbance and headache for 08 months. She had
history of HTN. She was 4th gravida. She
developed all her signs and symptoms while she
was 6 months pregnant and gave birth to a male
baby few months back but her complaints still
persisted.
Imaging studies: CT and MRI of brain and eye
ball were done and she was suspected of having
carotid cavernous fistula on right side. The
definitive diagnostic modality is cerebral angiogram
with selective catheterization of the internal &
external carotid arteries on both sides. Diagnosis
was confirmed and all vascular contributions to
the fistula were visualized. Immediately medical
treatment was started but definitive surgical
treatment was yet to start.
Introduction :
Carotid carvernous fistula (CCF) is abnormal
communications between the carotid arterial
system and the carvernous sinus. They can be
spontaneous or acquired. Classified as direct or
indirect1. Direct CCF represents 70-90% of all
cases. Dural carotid carvernous fistula commonly
occurs in the middle aged to elderly women, while
traumatic carotid cavernous sinus fistula occurs
Carotid Cavernous Fistula (CCF): A Case ReportSYED ZOHERUL ALAM
Classified specialist in Radiology & Imaging, CMH, Dhaka.
commonly in young individual2. Spontaneous direct
CCF is often associated with underlying collagen
defiencies, such as Ehlers-Danlos syndrome3.
CT and MRI are useful in assessing the degree of
associated cerebral parenchymal injury, oedema
and orbital changes. Digitally substracted
angiography is pivotal in characterizing the
vascular abnormality, diagnosis and guiding the
endovascular treatment.
Case Report:
Mrs Rina Akter of 39 years old, hailing from
keraniganj, Dhaka was admitted in Bangabandhu
Sheikh Mujib Medical University(BSMMU) with
the complaints of protrusion, redness and visual
disturbance of right eye and headache for 8
months. She was also suffering from
hypertension. All her signs and symptoms
gradually started while she was 6 months
pregnant. She gave birth to a normal baby 2
months back but her complaints still persisted.
She was obese and nondiabetic. Her biochemical
and haematological profiles were almost within
normal limit at the time of examination except
raised blood sugar.
Fig.-1
BANGLADESH JOURNAL OF RADIOLOGY AND IMAGING 2014; VOL. 22(2): 100-102

CT scan and MRI of brain / orbit were done whichshowed suspected right sided carotid carvernousfistula with adjacent engorged vessels andproptosis of right eyeball. No bony lesion could bedetected in the skull base or orbit.
Angiogram findings: Dilated pool of contrast was
found in the cavernous part of right internal carotid
artery (ICA), from there dilated and tortuous right
superior ophthalmic vein and other abnormal
engorged vessels were visualized. Cerebral
branches of right ICA was deficit, rather right ACA
and MCA were visualized from opposite side i.e
when catheter was introduced on left side. Jugular
venous channels were visualized in arterial phase.
Renal angiogram was also done as she was having
high blood pressure but renal angiogram was found
normal.
So diagnosis was confirmed after carotid and
cerebral angiogram. Extension and vascular
contributions were also detected from angiogram.
Discussion:
CCF results in short circuiting of the arterial blood
with the venous system of cavernous sinus.
Angiographically Barrow classified CCF into four
types: Type A, a direct shunt between the intra
cavernous part of internal carotid artery (ICA) and
Fig.-2
Fig.-3
Fig.-4
She was sent in cath lab of CMH Dhaka forcerebral and carotid angiogram, to confirm thediagnosis and to find out the extension andcontribution of the vessels. Vascular entry was
right femoral artery (RFA) and catheter used 6
FR, JR-4. During the procedure, in the angiogram
suite, patient was having high blood pressure (160/
110 mmHg) and she was given antihypertensive
drugs (Tab. Amdocal and nificap).
Fig.-5
Carotid Cavernous Fistula (CCF): A Case Report Syed Zoherul Alam et al
101

the cavernous sinus: Type B, a dural arteriovenous
fistula (AV) supplied by the ICA; Type C, a dural
AV fistula supplied by the external carotid artery
(ECA) ; and Type D, a dural AV fistula supplied by
both ICA and ECA. Types B, D and C are often
grouped under the common definition of dural or
indirect carotid cavernous fistulas. Indirect fistulas
are often low flow lesions whereas direct fistula
demonstrate high flow4.
The most frequent cause of direct CCF is (a)
trauma, which accounts for 70-90% of cases (Motor
vehicle accidents, falls or penetrating injury) (b)
Iatrogenic injury may also occur during carotid
angioplasty, trans-sphenoidal hypophysectomy andnasopharyngeal biopsies, (c) Spontaneous directCCF, are often associated with underlying collagendeficiencies such as Ehlers Danlos syndrome.Indirect types (Barrow types B, C and D) are AVfistulas located within the dura surrounding the
cavernous sinus and result from spontaneous
rupture of small dural arteries. Most frequently
in middle aged women, secondary to hypertension
or hormonal factors associated with pregnancy or
menopause5.
Patient of CCF may present with following occular
complaints: Red eye, diplopia, bruit, decreased
vision, bulging eye and facial pain in the
distribution of the first division of the trigeminal
nerve6.
Various diagnostic methods have been described
for CCFs. CT scan, magnetic resonance imaging
(MRI) and orbital echography often help to confirm
the diagnosis, demonstrating extraocular muscle
enlargemant, dilatation of one or both superiopr
ophthalmic veins and enlargemant of the affected
cavernous sinus. Definitive diagnostic test is
cerebral angiography with selective catheterization
of the internal and external carotid arteries on
both sides. Cerebral angiography is the modality
which can show all arterial contributions to the
fistulae. DSA mode is preferable for angiography.
Management of a case of CCF requires medical
and surgical care. Currently, most CCF, direct or
indirect, is treated by endovascular techniques.
Indications for surgical intervention are rare. Both
transarterial and transvenous endovascular routes
may be used to treat direct (type A) CCFs. While
in indirect fistulas (type B, C and D) are more often
managed with transvenous techniques7.
Conclusion:
Catheter angiogram is the best diagnostic test for
CCFs. Early proper diagnosis and prompt minimal
invasive endovascular procedure can reverse the
condition, so that a patient can again see the
horizon; sunrise or sunset.
References
1. Harish stownkeer, Carotid cavernous fistula,
Pathogensis and routes of approach of
endovascular treatment, skull base, 2001,
11(3): 207-218
2. Hirai T, Korogi Y, Baba Y, et al. Dural carotidcavernous fistulas : role of conventionalradiation therpy-long-term results withirradiation, embolization or both, Radiology
1998; 207:423-430
3. Barrow DL, Spector RH,Baraun IF, et al.Classification and treatment of spontaneouscarotid cavernous sinus fistulas. J Neurosurg
1985;62:248-256
4. Kupersmith MJ, Satterfield D, Dublin AB, et
al. Dural and carotid cavernous sinus fistulas:
diagnosis, management and complications.Ophthalmology 1987;94:1585-1600
5. Katsiotis P, Kiriakopolous C, Taptas J.
Carotid-cavernous fistulae and dural arterio-
venous shunts. J Vasc Surg 1974;8:60-69
6. Irgrid U scalt, Carotid cavernous fistula;Medscape: 2012, 17/1/12-i-net.
7. Anne G osborn; Diagnostic Neuroradiology;
1994;1:238-239.
Bangladesh Journal of Radiology and Imaging Vol. 22(2): July 2014
102
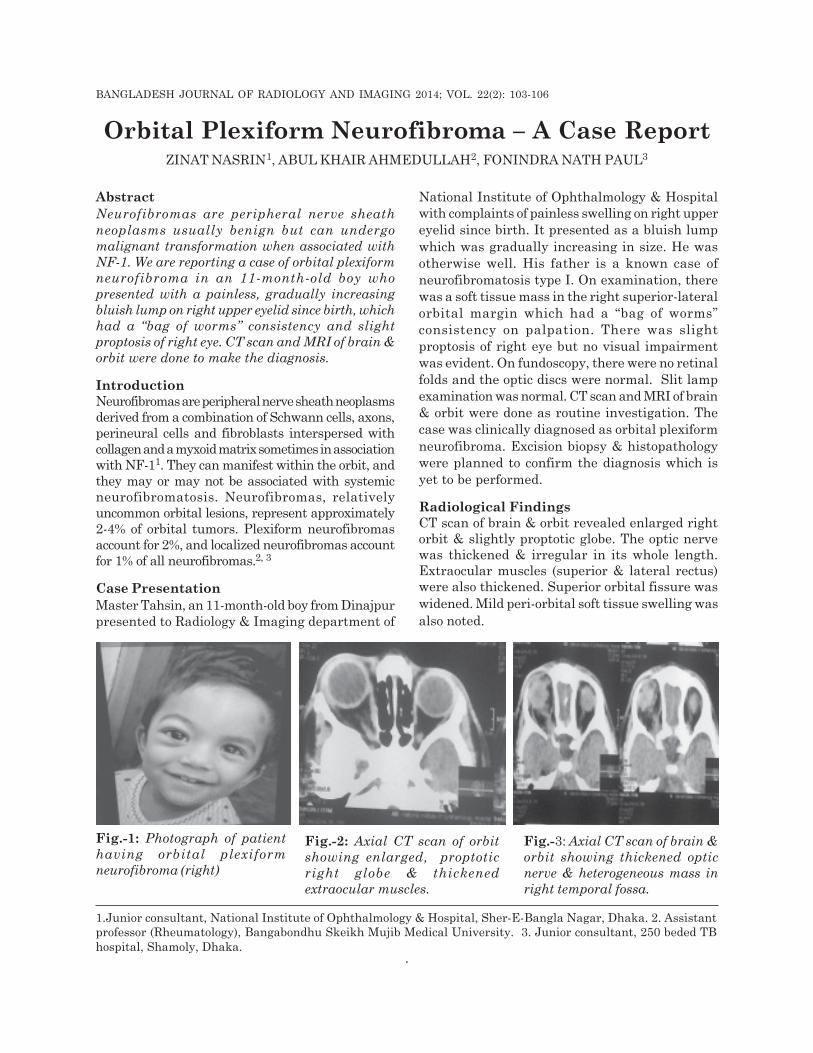
Abstract
Neurofibromas are peripheral nerve sheath
neoplasms usually benign but can undergo
malignant transformation when associated with
NF-1. We are reporting a case of orbital plexiform
neurofibroma in an 11-month-old boy who
presented with a painless, gradually increasing
bluish lump on right upper eyelid since birth, which
had a “bag of worms” consistency and slight
proptosis of right eye. CT scan and MRI of brain &
orbit were done to make the diagnosis.
Introduction
Neurofibromas are peripheral nerve sheath neoplasmsderived from a combination of Schwann cells, axons,perineural cells and fibroblasts interspersed withcollagen and a myxoid matrix sometimes in associationwith NF-11. They can manifest within the orbit, andthey may or may not be associated with systemicneurofibromatosis. Neurofibromas, relativelyuncommon orbital lesions, represent approximately2-4% of orbital tumors. Plexiform neurofibromasaccount for 2%, and localized neurofibromas accountfor 1% of all neurofibromas.2, 3
Case Presentation
Master Tahsin, an 11-month-old boy from Dinajpur
presented to Radiology & Imaging department of
Orbital Plexiform Neurofibroma – A Case ReportZINAT NASRIN1, ABUL KHAIR AHMEDULLAH2, FONINDRA NATH PAUL3
1.Junior consultant, National Institute of Ophthalmology & Hospital, Sher-E-Bangla Nagar, Dhaka. 2. Assistantprofessor (Rheumatology), Bangabondhu Skeikh Mujib Medical University. 3. Junior consultant, 250 beded TB
hospital, Shamoly, Dhaka.
National Institute of Ophthalmology & Hospital
with complaints of painless swelling on right upper
eyelid since birth. It presented as a bluish lump
which was gradually increasing in size. He was
otherwise well. His father is a known case of
neurofibromatosis type I. On examination, there
was a soft tissue mass in the right superior-lateral
orbital margin which had a “bag of worms”
consistency on palpation. There was slight
proptosis of right eye but no visual impairment
was evident. On fundoscopy, there were no retinal
folds and the optic discs were normal. Slit lamp
examination was normal. CT scan and MRI of brain
& orbit were done as routine investigation. The
case was clinically diagnosed as orbital plexiform
neurofibroma. Excision biopsy & histopathology
were planned to confirm the diagnosis which is
yet to be performed.
Radiological Findings
CT scan of brain & orbit revealed enlarged rightorbit & slightly proptotic globe. The optic nervewas thickened & irregular in its whole length.Extraocular muscles (superior & lateral rectus)were also thickened. Superior orbital fissure was
widened. Mild peri-orbital soft tissue swelling was
also noted.
Fig.-3: Axial CT scan of brain &
orbit showing thickened optic
nerve & heterogeneous mass in
right temporal fossa.
Fig.-1: Photograph of patient
having orbital plexiform
neurofibroma (right)
Fig.-2: Axial CT scan of orbit
showing enlarged, proptotic
right globe & thickened
extraocular muscles.
BANGLADESH JOURNAL OF RADIOLOGY AND IMAGING 2014; VOL. 22(2): 103-106
.

MRI revealed enlarged right globe with lobulated
ill-defined soft tissue mass extending from anterior
aspect of globe to apex, involving extra & intraconal
space of right orbit & also having extension into
the right temporal fossa through the widened
Superior orbital fissure . The right optic nerve was
thickened & irregular in its whole length. Superior
rectus, lateral rectus and preseptal space of upper
lid were thickened. The lesions were isointense in
T1-weighted images and heterogeneously
hyperintense signal in T2-weighted images. After
i.v contrast no significant enhancement was noted.
Discussion
Plexiform neurofibromas occur in about 60% of
neurofibromatosis type 1(NF-1) patients and can
lead to severe morbidity by disfigurement or
compression of vital structures. Moreover, these
tumors can undergo malignant transformation.
Neurofibromas may broadly be classified as
plexiform, diffuse, or localized tumors.
Plexiform Neurofibromas: Plexiform
neurofibromas are the most common subtype
encountered in the orbit and are closely associated
with Neurofibromatosis type 1 (NF-1). Some
Fig : 4 & 5: Axial T2W MRI: showing heterogeneous mass in right
retro-orbital space with extension into right temporal fossa.Fig: 6 Coronal T1W MR Image
showing thickened extra-ocular
muscles
Fig : 7 & 8: Sagittal T1 & T2W MRI: showing thickened right optic nerve and superior rectus muscle.
Bangladesh Journal of Radiology and Imaging Vol. 22(2): July 2014
104

authors consider these tumors to be
pathognomonic for NF1, though case reports of
orbital plexiform neurofibomas in the absence of
other findings suggest that these lesions may
instead be highly suggestive of the diagnosis4, 5.
They typically present early in life and appear
clinically as infiltrative, multi-nodular masses
growing along the course of peripheral nerves.
Like diffuse neurofibromas, they are typically
poorly circumscribed and vascular.1 Classic
characteristics include a “bag-of-worms”
consistency and eyelid involvement producing an
S-shaped mechanical ptosis (deformity).
Approximately 20% of tumors associated with NF1
may undergo malignant transformation.2
Diffuse Neurofibromas: A more recently
recognized variant similar to plexiform
neurofibroma, diffuse (or diffuse
plexiform) neurofibroma is vascular, infiltrative in
nature, and presents early in life. Diffuse
neurofibromas demonstrate infiltration into the
subcutaneous fat leading to a distinct clinical
appearance of dermal and subcutaneous
thickening. They are thought to be congenital,
though they may not be apparent at birth. Diffuse
neurofibromas are associated with NF1 in at least
10% of cases.6,7
Localized Neurofibromas: Localized (or isolated)
neurofibromas are focal, well-circumscribed
neoplasms that typically present in the superior
orbit during the third to fifth decade of life with a
slowly progressive mass effect.4 They most
frequently involve branches of the frontal nerve.3
11-28% of patients with localized neurofibromas
have a family history or systemic signs of NF1.1
In the absence of NF1, they only rarely undergo
malignant degeneration.8 These tumors are less
vascular than plexiform and diffuse neurofibromas,
and they can often be differentiated from plexiform
and diffuse lesions by imaging studies. The
occurrence of multiple localized neurofibromas has
been reported and may represent a “form fruste”
NF1.4
Plexiform neurofibromas are almost always
associated with NF1, whereas localized
neurofibromas are associated with NF1 in a
minority of cases. NF1 is a neurocutaneous
disorder that affects 1 in 3000 individuals and is
characterized by multiple café au lait spots and
cutaneous neurofibromas. It is inherited in an
autosomal dominant fashion, although 50% of cases
may be sporadic, and has been mapped to a gene
locus on chromosome 17q11.2.9
Management
Plexiform neurofibromas are more difficult to
remove because of their relative vascularity and
lack of clear margination. Removal may be
complicated by subtotal resection, and recurrence
or re-growth is common3.Large lesions may
ultimately require exenteration.2
Prognosis
Neurofibromas in the setting of NF1 develop
malignant transformation in 20% of cases2 and
require routine monitoring. In the absence of NF1,
localized neurofibromas rarely undergo malignant
transformation, but recurrence has been
occasionally reported following surgical removal.1
Patients should be advised to have routine follow
up with their ophthalmologist. With the
advancement in technology, the management
should depend on the clinical features and the
extent of involvement.
References
1. Gunkel AR, Freysinger W, and Thumfart WF;
“Experience with various 3-dimensional
navigation systems in head and neck surgery,”
Archives of Otolaryngology, 2000, vol. 126,
no. 3, pp. 390–395.
2. Karcioglu Z. Clinicopathologic Correlates in
Orbital Disease. Duane’s Foundations of
Clinical Ophthalmology, 2006, Vol 3, Chapter
17. Lippincott Williams & Wilkins.
3. Misra S. Recurrent neurofibroma of the orbit.
Australas Med J. 2013 Apr 30; 6 (4):189-91.
4. Savar A and Cestari DM, “Neurofibromatosis
type I: genetics and clinical manifestations,”
Seminars in Ophthalmology, 2008, vol. 23 (1),
pp. 45–51.
5. M. D. Poole, “Experiences in the surgical
treatment of cranio-orbital neuro-
Orbital Plexiform Neurofibroma – A Case Report Zinat Nasrin et al
105

fibromatosis,” British Journal of Plastic
Surgery, 1989, vol. 42, no. 2, pp. 155–162.
6. I.T. Jackson, A. Carbonnel, Z. Potparic, and
K. Shaw, “Orbitotemporal neurofibromatosis:
classification and treatment,” Plastic and
Reconstructive Surgery, 1993, vol. 92, no. 1,
pp. 1–11.
7. G. B. Krohel, P. N. Rosenberg, J. E. Wright,
and R. S. Smith, “Localized orbital
neurofibromas,” American Journal of
Ophthalmology, 1985, vol. 100, no. 3, pp. 458–
464.
8. M. H. Erb, N. Uzcategui, R. F. See, and M.
A. Burnstine, “Orbitotemporal neuro-
fibromatosis: classification and treatment,”
Orbit, 2007, vol. 26, no. 4, pp. 223–228.
9. ht tp : / /www.uptodate . com/contents /
n e u r o f i b r m a t o s i s - t y p e - 1 - v o n -
recklinghausens.
Bangladesh Journal of Radiology and Imaging Vol. 22(2): July 2014
106


