NSP-74-103 Revision 1 November 1982 30.2874.0103 MONTICELLO NUCLEAR GENERATING PLANT PLANT UNIQUE ANALYSIS REPORT VOLUME 3 VENT SYSTEM ANALYSIS Prepared for: Northern States Power Company Prepared by: NUTECH Engineers, Inc. San Jose, California Prepared by: Dr. T. I. Hsu, P.E. Project Engineer Approved by: Approved by: I. D..McInnes, P.E. Engineering Manager Issued by: T. A Wenner, P.E. Engineering Director M. F Aleksey Project Manager T. J. lfor Project Director 8212210333 821215 PDR ADOCK 05000263 P PDR nuteph
Chugging Lateral Loads for Multiple Downcomers - Maximum Overall Effects
Chugging Lateral Loads on Two Downcomers Maximum Local Effects
Load Reversal Histogram for Chugging Downcomer Lateral Load Fatigue Evaluation
Chugging Vent System Internal Pressures
Support Column Pre-Chug Submerged Structure Load Distribution
Downcomer Longitudinal Bracing and Tie Rods Pre-Chug Submerged Structure Load Distribution
Support Column Post-Chug Submerged Structure Load Distribution
Downcomer Longitudinal Bracing and Tie Rods Post-Chug Submerged Structure Load Distribution
Support Column SRV Discharge Submerged Structure Load Distribution
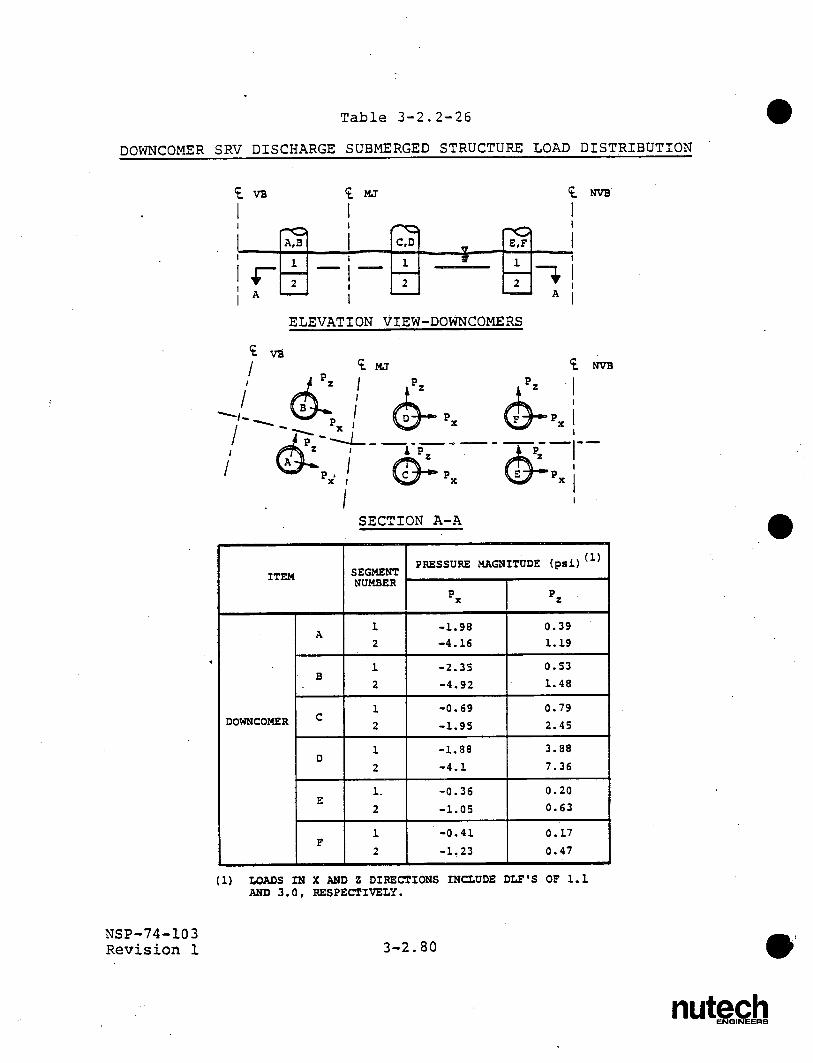
Downcomer SRV Discharge Submerged Structure Load Distribution
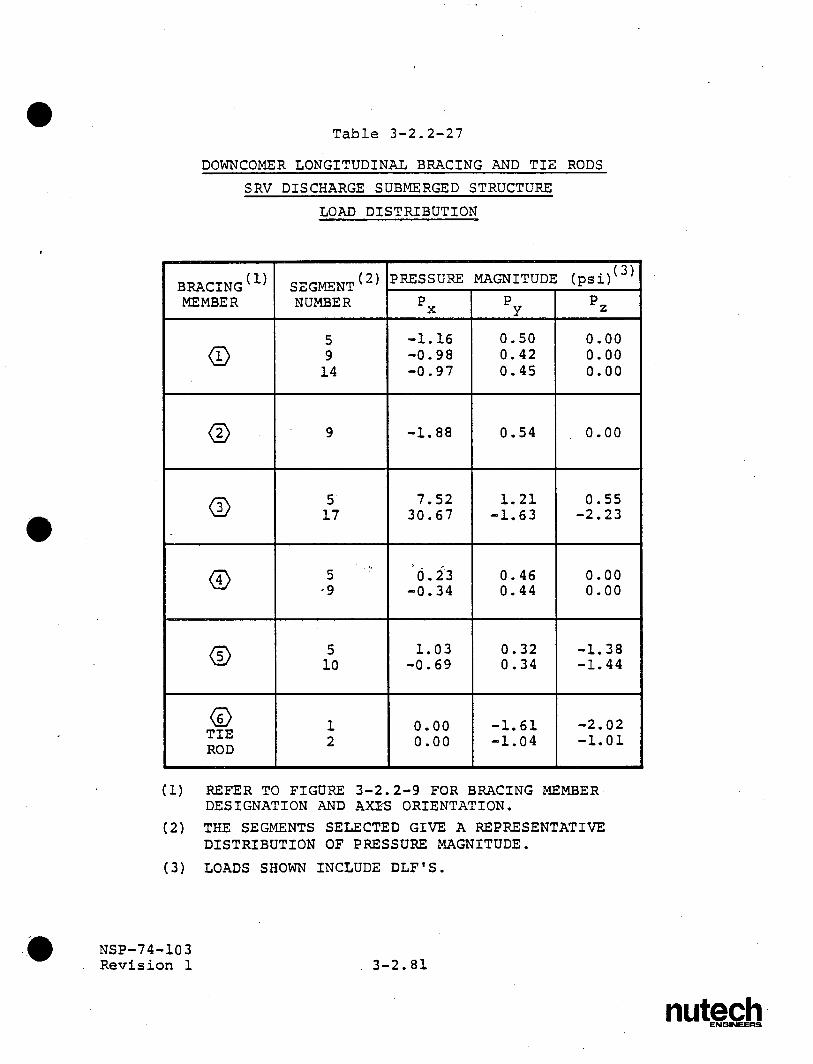
Downcomer Longitudinal Bracing and Tie Rods SRV Discharge Submerged Structure Load Distribution
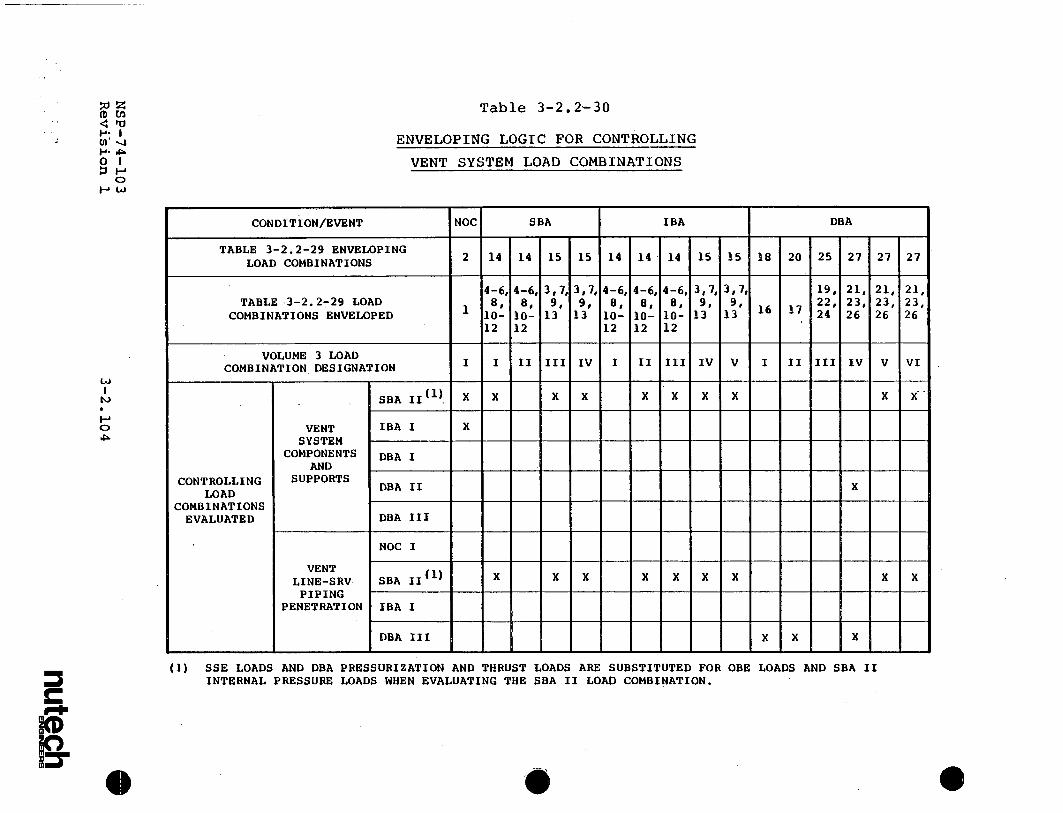
Mark I Containment Event Combinations
Controlling Vent System Load Combinations
Page
3-2.69
3-2.70
3-2.71
3-2.72
3-2.73
3-2.74
3-2.75
3-2.76 03-2.77
3-2.78
3-2.79
3-2.80
3-2.81
3-2.101
3-2.102
NSP-74-103 Revision 1
nutech ENGINEERS
3-xi
Number
3-2.2-30
3-2.3-1
3-2.3-2
3-2.4-1
3-2.4-2
3-2.5-1
3-2.5-2
3-2.5-3
3-2.5-4
3-2.5-5
3-2.5-6
3-2.5-7
3-2.5-8
LIST OF TABLES (Concluded)
Title Page
Enveloping Logic for Controlling Vent System Load Combinations 3-2.104
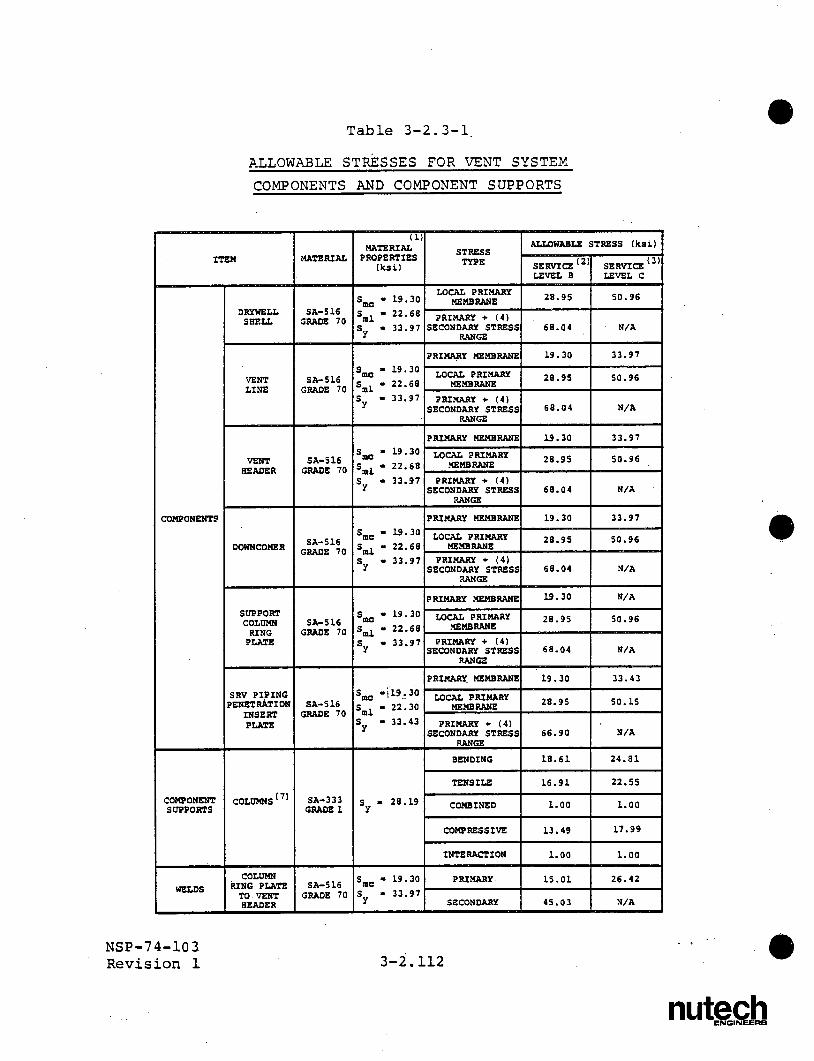
Allowable Stresses for Vent System Components and Component Supports 3-2.112
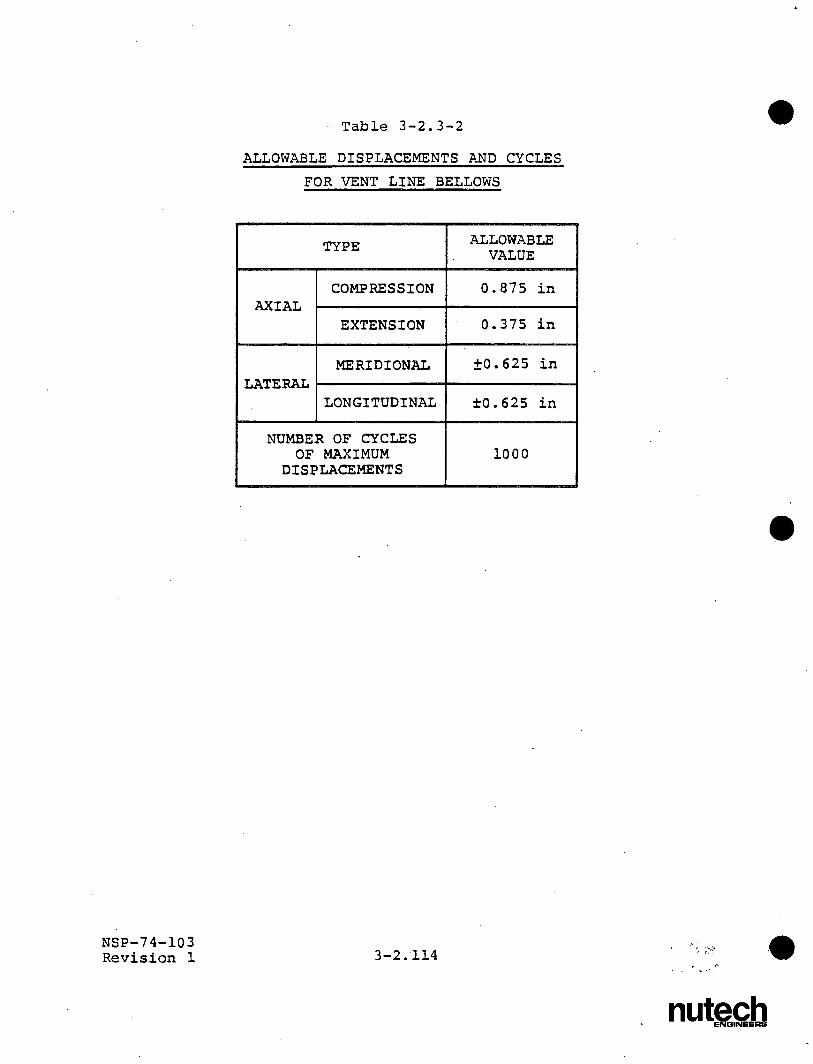
Allowable Displacements and Cycles for Vent Line Bellows 3-2.114
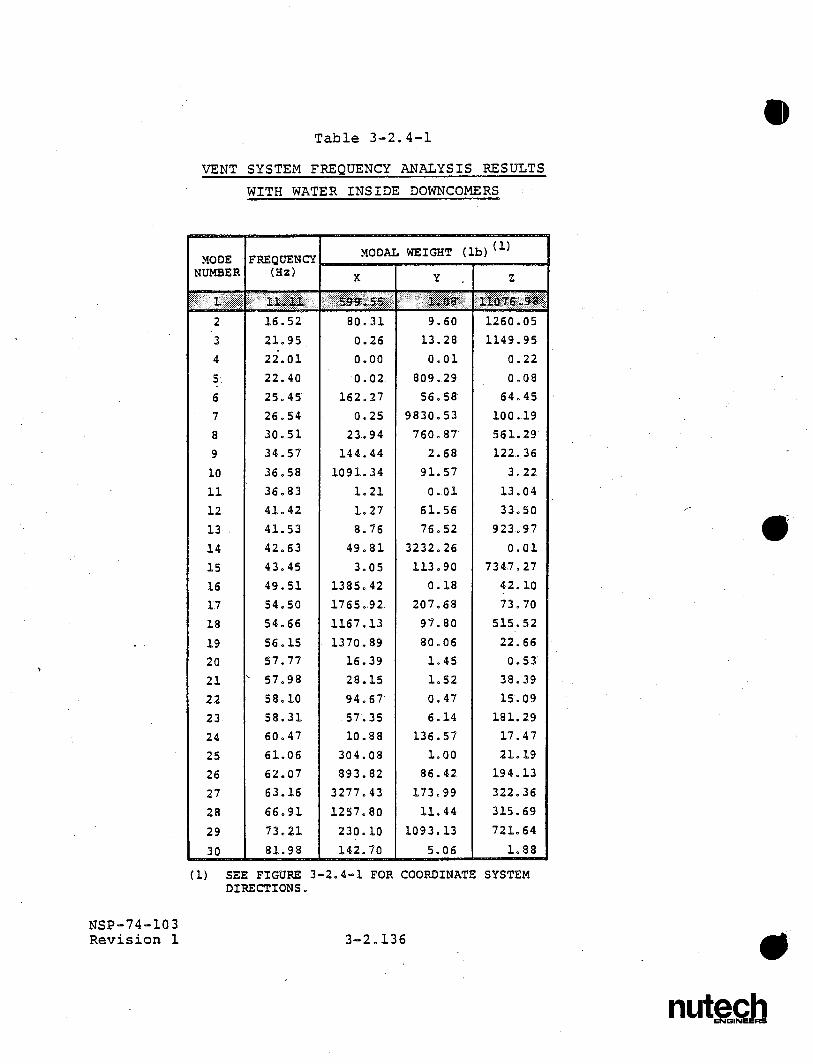
Vent System Frequency Analysis Results With Water Inside Downcomers 3-2.136
Vent System Frequency Analysis Results Without Water Inside Downcomer 3-2.137
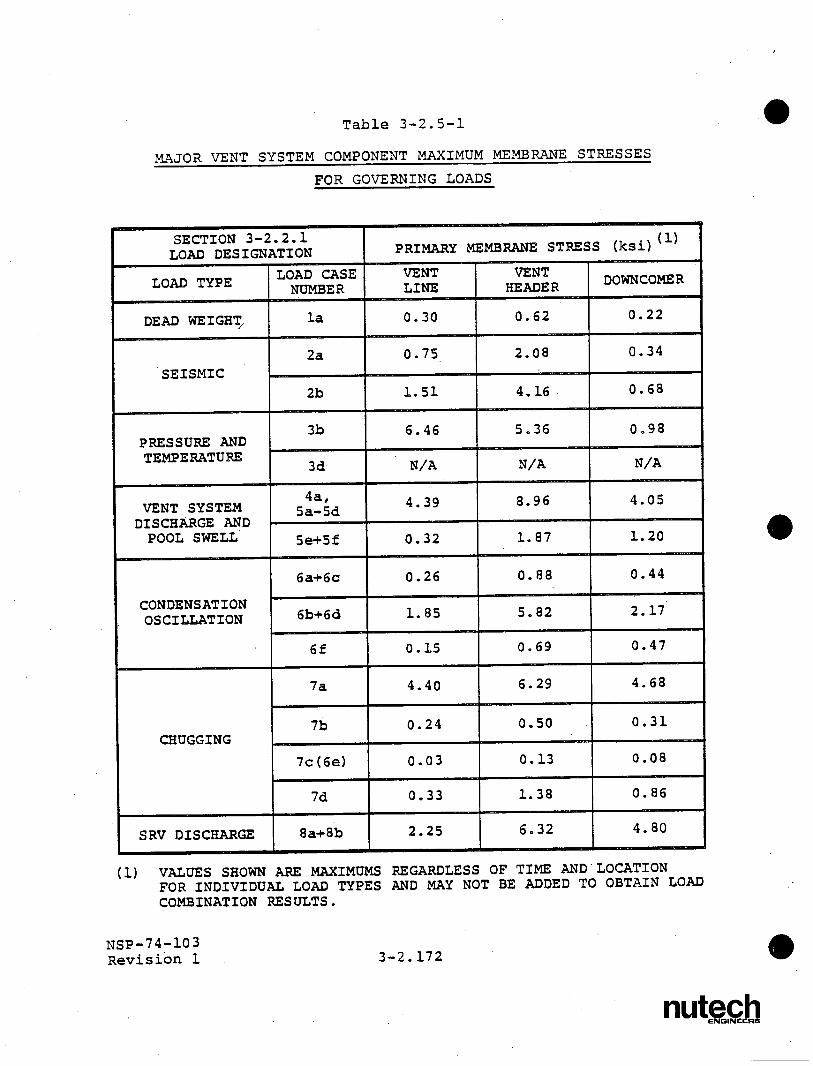
Major Vent System Component Maximum Membrane Stresses for Governing Loads 3-2.172
Maximum Column Reactions for Governing Vent System Loads 3-2.173
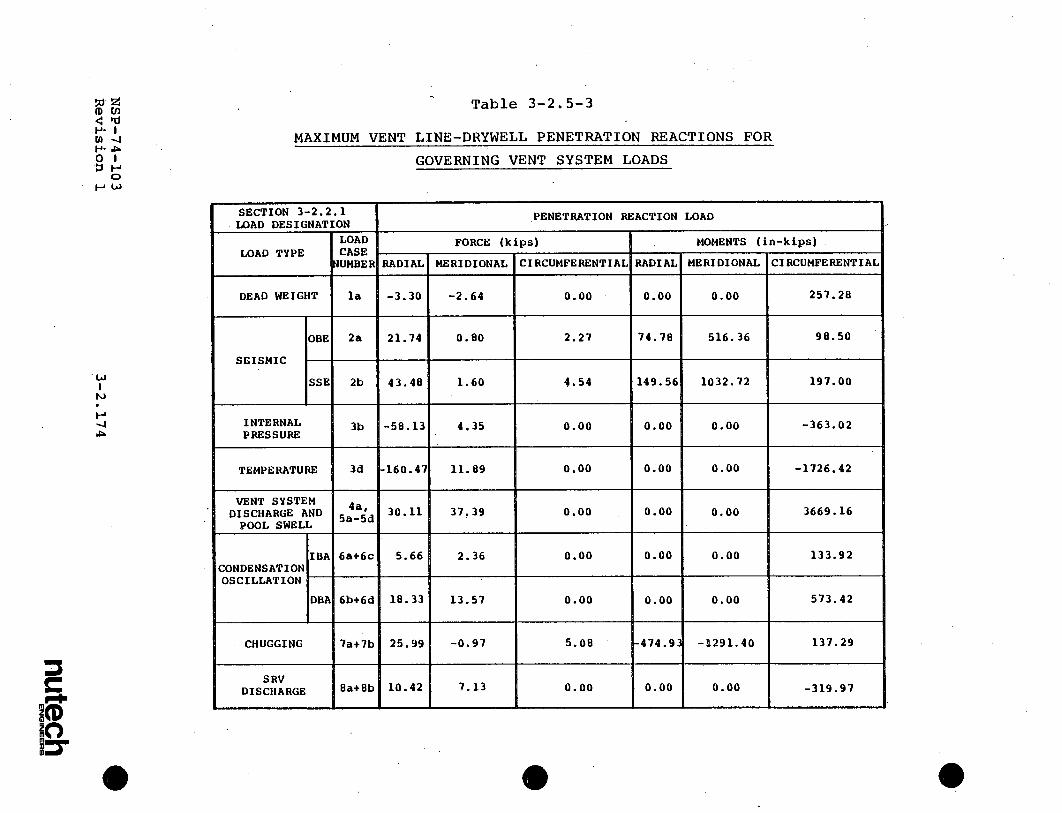
Maximum Vent Line-Drywell Penetration Reactions for Governing Vent System Loads 3-2.174
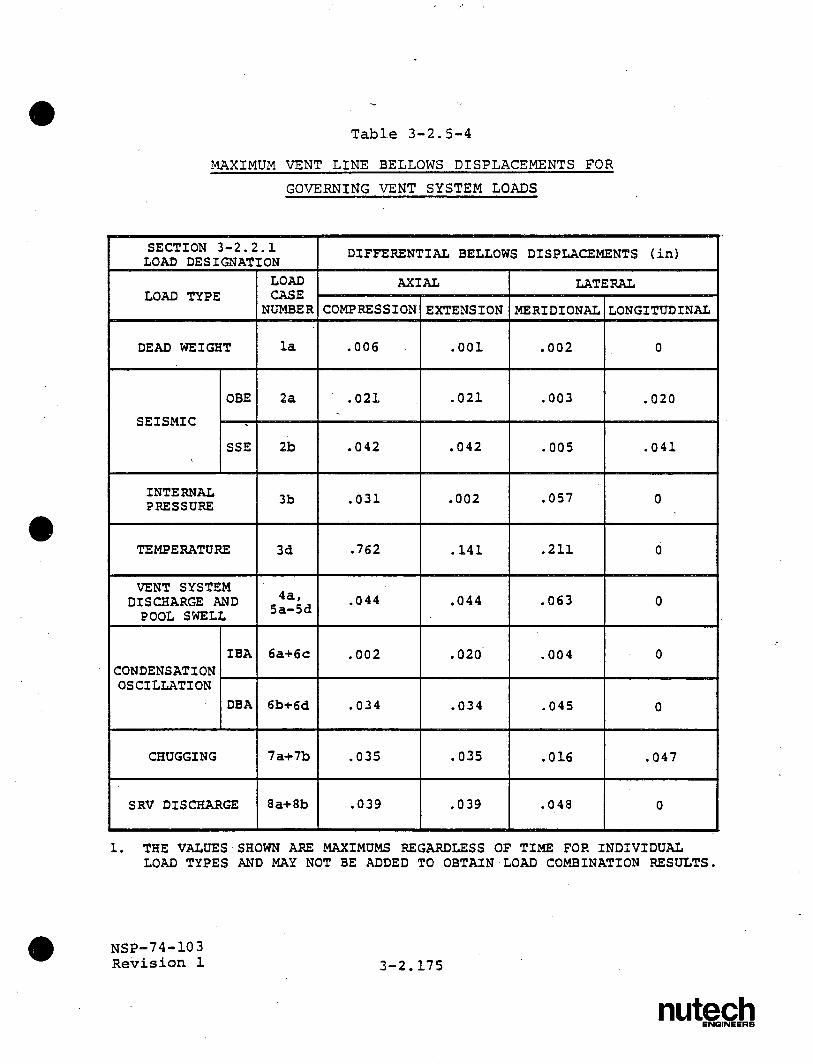
Maximum Vent Line Bellows Displacements For Governing Vent System Loads 3-2.175
Maximum Vent System Stresses For Controlling Load Combinations 3-2.176
Maximum Vent Line-SRV Piping Penetration Stresses for Controlling Load Combinations 3-2.178
Maximum Vent Line Bellows Differential Displacements for Controlling Load Combinations 3-2.179
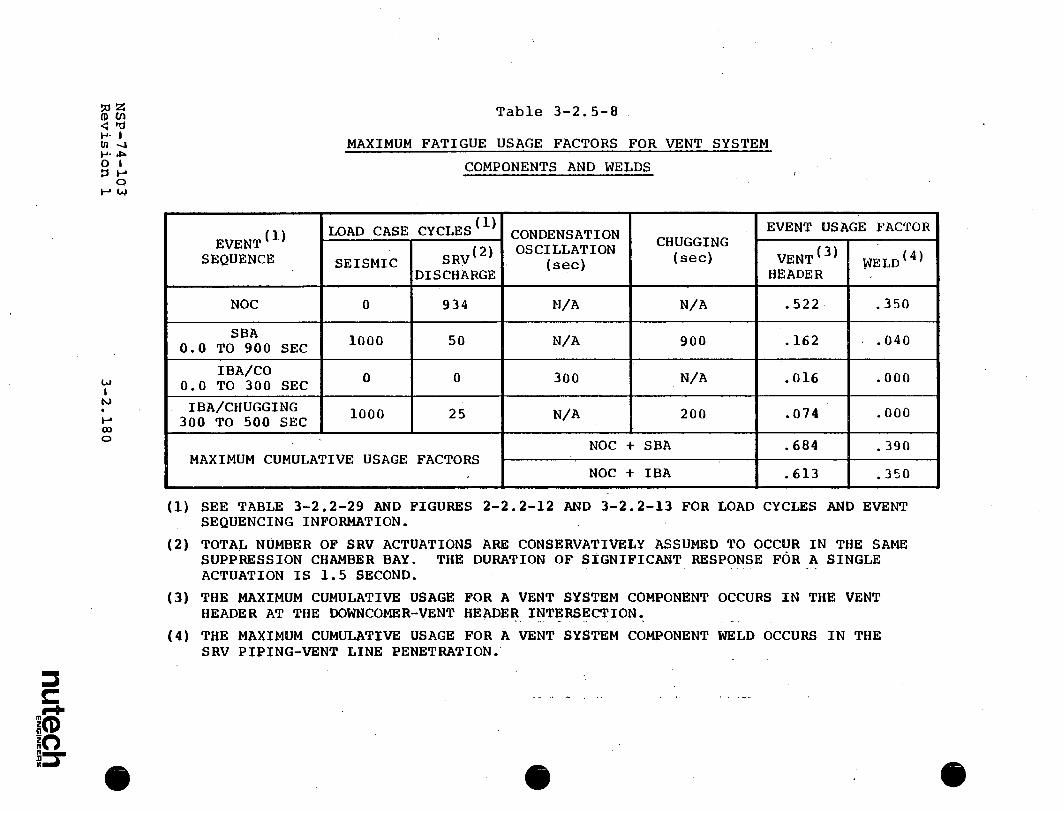
Maximum Fatigue Usage Factors For Vent System Components and Welds 3-2.180
NSP-74-103 Revision 1
3-xii
nutech ENGINEERS
Number
3-2.1-1
3-2.1-2
3-2. 1-3
3-2.1-4
3-2.1-5
3-2.1-6
3-2.1-7
3-2.1-8
3-2.1-9
3-2.1-10
3-2.1-11
3-2.1-12
3-2.1-13
3-2.1-14
3-2.2-1
3-2.2-2
3-2.2-3
3-2.2-4
NSP-74-103 Revision 1
LIST OF FIGURES
Title
Plan View of Containment
Elevation View of Containment
Suppression Chamber Section Midbay Vent Line Bay
Suppression Chamber Section Miter Joint
Suppression Chamber Section Midbay Non-Vent Line Bay
Developed View of Suppression Chamber Segment
Vent Line Details - Upper End
SRV Penetration in Vent Line
Vent Line-SRV Piping Penetration Nozzle Details
Vent Line-Vent Header Intersection Details
Developed View of Downcomer Bracing System
Downcomer-to-Vent Header Intersection Details
Vent Header Support Column Ring Plate Details
Vent System Support Column Details
Vent System Internal Pressures For SBA Event
Vent System Internal Pressures for IBA Event
Vent System Internal Pressures for DBA Event
Vent System Temperatures for SBA Event
3-xiii
nutech ENGINEERS
Page
3-2.10
3-2.11
3-2.12
3-2.13
3-2.14
3-2.15
3-2.16
3-2.17
3-2.18
3-2.19
3-2.20
3-2.21
3-2.22
3-2.23
3-2.82
3-2.83
3-2.84
3-2.85
0
Number
3-2.2-5
3-2.2-6
3-2.2-7
3-2.2-8
3-2.2-9
3-2.2-10
3-2.2-11
3-2.2-12
3-2.2-13
3-2.2-14
3-2.4-1
3-2.4-2
3-2.4-3
3-2.4-4
3-2.4-5
3-2.4-6
LIST OF FIGURES (Continued)
Title
Vent System Temperatures for IBA Event
Vent System Temperatures for DBA Event
Downcomer Pool Swell Impact Loads
Pool Swell Impact Loads for Vent Header Deflectors at Selected Locations
Downcomer Longitudinal Bracing and Tie Rods
IBA and DBA Condensation Oscillation Downcomer Differential Pressure Load Distribution
Pool Acceleration Profile for Dominant Suppression Chamber Frequency at Midbay Location
Vent System SBA Event Sequence
Vent System IBA Event Sequence
Vent System DBA Event Sequence
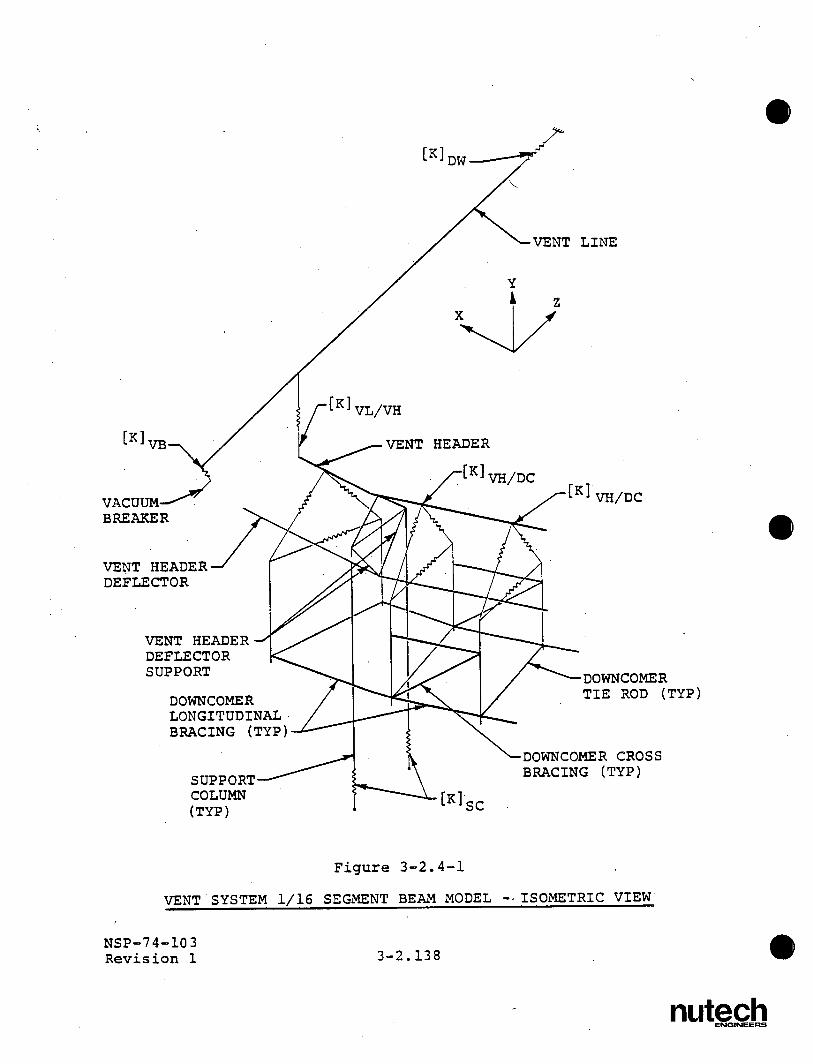
Vent System 1/16 Segment Beam Model Isometric View
Vent Line-Drywell Penetration Axisymmetric Finite Difference Model - View of Typical Meridian
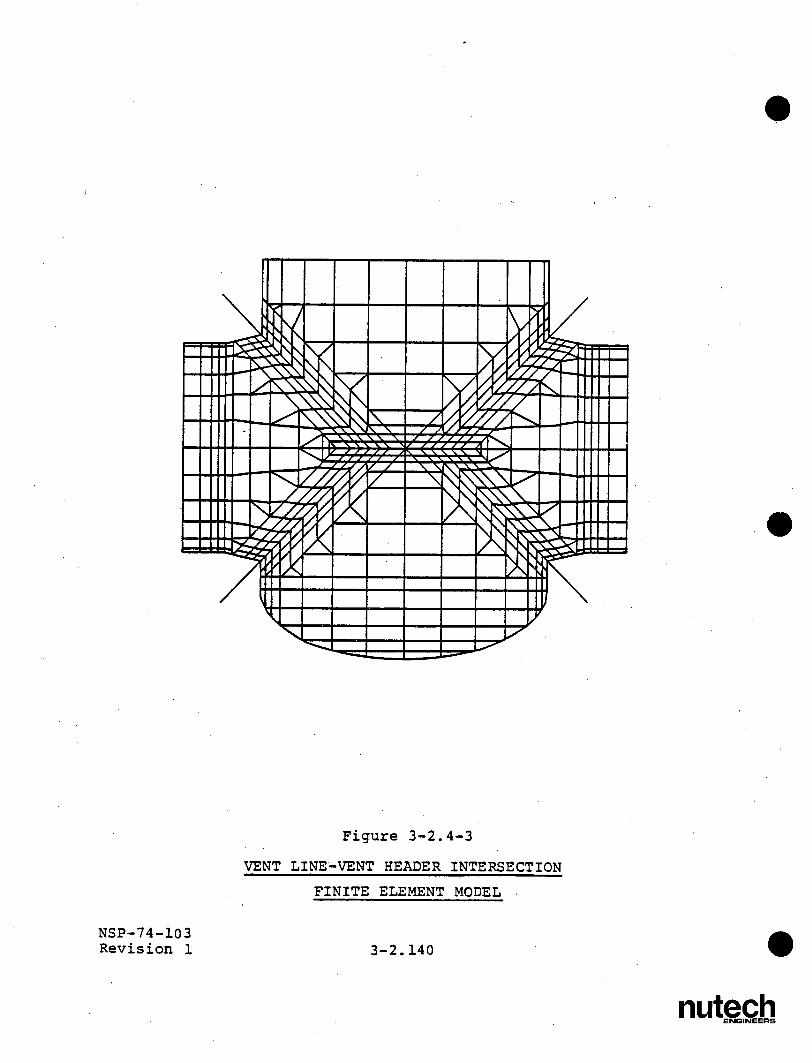
Vent Line-Vent Header Intersection Finite Element Model
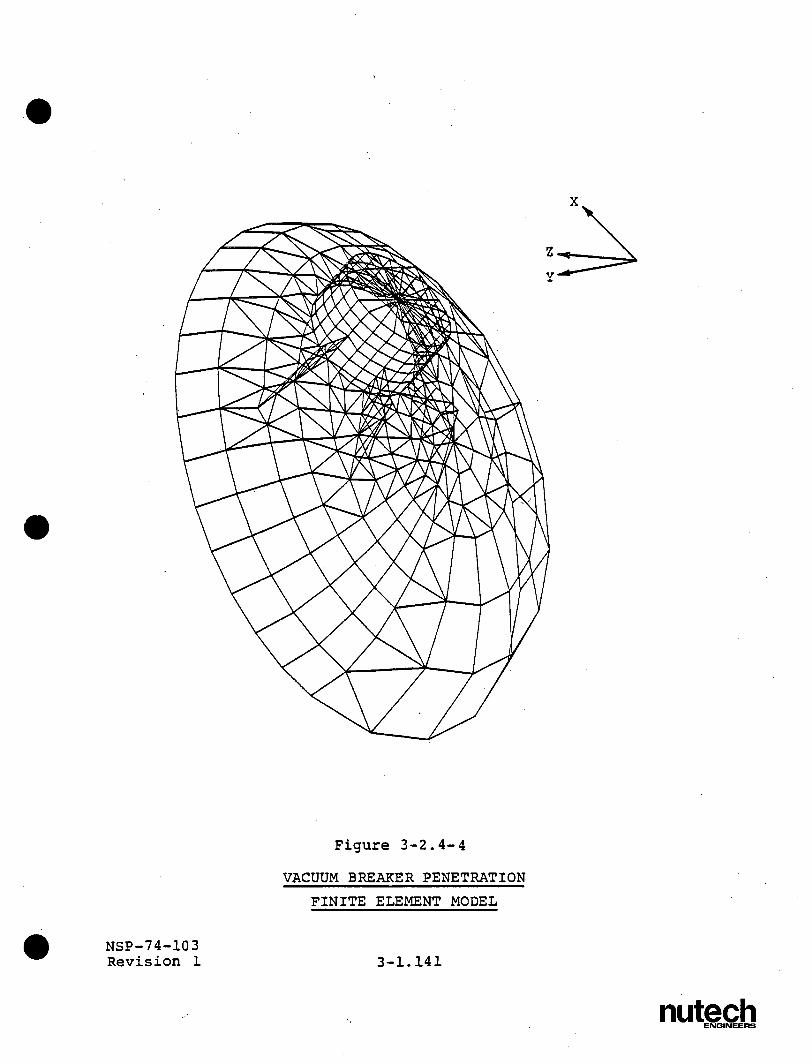
Vacuum Breaker Penetration Finite Element Model
Downcomer-Vent Header Intersection Finite Element Model - Isometric View
Harmonic Analysis Results for Support Column Submerged Structure Load Frequency Determination
NSP-74-103 Revision 1
3-xiv
3-2
3-2.g6
3- 2'.87
3-2.88
3-2.89
3-2.90
3-2.91
3-2.9-2
3-2 .105
3-2.106
3-2.107
3-2.138
3-2.139
3-2.140
3-2.141
3-2.142
3-2.143
nutech ENGINEERS
Number
3-2.4-7
3-2.4-8
3-2.4-9
3-2.4-10
3-2.4-11
3-2.4-12
3-2.4-13
3-2.4-14
3-2.4-15
3-2.4-16
3-2.5-1
3-2.5-2
NSP-74-103 Revision 1
LIST OF FIGURES (Concluded)
Title
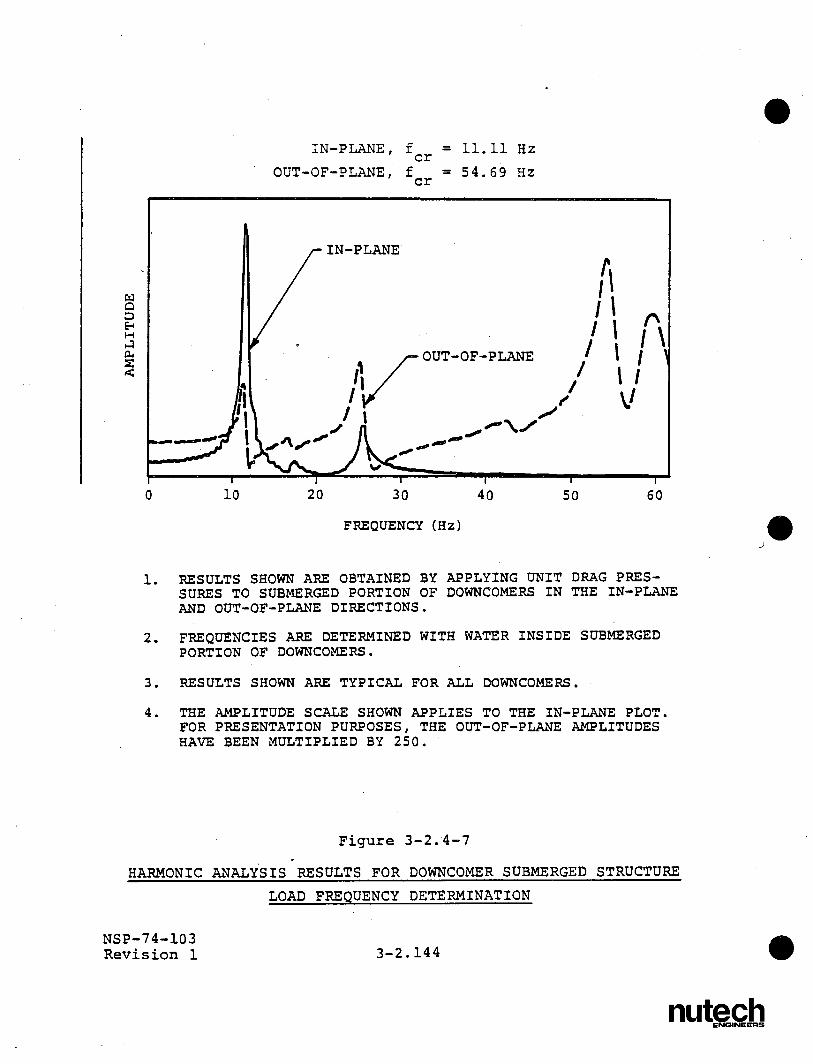
Harmonic Analysis Results for Downcomer Submerged Structure Load Frequency Determination
Harmonic Analysis Results for Tie Rods Submerged Structure Load Frequency Determination
Harmonic Analysis Results for Longitudinal Bracing Submerged Structure Load Frequency Determination
Harmonic Analysis Results for Condensation Oscillation Downcomer Load Frequency Determination
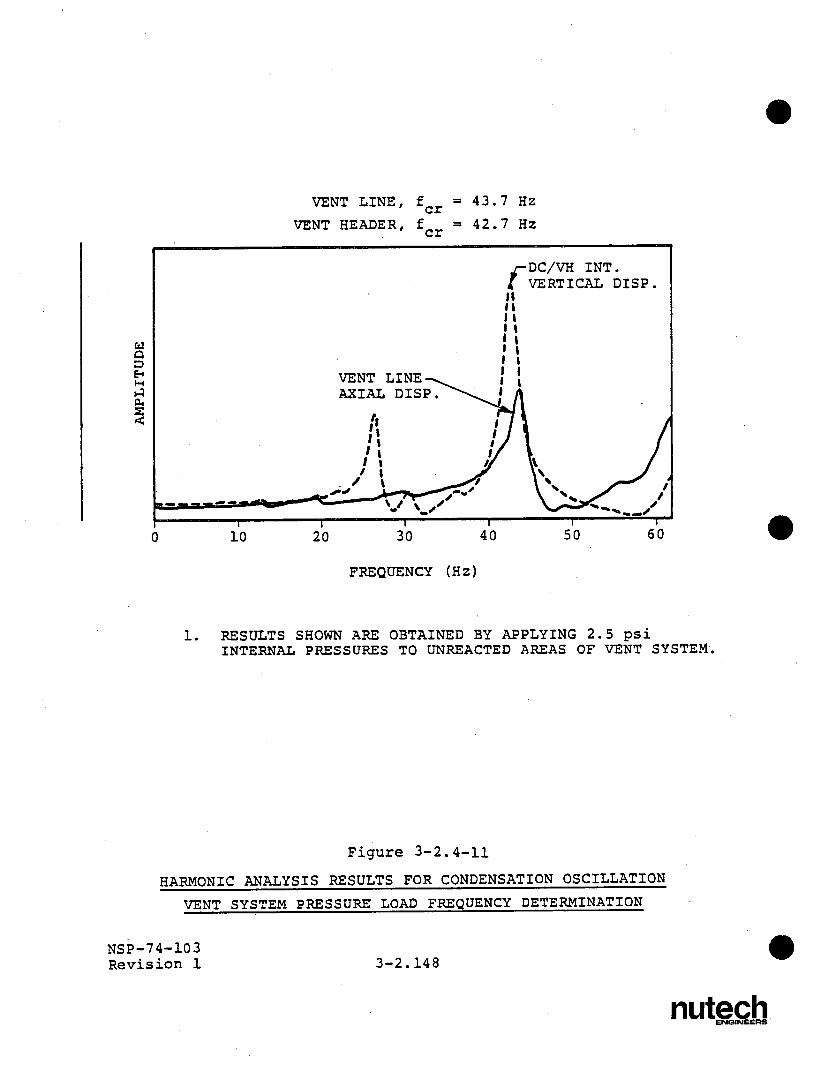
Harmonic Analysis Results for Condensation Oscillation Vent System Pressure Load Frequency Determination
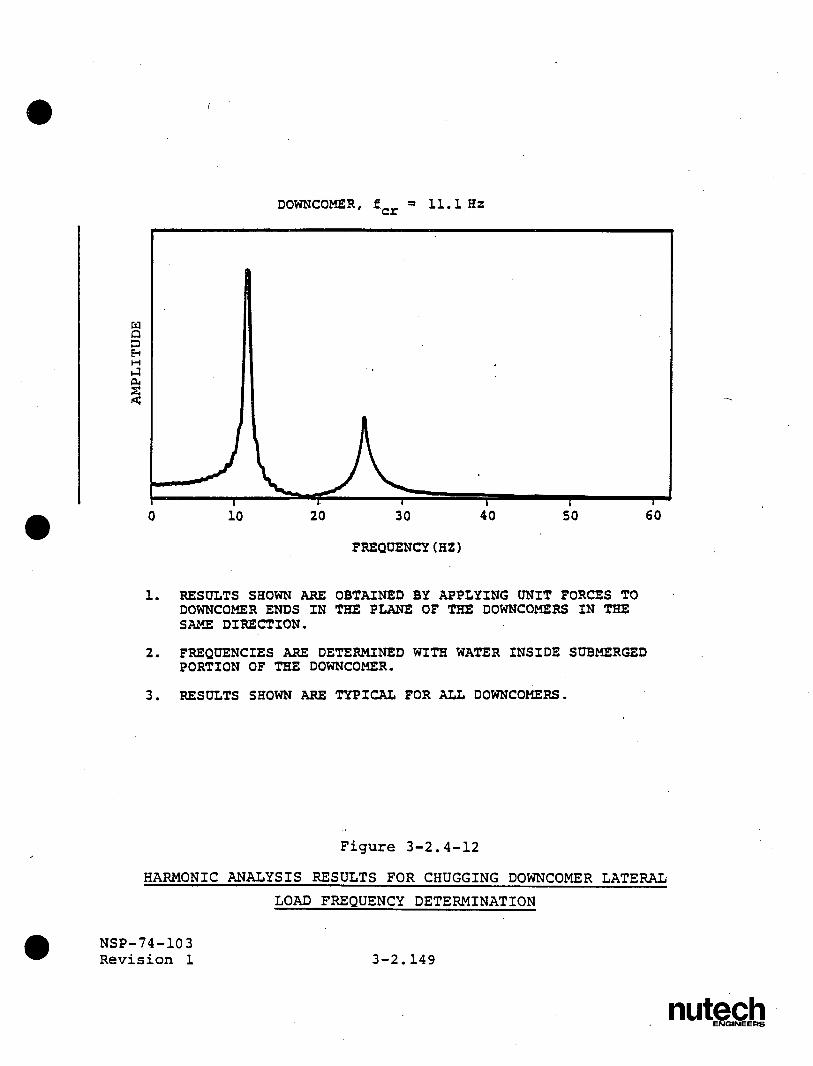
Harmonic Analysis Results for Chugging Downcomer Lateral Load Frequency Determination
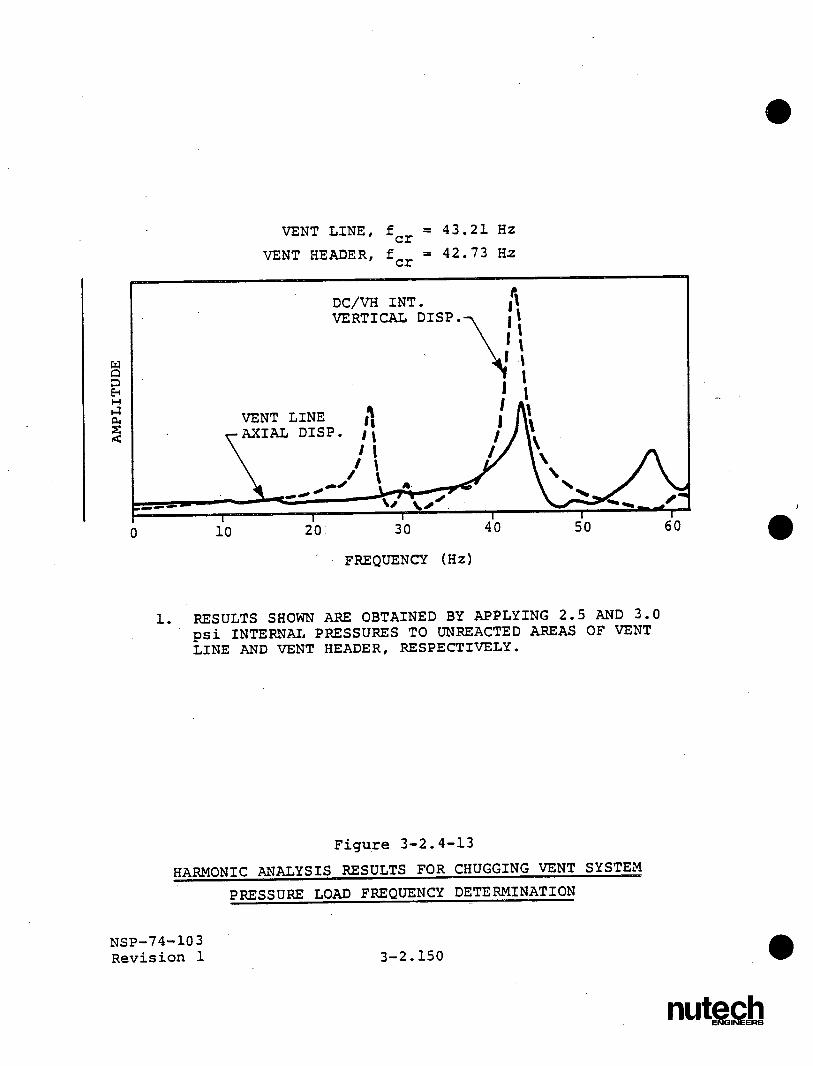
Harmonic Analysis Results for Chugging Vent System Pressure Load Frequency Determination
Vent System 1800 Beam Model - Isometric View
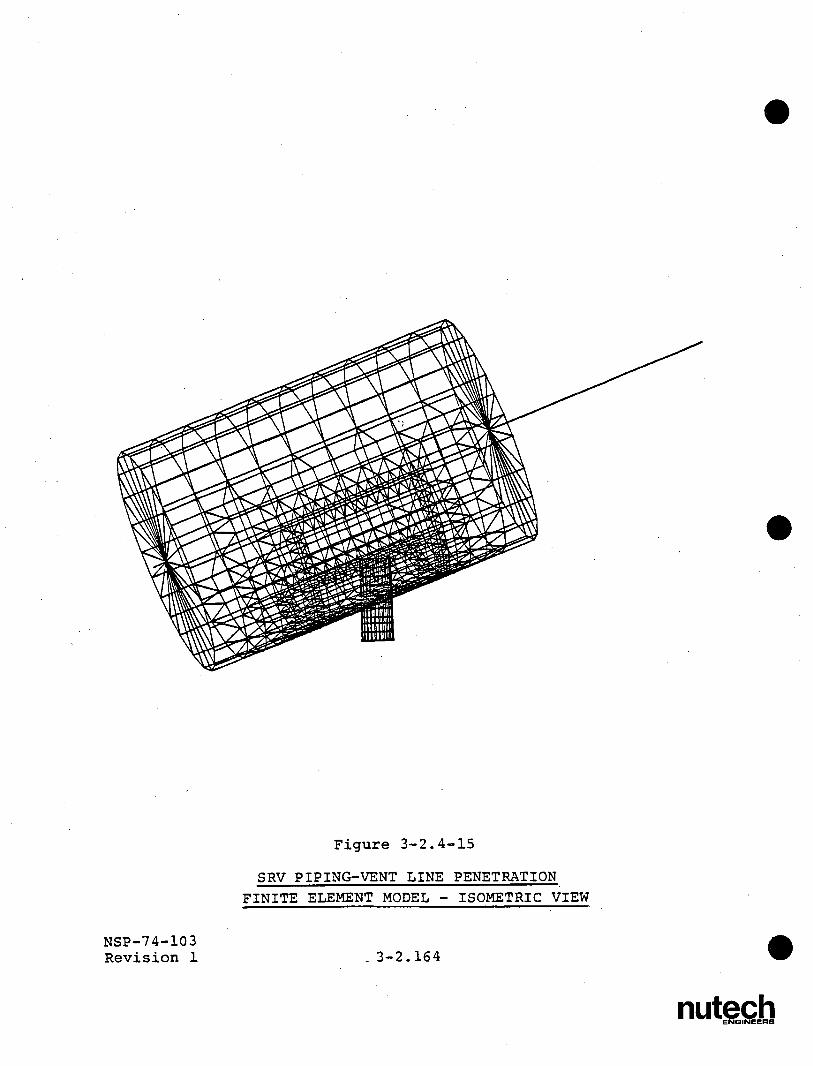
SRV Piping-Vent Line Penetration Finite Element Model - Isometric View
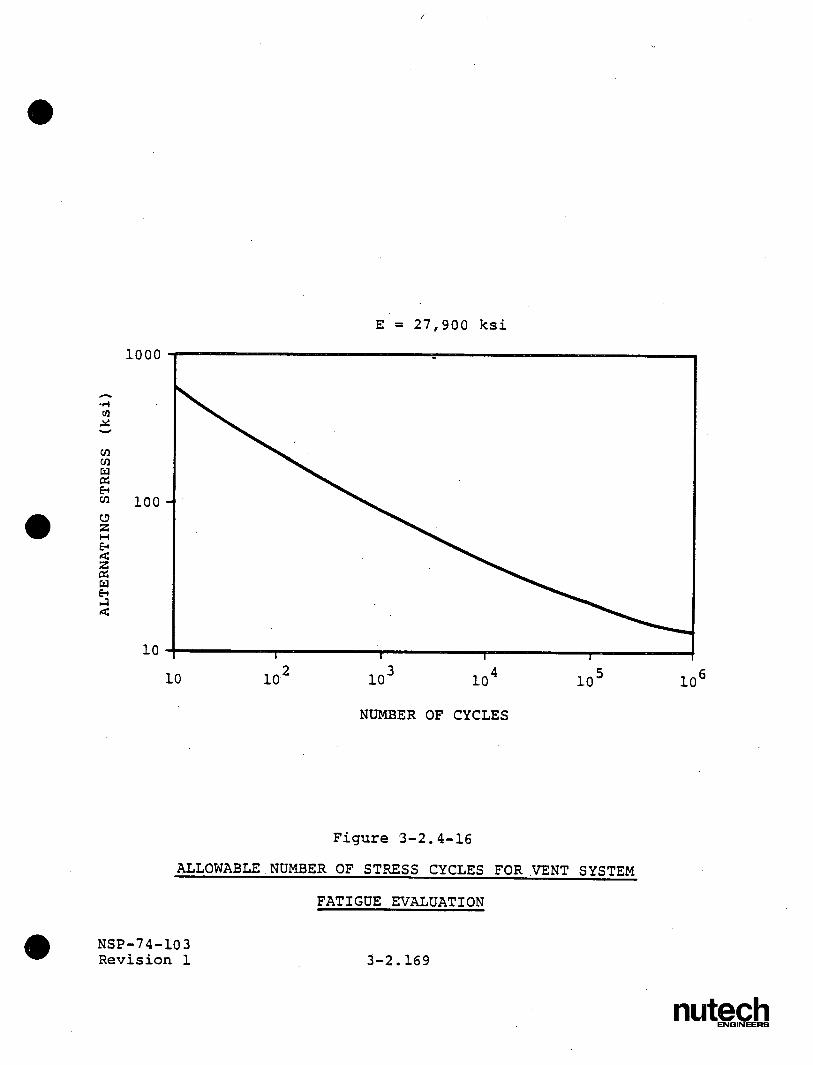
Allowable Number of Stress Cycles For Vent System Fatigue Evaluation
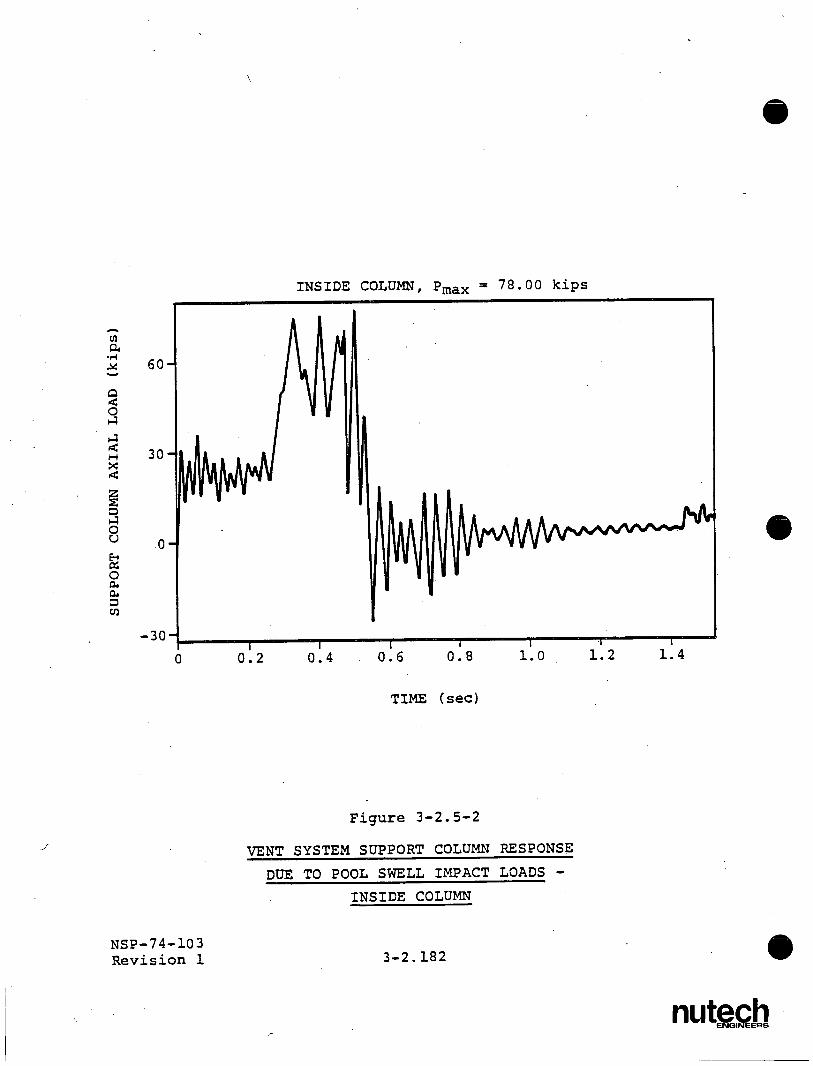
Vent System Support Column Response Due to Pool Swell Impact Loads - Outside Column
Vent System Support Column Response Due to Pool Swell Impact Loads - Inside Column
3-xv
Page
3-2.144
3-2.145
3-2.146
3-2.147
3-2.148
3-2.149
3-2.150
3-2.156
3-2.164
3-2.169
3-2.181
3-2.182
nutech ENGINEERS
3-1.0 INTRODUCTION
In conjunction with Volume 1 of the Plant Unique
Analysis Report (PUAR), this volume documents the
efforts undertaken to address the NUREG-0661 require
ments which affect the Monticello vent system. The vent
system PUAR is organized as follows.
o INTRODUCTION
- Scope of Analysis
- Summary and Conclusions
o VENT SYSTEM ANALYSIS
- Component Description
- Loads and Load Combinations
- Analysis Acceptance Criteria
- Methods of Analysis
- Analysis Results
The INTRODUCTION section contains an overview of the
scope of the vent system evaluation, as well as a
summary of the conclusions derived from the comprehen
sive evaluation of the vent system. The VENT SYSTEM
ANALYSIS section contains a comprehensive discussion of
the vent system loads and load combinations and a
description of the components of the vent system
NSP-74-103 3-1.1 Revision 1
nutech ENGINEERS
affected by these loads. The section also contains a
discussion of the methodology used to evaluate the
effects of these loads, the associated evaluation
results, and the acceptance limits to which the results
are compared.
0
3-1.2NSP-74-103 Revision 1
nutech ENGINEERS
3-1.1 Scope of Analysis
The criteria presented in Volume 1 are used as the basis
for the Monticello vent system evaluation. The modified
vent system is evaluated for the effects of LOCA-related
loads.and SRV discharge-related loads defined by the NRC
Safety Evaluation Report NUREG-0661 (Reference 1) and
the "Mark I Containment Program Load Definition Report"
(LDR) (Reference 2).
The LOCA and SRV discharge loads used in this evaluation
are formulated using the methodology discussed in Volume
1 of this report. The loads are developed using the
plant unique geometry, operating parameters, and test
results contained in the Plant Unique Load Definition
(PULD) report (Reference 3). The effects of increased
suppression pool temperatures which occur during SRV
discharge events are also evaluated. These temperatures
are taken from the plant's suppression pool temperature
response analysis. Other loads and methodology, such as
the evaluation for seismic loads, are taken from the
plant's Final Safety Analysis Report (FSAR)
(Reference 4).
NSP-74-103 3-1.3 Revision 1
nutech ENGINEERS
The evaluation includes performing a structural analysis
of the vent system for the effects of LOCA and SRV dis
charge-related loads to confirm that the design of the
vent system is adequate. Rigorous analytical techniques
are used in this evaluation, including the use of
detailed analytical models for computing the dynamic
response of the vent system. Effects such as local
penetration and intersection flexibilities are
considered in the vent system analysis.
The results of the structural evaluation for each load
are used to evaluate load combinations and fatigue
effects for the vent system in accordance with the
"Mark I Containment Program Structural Acceptance
Criteria Plant Unique Analysis Application Guide"
(PUAAG) (Reference 5). The analysis results are com
pared with the acceptance limits specified by the PUAAG
and the applicable sections of the ASME Code (Reference
6).
NSP-74-103 3-1.4
Revision 1
nutech ENGINEErts
Summary and Conclusions
The evaluation documented in this volume is based on the
modified Monticello vent system described in Section
1-2.1. The overall load-carrying capacity of the modi
fied vent system and its supports is substantially
greater than that of the original suppression chamber
design described in the plant's FSAR.
The loads considered in the original design of the vent
system include dead weight loads, OBE and DBE loads,
thrust loads, and pressure and temperature loads
associated with normal operating conditions (NOC) and a
postulated LOCA event. Additional loadings, which
affect the design of the vent system, are postulated to
occur during SBA, IBA, or DBA LOCA events and during SRV
discharge events. These loadings are defined gener
ically in NUREG-0661. These events result in impact and
drag loads on vent system components above the suppres
sion pool, in hydrodynamic internal pressure loadings on
the vent system, in hydrodynamic drag loadings on the
submerged components of the vent system, and in motion
and reaction loadings caused by loads acting on
structures attached to the vent system.
NSP-74-103 3-1.5 Revision 1
nutech ENGINEERS
3-1.2
Section 1-4.0 discusses the methodology used to develop
plant unique loadings for the vent system evaluation.
Applying this methodology results in conservative values
for each of the significant NUREG-0661 loadings which
envelop those postulated to occur during an actual LOCA
or SRV discharge event.
The LOCA and SRV discharge-related loads are grouped
into event combinations using the NUREG-0661 criteria
discussed in Section 1-3.2. The event sequencing and
event combinations specified and evaluated envelop the
actual events postulated to occur throughout the life of
the plant.
Some of the loads contained in the postulated event
combinations are major contributors to the total
response of the vent system. These include pressur
ization and thrust loads, pool swell impact loads,
condensation oscillation downcomer loads, and chugging
downcomer lateral loads. Although considered in the
evaluation, other loadings, such as internal pressure
loads, temperature loads, seismic loads, froth impinge
ment and fallback loads, submerged structure loads, and
containment motion and reaction loads, have a lesser
effect on the total response of the vent system.
NSP-74-103 3-1.6 Revision 1
nutech ENGINEERS
The vent system evaluation is based on the NUREG-0661
acceptance criteria discussed in-Section 1-3.2. These
acceptance limits are at least as restrictive as those
used in the original vent system design documented in
the plant's FSAR. Use of these criteria ensures that
the original vent system design margins have been
restored.
The controlling event combinations for the vent system
are those which include the loadings found to be major
contributors to the response of the vent system. The
evaluation results for these event combinations show
that all of the vent system stresses and support
reactions are within acceptable limits.
As a result, the modified vent system described in
Section 1-2.1 is adequate to restore the margins of
safety inherent in the original design of the vent
system documented in the plant's FSAR. The intent of
the NUREG-0661 requirements, as they affect the design
adequacy and safe operation of the Monticello vent
system, are considered to be met.
NSP-74-103 3-1.7 Revision 1
nutech ENGINEERS
3-2.0 VENT SYSTEM ANALYSIS
Evaluations of each of the NUREG-0661 requirements which
affect the design adequacy of the Monticello vent system
are presented in the following sections. The criteria
used in this evaluation are contained in Volume 1 of
this report.
Section 3-2.1 describes the vent system components
examined. Section 3-2.2 describes and presents the
loads and load combinations for which the vent system is
evaluated. Section 3-2.4 discusses the analysis
methodology used to evaluate the effects of these loads
and load combinations on the vent system. The
acceptance limits to which the analysis results are
compared, discussed, and presented are in Section 3-2.3.
Section 3-2.5 presents the analysis results and the
corresponding vent system design margins.
NSP-74-103 3-2.1 Revision 1
nutech ENGINEERS
3-2.1 Component Description
The Monticello vent system is constructed from
cylindrical shell segments joined together to form a
manifold-like structure which connects the drywell to
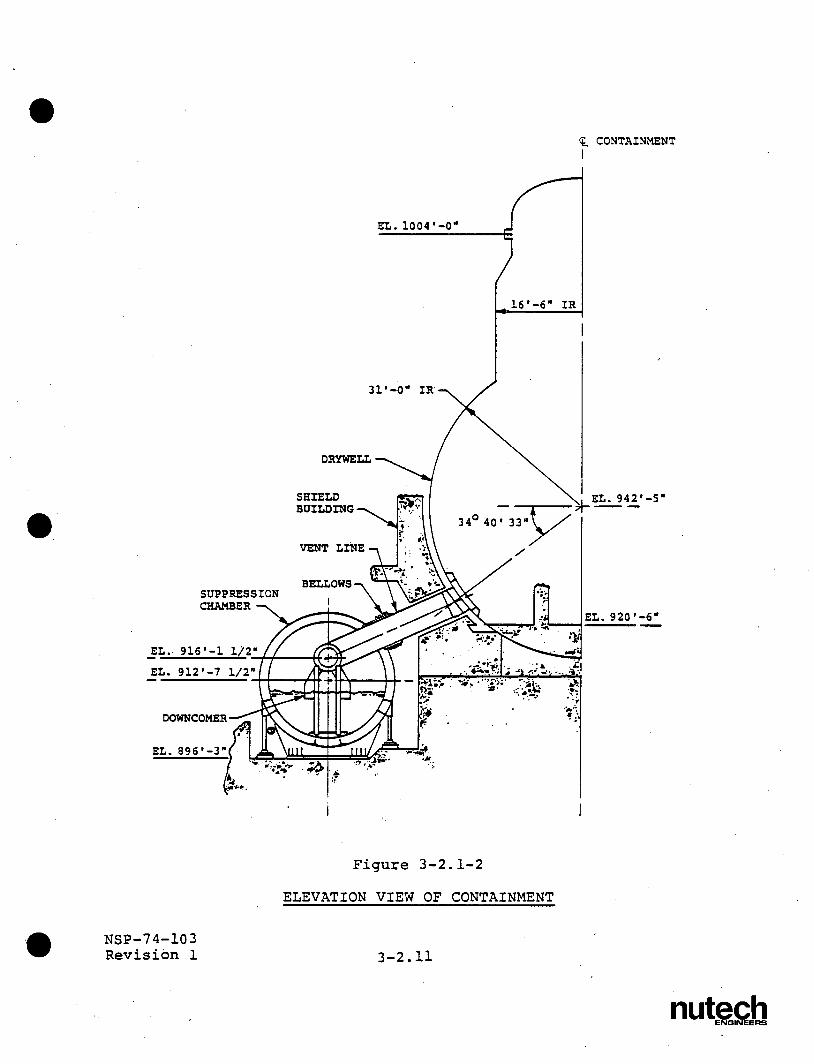
the suppression chamber. Figures 3-2.1-1 and 3-2.1-2
show the configuration of the vent system. The major
components of the vent system include the vent lines,
vent header, and downcomers. Figures 3-2.1-3 through
3-2.1-6 show the proximity of the vent system to other
components of the containment.
The eight vent lines connect the drywell to the vent
header in alternate mitered cylinders of the suppression
chamber. The vent lines are nominally 1/4" thick and
have an inside diameter of 6'9". The upper ends of the
vent lines include a conical transition segment at the
penetration to the drywell (Figure 3-2.1-7). The
drywell shell around each vent line-drywell penetration
varies from 3/4" to 1-1/4" thick and is reinforced with
a 2-1/2" thick insert plate and 3" thick cylindrical
nozzle. The vent lines are shielded from jet impinge
ment loads at each vent line-drywell penetration loca
tion by jet deflectors which span the openings of the
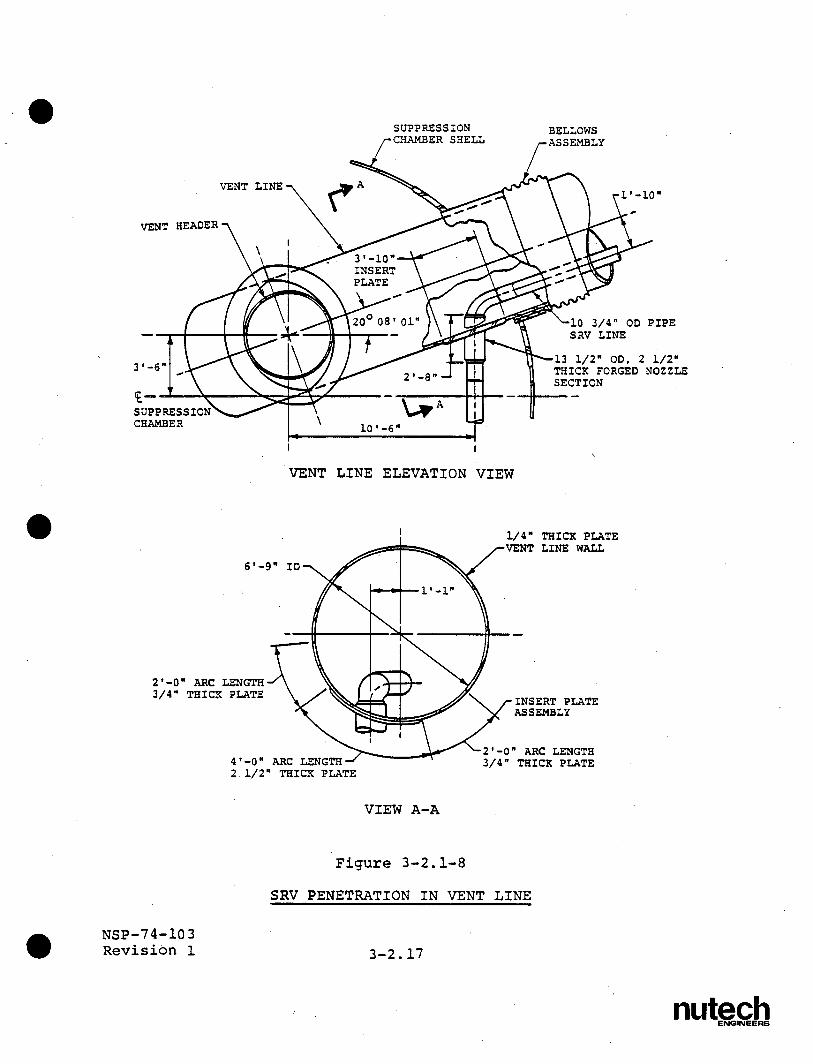
vent lines. The lower ends of the vent lines are con
NSP-74-103 3-2.2
Revision 1
nutech ENIINEERS
nected to the vent header in the manner of a penstock
(Figure 3-2.1-8).
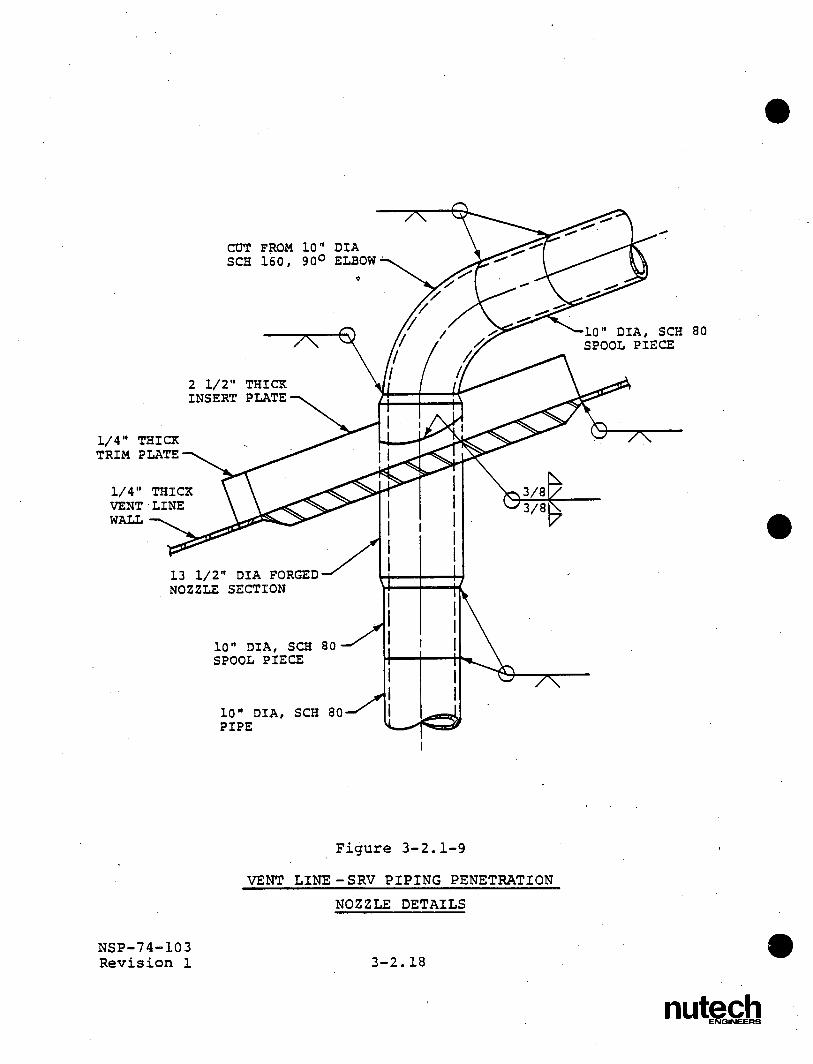
The SRV piping is routed from the drywell through the
vent line and penetrates the vent lines inside the
suppression chamber (Figures 3-2.1-7 through 3-2.1-10).
The vent lines and SRV discharge piping lines are
reinforced at each penetration location by a 2-1/2"
thick insert plate and a 13-1/2" OD, 2-1/2" thick
section of piping at each penetration. The vent line
SRV piping penetration assembly provides an effective
means of transferring loads acting on the SRV piping to
the vent line.
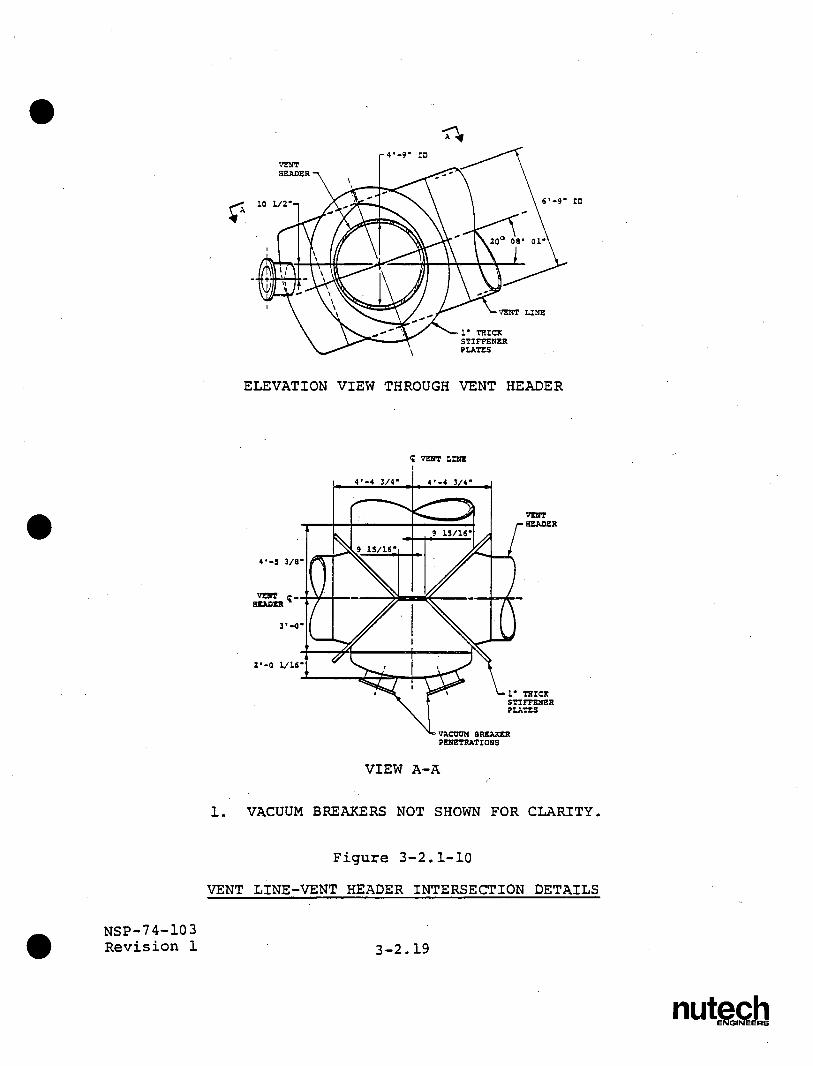
The vent header is a continuous assembly of mitered
cylindrical shell segments joined together to form a
ring header (Figure 3-2.1-1). The vent header is 1/4"
thick and has an inside diameter of 4'9". At the vent
line-vent header intersection, the vent header segments
connect to a transition weldment that in turn connects
to the vent line. Additional stiffening for the vent
line-vent header intersection is provided by 1" thick
plates attached to the transition weldment.
NSP-74-103 3-2.3 Revision 1
nutech ENGINEERS
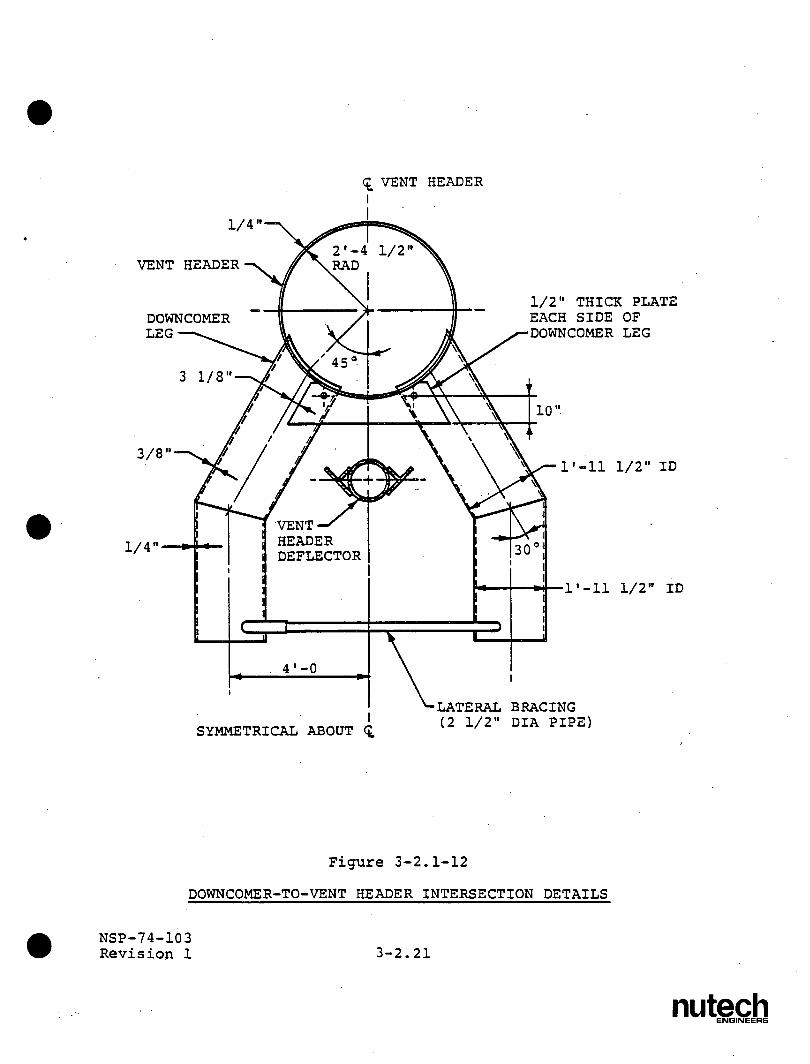
A total of 96- downcomers penetrate the vent header in
pairs (Figures 3-2.1-1 and 3.2.1-11). Two downcomer
pairs are located in each vent line bay and four pairs
are located in each non-vent line bay. Each downcomer
consists of an inclined segment which penetrates the
vent header and a vertical segment which terminates
below the surface of the suppression pool (Figure
3-2.1-12). The inclined segment is 3/8" thick and the
vertical segment is 1/4" thick. Both segments have
l'1l-1/2" inside diameters.
Full penetration welds connect the vent lines to the
drywell, the vent lines to the vent header, and the
downcomers to the vent header. As such, the connections
of the major components of the vent system are capable
of developing the full capacity of the associated major
components themselves.
The intersections of the downcomers and the vent header
are reinforced with a system of stiffener plates and
bracing members (Figures 3-2.1-11 and 3-2.1-12). In the
plane of the downcomers, the intersections are stiffened
by a pair of 1/2" gusset plates located between each set
of the downcomers and a pair of 2-1/2" pipe members at
the bottom of each set of two downcomers. The gusset
NSP-74-103 3-2.4
Revision 1
nutech ENGINEERS
plates are welded both to the tangent points of the
downcomer legs and to the vent header. The pipe members
are welded to the downcomer legs near the tangent
points. The system of stiffener plates is designed to
reduce local intersection stresses caused by loads
acting in the plane of the downcomers. The system of
pipe bracing ties the downcomer legs together in a pair;
therefore, separation forces on the pair of downcomer
legs will be taken as axial forces in the bracing.
In the direction normal to the plane of the downcomer
pair, the intersections are braced by 2-1/2" diameter
pipe members located on each side of the vent header
(Figure 3-2.1-11) . The ends of the horizontal pipe
members are welded to the downcomers and the diagonals
are connected to the horizontal members by means of
gusset plates.
This bracing system provides an additional load path for
the transfer of loads acting on the submerged portion of
the downcomers and results in reduced local stresses in
the downcomer-vent header intersection regions. The
system of downcomer-vent header intersection stiffener
plates and bracing members provides a redundant
mechanism for the transfer of loads acting on-the down
NSP-74-103 3-2.5 Revision 1
nutech ENGINEERS
comers, thus reducing the magnitude of loads passing
directly through the intersection. The bracing also
ties together several pairs of downcomers in the
longitudinal direction, causing an increase in stiffness
to the overall system that minimizes the dynamic effect
of several loads, including SRV submerged structure
loads. This also results in load sharing among the
downcomers for both chugging lateral loads and SRV
submerged structure loads.
A bellows assembly is provided at the penetration of the
vent line to the suppression chamber (Figure 3-2.1-7).
The bellows allows differential movement of the vent
system and suppression chamber to occur without
developing significant interaction loads. Each bellows
assembly consists of a stainless steel bellows unit that
is connected to a 1-3/4" thick nozzle. The bellows unit
has a 7'3-3/4" inside diameter and contains five
convolutions which connect to 1/2" thick cylindrical
sleeves at each end. A 1-1/2" thick annular plate
welded to the vent line connects to the upper end of the
bellows assembly by full penetration welds. The lower
end of the bellows assembly is a 1-3/4" thick nozzle,
already described, which is connected to the suppression
NSP-74-103 3-2.6
Revision 1
nutech ENGINEERS
chamber shell insert plate by full penetration welds.
The overall length of the bellows assembly is 6'4-7/8".
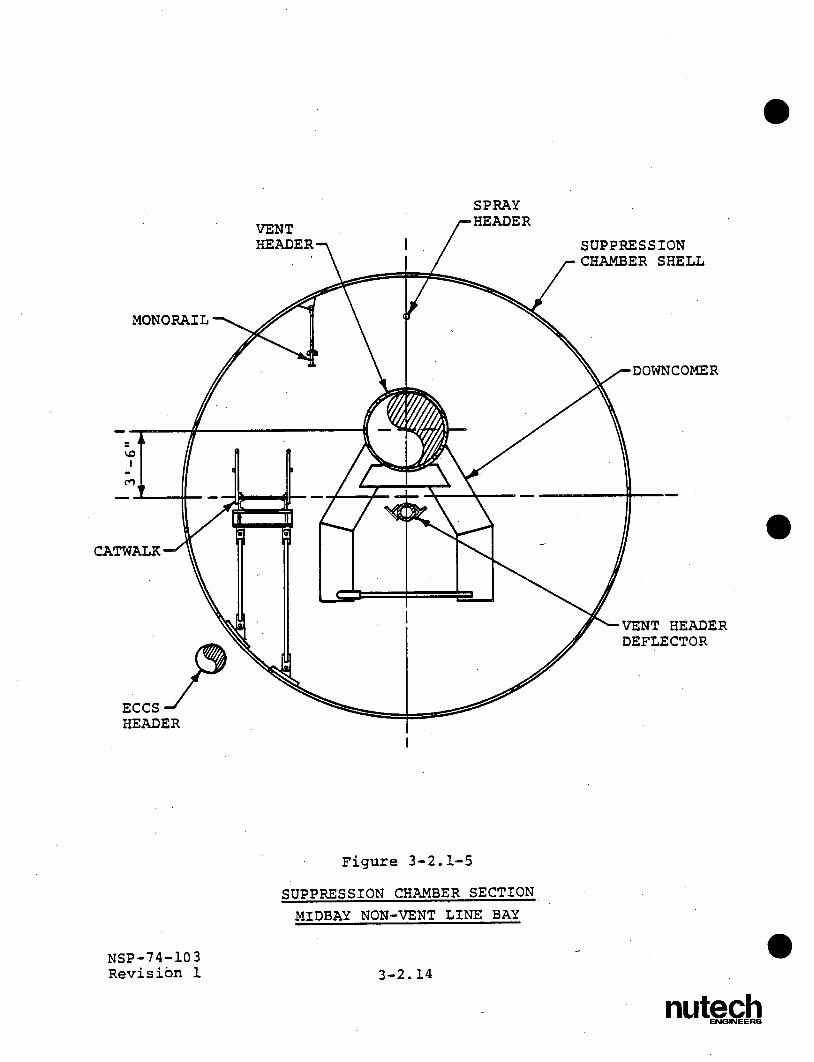
Vent header deflectors are provided in both the vent
line bays and the non-vent line bays (Figures 3-2.1-5,
3-2.1-6, and 3-2.1-12). The deflectors shield the vent
header from pool swell impact loads which occur during
the initial phase of a DBA event. The vent header
deflectors are constructed from 14" diameter, Schedule
160 pipe with WT6 x 32.5 split tee sections attached to
either side. The vent header deflectors are supported
by 1" thick connection plates that are welded to the
vent header collar plates near each miter joint. The
vent header deflectors are designed to completely
mitigate pool swell impact loads on the vent header.
The drywell/wetwell vacuum breakers are nominal 18"
units and extend from mounting flanges attached to 1,8"
OD, 1" thick nozzles. The nozzles penetrate the vent
header at the vent line-vent header intersections
(Figure 3-2.1-10). Additional support for the vacuum
breakers at each vent line-vent header intersection
location is provided by a system of three 1" thick
stiffener plates around the nozzle. The vacuum breaker
support system is designed to reduce local stresses at
NSP-74-103 3-2.7 Revision 1
nutech ENGINEERS
the intersections of the vacuum breaker nozzles and the
vent header.
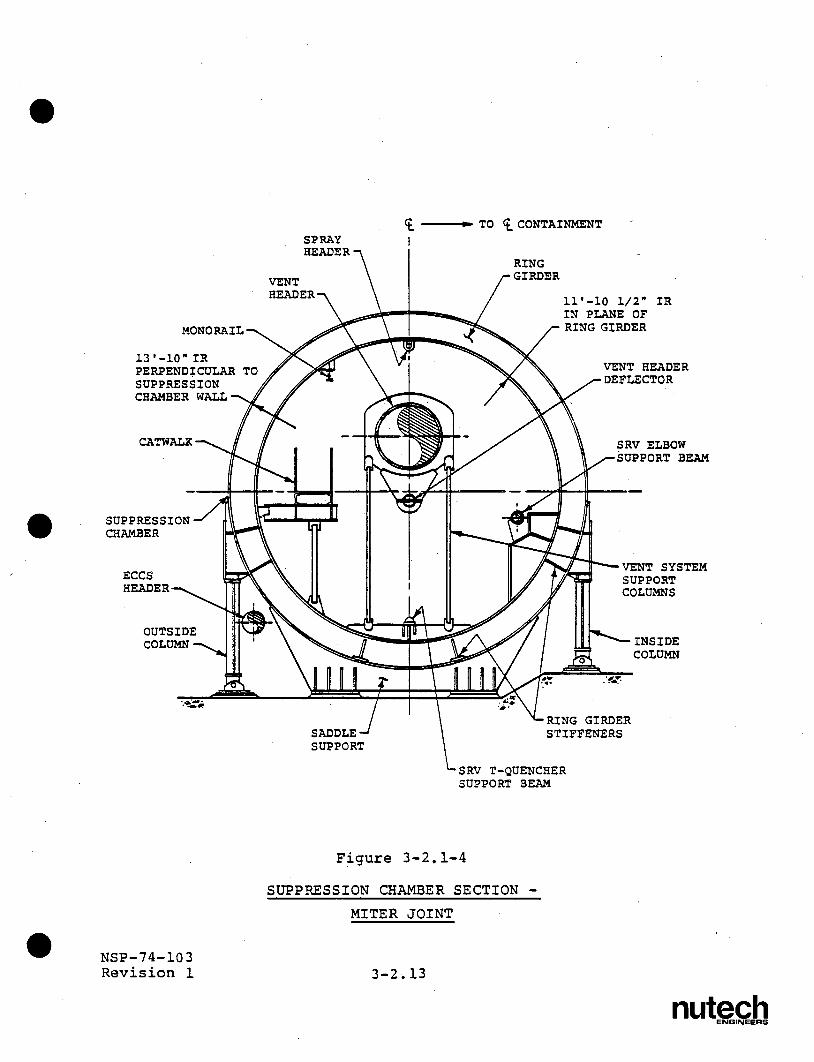
The vent system is supported vertically by two column
members at each miter joint location (Figures 3-2.1-4,
3-2.1-13 and 3-2.1-14). The support column members are
constructed with 6" diameter, Schedule 80 pipe. Built
up clevis assemblies are attached to each end of the
columns. The upper ends of each support column are
connected to the 1" thick vent header collar plates by a
2-3/4" diameter pin. The collar plates are attached to
the vent header with 5/16" fillet welds. The support
column loads are transferred at the upper--pin locations
by 3/4" thick clevis plates and 3/4" thick reinforcing
plates, which provide additional bearing capacity. The
lower ends of each support column are attached to 1-1/2"
thick ring girder pin plates with a 2-3/4" diameter pin
and two 3/4" thick clevis plates. The support column
assemblies are designed to transfer vertical loads
acting on the vent system to the suppression chamber
ring girders while simultaneously resisting drag loads
on submerged structures.
The vent system is supported horizontally by the vent
lines which transfer lateral loads acting on the vent
NSP-74-103 3-2.8
Revision 1
nutech ENGINEERS
system to the drywell at the vent line-drywell penetra
tion locations. The vent lines also provide additional
vertical support for the vent system, although the vent
system support columns provide primary vertical support.
The support provided by the vent line bellows is
negligible, since the relative stiffness of the bellows
with respect to other vent system components is small.
The vent system also provides support for a portion of
the SRV piping inside the vent line and suppression
chamber (Figures 3-2.1-3 and 3-2.1-8). Loads acting on
the SRV piping are transferred to the vent system by the
penetration assembly on the vent line. Conversely,
loads acting on the vent system cause motions to be
transferred to the SRV piping at the same support
locations.
The overall load-carrying capacities of the vent system
components described in the preceding paragraphs are
substantially greater than those of the original vent
system design described in the plant's FSAR.
NSP-74-103 3-2.9 Revision 1
nutech "ENGINEERS
SEISMIC RESTRAINT
1 O80 18 VENT LINE
PENETRATION
900- 1.2 0
, DRYWELL
VENT SYSTEM _
VENT HEADER
MITER NON-VENT JOINT LINE BAY
Oo SUPPRESS ION CHAMBER
VENT LINE MIDBAY
Figure 3-2.1-1
PLAN VIEW OF CONTAINMENT
NSP-74- 1 0 3
Revision 1 3-2.10
nutech ENGINEERS
CONTAINMENT
31'-0" IR
DRYWELL
SHIELD
SUPPRESSION CHAMBER
EL. 916'-1 1/2"
EL. 912'-7 1/2"4
BELLOWS.
EL. 920'-6"
Figure 3-2.1-2
ELEVATION VIEW OF CONTAINMENT
NSP-74-103 Revision 1 3-2.11
nutech ENGINEERS
q TO ( CONTAINMENT
0.584" THICK SRV DISCHARGE WALL BELOW LINE
CATWALK AND ACCESS PLATFORM
SRV ELBOW SUPPORT BEAM
DOWNCOMER LEG (TYP) SRV T-QUENCHER
SUPPORT BEAM DOWNCOMER LATERAL RESTRAINT 9'071" 10'-6"
Figure 3-2.1-3
SUPPRESSION CHAMBER SECTION
MIDBAY VENT LINE BAY
NSP-74-103 Revision 1 3-2.12
nutech ENESINEERS
TO S CONTAINMENT
SRV T-QUENCHER SUPPORT BEAM
Figure 3-2.1-4
SUPPRESSION CHAMBER SECTION
MITER JOINT
NSP-74-103 Revision 1 3-2.13
nutech ENGINEERS
SPRAY
VENT
MONORAIL
ECCS -/ HEADER
SUPPRESSION CHAMBER SHELL
,-DOWNCOMER
DEFLECTOR
Figure 3-2.1-5
SUPPRESSION CHAMBER SECTION
MIDBAY NON-VENT LINE BAY
NSP-74-103 Revision 1 3-2.14
nutech ENGINEERS
I
Figure 3-2.1-6
DEVELOPED VIEW OF SUPPRESSION CHAMBER SEGMENT
NSP-74-103 Revision 1 3-2.15
nutech ENGINEERS
1 3/4" THICK INSERT ASSEMBLY
1 1/16" THICK INSERT PLATE-7
2 1/2" THICK INSERT PLATE
1/2" THICK
DRYWELL SHELL
JET DEFLECTOR
SEGMENT
VENT LINE BELLOWS
1/4" THICK VENT LINE
3" THICK CYLINDRICAL NOZZLE
1 1/2" THICK ANNULAR PLATE
6'-9" IDSUPPRESSION CHAMBER SHELL
Figure 3-2.1-7
VENT LINE DETAILS - UPPER END
NSP-74-103 Revision 1 3-2.16
0s
nutech ENGINEERS
I
SUPPRESSION CHAMBER SHELL
VENT LINE ELEVATION VIEW
6'-9" ID'
2'-0" ARC LENGTH 3/4" THICK PLATE
4'-0" ARC LENGTH-/ 2 1/2" THICK PLATE
3/4" THICK PLATE
VIEW A-A
Figure 3-2.1-8
SRV PENETRATION IN VENT LINE
NSP-74-103 Revision 1 3-2.17
BELLOWS
nutech ENGINEERS
CUT FROM 10" DIA SCE 160, 900 ELBOW
80
1/4" THICK TRIM PLATE-
1/4" VENT WALL
13 1/2" DIA FORGED NOZZLE SECTION
Figure 3-2.1-9
VENT LINE -SRV PIPING PENETRATION
NOZZLE DETAILS
NSP-74-103 Revision 1 3-2.18
nutech ENGINEERS
09
ELEVATION VIEW THROUGH VENT HEADER
4-5
VENT
3,
2.-0 1,
vENr READER
*I" THICK STIFFENER PLATES
VIEW A-A
1. VACUUM BREAKERS NOT SHOWN FOR CLARITY.
Figure 3-2.1-10
VENT LINE-VENT HEADER INTERSECTION DETAILS
NSP-74-103 Revision 1
nutech ENGINEERS
3-2.19
VENT BAY-'1
NON-VENT BAY
PARTIAL PLAN VIEW OF SUPPRESSION CHAMBER
2*-7 1/4"
- 2 1/2" DIA, SCH 80 PIPE (TYP)
3- DIA, SCH 80 PIPE (TYP)
VIEW A-A
VIEW B-B (OPPOSITE HAND)
1. VENT HEADER DEFLECTOR AND VENT HEADER COLUMNS NOT SHOWN FOR CLARITY.
Figure 3-2.1-11
DEVELOPED VIEW OF
DOWNCOMER BRACING SYSTEM
NSP-74-103 Revision 1
nutech ENGINEERS
3-2.20
r+ VENT HEADER I
1/2" THICK PLATE EACH SIDE OF
1/4"
SYMMETRICAL ABOUT tL
LATERAL BRACING (2 1/2" DIA PIPE)
Figure 3-2.1-12
DOWNCOMER-TO-VENT HEADER INTERSECTION DETAILS
NSP-74-103 Revision 1 3-2.21
nutech ENGINEERS
SECTION THROUGH VENT HEADER AT RING PLATE
I 13/16" THICK
1" DIA SPACER (TYP)
BOLT (TYP)
. . 3/4" THICK REINFORCEMENT
3/4" DIA - -PATE (TYP)
SECTION A-A
Figure 3-2.1-13
VENT HEADER SUPPORT COLUMN
RING PLATE DETAILS
NSP-7 4 - 1 0 3
Revision 1 3-2.22
" THICK
4*-9" ID
nutech ENGINEERS
4" RAD (TYP)
-13'-0 1/4"
3/4" THICK PIN PLATE (TYP)
6" DIA, SCH 80
A
1 1/16"-
SECTION. A-A
A
2 25/32" DIA HOLE (TYP)
1 9/16"
Figure 3-2.1-14
VENT SYSTEM SUPPORT COLUMN DETAILS
NSP-74-103 Revision 1
nutech ENGINEETIS
3-2.23
3-2.2 Loads and Load Combinations
The loads for which the Monticello vent system is
evaluated are defined in NUREG-0661 on a generic basis
for all Mark I plants. Section 1-4.0 discusses the
methodology used to develop plant unique vent system
loads for each load defined in NUREG-0661. The results
of applying the methodology to develop specific values
for each of the governing loads which act on the vent
system are discussed and presented in Section 3-2.2.1.
Using the event combinations and event sequencing
defined in NUREG-0661 and discussed in Sections 1-3.2
and 1-4.3, the controlling load combinations which
affect the vent system are formulated. The controlling
vent system load combinations are discussed and pre
sented in Section 3-2.2.2.
NSP-74-103 3-2.24 Revision 1
nutech ENGINEERS
3-2.2.1 Loads
The loads acting on the vent system are categorized as
follows.
1. Dead Weight Loads
2. Seismic Loads
3. Pressure and Temperature Loads
4. Vent System Discharge Loads
5. Pool Swell Loads
6. Condensation Oscillation Loads
7. Chugging Loads
8. Safety Relief Valve Discharge Loads
9. Piping Reaction Loads
10. Containment Interaction Loads
Loads in categories 1 and 2 were considered in the
original containment design as documented in the plant's
FSAR. Category 3 pressure and temperature loads result
from postulated LOCA and SRV discharge events. Loads in
categories 4 through 7 result from postulated LOCA
events; loads .in category 8 result from SRV discharge
events; loads in category 9 are reactions which result
from loads acting on SRV piping systems; loads in cate
gory 10 are motions which result from loads acting on
other containment-related structures.
NSP-74-103 3-2.25 Revision 1
nutech ENGINEERS
Not all of the loads defined in NUREG-0661 are evaluated
in detail since some are enveloped by others or have a
negligible effect on the vent system. Only those loads
which maximize the vent system response and lead to
controlling stresses are fully evaluated and discussed.
These loads are referred to as governing loads in sub
sequent discussions.
Table 3-2.2-1 shows the specific vent system components
affected by each of the loadings defined in NUREG-0661.
The table also lists the section in Volume 1 in which
the methodology for developing values for each loading
is discussed. The magnitudes and characteristics of
each governing vent system load in each load category
are identified and presented in the following para
graphs.
1. Dead Weight Loads
a. Dead Weight of Steel: The weight of steel
used to construct the modified vent system and
its supports is considered. The nominal
component dimensions and a density of steel of
490 lb/ft 3 are used in this calculation.
NSP-74-103 3-2.26 Revision 1
nutech ENGINEERS
2. Seismic Loads
a. OBE Loads: The vent system is subjected to
horizontal and vertical accelerations during
an Operating Basis Earthquake (OBE). This
loading is taken from the original design
basis for the containment documented in the
plant's FSAR. The OBE loads have a maximum
horizontal spectral acceleration of 0.23g and
a maximum vertical spectral acceleration of
0.153g.
b. SSE Loads: The vent system is subjected to
horizontal and vertical accelerations during a
Safe Shutdown Earthquake (SSE). This loading
is taken from the original design basis for
the containment documented in the plant's
FSAR, termed a Design Basis Earthquake (DBE)
(Reference 4). The SSE loads have a maximum
horizontal spectral acceleration of 0.46g and
a maximum vertical spectral acceleration of
0.307g.
3. Pressure and Temperature Loads
a. Normal Operating Internal Pressure Loads: The
vent system is subjected to internal pressure
NSP-74-103 3-2.27 Revision 1
nutech ENGINEERS
loads during Normal Operating Conditions.
This loading is taken from the original design
basis for the containment documented in the
PULD report.
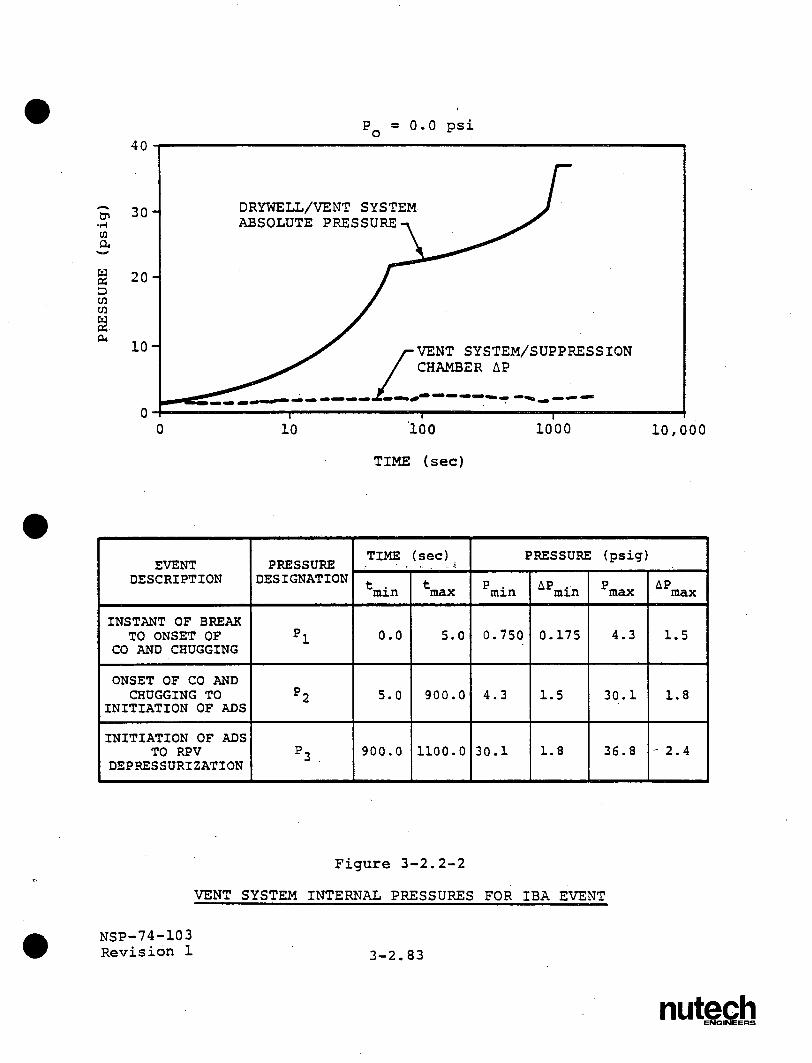
b. LOCA Internal Pressure Loads: The vent system
is subjected to internal pressure loads during
a small break accident (SBA), an intermediate
break accident (IBA), and a design basis
accident (DBA) event. The procedure used to
develop LOCA internal pressures for the con
tainment is discussed in Section 1-4.1.1.
Figures 3-2.2-1 through 3-2.2-3 present the
resulting vent system internal pressure tran
sients and pressure magnitudes at key times
during the SBA, IBA, and DBA events.
The vent system internal pressures for each
event are conservatively assumed to be equal
to the corresponding drywell internal pres
sures; reductions due to losses are negli
gible. The net internal pressures acting on
the components of the vent system inside the
NSP-74-103 3-2.28 Revision 1
nutech ENGINEEFIS
suppression chamber are extracted as the dif
ference in pressures between the vent system
and suppression chamber.
The pressures specified are assumed to act
uniformly over the vent line, vent header, and
downcomer shell surfaces. The external or
secondary containment pressure for the vent
system components outside the suppression
chamber for all events is assumed to be zero.
The effects of internal pressure on the vent
system for the DBA event are included in the
pressurization and thrust loads discussed in
load case 4a.
c. Normal Operating Temperature Loads: The vent
system is subjected to the thermal expansion
loads associated with normal operating
conditions. This loading is taken from the
original design basis for the containment
documented in the plant's FSAR. The range of
normal operating temperatures for the vent
system with a concurrent SRV discharge event
is 650 to 150aF. The temperature of the SRV
NSP-74-103 3-2.29 Revision 1
nutech ENGINEERS
piping with a concurrent SRV discharge event
is conservatively taken as 375cF.
Additional normal operating temperatures for
the vent system inside the suppression chamber
are taken from the suppression pool tempera
ture response analysis. Table 3-2.2-2 pro
vides a summary of the resulting vent system
temperatures.
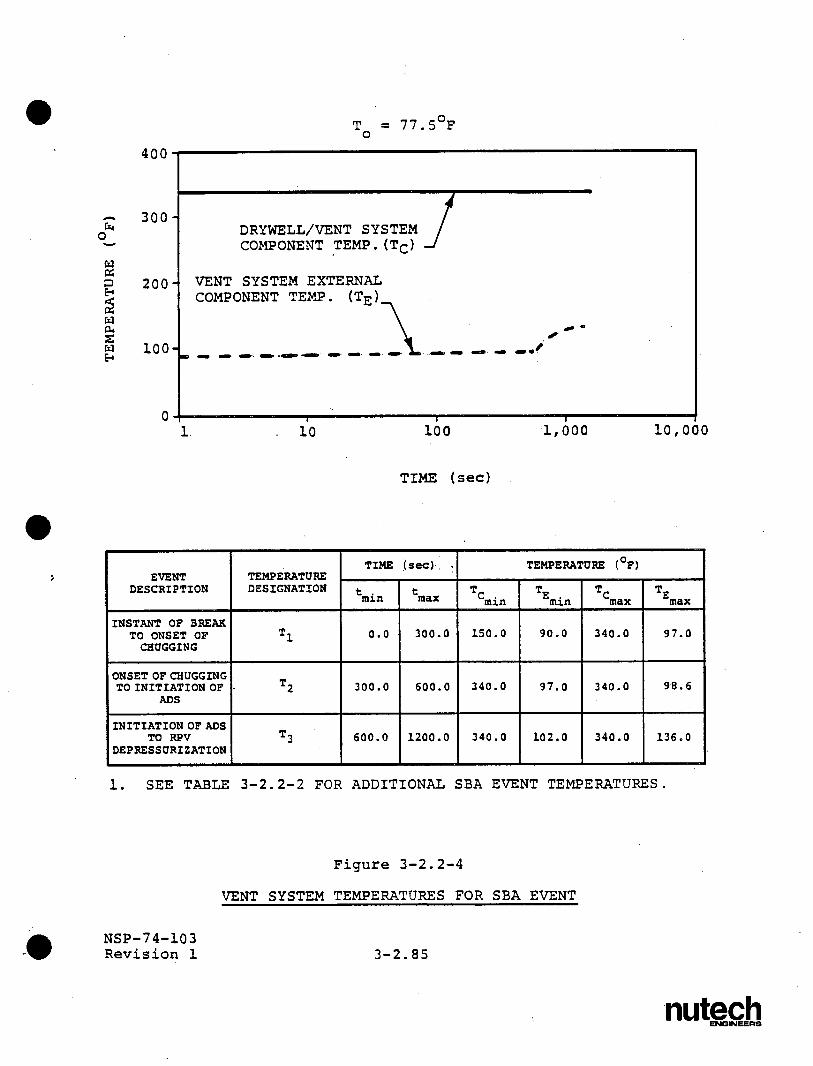
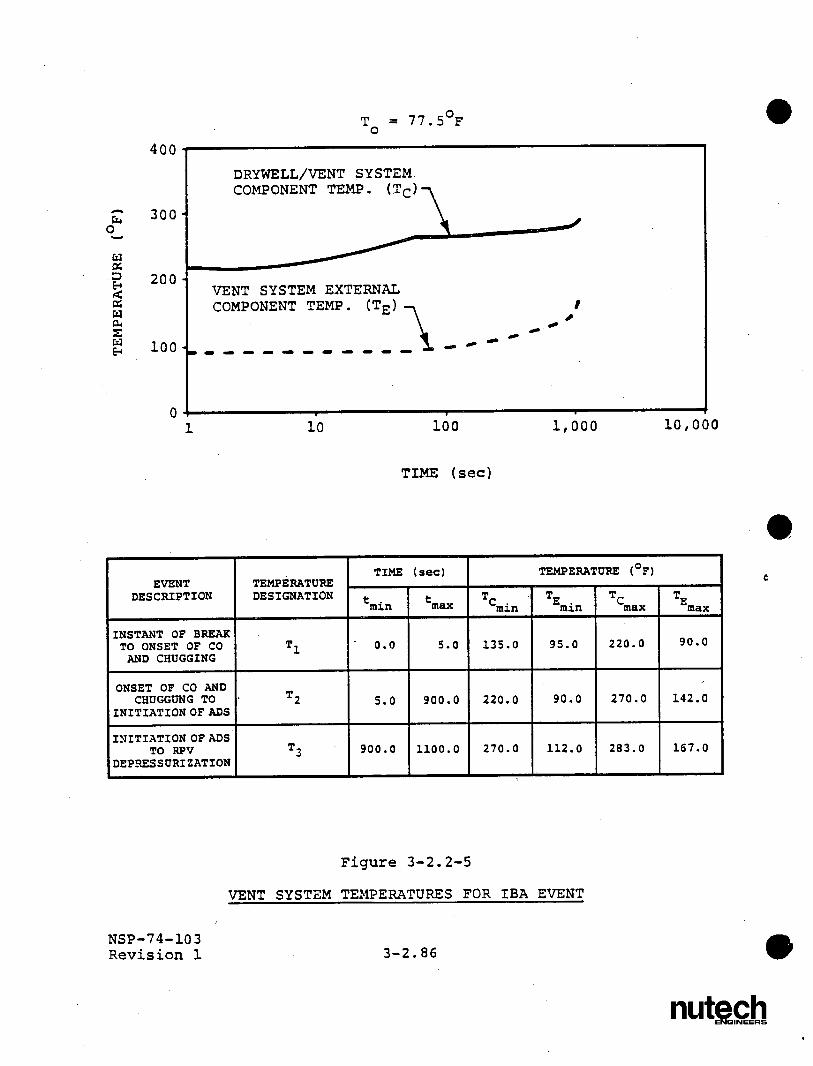
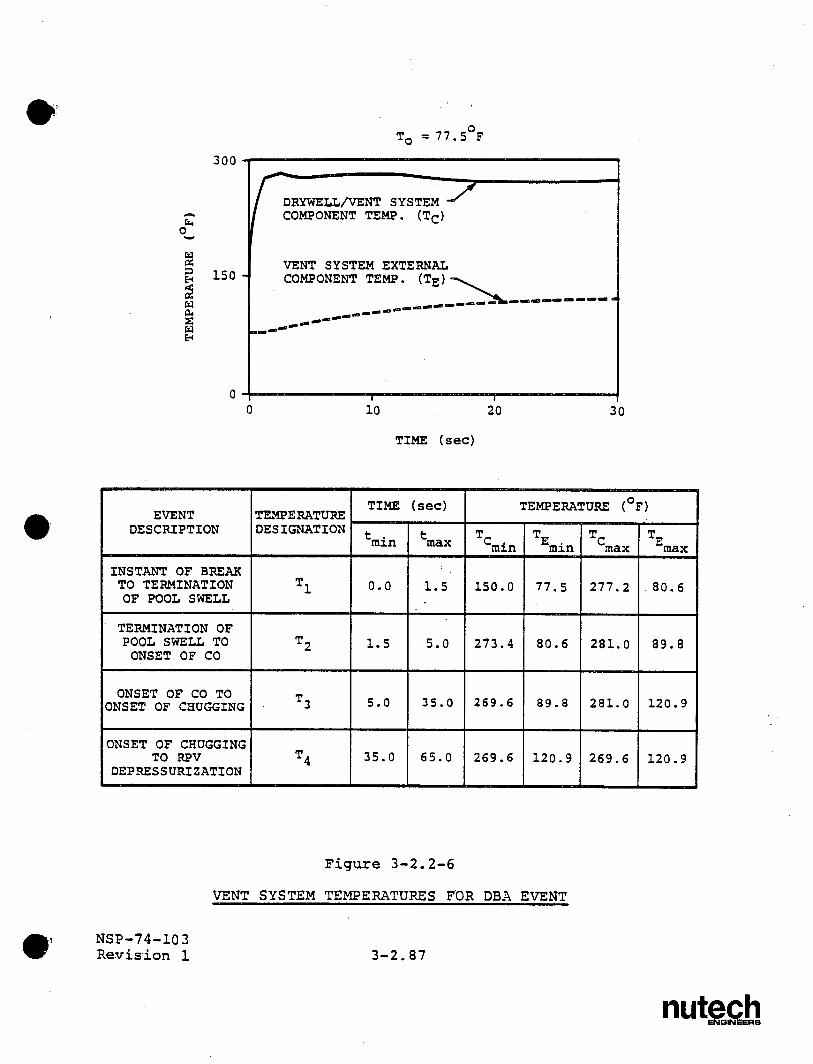
d. LOCA Temperature Loads: The vent system is
subjected to thermal expansion loads associ
ated with the SBA, IBA, and DBA events. The
procedure used to develop LOCA containment
temperatures is discussed in Section 1-4.1.1.
Figures 3-2.2-4 through 3-2.2-6 present the,
resulting vent system temperature transients
and temperature magnitudes at key times during
the SBA, IBA, and DBA events.
Additional vent system SBA event temperatures
are taken from the suppression pool tempera
ture response analysis. Table 3-2.2-2 summar
izes the resulting vent system temperatures.
The greater of the temperatures specified in
NSP-74-103 3-2.30 Revision 1
nutech ENGINEERS
Figure 3-2.2-4 and Table 3-2.2-2 is used in
evaluating the effects of SBA event tempera
tures.
The temperatures of the major components of
the vent system, such as the vent line, vent.
header, and downcomers, are conservatively
assumed to be equal to the corresponding dry
well temperatures for the SBA, IBA and DBA
events.
The temperatures of the external components of
the vent system, such as the support columns,
downcomer bracing, vent header deflectors,
vacuum breaker penetration supports, and
associated ring plates and stiffeners, are
assumed equal to the corresponding suppression
chamber temperatures for each event.
The temperatures specified are assumed repre
sentative of the major component and external
component metal temperatures throughout the
vent system. The temperature of the SRV
piping is 375*F for those SBA, IBA, and DBA
events which include SRV discharge loads. The
NSP-74-103 3-2.31 Revision 1
nutech ENGINEERS
ambient or initial temperature of the vent
system for all events is assumed equal to the
arithmetic mean of the minimum and maximum
vent system operating temperatures.
4. Vent System Discharge Loads
a. Pressurization and Thrust Loads: The vent
system is subjected to dynamic pressurization
and thrust loads during a DBA event. The
procedure used to develop vent system pres
surization and thrust forces applied to the
unaffected areas of the major components of
the vent system is discussed in Section
1-4.1.2. Table 3-2.2-3 shows the resulting
maximum forces for each of the major component
unreacted areas at key times during the DBA
event.
The vent system discharge loads shown include
the effects of a zero drywell/wetwell pressure
differential. The vent system discharge loads
specified for the DBA event include the
effects of DBA internal pressure loads as
NSP-74-103 3-2.32 Revision 1
nutech ENGINEERS
discussed in load case 3a. The vent system
discharge loads which occur during the SBA or
IBA events are negligible.
5. Pool
a.
Swell Loads
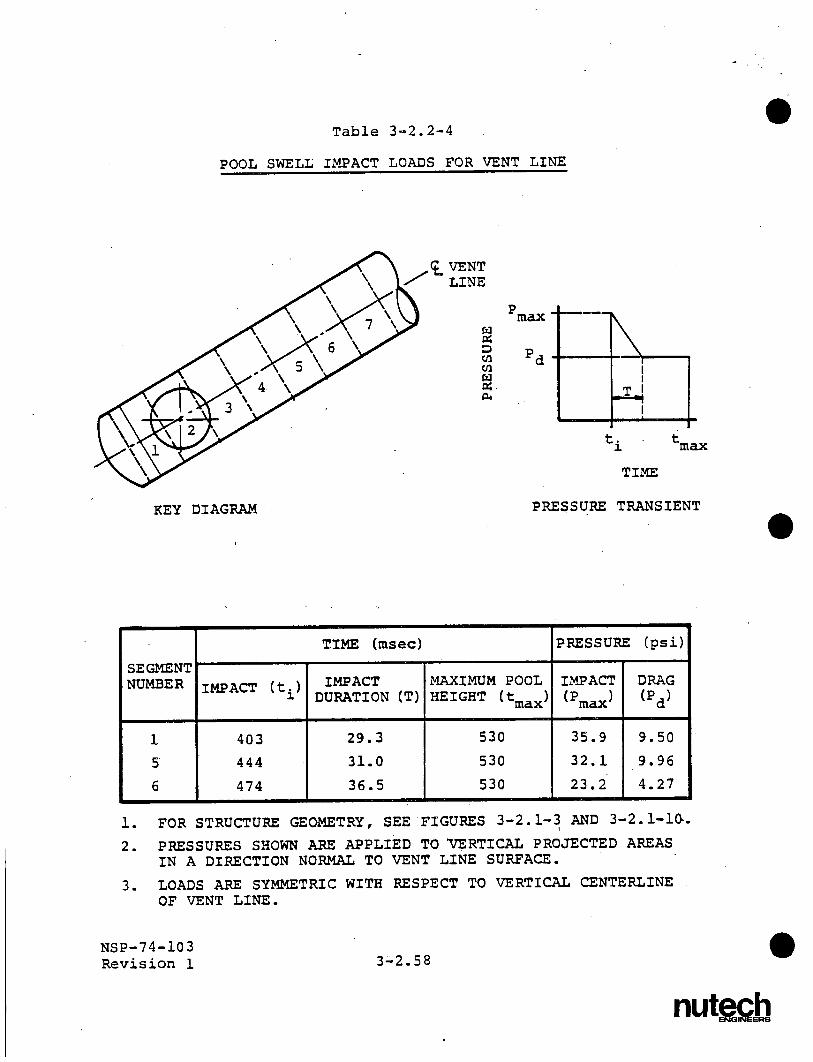
Vent System Impact and Drag Loads: During the
initial phase of a DBA event, transient impact
and drag pressures are postulated to act on
major components of the vent system above the
suppression pool. The major components
affected are the vent line inside the suppres
sion chamber below the maximum bulk pool
height and the inclined portion of the down
comers. The vent headers in the vent line bay
and in the non-vent line bay are shielded from
pool swell impact loads by the vent header
deflectors.
The procedure used to develop the transient
forces and the spatial distribution of pool
swell impact loads on these components is
discussed in Section 1-4.1.4. Table 3-2.2-4
and Figures 3-2.2-7 and 3-2.2-8 summarize the
resulting magnitudes and distribution of pool
swell impact loads on the vent line, down-
NSP-74-103 Revision 1
3-2.33
nutech ENGINEERS
comers, and vent header deflector. The
results shown are based on plant unique QSTF
test data contained in the PULD (Reference 3)
and include the effects of the main vent
orifice tests. Pool swell loads do not occur
during the SBA and IBA events.
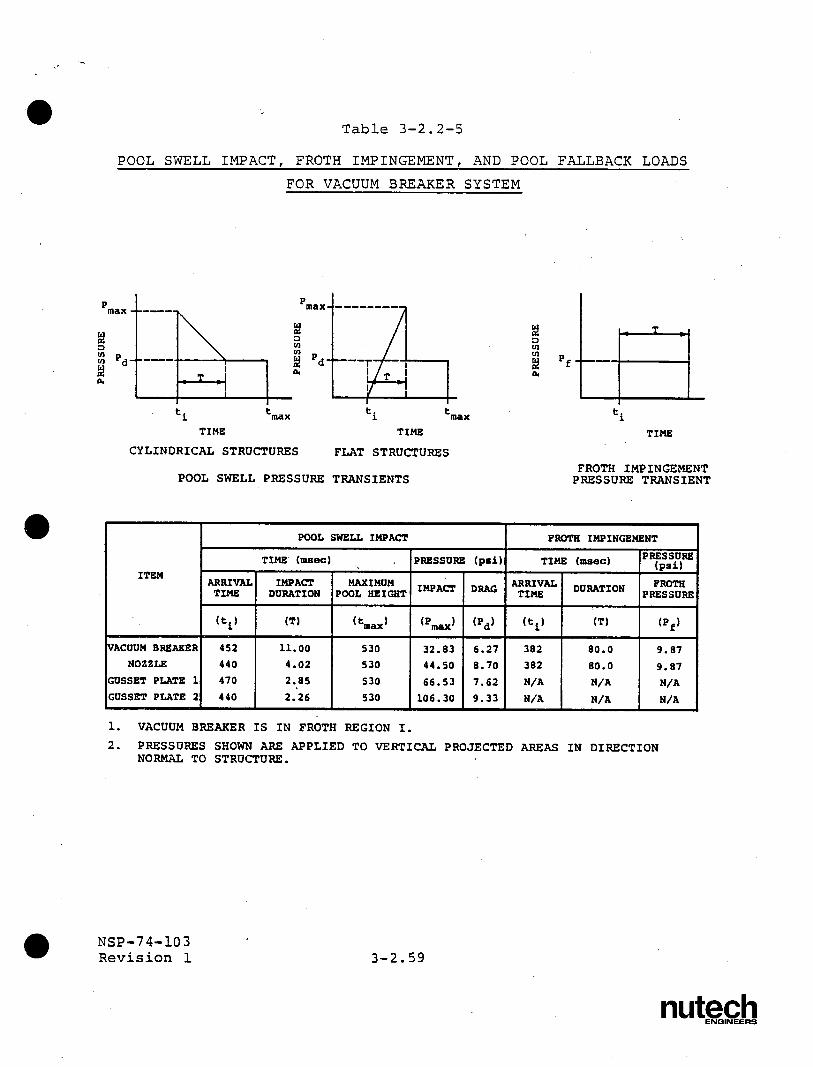
b. Impact and Drag Loads on Other Structures:
During the initial phase of a DBA event,
transient impact and drag pressures are postu
lated to act on non-major components of the
vent system. The components affected are the
vacuum breaker and vacuum breaker penetration.
The downcomer tie rods, the downcomer
longitudinal bracing members, and the SRV
piping and supports are also subjected to the
drag loads during this phase of a DBA event.
The procedure used to develop the transient
forces and the spatial distribution of pool
swell impact and drag loads on these
components is discussed in Section 1-4.1.4.
Tables 3-2.2-5 and 3-2.2-6 and Figure 3-2.2-9
summarize the resulting magnitudes and
distribution of pool swell impact and drag
NSP-74-103 3-2.34
Revision 1
nutech ENOIER
pressures on the vacuum breaker, the vacuum
breaker penetration, the downcomer tie rods,
and the downcomer longitudinal bracings. The
pool swell drag loads on the SRV piping and
supports located beneath the level of the vent
line are presented in Volume 5 of this report.
The results shown are based on plant unique
QSTF test data contained in the PULD which are
used to determine the impact velocities and
arrival times. Pool swell loads do not occur
during the SBA and IBA events.
c. Froth Impingement and Fallback Loads: During
the initial phase of a DBA event, transient
impingement pressures are postulated to act on
components of the vent system located in spec
ified regions above the rising suppression
pool. The impacted components located in both
Regions I and II are the vacuum breaker and
vacuum breaker penetration.
The procedure used to develop the transient
forces and spatial distribution of froth
impingement and fall back loads on these com
ponents is discussed in Section 1-4.1.4.
NSP-74-103 3-2.35 Revision 1
nutech ENGINEERS
Table 3-2.2-5 summarizes the resulting
magnitudes and distribution of froth impinge
ment and fallback pressures on the vacuum
breaker and vacuum breaker penetration. Pool
swell loads do not occur during the SBA and
IBA events.
d. Pool Fallback Loads: During the later portion
of the pool swell event, transient drag
pressures are postulated to act on selected
components of the vent system located between
the maximum bulk pool height and the downcomer
exit. The components affected are the down
comer longitudinal bracing members and the SRV
piping and supports located beneath the level
of the vent line. The procedure used to
develop transient drag pressures and spatial
distribution of pool fallback loads on these
components is discussed in Section 1-4.1.4.
Table 3-2.2-6 summarizes the resulting magni
tudes and distribution of pool fallback loads
on the downcomer longitudinal bracing
members. (The pool fallback loads on the SRV
piping and supports located beneath the level
NSP-74-103 3-2.36 Revision 1
nutech ENGINEERS
of the vent line are presented in Volume 5 of
this report) . The results shown include the
effects of maximum pool displacements measured
in plant unique QSTF tests. Pool swell loads
do not occur during the SBA and IBA events.
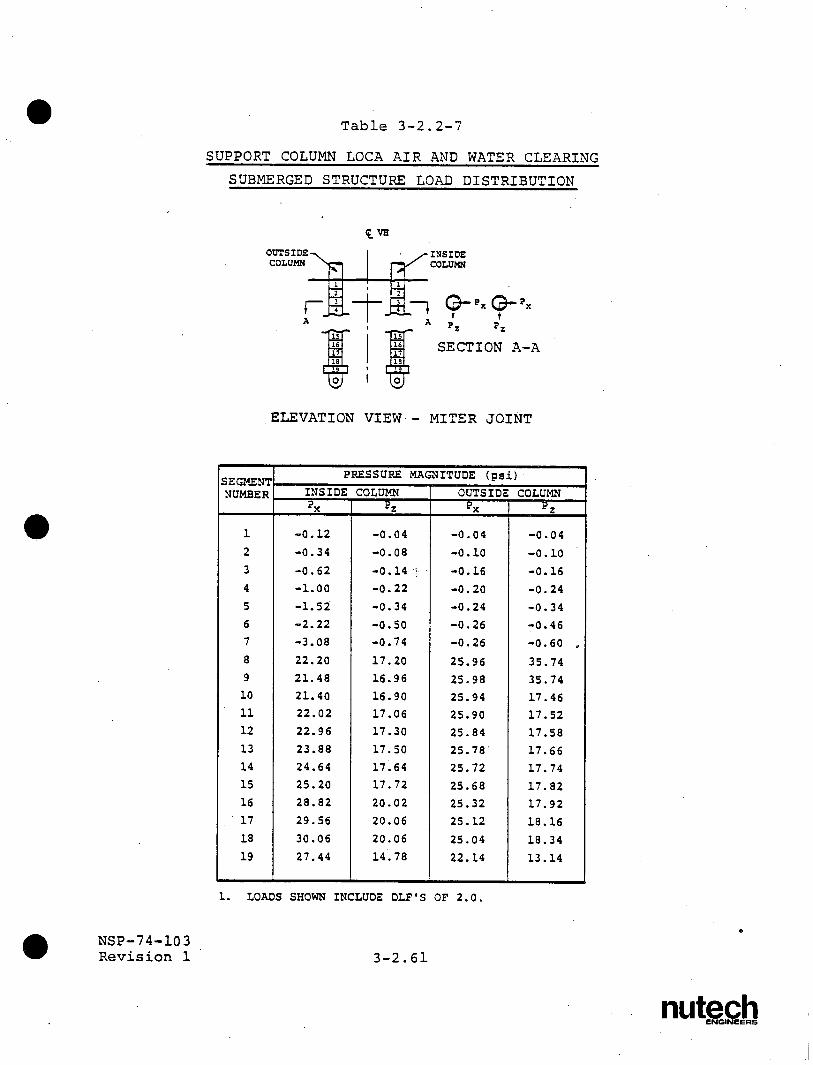
e. LOCA Water Clearing Submerged Structure Loads:
Water jet drag loads are postulated to act on
the submerged components of the vent system
during the water clearing phase of a DBA
event. The components affected are the vent
system support columns. The procedure used to
develop the transient forces and spatial
distribution of LOCA water clearing loads on
these components is discussed in Section
1.4.1.5. Table 3-2.2-7 shows the resulting
magnitudes and distribution of LOCA water
clearing loads acting on the support columns.
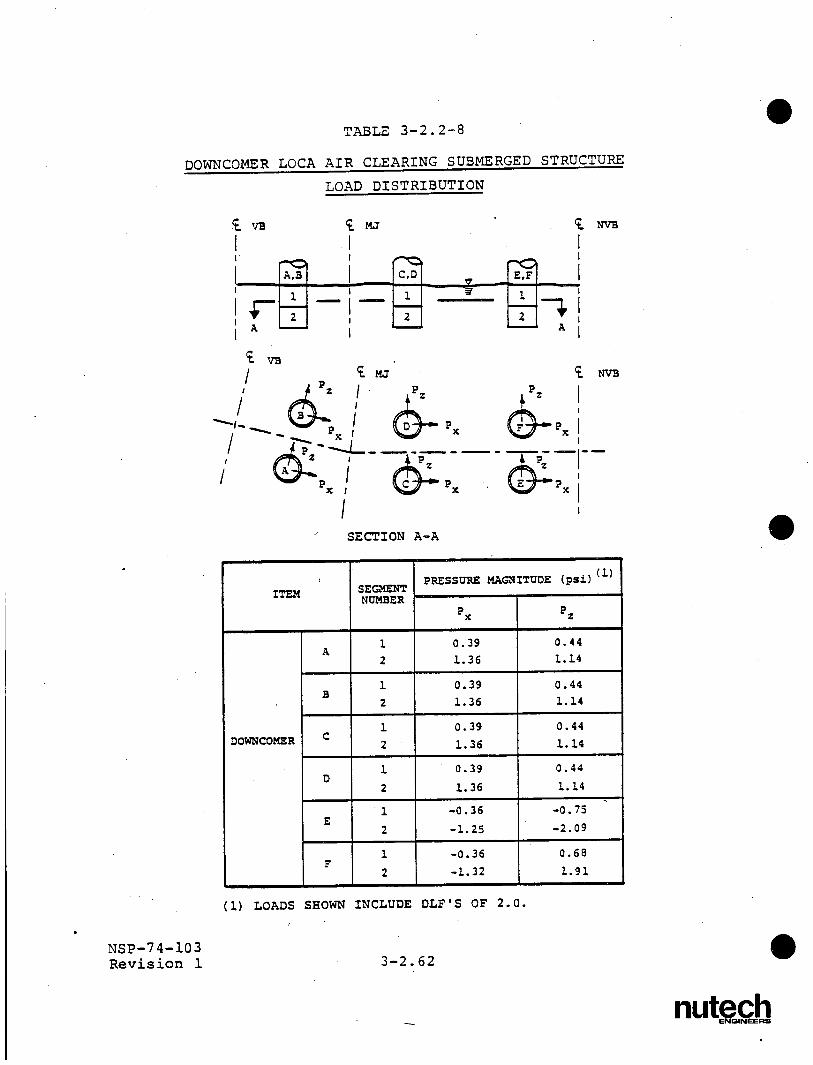
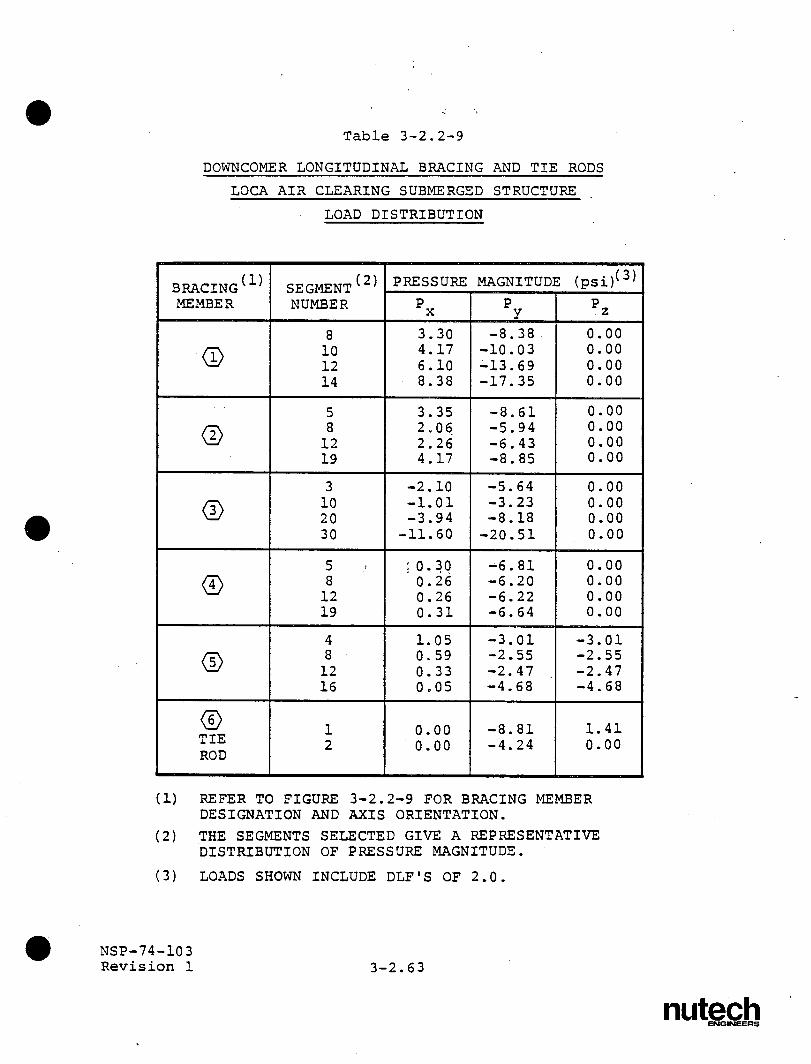
f. LOCA Air Clearing Submerged Structure Loads:
Transient.drag pressures are postulated to act
on the submerged components of the vent system
during the air clearing phase of a DBA
event. The components affected are the down
comers, the downcomer tie rods, the downcomer
NSP-74-103 3-2.37 Revision 1
nutech ENGINEERS
longitudinal bracing members, the support
columns, and the submerged portion of the SRV
piping. The procedure used to develop the
transient forces and spatial distribution of
DBA air clearing drag loads on these com
ponents is discussed in Section 1-4.1.6.
Tables 3-2.2-7, 3-2.2-8, and 3-2.2-9 show the
resulting magnitudes and distribution of drag
pressures acting on the vent system support
columns, the downcomers, the downcomer tie
rods, and the downcomer longitudinal bracing
members for the controlling DBA air clearing
load case. (The controlling DBA air clearing
loads on the submerged portion of the SRV
piping are presented in Volume 5 of this
report). The results- shown include the
effects of velocity drag, acceleration drag,
and interference effects. The LOCA air
clearing submerged structure loads which occur
during an SBA or IBA event are negligible.
6. Condensation Oscillation Loads
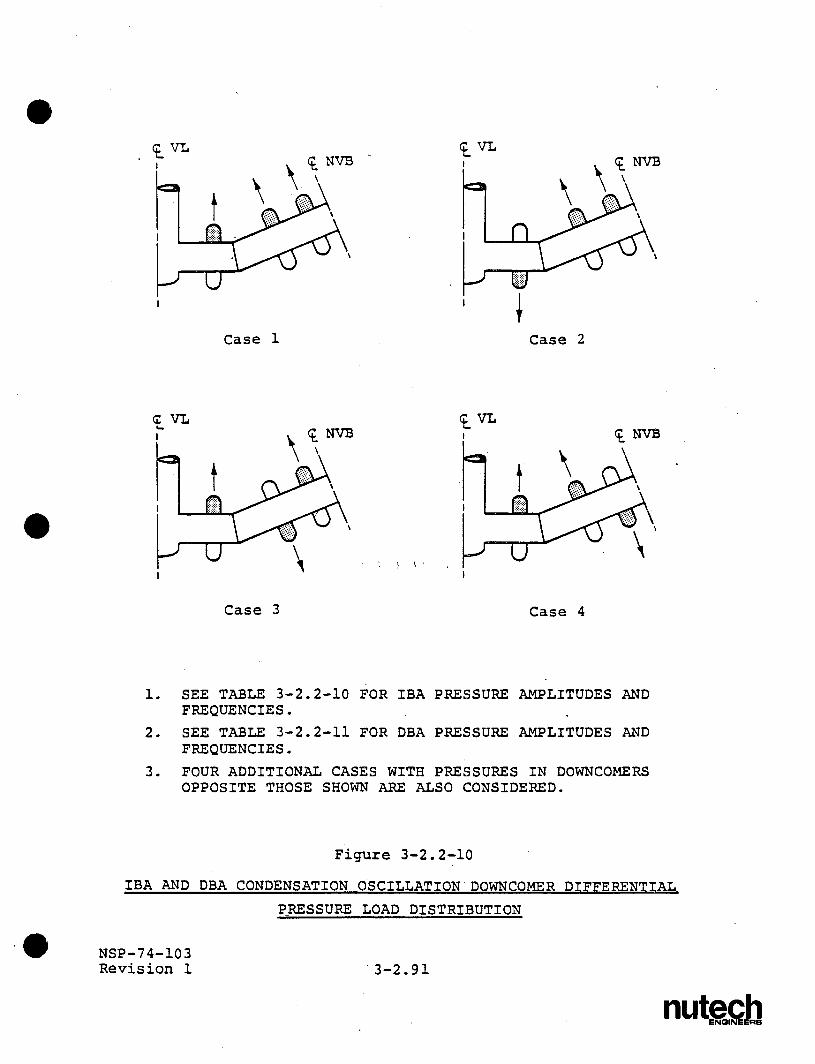
a. IBA Condensation Oscillation Downcomer Loads:
Harmonic internal pressure loads are postu
lated to act on the downcomers during the
NSP-74-103 3-2.38 Revision 1
nutech ENGINEERS
condensation oscillation phase of an IBA
event. The procedure used to develop the
harmonic pressures and spatial distribution of
IBA condensation oscillation downcomer loads
is discussed in Section 1-4.1.7. The loading
consists of a uniform internal pressure compo
nent acting on all downcomers and a differen
tial internal pressure component acting on one
downcomer in a downcomer pair. Table 3-2.2-10
shows the resulting pressure amplitudes and
associated frequency range for each of the
three harmonics in the IBA condensation
oscillation downcomer loading. Figure
3-2.2-10 shows the corresponding distribution
of differential downcomer internal pressure
loadings.
The IBA condensation oscillation downcomer
load harmonic in the range of the dominant
downcomer frequency for the uniform and the
differential pressure components is applied at
the dominant downcomer frequency. The remain
ing two downcomer load harmonics are applied
at frequencies which are multiples of the
dominant frequency. The results of the three
NSP-74-103 3-2.39 Revision 1
nutech ENGINEERS
harmonics for the uniform and differential IBA
condensation oscillation downcomer load compo
nents are combined by absolute sum.
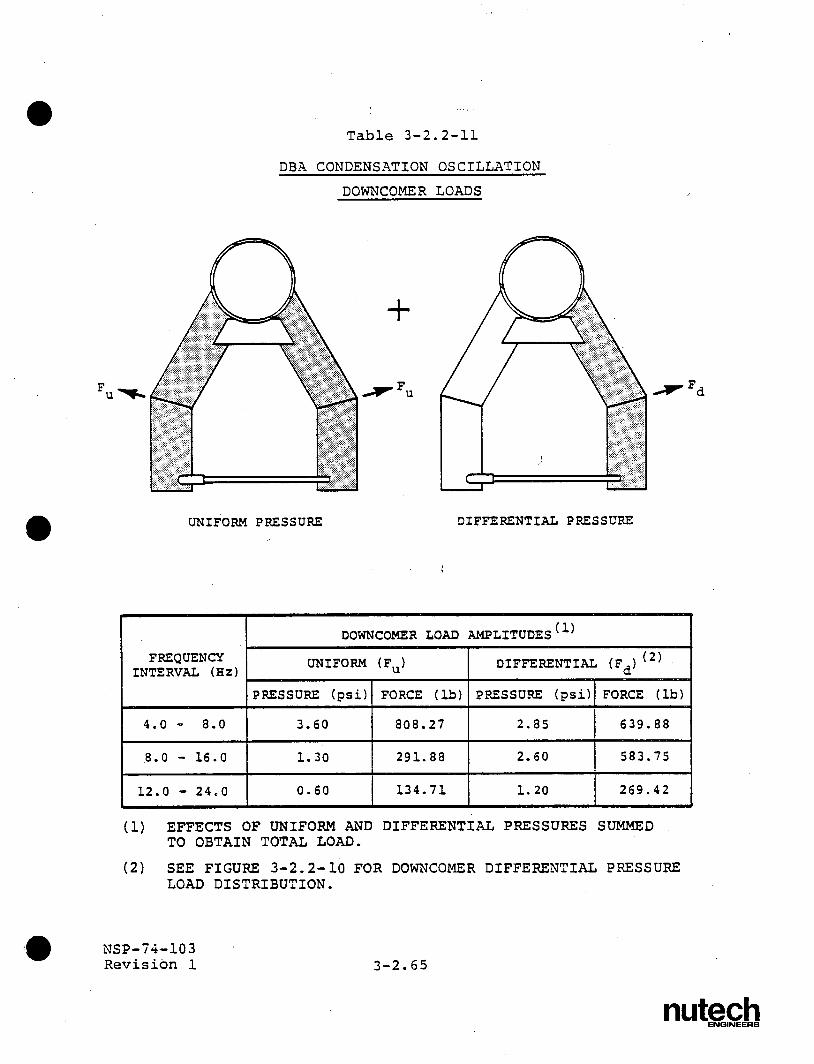
b. DBA Condensation Oscillation Downcomer Loads:
Harmonic internal pressure loads are postu
lated to act on the downcomers during the
condensation oscillation phase of a DBA event.
The procedure used to develop the harmonic
pressures and spatial distribution of DBA
condensation oscillation downcomer loads is
the same as that discussed for IBA condensa
tion oscillation downcomer loads in load
case 6a. Table 3-2.2-11 shows the resulting
pressure amplitudes and associated frequency
range for each of the three harmonics in the
DBA condensation oscillation downcomer load
ing. Figure 3-2.2-10 shows the corresponding
distribution of differential downcomer inter
nal pressure loadings.
c. IBA Condensation Oscillation Vent System Pres
sure Loads: Harmonic internal pressure loads
are postulated to act on the vent system dur
ing the condensation oscillation phase of an
NSP-74-103 3-2.40
Revision 1
nutech ENGINEERS
IBA event. The components affected are the
vent line, the vent header, and the down
comers. The procedure used to develop the
harmonic pressures and spatial distribution of
IBA condensation oscillation vent system pres
sures is discussed in Section 1-4.1.7.
Table 3-2.2-12 shows the resulting pressure
amplitudes and associated frequency range for
the vent line and vent header. The loading is
applied at the frequency within a specified
range which maximizes the vent system
response.
The effects of IBA condensation oscillation
vent system pressures on the downcomers are
included in the IBA condensation oscillation
downcomer loads discussed in load case 6a. An
additional static internal pressure of 1.55
psi is applied uniformly to the vent line,
vent header, and downcomers to account for the
effects of downcomer submergence. The IBA
condensation oscillation vent system pressures
act in conjunction with the IBA containment
internal pressures discussed in load case 3a.
NSP-74-103 3-2.41 Revision 1
nutech ENGINEERS
d. DBA Condensation Oscillation Vent System Pres
sure Loads: Harmonic internal pressure loads
are postulated to act on the vent system
during the condensation oscillation phase of a
DBA event. The components affected are the
vent line, vent header, and downcomers. The
procedure used to develop the harmonic pres
sures and spatial distribution of the DBA
condensation oscillation vent system pressures
is the same as that- discussed for the IBA in
load case 6c. Table 3-2.2-12 shows the
resulting pressure amplitudes and associated
frequency range for the vent line and vent
header. The effects of DBA condensation
oscillation vent system pressures on the
downcomers are included in the DBA condensa
tion oscillation downcomer loads discussed in
load case 6b. The DBA condensation oscilla
tion vent system pressures act in addition to
the DBA vent system pressurization and thrust
loads discussed in load case 4a.
e. IBA Condensation Oscillation Submerged Struc
ture Loads: Harmonic pressure loads are
postulated to act on the submerged components
NSP-74-103 3-2.42 Revision 1
nutech ENGINEERS
of the vent system during the condensation
oscillation phase of an IBA event. In accor
dance with NUREG-0661, the submerged structure
loads specified for pre-chug are used in lieu
of IBA condensation oscillation submerged
structure loads. Pre-chug submerged structure
loads are discussed in load case 7c.
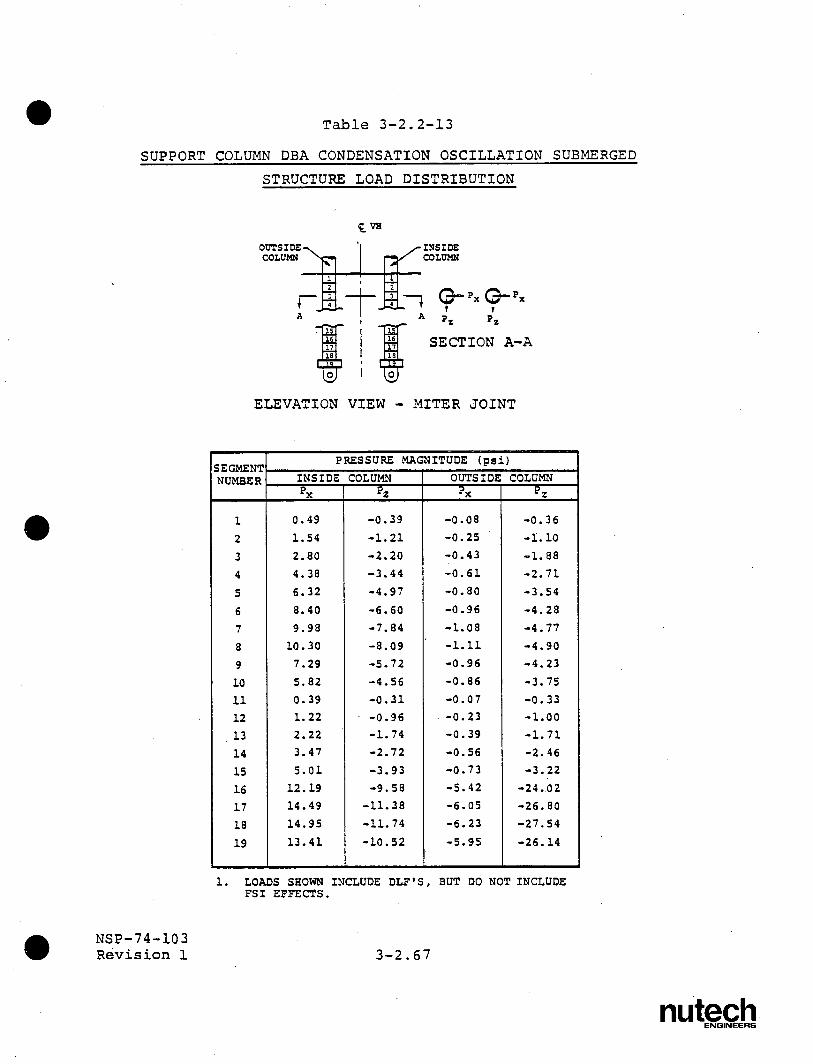
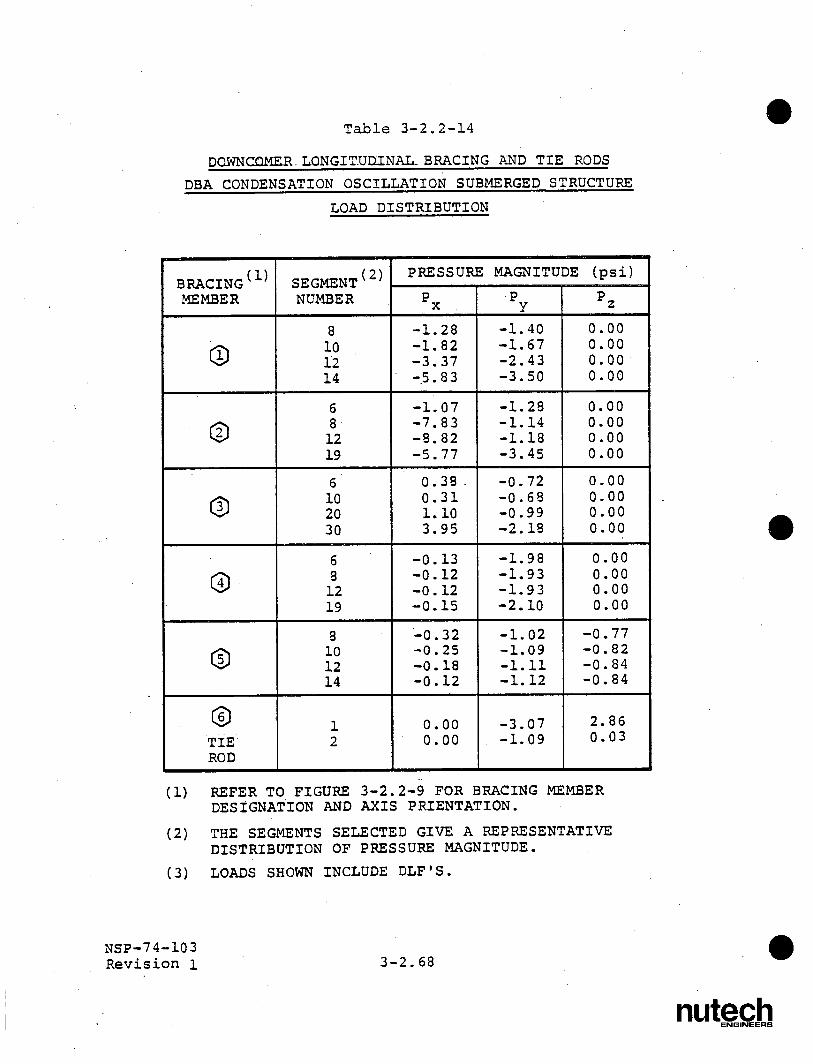
f. DBA Condensation Oscillation Submerged Struc
ture Loads: Harmonic drag pressures are pos
tulated to act on the submerged components of
the vent system during the condensation oscil
lation phase of a DBA event. The components
affected are the downcomer tie rods, the
downcomer longitudinal bracing members, the
support columns, and the submerged portions of
the SRV piping. The procedure used to develop
the harmonic forces and spatial distribution
of DBA condensation oscillation drag loads on
these components is discussed in Section
1-4.1.7.
Loads are developed for the case with the
average source strength at all downcomers and
the case with twice the average source
NSP-74-103 3-2.43 Revision 1
nutech ENGINEERS
strength at the nearest downcomer. The
results of these two cases are evaluated to
determine the controlling loads.
Tables 3-2.2-13 and 3-2.2-14 show the result
ing magnitudes and distribution of drag
pressures acting on the support columns, the
downcomer tie rods, and the downcomer longi
tudinal bracing members for the controlling
DBA condensation oscillation drag load case.
The controlling DBA condensation oscillation
drag loads on the submerged portion of the SRV
piping are presented in Volume 5 of this
report. The effects of DBA condensation
oscillation submerged structure loads on the
downcomers are included in the loads discussed
in load case 6b.
The results in Tables 3-2.2-13 and 3-2.2-14
include the effects of velocity drag, accel
eration drag, torus shell FSI acceleration
drag, interference effects, and acceleration
drag volumes. Figure 3-2.2-11 shows a typical
pool acceleration profile from which the FSI
accelerations are derived. The results of
NSP-74-103 3-2.44 Revision 1
nutech ENGINEERS
each harmonic in the loading are combined
using the methodology discussed in Section
1-4.1.7.
7. Chugging Loads
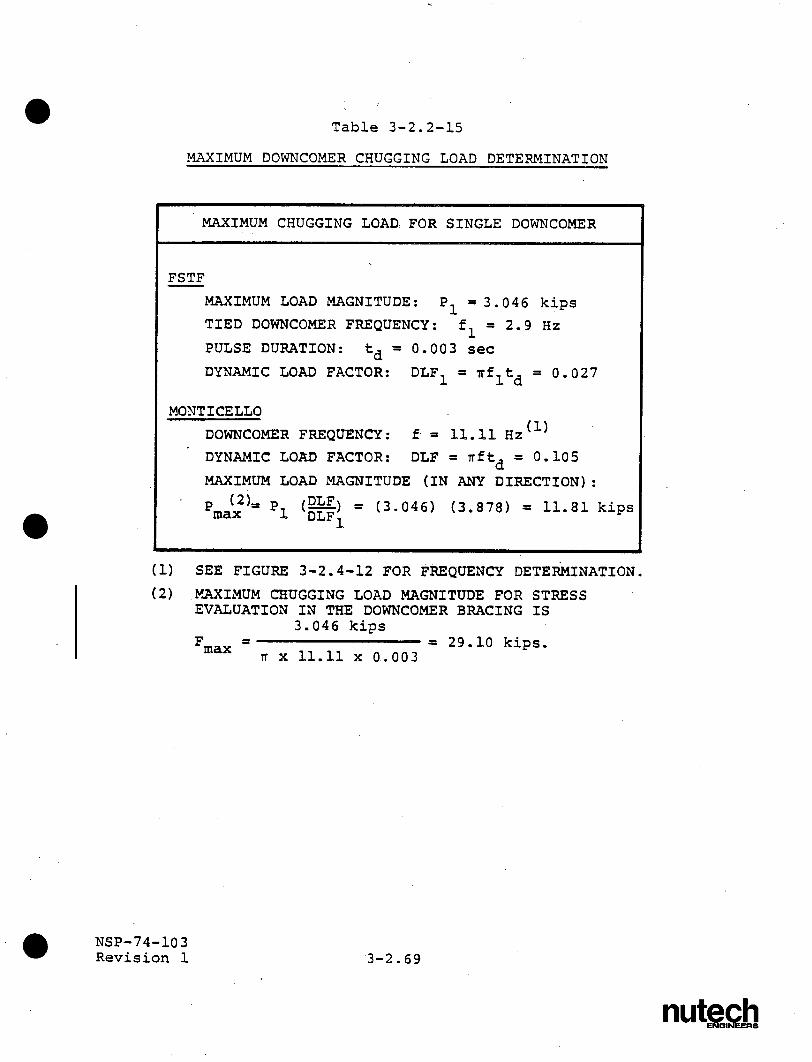
a. Chugging Downcomer Lateral Loads: Lateral
loads are postulated to act on the downcomers
during the chugging phase of an SBA, IBA, and
DBA event. The procedure used to develop
chugging downcomer lateral loads is discussed
in Section 1-4.1.8. The maximum lateral load
acting on any one downcomer in any direction
is obtained using the maximum downcomer
lateral load and chugging pulse duration
measured at FSTF, the frequency of the tied
downcomers for FSTF, and the plant unique
downcomer frequency calculated for Monticello.
Table 3-2.2-15 summarizes this information.
The resulting ratio of Monticello to the FSTF
dynamic load factors (DLF) is used in subse
quent calculations to determine the magnitude
of multiple downcomer loads and to determine
the load magnitude used for evaluating
fatigue. Section 3-2.4.1 discusses the method
NSP-74-103 3-2.45 Revision 1
nutech ENGINEERS
ology used to determine the plant unique down
comer frequency.
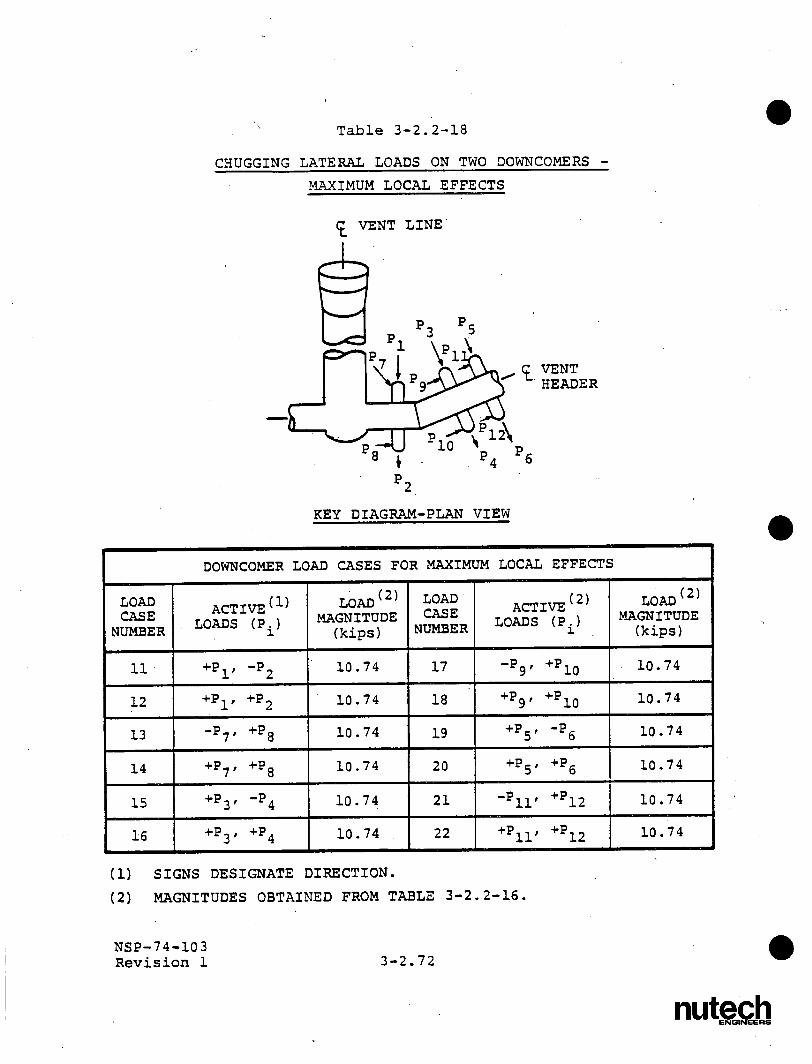
The magnitude of chugging lateral loads acting
on multiple downcomers simultaneously is
determined using the methodology described in
Section 1-4.1.8. The methodology involves
calculation of the probability of exceeding a
given downcomer load magnitude once per LOCA
as a function of the number of downcomers
loaded. The chugging load magnitudes (Table
3-2.2-16) are determined using the resulting
non-exceedance probabilities and the ratio of
the DLF's from the maximum downcomer load
calculation. The distributions of chugging
downcomer lateral loads considered are those
cases which maximize both local and overall
effects in the vent system. Tables 3-2.2-17
and 3-2.2-18 summarize these distributions.
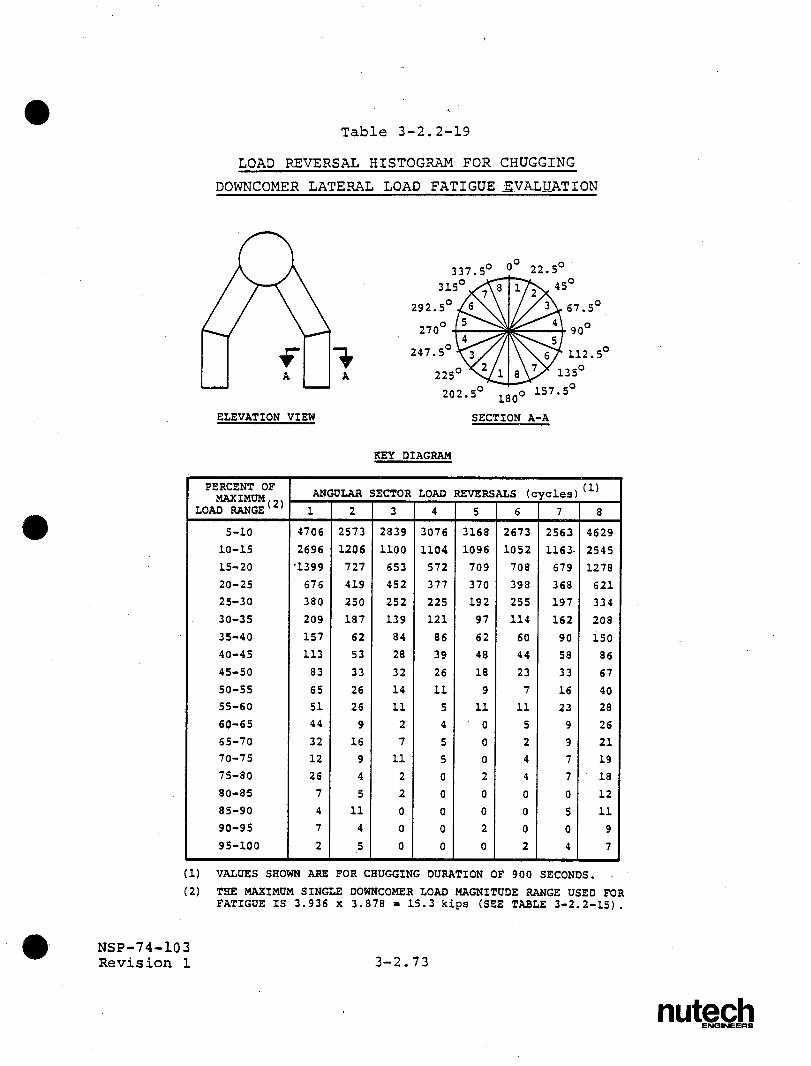
The maximum downcomer lateral load magnitude
used for evaluating fatigue is obtained using
both the maximum downcomer lateral load
measured at FSTF with a 95% NEP and the ratio
of DLF's from maximum downcomer load calcula
NSP-74-103 3-2.46 Revision 1
nutech ENGINEERS
tions. The stress reversal histograms pro
vided for FSTF are converted to plant unique
stress reversal histograms using the postu
lated plant unique chugging duration
(Table 3-2.2-19).
b. Chugging Vent System Pressures: Transient and
harmonic internal pressures are postulated to
act on the vent system during the chugging
phase of an SBA, IBA, and DBA event. The
components affected are the vent line, the
vent header, and the downcomers. The proce
dure used to develop chugging vent system
pressures is discussed in Section 1-4.1.8.
The load consists of a gross vent system pres
sure oscillation component, an acoustic vent
system pressure oscillation component, and an
acoustic downcomer pressure oscillation compo
nent. Table 3-2.2-20 shows the resulting
pressure magnitudes and characteristics of the
chugging vent system pressure loading. The
three load components are evaluated individu
ally and are not combined.
NSP-74-103 3-2.47 Revision 1
nutech ENGINEERS
The overall effects of chugging vent system
pressures on the downcomers are included in
the loads discussed in load case 7a. The
downcomer pressures (Table 3-2.2-20) are used
to evaluate downcomer hoop stresses. The
chugging vent system pressures act in addition
to the SBA and IBA containment internal
pressures discussed in load case 3a and the
DBA pressurization and thrust loads discussed
in load case 4a.
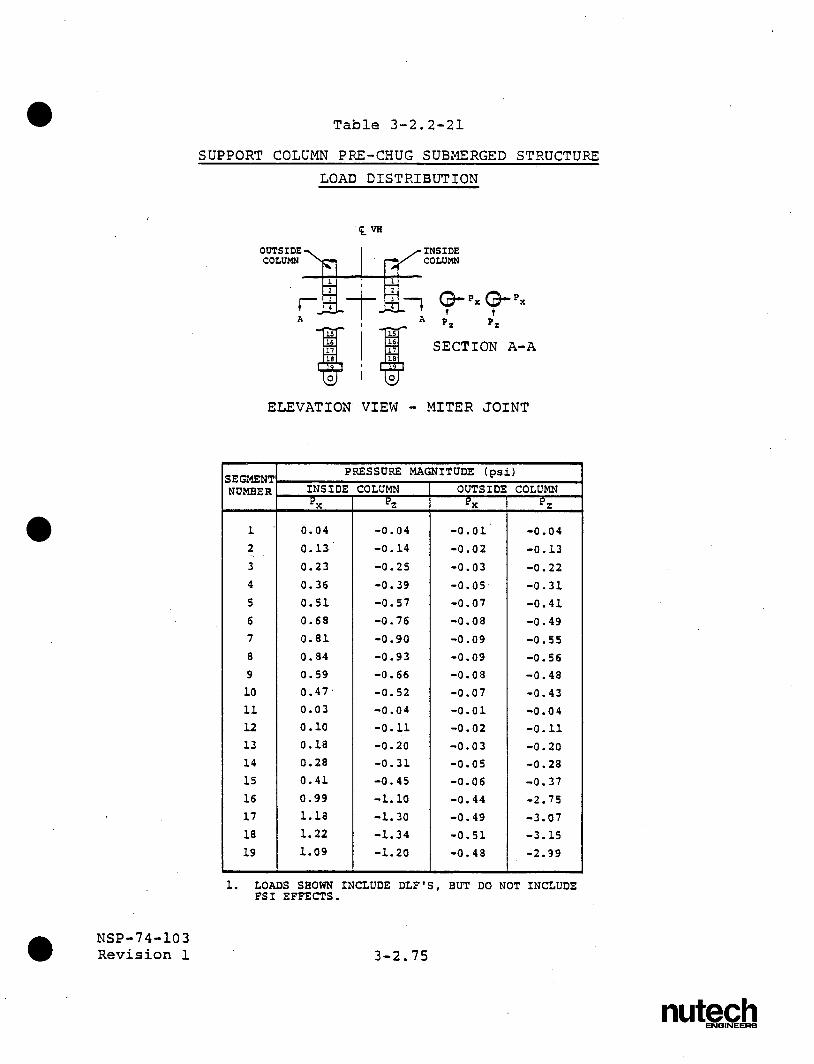
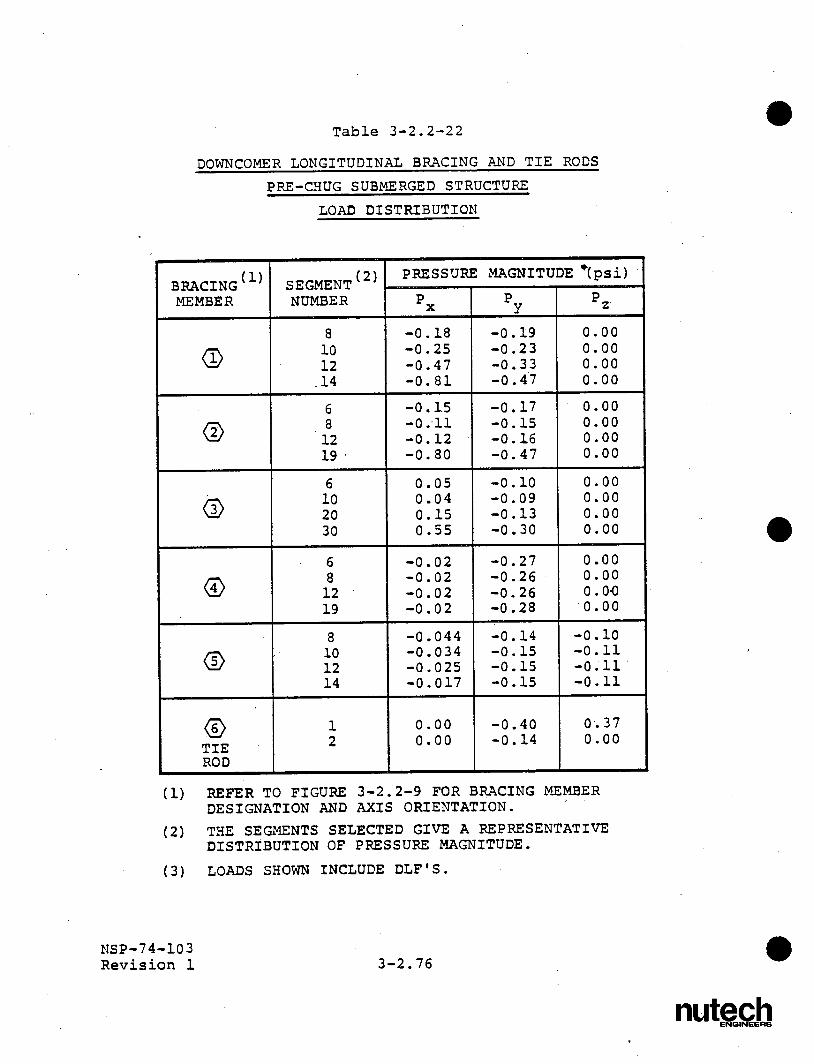
c. Pre-Chug Submerged Structure Loads: During
the chugging phase of an SBA, IBA, or DBA
event, harmonic drag pressures associated with
the pre-chug portion of a chugging' cycle are
postulated to act on the submerged components
of the vent system. The components affected
are the downcomer tie rods, the downcomer
longitudinal bracing members, the support
columns, and the submerged portion of the SRV
piping. The procedure used to develop the
harmonic forces and spatial distribution of
pre-chug drag loads on these components is
discussed in Section 1-4.1.8.
NSP-74-103 3-2.48 Revision 1
nutech ENGINEERS
Loads are developed for the case with the
average source strength at all downcomers and
the case with twice the average source
strength at the nearest downcomer. The
results of these -two cases are evaluated to
determine the controlling loads. Tables
3-2.2-21 and 3-2.2-22 show the resulting
magnitudes and distribution of drag pressures
acting on the support columns, the downcomer
tie rods, and the downcomer longitudinal
bracing members for the controlling pre-chug
drag load case. The controlling pre-chug drag
loads on the submerged portion of the SRV
piping are presented in Volume 5 of this
report. The effects of pre-chug submerged
structure loads on the downcomers are included
in the loads discussed in Load Case 7a.
The results shown include the effects of velo
city drag, acceleration drag, torus shell FSI
acceleration drag, interference effects, and
acceleration drag volumes. Figure 3-2.2-11
shows a typical pool acceleration profile from
which the FSI accelerations are derived.
NSP-74-103 3-2.49 Revision 1
nutech
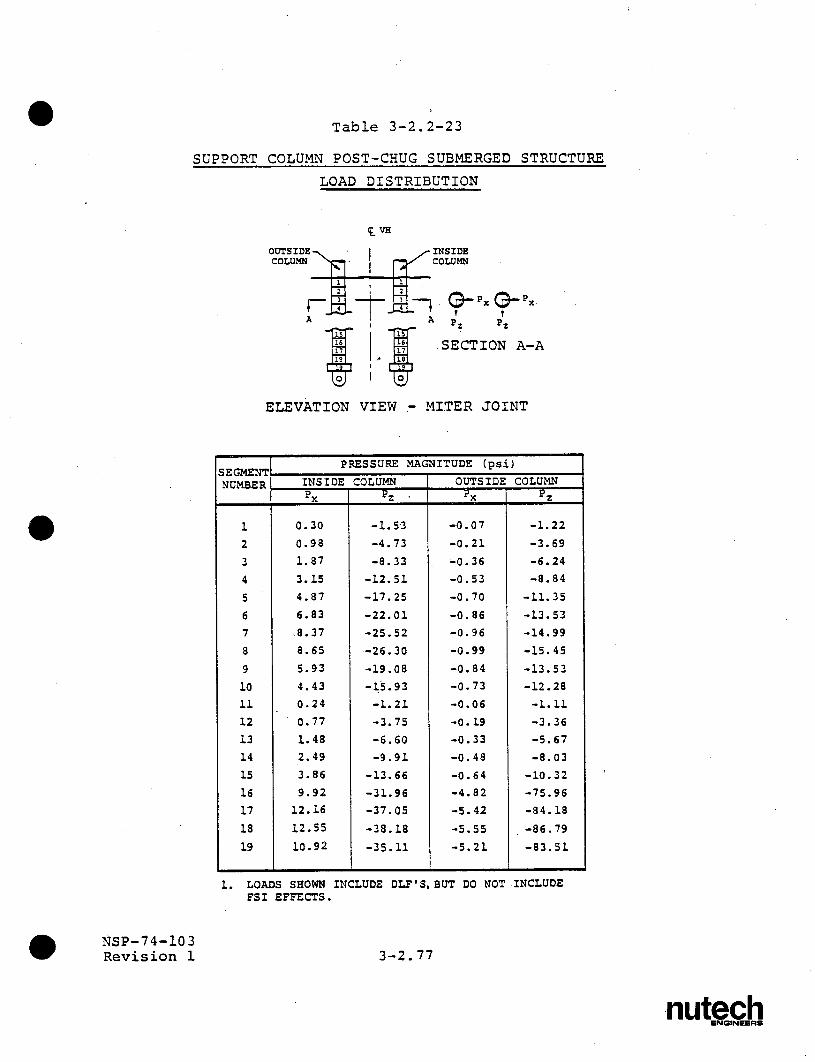
d. Post-Chug Submerged Structure Loads: During
the chugging phase of an SBA, IBA, or DBA
event, harmonic drag pressures associated with
the post-chug portion of a chug cycle are
postulated to act on the submerged components
of the vent system. The components affected
are the downcomer tie rods, the downcomer
longitudinal bracing members, the support
columns, and the submerged portion of the SRV
piping. Section 1-4.1.8 discusses the proce
dure used to develop the- harmonic forces and
spatial distribution of pre-chug drag loads on
these components.
Loads are developed for the cases with the
maximum source strength at the nearest two
downcomers acting both in-phase and
out-of-phase. The results of these cases are
evaluated to determine the controlling loads.
Tables 3-2.2-23 and 3-2.2-24 shows the result
ing magnitudes and distribution of drag
pressures acting on the support columns, the
downcomer tie rods, and the downcomer longitu
dinal bracing members for the controlling
post-chug drag load case. The controlling
post-chug drag loads on the submerged portion
NSP-74-103 3-2.50 Revision 1
nutech ENGINEERS
8. Safe
a.
NSP-74-103 Revision 1
of the SRV piping are presented in Volume 5 of
this report. The effects of post-chug sub
merged structure loads acting on the down
comers are included in the chugging downcomer
lateral loads discussed in Load Case 7a.
The results shown include the effects of velo
city drag, acceleration drag, torus shell FSI
acceleration drag, interference effects, and
acceleration drag volumes. Figure 3-2.2-11
shows a typical pool acceleration profile from
which the FSI accelerations are derived. The
results of each harmonic are combined using
the methodology described in Section 1-4.1.8.
ty Relief Valve Discharge Loads
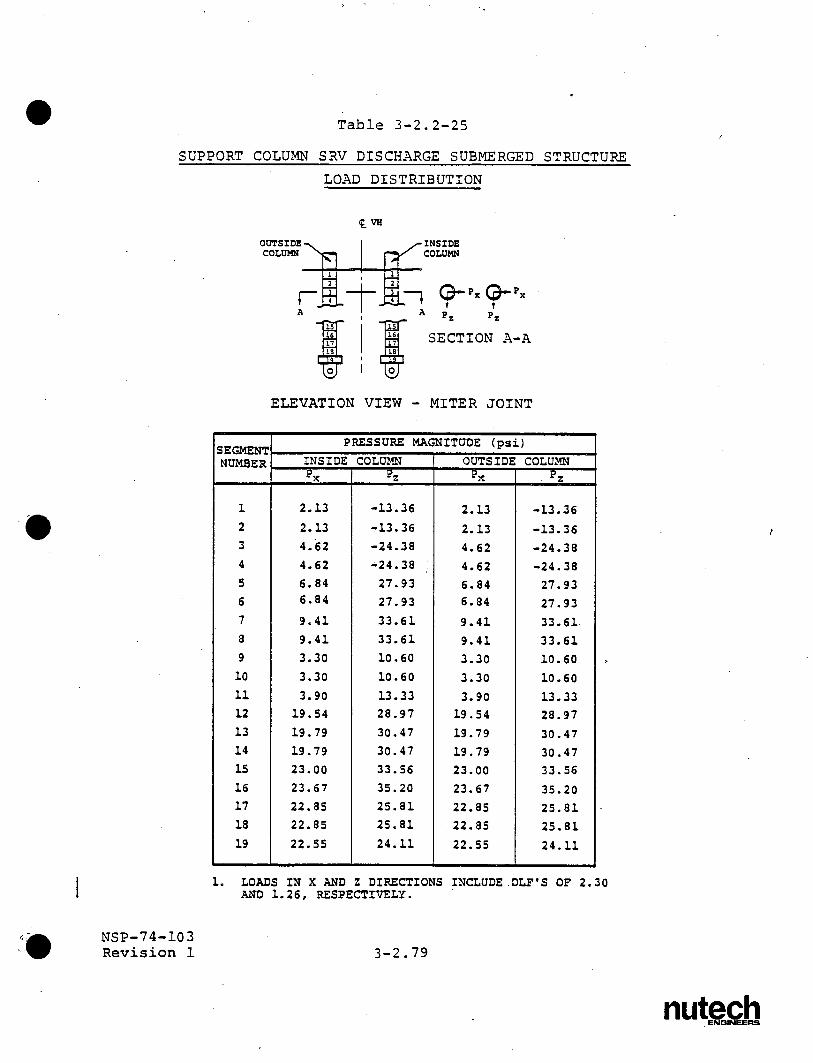
SRV Discharge Water Clearing Submerged
Structure Loads: Water jet loads from the
quencher arm holes are postulated to act on
the submerged components of the vent system
during the water clearing phase of an SRV
discharge event. The quencher water jet does
not reach the downcomers and longitudinal
bracings. The components affected are the
vent system support columns. The procedure
used to develop the transient forces and
3-2.51
nutech ENGINEERS
spatial distribution of the SRV discharge
water clearing loads on these components is
discussed in Section 1.4.2.4. Table 3-2.2-25
provides the resulting magnitudes and distri
bution of SRV water clearing loads acting on
the support columns.
b. SRV Discharge Air Clearing Submerged Structure
Loads: Transient drag pressures are postu
lated to act on the submerged components of
the vent system during the air clearing phase
of an SRV discharge event. The components
affected are the downcomers, the downcomer tie
rods, the downcomer longitudinal bracing mem
bers, support columns, the submerged portion
of the SRV piping, and the SRV piping support..
The procedure used to develop the transient
forces and spatial distribution of the SRV
discharge air clearing drag loads on these
components is discussed in Section 1-4.2.4.
Loads are developed for the case with four
bubbles from quenchers located in the bay
containing the structure or either of the
adjacent bays. A calibration factor is
applied to the resulting downcomer loads
NSP-74-103 3-2.52 Revision 1
nutech
developed using the methodology discussed in
Section 1-4.2.4. Tables 3-2.2-25, 3-2.2-26,
and 3-2.2-27 show the magnitudes and distribu
tion of drag pressures acting on the support
columns, the downcomers, the downcomer tie
rods, and the downcomer longitudinal bracings
for the controlling SRV discharge drag load
case.
These results include the effects of velocity
drag, acceleration drag, interference effects,
and acceleration drag volumes.
9. Piping Reaction Loads
a. SRV Piping Reaction Loads: Reaction loads
affect the vent system because of loads acting
on the drywell and wetwell SRV piping systems.
These reaction loads occur at the vent line
SRV piping penetration. The SRV piping
reaction loads consist of those caused by
motions of the vent system and loads acting on
the drywell and wetwell portions of the SRV
piping systems. Loads acting on the SRV
piping systems are pressurization and thrust
loads, submerged structure loads, and other
operating or design basis loads.
NSP-74-103 3-2.53 Revision 1
nutech ENGINEERS
The effects of the SRV piping reaction loads
on the vent system are included in the vent
system analysis. These reaction loads were
taken from the analysis of the SRV piping
system that is described in Volume 5 of this
report.
10. Containment Interaction Loads
a. Containment Structure Motions: Loads acting
on the drywell, suppression chamber and vent
system cause interaction effects between these
structures. The interaction effects result in
vent system motions applied at the attachment
points of the vent system to the drywell and
the suppression chamber. The effects of these
motions on the vent system are considered in
the vent system analysis.
The values of the loads presented in the preceding para
graphs envelop those which could occur during the LOCA
and SRV discharge events postulated. An evaluation for
the effects of the above loads results in conservative
estimates of the vent system responses and leads to
bounding values of vent system stresses.
NSP-74-103 3-2.54 Revision 1
nutech ENGINEERS
0
(D E
Wn -1 0* I m3 H
0
Ul
COHPONENT PART LOADED
VOLUME 3 LOAD DESIGNATION PUAR REMAR0S sECTIon 8 kg 3oeg PC REMARKIS
CA EFMERENCE OC .
CATEGORY WOAD TYPE NUNBR
DEAD WEIGHT LOADS DEAD WEIGHT OF STEEL Ia 1-3.1 K K K K K K X K X K AS-MODIFIED GEOMETRY
OBE 2a 1-3.1 K K K K x X K K x X 0.23g HORIZONTAL, 0.153g VERTICAL. SEISMIC _
SSB 2b 1-3.1 K K K X X X x x x :0.46g HORISONTAL. 0.307g VERTICAL
NORMAL OPERATING INTERNAL PRESSURE ]a 1-3.1 K x X x K -0.1 TO 1.0 pat
PRESSURE AND LOCA INTERNAL PRESSURE 31 1-4.1.1 K K K K K SBA, IRA. & DBA PRESSURES
TEMPERATURE NORMAL OPERATING TEMPERATURE So 1-3.1 K K K K K K K K X K 65 TO 1500,,
LCA TEMPERATURE 3d 1-4.1.1 K K I x K K X X SEA, 18A. & DBA TEMPERATURES
VENT SYSTEM DISCHARGE PRESSURIZATION AND TIlaUST 4a 1-4.1.2 K K K FORCES ON UNREACTED AREAS
VENT SYSTEM IMPACT AND DRAG 54 1-4.1.4.1 K K K HEADER SHIELDED BY DEFLECTORS IMPACT AND DRAG LOADS ON OTHER STRUCTURES 5b 1-4.1.4.2 X x X COMPONENTS BELOW MAXIMUM
K K POOL NEIGNT
ROTiU IMPINGEMENT & FALLBACE .Sc 1-4.1.4.3 K TWO REGIONS SPECIFIED POOL SWELL
POOL FALLEACK Sd 1-4.1.4.4 K MAJOR COMPONENTS NOT AFFECTED
LOCA WATER CLEARING SUBMERGED STRUCTURE So 1-4.1.5 x EFFECTS ON SUPPORT COLUMNS
LOCA AIR CLEARING SUBMERGED STRUCTURE 59 1-4.1.6 x K K K PRIMARILE LOCAL EFFECTS
IBA CO. DOWNCOMER LOADS 6a 1-4.1.7.2 x UNIFORM & DIFFERENTIAL COMPONENTS
DNA CO, DOWNCOMER W4ADS Nb 1-4.1.7.2 x UNIFORM & DIFFERENTIAL COMPONENTS
CONDENSATION IlA CO, VENT SYSTEM PRESSURE 6c 1-4.1.7.2 K K K DOWNCOMER PRESSURES INCLUDED IN 6. OSCILLATION DNA CO, VEST SYSTEM PRESSURE 6d 1-4.1.7.2 X K K DOWNCOHER PRESSURES INCLUDED IN 6L
IDA CO. SUDMERGED STRUCTURE 6 1-4.1.7.3 K S K DOWNCOMER LOADS INCLUDED IN 6a
DBA CO, SUBMERGED STRUCTURE NE 1-4.1.7.3 X K x DOWNCONER LOADS INCLUDED IN 6b
CHUGGING, DOHNCOHER LATERAL WOADS 7a 1-4.1.0.2 K RSEL BASED ON FSTF
CIUGGING, VENT SYSTEM PRESSURES Tb 1-4.X..2 K X S I THREE WOADING ALTERNATES CHUGGING
PRE-CIlUG, SUBMERGED STRUCTURES 7c 1-4.I.E.3 K x DOWNCONER LOADS INCLUDED IN 7a
POST-CIIUG, SUBMERGED STRUCTURES 7d 1-4.1.6.3 X x x DOWNCOMER LOADS INCLUDED IN 7.
WATER CLEARING, SUBMERGED STRUCTURES Na 1-4.2.4 x EFFECTS ON SUPPORT COLUMNS SRV DISCHARGE
AIR CLEARING, SUBMERGED STRUCTURES Eb 1-4.2.4 x x K I PRIMARILY LOCAL EFFECTS
REAIHG SRV PIPING REACTION 9a VOLUME 5 K REACTIONS ON VENT LINE
CNNETCONTA S N me 2 DYMELL & TORUS OTIONS INTERACTION CONTAINMENT STRUCTURE MOTIONS Io'q VOLUM 2 K Kl X RWI OU OIN
Table 3-2.2-1
VENT SYSTEM COMPONENT LOADING INFORMATION
Table 3-2.2-2
SUPPRESSION POOL TEMPERATURE RESPONSE
ANALYSIS RESULTS - MAXIMUM TEMPERATURES
CAS NUMBER MAXIMUM CONDITION CASE OF SRV's BULK POOL
NUMBER ACTUATED TEMPERATURE (oF)
1A 0 155.0
IB 1 168.0
NORMAL 2A 3 166.0 OPERATING
2B 1 146.0
2C 3 156.0
3A 3 (ADS) 164.0 SBA
EVENT 3B 3 155.0
(1) SEE SECTION 1-5.1 FOR DESCRIPTION OF SRV
DISCHARGE EVENTS CONSIDERED.
NSP-74-103 Revision 1 3-2.56
nutech ENGINEERS
/
Table 3-2.2-3
VENT SYSTEM PRESSURIZATION AND THRUST LOADS
FOR DBA EVENT
A-4 F 4
PLAN SECTION A-A
KEY DIAGRAM
TIME DURING MAXIMUM COMPONENT FORCE MAGNITUDE (kips) DBA EVENT
(sec) F F F F F F
POOL SWELL -64.0 -152.0 58.0 24.G 1.2 -3.9 0.0 TO 1.5
1 0.00 -1.61 -2.02 TIE ROD: 2 0.00 -1.04 -1.01 ROD
(1) REFER TO FIGURE 3-2.2-9 FOR BRACING MEMBER DESIGNATION AND AXIS ORIENTATION.
(2) THE SEGMENTS SELECTED GIVE A REPRESENTATIVE DISTRIBUTION OF PRESSURE MAGNITUDE.
(3) LOADS SHOWN INCLUDE DLF'S.
NSP-74-103Revision 1 3-2.81
nutech ENGINEERS
Po = 0.0 psi
10 100
TIME (sec)
1000
Figure 3-2.2-1
VENT SYSTEM INTERNAL PRESSURES FOR SBA EVENT
NSP-74-103 Revision 1 3-2.82
40
30
20 -
-4
M2
10 -4
DRYWELL VENT SYSTEM ABSOLUTE PRESSURE
VENT SYSTEM/SUPPRESSION CHAMBER AP
0 .4
0 10,000
EVENT -PRESSURE TIME (sec) PRESSURE (psig)
DESCRIPTION DESIGNATION t . t P . AP . P AP min max mmn mmn max max
INSTANT OF BREAK TO ONSET P1 0.0 300.0 0.750 0.175 14.8 2.0 OF CHUGGING
ONSET OF CHUGGING TO P2 300.0 600.0 14.8 2.0 23.2 2.0
INITIATION OF ADS
INITIATION OF ADS TO RPV P3 600.0 1200.0 23.2 2.0 28.0 2.0
DEPRESSURIZATION
nutech ENGINEERS
P = 0.0 psi
20-1
10 100
TIME (sec)
Figure 3-2.2-2
VENT SYSTEM INTERNAL PRESSURES FOR IBA EVENT
NSP-74- 1 0 3
Revision 1 3-2.83
40
30 -
cfn
10-
DRYWELL/VENT SYSTEM ABSOLUTE PRESSURE
VENT SYSTEM/SUPPRESSION CHAMBER AP
0 .1
0 1000 10,000
TIME (sec) PRESSURE (psig) EVENT PRESSURE - ,. 1.;
DESCRIPTION DESIGNATION t tP min max min mmn max max
INSTANT OF BREAK TO ONSET OF P1 0.0 5.0 0.750 0.175 4.3 1.5
CO AND CHUGGING
ONSET OF CO AND CHUGGING TO P2 5.0 900.0 4.3 1.5 30.1 1.8
INITIATION OF ADS
INITIATION OF ADS TO RPV P3 900.0 1100.0 30.1 1.8 36.8 2.4
DEPRESSURIZATION
nutech ENGINEERS
01P = 0.0 psi
10 20 30
TIME (sec)
TIME (sec) PRESSURE (psig) EVENT PRESSURE TIE-sc
DESCRIPTION DESIGNATION t min 'max pmax
INSTANT OF BREAK TO TERMINATION OF p1 0.0 1.5 0.750 0.175 41.4 32.9
POOL SWELL
TERMINATION OF POOL SWELL TO P2 1.5 5.0 32.3 13.8 40.2 29.2 ONSET OF CO
ONSET OF CO TO p 5.0 35.0 28.2 3.0 35.2 12.8 ONSET OF CHUGGING 3
ONSET OF CHUGGING TO RPV p4 35.0 65.0 28.2 3.0 28.2 3.0
DEPRESSURIZATION
1. DBA VENT SYSTEM INTERNAL PRESSURE LOADS ARE INCLUDED IN VENT SYSTEM PRESSURIZATION AND THRUST LOADS SHOWN IN TABLE 3-2.2-3.
Figure 3-2.2-3
VENT SYSTEM INTERNAL PRESSURES FOR DBA EVENT
NSP-74-103 Revision 1
nutech ENGINEERS
40
20 -
-4
ra 4
DRYWELL/VENT SYSTEM ABSOLUTE PRESSURE-%
VENT SYSTEM/ SUPPRESSION
1 CHAMBER AP
0*I
00
3-2.84
T = 77.5 0F 0
400
300
200
100-
01 10 100
TIME (sec)
1,000 10,000
. TIME (sec) ! TEMPERATURE (O) EVENT TEMPERATURE ____
DESCRIPTION DESIGNATION t t T T T T min max Ci Emn Cmax Emax
INSTANT OF BREAK TO ONSET OF T1 0.0 300.0 150.0 90.0 340.0 97.0 CHUGGING
ONSET OF CHUGGING T TO INITIATION OF 2 300.0 600.0 340.0 97.0 340.0 98.6
ADS
INITIATION OF ADS TO RPV 3 600.0 1200.0 340.0 102.0 340.0 136.0
DEPRESSURIZATION
1. SEE TABLE 3-2.2-2 FOR ADDITIONAL SBA EVENT TEMPERATURES.
Figure 3-2.2-4
VENT SYSTEM TEMPERATURES FOR SBA EVENT
NSP-74-103 Revision 1 3-2.85
0
EO-
DRYWELL/VENT SYSTEM COMPONENT TEMP. (TC)
VENT SYSTEM EXTERNAL COMPONENT TEMP. (TE)
.4
nutech
,
T = 77.5 0 F 0
DRYWELL/VENT SYSTEM COMPONENT TEMP. (TC)
VENT SYSTEM EXTERNAL COMPONENT TEMP. (TE)
09 .
TIME (sec)
TIME (sec) TEMPERATURE (oF) EVENT TEMPERATURE ________
DESCRIPTION DESIGNATION t t E C E maax Ci min max Ea
INSTANT OF BREAK TO ONSET OF CO T 0.0 5.0 135.0 95.0 220.0 90.0
AND CHUGGING
ONSET OF CO AND CHUGGUNG TO T 2 5.0 900.0 220.0 90.0 270.0 142.0
INITIATION OF ADS
INITIATION OF ADS TO RPV T 3 900.0 1100.0 270.0 112.0 283.0 167.0
DEPRESSURIZATION
10 100 1,000 10,000
0
Figure 3-2.2-5
VENT SYSTEM TEMPERATURES FOR IBA EVENT
NSP-74-103 Revision 1
nutech ENGINEERS
400
0
E
300
200
100
01
3-2.86
To = 77.5 F
300
150 -
00 10 20
TIME (sec)
Figure 3-2.2-6
VENT SYSTEM TEMPERATURES FOR DBA EVENT
NSP-74-103 Revision 1
nutech ENGINEERS
rzc 0
E-4
Wa
E-
DRYWELL/VENT SYSTEM COMPONENT TEMP. (TC)
VENT SYSTEM EXTERNAL COMPONENT TEMP. (TE)
30
TIME (sec) TEMPERATURE (o EVENT TEMPERATURE
DESCRIPTION DESIGNATION t t T T T T min max Cmi min Cma Ea
INSTANT OF BREAK TO TERMINATION T1 0.0 1.5 150.0 77.5 277.2 80.6 OF POOL SWELL
TERMINATION OF POOL SWELL TO T2 1.5 5.0 273.4 80.6 281.0 89.8 ONSET OF CO
ONSET OF CO TO T ONSET OF CHUGGING 3 5.0 35.0 269.6 89.8 281.0 120.9
ONSET OF CHUGGING TO RPV T4 35.0 65.0 269.6 120.9 269.6 120.9
DEPRESSURIZATION
3-2.87
A
AA
max SECTION A-A
ELEVATION VIEW
PRESSURE DISTRIBUTION
8.0 max)
0.272
P max
0.520
TIME (sec)
PRESSURE TRANSIENT
1. PRESSURES SHOWN ARE APPLIED IN A DIRECTION NORMAL
TO DOWNCOMER'S SURFACE.
Figure 3-2.2-7
DOWNCOMER POOL SWELL IMPACT LOADS
NSP-74-103Revision 1 3-2.88
nutech ENGINEERS
-4
cn
cn
-U
0
vo' A
NVB
0.0 0.5 1.0 SECTION
DEVELOPED VIEW
KEY DIAGRAM
44
-4
U
0
0 11 I }
240 280 320 360 400 440 TIME (msec)
1. LOADS AT DISCRETE LOCATIONS ALONG DEFLECTOR OBTAINED BY LINEAR INTERPOLATION.
Figure 3-2.2-8
POOL SWELL IMPACT LOADS FOR VENT HEADER DEFLECTORS AT
SELECTED LOCATIONS
NSP-74-103 Revision 1 3-2.89
nutegb
VB
VENT LINE BAY
NON-VENT I BAY.
PLAN VIEW
IZ yjI
SECTION 3-B D 0 (TYPICAL AT ALL DOWNCOMERS)
O DESIGNATES BRACING MEMBER NUMBER
VIEW A-A
Figure 3-2.2-9
DOWNCOMER LONGITUDINAL BRACING AND TIE RODS
NSP-74-103 Revision 1 3-2.90
nutech ENGINEERS
VL VL INVB NVB
Case 1 Case 2
~VL ~VL vj vV t V
Case 3 Case 4
1. SEE TABLE 3-2.2-10 FOR IBA PRESSURE AMPLITUDES AND FREQUENCIES.
2. SEE TABLE 3-2.2-11 FOR DBA PRESSURE AMPLITUDES AND FREQUENCIES.
3. FOUR ADDITIONAL CASES WITH PRESSURES IN DOWNCOMERS OPPOSITE THOSE SHOWN ARE ALSO CONSIDERED.
Figure 3-2.2-10
IBA AND DBA CONDENSATION OSCILLATION DOWNCOMER DIFFERENTIAL
PRESSURE LOAD DISTRIBUTION
NSP-74-103 Revision 1 3-2.91
nutgq
STO L DRYWELL
F
KEY DIAGRAM
NORMALIZED POOL ACCELERATIONS
PROFILE POOL ACCELERATION (ft/sec2
A 50.0
B 100.0
C 150.0
D 200.0
E 250.0
F 300.0
1. POOL ACCELERATIONS DUE TO HARMONIC APPLICATION OF TORUS SHELL PRESSURES. SHOWN IN FIGURE 2-2.2-10 AT A SUPPRESSION CHAMBER FREQUENCY OF 24.14 HERTZ.
Figure 3-2.2-11
POOL ACCELERATION PROFILE
FOR DOMINANT SUPPRESSION CHAMBER FREQUENCY
AT MIDBAY LOCATION
NSP-74-103 Revision 1
nutech ENGINEERS
3-2.92
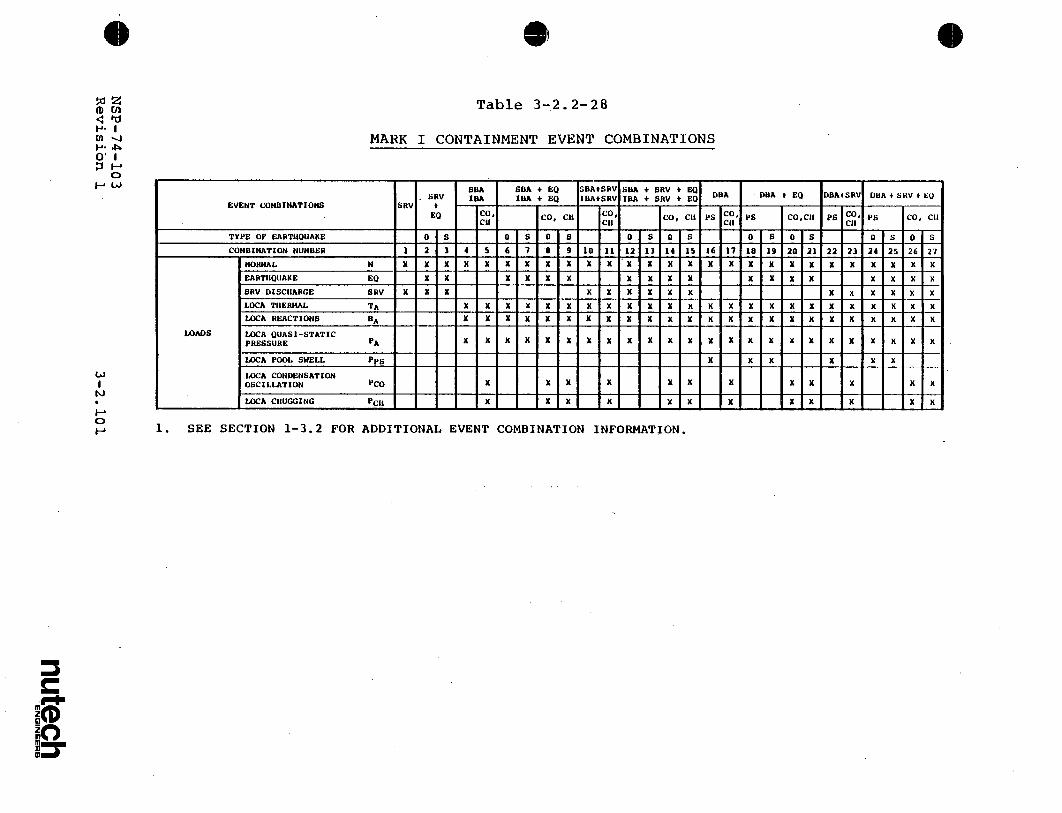
3-2.2.2 Load Combinations
The load categories and associated load cases for which
the vent system is evaluated are presented in
Section 3-2.2.1. The general NUREG-0661 criteria for
grouping the respective loads and load categories into
event combinations are discussed in Section 1-3.2
(Table 3-2.2-28).
The 27 general event combinations shown are expanded to
form a total of 69 specific vent system load
combinations for the Normal Operating, SBA, IBA, and DBA
events. The specific load combinations reflect a
greater level of detail than is contained in the general
event combinations, including distinction between SBA
and IBA, distinction between pre-chug and post-chug, and
consideration of multiple cases of particular
loadings. The total number of vent system load
combinations consists of 3 for the Normal Operating
event, 18 for the SBA event, 24 for the IBA event, and
24 for the DBA event. Several different service level
limits and corresponding sets of allowable stresses are
associated with these load combinations.
NSP-74-103 3-2.93 Revision 1
nutegh
Not all of the possible vent system load combinations
are evaluated since many are enveloped by others and do
not lead to controlling vent system stresses. The
enveloping load combinations are determined by examining
the possible vent system load combinations and comparing
the respective load cases and allowable stresses.
Table 3-2.2-29 shows the results of this examination.
Here each enveloping load combination is assigned a
number for ease of identification.
The enveloping load combinations are further reduced by
examining relative load magnitudes and individual load
characteristics to determine which load combinations
lead to controlling vent system stresses. The load
combinations which have been found to produce control
ling vent system stresses are separated into two
groups. The SBA II, IBA I, DBA I, DBA II, and DBA III
combinations are used to evaluate stresses in all vent
system components except those associated with the vent
line-SRV piping penetrations. The NOC I, SBA II, IBA I,
and DBA III combinations are use to evaluate stresses in
the vent line-SRV piping penetrations. An explanation
of the logic behind these controlling vent system load
combinations is presented in the following paragraphs.
Table 3-2.2-30 summarizes the controlling load combina
NSP-74-103 3-2.94 Revision 1
nutech ENGINEERS
tions and identifies which load combinations are
enveloped by each of the controlling combinations.
Many of the general event combinations (Table 3-2.2-28)
have the same allowable stresses and are enveloped by
others which contain the same or additional load cases.
There is no distinction between Service Level A and B
conditions for the vent system since the Service Level A
and B allowable stress values are the same.
Except for seismic loads, many pairs of load combina
tions contain identical load cases. One of the load
combinations in the pair contains OBE loads and has
Service Level A or B allowables, while the other
contains SSE loads with Service Level C allowables.
Examining the load magnitudes presented in Section
3-2.2.1 shows that both the OBE and SSE vertical accel
erations are small compared to gravity. As a result,
vent system stresses and support column reactions due to
vertical seismic loads are small compared to those
caused by other loads in the load combination. The
horizontal loads for OBE and SSE are less than 50% of
gravity and also result in small vent system stresses
compared to those caused by other loads in the load
combinations, except at the vent line-drywell penetra
NSP-74-103 3-2.95 Revision 1
nuteh ENGI ,ER
tions which provide horizontal support for the vent
system. The Service Level C primary stress allowables
for the load combinations containing SSE loads are 40%
to 80% higher than the Service Level B allowables for
the corresponding load combination containing OBE
loads. Therefore the controlling load combinations for
evaluation of all vent system components, except the
vent line-drywell penetration, are those containing OBE
loads and Service Level B allowables.
For the vent line-drywell penetration, evaluation of
both OBE and SSE combinations is necessary since seismic
loads are a large contributor to the total lateral load
acting on the vent system for which the penetrations
provide support.
Application of the above reasoning to the total number
of vent system load combinations yields a reduced number
of enveloping load combinations for each event. Table
3-2.2-29 shows the resulting vent system load combina
tions for the Normal Operating, SBA, IBA and DBA events,
along with the associated service level assignments.
For ease of identification, each load combination in
each event is assigned a number. The reduced number of
of one for the Normal Operating event, four for the SBA
event, five for the the IBA event, and six for the DBA
event. The load case designations for the loads which
make up the combinations are the same as those presented
in Section 3-2.2.1.
An examination of Table 3-2.2-29 shows that further
reductions are possible in the number of vent system
load combinations requiring evaluation. Any of the SBA
or IBA combinations envelop the NOC I combination since
they contain the same loadings as the NOC I combination
and, in addition, contain condensation oscillation or
chugging loads. The NOC I combination does, however,
result in local thermal effects in the vent line-SRV
piping penetration when the penetration assembly is cold
and the corresponding SRV piping is hot (during an SRV
discharge). The SBA and IBA combinations, therefore,
envelop the NOC I combination for all vent system
components except the vent line-SRV piping penetration.
The NOC I combination is evaluated for the vent line-SRV
piping penetration since it may result in controlling
penetration stresses. The effects of the NOC I
combination are also considered in the vent system
fatigue evaluation.
NSP-74-103 3-2.97 Revision 1
nutech ENGINEERS
The SBA II combination is the same as the IBA III combi
nation except for negligible differences in internal
pressure loads. Thus IBA III can be eliminated from
consideration. The SBA II combination envelops the
SBA I and IBA II combinations since the submerged
structure loads due to post-chug are more severe than
those due to pre-chug. It also follows, from the rea
soning presented earlier for OBE and SSE loads, that the
SBA II combination envelops the SBA III, SBA IV, IBA IV,
and IBA V combinations except when the effects of
lateral loads on the vent line-drywell penetration are
evaluated. Similarly, the SBA II combination envelops
the DBA V and DBA VI combinations; these combinations,
however, contain vent system discharge loads which are
somewhat larger than the pressure loads for the SBA II
combination. This effect is accounted for by substitut
ing the vent system discharge loads which occur during
the chugging phase of a DBA event for the SBA II
pressure loads when this load combination is evaluated.
Examination of Table 3-2.2-29 shows that the load
combinations which result in maximum lateral loads on
the vent line-drywell penetration are SBA IV, IBA V, and
DBA VI. All of these contain SSE loads and chugging
downcomer lateral loads which, when combined, result in
the maximum possible lateral load on the vent system.
NSP-74-103 3-2.98 Revision 1
nutech ENGINEERS
As previously discussed, the SBA II combination envelops
the above combinations except for seismic loads. The
effects of seismic loads are accounted for by substitut
ing SSE loads for OBE loads when evaluating the SBA II
combination.
The DBA II combination envelops the DBA IV combination
since the SRV discharge loads which occur late in the
DBA event have a negligible effect on the vent system.
The DBA II combination also has more restrictive allow
ables than the DBA IV combination.
The controlling vent system load combinations evaluated
in the remaining report sections can now be summarized.
The SBA II, IBA I, DBA I, DBA II, and DBA III combina
tions are evaluated for all vent system components
except those associated with the vent line-SRV piping
penetration. The DBA I and DBA II combinations do not
need to be examined when evaluating the vent line-SRV
piping penetration. This is because they do not contain
SRV discharge loads, which are a large contributor to
loads on the penetration. Thus, the NOC I, SBA II, IBA
I and DBA III combinations are evaluated for the vent
line-SRV piping penetration. As previously noted, SSE
loads and the vent system discharge loads which occur
during the chugging phase of the DBA event are conser
NSP-74-103 3-2.99 Revision 1
nutech ENGINEERS
vatively substituted for OBE loads and the SBA pressure
loads when evaluating the SBA II load combination.
To ensure that fatigue is not a concern for the vent
system over the life of the plant, the combined effects
of fatigue due to Normal Operating plus SBA events and
Normal Operating plus IBA events are evaluated.
Figures 3-2.2-12, 3-2.2-13 and 3-2.2-14 show the rela
tive sequencing and timing of each loading in the SBA,
IBA, and DBA events used in this evaluation. The
fatigue effects for Normal Operating plus DBA events are
enveloped by the Normal Operating plus SBA or IBA events
since the combined effects of SRV discharge loads and
other loads for the SBA and IBA events are more severe
than those for DBA. Table 3-2.2-29 summarizes
additional information used in the vent system fatigue
evaluation.
The load combinations and event sequencing described in
the preceding paragraphs envelop those which could
actually occur during a LOCA or SRV discharge event. An
evaluation of these load combinations results in a con
servative estimate of the vent system response and leads
to bounding values of vent system stresses and fatigue
effects.
NSP-74-103 3-2.100 Revision 1
nutech ENGINEERS
S
Table 3-2.2-28
MARK I CONTAINMENT EVENT COMBINATIONS0* &
0
H 0: F-
.
SBA SBA + EQ SBA+SRV SBA * SKV + EQ DA+E B+R SRV IBA IBA + 0 IA+SRV I A + SW + Eo DBA DBA + EQ DBASRV DBA+SRV EQ EVENT COMBINATIONS SRV +
C Co. CH CO* CO, CH PS * PS COCH PS Co* PS CO, CH EQ CO.1 coH CH TYPE OF EARTHQUAKE O S 0 S 0 8 0 S 0 S 0 S 0 S 0 S 0 S COMBINATION NUMBER 1 2 3 4 5 6 7 8 9 10 11 12 13 14 15 16 17 18 19 20 21 22 23 24 25 26 27
NORMAL N X X X X X X x X X X X X 1 X X X X X X 1 1 1 X X X 2
EARTHQUAKE EO x x x x x x x x x x x x x x x x x x SRV DISCHARGE SRV X X X X X X X X X X x X X X X LOCATHERMAL TA X X X X X X X X X X X X X 1 X X 1 X X 1 X X 2 LOCA REACTIONS RA X X X X x X x X X X X x X X X X 2 X X 2 X
LOADS LOCA QUASI-STATIC PRESSURE PA X X X X X X XX 21 XX XX X X X 2 2 2 21
LOCA POOL SNELL PPS 2 X X K X X
LOCA CONDENSATION OSCILLATION PCO K x x X X X X X x x X x
IDCA CHUGGING PCII X X 2 X K X X X X X X
1. SEE SECTION 1-3.2 FOR ADDITIONAL EVENT COMBINATION INFORMATION.
S
10 Er
Table 3-2.2-29
CONTROLLING VENT SYSTEM LOAD COMBINATIONS
OI
0
O0
CONDITION/EVENT
VOLUME 3 LOAD COMDINATION NUMBER
TABLE 3-2.2-24 LOAD COMBINATION NUMBER
rT I
HOC SBA
II1 1452b
2.T 3
T2,T 3
Ta-To
C
IDA
IV
1 5
2b
P 2 .P 3
T2,T I
I
14
DEAD WEIGHT
OBB
SEISMIC
SSE
PRESSUREt1 . 3
TEMPERATURE(M T T2 T
VENT SYSTEM DISCHARGE
POOL SWELL
CONDENSATION OSCILLATION
PRE-CHUG Ta-7c
CIIUGGING POST-CHUG
SRV DISCHARGE
PIPING REACTIONS 94-*
CONTAINMENT INTERACTION 40A
SERVICE LEVEL B
NUMBER OF EVENT OCCURRENCES1M 150 1
NUMBER OF SRV ACTUATIONSM 934 50 -
DBA
SECTION 3-2. 2.1 LOAD
DESIGNATION
*, 7b 74
C
> 50
-U
.
II III IV V I ) III IV V VI
14 14 Is 15 5 ( . a 27 27 27
8-
-
-
2b 2b 2b
P 2 .I3 2' 'P 3 1 3 *P 3 P2'P 3 P P4 P4
T T T T3T 12.T3 T 2TI T T T) T4 T4
toa------ -
484a
6b.6d 6f
la-7c 7&-7o Ta,7c
7a. db 7a,7b 7a, 7b
0a,B p S b a,6b 8a,b aa,ob
B B C C 40i7) *71 C C C C
25 * (9 I -I-- 1
I
NOTES TO TABLE 3-2.2-29
1. SEE FIGURES 3-2.2-1 THROUGH 3-2.2-3 FOR SBA, IBA, AND DBA INTERNAL PRESSURE VALUES.
2. THE RANGE OF NORMAL OPERATING INTERNAL PRESSURES IS -0.1 TO 1.0 psi AS SPECIFIED BY THE FSAR.
3. SEE FIGURES 3-2.2-4 THROUGH 3-2.2-6 FOR SBA, IBA, AND DBA TEMPERATURE VALUES.
4. THE 0 RANGE OF NORMAL OPERATING TEMPERATURES IS 650 TO 150 F AS SPECIFIED BY THE FSAR. SEE TABLE 3-2.2-2 FOR ADDITIONAL NORMAL OPERATING TEMPERATURES.
5. THE SRV DISCHARGE LOADS WHICH OCCUR DURING THIS PHASE OF THE DBA EVENT HAVE A NEGLIGIBLE EFFECT ON THE VENT SYSTEM.
6. EVALUATION OF PRIMARY-PLUS-SECONDARY STRESS RANGE OR FATIGUE IS NOT REQUIRED.
7. THE ALLOWABLE STRESS VALUE FOR LOCAL PRIMARY MEMBRANE STRESS AT PENETRATIONS MAY BE INCREASED BY 1.3.
8. THE NUMBER OF SEISMIC LOAD CYCLES USED FOR FATIGUE Is 1000.
9. THE VALUES SHOWN ARE CONSERVATIVE ESTIMATES OF THE NUMBER OF ACTUATIONS EXPECTED FOR A BWR 3 PLANT WITH A REACTOR SIZE OF 205.
NSP-74-103Revision 1 3-2.103
nutech ENGINEERS
Table 3-2.2-30
ENVELOPING LOGIC FOR CONTROLLING
VENT SYSTEM LOAD COMBINATIONS
(1) SSE LOADS AND DBA PRESSURIZATION AND THRUST LOADS ARE SUBSTITUTED FOR OBE INTERNAL PRESSURE LOADS WHEN EVALUATING THE SBA II LOAD COMBINATION.
1. THE SRV DISCHARGE LOADS WHICH OCCUR DURING THIS PHASE OF THE DBA EVENT ARE NEGLIGIBLE.
Figure 3-2.2-14
VENT SYSTEM DBA EVENT SEQUENCE
4-103 ion 1 3-2.107
nutech ENGINEERS
OADS
LOADS
O LOADS
(7a-7d) CHUGGING LOADS
SEE NOTE 1
A 1 4,e 4- eA 4
-4
The NUREG-0661 acceptance criteria on which the
Monticello vent system analysis is based are discussed
in Section 1-3.2. In general, the acceptance criteria
follow the rules contained in the ASME Code, Section
III, Division 1, including the Summer 1977 Addenda for
Class MC components and component supports (Reference
4). The corresponding service limit assignments,
jurisdictional boundaries, allowable stresses, and
fatigue requirements are consistent with those contained
in the applicable subsections of the ASME Code and the
"Mark I Containment Program Plant Unique Analysis
Application Guide" (PUAAG) (Reference 5). The following
paragraphs summarize the acceptance criteria used in the
analysis of the vent system.
The items evaluated in the analysis of the vent system
are the vent lines, the vent header, the downcomers, the
support columns and associated support elements, the
drywell shell near the vent line penetrations, the vent
header deflectors, the downcomer-vent header intersec
tion stiffener plates and bracing system, the vacuum
breaker penetration, the vent line-SRV piping pene
tration assembly, the vent header support collar-miter
NSP-74-103 3-2.108
Revision 1
nutech ENGINEERS
3a-1
assembly, and the vent line bellows assembly.
Figures 3-2.1-1 through 3-2.1-14 identify the specific
components associated with each of these items.
The vent lines, the vent header, the downcomers, the
support column ring plate away from the pin locations,
the drywell shell, the downcomer-vent header inter
section stiffener plates, the stiffener plates attached
to the vent line-vent header intersection, the vacuum
breaker nozzle, the vent header support collar-miter
assembly, and the vent line-SRV piping penetration
assembly are evaluated in accordance with the require
ments for Class MC components contained in Subsection NE
of the ASME Code. Fillet welds and partial penetration
welds joining these components or attaching other
structures to them are also examined in accordance with
the requirements for Class MC welds contained in Sub
section NE of the ASME Code.
The support columns, the downcomer bracing members, and
the associated connecting elements and welds are
evaluated in accordance with the requirements contained
in Subsection NF.of the ASME Code for Class MC component
supports. The vent header deflectors and associated
components and welds are also evaluated in accordance
NSP-74-103 3-2.109 Revision 1
nutech ENGINEERS
with the requirements for Class MC component supports
with allowable stresses corresponding to Service Level
D.
The NOC I, SBA II, IBA I, DBA I, and DBA II combinations
all have Service Level B limits while the DBA III
combination has Service Level C limits (Table 3-2.2-29).
Since these load combinations have somewhat different
maximum temperatures, the allowable stresses for the two
load combination groups with Service Level B and C
limits are conservatively determined at the highest
temperature for each load combination group.
The allowable stresses for all the major components of
the vent system, such as the vent line, the vent header
and the downcomers, are determined at the maximum DBA
temperature of 281 0 F. The allowable stresses for the
vent line-SRV piping nozzle and adjoining components are
determined at 375 0 F. Table 3-2.3-1 shows the allowable
stresses for the load combinations with Service Level B
and C limits.
Table 3-2.3-2 shows the allowable displacements and
associated number of cycles for the vent line bellows.
These values are taken from the FSAR, as permitted by
NSP-74-103 3-2.110
Revision 1
nutech ENGINEERS
NUREG-0661 in cases where the analysis technique used in
the evaluation is the same as that contained in the
plant's FSAR.
The acceptance criteria described in the preceding para
graphs result in conservative estimates of the existing
margins of safety and ensure that the original vent
system design margins are restored.
NSP-74-103
Revision 13-2.111
nutech ENGINEEIS
Table 3-2.3-1
ALLOWABLE STRESSES FOR VENT SYSTEM
COMPONENTS AND COMPONENT SUPPORTS
(1) MATERIAL ALLOWABLE STRESS (ksi)
ITEM MATERIAL PROPERTIES TYPES (2) (3) (ksi) SERVICE SERVICE
LEVEL B LEVEL C
S . 19.30 LOCAL PRIMARY 28.95 50.96 mc MEMBRANE DRYWELL SA-516 a - 22.68 PRIMARY + (4)
S . 33.97 SECONDARY STRESS 68.04 N/A y RANGE
PRIMARY MEMBRANE 19.30 33.97
VENT SA-516 me = 19.30 LOCAL PRIMARY 28.95 50.96 LINE GRADE 70 sml m 22.68 MEMBRANE
S = 33.97 PRIMARY + (4) SECONDARY STRESS 68.04 N/A
RANGE
PRIMARY MEMBRANE 19.30 33.97
VENT SA-516 5 mc m 19.30 LOCAL PRIMARY 28.95 50.96
HEADER GRADE 70 mi = 22.68 MEMBRANE
S = 33.97 PRIMARY + (4) SECONDARY STRESS 68.04 N/A
RANGE
COMPONENTS PRIMARY MEMBRANE 19.30 33.97
SA-516 S m - 19.30 LOCAL PRIMARY 28.95 50.96 DOWNCOMER GRADE 70 Sal - 22.68 MEMBRANE
S = 33.97 PRIMARY + (4) SECONDARY STRESS 68.04 N/A
RANGE
PRIMARY MEMBRANE 19.30 N/A
5UPOR S * 19.30 LOCAL PRIMARY 28.95 50.96 COLUMN SA-516 3c -2.8 MMRN 99 09
RING GRADE 70 m 2 PLATE S . 33.97 PRIMARY + (4)
Y SECONDARY STRESS 68.04 N/A RANGE
PRIMARY MEMBRANE 19.30 33.43
SRV PIPING S c 19.30 LOCAL PRIMARY PENETRATION SA-516 S . 22.30 MEMBRANE 28.95 50.15
INSERT GRADE 70 ml PLATE S . 33.43 PRIMARY + (4)
SECONDARY STRESS 66.90 N/A RANGE
BENDING 18.61 24.81
TENSILE 16.91 22.55
COMPONENT COLUMNS( 7 ) SA-333 S * 28.19 COMBINED 1.00 1.00 SUPPORTS GRADE 1 Y
COMPRESSIVE 13.49 17.99
INTERACTION 1.00 1.00
COLUMN S * 19.30 PRIMARY 15.01 26.42 WELDS RING PLATE SA-516 mc
TO VENT GRADE 70 S - 33.97 HEADER I SECONDARY 45.03 N/A
NSP-74-103 Revision 1 3-2.112
nutech ENGINEERS
NOTES TO TABLE 3-2.3-1
(1) MATERIAL PROPERTIES TAKEN AT MAXIMUM.EVENT TEMPERATURES.
(2) SERVICE LEVEL B.ALLOWABLES ARE USED WHEN EVALUATING NOC I, SBA II, IBA I, DBA I, AND DBA II LOAD COMBINATION RESULTS.
(3) SERVICE LEVEL C ALLOWABLES ARE USED WHEN EVALUATING THE DBA III LOAD COMBINATION RESULTS.
(4) THERMAL BENDING STRESSES ARE EXCLUDED WHEN EVALUATING PRIMARY-PLUS-SECONDARY STRESS RANGES.
(5) EVALUATION OF PRIMARY-PLUS-SECONDARY STRESS INTENSITY RANGE AND FATIGUE ARE NOT REQUIRED FOR LOAD COMBINATION DBA I.
(6) THE ALLOWABLE STRESSES FOR LOCAL PRIMARY MEMBRANE STRESSES AT PENETRATIONS ARE INCREASED-BY 1.3 WHEN EVALUATING LOAD COMBINATIONS DBA I AND DBA II.
(7) STRESS DUE TO THERMAL LOADS MAY BE EXCLUDED WHEN EVALUATING COMPONENT SUPPORTS.
NSP-74-103 Revision 1 3-2.113
nutech ENGINEERS
NSP-74-103 Revision 1
Table 3-2.3-2
ALLOWABLE DISPLACEMENTS AND CYCLES
FOR VENT LINE BELLOWS
ALLOWABLE TYEVALUE
COMPRESSION 0.875 in AXIAL
EXTENSION 0.375 in
MERIDIONAL ±0.625 in
LATERAL LONGITUDINAL *0.625 in
NUMBER OF CYCLES OF MAXIMUM 1000
DISPLACEMENTS
3-2.114 S
nuteph ENGI ER
3-2.4 Methods of Analysis
Section 3-2.2.1 presents the governing loads for which
the Monticello vent system is evaluated. Section
3-2.4.1 discusses the methodology used to evaluate the
vent system for the overall effects of all loads except
for those loads which exhibit asymmetric character
istics. The effects of asymmetric loads on the vent
system are evaluated using the methodology discussed in
Section 3-2.4-2. The methodology used to examine the
local effects at the penetrations and intersections of
the vent system major components is discussed in
Section 3-2.4.3.
Section 3-2.4.4 discusses the methodology used to
formulate results for the controlling load combinations,
examine fatigue effects, and evaluate the analysis
results for comparison with the applicable acceptance
limits.
NSP-74-103 3-2.115 Revision 1
nutech ENGINEERS
3-2.4.1 Analysis for Major Loads
The repetitive nature of the vent system geometry is
such that the vent system can be divided into 16 iden
tical segments which extend from midbay of the vent line
bay to midbay of the non-vent line bay (Figure 3-2.1-6).
The governing loads which act on the vent system, except
for seismic loads and a few chugging load cases, exhibit
symmetric or anti-symmetric characteristics (or both)
with respect to a 1/16 segment of the vent system. The
analysis of the vent system for the majority of the
governing loads is therefore performed for a typical
1/16 segment.
A beam model of a 1/16 segment of the vent system
(Figure 3-2.4-1) is used to obtain the response of the
vent system to all loads except those resulting in
asymmetric effects on the vent system. The model
includes the vent line, the vent header, the downcomers,
and the support columns. The model also includes the
vent header deflectors, the downcomer bracing system,
and the vacuum breaker.
The local stiffness effects at the penetrations and
intersections of the major vent system components
NSP-74-103 3-2.116
Revision 1
nutech . ENGINEERS
(Figures 3-2.1-7 through 3-2.1-12) are included by using
stiffness matrix elements of these penetrations and
intersections. A matrix element for the vent line-dry
well penetration, which connects the upper end of the
vent line to the transition segment, is developed using
the finite difference model of the penetration (Figure
3-2.4-2). A matrix element which connects the lower end
of the vent line to the beams on the centerline of the
vent header is developed using the finite element model
of the vent line-vent header intersection (Figure
3-2.4-3). Figure 3-2.4-4 shows a finite element model
used to develop a matrix element'for the vacuum breaker
penetration at the end cap of the vent line.
Finite element models of each downcomer-vent header
intersection, similar to the one shown in Figure
3-2.4-5, are used to develop matrix elements which
connect the beams on the centerline of the vent header
to the upper ends of the downcomers at the downcomer
miters. The length of the vent header segment in the
analytical models used for downcomer-vent header
intersection stiffness determination is increased to
ensure that vent header ovaling effects are properly
accounted for. Use of this modeling approach has been
verified using results from FSTF tests. Additional
NSP-74-103 3-2.117 Revision 1
nutech ENGINEERS
information on the analytical models used to evaluate
the penetrations and intersections of major vent system
components is contained in Section 3-2.4.3.
The 1/16 beam model contains 158 nodes, 153 beam
elements, and 7 matrix elements. The node spacing used
in the analytical model is refined to ensure adequate
distribution of mass and determination of component
frequencies and mode shapes and to facilitate accurate
application of loadings. The stiffness and mass proper
ties used in the model are based on the nominal dimen
sions and densities of the materials used to construct
the vent system. Small displacement linear-elastic
behavior is assumed throughout.
The boundary conditions used in the 1/16 beam model are
both physical and mathematical in nature. The physical
boundary conditions consist of the elastic restraints
provided at the attachments of the support columns. The
associated stiffnesses are developed using the
analytical model of the ring girder described in Volume
2 of this report. Additional physical boundary
conditions include the elastic restraints provided at
the attachment of the vent line to the drywell. The
associated vent line-drywell penetration stiffnesses are
NSP-74-103 3-2.118 Revision 1
nutech ENGINEERS
included as a stiffness matrix element, the development
of which is discussed in the preceding paragraphs. The
mathematical boundary conditions consist of either
symmetry, anti-symmetry, or a combination of both at the
midbay planes, depending on the characteristics of the
load being evaluated.
Additional mass is lumped along the length of the sub
merged portions of the downcomers, support columns, and
bracings to account for the effective mass of water
which acts with these components during dynamic load
ings. The total mass of water added is equal to the
mass of water displaced by each of these components.
For all but the pool swell and condensation oscillation
dynamic loadings, the mass of water inside the submerged
portion of the downcomers is included. The downcomers
are assumed to contain air or steam (or both) during
pool swell and condensation oscillation. The mass of
this mixture is considered negligible. An additional
mass of 937 pounds to account for the weight of the
drywell/wetwell vacuum breaker is lumped at the center
of gravity of the vacuum breaker.
A frequency analysis is performed using the 1/16 beam
model of the vent system for the case with water inside
NSP-74-103 3-2.119 Revision 1
nutech ENGINEERS
the downcomers and for the case with no water inside the
downcomers. All structural modes in the range of 0 to
80 hertz and 0 to 90 hertz, respectively, are extracted
for these cases. Tables 3-2.4-1 and 3-2.4-2 show the
resulting frequencies and mass participation factors.
A dynamic analysis using the 1/16 beam model of the vent
system is performed for the pool swell loads and con
densation oscillation loads specified in Section
3-2.2-1. The analysis consists of a transient analysis
for pool swell loads and a harmonic analysis for conden
sation oscillation loads. The modal superposition tech
nique with 2% damping is utilized in both the transient
and harmonic analyses. The pool swell and condensation
oscillation load frequencies are enveloped by including
vent system frequencies to 90 hertz and 60 hertz,
respectively.
The remaining vent system load cases specified in Sec
tion 3-2.2.1 involve either static loads or dynamic
loads, which are evaluated using an equivalent static
approach. For the latter, conservative dynamic amplifi
cation factors are developed and applied to the maximum
spatial distributions of the individual dynamic
loadings.
NSP-74-103 3-2.120
Revision 1
nutech ENGINEERS
The effects of asymmetric loads are evaluated by apply
ing loads generated using the 1800 beam model discussed
in Section 3-2.4.2 to the 1/16 beam model. Displace
ments taken from the 1800 beam model results are imposed
at the midcylinder boundary planes of the 1/16 beam
model. Inertia forces due to horizontal seismic loads
and concentrated forces due to asymmetric chugging
loads, both of which are taken from the 1800 beam model
results, are applied to the portion of the 1/16 beam
model which lies between the midcylinder boundary
planes. Additional information related to the vent
system analysis. for asymmetric loads is provided in
Section 3-2..4.2.
The 1/16 beam model is also used to generate loads for
the evaluation of stresses in the major vent system com
ponent penetrations and intersections. Beam end loads,
distributed loads, reaction loads, and inertia loads are
developed and applied to the analytical models of the
vent system penetrations and intersections (Figures
3-2.4-2 through 3-2.4-4). Additional information
related to the vent system penetrations and intersection
stress evaluation is provided in Section 3-2.4.3.
NSP-74-103 3-2.121 Revision 1
nutech ENGINEERS
The specific treatment of each load in the load catego
ries identified in Section 3-2.2.1 is discussed in the
following paragraphs.
1. Dead Weight Loads
a. Dead Weight of Steel: A static analysis is
performed for a unit vertical acceleration
applied to the weight of vent system steel.
2. Seismic Loads
a. OBE Loads: A static analysis is performed for
a 0.153g vertical seismic acceleration applied
to the weight of steel included in the 1/16
beam model. An additional static analysis is
performed for the boundary displacements and
associated inertia loads generated for a 0.23g
seismic acceleration applied in each horizon
tal direction using the 1800 beam model. The
results of the three earthquake directions are
combined using SRSS.
b. SSE Loads: The procedure used to evaluate the
0.307g vertical and 0.46g horizontal SSE
seismic accelerations is the same as that dis
cussed for OBE seismic loads in Load Case 2a.
NSP-74-103 3-2.122 Revision 1
nutech ENGINEERS
3. Containment Pressure and Temperature Loads
a. Normal Operating Internal Pressure Loads: A
static analysis is performed for a 1.0 psi
internal pressure applied as concentrated
forces to the unreacted areas of the vent
system.
b. LOCA Internal Pressure Loads: A static anal
ysis is performed for the SBA and IBA net
internal pressures applied as concentrated
forces to the unreacted areas of the major
components of the vent system. Figures
3-2.2-1 through 3-2.2-3 show these pressures.
The effects of DBA internal pressure loads are
included in the pressurization and thrust
loads discussed in Load Case 4a.
Concentrated forces are also. applied at the
vent. line-drywell penetration location using
the SBA, IBA, and DBA drywell internal
pressures. These forces account for the
pressures acting on the vent line-drywell
penetration unreacted area and for the
movement of the drywell due to internal
pressure. The movement of the suppression
NSP-74-103. 3-2.123 Revision 1
nutech ENGINEERS
chamber due to internal pressure, although
small in magnitude, is also applied.
c. Normal Operating Temperature Loads: A static
analysis is performed for the case with the
containment at an ambient temperature of
77.5 0F and with a temperature of 375 0F
uniformly applied to the wetwell SRV piping.
The methodology used to evaluate local thermal
effects in the vent line-SRV piping penetra
tion is discussed in Section 3-2.4-.3.
An additional static analysis is performed for
the maximum normal operating temperature
(Table 3-2.2-2). This temperature is uniform
ly applied to the portion of the vent system
inside the suppression chamber. Corresponding
temperatures of 77.5 0F for the drywell and
vent system components outside the suppression
chamber, 168 0 F for the suppression chamber,
and 375 0 F for the SRV piping are also applied
in this analysis.
NSP-74-103 3-2.124 Revision 1
nutech ENSINEERS
d. LOCA Temperature Loads: A static analysis is
performed for the SBA, IBA, and DBA tempera
tures, which are uniformly applied to the
major components and external components of
the vent system. Figures 3-2.2-4 through
3-2.2-6 show these temperatures. A tempera
ture of 375 0 F is also uniformly applied to the
SRV piping for those controlling load combina
tions which include SRV discharge loads.
Reaction loads applied to the vent line-SRV
piping penetration are calculated on the basis
of the methods described in Volume 5.
Concentrated forces are applied at the vent
line-drywell penetration and at the support
column attachment points to the suppression
chamber to account for the thermal expansion
of the drywell and suppression chamber during
the SBA, IBA, and DBA events. The greater of
the temperatures specified in Figure 3-2.2-4
and Table 3-2.2-2 is used in the analysis for
SBA temperatures.
NSP-74-103 3-2.125 Revision 1
nutech ENGINEERS
4. Vent System Discharge Loads
a. DBA Pressurization and Thrust Loads: A dyna
mic analysis is performed for the DBA pressur
ization and thrust loads (Table 3-2.2-3).
5. Pool Swell Loads
a. Vent System Impact and Drag Loads: A dynamic
analysis is performed for the vent line,
downcomer, and vent header deflector pool
swell impact loads (Table 3-2.2-4, Figures
3-2.2-7 and 3-2.2-8).
b. Impact and Drag Loads on Other Structures: A
dynamic analysis is performed for pool swell
impact loads on the vacuum breaker and on pool
swell drag loads on the downcomer tie rods and
the downcomer longitudinal members. Tables
3-2.2-5 and 3-2.2-6 show these loads.
Response spectra are developed at the vent
line-SRV piping penetration node for input
into analysis performed in Volume 5.
c. Froth Impingement and Fallback Loads: A dyna
mic analysis is performed for froth impinge
NSP-74-103 3-2.126 Revision 1
nutech ENGIES
ment and fallback loads on the vacuum breaker.
These loads are shown in Table 3-2.2-5.
d. Pool Fallback Loads: A dynamic analysis is
performed for pool fallback loads on the down
comer longitudinal bracing members. Table
3-2.2-6 shows these loads. Response spectra
are developed at the vent line-SRV piping
penetration node for input into analysis
performed in Volume 5.
e. LOCA Water Clearing Submerged Structure Loads:
An equivalent static analysis is performed for
LOCA water clearing submerged structure loads
on the vent system support columns. Table
3-2.2-7 shows these loads. The values of the
loads include dynamic amplification factors
which are computed on the basis of methods
described in Reference 7 and through use of
the dominant frequency of the support columns.
The dominant frequencies are derived from
harmonic analyses of these components. Figure
3-2.4-6 shows the results of these harmonic
analyses.
NSP-74-103 3-2.127 Revision 1
nutech ENGINEERS
f. LOCA Air Clearing Submerged Structure Loads:
An equivalent static analysis is performed for
LOCA air clearing submerged structure loads on
the downcomers, the downcomer tie rods, the
downcomer longitudinal bracing members, and
the support columns. Tables 3-2.2-7, 3-2.2-8,
and 3-2.2-9 show these loads. The values of
the loads include dynamic amplification
factors computed using the dominant frequen
cies of the affected structures. The dominant
frequencies are derived from harmonic analyses
of these components (Figures 3-2.4-6 through
3-2.4-9). The LOCA air clearing submerged
structure loads acting on the submerged
portion of. the SRV piping are also applied
using the procedures described in Volume 5.
6. Condensation Oscillation Loads
a. IBA Condensation Oscillation Downcomer Loads:
A dynamic analysis is performed for the IBA
condensation oscillation downcomer loads
(Table 3-2.2-10). The dominant downcomer
frequency is determined from the harmonic
results (Figure 3-2.4-10). Figure 3-2.4-6
indicates that the dominant downcomer
frequency occurs in the frequency range of the
NSP-74-103 3-2.128 Revision 1
nutech ENGINEERS
second condensation oscillation downcomer load
harmonic. The first and third condensation
oscillation downcomer load harmonics are
therefore applied at frequencies equal to 0.5
and 1.5 times the value of the dominant down
comer frequency.
b. DBA Condensation Oscillation Loads: The pro
cedure used to evaluate the DBA condensation
oscillation downcomer loads (Table 3-2.2-11)
is the same as that discussed for IBA
condensation oscillation downcomer loads in
Load Case 6a.
c. IBA Condensation Oscillation Vent System
Pressures: A dynamic analysis is performed
for IBA condensation oscillation vent system
pressures on the vent line and vent header.
Table 3-2.2-12 shows these loads. The
dominant vent line and vent header frequencies
are determined from the harmonic analysis
results (Figure 3-2.4-11). An additional
static analysis is performed for a 1.55 psi
NSP-74-103 3-2.129 Revision 1
nutech ENGINEERS
internal pressure applied as concentrated
forces to the unreacted areas of the vent
system.
d. DBA Condensation Oscillation Vent System
Pressure Loads: The procedure used to evalu
ate the DBA condensation oscillation vent
system pressure loads (Table 3-2.2-12) is the
same as that discussed for IBA condensation
oscillation vent system pressure loads in Load
Case.6c.
e. IBA Condensation Oscillation Submerged Struc
ture Loads: As previously discussed, pre-chug
loads described in Load Case 7c are specified
in lieu of IBA condensaton oscillation loads.
f. DBA Condensation Oscillation Submerged Struc
ture Loads: An equivalent static analysis is
performed for the DBA condensation oscillation
submerged structure loads on the downcomer tie
rods, - the downcomer longitudinal bracing
members, and the support columns. Tables
3-2.2-13 and 3-2.2-14 show these loads, which
include dynamic amplification factors computed
NSP-74-103 3-2.130
Revision 1
nutech ENGINEERS
using the methodology described for LOCA water
and air clearing submerged structure loads in
Load Cases 5e and 5f. The DBA condensation
oscillation submerged structure loads acting
on the submerged portion of the SRV piping are
also applied, following the procedures
described in Volume 5.
7. Chugging Loads
a. Chugging Downcomer Lateral Loads: A harmonic
analysis of the downcomers is performed to
determine the dominant downcomer frequency for
use in calculating the maximum chugging load
magnitude. Figure 3-2.4-12 shows the harmonic
analysis results. Table 3-2.2-15 shows the
resulting chugging load magnitudes. A static
analysis using the 1/16 beam model is per
formed for chugging downcomer lateral Load
Cases 8 through 22. Tables 3-2.2-17 and
3-2.2-18 show these load cases. An additional
static analysis using the 1800 beam model is
performed for boundary displacements and
associated concentrated forces generated for
Load Cases 1 through 7.
NSP-74-103 3-2.131 Revision 1
nutech ENGINEERS
A static analysis is also performed for the
maximum chugging load (Table 3-2.2-19) applied
to a single downcomer in the in-plane and
out-of-plane directions. The results of this
analysis are used in evaluating fatigue.
b. Chugging Vent System Pressures: An equivalent
static analysis is performed for the chugging
vent system pressures applied to the unreacted
areas of the vent system. Table 3-2.2-20
shows these loads. The dominant vent line and
vent header frequencies are determined from
the harmonic analysis results (Figure.
3-2.4-13).
c. Pre-Chug Submerged Structure Loads: An equi
valent static analysis is performed for the
pre-chug submerged structure loads on the
downcomer tie rods, the downcomer longitudinal
bracing members, and the support columns.
Tables 3-2.2-21 and 3-2.2-22 show these loads.
The loads include dynamic amplification
factors which are computed using the method
ology described for submerged structure LOCA
air clearing loads in Load Case 5f. The pre
NSP-74-103 3-2.132
Revision 1
nutech ENGINEERS
chug submerged structure loads acting on the
submerged portion of the SRV piping are also
applied using the procedures described in
Volume 5.
d. Post-Chug Submerged Structure Loads: The
procedure used to evaluate the post-chug sub
merged structure loads on the downcomer tie
rods, the downcomer longitudinal bracing
members, and the support columns is the same
as that discussed for pre-chug submerged
structure loads in Load Case 6c. Tables
3-2.2-23 and 3-2.2-24 show these loads.
8. Safe
a.
ty Relief Valve Discharge Loads
SRV Discharge Water Clearing Submerged Struc
ture Loads: An equivalent static analysis is
performed for SRV discharge water clearing
submerged structure loads on the vent system
support columns. Table 3-2.2-25 shows these
loads. The values of the loads include
dynamic amplification factors which are.
calculated on the basis of methods described
in Reference 7 and use of the dominant
frequency of the support columns.
NSP-74-103 Revision 1
nutech ENGINEERS
3-2.133
b. SRV Discharge Air Clearing Submerged Structure
Loads: An equivalent static analysis is per
formed for SRV discharge drag loads on the
downcomers, the downcomer tie rods, the
downcomer longitudinal bracing members, and
the support columns. Tables 3-2.2-25,
3-2.2-26, and 3-2.2-27 show these loads. The
loads include a dynamic load factor of 3.0, as
discussed in Section 1-4.2.4. A dynamic load
factor of 1.1 is used for the downcomer loads
applied in the out-of-plane direction, since
the out-of-plane downcomer frequency is well
above the maximum SRV discharge load frequency
(Figure 3-2.4-7). The SRV discharge submerged
structure loads acting on the submerged por
tion of the SRV piping are also applied using
the procedures described in Volume 5.
9. Piping Reaction Loads
a. At the vent line-SRV piping penetration, the
reaction loads are developed using the pro
cedures described in Volume 5. These reaction
NSP-74-103 3-2.134 Revision 1
nutech ENGIER
loads are applied to the local vent line-SRV
piping finite element model described in
Section 3-2.4.3.
10. Containment Interaction Loads
a. Containment Structure Motions: The motions of
the drywell and the suppression chamber due to
internal pressure and thermal expansion are
applied to the 1/16 beam model. The motions
caused by loads in other load categories
acting on the drywell and suppression chamber
have been evaluated and found to have a negli
gible effect on the vent system.
The methodology described in the preceding paragraphs
results in a conservative evaluation of the. vent system
response and associated stresses for the governing
loads.
NSP-74-103 3-2.135 Revision 1
nutech ENGINEERS
Table 3-2.4-1
VENT SYSTEM FREQUENCY ANALYSIS RESULTS
WITH WATER INSIDE DOWNCOMERS
MODE FREQUENCY MODAL WEIGHT (lb)(1)
NUMBER (Hz) x
1 11.11.. 5__9__5_ 1._ _ 1107
2
3
4
5
6
7
8
9
10
11
12
13
14
15
16
17
18
19
20
21
22
23 24
25
26
27
28
29
30
16.52
21.95
22.01
22.40
25.45
26.54
30.51
34.57
36.58
36.83
41.42
41.53
42.63
43.45 49.51
54.50
54.66
56.15
57.77
57.98
58.10
58.31
60.47
61.06
62.07
63.16
66.91 73.21
81.98
80.31
0.26
0.00
0.02
162.27
0.25
23.94
144.44
1091.34
1.21
1.27
8.76
49.81
3.05
1385.42
1765,92.
1167.13
1370.89
16.39
28.15
94.67
.57.35
10. 88
304.08
893.82
3277.43
1257.80
230.10
142.70
9.60
13.28
0.01
809.29
56.58
9830.53
760.87
2.68
91.57
0.01
61.56
76.52
3232.26
113.90
0.18
207.68
97.80
80.06
1.45
1.52
0.47
6.14
136.57
1.00
86.42
173.99
11.44
1093.13
5.06
1260.05
1149.95
0.22
0.08
64.45
100.19
561.29
122.36
3.22
13.04
33.50
923.97
0.01
7347.27
42.10
73.70
515.52
22.66
0.53
38.39
15.09
181.29
17.47
21.19
194.13
322.36
315.69
721.64
1.88
(1) SEE FIGURE 3-2.4-1 FOR COORDINATE SYSTEM DIRECTIONS.
NSP-74-103 Revision 1
nutech ENGINEERS
3-2.136
I
I
Table 3-2.4-2
VENT SYSTEM FREQUENCY ANALYSIS RESULTS
WITHOUT WATER INSIDE DOWNCOMER
MODE FREQUENCY MODAL WEIGHT (1b) NUMBER (Hz)
x Y z
L _13m08 415-46 LBT 7833_58
2 19.79
3 21.95
4 22.01
5 22.40
6 26.54
7 30.25 8 30.81
9 34.57
10 36.59
11 36.83 12 41.43
13 41.66
14 42.76
15 43.94
16 49.62
17 55.46 18 56.22
19 57.02
20 57.83 21 58.06 22 58.11 23 60.43
24 61.38 25 62.03
26 63.66 27 69.19 28 73.76
29 74.77 30 89.70
56.40
0.09 0.00
0.38
1.93
97.50
15.29
142.86
1025.70
1.15
0.01 3.15
0.96
3.37. 1258.92
195.96
379.36 541.79
11.07 3.01
121.93
1.40
30.90 1.76
3.75 1336.30
312.48
4816.39
45.41
28.42
12.20
0.01
804.51
9864.80
266.48
520.98
2.43
87.80
0.05
36.80 92.74
3233.97
172.66
0.03 318.69
3.36 3.35
1.77
0.01 0.15
133.03
0.02 177.19
7.43
346.03
609.98
269.88
1.49
(1) SEE FIGURE 3-2.4-1 FOR COORDINATE DIRECTIONS.
NSP-74-103 Revision 1
996.58
1104.73
0.22
0.29 107.16
556.58
86.17
116.78
4.10
9.10 5.18
887.51
23.02 7486.08
128.62
10.89 103.93
4.17
0.81
0.00 4.86
0.57 60.90 98.21
966.65 15.20
403.68 388.62
0.10
3-2.137
nutech ENGINEERS
VENT LINE
[KIVB
VACUUM- " BREAKER
VENT HEADER DEFLECTOR
VENT SYSTEM 1/16
[K] VH/DC
DOWNCOMER TIE ROD (TYP)
DOWNCOMER CROSS BRACING (TYP)
[K)Sc
Figure 3-2.4-1
SEGMENT BEAM MODEL -- ISOMETRIC VIEW
NSP-74-103 Revision 1
nutech ENGINEERS
3-2.138 0a
z
VENT LINE-DRYWELL PENETRATION
Figure 3-2.4-2
VENT LINE-DRYWELL PENETRATION AXISYMMETRIC
FINITE DIFFERENCE MODEL - VIEW OF TYPICAL MERIDIAN
NSP-74-103 Revision 1 3-2.139
nutech ENGINEERS
(
[
Figure 3-2.4-3
VENT LINE-VENT HEADER INTERSECTION
FINITE ELEMENT MODEL
NSP-74-103 Revision 1 3-2.140
nutech ENGINEEIS
x
Y
Figure 3-2.4-4
VACUUM BREAKER PENETRATION
FINITE ELEMENT MODEL
NSP-74-103 Revision 1 3-1.141
nutech ENGINEERS
Figure 3-2.4-5
DOWNCOMER-VENT HEADER INTERSECTION
FINITE ELEMENT MODEL - ISOMETRIC VIEW
NSP-74-103 Revision 1 3-2.142
nutech ENGINEERS
IN-PLANE, for OUT-OF-PLANE, fcr
E-4
= 21.97 Hz
= 36.62 Hz
0 10 20 30 - 40 50 60
FREQUENCY (HZ)
1. RESULTS SHOWN ARE OBTAINED BY APPLYING UNIT DRAG PRESSURES TO SUBMERGED PORTION OF COLUMNS IN THE IN-PLANE AND OUT-OF-PLANE DIRECTIONS RELATIVE TO THE MITER JOINT.
2. RESULTS SHOWN ARE TYPICAL FOR INSIDE AND OUTSIDE COLUMNS.
Figure 3-2.4-6
HARMONIC ANALYSIS RESULTS FOR SUPPORT COLUMN SUBMERGED STRUCTURE LOAD FREQUENCY DETERMINATION
NSP-74-103 Revision 1 3-2.143
nutech ENGINEERS
IN-PLANE, fcr OUT-OF-PLANE,
for
-4
= 11.11 Hz
= 54.69 Hz
0 10 20 30 40 50 60
FREQUENCY (Hz)
1. RESULTS SHOWN ARE OBTAINED BY APPLYING UNIT DRAG PRESSURES TO SUBMERGED PORTION OF DOWNCOMERS IN THE IN-PLANE AND OUT-OF-PLANE DIRECTIONS.
2. FREQUENCIES ARE DETERMINED WITH WATER INSIDE SUBMERGED PORTION OF DOWNCOMERS.
3. RESULTS SHOWN ARE TYPICAL FOR ALL DOWNCOMERS.
4. THE AMPLITUDE SCALE SHOWN APPLIES TO THE IN-PLANE PLOT. FOR PRESENTATION PURPOSES, THE OUT-OF-PLANE AMPLITUDES HAVE BEEN MULTIPLIED BY 250.
Figure 3-2.4-7
HARMONIC ANALYSIS RESULTS FOR DOWNCOMER SUBMERGED STRUCTURE
LOAD FREQUENCY DETERMINATION
NSP-74-103 Revision 1 3-2.144 0
nutech ENGINEERS
LONGITUDINAL, f . cr VERTICAL, for
w Q
E-4 H
PA
= 58.11 Hz
= 57.86 Hz
0 10 20 30 40 50 60
FREQUENCY (HZ)
1. RESULTS SHOWN ARE OBTAINED BY APPLYING UNIT DRAG PRESSURES TO SUBMERGED TIE RODS.
2. RESULTS SHOWN ARE TYPICAL FOR ALL TIE RODS.
3. LONGITUDINAL DIRECTION IS PARALLEL TO THE VENT HEADER AXIS.
Figure 3-2.4-8
HARMONIC ANALYSIS RESULTS FOR TIE RODS
SUBMERGED STRUCTURE LOAD FREQUENCY DETERMINATION
NSP-74-103 Revision 1 3-2.145
nutech ENGINEERS
VERTICAL, f = 59.81'Hz
TRANSVERSE, fcr = 61.04 Hz
10 20 30 40 50 60
FREQUENCY(HZ)
1. RESULTS SHOWN ARE OBTAINED BY APPLYING UNIT DRAG PRESSURES TO SUBMERGED LONGITUDINAL BRACING.
2. RESULTS SHOWN ARE FOR THE LONGEST LONGITUDINAL BRACING.
Figure 3-2.4-9
HARMONIC ANALYSIS RESULTS FOR LONGITUDINAL BRACING
SUBMERGED STRUCTURE LOAD FREQUENCY DETERMINATION
NSP-74-103 Revision 1 3-2.146
E-4 14
0
0
nutech ENGINEERlS
DOWNCOMER, f = 13.2 Hz cr
0 10 20 30 40 50 60
FREQUENCY (Hz)
1. RESULTS SHOWN ARE OBTAINED BY APPLYING UNIT INTERNAL
PRESSURES TO ONE DOWNCOMER IN A DOWNCOMER PAIR.
2. FREQUENCIES ARE DETERMINED WITHOUT WATER INSIDE SUBMERGED
PORTION OF THE DOWNCOMERS.
3. RESULTS SHOWN ARE TYPICAL FOR ALL DOWNCOMERS.
FIGURE 3-2.4-10
HARMONIC ANALYSIS RESULTS FOR CONDENSATION OSCILLATION
DOWNCOMER LOAD FREQUENCY DETERMINATION
NSP-74-103 Revision 1 3-2.147
nutech
VENT LINE, f cr VENT HEADER, f
cr
= 43.7 Hz
= 42.7 Hz
FREQUENCY (Hz)
1. RESULTS SHOWN ARE OBTAINED BY APPLYING 2.5 psi INTERNAL PRESSURES TO UNREACTED AREAS OF VENT SYSTEM.
Figure 3-2.4-11
HARMONIC ANALYSIS RESULTS FOR CONDENSATION OSCILLATION
VENT SYSTEM PRESSURE LOAD FREQUENCY DETERMINATION
NSP-74-103 Revision 1 3-2.148
S
E-4
0
S
nutech ENGINEERS
DOWNCOMER, fcr = 11.1Hz
0 10 20 30 40 50 60
FREQUENCY (HZ)
1. RESULTS SHOWN ARE OBTAINED BY APPLYING UNIT FORCES TO DOWNCOMER ENDS IN THE PLANE OF THE DOWNCOMERS IN THE SAME DIRECTION.
2. FREQUENCIES ARE DETERMINED WITH WATER INSIDE SUBMERGED PORTION OF THE DOWNCOMER.
3. RESULTS SHOWN ARE TYPICAL FOR ALL DOWNCOMERS.
Figure 3-2.4-12
HARMONIC ANALYSIS RESULTS FOR CHUGGING DOWNCOMER LATERAL
LOAD FREQUENCY DETERMINATION
NSP-74-103 Revision 1
nutech ENGINEERS
E-
3-2.149
--r-
f
ja
VENT LINE, f cr VENT HEADER, fcr
= 43.21 Hz
= 42.73 Hz
FREQUENCY (Hz)
1. RESULTS SHOWN ARE OBTAINED BY APPLYING 2.5 AND 3.0
psi INTERNAL PRESSURES TO UNREACTED AREAS OF VENT
LINE AND VENT HEADER, RESPECTIVELY.
Figure 3-2.4-13
HARMONIC ANALYSIS RESULTS FOR CHUGGING VENT SYSTEM
PRESSURE LOAD FREQUENCY DETERMINATION
NSP-74-10 3
Revision 1 3-2.150
0
W.
S
nutech ENGINEERS
3-2.4.2 Analysis for Asymmetric Loads
The asymmetric loads acting on the vent system are
evaluated by decomposing each of the asymmetric loadings
into symmetric or asymmetric components, or both, with
respect to a 1800 segment of the vent system. The
analysis of the vent system for asymmetric loads is per
formed for a typical 180* segment of the vent system cut
along the plane of a principal azimuth.
A beam model of a .180* segment of the vent system
(Figure 3-2.4-14) is used to obtain the response of the
vent system to asymmetric loads. The model includes the
vent line, vent header, downcomers, downcomer tie rods,
downcomer longitudinal bracing members, and support
columns.
Many of the modeling techniques used in the 1800. beam
model, such as those used for local mass and stiffness
determination, are the same as those utilized in the
1/16 beam model of the vent system discussed in
Section 3-2.4.1. The local stiffness effects at the
vent line-drywell penetrations and vent line-vent header
intersections are included using stiffness matrix
elements for these penetrations and intersections. The
NSP-74-103 3-2.151 Revision 1
nutech ENGINEERS
local stiffness effects at the attachments of the
support columns to the support ring girder are included
in the model.
The 180* beam model contains 286 nodes, 382 beams, and
16 matrix elements. The model is less refined than the
1/16 beam model of the vent system and is used to
characterize the overall response of the vent system to
asymmetric loadings. It includes those components and
local stiffnesses which have an effect on the overall
response of the vent system. The stiffness and mass
properties used in the model are based on the nominal
dimensions and densities of the materials used to con
struct the vent system. Small displacement linear
elastic behavior is assumed throughout.
The boundary conditions used in the 1800 beam model are
both physical and mathematical in nature. The physical
boundary conditions used in the model are similar to
those used in the 1/16 beam model of the vent system.
The mathematical boundary conditions used in the model
consist of either symmetry, anti-symmetry, or a combi
nation of both at the O and 1800 planes. The specific
boundary condition used depends on the characteristics
of the load being evaluated.
NSP-74-103 3-2.152 Revision 1
nutech ENGINEERS
Additional mass is lumped along the length of the sub
merged portion of the downcomers and support columns in
a manner similar to that used in the 1/16 beam model.
The mass of water inside the submerged portion of the
downcomers is also included. An additional mass of 937
lbs is lumped at the center of gravity of the drywell/
wetwell vacuum breaker to account for its weight. The
masses of other vent system components are also lumped
at the appropriate locations in the model.
The asymmetric loads which act on the vent system are
horizontal seismic loads and asymmetric chugging loads,
as specified in Section 3-2.2.1. An equivalent static
analysis is performed for each of the loads using the
1800 beam model.
The 1800 beam model analysis results are used to gener
ate loads for use in the 1/16 beam model analysis. This
allows evaluation of the effects of asymmetric loads on
the component parts of the vent system not included in
the 1800 beam model. Beam stresses in the vent line and
vent header are examined for each asymmetric loading to
determine which 1/16 segment or segments of the 1800
beam model produce the maximum response. The forces at
the midcylinder planes of the controlling 1/16 segments
NSP-74-103 3-2.153 Revision 1
nutech ENGINEERS
are imposed on the corresponding midcylinder boundary
planes of the 1/16 beam model. The inertia forces and
concentrated forces acting on the 1800 beam model
between the midcylinder boundary planes are also applied
to the 1/16 beam model at the appropriate node
locations.
The magnitudes and characteristics of governing asym
metric loads on the vent system are presented and
discussed in Section 3-2.2.1. The overall effects of
asymmetric loads on the vent system are evaluated using
the 1800 beam model and the general analysis techniques
discussed in the preceding paragraphs. The specific
treatment of each load which results in asymmetric loads
on the vent system is discussed in the following
paragraphs.
2. Seismic Loads
a. OBE Loads: A static analysis is performed for
a 0.23g horizontal seismic acceleration
applied to the weight of steel and water
included in the 1800 beam model. Seismic
loads are applied in the direction of both
principal azimuths.
NSP-74-103 3-2.154 Revision 1
nutech ENGINEERS
b. SSE Loads: The procedure used to evaluate
0.46g horizontal SSE accelerationts is the same
as that discussed for OBE loads in Load Case
2a.
7. Chugging Loads
a. Chugging Downcomer Lateral Loads:. A static
analysis is performed for chugging downcomer
lateral Load Cases 1 through 7 (Table
3-2.2-17).
Use of the methodology described in the preceding
paragraphs results in a conservative evaluation of vent
system response to the asymmetric loads defined in
NUREG-0661.
NSP-74-103 Revision 1
3-2.155
nutech ENGINEERB
Y Ow Z
(KIDW 2
(TYCMEP)YP
BRACING/ T(TYP) ,
B(TYP)(YP
VENTSYSEM 1~VEAMMDLNTSMTRCVE 0 4 VVENT DONCME
(TYP
TI
ROD TYP
HEDOWCOE
(TP)LOGIUDNA
BRAINBRAWCING TYP
Figure 3-2.4-14,
VENT SYSTEM 180o BEAM MODEL -ISOMETRIC VIEW
3-2.4.3 Analysis for Local Effects
The penetrations and intersections of the major compo
nents of the vent system are evaluated using refined
analytical models of each penetration and intersection.
These include the vent line-drywell penetration, the
vent line-SRV piping penetration, the vent line-vent
header intersection, the downcomer-vent header inter
sections, and the vacuum breaker penetration. Figures
3-2.4-2 through 3-2.4-5 and Figure 3-2.4-15 show
analytical models used to evaluate these penetrations
and intersections.
Each of the penetration and intersection analytical
models includes mesh refinement near discontinuities to
facilitate evaluation of local stresses. The stiffness
properties used in the model are based on the nominal
dimensions of the materials used to construct the pene
trations and intersections. Small displacement linear
elastic theory is assumed throughout.
The analytical models are used to generate local stiff
nesses of the penetrations and intersections for use in
the 1/16 beam model and the 180* beam model, as dis
cussed in Sections 3-2.4.1 and 3-2.4.2. Local stiff
NSP-74-103 3-2.157
Revision 1
nutech ENGINEERS
nesses are developed which represent the stiffness of
the entire penetration or intersection in terms of a few
local degrees of freedom on the penetration or intersec
tion. This is accomplished either by applying unit
forces or displacements to the selected local degrees of
freedom or by performing a matrix condensation to reduce
the total stiffness of the penetration or intersection
to those of the selected local degrees of freedom. The
results are used to formulate stiffness matrix elements
which are added to the 1/16 beam model and the 1800 beam
model at the corresponding penetration or intersection
locations.
In order to account for the ovaling behavior of the
shell segment of the vent header, the shell segment of
the vent header at the downcomer intersection is
extended at least to the location of the first
circumferential collar for the intersection stiffness
calculation.
The analytical models are also used to evaluate stresses
in the penetrations and intersections. Stresses are
computed by idealizing the penetrations and intersec
tions as free bodies in equilibrium under a set of
statically applied loads. The applied loads, which are
NSP-74-103 3-2.158
Revision 1
nutech ENGINEERS
extracted from the 1/16 beam model results or the SRV
piping analysis described in Volume 5, consist of loads
acting on the penetration and intersection model
boundaries and of loads acting on the interior of pene
tration and intersection models. The loads acting on
the penetration and intersection model boundaries are
the beam end loads taken from the vent system and SRV
piping models at nodes coincident with the penetration
or intersection model boundary locations.
The loads which act on the interior of the penetration
or intersection models consist of reaction loads and
distributed loads taken from the 1/16 beam model
results. The reaction loads include the forces and
moments applied to the appropriate penetration or inter
section at the attachment points of the SRV piping, the
downcomer miter joint, the vent header, the vent line,
and the support columns. The distributed loads include
the pressures and acceleration loads applied to penetra
tion and intersection models to account for internal
pressure loads, thrust loads, pool swell loads, and
inertia loads. By the application of boundary loads,
reaction loads, and distributed loads to the penetration
and intersection models, equilibrium of the penetrations
and intersections is achieved for each of the governing
NSP-74-103 3-2.159 Revision 1
nutech ENGINEERS
vent system loadings. The inertia loads are found to be
insignificant for most of the load cases.
Loads which act on the shell segment boundaries are
applied to the penetration and intersection models
through a system of radial beams. The radial beams
extend from the middle surface of each of the shell
segments to a node located on the centerline of the
corresponding shell segment. The beams have large bend
ing stiffnesses, zero axial stiffness, and are pinned in
all directions at the shell segment middle surface.
Boundary loads applied to the centerline nodes cause
only shear loads to be transferred to the shell segment
middle surface with no local bending effects. Use of
this boundary condition minimizes end effects on
penetration and intersection stresses in the local areas
of interest. The system of radial beams constrains the
boundary planes to remain plane during loading, which is
consistent with the assumption made in small deflection
beam theory.
Section 3-2.4.1 discusses the methodology used to eval
uate the overall effects of the governing loads acting
on the vent system using the 1/16 beam model. The
general methodology used to evaluate local vent system
NSP-74-103 3-2.160 Revision 1
nutech
penetration and intersection stresses is discussed in
the preceding paragraphs. Descriptions of each vent
system penetration and intersection analytical model and
its use are provided in the following paragraphs.
o Vent Line-Drywell Penetration Axisymmetric Finite
Difference Model: The vent line-drywell penetra
tion model (Figure 3-2.4-2) includes a segment of
the drywell shell, the jet deflector, the
cylindrical penetration nozzle, the annular pad
plate, and the conical transition piece. The
analytical model contains 10 segments with 145 mesh
points. The reaction loads applied to the model
include those computed at the upper end of the vent
line. The distributed loads applied to the model
are internal pressure loads.
o Vent Line-SRV Piping Penetration Finite Element
Model: The vent line-SRV piping penetration model
(Figure 3-2.4-15) includes a segment of the vent
line, the penetration insert plate and the pene
tration nozzle. The model contains 1,381 nodes, 82
beam elements, and 1,719 plate bending and stretch
ing elements. Boundary loads are applied at each
end of the vent line shell segment. The reaction
NSP-74-103 3-2.161 Revision 1
nutech ENGINEERS
loads applied to the analytical model include the
drywell and wetwell SRV piping reaction loads. The
distributed loads applied to the analytical model
are internal pressure loads.
o Vent Line-Vent Header Intersection Finite Element
Model: The vent line-vent header intersection
finite element model (Figure 3-2.4-3) includes a
segment of the vent line, a segment of the vent
header with conical transitions, and the inter
section stiffener plates. The model contains 1512
nodes and 1544 plate bending and stretching
elements. Boundary loads are applied at the end of
the vent line shell segment and at each end of the
vent header shell segment. The distributed loads
applied to the analytical model are internal
pressure loads and thrust loads.
o Downcomer-Vent Header Intersection Finite Element
Model: The downcomer vent header intersection
finite element model (Figure 3-2.4-5) includes a
segment of the vent header, a segment of each
downcomer, and two gusset plates. The analytical
model contains 796 nodes, 154 beam elements, and
740 plate bending and stretching elements.
NSP-74-103 3-2.162 Revision 1
nutech
Boundary loads are applied at the ends of the vent
header segment and at the ends of the downcomer
segment. The distributed loads applied to the
model are internal pressure loads, pool swell loads
on the downcomers, and pool swell inertia loads.
o Vacuum Breaker Penetration Finite Element Model:
The vacuum breaker penetration model (Figure
3-2.4-4) includes a vent line cap, a segment of a
nozzle, and three stiffener plates. The analytical
model contains 564 nodes, 24 beam elements, and 458
plate bending and stretching elements. Boundary
loads are applied at the end of the nozzle segment.
The distributed loads applied to the model are pool
swell loads and pool swell inertia loads.
Use of the methodology described in the preceding para
graphs results in a conservative evaluation of vent
system local stresses due to the loads defined in
NUREG-0661.
NSP-74-103 3-2.163 Revision 1
nutech ENGINEERS
Figure 3-2.4-15
SRV PIPING-VENT LINE PENETRATION
FINITE ELEMENT MODEL - ISOMETRIC VIEW
NSP-74-103 Revision 1 3-2.164
nutech
3-2.4.4 Methods for Evaluating Analysis Results
The methodology discussed in Sections 3-2.4.1 and
3-2.4.2 is used to determine element forces and compo
nent stresses in the vent system component parts. The
following paragraphs discuss- the methodology used to
evaluate the analysis results, determine the controlling
stresses in the vent system components parts, and
examine fatigue effects.
To evaluate analysis results for the vent system Class
MC components, membrane and extreme fiber stress
intensities are computed. The values of the membrane
stress intensities away from discontinuities are com
puted using 1/16 beam model results. These stresses are
compared with the primary membrane stress allowables
(Table 3-2.3-1). The values of membrane stress intensi
ties near discontinuities are computed using results
from the penetration and intersection analytical models.
These stresses are compared with local primary membrane
stress allowables (Table 3-2.3-1). Primary stresses in
vent system Class MC component welds are computed using
maximum principal stresses or the resultant forces
acting on the weld throat. The results are compared to
primary weld stress allowables (Table 3-2.3-1).
NSP-74-103 3-2.165 Revision 1
nutech ENGINEERS
Many of the loads contained in each of the controlling
load combinations are dynamic loads which result in
stresses which cycle with time and are partially or
fully reversible. The maximum stress intensity ranges
for all vent system Class MC components are calculated
using the maximum values of the extreme fiber stress
differences which occur near discontinuities in the
penetration and intersection analytical models. These
stresses are compared to the secondary stress range
allowables (Table 3-2.3-1). A similar procedure is used
to compute the stress range for the vent system Class MC
component welds. The results are compared to the secon
dary weld stress allowables (Table 3-2.3-1).
To evaluate the vent system Class MC component supports,
beam end loads obtained from the 1/16 beam model results
are used to compute stresses. The results are compared
with the corresponding allowable stresses (Table
3-2.3-1). Stresses in vent system Class MC component
support welds are obtained using the 1/16 beam model
results to compute the maximum resultant force acting on
the associated weld throat. The results are compared to
weld stress limits discussed in Section 3-2.3.
NSP-74-103 3-2.166
Revision 1
nutech ENGINEERS
Section 3-2.2.2 defines the controlling vent system load
combinations. During load combination formulation, the
maximum stress components in a particular vent system
part at a given location are combined for the individual
loads contained in each combination. The stress
components for dynamic loadings are combined to obtain
the maximum stress intensity.
The maximum differential displacements of the vent line
bellows are determined using results from the 1/16 beam
model of the vent system and the analytical model of the
suppression chamber discussed in Volume 2 of this
report. The displacements of the attachment points of
the bellows to the suppression chamber and to the vent
line are determined for each load case. The differ
ential displacement is computed from these values. The
results for each load are combined to determine the
total differential displacements for the controlling
load combinations. These results are compared to the
allowable bellows displacements (Table 3-2.3-2).
To evaluate fatigue effects in the vent system Class MC
components and associated welds, extreme fiber alternat
ing stress intensity histograms are determined for each
load in each event or combination of events. Fatigue
NSP-74-103 3-2.167 Revision 1
nutech ENGINEERS
effects for chugging downcomer lateral loads are eval
uated using the stress reversal histrograms (Table
3-2.2-19). Stress intensity histograms are developed
for the most highly stressed area in the vent system,
which is the downcomer-vent header intersection. For
each combination of events, a load combination stress
intensity histogram is formulated and the corresponding
fatigue usage factors are determined using the curve
shown in Figure 3-2.4-16. The usage factors for each
event are then summed to obtain the total fatigue usage.
Use of the methodology described above results in a
conservative evaluation of the vent system design
margins.
3-2.168NSP-74-103 Revision 1
0s
40
nutech
E = 27,900 ksi
NUMBER OF CYCLES
Figure 3-2.4-16
ALLOWABLE NUMBER OF STRESS CYCLES FOR VENT SYSTEM
FATIGUE EVALUATION
NSP-74-103 Revision 1
nutech ENGINEERS
1000
cJn
En2 100
10
10 10 6
3-2.169
10 4
3-2.5 Analysis Results
The geometry, loads and load combinations, acceptance
criteria, and analysis methods used in the evaluation of
the Monticello vent system are presented and discussed
in the preceding sections. The results and conclusions
derived from the evaluation of the vent system are
presented in the following paragraphs and sections.
Table 3-2.5-1 shows the maximum primary membrame
stresses for the major components of the vent system for
each of the governing loads. Tables 3-2.5-2 and 3-2.5-3
show the corresponding reaction loads for the vent
system support columns and vent line-drywell penetra
tion. Table 3-2.5-4 shows the maximum differential
displacements of the vent line bellows for the governing
load cases. Figures 3-2.5-1 and 3-2.5-2 show the
transient response of the vent system support columns
for pool swell loads.
Table 3-2.5-5 shows the maximum stresses and associated
design margins for the major vent system components,
component supports, and welds for the SBA II, IBA I, DBA
I, DBA II, and DBA III load combinations. Table 3-2.5-6
shows the maximum stresses and associated design margins
NSP-74-103 3-2.170 Revision 1
nutech E~NGINEERS
for the components and welds of the vent line-SRV piping
penetration for the NOC I, SBA II, IBA I, and DBA III
load combinations. Table 3-2.5-7 shows the maximum
differential displacements and design margins for the
vent line bellows for the SBA II, IBA I, DBA II, and DBA
III load combinations. Table 3-2.5-8 shows the fatigue
usage factors for the controlling vent system component
and weld for the Normal Operating plus SBA events, and
the Normal Operating plus IBA events.
Stresses at the vacuum breaker penetration are evaluated
for pool swell impact and drag loads. The maximum local
primary membrane stress is 0.43 of the allowable at the
gusset plate location.
Stresses in the downcomer bracings are evaluated for
chugging lateral loads and SRV submerged structure
loads. The maximum stress is 0.62 of the allowable.
Section 3-2.5.1 discusses the vent system evaluation
results presented in the preceding paragraphs.
NSP-74-103 3-2.171 Revision 1
nutech ENGINEERS
Table 3-2.5-1 0
MAJOR VENT SYSTEM COMPONENT MAXIMUM MEMBRANE STRESSES
1. THE DBA III BELLOWS DISPLACEMENTS ENVELOP THOSE OF DBA I SINCE DBA III CONTAINS SRV DISCHARGE LOADS IN ADDITION TO THE OTHER LOADS IN DBA I (TABLE 3-2.2-29)
ew JZ
gP* I m En. (0 -4 0 1
H
Id
t'3
I-. -J
Table 3-2.5-8 .
MAXIMUM FATIGUE USAGE FACTORS FOR VENT SYSTEM
COMPONENTS AND WELDS
SEE TABLE 3-2.2-29 AND FIGURES 2-2.2-12 AND 3-2.2-13 FOR LOAD CYCLES AND EVENT SEQUENCING INFORMATION.
TOTAL NUMBER OF SRV ACTUATIONS ARE CONSERVATIVELY ASSUMED TO OCCUR IN THE SAME SUPPRESSION CHAMBER BAY. THE DURATION OF SIGNIFICANT RESPONSE FOR A SINGLE ACTUATION IS 1.5 SECOND.
THE MAXIMUM CUMULATIVE USAGE FOR A VENT SYSTEM COMPONENT OCCURS IN THE VENT HEADER AT THE DOWNCOMER-VENT HEADER INTERSECTION.
THE MAXIMUM CUMULATIVE USAGE FOR A VENT SYSTEM COMPONENT WELD OCCURS IN THE SRV PIPING-VENT LINE PENETRATION.
discharge loads. The remaining loadings result in small
primary stresses in the vent system major components.
Table 3-2.5-2 shows that the largest vent system support
column reactions occur for internal pressure loads, vent
system discharge loads, pool swell impact loads, and DBA
condensation oscillation loads. The distribution of
loads between the inner and outer support columns varies
from load case to load case. The magnitude and distri
bution of reaction loads on the drywell penetrations
also vary from load case to load case (Table 3-2.5-3).
Table 3-2.5-4 shows that the differential displacements
of the vent line bellows are small for all loadings,
except for thermal loadings.
The results (Table 3-2.5-5) indicate that the highest
stresses in the vent system components, component
supports, and associated welds occur for the SBA II and
NSP-74-103 3-2.183 Revision 1
nutech ENGINEERS
the DBA I load combinations. The vent line, vent
header, and downcomer stresses for the SBA II and DBA I
load combinations are less than the allowable limits
with stresses in other vent system components, component
supports, and welds well within the allowable limits.
The stresses in the vent system components, component
supports, and welds for the IBA I, DBA II, and DBA III
load combinations are also well within the allowable
limits.
The results (Table 3-2.5-7) indicate that the vent line
bellows differential displacements are all well within
allowable limits. The maximum displacement occurs for
the SBA II load combination.
The loads which cause the highest number of displacement
cycles at the vent line bellows are seismic loads, SRV
loads, and LOCA-related loads such as pool swell,
condensation oscillation, and chugging. The bellows
displacements for these loads are small compared to the
maximum allowable displacement, and their effect on
fatigue is negligible. Thermal loads and internal
pressure loads are the largest contributors to bellows
displacements. The specified number of thermal load and
internal pressure load cycles is 150. Since the bellows
NSP-74-103 3-2.184
Revision 1
nutech
have a rated capacity of 1,000 cycles at maximum dis
placement, their adequacy for fatigue is assured.
The vent system fatigue usage factors (Table 3-2.5-8)
are computed for the controlling events, which are
Normal Operating plus SBA and Normal Operating plus
IBA. The governing vent system component for fatigue is
the vent header at the downcomer-vent header inter
section. The magnitudes and cycles of downcomer lateral
loads are the primary contributors to fatigue at this
location.
The governing vent system weld for fatigue is the insert
plate to vent line shell at the vent line-SRV piping
penetration. SRV temperature and thrust loads and the
number of SRV actuations are the major contributors to
fatigue at this location.
Fatigue effects at other locations in the vent system
are less severe than at those described above, due
primarily to lower stresses.
NSP-74-103 3-2.185 Revision 1
nutech
3-2.5.2 Closure
The vent system loads described and presented in Section
3-2.2.1 are conservative estimates of the loads postu
lated to occur during an actual LOCA or SRV discharge
event. Applying the methodology discussed in Section
3-2.4 to examine the effects of the governing loads on
the vent system results in bounding values of stresses
and reactions in vent system components and component
supports.
The load combinations and event sequencing defined in
Section 3-2.2.2 envelop the actual events postulated to
occur during a LOCA or SRV discharge event. Combining
the vent system responses to the governing loads and
evaluating fatigue effects using this methodology
results in conservative values of the maximum vent
system stresses, support reactions, and fatigue usage
factors for each event or sequence of events postulated
to occur throughout the life of the plant.
The acceptance limits defined in Section 3-2.3 are as
restrictive as those used in the original containment
design documented in the plant's FSAR (in many cases,
more restrictive). Comparing the resulting maximum
NSP-74-103 3-2.186 Revision 1
nutech ENGINEERS
stresses and support reactions to these acceptance
limits results in a conservative evaluation of the
design margins present in the vent system and its
supports. As demonstrated in the results discussed and
presented in the preceding sections, all of the vent
system stresses and support reactions are within these
acceptance limits.
As a result, the components of the vent system described
in Section 3-2.1, which are specifically designed for
the loads and load combinations used in this evaluation,
exhibit the margins of safety inherent in the original
design of the primary containment as documented in the
plant's FSAR. The NUREG-0661 requirements, as they
relate to the design adequacy and safe operation of the
Monticello vent system, are therefore considered to be
met.
NSP-74-103 3-2.187 Revision 1
nutech ENGIER
LIST OF REFERENCES
1. "Mark I Containment Long-Term Program," Safety Evaluation Report, NRC, NUREG-0661, July 1980.
2. "Mark I Containment Program Load Definition Report," General Electric Company, NEDO-21888, Revision 2, December 1981.
3. "Mark I Containment Program Plant Unique Load Definition," Monticello Nuclear Generating Plant, General Electric Company, NEDO-24576, Revision 1, October 1981.
4. Monticello Nuclear Generating Plant, Final Safety Analysis Report (FSAR), Northern States Power Company, Volume III, Section 12, July 1969.
5. "Mark I Containment Program Structural Acceptance Criteria Plant Unique Analysis Application Guide, Task Number 3.1.3," General Electric Company, NEDO24583-1, October 1979.
6. ASME Boiler and'Pressure Vessel Code, Section III, Division 1, 1977 Edition with Addenda up to and including Summer 1977.
7. Biggs, J. M., "Introduction to Structural Dynamics," McGraw-Hill Book Company, N.Y., 1964.