52
New Volcanic Island Saving Marine Archives Climate Model Accuracy
New Volcanic Island
Saving Marine Archives
Climate Model
Accuracy
VOL. 98 • NO. 9 • SEP 2017
Students:Doing Research this Summer?
Learn more at virtualposter.agu.org
Doing Research this Summer?
virtualposter.agu.org
Present it in the Fall Showcase!Abstract Submission Deadline: 30 September
Earth & Space Science News Contents
Earth & Space Science News Eos.org // 1
SEPTEMBER 2017VOLUME 98, ISSUE 9
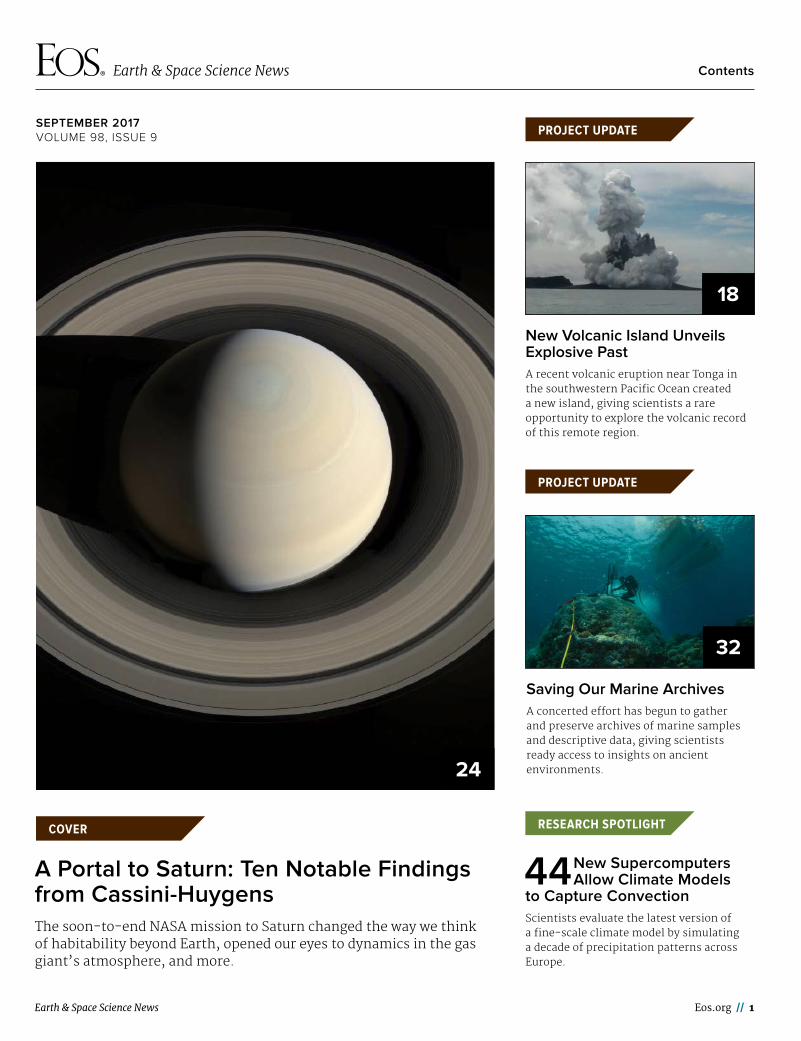
A Portal to Saturn: Ten Notable Findings from Cassini-HuygensThe soon-to-end NASA mission to Saturn changed the way we think of habitability beyond Earth, opened our eyes to dynamics in the gas giant’s atmosphere, and more.
COVER
24
44 New Super computers Allow Climate Models
to Capture ConvectionScientists evaluate the latest version of a fine-scale climate model by simulating a decade of precipitation patterns across Europe.
New Volcanic Island Unveils Explosive PastA recent volcanic eruption near Tonga in the southwestern Pacific Ocean created a new island, giving scientists a rare opportunity to explore the volcanic record of this remote region.
PROJECT UPDATE
18
Saving Our Marine ArchivesA concerted effort has begun to gather and preserve archives of marine samples and descriptive data, giving scientists ready access to insights on ancient environments.
PROJECT UPDATE
32
RESEARCH SPOTLIGHT

2 // Eos September 2017
Contents
facebook.com/AmericanGeophysicalUnion linkedin.com/company/american-geophysical-union@AGU_Eos youtube.com/user/AGUvideos
Editor in ChiefBarbara T. Richman: AGU, Washington, D. C., USA; eos_ [email protected]
Christina M. S. CohenCalifornia Institute of Technology, Pasadena, Calif., USA; cohen@srl .caltech.edu
José D. FuentesDepartment of Meteorology, Pennsylvania State University, University Park, Pa., USA; [email protected]
Wendy S. GordonEcologia Consulting, Austin, Texas, USA; wendy@ecologiaconsulting .com
David HalpernJet Propulsion Laboratory, Pasadena, Calif., USA; davidhalpern29@gmail .com
Carol A. SteinDepartment of Earth and Environmental Sciences, University of Illinois at Chicago, Chicago, Ill., USA; [email protected]
Editors
Mark G. Flanner, Atmospheric SciencesNicola J. Fox, Space Physics and AeronomyPeter Fox, Earth and Space Science InformaticsSteve Frolking, Biogeosciences Edward J. Garnero, Study of the Earth’s Deep Interior Michael N. Gooseff, HydrologyBrian C. Gunter, GeodesyKristine C. Harper, History of GeophysicsSarah M. Hörst, Planetary Sciences Susan E. Hough, Natural HazardsEmily R. Johnson, Volcanology, Geochemistry, and Petrology Keith D. Koper, SeismologyRobert E. Kopp, Geomagnetism and Paleomagnetism
John W. Lane, Near-Surface GeophysicsJian Lin, TectonophysicsFigen Mekik, Paleoceanography and PaleoclimatologyJerry L. Miller, Ocean SciencesThomas H. Painter, Cryosphere SciencesPhilip J. Rasch, Global Environmental ChangeEric M. Riggs, EducationAdrian Tuck, Nonlinear GeophysicsSergio Vinciguerra, Mineral and Rock PhysicsAndrew C. Wilcox, Earth and Planetary Surface ProcessesEarle Williams, Atmospheric and Space ElectricityMary Lou Zoback, Societal Impacts and Policy Sciences
Editorial Advisory Board
Staff
Production and Design: Faith A. Ishii, Production Manager; Melissa A. Tribur, Senior Production Specialist; Beth Bagley, Manager, Design and Branding; Travis Frazier and Valerie Friedman, Senior Graphics SpecialistsEditorial: Peter L. Weiss, Manager/Senior News Editor; Mohi Kumar, Scientific Content Editor; Randy Showstack, Senior News Writer; JoAnna Wendel, News Writer; Liz Castenson, Editorial and Production Coordinator; Kimberly M. S. Cartier, News Writing and Production InternMarketing: Jamie R. Liu, Manager, Marketing; Angelo Bouselli and Tyjen Conley, Marketing Program Managers; Ashwini Yelamanchili, Digital Marketing CoordinatorAdvertising: Tracy LaMondue, Director, Development; Tel: +1-202-777-7372; Email: [email protected]
©2017. American Geophysical Union. All Rights Reserved. Material in this issue may be photocopied by individual scientists for research or classroom use. Permission is also granted to use short quotes, figures, and tables for publication in scientific books and journals. For permission for any other uses, contact the AGU Publications Office.
Eos (ISSN 0096-3941) is published monthly by the American Geophysical Union, 2000 Florida Ave., NW, Washington, DC 20009, USA. Periodical Class postage paid at Washington, D. C., and at additional mailing offices. POSTMASTER: Send address changes to Member Service Center, 2000 Florida Ave., NW, Washington, DC 20009, USA.
Member Service Center: 8:00 a.m.–6:00 p.m. Eastern time; Tel: +1-202-462-6900; Fax: +1-202-328-0566; Tel. orders in U.S.: 1-800-966-2481; Email: [email protected].
Use AGU’s Geophysical Electronic Manuscript Submissions system to submit a manuscript: http://eos-submit.agu.org.
Views expressed in this publication do not necessarily reflect official positions of the American Geophysical Union unless expressly stated.
Christine W. McEntee, Executive Director/CEO
DEPARTMENTS
3–11 NewsUSGS Library Cuts Would Harm Research, Education, Say Scientists; Tornado Precursor Foreseen Hours Before Twister Hit; Build Four U.S. Polar Icebreakers, Report Urges; Homemade Lava Flows Fuse Science with Art on Video; Climate Change Could Make Siberia an Attractive Place to Live; Contrary Temperature Trend Stalls Upgraded Climate Model’s Debut; Gerald J. Wasserburg ( 1927– 2016).
12 Meeting ReportProtecting Water Resources Through a Focus on Headwater Streams.
13–17 OpinionsClimate and Other Models May Be More Accurate Than Reported; Avoiding Predators in Publishing.
37–40 AGU NewsUnemployed? AGU Can Help; Japan- U.S. Joint Meeting: Geoscience for a Borderless World; Eos Receives Two Publication Awards; 2017 AGU Union Medal, Award, and Prize Recipients Announced.
41–44 Research SpotlightMysterious Particle Beams Found over Jupiter’s Poles; Curiosity Spies Shifting Sands on Mars; Shedding Light on Intermittent Rainfall; Can Ocean Tides Be Powerful Indicators of Climate Change?; New Supercomputers Allow Climate Models to Capture Convection.
45–48 Positions AvailableCurrent job openings in the Earth and space sciences.
Inside Back Cover: Postcards from the FieldScientists use blue dye to study a rain-on-snow event in Switzerland.
On the CoverArtist’s concept of Cassini in one of its final dives over Saturn. Credit: NASA/JPL-Caltech
7
16

Earth & Space Science News
NEWS
Eos.org // 3
The U.S. Geological Survey (USGS) Library, home to one of the largest Earth and natural science collections in
the world, faces a 52% funding decrease in the fiscal year (FY) 2018 federal budget proposed by President Donald Trump.
The potential funding loss of $3 million would close at least three of the library’s four branches, eliminate three quarters of the sup-porting staff, and end public and researcher access to USGS Library collections, according to the FY 2018 USGS budget justification doc-ument.
This rollback of librarian services and other impacts would damage geoscience research and education, said Earth scientists, educa-tors, and scientific society leaders interviewed by Eos. The harm would also ripple through libraries and other institutions that rely on the USGS Library for materials and guidance not available elsewhere, said librarians and others from outside USGS.
“Defunding the USGS Library has the potential to be devastating,” said Aaron John-son, executive director of the American Insti-tute of Professional Geologists (AIPG) in Thornton, Colo., referring to the possible effect on research projects of AIPG members.
“If these resources are rendered inaccessi-ble, the nation will lose an invaluable scien-
tific asset,” wrote 23 science organizations in a 16 June letter (http:// bit . ly/ June - 16 - Letter) to several members of Congress that urged continued library funding in 2018 at the level of $5.8 million that USGS currently receives. (AGU, the publisher of Eos, is a signatory of the letter.)
Access to Collections and Librarians May CeaseWith so few staff left after the anticipated cuts, those who would remain would be expected to focus on “ inward- facing, tech-nical, and operational tasks, with minimal capacity for research support and digitization,” according to a statement that the USGS Office of Communications and Publishing (OCP) provided to Eos. Branch closures would restrict public, researcher, and educator access to nondigitized
collections and USGS librarians, the statement also noted. The library operates branches in Reston, Va.; Denver, Colo.; Flagstaff, Ariz.; and Menlo Park, Calif.
The most important information to which geologists could lose access is “foundational” materials—such as topographical maps, land use patterns, and historical records—that serve as the starting points for geophysical research projects, Johnson said. He believes that losing access to the nondigitized collec-tions could derail ongoing and planned research projects.
Under the proposed funding restrictions, USGS would not be able to maintain its Publi-cations Warehouse, the online official index to USGS- authored publications, according to the OCP statement. The warehouse site received more than 1.2 million unique visitors in 2016.
No AlternativeMuch of the USGS Library’s content is unique or available from fewer than 10 libraries around the world, the agency reported in a 2014 blog post about digitization of its library holdings.
During 2015 and 2016, the USGS Library filled “over 3,600 requests for resources from 820 individual institutions,” according to the OCP statement. “Many other libraries use it as
a resource, to get documents and informa-tion that they can’t get anywhere else,” said Maeve Boland, director of geoscience policy at the American Geosciences Institute (AGI) in Alexandria, Va.
According to Lisa Long, the librarian at the Ohio Geological Survey, “In some cases, we depend on the USGS collections to have items or be able to explain the provenance of items that we may or may not have in our collections.”
Potential Education ImpactsBeyond geological research, the USGS Library has provided resources for geology educators and the public for years. USGS estimated that 40% of visitors to the Denver branch and 80% of visitors to the Reston branch were from outside USGS.
College students studying geology would also be hit hard by the loss of access to the USGS Library, according to Johnson. An associate professor of geology at Northwest Missouri State University for 9 years, John-son recalled that he relied on data from the USGS Library to create course content for undergraduate classes ranging from intro-ductory to senior level.
“My students have found working with USGS data to be one of the most valuable parts of their preparation to be professional geoscientists,” he added. “In my opinion, you can’t underestimate the impact on undergraduate education in the geosci-ences.”
What’s Next?The requested cut to the USGS Library bud-get is part of a 15% reduction in overall USGS funding in President Trump’s FY 2018 budget request. On 18 July, the House Appropria-tions Subcommittee for the Interior, Envi-ronment, and Related Agencies approved a spending bill that allocate $116.8 million more for USGS than the president’s request. However, the agency total still falls $46.2 million short of its current funding level. As this issue of Eos went to press, no further congressional actions had been taken on this portion of the FY 2018 federal budget.
In the meantime, “options are being iden-tified and evaluated to inform implementa-tion strategies and decisions that will define the full impact of changes to library services, resources, and collections,” the OCP state-ment said.
As Boland noted, the agency and its library “are not in control of their own destiny.”
By Kimberly M. S. Cartier (@ AstroKimCartier), News Writing and Production Intern
USGS Library Cuts Would Harm Research, Education, Say Scientists
Map of Washington, D. C., around Capitol Hill from 1920, in the Historical
Map Collection of the USGS Library in Reston, Va. Credit: AGU
4 // Eos September 2017
NEWSNEWS
A rain- wrapped tornado struck the small town of Elk City, Okla., on 16 May and damaged more than 20 homes and
businesses. Thanks to an experimental storm prediction model from the National Severe Storms Laboratory (NSSL) in Norman, Okla., residents received more than twice the usual warning time to seek shelter.
Pamela Heinselman, project manager of the prediction model called Warn- on- Forecast, told Eos that National Weather Service (NWS) forecasters in Norman saw the test as “significant in terms of being able to put out that advisory and then have confidence to issue a warning…earlier than they would have been able to do otherwise.”
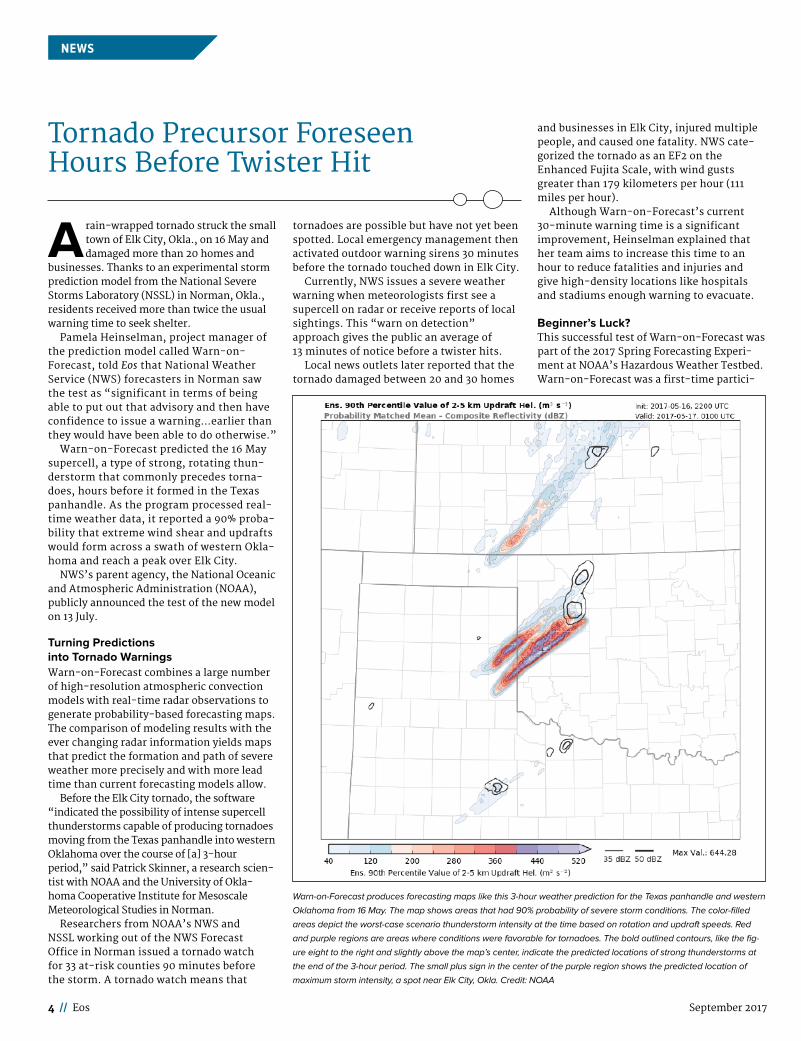
Warn- on- Forecast predicted the 16 May supercell, a type of strong, rotating thun-derstorm that commonly precedes torna-does, hours before it formed in the Texas panhandle. As the program processed real- time weather data, it reported a 90% proba-bility that extreme wind shear and updrafts would form across a swath of western Okla-homa and reach a peak over Elk City.
NWS’s parent agency, the National Oceanic and Atmospheric Administration (NOAA), publicly announced the test of the new model on 13 July.
Turning Predictions into Tornado Warnings Warn- on- Forecast combines a large number of high- resolution atmospheric convection models with real- time radar observations to generate probability- based forecasting maps. The comparison of modeling results with the ever changing radar information yields maps that predict the formation and path of severe weather more precisely and with more lead time than current forecasting models allow.
Before the Elk City tornado, the software “indicated the possibility of intense supercell thunderstorms capable of producing tornadoes moving from the Texas panhandle into western Oklahoma over the course of [a] 3-hour period,” said Patrick Skinner, a research scien-tist with NOAA and the University of Okla-homa Cooperative Institute for Mesoscale Meteorological Studies in Norman.
Researchers from NOAA’s NWS and NSSL working out of the NWS Forecast Office in Norman issued a tornado watch for 33 at- risk counties 90 minutes before the storm. A tornado watch means that
tornadoes are possible but have not yet been spotted. Local emergency management then activated outdoor warning sirens 30 minutes before the tornado touched down in Elk City.
Currently, NWS issues a severe weather warning when meteorologists first see a supercell on radar or receive reports of local sightings. This “warn on detection” approach gives the public an average of 13 minutes of notice before a twister hits.
Local news outlets later reported that the tornado damaged between 20 and 30 homes
and businesses in Elk City, injured multiple people, and caused one fatality. NWS cate-gorized the tornado as an EF2 on the Enhanced Fujita Scale, with wind gusts greater than 179 kilometers per hour (111 miles per hour).
Although Warn- on- Forecast’s current 30-minute warning time is a significant improvement, Heinselman explained that her team aims to increase this time to an hour to reduce fatalities and injuries and give high- density locations like hospitals and stadiums enough warning to evacuate.
Beginner’s Luck?This successful test of Warn- on- Forecast was part of the 2017 Spring Forecasting Experi-ment at NOAA’s Hazardous Weather Testbed. Warn- on- Forecast was a first- time partici-
Tornado Precursor Foreseen Hours Before Twister Hit
Warn- on- Forecast produces forecasting maps like this 3-hour weather prediction for the Texas panhandle and western
Oklahoma from 16 May. The map shows areas that had 90% probability of severe storm conditions. The color- filled
areas depict the worst- case scenario thunderstorm intensity at the time based on rotation and updraft speeds. Red
and purple regions are areas where conditions were favorable for tornadoes. The bold outlined contours, like the fig-
ure eight to the right and slightly above the map’s center, indicate the predicted locations of strong thunderstorms at
the end of the 3- hour period. The small plus sign in the center of the purple region shows the predicted location of
maximum storm intensity, a spot near Elk City, Okla. Credit: NOAA

Earth & Space Science News Eos.org // 5
NEWS
D eeming the United States “ ill- equipped to protect its interest and maintain leadership” in the polar
regions, a national science advisory commit-tee issued a report in July calling for construc-tion of four new ships with heavy icebreaking capability.
The United States currently owns just one operational heavy polar icebreaker, the Polar Star, which was built in 1976 and is long past its 30-year design life. The Polar Star and one medium polar icebreaker, the Healy, constitute the entire U.S.- owned operational polar ice-breaker fleet, whereas Russia has 16 polar ice-breakers with four more under construction, Finland has seven, Sweden four, and Canada three.
Heavy icebreakers come with high price tags. To hold down costs, which nonetheless would average nearly $800 million per ship, the report, from the National Academies of Sciences, Engineering, and Medicine ( NASEM), recommends using essentially the same design for all the ships and buying them all
through a block purchase (http:// bit . ly/ Icebreaker - 2017).
The document, entitled “Acquisition and Operation of Polar Icebreakers: Fulfilling the Nation’s Needs,” also recommends assigning the U.S. Coast Guard to own and operate the vessels, three of which would serve in the Arc-tic and one in the Antarctic.
To support future scientific use of the ships, the NASEM committee encourages spending more initially on the vessels to make it easier and more cost- effective to equip them later for science missions. All of the ships should be built to a standard of “science ready,” at an additional cost of about $ 10 million to $20 million per ship, the report recommends. For yet another $ 20 million to $30 million, one of the four ships should begin its career as fully “science capable.”
“If you’re going to build a ship that goes to places where no other ship can go, to oceans that we don’t know a hell of a lot about, then you ought to have some ability to do a little science while you’re there,” said Rear Adm.
Build Four U.S. Polar Icebreakers, Report Urges
pant in this annual NOAA event, a modeling- focused experiment coordinated between the Storm Prediction Center and NSSL.
According to Heinselman, experiments like these are critical for understanding the strengths and weaknesses of the forecasting program and for improving the current ver-sion of the model. Warn- on- Forecast is still in the experimental stages of development and is not expected to be fully operational for at least 6 to 8 years, she said.
Because the Elk City forecast was the first attempt by NWS forecasters to use Warn- on- Forecast for a real- world prediction and storm warning, the team does not yet know whether the accuracy of the prediction typi-fies the software’s capabilities or was just a one- time success. The researchers expect to continue testing with NWS. These tests should enable the researchers to “collect more cases with the model, which will allow us to more thoroughly evaluate its perfor-mance,” added Heinselman.
Warn- on- Forecast and a related program, Forecasting a Continuum of Environmental Threats, aim to deliver detailed storm predic-tions across a “threat grid” that updates on the basis of real- time data, Heinselman said. Other predictive models currently in use issue a “yes or no” storm prediction for large areas and can have a high level of uncertainty.
“From probabilistic- type guidance you can give a more specific area of impact associated with different threats,” she explained. “The goal is to be able to reduce the [geographic] size of that warning based on, in part, model forecasts.”
By Kimberly M. S. Cartier (@AstroKimCartier), News Writing and Production Intern
Warn- on- Forecast predicted the path of a thunderstorm
capable of producing tornadoes through parts of Texas and
Oklahoma on 16 May. The storm first produced the tornado
pictured here south of McLean, Texas, before generating a
second tornado that touched down in Elk City, Okla. Credit:
Dave Lewison, https://www.facethewind.com
The Polar Star breaks a path through the ice for ships that supply McMurdo Station, a site of the U.S. Antarctic Program
where scientists conduct field research and geophysical observations. The Polar Star is the only operational heavy
polar icebreaker owned by the U.S. government. Credit: U.S. Coast Guard Headquarters

6 // Eos September 2017
NEWS
Richard West (retired), who chaired the NASEM committee that wrote the report.
Elements of a science- ready design, the report notes, could include structural sup-ports, flexible accommodations for up to 50 science personnel, and the means to avoid interference with sonar transducers. Full sci-ence capability could include carrying oceano-graphic equipment, instrumentation, and facilities “comparable with those of modern oceanographic research vessels,” according to the report.
West added that with science- ready designs, “you don’t have to go back and ret-rofit that capability at probably a tenfold more expense.”
Failure to Respond to the NeedThere’s no time to lose, according to West and his committee. “For more than 30 years, studies have emphasized the need for U.S. icebreakers to maintain presence, sover-eignty, leadership, and research capacity—but the nation has failed to respond,” they state in the document.
West told Eos that he hopes that this study will make a difference. “We’ve been procras-tinating on investing in polar icebreakers for a long time, and so this is a crucial report,” he said. “The nation is in extremis. If you don’t do something now, you will be without icebreaking capability very, very quickly.”
The admiral, who from 2002 to 2008 served as president and CEO of the Consortium for Oceanographic Research and Education, which was renamed the Consortium for Ocean Leadership during that period, noted that both the Obama and Trump administra-tions have expressed support for polar ice-breakers.
Funding ProspectsA government project to acquire a new polar icebreaker received about $221 million between fiscal year (FY) 2013 and FY 2017, according to a June 2017 Congressional Research Service (CRS) report (http:// bit . ly/ CRS - 2017). The CRS report also summarizes some of the Coast Guard’s long- standing efforts to beef up its icebreaking capability, including $20 million in contracts awarded to companies in February 2017 for heavy polar icebreaker design studies and analysis.
The Coast Guard’s proposed FY 2018 budget requests $19 million in acquisition funding for a polar icebreaker. U.S. president Donald Trump said in a 17 May speech at the Coast Guard Academy that during his administration, “we will be building the first new heavy icebreakers the United States has seen in over 40 years.”
On Capitol Hill, the Senate Armed Services Committee unanimously approved in June a
provision of the FY 2018 National Defense Authorization Act that calls for procurement of up to six Coast Guard polar- class icebreak-ers. An appropriations bill that was subse-quently passed by the House of Representa-tives included $19 million of icebreaker funding. However, when this issue of Eos went to press, Senate appropriators had not yet released a sister appropriations bill.
How Best to Accommodate ScienceCarin Ashjian, a biological oceanographer who is a senior scientist at Woods Hole Oceanographic Institution and a member of the NASEM committee, said she would prefer that all four ships be made science capable.
However, she said, the report “is a mea-sured, realistic assessment. Given the present levels of funding available to the nation, we could not support [full science capability] on four of those ships. We simply do not have the research funds, nor do funding agencies have funds to maintain the operations of the sci-ence portions of a ship.” She said that the report builds in flexibility by recommending science- ready and science- capable icebreaker designs.
Kelly Falkner, director of the Office of Polar Programs at the National Science Foundation, said that she appreciates the efforts by the committee to take a pragmatic approach to building polar icebreakers. However, she told Eos that she has concerns about how thor-oughly the new icebreakers would meet sci-ence needs.
“In an ideal world, you’d have an asset that is controlled and scheduled completely by the science community and operated in the most efficient and effective way for science,” she said, noting that the Coast Guard has many other important priorities, including national security and search and rescue missions. “When it comes to being at the forefront of marine science in the polar regions, you really want to dedicate a vessel to that and optimize a vessel for that.”
Some people think that if the science com-munity doesn’t throw its hat in with the Coast Guard, it will never get a science- suitable icebreaker, Falkner said. However, “I would argue that we’re not at the point where you take what you get,” she said.
This report “is very good from the stand-point of reinforcing that we do need immedi-ately to get going on construction of our [ice]breaker fleet. And I’m hoping we can con-tinue the conversation on exactly how best to accommodate science.”
By Randy Showstack (@RandyShowstack), Staff Writer
Merging Geophysical, Petrochronologic,
and Modeling Perspectives of Large
Silicic Magma Systems
Learn more at chapman.agu.org/
silicic-magma/
Join your colleagues to identify effective ways to improve our
understanding of how large silicic magma systems grow and erupt by merging views from the geophysics,
petrology, geochronology, and modeling communities.
Abstract Submission Deadline:
13 September 2017
Travel Grant Deadline: 20 September 2017
Registration Deadline: 15 November 2017
Earth & Space Science News Eos.org // 7
NEWS
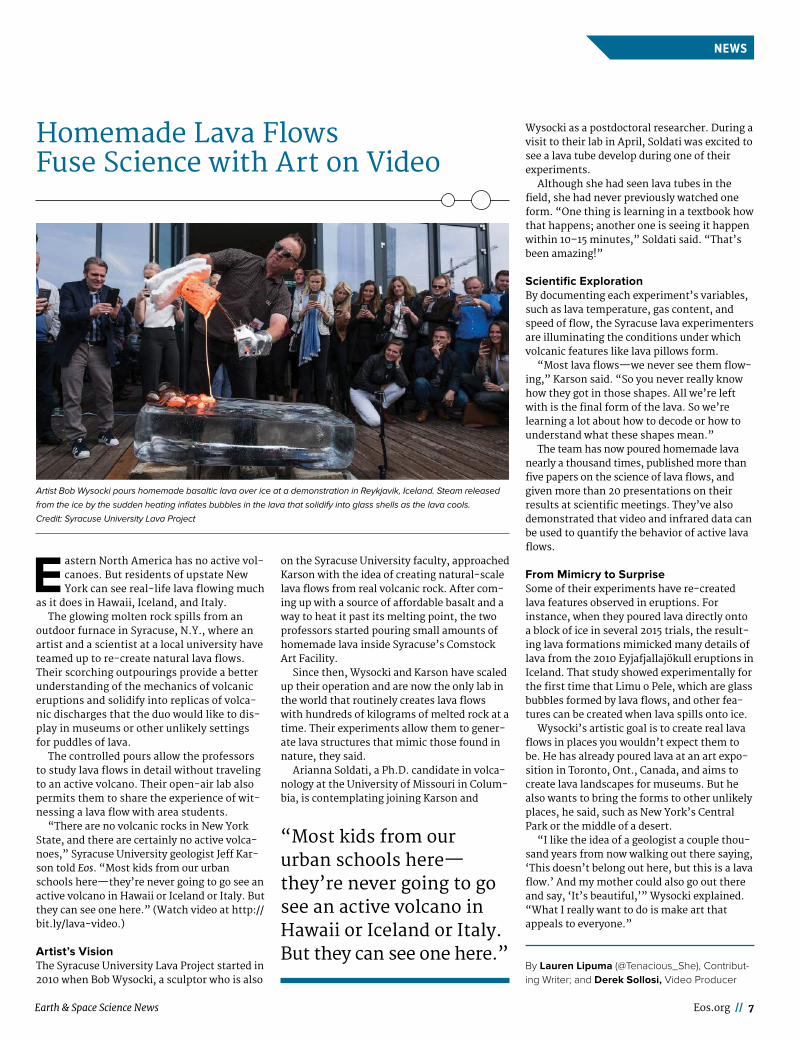
E astern North America has no active vol-canoes. But residents of upstate New York can see real- life lava flowing much
as it does in Hawaii, Iceland, and Italy.The glowing molten rock spills from an
outdoor furnace in Syracuse, N.Y., where an artist and a scientist at a local university have teamed up to re-create natural lava flows. Their scorching outpourings provide a better understanding of the mechanics of volcanic eruptions and solidify into replicas of volca-nic discharges that the duo would like to dis-play in museums or other unlikely settings for puddles of lava.
The controlled pours allow the professors to study lava flows in detail without traveling to an active volcano. Their open- air lab also permits them to share the experience of wit-nessing a lava flow with area students.
“There are no volcanic rocks in New York State, and there are certainly no active volca-noes,” Syracuse University geologist Jeff Kar-son told Eos. “Most kids from our urban schools here—they’re never going to go see an active volcano in Hawaii or Iceland or Italy. But they can see one here.” (Watch video at http:// bit . ly/ lava- video.)
Artist’s VisionThe Syracuse University Lava Project started in 2010 when Bob Wysocki, a sculptor who is also
on the Syracuse University faculty, approached Karson with the idea of creating natural- scale lava flows from real volcanic rock. After com-ing up with a source of affordable basalt and a way to heat it past its melting point, the two professors started pouring small amounts of homemade lava inside Syracuse’s Comstock Art Facility.
Since then, Wysocki and Karson have scaled up their operation and are now the only lab in the world that routinely creates lava flows with hundreds of kilograms of melted rock at a time. Their experiments allow them to gener-ate lava structures that mimic those found in nature, they said.
Arianna Soldati, a Ph.D. candidate in volca-nology at the University of Missouri in Colum-bia, is contemplating joining Karson and
Wysocki as a postdoctoral researcher. During a visit to their lab in April, Soldati was excited to see a lava tube develop during one of their experiments.
Although she had seen lava tubes in the field, she had never previously watched one form. “One thing is learning in a textbook how that happens; another one is seeing it happen within 10–15 minutes,” Soldati said. “That’s been amazing!”
Scientific ExplorationBy documenting each experiment’s variables, such as lava temperature, gas content, and speed of flow, the Syracuse lava experimenters are illuminating the conditions under which volcanic features like lava pillows form.
“Most lava flows—we never see them flow-ing,” Karson said. “So you never really know how they got in those shapes. All we’re left with is the final form of the lava. So we’re learning a lot about how to decode or how to understand what these shapes mean.”
The team has now poured homemade lava nearly a thousand times, published more than five papers on the science of lava flows, and given more than 20 presentations on their results at scientific meetings. They’ve also demonstrated that video and infrared data can be used to quantify the behavior of active lava flows.
From Mimicry to SurpriseSome of their experiments have re-created lava features observed in eruptions. For instance, when they poured lava directly onto a block of ice in several 2015 trials, the result-ing lava formations mimicked many details of lava from the 2010 Eyjafjallajökull eruptions in Iceland. That study showed experimentally for the first time that Limu o Pele, which are glass bubbles formed by lava flows, and other fea-tures can be created when lava spills onto ice.
Wysocki’s artistic goal is to create real lava flows in places you wouldn’t expect them to be. He has already poured lava at an art expo-sition in Toronto, Ont., Canada, and aims to create lava landscapes for museums. But he also wants to bring the forms to other unlikely places, he said, such as New York’s Central Park or the middle of a desert.
“I like the idea of a geologist a couple thou-sand years from now walking out there saying, ‘This doesn’t belong out here, but this is a lava flow.’ And my mother could also go out there and say, ‘It’s beautiful,’” Wysocki explained. “What I really want to do is make art that appeals to everyone.”
By Lauren Lipuma (@Tenacious_She), Contribut-ing Writer; and Derek Sollosi, Video Producer
“Most kids from our urban schools here—they’re never going to go see an active volcano in Hawaii or Iceland or Italy. But they can see one here.”
Artist Bob Wysocki pours homemade basaltic lava over ice at a demonstration in Reykjavik, Iceland. Steam released
from the ice by the sudden heating inflates bubbles in the lava that solidify into glass shells as the lava cools.
Credit: Syracuse University Lava Project
Homemade Lava Flows Fuse Science with Art on Video

8 // Eos September 2017
NEWSNEWS
C limate change has introduced the specter of rising seas, flooded coastal communities, and people uprooted
from their homes on an unprecedented scale. In 2016, 23.5 million people were displaced by climate- and weather- related disasters, including 12.9 million hit by storms, according to the Internal Displacement Monitoring Cen-tre in Switzerland.
If climate change produces refugees seeking safer places to live, where will they go? Some researchers are considering real estate in a thinly populated area of the world where cli-mate change might make living conditions improve: Siberia.
Russia’s vast Siberian region stretches from the Ural Mountains eastward to the Pacific Ocean. On average, only three people occupy each of the more than 13 million square kilo-meters of this expanse. The territory has extensive oil and mineral deposits, some of the world’s largest natural gas reserves, abun-dant forests and fisheries, and crop and live-stock production.
However, Siberia’s Yakutia region also hosts the Northern Hemisphere’s “pole of cold,” the place with the lowest air temperature ever recorded in the hemisphere. Even in Siberia’s largest city, Novosibirsk, the mercury can drop to −50°C.
Wild New FrontierBut atmospheric warming from greenhouse gases could make conditions more hospitable. Researchers from the Sukachev Institute of Forest of the Siberian Branch of the Russian Academy of Sciences have been examining the climatic and agricultural potential for Siberia to become a home to more people.
Elena Parfenova and her colleagues outlined their projections in a poster (http:// bit . ly/ Parfenova- 2017) that they presented at a joint conference of the Japan Geoscience Union and AGU in Chiba, Japan, in May. The researchers reported that by the 2080s, Siberia will have a milder climate, less permafrost coverage, and possibly vastly increased crop production. These would make the region much more appealing for settlers, they added.
Because the district of the Russian Federa-tion formally named “Siberia” occupies only a fraction of the land on which the researchers focused their study, Parfenova and her col-leagues use the term “Asian Russia” in their poster to refer to the entire Urals to Pacific coast region.
The team evaluated Asian Russia now and how it might look in the 2080s in several cate-gories: temperature, precipitation, perma-frost, and a “climate severity” parameter that factors in temperatures below 0°C and the
presence or absence of permafrost. They also calculated the region’s ecological landscape potential (ELP), a gauge of a landscape’s abil-ity to provide for the needs of human settlers. The ELP ranking for various Russian land-scapes, originally developed by Russian envi-ronmental scientist A. G. Isachenko, is a seven- step chart going from 1 (most hospita-ble) to 7 (most inhospitable) and includes mean population densities. The ranking is derived from calculations involving tempera-ture, precipitation, and evaporation. For instance, the forested landscape known as middle taiga has an ELP ranking of 3, or “medium,” and a mean population density of 6.6 people per square kilometer.
Siberia, 2080To project what Siberia’s 2080s climate might be like, the researchers analyzed data from 1000 Siberian weather stations from the 1960– 1990 period and established baselines of tem-peratures for January and July and of annual precipitation. They then interpolated the weather station data across a grid with a pixel size of 0.25° of latitude by 0.25° of longitude.
To characterize different warming scenarios for the 2080s, the researchers applied to the baseline temperatures and annual precipita-tion at each pixel the outcomes of 20 general circulation models developed in the Coupled Model Intercomparison Project of the Inter-governmental Panel on Climate Change.
The team also superimposed maps showing current climate severity, permafrost extent, and crop potential onto population maps. The good correlations between these environmen-tal factors and present- day population densi-ties suggested that it’s possible to project pop-ulation increases along with climate change, Parfenova’s collaborator Nadezhda Tcheba-kova, also of the Sukachev Institute, told Eos.
The researchers found that by the 2080s, Siberia could have a milder climate with less permafrost coverage. Depending on the projec-tion scenario, temperatures could rise by as much as 9.1°C in midwinter and as much as 5.7°C in midsummer; annual precipitation may increase by 60 millimeters to 140 millime-ters.
They also found that ELP values for most of the region could jump by one to two catego-ries, meaning that the potential for human settlement could also jump. The results of the study, which the researchers said would be
Climate Change Could Make Siberia an Attractive Place to Live
A frozen river winds through the tundra in northern Siberia. Credit: Peter Prokosch, CC BY- NC- SA 2.0 (http://bit.ly/ccbysa2-0)
Eos.org // 9
NEWS
Earth & Space Science News
Permafrost thawing can lead to land subsidence, which can undermine the foundations for and ultimately destroy roads, bridges, and other infrastructure needed by settlers.
submitted to a special issue of Environmental Research Letters by next month, build on previ-ous work by Parfenova, Tchebakova, and col-leagues. In a 2011 study (http:// bit . ly/ Tchebakova- 2011) published in the same jour-nal, they predicted that by the end of the 21st century, 50%– 80% of central Siberia might have a climate suitable for agriculture, with traditional Siberian crops shifting north-ward by as much as 70 kilometers per decade. Soil conditions would put limits on farming, but the warmer climate might allow the intro-duction of crops such as rice, beans, and Euro-pean grapes.
“The population density may increase by threefold under one scenario,” Parfenova told Eos. “But this is just the potential. It doesn’t mean people will necessarily go there. There are no railways, and infrastructure is poor. I have some doubts because nobody will know when the permafrost will melt. Maybe this territory will transform into a big bog. But it will be better than now because the severe winter cold will be milder.”
Permafrost Wild CardThe “big bog” scenario, thawing of the perma-frost, represents a potential wild card in this
makeover of Siberia. Scientists believe that permafrost is holding some 1400 gigatons of carbon globally, more than twice the amount of carbon currently in the atmosphere.
As the permafrost melts, it could release greenhouse gases such as methane into the atmosphere, enhancing the effects of warming. However, as forests push northward into tun-dra areas, they will act as a carbon sink, poten-tially slowing the effect, the researchers said.
Permafrost thawing can lead to land subsid-ence, which can undermine the foundations for and ultimately destroy roads, bridges, and other infrastructure needed by settlers. “The potential threefold increase in population by the 2080s will depend also upon infrastructure development and other socioeconomic fac-tors,” Pavel Groisman told Eos. He is a North Carolina State University research scholar at the National Centers for Environmental Information in Asheville and was a convener of the poster session of the joint conference at which the study was presented.
“The authors are careful to mention that the climate and environmental changes in Siberia will provide changes in ecological landscape potential,” added Groisman, who is also a project scientist at the Northern Eurasia Earth Science Partnership Initiative. “Future socioeconomic development of northern Asia will show if this ELP materializes into popula-tion growth or not.”
By Tim Hornyak (email: timothyhornyak@ gmail . com; @robotopia), Science and Technology Jour-nalist
10 // Eos September 2017
NEWSNEWS
M any researchers around the world use a digital representation of Earth’s land, water, and air known as the
Community Earth System Model (CESM) to mimic and predict the evolution of our plan-et’s climate. To enable those climate modelers to simulate global climatic behavior with ever greater precision and fidelity, scientists who work to improve CESM had been expected to unveil the model’s next major release, CESM2, at a workshop (http:// bit . ly/ CESM - 2017) in Boulder, Colo., this past June.
It didn’t happen. Instead, the workshop transformed from a debut to an effort by the model’s developers to figure out why the enhanced model fails to replicate an import-ant temperature trend during a 20-year stretch in the middle of the past century. Although observations show that global tem-peratures steadily rose during that mid- 20th century period (as they continue to do today), the new model finds that they edged down-ward by some 0.2°C or 0.3°C during that per-plexing 2- decade period.
“We feel really, really good about the new model,” said Jean- François Lamarque, an atmospheric chemist at the National Center for Atmospheric Research ( NCAR) in Boulder and the chief scientist behind CESM. “Which
is also the really frustrating part—it feels really good, but then there is something keeping us from giving it to people in the research community.”
Aerosol Effects SurpriseThe discrepancy arose when the model’s developers added a mathematical function that calculates aerosols’ effects on cloud for-
mation, said Richard Neale, an NCAR project scientist who works on atmospheric compo-nents of CESM. The added function, he said, “accounts for things like emissions off the coast of Southeast Asia” and in mainland China. For example, “Beijing often has these ‘brownouts’ where you can’t see farther than 3 feet in front of your face, and those emis-sions impact clouds.” Those emissions
include aerosols like sulfate ions, which form from sulfur dioxide emitted from coal- fired power plants and other industrial processes, he explained. Sulfate particles can take up water and swell and, as a result, more strongly scatter incoming solar radiation. Some of this solar energy radiates back into space, which can cool the planet.
When the CESM team activated its simula-tion of the aerosol effect, “things went wrong,” Lamarque said. Neale suspects that the error may lie not within the climate mod-el’s software but in the estimates of aerosol emissions for the past 160 years. The mea-surements of emissions levels in the data sets may be too high, he speculated.
Software Bug or Flawed Observation Data?“It is yet to be determined whether a fix to the aerosol emission data sets will remedy the problem…or whether the cloud- aerosol mechanisms in the model could be too strong,” Neale said. Still, Lamarque added, working through such mismatches is a nor-mal part of how climate models evolve: “We do simulations, and when some things look bad, we’re like, ‘okay, for the next version, let’s fix it,’” he said.
When CESM2 launches, it will be a signifi-cant improvement over previous versions, Neale asserted. For instance, the revised model depicts precipitation more realistically than does the current version. In today’s CESM, rain or snow falls from a cloud to the ground instantaneously. That’s “not realistic, of course, as rain and snow do not fall at infinite speeds to the ground,” Neale said. The new version of the model accounts for how long it actually takes rain and snow to fall from cloud to ground.
After the problem with the cloud- aerosol effect gets straightened out, the model will better reflect the physics of clouds as seen in the real world, Neale predicted. Cloud- aerosol interactions are “the big advance-ment that we put into the model over the past few years,” he noted.
As for the erroneous simulations plaguing that major addition? “We’re trying to get to the bottom of it,” Lamarque said.
By Lucas Joel (email: lucasvjoel@ gmail .com), Freelance Writer
Contrary Temperature Trend Stalls Upgraded Climate Model’s Debut
Working through such mismatches is a normal part of how climate models evolve.
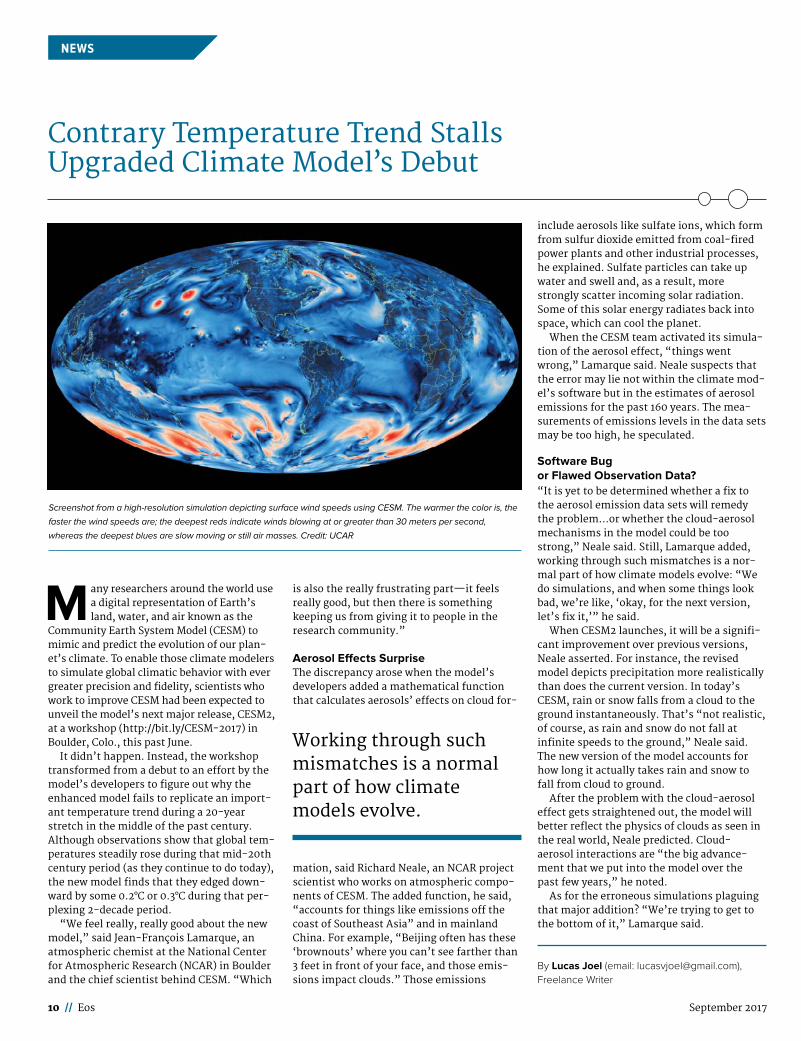
Screenshot from a high- resolution simulation depicting surface wind speeds using CESM. The warmer the color is, the
faster the wind speeds are; the deepest reds indicate winds blowing at or greater than 30 meters per second,
whereas the deepest blues are slow moving or still air masses. Credit: UCAR
Earth & Space Science News Eos.org // 11
TRIBUTE
Gerald J. “Jerry” Was-serburg, a
pioneer in the fields of geochemistry and cosmochemistry, died on 13 June 2016 at the age of 89. Wasserburg made fundamental and enduring contribu-tions to Earth and planetary sciences using the methods of isotope geochemistry and cosmochemistry.
Jerry was born in New Brunswick, N.J.
After enlisting in the U.S. Army and seeing combat in World War II, he graduated from high school and spent 2 years at Rutgers University in New Jersey. Following the advice of Henri Bader, he transferred to the University of Chicago, where he obtained a B.S. in physics in 1951, an M.S. in geology in 1952, and a Ph.D. under H. C. Urey and M. G. Inghram III in 1954. His Ph.D. thesis was on the branching ratio of potassium- 40 decay, an essential step in the development of potassium- argon ( K- Ar) age dating.
Jerry joined the faculty of the California Institute of Technology (Caltech) in 1955 as a professor of geology and geophysics and retired from that position in 2001. He initially focused his research on the search for now extinct iodine- 129 (129I) in meteorites and on problems in rubidium- strontium ( Rb- Sr) and uranium- lead ( U- Pb) geochronology. He published a classic paper on the duration of nucleosynthesis based on Reynold’s discovery of 129I. He was the first to recognize the sig-nificance of the difference of Earth’s potas-sium/ uranium (K/ U) ratio from that measured in primitive meteorites and the implications for the thermal history of the Earth.
Lunatic AsylumJerry’s signature approach was to improve chemical separation and mass spectrometric methods for isotopic measurements. He led the way for these developments, and the Caltech laboratory he established in the late 1960s in anticipation of lunar sample returns set the standard for the field. In that lab,
Jerry built a mass spectrometer of extraordi-narily high precision, which he called Luna-tic I. He dubbed the lab the “Lunatic Asy-lum.” His analytical contributions, combined with keen insight, led to a long line of discoveries and developments.
One of the first of those results was the measurement of the initial ratio of strontium- 87 to strontium- 86 (87Sr/ 86Sr) for the solar system on the basis of meteorites that we now believe are samples of basaltic lavas from the asteroid Vesta. This value is still in use and is essential for any considerations of planetary evolution based on the Rb- Sr system.
Solar System Clues in a MeteoriteIn 1969, when the meteorite Allende fell in Mexico, Jerry rushed to the field to collect pieces of it. His studies led to the discovery that short- lived radioactive aluminum- 26 was present in the early solar system. This finding required that fresh nucleosynthetic material had been injected into the solar sys-tem’s parent molecular cloud. Jerry also found anomalies that made it clear for the first time that materials that now make up the terres-trial planets and asteroid belt did not all form by condensation from a hot solar gas.
These extraordinary results were followed by the discovery that palladium- 107 had been present in the early solar system. Research following up on these discoveries from the late 1970s and early 1980s is con-tinuing today at full pace.
Concurrently, Jerry continued to pursue research on the implications of long- and short- lived radionuclides for the evolution of the Milky Way and showed that long- lived chronometers date the mean age of the uni-verse. Work by him and his colleagues on the U- Pb isotopic system in lunar samples, together with Rb- Sr and K- Ar data, led Jerry to propose that about 3.9 billion years ago the frequency of impacts on the Moon rose sharply, an intensification he described as a “terminal lunar cataclysm.” There is now evidence that this event, referred to today as the Late Heavy Bombardment, affected the entire inner solar system.
Golden Age of ApolloThe Apollo space program provided a golden age for planetary science and isotope cos-mochemistry. Jerry identified and mentored
many talented scientists in the Lunatic Asy-lum during those years, and his group gen-erated an impressive cascade of publications that are a testament to Jerry’s imagination, inspiration, drive, uncompromising dedica-tion to high- quality data, and ability to choose exciting and important scientific problems. Jerry also helped to ensure that the last two Apollo missions proceeded as planned and included science.
From Earth’s Interior to Its Ancient ClimateIn the mid- 1970s a major focus of Jerry’s laboratory was the development of the samarium- neodymium isotopic system. This system forms the cornerstone of the part of modern geochemistry devoted to understanding the chemical evolution of Earth’s interior. A later important contribu-tion was to point out that helium isotope variations are consistent with a deep primi-tive reservoir in Earth.
Jerry was also the first to develop rhenium- osmium ( Re- Os) and thorium- 230 (230Th) measurements by thermal ionization mass spectrometry. The Re- Os technique resulted in a method for mapping the age structure of the subcontinental lithospheric mantle and age dating of black shales. The 230Th technique has led to enormous advances in the field of paleoclimatology.
Honored PioneerJerry received many prestigious honors. In 1978, he was awarded the V. M. Goldschmidt Medal, now called the V. M. Goldschmidt Award, which is the highest honor of the Geochemical Society. In 1984, AGU selected him as the first recipient of its Harry H. Hess Medal. In 1986, he was jointly awarded, with Claude Allègre, the Crafoord Prize for his pioneering work on isotope geology, the top honor given by the Royal Swedish Academy of Sciences to geoscientists. AGU recognized Jerry again in 2008 with the William Bowie Medal, its highest honor.
Jerry’s extensive efforts over 60 years defined the fields of isotope geochemistry and cosmochemistry and contributed substantially to the fields of space and planetary sciences.
By Stein B. Jacobsen (email: jacobsen@ neodymium . harvard . edu), Department of Earth and Planetary Sciences, Harvard University, Cambridge, Mass.; Dimitri A. Papanastassiou, Division of Geological and Planetary Sciences, California Institute of Technology, Pasadena; and Donald J. DePaolo, Department of Earth and Planetary Science, University of California, Berkeley
Gerald J. Wasserburg ( 1927– 2016)
A detail from a portrait
of Gerald Wasserburg.
Credit: Painting, and
photo of it, by John A.
Wood.

12 // Eos September 2017
MEETING REPORT
H eadwater streams are the largest inter-face between land and water and make up the majority of global river habitats.
Understanding the hydrology and ecology of small streams is therefore critical to protect-ing aquatic ecosystems and ensuring human water security.
However, headwater streams experience huge swings in water flow, temperature, and chemistry. This fluctuation makes it difficult to predict carbon and nutrient fluxes on the basis of characteristics of the land that head-water streams drain. Predicting stream behav-ior is further complicated by the sheer number of headwaters and the prohibitive cost of high- frequency water quality monitoring.
To discuss how new and old water quality data can help scientists to better understand headwater streams, researchers gathered for a 2- day international workshop in France in March. The workshop was funded by the Earth Sciences and Astronomy Observatory of Rennes (OSUR) and the French Continents and
Coasts Initiative (EC2CO). Both programs are part of the French National Center for Scien-tific Research (CNRS).
Specifically, workshop participants addressed the following questions:
• How can researchers integrate multiple, nonuniform data sources such as occasional sampling of multiple points in the stream, high- frequency time series, and agency water quality data?
• What are the limits to extrapolating high- frequency data from a single catchment?
• What scaling tools can address manage-ment issues and improve hypothesis testing?
Working groups developed synthesis papers before and during the meeting on the follow-ing topics:
• relationships between water chemistry and water discharge across spatial and tempo-ral scales
• long- term changes in seasonality as indicators of ecosystem health and efficacy of management actions
• optimizing water quality monitoring designs
• synchrony and stationarity of headwater catchment chemistry
• novel modeling techniques to link hydrology with biogeochemistry
One recurrent discussion point was that current water quality monitoring schemes and regulatory frameworks are often a conse-quence of historical priorities and choices rather than of contemporary needs. For exam-ple, current monitoring designs capture annual loads from large catchments relatively well, but because of bias in temporal and spa-tial sampling they cannot identify problem times and locations through the stream net-work. If water quality targets are not ecologi-cally relevant or if monitoring designs are not able to evaluate compliance, they are unlikely to usefully inform management efforts.
Time lags are another major challenge because improved management may take decades to improve performance. Partici-pants discussed the effectiveness of regula-tory goals, the likelihood of interventions reaching those goals, and how monitoring frameworks could better integrate basic research.
In addition to participants writing a review paper about regulation and management, other papers and proposals resulting from this meeting will cover emergent properties in water quality variance; the characteriza-tion, classification, and prediction of solute variability in catchments; and new metrics of water quality data.
To overcome some of the challenges and apprehensions associated with interdisciplin-ary research, meeting participants will pre-pare a commentary article consisting of two letters that will be submitted to an appropri-ate journal. The first letter will be written by hydrologists to aquatic ecologists; the second letter will be addressed in the reverse direc-tion. The letters will explore what disciplinary differences prevent these scientists from working together. Specifically, what does the other side get wrong, what is intimidating or confusing about the other science, and what can each camp offer their colleagues across the stream?
Additional photos and a list of participants are available on the OSUR website (http:// bit . ly/ OSURMarch2017mtg).
By Benjamin W. Abbott (email: benabbo@ gmail . com), Earth and Environmental Sciences, Michigan State University, Lansing; Gilles Pinay, French National Center for Scientific Research (CNRS), University of Rennes 1, Rennes, France; and Tim Burt, Durham University, Durham, U.K.
Protecting Water Resources Through a Focus on Headwater StreamsWhere Land Becomes Stream: Connecting Spatial and Temporal Scales to Better Understand and Manage Catchment EcosystemsRennes, France, 7– 8 March 2017
Headwater streams like this one in Brittany, France, make up most of the interface between land and water and are
important habitats across the globe. They respond quickly to changes in precipitation, experiencing huge swings in
water flow and water chemistry. Urbanization and agriculture alter stream ecology with nutrient-rich runoff, and physi-
cal modifications change hydrological behavior. Participants at a recent meeting sought to characterize these effects.
Credit: G. Pinay

Eos.org // 13
OPINION
Earth & Space Science News
A lmost all areas of the sciences use models to study and predict physical phenomena, but predictions and con-
clusions are only as good as the models on which they are based. The statistical assess-ment of errors in model prediction and model estimation is of fundamental importance. Recent reports of the Intergovernmental Panel on Climate Change (IPCC; see http:// www . ipcc . ch), for example, present and interpret several commonly used estimates of average error to evaluate and compare the accuracies of global climate model simula-tions [Flato et al., 2013].
One recently developed model evaluation metrics package (http:// bit . ly/ PCMDI - metrics) similarly assesses, visualizes, and compares model errors [Gleckler et al., 2016]. This package also evaluates the most com-monly reported measure of the average dif-ference between observed and predicted val-ues: the root- mean- square error (RMSE).
We contend, however, that average- error measures based on sums of squares, includ-ing the RMSE, erratically overestimate aver-age model error. Here we make the case that
using an absolute value– based average- error measure rather than a sum- of- squares- based error measure substantially improves the assessment of model performance.
Error MeasuresOur analyses of sum- of- squares- based average- error measures reveal that most models are more accurate than these mea-sures suggest [Willmott and Matsuura, 2005; Willmott et al., 2009]. We find that the use of alternative average- error measures based on
sums of the absolute values of the errors (e.g., the mean absolute error, or MAE) cir-cumvents such error overestimation.
At first glance, the distinction between average- error measures based on squared versus absolute values may appear to be an arcane statistical issue. However, the erratic overestimation inherent within sum- of- squares- based measures of average model estimation error can have important and long- lasting influences on a wide array of decisions and policies. For example, policy makers and scientists who accept the RMSEs and related measures recently reported by the IPCC [Flato et al., 2013] are likely to be under-estimating the accuracy of climate models. If they assessed error magnitude– based mea-sures, they could place more confidence in model estimates as a basis for their decisions.
Absolute ValuesOur recommendation is to evaluate the mag-nitude (i.e., the absolute value) of each dif-ference between corresponding model- derived and credibly observed values. The sum of these difference magnitudes is then divided by the number of difference magni-tudes. The resulting measure is the MAE.
In effect, MAE quantifies the average mag-nitude of the errors in a set of predictions without considering their sign. Similarly, the average variability around a parameter (e.g., the mean) or a function is the sum of the magnitudes of the deviations divided by the number of deviations. This measure is com-monly referred to as the mean absolute devi-ation (MAD).
An Inconsistent RelationshipThe RMSE has an inconsistent relationship with the MAE [Willmott and Matsuura, 2005]. It is possible, for example, for RMSE to increase at the same time that MAE is decreasing, that is, when the variability among squared error elements is increasing while the sum of the error magnitudes is decreasing.
At the same time, squaring each error often alters—sometimes substantially—the relative influence of individual errors on the error total, which tends to undermine the interpretability of RMSE. Although the lower limit of RMSE is MAE, which occurs when all of the errors have the same magnitude, the upper limit of RMSE is a function of both MAE and the sample size (√n × MAE) and is reached when all of the error is contained in a single data value [Willmott and Mat-suura, 2005].
An important lesson is that RMSE has no consistent relationship with the average of the error magnitudes, other than having a lower limit of MAE.
Climate and Other Models May Be More Accurate Than Reported
Squaring each error often alters—sometimes substantially—the relative influence of individual errors on the error total.
Temperature anomalies (deviations from the 1981– 2010 monthly mean in degrees Celsius) estimated from advanced
microwave sounding unit data for February 2016. Estimates of their spatially averaged magnitude, using sum- of-
squares- based average- deviation measures, such as the root- mean- square or standard deviation, would erratically
overestimate their true spatially averaged magnitude. Data are from the National Space Science and Technology Cen-
ter, University of Alabama in Huntsville.

14 // Eos September 2017
OPINION
An Example Using Precipitation DataWe illustrate the inconsistent relationship between RMSE and MAE by appraising errors associated with the spatial interpolation of monthly precipitation totals, evaluated over 5 years, at locations across South America (Figure 1).
As noted above, the RMSE is always greater than or equal to the MAE. Thus, in Figure 1, points lie above or on the diagonal line repre-senting the case where RMSE is equal to MAE.
But an infinite number of RMSEs can be asso-ciated with one value of MAE. As a result, when researchers report one or more values of RMSE without their corresponding MAEs and sample sizes, as is usually the case, it is nearly impossible to interpret them meaningfully or
to make useful com-parisons among the RMSEs.
It is important to note that RMSE tends to increase with vari-ability, as illustrated at some locations closer to the equator that tend to have higher precipitation magnitudes (and variability) and therefore larger dif-ferences between RMSE and MAE (Fig-ure 1). Furthermore, RMSE often increases with increasing geo-graphic area and/or time period being analyzed because larger sampling domains are more likely to contain greater numbers of outliers [Willmott and Matsuura, 2006].
In short, by sum-ming the squares of errors, RMSE is dis-proportionately amplified by outliers, giving them more weight than they
may deserve. MAE, on the other hand, gives each error the natural weight of its magnitude.
Interpreting Average- Error MeasuresDrawing from long- accepted statistical prac-tices, the average- error or average- deviation measures that are most often computed, interpreted, and reported are based on sum- of- squares errors or deviations. The RMSE and the standard deviation are well- known exam-ples.
Nevertheless, we concur with J. S. Arm-strong, who after assessing a number of fore-cast evaluation metrics warned practitioners, “Do not use Root Mean Square Error” [Arm-strong, 2001]. Only in rare cases, when the underlying distribution of errors is known or can be reliably assumed, is there some basis for interpreting and comparing RMSE values.
More broadly, comparable critiques can also be leveled at sum- of- squares- based measures of variability, including the standard deviation and standard error [Willmott et al., 2009]. Their roles should be limited to probabilistic assess-ments, such as estimating the sample stan-dard deviation as a parameter in a Gaussian distribution.
Losing the AmbiguitiesIn view of the inconsistent relationship between RMSE and MAE, we argue that com-paring the performance of competing models by comparing their RMSEs lacks merit.
Because of the ambiguities that are inherent within commonly used sum- of- squares error measures, such as the RMSE, we encourage scientists to no longer evaluate and report them as average- error measures. Instead, researchers should evaluate, interpret, and report values of the mean absolute error or the mean absolute deviation and the sample size.
It remains essential for researchers to go beyond statistical summaries and to present and interpret visualizations of the errors and error distributions to allow for a full and accu-rate assessment of model performance. But as we increasingly seek to convey climate data and projections to policy makers, let’s use MAE and related measures [e.g., Willmott et al., 2015] to help them evaluate the relative accu-racy of the information.
AcknowledgmentsSeveral of the concepts discussed here were previously considered by Willmott and his graduate students, including David Legates, who was an early proponent of error magnitude– based average- error measures. We are also indebted to P. W. Mielke Jr. for his innovative work on distance function statistics.
ReferencesArmstrong, J. S. (2001), Evaluating forecasting methods, in Principles
of Forecasting: A Handbook for Researchers and Practitioners, edited by J. S. Armstrong, pp. 443– 472, Springer, New York.
Flato, G., et al. (2013), Evaluation of climate models, in Climate Change 2013: The Physical Science Basis—Contribution of Working Group I to the Fifth Assessment Report of the Intergovernmental Panel on Climate Change, chap. 9, pp. 741– 866, edited by T. F. Stocker et al., Cambridge Univ. Press, Cambridge, U.K.
Gleckler, P. J., et al. (2016), A more powerful reality test for climate models, Eos, 97, https://doi . org/10 . 1029/ 2016EO051663.
Matsuura, K., and C. J. Willmott (2015), Terrestrial precipitation: Gridded monthly time series ( 1900– 2014) (Version 4.01), http:// climate . geog . udel . edu/ ~ climate/ html _ pages/ Global2014/ README . GlobalTsP2014 . html.
Willmott, C. J., and K. Matsuura (2005), Advantages of the mean abso-lute error (MAE) over the root mean square error (RMSE) in assess-ing average model performance, Clim. Res., 30, 79– 82, https:// doi . org/ 10 . 3354/ cr030079.
Willmott, C. J., and K. Matsuura (2006), On the use of dimensioned measures of error to evaluate the performance of spatial interpo-lators, Int. J. Geogr. Inf. Sci., 20(1), 89– 102, https:// doi . org/10 . 1080/ 13658810500286976.
Willmott, C. J., K. Matsuura, and S. M. Robeson (2009), Ambiguities inherent in sums- of- squares- based error statistics, Atmos. Environ., 43(3), 749– 752, https:// doi . org/10 . 1016/j . atmosenv . 2008.10.005.
Willmott, C. J., et al. (2015), Assessment of three dimensionless mea-sures of model performance, Environ. Modell. Software, 73, 167– 174, https://doi . org/10 . 1016/j . envsoft . 2015 . 08 . 012.
By Cort J. Willmott, Department of Geography, University of Delaware, Newark; Scott M. Robe-son (email: srobeson@ indiana .edu), Department of Geography, Indiana University, Bloomington; and Kenji Matsuura, Department of Geography, University of Delaware, Newark
Fig. 1. This plot shows values of the mean absolute error (MAE) and corresponding val-
ues of the root- mean- square error (RMSE) associated with the spatial interpolation of
monthly precipitation totals (in millimeters per month) using station data from South
America [Matsuura and Willmott, 2015]. In this assessment, the observed monthly pre-
cipitation at each station was excluded, and its value was interpolated (predicted) from
available same- month data from surrounding stations. For the calculation of the MAE
and RMSE, each monthly interpolation error is the difference between the observed
value and the corresponding interpolated value at the station. The inset map of South
America shows the station locations, while the vertical color scale indicates their lati-
tude. The plot illustrates the erratic way in which RMSE overestimates the true average-
error magnitude.
Summing the squares of errors disproportionately amplifies outliers.

Earth & Space Science News Eos.org // 15
Flood Damage Survey and Assessment: New Insights from Research and Practice
Editors: Daniela Molinari, Scira Menoni, and Francesco Ballio
Climate Extremes: Patterns and MechanismsEditors: S.-Y Simon Wang, Jin-Jo Yoon, Christopher C. Funk, and Robert R. Gillies
Fault Zone Dynamic Processes: Evolution of Fault Properties During Seismic Rupture
Editors: Marion Y. Thomas, Thomas M. Mitchell, and Harsha S. Bhat
Water-Energy-Food Nexus: Principles and PracticesEditors: P. Abdul Salam, Sangam Shrestha, Vishnu Prasad Pandey, and Anil K. Anal
NEW BOOKS FROM AGU
AGU members receive 35% off all Wiley books Log in with your AGU ID to get the discount code
publications.agu.org/books
Read interviews with the books’ editors
eos.org/editors-vox

16 // Eos September 2017
OPINION
A s the saying goes, when no one is talking about money, you can be sure that it’s really all about money. We
assume that organizations involved in schol-arly communication, primarily publishing and conferences, aim foremost to share and pro-mote good research. However, journals and meetings are big business, and financial via-bility is a key concern. This inherent conflict of interest, as highlighted in an Editors’ Vox post that published in June (see http:// bit . ly/ COFI - vox), deserves more attention and awareness.
Unfortunately, as open- access publishing has expanded, some people have realized that they can profit from scholarly communica-tion while shirking quality. Recent news sto-ries, stings, and probes have revealed prac-tices ranging from mild deception to serious fraud.
Unscrupulous journals have been caught accepting nonsense papers, placing scientists on editorial boards without their knowledge, falsely implying that they provide certain editorial processes such as indexing content, and manipulating journal metrics. In other cases, copycat journals have mimicked genuine journals by adopting almost identical titles (perhaps with just one word different)
and logos with minor variations. In addition, some predators charge authors for services, such as editing or translation, that may lack quality and rigor.
Predatory meetings have also been on the rise, offering participants opportunities to present a paper at an “international confer-ence” followed by rapid publication in confer-ence proceedings, neither of which pan out.
Books have fallen victim to this trend as well, compounded by the fact that in book publishing, the relatively few standards and greater variability around indexing, formats, distribution, author fees, and royalties leave more room for deception.
These scams have victimized some innocent people. On the other hand, some authors or presenters have gone along with the shoddy practices of illicit journals and meetings to achieve goals such as proving publication in an international journal for a tenure application.
Supporting the Integrity of ScienceDuring the past decade, many publishers have been developing practices to secure the schol-arly literature that forms the record of scien-tific knowledge and progress, even more so as electronic publishing has evolved. These prac-tices include providing for secure archives; supporting widespread indexing (e.g., in GeoRef); developing and expanding links and identifiers to other papers (such as Digital Object Identifier (DOI) numbers), underlying data, funding information, people, and sam-ples; enriching papers online in multiple for-mats; opening references and supplements for data mining; and more.
Publishers have also helped to develop and aid organizations and initiatives that support this record of knowledge, such as CrossRef, which registers the DOIs that enable citation linking across publishers; Open Researcher and Contributor ID (ORCID), which assigns persistent digital identifiers to individual researchers; the Clearinghouse for the Open Research of the United States (CHORUS), which provides public access to peer- reviewed publications that report on federally funded research; Portico, an electronic archiving ser-vice; and the National Information Standards Organization (NISO), which sets industry standards for the United States.
Some of the publishers that engage in fraudulent activities participate less or not at all in supporting this larger infrastructure around research integrity. They also don’t promote best practices (although some will say they do). Of broader concern is that the growth of predatory publishers erodes the integrity of the whole of publishing, and open- access journals in particular. These unethical actors and their growth normalize irresponsible and illegal behavior surrounding scholarly communication. Recent surveys support this concern.
What Can You Do?Distinguishing opportunities associated with legitimate journals or conferences from unprincipled come- ons can be a challenge. Although hallmarks of predatory publishers include actively soliciting papers and promis-ing rapid publication, many mainstream pub-lishers, such as AGU, do the same. Whereas illicit journals often offer low publication costs, some high- quality, open- access jour-nals similarly offer free submissions to
Avoiding Predators in Publishing
iSto
ck.c
om/ R
asm
us- R
aaha
uge
As open- access publishing has expanded, some people have realized that they can profit from scholarly communication while shirking quality.
Earth & Space Science News Eos.org // 17
authors, thanks to support from foundations or institutions. So how do you separate bona fide solicitations for journal articles, book pro-posals, or conference papers from those that are not? In addition to carrying out your own search about a publisher to assess factors such as quality, discoverability, and indexing, here are some other suggestions.
Refer to blacklists and white lists (although neither are infallible)
• Until recently, Jeffrey Beall, a librarian in Colorado, kept a list of predatory journals and publishers. His list of suspects grew by several hundred each year, documenting the worsen-ing problem. Although the list drew criticism for including some legitimate publishers and others that have improved their practices, the list could serve as a starting point for further scrutiny. The site with the list shut down in early 2017, but an archive remains (see http:// bit .ly/ Beall - archive). However, it will become less useful due to a lack of updates. Beall recently published an article giving his over-view of the history of predatory publishers (see http:// bit .ly/ Beall - article) as part of a special issue on predatory publishing in the journal Biochemia Medica.
• Several organizations evaluate how well publishers meet particular standards. For example, the Directory of Open Access Jour-nals provides a list of vetted open- access publishers. Clarivate (formally Thomson Reuters) now runs the Web of Science, which also provides a list of vetted journals. How-ever, its vetting process, which is neither transparent nor public, takes time, so newer journals from legitimate publishers may not be included for several years. Meanwhile,
Cabell’s Directories, which aims to list repu-table outlets for publication, has launched a reevaluation initiative since the removal of Beall’s list, with new, more stringent criteria (their selection policy is public).
Talk to your librarian and colleagues
• Check with your department or institu-tional librarian. Many closely follow scholarly publishing developments, including open- access journals, and are obviously invested in assessing subscription journals. They are an exceptional and generally underused resource in helping authors throughout the publishing process.
• Look for your colleagues on editorial boards, and check with them that their journal listing is legitimate. AGU editors, for example, welcome inquiries regarding potential sub-missions.
Support best practices and good governance
• Look for journals that follow best prac-tices in scholarly publishing. Give them your support, promote them, and help them develop.
• Get acquainted with governance prac-tices. In the Earth and space sciences, many of the leading society publishers provide open governance around journals and pub-lishing. At AGU, for example, the organiza-tion’s Publications Committee and its jour-nals’ editors in chief oversee publications operations. AGU’s Council and Board of Directors set key policies. This structure provides for input from members, authors, and reviewers.
A Community-Wide ChallengeThe number of predatory publishers is increasing, and the types of fraudulent behav-ior are expanding. This issue will likely persist for the foreseeable future. The scientific com-munity must respond collectively, with a focus on raising awareness among authors (includ-ing students and early- career researchers), readers, editors, and librarians.
You can set an example through your choices of where you submit and review papers and where you volunteer your publications- related time and effort. Many researchers approach publishing by focusing solely on their own interests and career devel-opment. However, becoming more aware of best practices in publishing and supporting publishers that foster those practices will help strengthen the integrity of science, as you provide visibility and credibility for your own scientific work.
By Brooks Hanson (email: bhanson@ agu . org), Senior Vice President, Publications, AGU; and Jenny Lunn, Program Director, Publications, AGU
The scientific community must respond collectively, with a focus on raising awareness among authors, readers, editors, and librarians.
OPINION

September 201718 // Eos
By Shane J. Cronin, Marco Brenna, Ian E. M. Smith, Simon Barker, Manuela Tost, Murray Ford, Sisi Tonga’onevai, Taaniela Kula, and Rennie Vaiomounga

In late December 2014, an undersea volcano erupted between two small islands in the Tonga volcanic arc northeast of New Zealand, sending steam and dense ash plumes high into the air. By the time the erup-tion ended, about 5 weeks later, a new island had formed, eventually bridging the gap between the orig-
inal islands. Winds and ocean waves then began rapidly reshaping the newly emerged volcanic cone.
Ten months after the eruption, we visited the new land-mass, which we unofficially nicknamed Hunga Island. There, we attempted to characterize the volcanology of the eruption, begin tracking the rate of erosion on the new island, and assemble a history of volcanism in this region of the southwestern Pacific Ocean. Our findings reveal a shallow submarine volcanic caldera adjacent to the new volcanic island, and they highlight how incomplete the volcanic record can be at remote oceanic volcanoes.
Signs of EruptionThe uninhabited islands of Hunga Tonga and Hunga Ha‘apai lie 65 kilometers north of Nuku‘alofa, the capital city of the Kingdom of Tonga. Between 19 December 2014 and 28 January 2015, residents of Nuku‘alofa witnessed several large volcanic plumes rising from an eruption in the direction of the two islands [Global Volcanism Program, 2015].
The plumes were the result of an explosive interaction between seawater and magma rising from a plateau about 150 meters below the ocean surface. The plateau is part of Hunga, a massive, submerged volcanic edifice that rises more than 2000 meters from the surrounding seafloor, and is the site of volcanic activity as recently as 1988 and 2009 [Global Volcanism Program, 2009].
The 2014– 2015 Hunga eruption deposited material between the islands of Hunga Tonga and Hunga Ha‘apai, initially creating an isolated third island before connecting with Hunga Ha‘apai. In less than 3 weeks, the eruption
A recent volcanic eruption near Tonga in the southwestern Pacific
Ocean created a new island, giving scientists a rare opportunity to
explore the volcanic record of this remote region.
A newly formed volcanic cone between the Tonga islands of Hunga
Tonga and Hunga Ha‘apai erupts on 15 January 2015, releasing dense,
particle- rich jets from the upper regions and surges of water- rich mate-
rial around the base. The monthlong Hunga eruption created a new
island that is now the subject of study and promises to reveal new
aspects of the region’s explosive volcanic past. Credit: New Zealand
High Commission, Nuku’alofa, Tonga
Eos.org // 19Earth & Space Science News

September 201720 // Eos
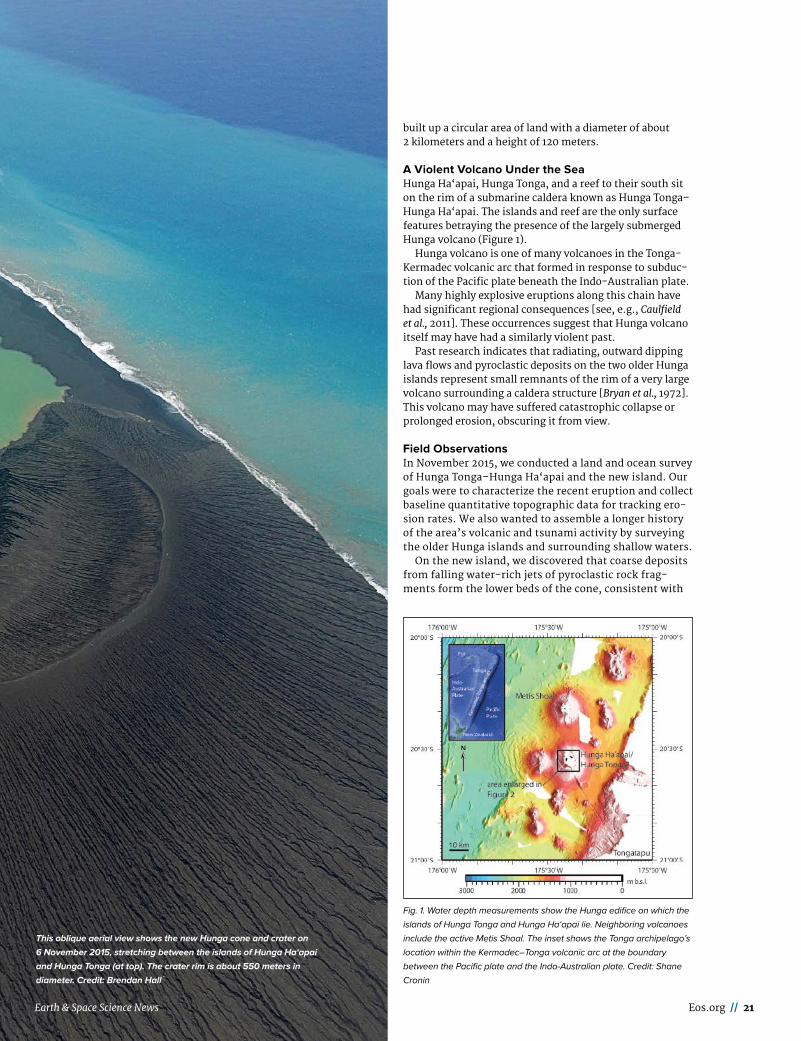
Eos.org // 21
built up a circular area of land with a diameter of about 2 kilometers and a height of 120 meters.
A Violent Volcano Under the SeaHunga Ha‘apai, Hunga Tonga, and a reef to their south sit on the rim of a submarine caldera known as Hunga Tonga– Hunga Ha‘apai. The islands and reef are the only surface features betraying the presence of the largely submerged Hunga volcano (Figure 1).
Hunga volcano is one of many volcanoes in the Tonga- Kermadec volcanic arc that formed in response to subduc-tion of the Pacific plate beneath the Indo- Australian plate.
Many highly explosive eruptions along this chain have had significant regional consequences [see, e.g., Caulfield et al., 2011]. These occurrences suggest that Hunga volcano itself may have had a similarly violent past.
Past research indicates that radiating, outward dipping lava flows and pyroclastic deposits on the two older Hunga islands represent small remnants of the rim of a very large volcano surrounding a caldera structure [Bryan et al., 1972]. This volcano may have suffered catastrophic collapse or prolonged erosion, obscuring it from view.
Field ObservationsIn November 2015, we conducted a land and ocean survey of Hunga Tonga– Hunga Ha‘apai and the new island. Our goals were to characterize the recent eruption and collect baseline quantitative topographic data for tracking ero-sion rates. We also wanted to assemble a longer history of the area’s volcanic and tsunami activity by surveying the older Hunga islands and surrounding shallow waters.
On the new island, we discovered that coarse deposits from falling water- rich jets of pyroclastic rock frag-ments form the lower beds of the cone, consistent with
Fig. 1. Water depth measurements show the Hunga edifice on which the
islands of Hunga Tonga and Hunga Ha‘apai lie. Neighboring volcanoes
include the active Metis Shoal. The inset shows the Tonga archipelago’s
location within the Kermadec– Tonga volcanic arc at the boundary
between the Pacific plate and the Indo- Australian plate. Credit: Shane
Cronin
This oblique aerial view shows the new Hunga cone and crater on
6 November 2015, stretching between the islands of Hunga Ha‘apai
and Hunga Tonga (at top). The crater rim is about 550 meters in
diameter. Credit: Brendan Hall
Earth & Space Science News

22 // Eos September 2017
videos and photos of the eruption in progress. Where waves have cut into the shoreline, the pyroclastic depos-its appear poorly consolidated and poorly sorted.
The upper part of the cone is steeper and reflects a gradual “drying” (decrease in water interaction with magma) of the eruption as it proceeded. This upper region is made up of thin, fine- grained beds of ash deposits, interspersed with ash- dominated sediments typical of lateral currents of particles, air, and steam.
The cone reached its maximum diameter by 7 January 2015 but continued to increase in height over the next 2 weeks. Once the vent was completely surrounded by pyroclastic deposits, much higher eruption columns began. Such Surtseyan eruptions—from a shallow sea or lake water—have only rarely been witnessed since the phenomenon was first seen during the formation of Surtsey, Iceland, in 1963 [Kokelaar, 1983].
Rilling of the island’s surface—forming dendritic ero-sion patterns—started during the cone growth, but it accelerated with rainfall once the eruption ceased. In addition, wave erosion began to rapidly attack the base of the island. Wave erosion was strongest on the south-ern side of the cone, exposed to the southeast trade winds and associated ocean swells. There, the island has shrunk by more than 500 meters from its initial posteruption shore, leaving 40- meter- high collapsing cliffs.
In the 2.5 years since its for-mation, the primary volcanic cone lost about 40% of its origi-nal footprint, which spanned roughly 8 square kilometers. However, the island has remained roughly the same in overall area because erosion has been matched by long- coast redisposition of the volcanic material in beach bars, altering the island’s shape.
Taking SamplesShortly after the eruption, we carried out a photogrammetric survey using a drone and real- time kinematic GPS control points to provide a baseline for future monitoring.
We collected samples to chem-ically characterize the new volca-nic material and compare it with deposits of the broader volcano. On the older Hunga Ha‘apai islands, we found welded pumice- rich ignimbrite units and non-welded pyroclastic flow deposits, laid down by superheated flows of gas and particles. Such deposits attest to past huge explosive eruptions from this long- lived volcano.
One pyroclastic flow deposit contained charcoal, which we dated to the period 1040– 1180 C.E. This deposit cor-relates closely in age and chemistry to ashfall deposits found on Tongatapu Island, 65 kilometers to the southwest [Cronin, 2015]. It also corresponds, within uncertainty bounds, to an unknown tropical eruption in 1108 C.E. that produced more than 1°C of global cooling [Sigl et al., 2015].
Seafloor MappingWe also mapped the seafloor surrounding the new island at a resolution of about 1 meter using a WASSP multibeam sounder.
The seafloor survey revealed a large closed depression to the south (Figure 2), consistent with the caldera postulated by Bryan et al. [1972]. The depression is approximately 150 meters deep and measures about 4 × 2 kilometers, with its northern and southern portions filled by younger volcanic deposits.
A broad, shallow area is associated with the 2009 erup-tions south of the island that formed in 2015 and a chain of cones that formed in 1988 to the southeast. Numerous other cones surround the rim of the caldera.
Fig. 2. A bathymetric sonar survey of the seafloor near the islands of Hunga Tonga and Hunga
Ha‘apai, conducted in November 2015, shows the summit platform of the submerged Hunga volcanic
edifice. The dashed black line outlines a previously undocumented caldera, which lies 150 to 180
meters below the surface. Traces of past eruptions along the caldera rim are clearly visible; the inset
gives the locations of the 1988 eruptions in greater detail. White areas represent depths greater than
200 meters, beyond the range of the sonar system. Credit: Simon Barker

Earth & Space Science News Eos.org // 23
The caldera likely formed when an older Hunga edifice collapsed violently into the sea. This collapse may be the source of the unknown South Pacific eruption about 1000 years ago.
Next StepsOur first observations highlight how rapidly new volcanic forms are eroded in this area and imply that the volcanic record in the Tonga region is extremely fragmentary. In future visits, we will continue investigating past eruptions while extending submarine surveys and sampling around the new island to monitor the ongoing changes in response to storms and other events.
AcknowledgmentsWe thank the Pacifi c Rose crew from Pacific Sunrise Fishing; Electronic Navigation Ltd., Auckland, for the WASSP sys-tem; and Lucy Meadows and Alex Holden of Icon Films, Bristol, U.K., for logistics assistance. This work was sup-ported by funds from the University of Auckland Faculty of Science and School of Environment.
ReferencesBryan, W. B., G. D. Stice, and A. Ewart (1972), Geology, petrography, and geochemistry
of the volcanic islands of Tonga, J. Geophys. Res., 77(8), 1566– 1585, https://doi . org/10 . 1029/JB077i008p01566.
Caulfi eld, J. T., et al. (2011), Mafi c Plinian volcanism and ignimbrite emplacement at Tofua volcano, Tonga, Bull. Volcanol., 73, 1259– 1277, https://doi . org/10 . 1007/ s00445-011-0477-9.
Cronin, S. J. (2015), Subaerial records of large- scale explosive volcanism and tsunami along an oceanic arc, Tonga, SW Pacifi c, Abstract V33B- 3090 presented at 2015 Fall Meeting, AGU, San Francisco, Calif., 14–18 Dec.
Global Volcanism Program (2009), Report on Hunga Tonga- Hunga Ha’apai (Tonga), Bull. Global Volcanism Network, 34(3), https://doi . org/10.5479/si . GVP . BGVN200903- 243040.
Global Volcanism Program (2015), Report on Hunga Tonga- Hunga Ha’apai (Tonga), Bull. Global Volcanism Network, 40(1), https://volcano . si . edu/ showreport . cfm ? doi = 10 . 5479/ si . GVP . BGVN201501 - 24304.
Kokelaar, B. P. (1983), The mechanism of Surtseyan volcanism, J. Geol. Soc. London, 140, 939– 944, https://doi . org/10 . 1144/gsjgs . 140 . 6 . 0939.
Sigl, M., et al. (2015), Timing and climate forcing of volcanic eruptions for the past 2,500 years, Nature, 523, 543– 549, https:// doi . org/10 . 1038/ nature14565.
Author InformationShane J. Cronin (email: [email protected]), Marco Brenna, Ian E. M. Smith, Simon Barker, Manuela Tost, and Murray Ford, School of Environment, University of Auckland, Auckland,New Zealand; and Sisi Tonga’onevai, Taaniela Kula, and Rennie Vaiomounga, Geology Unit, Natural Resources Division, Ministry of Lands and Natural Resources, Nuku‘alofa, Tonga
For a video of the Hunga Island eruption, view the onlineversion of this article at
http://bit.ly/ Eos _ volcanic -past.
Read it first on Could a Newfound Molecule on TitanBe a Building Block for Life?http://bit.ly/EOS_molecule
Sediment Cores Reveal Ocean Current’sPast Lifehttp://bit.ly/EOS_sediment
Cities Partner to Prepare for Natural Hazards and Climate Changehttp://bit.ly/EOS_prepare_nat_haz
Tracking River Flows from Spacehttp://bit.ly/EOS_river
Natural Resource Exploitation Could Reach New Depthshttp://bit.ly/EOS_depths
Climate Change Indicators Are Not Enoughhttp://bit.ly/EOS_indicators
Articles are published on Eos.org beforethey appear in the magazine.
Visit https://eos.org daily for the latest newsand perspectives.
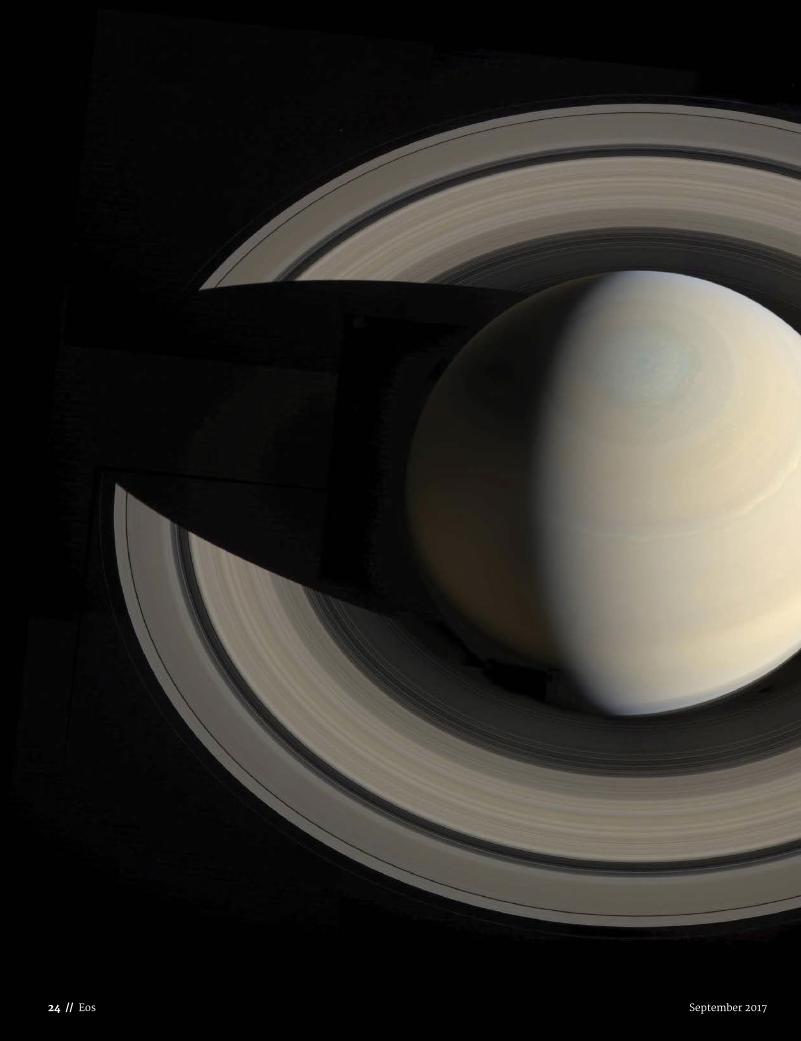
24 // Eos September 2017

Earth & Space Science News Eos.org // 25
As summer closes and children around the country gear up for a new school year, a mis-sion that fundamentally changed how we think of life in the universe moves deep into its winter. On 15 September, NASA’s Cassini spacecraft will plunge into Saturn’s atmo-
sphere and burn up, just weeks shy of its twentieth birth-day.
The Cassini- Huygens mission launched on 15 October 1997, carrying 12 scientific instruments and a 2- meter- wide saucer- shaped probe called Huygens to land on Sat-urn’s hazy moon Titan. With it launched a generation of scientific careers and scientists who dedicated more than a decade of their lives to combing through gigabytes of data to understand the gas giant, its rings, and its moons. And those schoolchildren? They have never known a world without Cassini- Huygens.
The mission itself was conceived in the 1980s, after the Pioneer and Voyager spacecraft sent back images and data from the Saturn system that left scientists wanting more. Cassini’s primary goal was simple: Explore Saturn and its
surroundings and teach us about the strange places we saw and the data we received during previous spacecraft ren-dezvous.
Cassini- Huygens did not disappoint. Since its arrival at Saturn in 2004, Cassini has traveled more than 3 billion kilometers in more than 200 orbits around Saturn. It has flown by Titan more than 100 times and the icy ocean moon Enceladus 23 times. And on 14 January 2005, when the Huygens probe touched down on Titan, the mission became the first to successfully drop a lander on an outer solar system moon.
Over the course of its travels, Cassini- Huygens has transmitted more than 300,000 raw images of the planet, its moons, and its rings. Caught in Cassini’s web, our imaginations were—and still are—ensnared by Titan’s murky methane lakes; Saturn’s vast, roiling storms; and, perhaps most important of all, the potential for life below Enceladus’s sheath of ice.
But soon Cassini’s exploration of Saturn’s neighborhood will end and with that the steady stream of images, data, and scenes of curious landscapes. For Linda Spilker, the
A PORTAL TO SATURNTEN NOTABLE FINDINGS FROM CASSINI- HUYGENS
By JoAnna Wendel
The soon-to-end NASA mission to Saturn changed the way we think of habitability
beyond Earth, opened our eyes to dynamics in the gas giant’s atmosphere, and more.
A portrait of Saturn created by layering 12 different images taken using different filters from Cassini’s imaging instruments. Credit: NASA/JPL-Caltech/
Space Science Institute/G. Ugarkovic

26 // Eos September 2017
Cassini- Huygens mission’s head scientist, Cassini’s end feels like a high school graduation. After the mission ends, she said, the Cassini team will disperse “and go all differ-ent directions. We’re going to take our knowledge that we’ve learned from Cassini and use that to go forward into the future for the next mission,” whatever that may be.
There are feelings of sadness, of course, she continued, but also of “tremendous pride in all that Cassini has accomplished.”
And those accomplishments pile high. Here are 10 nota-ble findings from data spanning the Cassini- Huygens mis-sion.
1 Cassini Revealed Enceladus’s Potentially Habitable Internal Ocean
In July 2005, mission scientists sent Cassini flying by Ence-ladus’s south pole. Enceladus, its ice- covered south pole gouged with deep crevasses, orbits within Saturn’s magnetic field. But the magnetic field acts strangely around Enceladus—it responds to the moon somewhat akin to how magnetic fields act around bodies with thin atmospheres. So researchers sent Cassini to look for that atmosphere.
What they found changed almost the entire focus of the mission. During that flyby, instruments detected water vapor and ice grains. These data, along with data showing that the south pole is warmer than the rest of Enceladus, tipped them off that Enceladus is geologically active. Then, in November, images returned to Earth displayed bright plumes of water and ice spewing from south pole cre-vasses.
Scientists were stunned. Enceladus doesn’t have an atmosphere. It hosts jets of water spewing out of its icy surface.
Intrigued, the team added 19 more Enceladus flybys; by mission’s end, Cassini had swung past the moon 23 times.
Through those flybys, scientists found that Enceladus’s ice shell encloses a global ocean. By sending the spacecraft through the fountains again and again, researchers detected sodium, water vapor, and organic molecules com-posed of oxygen, nitrogen, carbon, and hydrogen—mole-cules thought to be important for life. They even recently found molecular hydrogen in the plumes, which suggests that the ocean’s floor may host minerals reacting with hot water. Could these be hydrothermal vents, which on Earth teem with life?
“Cassini has shown that Enceladus satisfies almost all of the present criteria that define habitability,” said Hunter Waite, principal investigator on Cassini’s Ion and Neutral Mass Spectrometer and researcher at the Southwest Research Institute in San Antonio, Texas. Those criteria would be liquid water, organic molecules, and an energy source for microbes (the possible seafloor hydrothermal activity).
An illustration of NASA’s Cassini spacecraft at Saturn. The craft has trav-
eled more than 3 billion kilometers since its arrival at Saturn and down-
linked more than 300,000 raw images in the past 13 years. The Cassini-
Huygens mission launched in October 1997 and will end on
15 September, when the spacecraft dives into Saturn’s atmosphere.
Credit: NASA/JPL
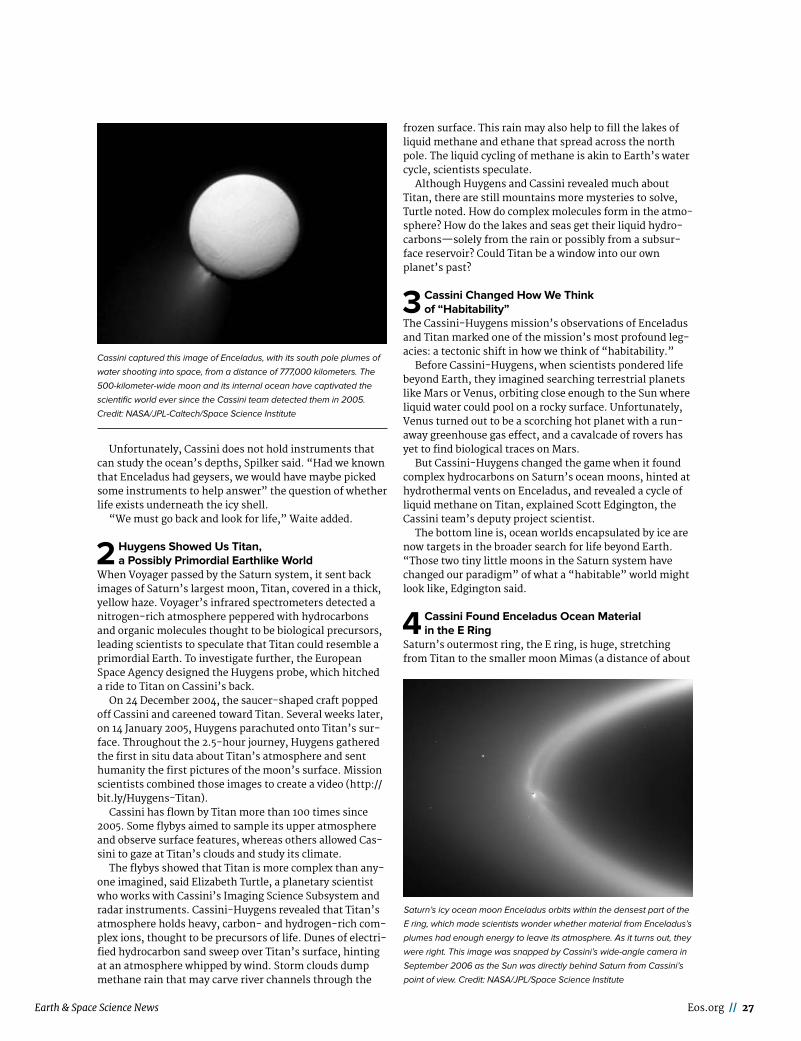
Earth & Space Science News Eos.org // 27
Unfortunately, Cassini does not hold instruments that can study the ocean’s depths, Spilker said. “Had we known that Enceladus had geysers, we would have maybe picked some instruments to help answer” the question of whether life exists underneath the icy shell.
“We must go back and look for life,” Waite added.
2 Huygens Showed Us Titan, a Possibly Primordial Earthlike World
When Voyager passed by the Saturn system, it sent back images of Saturn’s largest moon, Titan, covered in a thick, yellow haze. Voyager’s infrared spectrometers detected a nitrogen- rich atmosphere peppered with hydrocarbons and organic molecules thought to be biological precursors, leading scientists to speculate that Titan could resemble a primordial Earth. To investigate further, the European Space Agency designed the Huygens probe, which hitched a ride to Titan on Cassini’s back.
On 24 December 2004, the saucer- shaped craft popped off Cassini and careened toward Titan. Several weeks later, on 14 January 2005, Huygens parachuted onto Titan’s sur-face. Throughout the 2. 5- hour journey, Huygens gathered the first in situ data about Titan’s atmosphere and sent humanity the first pictures of the moon’s surface. Mission scientists combined those images to create a video (http:// bit .ly/ Huygens -Titan).
Cassini has flown by Titan more than 100 times since 2005. Some flybys aimed to sample its upper atmosphere and observe surface features, whereas others allowed Cas-sini to gaze at Titan’s clouds and study its climate.
The flybys showed that Titan is more complex than any-one imagined, said Elizabeth Turtle, a planetary scientist who works with Cassini’s Imaging Science Subsystem and radar instruments. Cassini- Huygens revealed that Titan’s atmosphere holds heavy, carbon- and hydrogen- rich com-plex ions, thought to be precursors of life. Dunes of electri-fied hydrocarbon sand sweep over Titan’s surface, hinting at an atmosphere whipped by wind. Storm clouds dump methane rain that may carve river channels through the
frozen surface. This rain may also help to fill the lakes of liquid methane and ethane that spread across the north pole. The liquid cycling of methane is akin to Earth’s water cycle, scientists speculate.
Although Huygens and Cassini revealed much about Titan, there are still mountains more mysteries to solve, Turtle noted. How do complex molecules form in the atmo-sphere? How do the lakes and seas get their liquid hydro-carbons—solely from the rain or possibly from a subsur-face reservoir? Could Titan be a window into our own planet’s past?
3 Cassini Changed How We Think of “Habitability”
The Cassini- Huygens mission’s observations of Enceladus and Titan marked one of the mission’s most profound leg-acies: a tectonic shift in how we think of “habitability.”
Before Cassini- Huygens, when scientists pondered life beyond Earth, they imagined searching terrestrial planets like Mars or Venus, orbiting close enough to the Sun where liquid water could pool on a rocky surface. Unfortunately, Venus turned out to be a scorching hot planet with a run-away greenhouse gas effect, and a cavalcade of rovers has yet to find biological traces on Mars.
But Cassini- Huygens changed the game when it found complex hydrocarbons on Saturn’s ocean moons, hinted at hydrothermal vents on Enceladus, and revealed a cycle of liquid methane on Titan, explained Scott Edgington, the Cassini team’s deputy project scientist.
The bottom line is, ocean worlds encapsulated by ice are now targets in the broader search for life beyond Earth. “Those two tiny little moons in the Saturn system have changed our paradigm” of what a “habitable” world might look like, Edgington said.
4 Cassini Found Enceladus Ocean Material in the E Ring
Saturn’s outermost ring, the E ring, is huge, stretching from Titan to the smaller moon Mimas (a distance of about
Cassini captured this image of Enceladus, with its south pole plumes of
water shooting into space, from a distance of 777,000 kilometers. The
500- kilometer- wide moon and its internal ocean have captivated the
scientific world ever since the Cassini team detected them in 2005.
Credit: NASA/ JPL- Caltech/Space Science Institute
Saturn’s icy ocean moon Enceladus orbits within the densest part of the
E ring, which made scientists wonder whether material from Enceladus’s
plumes had enough energy to leave its atmosphere. As it turns out, they
were right. This image was snapped by Cassini’s wide- angle camera in
September 2006 as the Sun was directly behind Saturn from Cassini’s
point of view. Credit: NASA/JPL/Space Science Institute

28 // Eos September 2017
1 million kilometers). The ring is also puffier than the other flatter rings encircling Saturn.
But that’s not the strangest thing about the E ring. Enceladus, that game- changing moon, orbits Saturn within this ring. In fact, Enceladus orbits in the densest part of this ring. Once the Cassini team discovered Ence-ladus’s geyserlike plumes in 2005, they wondered, Could particles from Enceladus’s plumes be bulking up the E ring?
Analyzing icy tendrils of particles jetting out of Ence-ladus and comparing those particles to E ring particles answered this question: Yes, some of the plume material does indeed leave the moon fast enough to populate the ring, rather than falling back onto Enceladus’s surface.
This finding is particularly exciting because it “makes the entire ring a sample of the moon’s interior,” said Mat-thew Hedman, a physicist at the University of Idaho in Moscow who studies Saturn’s rings. Perhaps by studying E ring particles, scientists can learn more about Ence-ladus’s interior ocean, he noted.
5 Cassini Unlocked Mysteries of Saturn’s Hexagon
“If you’re a meteorologist, you love Saturn,” said Edgington.One of Saturn’s features that fascinates atmospheric
enthusiasts is the six- sided north polar jet stream simply deemed “the Hexagon.” Voyager’s images hinted at the structure back in the 1980s, but Cassini confirmed its exis-tence once and for all. The Hexagon spans 25,000 kilome-ters, and thermal imaging revealed that it may extend 100 kilometers down into the planet’s atmosphere.
The Hexagon is a polar jet stream of winds, similar to the river of winds whipping around Earth’s latitudes. The dif-ference is that Earth’s jet stream dips and wiggles because of landmasses and oceans pulling it every which way, Edg-ington said.
In contrast, Saturn’s hexagon might be what an undis-turbed polar jet stream looks like in an atmosphere devoid
of land and oceans. Why the jet stream is six sided rather than five or eight sided is still a mystery.
6 Cassini Showed Us One of Saturn’s Huge, Infrequent Storms…
Small thunderstorms pop up from time to time on Saturn, but huge storms arise only about once every 30 years, Spilker said. Because Cassini has orbited the planet for such a long period of time, scientists got to witness one of these massive, global storms from beginning to end.
When Voyager flew by Saturn, it detected lightning, but researchers were unsure of where the lightning signature came from; some even thought it could be from the rings, said Robert West, a coinvestigator on Cassini’s Ultraviolet Imaging Spectrograph (UVIS) instrument. But Cassini’s instruments showed us storms “rising and setting over the horizon” as the planet turned, confirming that the light-ning came from Saturn’s atmosphere, he continued.
Then, in 2010, a large white spot formed, signaling a storm. The storm stretched 10,000 kilometers across, about the size of Earth. The planet’s rotation dragged this storm along until it became a band streaking across the planet, widening north to south to span 15,000 kilometers.
Over the next several months, as Saturn rotated, the storm continued to drag around the planet like a ribbon, covering 5 billion square kilometers, until one day the tail of the storm collided with the head of the storm and “they annihilated each other,” West said. Then, over just a week, the storm’s activity ceased.
Scientists still aren’t sure why the storm abruptly ended, he noted.
7 …And That Storm Helped Cassini Detect Atmospheric Water
Studying this massive storm also showed that water exists in a lower layer of Saturn’s atmosphere.
On Earth, storms arise because of atmospheric convec-tion from surface heating aided by water vapor that is slightly more buoyant than the rest of the atmosphere. Cool, dense air sinks, and hot, light air rises. The turbu-lence from this mixing can induce a thunderstorm.
But on Saturn, water is the heavier component. It con-denses under hydrogen, helium, and clouds of ammonium sulfide and ammonia. This cap of dry upper layers over wet layers suppresses storm formation for a long time, researchers found.
Because of the lack of mixing between dry and wet lay-ers, the dry region above the water layer eventually cools, becomes heavy, and sinks, pushing the wetter layer upward. This sets off a domino effect of convection like on Earth, but on a much larger scale. During the 2010 storm, that wet layer eventually “punched through the upper clouds” as the dry layer sank, and Cassini was able to clearly detect water clouds in the atmosphere, West said.
8 Cassini Dazzled Scientists with Saturn’s Color- Changing Atmosphere
When Cassini reached Saturn, its northern hemisphere was just coming out of a 7- Earth- year- long winter. Upon arrival, scientists found a crisp, blue atmosphere, West said, rather than the yellowy beige that researchers were used to from ground- based observations.
This image of Saturn’s hexagonal polar jet stream was captured by Cas-
sini’s wide- angle camera in April 2014. Researchers think that the hexa-
gon could be what a jet stream might look like when undisturbed by
landmasses or oceans. Credit: NASA/JPL/Space Science Institute

Earth & Space Science News Eos.org // 29
Scientists were quick to discover the reason: This blue was a hint of a “clean” atmosphere. Saturn’s upper atmo-spheric layers are formed mostly of hydrogen and helium, which scatter blue light, and methane, which absorbs red light, West said. So light that scatters off the atmosphere takes on a bluer hue.
Then, as summer peaked in Saturn’s northern hemi-sphere, Cassini observed a color shift to yellow. This hap-pens because sunlight breaks apart methane, and those broken pieces form long chains of hydrocarbons that form particles. These particles, in turn, scatter light toward the
red end of the spectrum. These chemical reactions, which are similar to the creation of smog on Earth, create Sat-urn’s yellow haze.
What’s more, Saturn’s hexagonal polar jet stream often remains blue long after the surrounding atmosphere turns yellow: This is partly because it doesn’t receive as much sunlight as the lower latitudes, Edgington said, and partly because the sides of the jet stream block mixing from lower latitudes.
9 Cassini Spied Saturn’s Rings Acting Like a Seismometer
Scientists on Earth can figure out our planet’s internal structure by studying the way earthquake waves move through the ground. But Saturn is a gas giant, devoid of earthquakes. With Cassini, however, and its hundreds of images of Saturn, scientists noted something curious: waves propagating through Saturn’s rings.
From late 2010 through mid- 2011, this massive storm raged on Saturn.
The storm wrapped around the planet’s northern hemisphere. Storms
like this are rare on Saturn; scientists think they occur about every
30 years. For the full caption and description of each stage of the storm,
see http:// bit.ly/ StormSaturn. Credit: NASA/ JPL- Caltech/Space Science
Institute
Cassini snapped this photo from 4° above the ring plane, from 456,000
kilometers away. By looking at thousands of ring images, scientists
noticed that waves propagate through the disk. These waves, they
eventually found, could potentially tell us something about Saturn’s inte-
rior. Credit: NASA/ JPL- Caltech/Space Science Institute

30 // Eos September 2017
Gravitational pull from the planet’s many ring- bound moons can create undulations, but calculations showed that these tugs alone were not enough to produce the sig-nal observed by Cassini. Something else was going on.
By studying thousands of images and running thousands of calculations, scientists tracked the source of these mys-terious waves to Saturn itself.
“It’s like the rings are giving you a window into the inte-rior of the planet, much like earthquakes and the frequen-cies of the waves they generate give you a window into the structure of the Earth,” Carolyn Porco, the imaging team leader for the Cassini mission, told National Geographic (http://bit . ly/ NatGeoSaturnRings).
But what these waves tell us about Saturn’s interior remains a mystery.
10 Cassini Showed Us Saturn’s Other Dynamic Moons
Enceladus and Titan may capture scientists’ imaginations when it comes to habitability, but Saturn’s other moons beckon with mysteries as well.
Tethys, for instance, which orbits in Saturn’s E ring, sports long, mysteri-ous red streaks across its surface. “Nobody has seen anything like them any-where else in the solar sys-tem,” said Amanda Hendrix, a coinvestigator on Cassini’s UVIS instrument and resi-dent icy moon expert at the Planetary Science Institute in Tucson, Ariz.
Unfortunately, Cassini spotted the stripes too late in the mission to garner closer inspection—it’s not a trivial task to change the trajectory of the spacecraft for more flybys, Hendrix noted. The most mysterious
aspect of the stripes is their apparent young age. Researchers can estimate the ages of planetary surface features by counting craters and the relative age of features by what’s covering or underneath a crater. But these stripes travel over craters and the surrounding surface, a signal of youth. Nothing seems to have weathered the stripes or hit them.
“It really is like someone took a crayon and drew on the surface yesterday,” Hendrix said.
Then there are Saturn’s “tutu” moons (or enchilada moons or walnut moons or ravioli moons, depending on whom you ask). The tiny moon Pan, which cleared out its own path through Saturn’s A ring, made a splash on social media when new high- resolution raw images were released by the mission team.
Even tiny Dione, half the size of our own Moon, could harbor an internal ocean, Hendrix said. Instruments on Cassini have detected a magnetic signal similar to the sig-nal from Enceladus that hinted at its plumes. But subse-quent flybys of Dione have uncovered nothing, Hendrix said.
“They all have their own personalities,” Hendrix joked.
Cassini’s FarewellWith oceans of data left to process and interpret, the Cassini- Huygens mission will influence research decades into the future. But it’s no easy task to say good-bye to a mission that to some, shaped their very careers. West lik-ened the end of a mission to a divorce, whereas Hendrix went even further: “It really is almost a death,” she said. “Just thinking about it, how [Cassini is] going to be gone, it’s a little weird.”
Leigh Fletcher, an astronomer at the University of Leicester in the United Kingdom, started working on his Ph.D. studying Saturn’s and Titan’s atmospheres in 2004, about the time Cassini entered Saturn’s orbit. He works with Cassini data to this day, studying Saturn’s atmo-sphere using Cassini’s Composite Infrared Spectrometer.
“Whenever I watch the [animated] movie of Cassini’s final demise, it’s hard not to feel moved,” Fletcher said, referring to a video NASA released in April that simulates Cassini’s upcoming crash with Saturn (http:// bit . ly/ CassiniCrash). Fletcher feels “pride in what we’ve accom-plished, gratitude that I was offered a chance to become involved, and sadness that a team I’ve worked with for 13 years will now be moving on to pastures new.”
Sarah Hörst of Johns Hopkins University, who studies Titan’s atmosphere, says she’ll miss looking up to the sky every morning and saying, “Hello Saturn, hello Cassini!” on her way to work.
In the spacecraft’s last few seconds, before it disinte-grates in Saturn’s atmosphere and the molecules that make up its instruments and structure become part of Sat-urn itself, “Cassini will be like a Saturn probe,” Spilker said, collecting its first—and last—direct measurements of the upper atmosphere.
And a billion kilometers away, past planets, moons, and asteroids, scientists will receive those data “until the very end,” she said.
Author Information JoAnna Wendel (@JoAnnaScience), Staff Writer
This color- enhanced mosaic, captured in 2015, shows mysterious red
streaks painted across the northern hemisphere of Tethys. The streaks
look superimposed on craters and other surface features, indicating
that they formed relatively recently. Credit: NASA/JPL/Space Science
Institute
Two views from Cassini’s closest
ever encounter with Pan, Saturn’s
walnut- shaped moon. Pan orbits
Saturn within the A ring, in a
space it carved out called the
Encke Gap. Researchers suggest
that Pan’s ridge formed from ring
material falling onto its equator.
Credit: NASA/JPL/Space Science
Institute

osm.agu.org
Abstract, Town Hall, Workshop, and Auxiliary Event Submission Deadline
6 September 2017
Housing and Registration open in September. Rates are now posted.
8
Portland Oregon
SAVING OUR MARINE ARCHIVESBy Emilie Dassié, Kristine DeLong, Hali Kilbourne, Branwen Williams, Nerilie Abram, Logan Brenner, Chloé Brahmi, Kim M. Cobb, Thierry Corrège, Delphine Dissard, Julien Emile-Geay, Heitor Evangelista, Michael N. Evans, Jesse Farmer, Thomas Felis, Michael Gagan, David P. Gillikin, Nathalie Goodkin, Myriam Khodri, Ana Carolina Lavagnino, Michèle LaVigne, Claire Lazareth, Braddock Linsley, Janice Lough, Helen McGregor, Intan S. Nurhati, Gilman Ouellette, Laura Perrin, Maureen Raymo, Brad Rosenheim, Michael Sandstrom, Bernd R. Schöne, Abdelfettah Sifeddine, Samantha Stevenson, Diane M. Thompson, Amanda Waite, Alan Wanamaker, and Henry Wu
September 201732 // Eos

Some scientific communities, includ-ing paleontologists and archaeolo-gists, curate their physical samples in museums. In the paleoceanography and paleoclimatology communities, how-ever, scientists generally store their
physical samples in their own facilities, unless they are affiliated with international core drilling programs, which maintain centralized archives.
Data derived from the physical samples are usu-ally (but not always) uploaded to an electronic database, but individual curation of the associated samples and metadata imposes limits on future retrieval and further research. This also places these resources at risk from hazards like floods and fires. Likewise, storing metadata in an indi-vidual lab, in personal computer files, or in field notebooks limits the ability of other scientists to make use of these samples.
Historically, one way to encourage voluntary data submission to an existing data archive was to keep the formatting and metadata requirements to a minimum. However, regularized data standards could make future data synthesis much easier, and these standards are potentially viable now that funding agencies, including the National Science Foundation, have begun requesting that proposals include detailed data management plans for
archiving both physical samples and electronic data. However, these agencies provide no guidance on what practices are acceptable for a given scien-tific community.
To solve these data archival and hosting prob-lems, paleoceanographers and paleoclimatologists are beginning to define the standards they need to properly store physical samples, metadata, and derived proxy data. The Marine Annually Resolved Proxy Archives (MARPA; see http:// www . bit . ly/ MARPA) project is a grassroots effort by the scien-tific community to build consensus on data and sample archiving procedures, working with exist-ing and new data repositories to ensure that the needs of the community are represented.
Scattered ArchivesPaleoceanographers and paleoclimatologists col-lect, archive, and study marine materials, which serve as important sources of information on past climates. In cases where changes in the properties of these specimens are dependent on climate vari-ables, these changes serve as an indirect indicator (or proxy) for changes in Earth’s climate through time.
Within these communities, the need for stan-dards and metadata is particularly important for scientists who use marine specimens with rela-
Eos.org // 33Earth & Space Science News
A scientist collects a core sample from a coral colony on a western Australian reef. The MARPA project is working to establish
standards and capabilities for preserving metadata related to physical samples like this one in a format and a centralized
location that facilitate future access and research. Credit: Eric Matson, Australian Institute of Marine Science
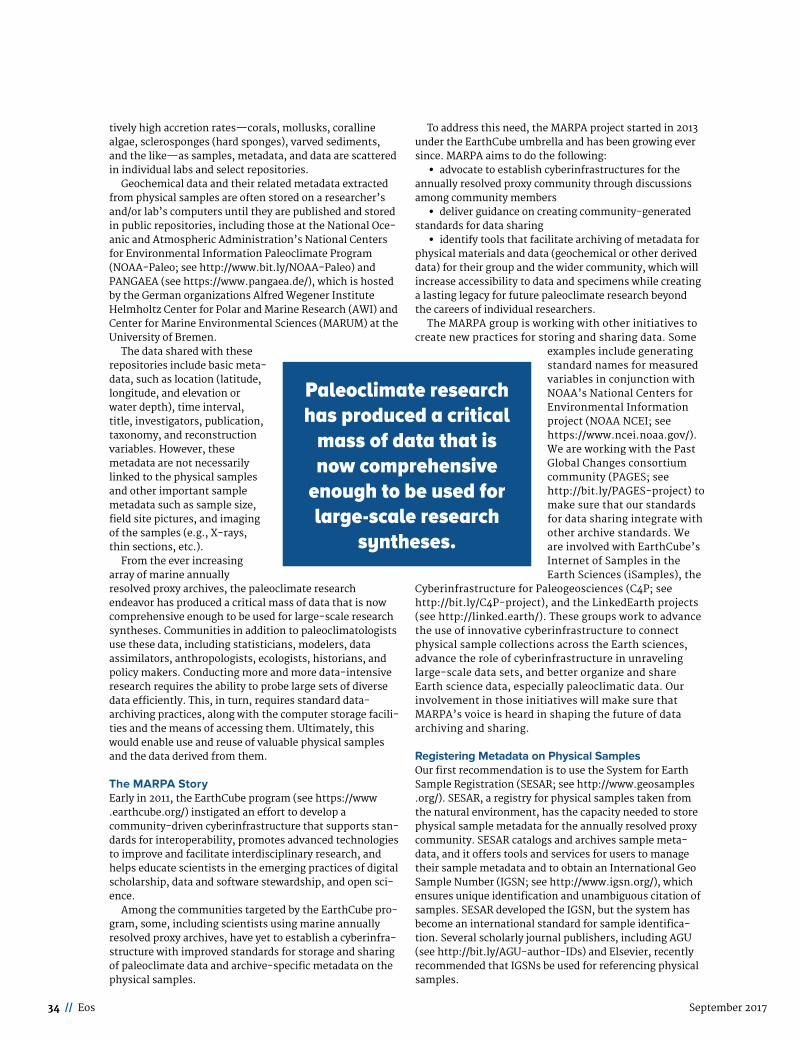
34 // Eos September 2017
tively high accretion rates—corals, mollusks, coralline algae, sclerosponges (hard sponges), varved sediments, and the like—as samples, metadata, and data are scattered in individual labs and select repositories.
Geochemical data and their related metadata extracted from physical samples are often stored on a researcher’s and/or lab’s computers until they are published and stored in public repositories, including those at the National Oce-anic and Atmospheric Administration’s National Centers for Environmental Information Paleoclimate Program ( NOAA- Paleo; see http:// www . bit . ly/ NOAA- Paleo) and PANGAEA (see https:// www . pangaea . de/), which is hosted by the German organizations Alfred Wegener Institute Helmholtz Center for Polar and Marine Research (AWI) and Center for Marine Environmental Sciences ( MARUM) at the University of Bremen.
The data shared with these repositories include basic meta-data, such as location (latitude, longitude, and elevation or water depth), time interval, title, investigators, publication, taxonomy, and reconstruction variables. However, these metadata are not necessarily linked to the physical samples and other important sample metadata such as sample size, field site pictures, and imaging of the samples (e.g., X-rays, thin sections, etc.).
From the ever increasing array of marine annually resolved proxy archives, the paleoclimate research endeavor has produced a critical mass of data that is now comprehensive enough to be used for large- scale research syntheses. Communities in addition to paleoclimatologists use these data, including statisticians, modelers, data assimilators, anthropologists, ecologists, historians, and policy makers. Conducting more and more data- intensive research requires the ability to probe large sets of diverse data efficiently. This, in turn, requires standard data- archiving practices, along with the computer storage facili-ties and the means of accessing them. Ultimately, this would enable use and reuse of valuable physical samples and the data derived from them.
The MARPA StoryEarly in 2011, the EarthCube program (see https:// www . earthcube . org/) instigated an effort to develop a community- driven cyberinfrastructure that supports stan-dards for interoperability, promotes advanced technologies to improve and facilitate interdisciplinary research, and helps educate scientists in the emerging practices of digital scholarship, data and software stewardship, and open sci-ence.
Among the communities targeted by the EarthCube pro-gram, some, including scientists using marine annually resolved proxy archives, have yet to establish a cyberinfra-structure with improved standards for storage and sharing of paleoclimate data and archive- specific metadata on the physical samples.
To address this need, the MARPA project started in 2013 under the EarthCube umbrella and has been growing ever since. MARPA aims to do the following:
• advocate to establish cyberinfrastructures for the annually resolved proxy community through discussions among community members
• deliver guidance on creating community- generated standards for data sharing
• identify tools that facilitate archiving of metadata for physical materials and data (geochemical or other derived data) for their group and the wider community, which will increase accessibility to data and specimens while creating a lasting legacy for future paleoclimate research beyond the careers of individual researchers.
The MARPA group is working with other initiatives to create new practices for storing and sharing data. Some
examples include generating standard names for measured variables in conjunction with NOAA’s National Centers for Environmental Information project (NOAA NCEI; see https:// www . ncei . noaa . gov/). We are working with the Past Global Changes consortium community (PAGES; see http://bit . ly/ PAGES - project) to make sure that our standards for data sharing integrate with other archive standards. We are involved with EarthCube’s Internet of Samples in the Earth Sciences (iSamples), the
Cyberinfrastructure for Paleogeosciences (C4P; see http:// bit . ly/ C4P- project), and the LinkedEarth projects (see http:// linked . earth/). These groups work to advance the use of innovative cyberinfrastructure to connect physical sample collections across the Earth sciences, advance the role of cyberinfrastructure in unraveling large- scale data sets, and better organize and share Earth science data, especially paleoclimatic data. Our involvement in those initiatives will make sure that MARPA’s voice is heard in shaping the future of data archiving and sharing.
Registering Metadata on Physical SamplesOur first recommendation is to use the System for Earth Sample Registration (SESAR; see http://www . geosamples . org/). SESAR, a registry for physical samples taken from the natural environment, has the capacity needed to store physical sample metadata for the annually resolved proxy community. SESAR catalogs and archives sample meta-data, and it offers tools and services for users to manage their sample metadata and to obtain an International Geo Sample Number (IGSN; see http://www . igsn . org/), which ensures unique identification and unambiguous citation of samples. SESAR developed the IGSN, but the system has become an international standard for sample identifica-tion. Several scholarly journal publishers, including AGU (see http://bit . ly/ AGU- author- IDs) and Elsevier, recently recommended that IGSNs be used for referencing physical samples.
Paleoclimate research has produced a critical
mass of data that is now comprehensive
enough to be used for large-scale research
syntheses.

Earth & Space Science News Eos.org // 35
Registering samples in SESAR is easy. Investigators can download a template as an Excel file, save it on a personal computer, and upload data to SESAR using this template at their convenience. Investigators are able to control the pri-vacy of their sample metadata, meaning that they can store and manage their physical sample metadata in SESAR, obtain IGSNs for each sample, and make that information public in SESAR only when they are ready, for example, upon publication release.
Physical sample IGSNs can be inserted into publications, saving space and time by providing a compact reference to all the information on the physical samples that is freely accessible online, rather than cluttering journal articles with metadata that are important but perhaps peripheral to the particular scientific findings of the article. The IGSN can link to the catalog of an institutional repository, where physical samples are stored and curated.
SESAR facilitates metadata management and may make sample management easier, for example, by providing the ability to easily print labels. The Lamont- Doherty Core Repository has taken advantage of these capabilities to organize and catalog their physical samples (Figure 1). The MARPA website provides an example template and a video tutorial on how to register physical samples in SESAR, in particular, those from annually resolved proxies.
Going ForwardMARPA’s goal is to continue engaging with the marine (as well as the emerging freshwater) annually resolved proxy archive community to ensure that our data storage and retrieval needs are represented in the existing cyberinfrastructures and those that are currently being developed. We are actively seeking feedback from the community to address these concerns.
In addition to promoting the use of SESAR to store physical sample metadata and training investigators to
use SESAR, the MARPA project has defined several goals for the near future. We are asking the MARPA community to describe its needs and desires regarding the storage and retrieval of its geochemical data. We have and will continue to incorporate our community’s input into existing projects such as the NOAA NCEI paleoclimatology program and LinkedEarth as they evolve and change to meet the needs of researchers.
We first presented this initiative at the 2015 AGU Fall Meeting, then at the 2016 Ocean2K and 2016 Sclerochro-nology meetings. We presented further developments in the work and recommendations of MARPA at the PAGES Open Science Meeting in May to help other communities move forward with their specific archival issues. We will use the MARPA website forum section to discuss various ongoing aspects of our community needs, including how to store physical samples that have already been analyzed once their metadata have been registered in SESAR.
More information on the MARPA project, updates on recent activities, and channels for providing feedback are available on the MARPA website (http:// bit . ly/ MARPA - site).
AcknowledgmentsWe thank the current and former NOAA Paleoclimate team, David Anderson, Eugene Wahl, Carrie Morill, and Bridget Thrasher, for helpful discussions, as well as Kerstin Lehnert and Megan Carter of the Interdisciplinary Earth Data Alliance, the data facility that operates SESAR. We
Fig. 1. Lamont- Doherty Core Repository at Columbia University before
and after organizing coral samples in boxes. Each sample was given an
IGSN and Quick Response (QR) code for the storage box so that core
pictures, X- ray images, and other available information can be linked to
the samples. Credit: Emilie P. Dassié and Michael Sandstrom
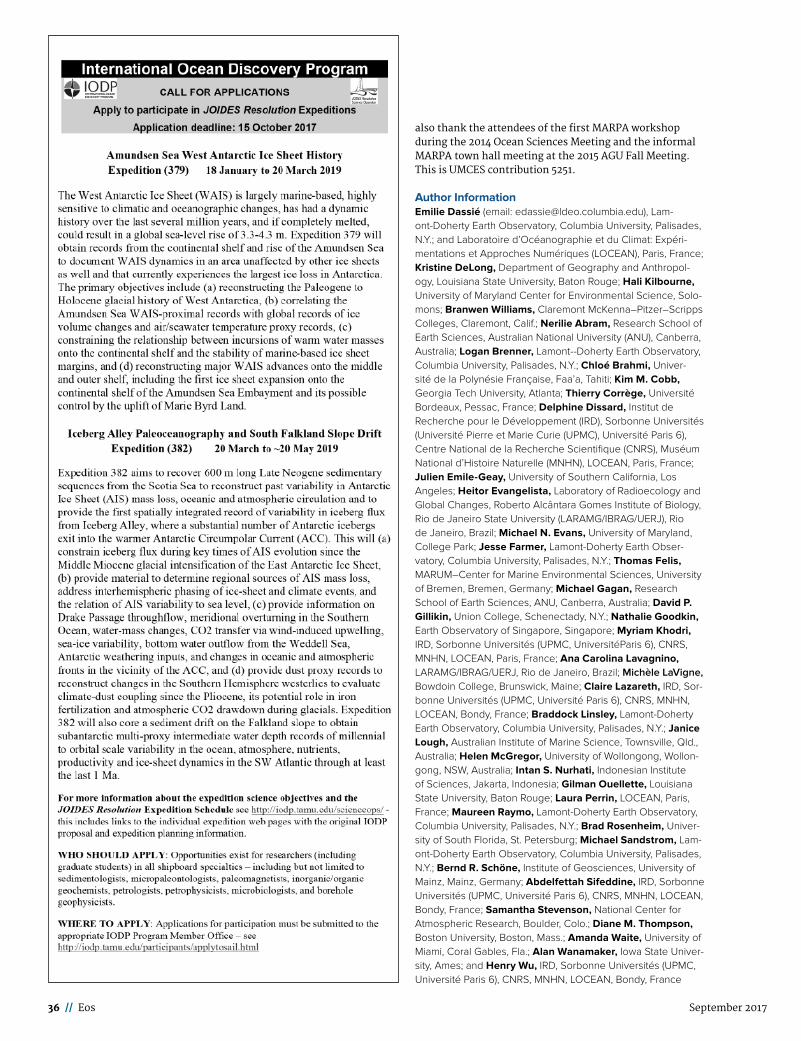
36 // Eos September 2017
also thank the attendees of the first MARPA workshop during the 2014 Ocean Sciences Meeting and the informal MARPA town hall meeting at the 2015 AGU Fall Meeting. This is UMCES contribution 5251.
Author InformationEmilie Dassié (email: [email protected]), Lam-ont-Doherty Earth Observatory, Columbia University, Palisades, N.Y.; and Laboratoire d’Océanographie et du Climat: Expéri-mentations et Approches Numériques (LOCEAN), Paris, France; Kristine DeLong, Department of Geography and Anthropol-ogy, Louisiana State University, Baton Rouge; Hali Kilbourne, University of Maryland Center for Environmental Science, Solo-mons; Branwen Williams, Claremont McKenna–Pitzer–Scripps Colleges, Claremont, Calif.; Nerilie Abram, Research School of Earth Sciences, Australian National University (ANU), Canberra, Australia; Logan Brenner, Lamont--Doherty Earth Observatory, Columbia University, Palisades, N.Y.; Chloé Brahmi, Univer-sité de la Polynésie Française, Faa’a, Tahiti; Kim M. Cobb, Georgia Tech University, Atlanta; Thierry Corrège, Université Bordeaux, Pessac, France; Delphine Dissard, Institut de Recherche pour le Développement (IRD), Sorbonne Universités (Université Pierre et Marie Curie (UPMC), Université Paris 6), Centre National de la Recherche Scientifique (CNRS), Muséum National d’Histoire Naturelle (MNHN), LOCEAN, Paris, France; Julien Emile-Geay, University of Southern California, Los Angeles; Heitor Evangelista, Laboratory of Radioecology and Global Changes, Roberto Alcântara Gomes Institute of Biology, Rio de Janeiro State University (LARAMG/IBRAG/UERJ), Rio de Janeiro, Brazil; Michael N. Evans, University of Maryland, College Park; Jesse Farmer, Lamont-Doherty Earth Obser-vatory, Columbia University, Palisades, N.Y.; Thomas Felis, MARUM–Center for Marine Environmental Sciences, University of Bremen, Bremen, Germany; Michael Gagan, Research School of Earth Sciences, ANU, Canberra, Australia; David P. Gillikin, Union College, Schenectady, N.Y.; Nathalie Goodkin, Earth Observatory of Singapore, Singapore; Myriam Khodri, IRD, Sorbonne Universités (UPMC, UniversitéParis 6), CNRS, MNHN, LOCEAN, Paris, France; Ana Carolina Lavagnino, LARAMG/IBRAG/UERJ, Rio de Janeiro, Brazil; Michèle LaVigne, Bowdoin College, Brunswick, Maine; Claire Lazareth, IRD, Sor-bonne Universités (UPMC, Université Paris 6), CNRS, MNHN, LOCEAN, Bondy, France; Braddock Linsley, Lamont-Doherty Earth Observatory, Columbia University, Palisades, N.Y.; Janice Lough, Australian Institute of Marine Science, Townsville, Qld., Australia; Helen McGregor, University of Wollongong, Wollon-gong, NSW, Australia; Intan S. Nurhati, Indonesian Institute of Sciences, Jakarta, Indonesia; Gilman Ouellette, Louisiana State University, Baton Rouge; Laura Perrin, LOCEAN, Paris, France; Maureen Raymo, Lamont-Doherty Earth Observatory, Columbia University, Palisades, N.Y.; Brad Rosenheim, Univer-sity of South Florida, St. Petersburg; Michael Sandstrom, Lam-ont-Doherty Earth Observatory, Columbia University, Palisades, N.Y.; Bernd R. Schöne, Institute of Geosciences, University of Mainz, Mainz, Germany; Abdelfettah Sifeddine, IRD, Sorbonne Universités (UPMC, Université Paris 6), CNRS, MNHN, LOCEAN, Bondy, France; Samantha Stevenson, National Center for Atmospheric Research, Boulder, Colo.; Diane M. Thompson, Boston University, Boston, Mass.; Amanda Waite, University of Miami, Coral Gables, Fla.; Alan Wanamaker, Iowa State Univer-sity, Ames; and Henry Wu, IRD, Sorbonne Universités (UPMC, Université Paris 6), CNRS, MNHN, LOCEAN, Bondy, France

Earth & Space Science News Eos.org // 37
AGU NEWS
I f you unexpectedly lost your job tomorrow, would you be prepared to cope with the consequences?Losing your job can be debilitating. If you
are facing an unplanned career transition, you may be dealing with the loss of identity associated with your former position. There is often a period of shock followed by mourning and even depression.
Let AGU be a resource for you. We offer a wide array of resources for members and nonmembers alike. Whether you are cur-rently unemployed or want to be prepared for the unexpected, AGU’s unemployment resources will reduce the impact of any work-force displacement.
It is important that job seekers stay engaged. AGU can help facilitate the transi-tion back into the workforce. With a commu-nity of more than 60,000 professionals in the Earth and space sciences, AGU is a key tool in the job seeker’s toolbox. Here are five steps to take after losing a job, along with AGU resources to help you.
1. Stay CurrentStay up to date in your field by reading AGU’s open-access articles in GeoHealth, Earth and Space Science, Earth’s Future, and Journal of Advances in Modeling Earth Systems. In addi-tion, all AGU articles published in 1997 and after are open-access 24 months after online publication.
Stay current with the latest news in Earth and space science with Eos.org and Eos Buzz alerts (http:// bit . ly/ Eos- Buzz). Keeping engaged will help you stay relevant so that
you can provide meaningful con-tributions during an interview or a networking meeting.
2. Make Yourself VisibleAGU members seeking employ-ment are encouraged to create a profile on the Career Center job board (http:// bit . ly/ AGUjobs). Creating a profile will allow you to search and respond to job listings, upload and instantly transfer your resumé to recruit-ers and hiring managers, and set up notifications when jobs meet your search criteria. In addition, creating a profile that includes your CV or resumé will allow our
participating recruiters to find you by searching our job seeker database.
Students may be disproportionately hard hit by increased competition for employ-ment. Gaining practical experience through internships or even temporary contractor positions can boost your skills and get your foot in the door. Internships and contracted positions give you experience, allow you to demonstrate your capabilities, and allow you to try out an organization’s work environ-ment. AGU connects students with intern-ships and other employment opportunities via the Career Center job board.
3. Expand Your NetworkNetworking is vital to the job hunt. AGU meetings and conferences are great venues for connecting with new professional con-tacts or reconnecting with previously forged ones.
If you plan to attend Fall Meeting, make sure to stop by AGU’s Recruiters Row, a vibrant part of the exhibit hall, where you can interview with prospective employers and network with company representatives. In addition, in the AGU Career Center, you can gain essential job search skills, have your resumé reviewed, or practice interview-ing.
Being active in the AGU community by attending Fall Meeting can help grow pro-fessional networks and increase opportuni-ties to discover available positions. For vir-tual opportunities, join the AGU group on LinkedIn (http:// bit . ly/ AGULinkedIn) and take part in discussions on the AGU
Connect-ß platform (https:// connect . agu . org).
4. Hone Your Professional SkillsAGU Webinars broadcast live each Thursday at 2:00 p.m. eastern time at no cost. AGU Webinars provide useful skills and training for Earth and space scientists. Topics include career development, science communica-tion, and science policy. Every third Thurs-day features a professional development topic. Webinar recordings are posted online approximately 1 week after initial broadcast. See webinars . agu . org for a list of upcoming and archived topics.
AGU’s On the Job blog features career advice and workforce guidance to geoscience students, early- career scientists, and estab-lished professionals interested in pursuing professional enrichment (http:// blogs . agu . org/ onthejob). You can also visit Eos Career Tools & Resources for a collection of job search and professional development advice articles curated by the Eos editorial team (http:// bit . ly/ Eos- toolkit).
5. Ask for HelpOne of the most intensive resources AGU offers is the Job Seekers Group, where cur-rently unemployed members meet virtually each week to discuss strategies that will help them find and secure that fulfilling position. During each meeting, time is allocated to discussing the progress and struggles of each member and to sharing suggestions for overcoming barriers. If you are interested in joining, email careers@ agu . org.
AGU is here for you and committed to supporting its members during tumultuous times. With a vibrant, helpful, and well- connected Earth and space science commu-nity and an array of career resources, we can help you minimize the impact of a job loss and secure a new position.
If you find yourself facing unemployment, remember to use our resources to get you back on your feet. For a full listing of unem-ployment resources, visit https:// unemployed . agu . org.
By Leslie Marasco (email: lmarasco@ agu.org), Student Programs Coordinator, AGU; David Har-well, Talent Pool Director, AGU; and Nathaniel Janick, Career Services Coordinator, AGU
Unemployed? AGU Can Help
Cre
dit:
vadi
mgu
zhva
/ iSto
ck P
hoto

38 // Eos September 2017
AGU NEWS
The Japan Geosciences Union– American Geophysical Union ( JpGU- AGU) Joint Meeting in Chiba, Japan, came to a
close on 25 May, and we said good-bye to a wonderful team of Japanese co- organizers. This meeting, the first of its kind between these organizations, arose from an idea con-ceived in 2014—an idea to advance Earth and space science by expanding the JpGU annual meeting and increasing participation from scientists outside of the region.
The resulting collaborative event, which drew 8450 attendees, was a resounding suc-cess. As I attended sessions and walked through the poster hall, I was reminded again and again of our borderless scientific world.
Sharing Visions and IdeasAlthough a joint meeting might seem like an easy proposal, planning a complex scientific event that reflects both organizations is a challenging task. Every society has a culture, traditions, and norms that are its own.
Beginning in 2015, under the guidance of a joint agreement, JpGU and AGU worked to ensure that we developed the scientific pro-gram and accompanying events together and made them reflective of the missions and visions of both of our organizations. All planning was collaborative; we began by discussing our vision and sharing ideas rather than by insisting on planning “the AGU way” or “the JpGU way.” Each organization shared best practices, and each organiza-tion tried new things.
With a collaborative plan-ning process under way, the scientific program committee, led by the meeting’s director, Hisayoshi Yurimoto of Hok-kaido University, and commit-tee cochairs Huixin Liu of Kyushu University and Tetsuo Irifune of Ehime University, began to discuss how to create
a program where there was something for everyone. Because the meeting traditionally had been held with mostly Japanese presen-tations, the committee recognized that there was a barrier to participation from non-
Japanese- speaking scientists. Thus, JpGU used its 2016 annual meet-
ing to encourage submission of more English language ses-
sions and abstracts.Ultimately, the joint meet-
ing offered Japanese ses-sions, English sessions, and a blended session type where the presenter shared slides in English but could present in Japanese. This array of ses-sion types resulted in more sessions for non- Japanese speakers and more positive experiences for Japanese- speaking presenters uncom-fortable with giving their entire talks in English.
Japan- U.S. Joint Meeting: Geoscience for a Borderless World
Exhibits and poster hall at the joint JpGU– AGU meeting in Chiba, Japan, in May. Credit: Ken Xs Hao
Student pop- up talks, dubbed
Oshaberi Bar Pop- Up Talks at
the JpGU– AGU meeting,
received a warm welcome from
the joint meeting’s attendees.
Credit: Takeshige Ishiwa, Hiroaki
Koge, and Natsumi Okutsu
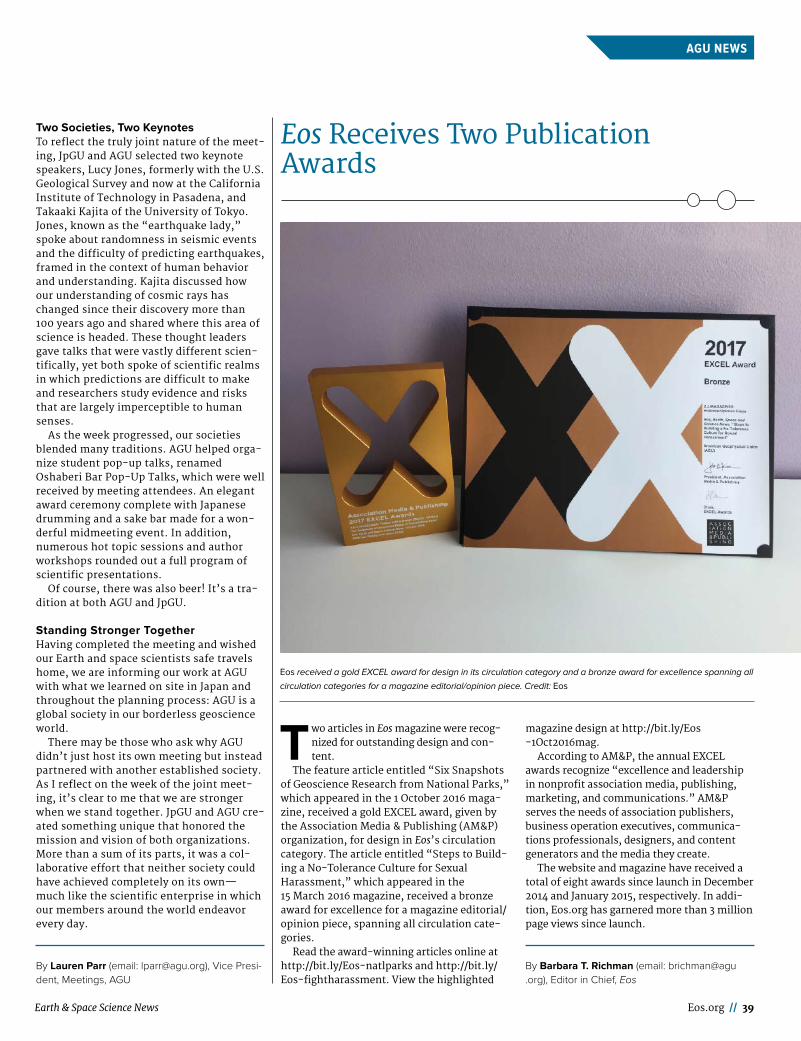
Earth & Space Science News Eos.org // 39
AGU NEWS
Two articles in Eos magazine were recog-nized for outstanding design and con-tent.
The feature article entitled “Six Snapshots of Geoscience Research from National Parks,” which appeared in the 1 October 2016 maga-zine, received a gold EXCEL award, given by the Association Media & Publishing (AM&P) organization, for design in Eos’s circulation category. The article entitled “Steps to Build-ing a No- Tolerance Culture for Sexual Harassment,” which appeared in the 15 March 2016 magazine, received a bronze award for excellence for a magazine editorial/opinion piece, spanning all circulation cate-gories.
Read the award- winning articles online at http:// bit . ly/ Eos- natlparks and http:// bit . ly/ Eos- fightharassment. View the highlighted
magazine design at http:// bit . ly/ Eos - 1Oct2016mag.
According to AM&P, the annual EXCEL awards recognize “excellence and leadership in nonprofit association media, publishing, marketing, and communications.” AM&P serves the needs of association publishers, business operation executives, communica-tions professionals, designers, and content generators and the media they create.
The website and magazine have received a total of eight awards since launch in December 2014 and January 2015, respectively. In addi-tion, Eos.org has garnered more than 3 million page views since launch.
By Barbara T. Richman (email: brichman@agu .org), Editor in Chief, Eos
Eos Receives Two Publication Awards
Two Societies, Two KeynotesTo reflect the truly joint nature of the meet-ing, JpGU and AGU selected two keynote speakers, Lucy Jones, formerly with the U.S. Geological Survey and now at the California Institute of Technology in Pasadena, and Takaaki Kajita of the University of Tokyo. Jones, known as the “earthquake lady,” spoke about randomness in seismic events and the difficulty of predicting earthquakes, framed in the context of human behavior and understanding. Kajita discussed how our understanding of cosmic rays has changed since their discovery more than 100 years ago and shared where this area of science is headed. These thought leaders gave talks that were vastly different scien-tifically, yet both spoke of scientific realms in which predictions are difficult to make and researchers study evidence and risks that are largely imperceptible to human senses.
As the week progressed, our societies blended many traditions. AGU helped orga-nize student pop- up talks, renamed Oshaberi Bar Pop- Up Talks, which were well received by meeting attendees. An elegant award ceremony complete with Japanese drumming and a sake bar made for a won-derful midmeeting event. In addition, numerous hot topic sessions and author workshops rounded out a full program of scientific presentations.
Of course, there was also beer! It’s a tra-dition at both AGU and JpGU.
Standing Stronger TogetherHaving completed the meeting and wished our Earth and space scientists safe travels home, we are informing our work at AGU with what we learned on site in Japan and throughout the planning process: AGU is a global society in our borderless geoscience world.
There may be those who ask why AGU didn’t just host its own meeting but instead partnered with another established society. As I reflect on the week of the joint meet-ing, it’s clear to me that we are stronger when we stand together. JpGU and AGU cre-ated something unique that honored the mission and vision of both organizations. More than a sum of its parts, it was a col-laborative effort that neither society could have achieved completely on its own—much like the scientific enterprise in which our members around the world endeavor every day.
By Lauren Parr (email: lparr@ agu.org), Vice Presi-dent, Meetings, AGU
Eos received a gold EXCEL award for design in its circulation category and a bronze award for excellence spanning all
circulation categories for a magazine editorial/ opinion piece. Credit: Eos

40 // Eos September 2017
AGU NEWS
E very year, AGU recognizes individuals through our renowned honors program for their exceptional achievements,
outstanding contributions and service to the scientific community, and attainment of eminence in Earth or space science fields. This distinguished group of honorees—sci-entists, leaders, educators, and communica-tors—has explored new frontiers in geophys-ical or space research through their creativity, original thinking, and groundbreaking advances. On behalf of AGU’s Honors and Recognition Committee, our Union selection committees, and our organization’s leader-ship and staff, we are very pleased to present the recipients of AGU’s 2017 Union medals, awards, and prizes.
Fulfilling AGU’s MissionOur 2017 honorees’ work and scientific achievements embody AGU’s mission of pro-moting discovery in Earth and space science for the benefit of society. Their discoveries or other contributions have helped improve the lives and prosperity of people and communi-ties around the world. Their passion for scien-tific excellence and their dedication continue to enhance our understanding of Earth and space science.
We thank all who have given their support and commitment to AGU’s honors program, including the volunteers who serve on the medal, award, and prize selection committees that have chosen this year’s Union honors recipients. We also are grateful for the commit-ment and engagement of all of the nominators and supporters who make our honors program possible through their dedicated efforts to rec-ognize and commend their colleagues.
Celebrate at Fall MeetingWe look forward to celebrating these 29 exceptional recipients of our Union medals, awards, and prizes and their contributions and achievements at this year’s Honors Tribute to be held Wednesday, 13 December 2017, at the Fall Meeting in New Orleans.
Please join us in congratulating our esteemed class of 2017 Union honorees listed below.
MedalsWilliam Bowie MedalThomas H. Jordan, Southern California
Earthquake Center, University of Southern California
James B. Macelwane MedalRobert E. Kopp, Rutgers University–
New BrunswickMichael P. Lamb, California Institute
of TechnologyYan Lavallée, University of LiverpoolWen Li, Boston University and
University of California, Los Angeles
Tiffany A. Shaw, University of Chicago
John Adam Fleming MedalMary K. Hudson, Dartmouth College
Maurice Ewing MedalDonald W. Forsyth, Brown University
Robert E. Horton MedalEric F. Wood, Princeton University
Harry H. Hess MedalRoberta L. Rudnick, University of California,
Santa Barbara
Roger Revelle MedalKevin E. Trenberth, National Center for
Atmospheric Research
Inge Lehmann MedalBrian L. N. Kennett, Research School of
Earth Sciences, Australian National University
Devendra Lal Memorial MedalS. K. Satheesh, Indian Institute of Science
AwardsAfrica Award for Research Excellence in Earth or
Ocean SciencesBruno V. E. Faria, National Meteorological
and Geophysics Institute
Africa Award for Research Excellence in Space Science
Melessew Nigussie, Washera Geospace and Radar Science Laboratory, Bahir Dar University
Ambassador AwardJean Marie Bahr, University of Wisconsin–
MadisonRobert A. Duce, Texas A&M UniversityRichard C. J. Somerville, Scripps Institution
of Oceanography, University of California, San Diego
Robert C. Cowen Award for Sustained Achievement in Science Journalism
Richard Monastersky, Nature
Edward A. Flinn III AwardRobert L. Wesson, U.S. Geological Survey
Excellence in Earth and Space Science Education Award
Thure E. Cerling, University of UtahJames R. Ehleringer, University of Utah
Charles S. Falkenberg AwardHook Hua, NASA Jet Propulsion Laboratory
Athelstan Spilhaus AwardErik Meade Conway, Jet Propulsion
Laboratory
International AwardHubert H. G. Savenije, Delft University of
Technology
Walter Sullivan Award for Excellence in Science Journalism– Features
Tony Bartelme, Post and Courier, Charleston, S.C.
David Perlman Award for Excellence in Science Journalism– News
Courtney Humphries, Freelance Journalist, Boston, Mass.
PrizesThe Asahiko Taira International Scientific Ocean
Drilling Research PrizeMichael Strasser, University of Innsbruck
Climate Communication PrizeStefan Rahmstorf, Potsdam Institute for
Climate Impact Research
By Eric A. Davidson, President, AGU; and Sam-uel Mukasa (email: agu _ unionhonors@ agu.org), Chair, Honors and Recognition Committee, AGU
2017 AGU Union Medal, Award, and Prize Recipients Announced

Earth & Space Science News Eos.org // 41
RESEARCH SPOTLIGHT
Mysterious Particle Beams Found over Jupiter’s Poles
Jupiter’s auroras are so powerful that if we could stand directly below them, where charged particles from space come crashing into the atmosphere, and see the ultraviolet light they emit, they
would appear brighter than the ultraviolet light from the Sun. How-ever, the behavior of these auroras, the most powerful in the solar system, has long been shrouded in mystery.
Last August, NASA’s Juno spacecraft deepened that mystery: In a close flyby of Jupiter’s poles, it found powerful angular beams of electrons above the aurora, extending in energy to greater than 1 million electron volts. These beams shoot upward over the polar caps and over the main aurora, even where a weaker downward compo-nent contains sufficient energy flux to generate the powerful emis-sions from the main aurora.
Now, as a contribution to a Geophysical Research Letters special sec-tion on Juno’s first encounter with Jupiter, Mauk et al. provide the most detailed analysis of this phenomenon yet. Although they don’t know the causes, they suggest it may be the key to understanding Jupiter’s intense auroras.
Juno’s close encounter came on 27 August 2016, just a couple of months after it arrived at Jupiter to study the planet, its moons, and its enormous magnetic field. The spacecraft’s pass over the northern and southern poles took it above dancing ovals of auroras, allowing it to peek into the polar regions within.
The authors analyzed data from the Jupiter Energetic Particle Detector Instrument, which measured the trajectories and energies
of the charged particles whizzing past. As the craft approached the auroral oval from the more equatorward regions, it saw typical sig-natures of trapped electrons with up- down differences reminiscent of those generating faint diffuse auroras at Earth.
However, when the spacecraft passed directly over the bright main auroral oval, it detected highly directional angular beams of both downward and upward traveling electrons. When Juno fully crossed inside the oval, deep within the polar caps, the downward beams virtually disappeared, leaving only the upward beams, vary-ing in intensity but always present. This is very unlike what hap-pens at Earth, where spacecraft passing over the most intense auroras find electrons accelerated downward only into what are called energy beams.
The Jovian bidirectional angle beams indicate that Jupiter’s auroras are generated by a totally different process than on Earth—a much more random one in which collisions and turbulence propel particles both down and up along magnetic field lines. The team hypothesizes that this may have been happening most strongly in the region below Juno’s position, which could explain why Juno saw the large up- down differences in the beams over the main auroral oval.
Juno’s orbit evolutions will allow this hypothesis to be tested during future polar passes at even lower altitudes, where predominantly descending energetic electrons may well be observed. (Geophysical Research Letters, https://doi . org/10 . 1002/ 2016GL072286, 2017) —Mark
Zastrow, Freelance Writer
An infrared image of an auroral oval over Jupiter’s southern polar regions, captured by NASA’s Juno spacecraft on 27 August 2016. Credit: NASA / JPL- Caltech/SwRI/ASI/INAF/JIRAM

42 // Eos September 2017
RESEARCH SPOTLIGHT
Shedding Light on Intermittent Rainfall
Curiosity Spies Shifting Sands on Mars
A plucky droid on a mission traverses a field of sandy dunes, alone on a vast, alien desert sea.
It’s an image straight out of science fiction—but it’s also what happened on Mars in late 2015 and early 2016, when NASA’s Curiosity became the first rover to explore an active dune field on another planet. For about 3 months, Curiosity traversed the Bagnold Dune Field on its way to Mount Sharp, studying how the dune sands shift and move.
Curiosity took images at five sites as it roved dunes up to 6 meters high, some bigger than a football field. The changes it saw were lim-ited, but a painstaking analysis by Bridges et al. provides insight into the physics of moving sand grains, how it has shaped Mars’s land-scape, and how it compares to that on Earth. Despite Mars’s lower gravity and its much lower atmospheric density— just 1% of Earth’s—the physics is remarkably similar.
In recent years, the growing fleet of spacecraft at Mars has given sci-entists the opportunity to study and track Mars’s dunes from orbit. In particular, the High Resolution Imaging Science Experiment (HiRISE) camera on NASA’s Mars Reconnaissance Orbiter has captured dramatic images of the slow advance of dunes over several years, the shifting rip-ples that form on their faces, and even avalanches as their faces erode.
The changes recorded by Curiosity were subtle, likely because the season when the images were taken typically has the lowest wind speeds of the year and because the rover spent no more than a few sols (Mars days) in any one place. In most cases, the movement amounted to the disappearance of individual grains from one image to the next, or grains moving a few pixels, usually in no apparent coher-ent direction.
But sometimes Curiosity saw clear evidence of the landscape’s movement. At one site, facing the steep leeward face of a 4- meter- high dune named Namib, it saw small flows of sand, miniature ava-lanches less than a centimeter wide. From another position, it saw a sheet of sand slumping down the face by about a centimeter over 1 sol.
Curiosity’s anemometer recorded wind speeds that averaged around 3– 9 meters per second, with gusts that probably exceed its present calibration limit of 20 meters per second. However, not all instances where changes occurred were linked to high winds. This finding sug-gests that other forces might also be at work, such as the electrostatic forces that build up between grains as they rub together.
What the team did not detect were any movements of ripples on the dunes or of the dunes themselves. This lack may be because according to atmospheric models and seasonal imaging from HiRISE, Curiosity happened to visit the dune field during local (southern hemisphere) fall–winter, the time of the Martian year with the lowest wind speeds. HiRISE images of the region have shown widespread ripple movement and dunes migrating up to 0.2 meter each year, but this movement happens during other seasons (around local summer), when winds are predicted to be stronger. (Journal of Geophysical Research: Planets, https://doi . org/ 10 . 1002/ 2017JE005263, 2017) — Mark Zastrow, Freelance
Writer
NASA’s Curiosity rover poses for a selfie in front of the slip face of Namib Dune, where it
measured winds in the dune’s lee and saw grain flows on the slip face and grain move-
ment at the base of the dune. Credit: NASA
When it rains, it pours. To speak less metaphorically, how-ever, sometimes it pours, then stops for a while, then sprin-kles, then pours again.
Rainfall is an important component of many environmental mod-els, which are crucial for studying flooding, drought, water quality, and more. Yet model representations of rainfall are typically static, whereas, in reality, rain is often intermittent. A model that fails to account for rainfall that is not continuous will have inaccuracies that can affect the quality of the conclusions that scientists draw from it.
A new study by Lombardo et al. helps improve our understanding of this problem and illustrates ways to refine representations of rainfall in environmental models.
The team developed a method for breaking up, or disaggregating, rainfall measurements into many individual blocks of time, each one
less than a month long. First, the researchers calculated the probabil-ity of rainfall occurring, as well as how that probability would ran-domly evolve over time.
They then compared their calculations to data collected at a rain gauge in Viterbo, Italy, between 1995 and 2005. The gauge was set up to take rainfall measurements every 30 minutes. This comparison allowed the researchers to test the model’s ability to successfully sim-ulate the behavior of real- life rainfall at more frequent time intervals.
It is one thing to measure the amount of rain a given location receives in a year or a month, but being able to represent when rain-fall is occurring on finer timescales is even more useful. This study has produced a more realistic, yet simple, model with which scientists can better simulate rainfall. (Water Resources Research, https:// doi . org/10 . 1002/ 2017WR020529, 2017) — Sarah Witman, Freelance Writer
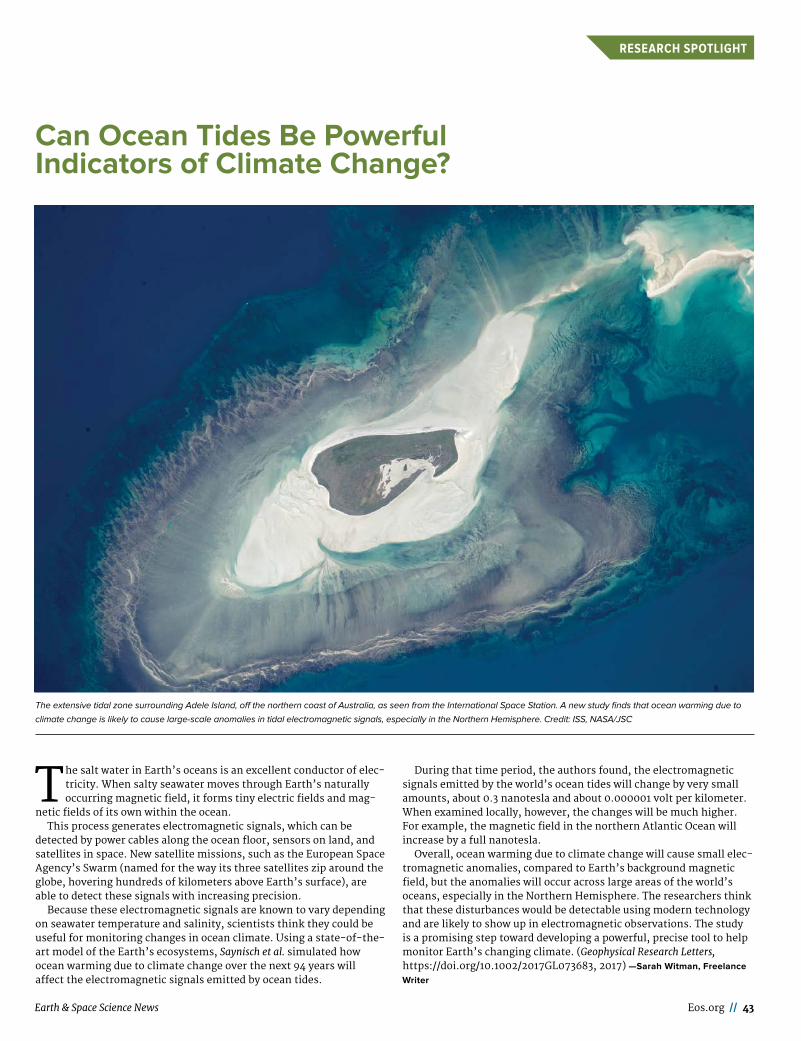
Earth & Space Science News Eos.org // 43
RESEARCH SPOTLIGHT
Can Ocean Tides Be Powerful Indicators of Climate Change?
The salt water in Earth’s oceans is an excellent conductor of elec-tricity. When salty seawater moves through Earth’s naturally occurring magnetic field, it forms tiny electric fields and mag-
netic fields of its own within the ocean.This process generates electromagnetic signals, which can be
detected by power cables along the ocean floor, sensors on land, and satellites in space. New satellite missions, such as the European Space Agency’s Swarm (named for the way its three satellites zip around the globe, hovering hundreds of kilometers above Earth’s surface), are able to detect these signals with increasing precision.
Because these electromagnetic signals are known to vary depending on seawater temperature and salinity, scientists think they could be useful for monitoring changes in ocean climate. Using a state- of- the- art model of the Earth’s ecosystems, Saynisch et al. simulated how ocean warming due to climate change over the next 94 years will affect the electromagnetic signals emitted by ocean tides.
During that time period, the authors found, the electromagnetic signals emitted by the world’s ocean tides will change by very small amounts, about 0.3 nanotesla and about 0.000001 volt per kilometer. When examined locally, however, the changes will be much higher. For example, the magnetic field in the northern Atlantic Ocean will increase by a full nano tesla.
Overall, ocean warming due to climate change will cause small elec-tromagnetic anomalies, compared to Earth’s background magnetic field, but the anomalies will occur across large areas of the world’s oceans, especially in the Northern Hemisphere. The researchers think that these disturbances would be detectable using modern technology and are likely to show up in electromagnetic observations. The study is a promising step toward developing a powerful, precise tool to help monitor Earth’s changing climate. (Geophysical Research Letters, https://doi . org/10 . 1002/ 2017GL073683, 2017) — Sarah Witman, Freelance
Writer
The extensive tidal zone surrounding Adele Island, off the northern coast of Australia, as seen from the International Space Station. A new study finds that ocean warming due to
climate change is likely to cause large- scale anomalies in tidal electromagnetic signals, especially in the Northern Hemisphere. Credit: ISS, NASA/JSC

44 // Eos September 2017
RESEARCH SPOTLIGHT
Thunderstorms and rain showers are difficult to simulate using weather and climate models because they require representa-tion of atmospheric circulations down to the kilometer scale and
smaller. Because this detailed modeling takes a lot of computing power, the models that are capable of such fine resolution have so far been limited to subcontinental- scale simulations.
However, novel supercomputer designs using accelerators such as graphics processing units are opening up new opportunities to simu-late the details of thunderstorms on a continental scale. In a new study, Leutwyler et al. demonstrate the capabilities of a new version of the Consortium for Small- scale Modeling (COSMO) model, evalu-ating its ability to simulate storm processes across continental Europe.
At kilometer- scale resolution, COSMO is a convection- resolving model, meaning that it explicitly simulates the deep convection pro-cesses in which warm, moist air rises to create precipitation condi-tions. In contrast, other models use parameterization to simulate deep convection, which is a complex mathematical approach that despite recent advances, can introduce uncertainties.
To evaluate COSMO’s performance at a continental scale, the research team ran a 10- year simulation of Europe’s climate at a resolu-tion of 2.2 kilometers. They used atmospheric data from the ERA- Interim Reanalysis for the period 1999 through 2008 to drive the model.
The researchers then compared the COSMO simulation with obser-vational data sets for the same time period. These included data from rain gauge networks and energy balance stations (which measure sur-face solar radiation and heat transfer) and lightning data sets.
The team found that COSMO successfully simulated Europe- wide precipitation patterns for the 10- year period. The model performed especially well in reproducing summertime precipitation patterns and accurately simulated important aspects of the continent’s annual deep convection cycle.
The scientists also identified areas for improvement. For example, COSMO underestimated or overestimated hourly precipitation to dif-ferent degrees depending on whether the underlying terrain was flat or mountainous.
This work builds on previous research showing that supercomput-ers equipped with graphics processing units (GPUs) allow for rapid performance of the latest version of COSMO. The computations were done on the Piz Daint supercomputer of the Swiss National Super-computing Centre. One day of simulation takes about 18 minutes and uses 144 compute nodes (about 3% of the total resources). These cur-rent findings serve as a proof of concept that GPU technology allows for continental- scale climate simulation in a reasonable amount of time. (Journal of Geophysical Research: Atmospheres, https://doi . org/ 10 . 1002/ 2016JD026013, 2017) — Sarah Stanley, Freelance Writer
New Super computers AllowClimate Models to Capture Convection
Convective cloud over Lake Constance in Switzerland. New supercomputer designs that use graphics processing units enable continental- scale simulation of the convection pro-
cesses that form thunderstorms. Scientists have now demonstrated the capabilities of the latest version of a climate model designed for such simulations. Credit: Kurt Abderhalden

Earth & Space Science News Eos.org // 45
POSITIONS AVAILABLE
Atmospheric Sciences
Assistant Professor Faculty Position in Data Assimilation, University of Maryland
The Department of Atmospheric & Oceanic Science (AOSC) at the Univer-sity of Maryland invites applications for a tenure- track faculty position in Data Assimilation. The successful can-didate is expected to be a leader in the development of advanced methodolo-gies in atmospheric, ocean, land sur-face, cryospheric, and biogeochemical data assimilation, and to develop an independently funded program build-ing on the activities of the thriving interdisciplinary weather and chaos group. Preference will be given to can-didates who will further strengthen the collaboration between the University and nearby national laboratories including: NOAA’s National Weather Service and its National Centers for Environmental Prediction, NOAA’s National Environmental Satellite, Data, and Information Service and its Center for Satellite Applications and Research and Joint Center for Satellite Data Assimilation, NASA’s Global Modeling and Assimilation Office, and the Naval Research Laboratory. The candidate should demonstrate research accom-plishments of originality and depth with the potential to be an interna-tional scientific leader in data assimi-lation. The candidate should also have a strong commitment to the educa-
tional mission of the Department, including graduate student mentoring.
To apply: http:// ejobs .umd .edu/ postings/ 52722
Postdoctoral Research Associate at Princeton: Research the contribution of individual sources and sinks to atmospheric methane variability through mathematical modeling.
We seek an enthusiastic and ener-getic postdoctoral researcher to enhance the atmospheric chemistry modeling capabilities of the GFDL Earth System Model version 4 (ESM4) to represent the global methane cycle and to apply the model in conjunction with a suite of observations ( ground- based, satellite, airborne) to improve estimates of the global methane bud-get. Specifically, the individual will incorporate a representation of stable carbon and hydrogen isotopes in the chemical mechanism to simulate the isotopic composition of atmospheric methane. The scientist will leverage observations of methane isotopic com-position together with ESM4 model simulations to provide improved con-straints on the global methane budget, and to analyze the roles of individual sources and sinks in driving methane variability on decadal to centennial timescales. The individual will work with Drs. Vaishali Naik and Larry W. Horowitz in the Atmospheric Chemis-try and Climate group at the NOAA Geophysical Fluid Dynamics Laboratory
AGU’s Career Center is the main resource for recruitment advertising.
All Positions Available and additional job postings can be viewed at https://eos.org/jobs-support.
AGU offers printed recruitment advertising in Eos to reinforce your online job visibility and your brand.
Visit employers.agu.org to view all of the packages available for recruitment advertising.
SIMPLE TO RECRUIT• online packages to access our Career Center audience • 30-day and 60-day options available• prices range $475–$1,215
CHALLENGING TO RECRUIT• online and print packages to access the wider AGU community• 30-day and 60-day options available • prices range $795–$2,691
DIFFICULT TO RECRUIT • our most powerful packages for maximum multimedia exposure
to the AGU community• 30-day and 60-day options available• prices range $2,245–$5,841
FREE TO RECRUIT
• packages apply only to student and graduate studentroles and all bookings are subject to AGU approval
• eligible roles include: student fellowships, internships, assistantships, and scholarships
• Eos is published monthly. Deadlines for ads in each issueare published at http://sites.agu.org/media-kits/eos-advertising-deadlines/.
• Eos accepts employment and open position advertisements from governments, individuals, organizations, and academic institutions. We reserve the right to accept or reject ads at our discretion.
• Eos is not responsible for typographical errors.
* Print-only recruitment ads will only be allowed for those whose requirements include that positionsmust be advertised in a printed/paper medium.

46 // Eos September 2017
POSITIONS AVAILABLE
(GFDL) in collaboration with GFDL’s Biogeochemistry, Ecosystems, and Climate Group. The individual will also be able to take advantage of a wide range of related research at Princeton University and other NOAA labs, including the Earth System Research Laboratory.
Candidates must have received a Ph.D. in atmospheric science, earth sciences, applied math, or chemical sciences within three years of the starting date for the appointment. Training in atmospheric chemistry is strongly preferred. Strong modeling, quantitative, and/or statistical skills, and a working knowledge of the pro-cesses governing the global methane cycle are essential. Postdoctoral appointments are initially for one year, with renewal for subsequent years based on satisfactory performance and continued funding. A competitive sal-ary is offered commensurate with experience and qualifications.
Applicants are asked to submit applications, consisting of a vitae, a statement of research experience and interests, and names of at least 3 refer-ences who will provide letters of sup-port, to https:// www . princeton . edu/ acad- positions/ position/ 2181. Review of applications will begin as soon as they are received, and continue until the position is filled. This position is subject to the University’s back-ground check policy.
Princeton University is an equal opportunity/affirmative action employer and all qualified applicants will receive consideration for employ-ment without regard to age, race, color, religion, sex, sexual orientation, gen-der identity or expression, national origin, disability status, protected vet-eran status, or any other characteristic protected by law.
Postdoctoral Research AssociateThe Shepson Tropospheric Chemis-
try Research Group at Purdue University has an opening for a Postdoctoral Research Associate. The position involves an opportunity to lead, and to work on a number of other problems in atmospheric chemistry, but focusing on development and application of meth-ods for quantitative determination of greenhouse gas fluxes in a variety of natural and anthropogenically impacted environments. Expertise in atmo-spheric science, quantitative measure-ments and error analysis, chemical instrumentation, statistical data analy-sis, and good computational skills is essential. The position is for one year, but potentially renewable annually. The position will be open until filled. Inter-ested candidates should send a CV with a list of 3 references to:
Prof. Paul B. ShepsonPurdue University560 Oval Dr.West Lafayette, IN 47907
765- 494- [email protected] University is an ADVANCE
Institution. Purdue University is an EEO/AA employer fully committed to achieving a diverse work force. A back-ground check will be required for employment in this position.
Biogeosciences
Tenure track Assistant Professor in Weathering and Soil, University of Lausanne
The Faculty of Geosciences and Environment at the University of Laus-anne seeks to appoint an Tenure track Assistant Professor in Weathering and Soil Development (100%)
The position will focus on processes in the critical zone that link the impact of weathering to the Earth’s climate and to the evolution of landscape and biomass. Research approaches that integrate different temporal and spa-tial scales to identify mechanisms of soil development and the quantifica-tion of rates and fluxes involved in weathering processes are highly rec-ommended.
Expected start date: August 1st, 2018Contract length: 6 years, tenure and
promotion to the rank of Associate Professor expected after 5-6 years
The successful candidate will join the Institute of Earth Surface Dynamics (IDYST) and have an active research program with external funding, He or she will teach courses in the Bachelor of Geosciences and Environment, con-tribute to the Faculty’s masters pro-grams, including the MSc of Biogeosci-ences and will supervise masters and doctoral students.
Candidates need to demonstrate an ability to conduct research of high quality, to obtain competitive research grants and to publish in international scholarly journals, combining research in areas of weathering, soil develop-ment, biogeochemical cycles and land-scape evolution. An aptitude for teach-ing and for supervising master’s and doctoral theses is required.
Application deadline: October 15th, 2017
All details and apply button on: www . unil .ch/ emplois, externe, req ID 11463.
The University of Lausanne seeks to promote an equitable representation of men and women among its staff and strongly encourages applications from women
Hydrology
Assistant Professor of Earth and Planetary Sciences, Washington University in St. Louis
The Department of Earth and Plane-tary Sciences at Washington University in St. Louis invites applications for a tenure- track Assistant Professor posi-tion in the field of surface hydrology. The candidate is expected to perform basic research in hydrologic processes
at or near Earth’s surface. Areas of interest include but are not limited to fluvial, lacustrine, and/or estuarine systems, fluvial geomorphology and sediment transport, flooding, and rela-tionships to ecological and climate sys-tems. The ideal candidate will employ quantitative tools and will integrate computational approaches with direct and remotely sensed observations.
The successful candidate is expected to develop a vigorous, externally funded research program, maintain a strong publication record, advise stu-dents, provide outstanding teaching over a broad range of undergraduate and graduate courses, and participate actively in departmental governance and university service. We seek candi-dates who will strengthen existing research programs in geology, climate science, and remote sensing, as well as foster collaboration with scholars across the Washington University community.
Candidates must have a Ph.D. in Earth science, or a related field, at the time of appointment. Complete appli-cations include a cover letter, curricu-lum vitae, statements of teaching and research interests, and the names and contact information of at least four references as a single PDF, and should be sent to Professor Philip Skemer, Hydrology Search Committee Chair, Department of Earth and Planetary Sciences, Washington University, Campus Box 1169, 1 Brookings Drive, St. Louis, MO 63130, or via e-mail: hydrologysearch@ eps . wustl .edu. Applications must be received by Octo-ber 15, 2017 to ensure full consider-ation. Washington University is an Equal Opportunity Employer.
All qualified applicants will receive consideration for employment without regard to race, color, religion, age, sex, sexual orientation, gender identity or expression, national origin, genetic information, disability, or protected veteran status.
Postdoctoral Researcher in Data Assimilation of Coupled Subsurface-/ Surface- Flow Models, University of Tübingen, Germany
The hydrogeology workgroup at the University of Tübingen, Center for Applied Geoscience, Germany (http:// www. uni- tuebingen .de/ ?id =84392) seeks for a Postdoctoral Researcher (100%) in Data Assimilation of Coupled Subsurface-/ Surface- Flow Models for 36 months, starting in October 2017. Payment is based on the salary system of German state employees ( TV- L E- 13/14).
The research is performed within the Research Unit FOR2131 “Data Assimilation for Improved Characteri-zation of Fluxes across Compartmental Interfaces” (http:// www .for2131 .de), consisting of eight projects at seven institutions funded by Deutsche For-schungsgemeinschaft. The Research Unit studies cross- compartmental data

Earth & Space Science News Eos.org // 47
POSITIONS AVAILABLE
assimilation of coupled subsurface- landsurface- atmosphere models. Proj-ect P7 in Tübingen focuses on the value of groundwater data in the assimilation of the groundwater- soil- land- surface nexus using PARFLOW, CLM, and Ensemble- Kalman filters/smoothers. Details on the project can be requested from Daniel Erdal ( daniel . erdal@ uni -tuebingen .de, +49 707129- 75210).
Suitable candidates should have a strong background in numerical mod-eling of coupled subsurface- surface systems. Experience in data assimila-tion is highly beneficial. Programing skills are mandatory. Candidates should hold a doctoral degree with a dissertation in the field. We expect good communication skills in English and willingness to closely collaborate within the Research Unit.
Applications are to be submitted to Prof. Dr.-Ing. Olaf A. Cirpka, Univer-sity of Tübingen, Center for Applied Geoscience, Germany by email to olaf . cirpka @ifg . uni - tuebingen .de. Appli-cations should include a letter of moti-vation, a CV, transcripts or degree cer-tificates including grades, proof of special qualifications, prints of publi-cations, and a list of at least three ref-erees.
The University of Tübingen wants to increase the number of female
researchers and specifically encourages female candidates to apply.
Disabled persons will be preferred in case of equal qualification.
Research Physical Scientist, AST, Earth Sciences Remote Sensing, NASA Goddard Space Flight Center
The Hydrological Sciences Labora-tory at NASA Goddard Space Flight Center seeks a scientist to develop advanced techniques for remote sens-ing of snow water equivalent and/or snow depth. Experience in retrieving snow properties from space, particu-larly using active and passive micro-wave, LIDAR, and signal- of- opportunity (SoOp) observations, is highly desirable. The individual will lead research aimed at improving understanding of the global water cycle, develop applications of direct societal benefit, participate in field campaigns such as NASA’s SnowEx, and contribute to the design and devel-opment of future Earth observing mis-sions. S/he will be expected to main-tain an externally funded research program.
A Ph.D. or equivalent experience in Earth sciences or related discipline is highly desirable. The position is intended for a civil servant hire and restricted to U.S.A. citizens. Interested
scientists may apply at the GS-13, 14, or 15 levels, and should submit applica-tions through USAJOBS (www . usajobs .gov) (search vacancy announcement # GS17D0158 and GS17D0160). Vacant research positions may be filled at one of several grade levels depending upon the scientific impact of the person selected. To ensure the broadest con-sideration, applicants are encouraged to apply to both announcements. Applications must be received by Sep-tember 30, 2017 via the USAjobs web-site.
NASA GSFC is an Equal Opportunity Employer.
Natural Hazards
Assistant Professorship in Natural Hazards, Simon Fraser University
The Department of Earth Sciences at Simon Fraser University invites appli-cations for a tenure track Assistant Professorship in Natural Hazards com-mencing as early as September 2018. A PhD is required, and post- doctoral research, teaching or industry experi-ence is desirable. Qualified candidates will be considered for a Tier 2 Canada Research Chair (see below). The research activities of the successful candidate will complement the existing natural hazards research interests
within the Department, while contrib-uting to the expertise of the Depart-ment as a whole. Candidates with expertise in remote sensing, risk assessment and mitigation, field- based observation and/or laboratory- based studies examining natural haz-ards, in particular, geological hazards, are encouraged to apply.
The successful candidate will develop a strong, externally funded research program, and supervise both Master’s and doctoral students. Teach-ing responsibilities will include under-graduate and graduate level courses, to support the environmental geoscience curriculum, for example, by teaching courses in Quaternary geology or envi-ronmental geoscience. The successful candidate is expected to eventually take on a leadership role in the Centre for Natural Hazards Research.
For additional information about this position, see http:// www .sfu .ca/earth - sciences/
All qualified candidates are encour-aged to apply; however, Canadian Citi-zens and Permanent Residents will be given priority. Simon Fraser University is committed to employment equity and encourages applications from all qualified women and men, including visible minorities, Aboriginal peoples, persons with disabilities, and LGBTQ

48 // Eos September 2017
POSITIONS AVAILABLE
persons. The University acknowledges the potential impact of career inter-ruptions on a candidate’s record of research productivity, and encourages qualified candidates to explain any impact career interruptions may have had on their record of research achievements.
Applicants are requested to submit a curriculum vitae, a statement of research and teaching interests, and the names, addresses, phone numbers, and email addresses of three referees. Electronic applications are preferred. Review of applications will begin November 1, 2017.
CRC Tier 2 Chairs
• Tier 2 chairs are intended for exceptional emerging scholars (i.e., candidates must have been an active researcher in their field for fewer than 10 years at the time of nomination).
• Applicants who are more than 10 years from having earned their highest degree (and where career breaks exist, such as maternity, paren-tal or extended sick leave, clinical training, etc.) may have their eligibility for a Tier 2 chair assessed through the program’s Tier 2 justification process. Please contact the research grants office for more information.
• Please consult the Canada Research Chairs website for full pro-gram information, including further details on eligibility criteria.
http:// www . chairs - chaires .gc .ca/ program - programme / nomination - mise _en _ candidature -eng .aspx#s5
Please note that under the authority of the University Act personal infor-mation that is required by the Univer-sity for academic appointment compe-titions will be collected. For further details see: http:// www .sfu .ca/ vpacademic/ Faculty _ Openings/ Collection _ Notice .html.
Applications or requests for further information should be directed to:
Dr. Brent Ward
Chair, Department of Earth SciencesSimon Fraser University8888 University DriveBurnaby, BC V5A 1S6Phone: 778- 782- 4229 E-mail: eascsec@ sfu .ca
Ocean Science
Post- Doctoral Position in Physical Oceanography – University of Hawaii
A postdoctoral research position in Physical Oceanography is available at the International Pacific Research Center (IPRC) of the University of Hawaii. The successful candidate will participate in a NASA- funded project to advance scientific understanding of the spatial and temporal variability in the ocean transport of heat and salt carried by mesoscale eddies and their effects on the general circula-tion. The study will rely on the com-bined analysis of various satellite data, such as sea level anomaly, sea surface temperature, sea surface salinity, and in- situ, primarily Argo profile data to describe mesoscale eddies at the surface, explore their subsurface structure, and assess their transport properties. Analysis of the observational data will be aided by a high- resolution OGCM.
Applicants should have a recent PhD in Physical Oceanography or closely related field, must be fluent in scientific computer programming, and have strong communication skills. Experience in dynamical analysis and interpretation of observed ocean data and numerical models is an advan-tage. Initial appointment is for one year with the possibility of renewal based on satisfactory performance and continued funding
The selected candidate will work closely with Dr. Oleg Melnichenko, the Principal Investigator of the project. For further information about IPRC, visit http:// iprc . soest . hawaii .edu.
Applicants are asked to submit elec-tronically (1) a cover letter describing research experience, (2) a CV, and (3) contact information for three ref-erences. Applications should be sub-mitted to: Dr. Oleg Melnichenko, oleg@ hawaii .edu. Questions about the position may be directed to the same address. Review of applications will begin on October 15, 2017 and will continue until the position is filled.
Professor of Atmosphere Ocean Sci-ence and Mathematics (open rank, tenured/ tenure track), The Courant Institute of Mathematical Sciences at New York University
The Center for Atmosphere Ocean Science (CAOS), a unit of the Depart-ment of Mathematics within the Cou-rant Institute of Mathematical Sci-ences at New York University, seeks candidates for an open rank faculty position, anticipated to begin in Sep-tember 2018. Appointments may be made at either a junior or senior level. The CAOS group focuses on the inter-section between applied mathematics and atmosphere ocean science (including the cryosphere), and hosts a distinct interdisciplinary PhD pro-gram within the Courant Institute. The ideal candidate will leverage existing strengths of the Courant Institute in applied mathematics to atmosphere- ocean- climate research. A research focus in multi- scale dynamics, high- performance simula-tion, or physical oceanography would be especially attractive, but excep-tional candidates from any relevant area will be considered.
Please include a CV, a short state-ment of your research and teaching interests, and a list of at least three references who could provide a letter on your behalf upon request.
A PhD in Atmospheric Science, Oce-anic Science, Mathematics, or a related field is required.
Applications can be submitted through Interfolio.com via the direct link
https:// apply . interfolio .com/ 42829Applications and supporting docu-
ments received by September 30th, 2017 will receive full consideration.
The Courant Institute/New York University is an Equal Opportunity/Affirmative Action Employer. Applica-tions from women and underrepre-sented groups are particularly encour-aged.
New York University is situated in Greenwich Village, one of the most vibrant and family friendly neighbor-hoods in the City of New York.
Paleoceanography and Paleoclimatology
Assistant Professor– Late - Quaternary Climate Science, Syra-cuse University
The Syracuse University Department of Earth Sciences seeks applicants for a
tenure- track Assistant Professor posi-tion in climate change science, who will hold the Thonis Family Endowed Professorship. Scientists with exper-tise in observational approaches to late- Quaternary paleoclimatology and with established links to the cli-mate modeling community are strongly encouraged to apply. The department welcomes applicants with expertise collecting, character-izing and calibrating quantitative records of past temperature, sea level change, glacial dynamics, hydrocli-mate, and terrestrial responses to natural and anthropogenic forcing. The ideal candidate will collaborate across traditional disciplinary bound-aries within the Department of Earth Sciences and the greater SU commu-nity, which includes expertise in energy, sustainability, and water resources. The successful applicant will arrive with or establish a strong, externally funded research program and develop a portfolio of excellence in teaching at the graduate and undergraduate levels. Active public engagement on issues of a changing climate is an essential part of the appointment. Applicants will teach a large, introductory- level class in Earth Science, contribute to existing courses in paleoclimatology and develop new undergraduate and grad-uate courses in the science of climate change.
The Department of Earth Sciences at Syracuse University (http:// earthsciences .syr .edu) currently has 15 full- time faculty with broad research strengths in the solid earth, geochronology, hydrology and paleo-climatology. The Department has an outstanding array of analytical facili-ties and recently renovated laborato-ries, and the University has an estab-lished track record of supporting research infrastructure.
Applicants should submit a cover letter, curriculum vitae, statements of research and teaching interests, copies of three relevant publications, and the contact information for three referees to https:// www . sujobopps .com/ postings/ 70988, preferably by November 15, 2017. The search committee will be available to meet with candidates at the GSA and Fall AGU meetings; the search will remain open until the position is filled.
Syracuse University is interested in candidates who have the communica-tion skills and cross- cultural abilities to maximize their effectiveness with diverse groups of colleagues, students and community members. Women, military veterans, individuals with disabilities, and members of other traditionally underrepresented groups are encouraged to apply. Syra-cuse University is an equal opportu-nity employer, as well as a federal contractor required to take affirma-tive action on behalf of protected vet-erans.
PLACE YOUR AD
HEREVisit Careers.agu.org to learn more about employment advertising with AGU

Dear science enthusiasts,
I’m over here in Switzerland on a collaborative visit doing some mountain science with the hydrology group in the Institute of Geography at University of Bern. Yesterday we took advantage of a significant rain-on-snow event above 2000 meters to run a qual-itative evaluation of water percolation though a satu-rated snowpack.
We hiked in and applied food-grade coloring to the surface of a slightly inclined 2 × 2 meter plot near some instrumental stations to visualize lateral versus vertical water flow in the snowpack. It had been rain-ing all night, but had mostly stopped when we began the test. Although there were some preferential flow paths across ice lensing, the entire column except for the uphill edge indicated downhill percolation from the surface after less than 3 hours. That’s a lot of water moving inside the snow, if you look at entire slopes! Thanks to M.S. students Sven (green) and Till (blue) for a great day in the Alps!
Cheers!
—Scotty Strachan, Department of Geography, Uni-versity of Nevada, Reno, USA
View more postcards athttp://americangeophysicalunion.tumblr . com/tagged/postcards-from-the-fi eld.
Postcards from the Field

Housing and Early Registration Deadline: 3 November 2017, 11:59 P.M. ET
fallmeeting.agu.org
Act Now to Save on Registration and Housing


