76
Vol. No. 12 Issue No. 5 November 2014
| Date post: | 25-Apr-2018 |
| Category: |
Documents |
| Upload: | trinhduong |
| View: | 216 times |
| Download: | 1 times |
Vol. No. 12 Issue No. 5 November 2014

2 November 2014 Intouchmutually
PPAAGGEE NNOO..MARKET REVIEW 3EDITORIAL 4FFEEAATTUURREESS OOFF OOUURR SSEELLEECCTT SSCCHHEEMMEESS 55-1166HDFC GROWTH FUND 17HDFC EQUITY FUND 17HDFC TOP 200 FUND 18HDFC CAPITAL BUILDER FUND 18HDFC CORE & SATELLITE FUND 19HDFC PREMIER MULTI-CAP FUND 19HDFC LARGE-CAP FUND 20HDFC MID-CAP OPPORTUNITIES FUND 20HDFC SMALL AND MID-CAP FUND 21HDFC INFRASTRUCTURE FUND 21HDFC LONG TERM ADVANTAGE FUND 22HDFC TAXSAVER 22HDFC INDEX FUND - SENSEX PLAN & NIFTY PLAN 23HDFC INDEX FUND - SENSEX PLUS PLAN 24HDFC BALANCED FUND 24HDFC PRUDENCE FUND 25HDFC CHILDREN’S GIFT FUND - INVESTMENT PLAN 25HDFC CHILDREN’S GIFT FUND - SAVINGS PLAN 26HDFC MF MIP - SHORT TERM PLAN 26HDFC MF MIP - LONG TERM PLAN 27HDFC MULTIPLE YIELD FUND 27HDFC MULTIPLE YIELD FUND - PLAN 2005 28HDFC INCOME FUND 28HDFC HIGH INTEREST FUND - DYNAMIC PLAN 29HDFC HIGH INTEREST FUND - SHORT TERM PLAN 29HDFC SHORT TERM PLAN 30HDFC SHORT TERM OPPORTUNITIES FUND 30HDFC MEDIUM TERM OPPORTUNITIES FUND 31HDFC GILT FUND - LONG TERM PLAN 31HDFC FLOATING RATE INCOME FUND - SHORT TERM PLAN & LONG TERM PLAN 32HDFC LIQUID FUND 33HDFC CASH MANAGEMENT FUND - SAVINGS PLAN 33HDFC CASH MANAGEMENT FUND - TREASURY ADVANTAGE PLAN 34HDFC CORPORATE DEBT OPPORTUNITIES FUND 34SSIIPP PPEERRFFOORRMMAANNCCEE OOFF SSEELLEECCTT SSCCHHEEMMEESS 3355-3366SCHEME PERFORMANCE SUMMARY - REGULAR PLANS 37-55SCHEME PERFORMANCE SUMMARY - DIRECT PLANS 56-70DIVIDEND HISTORY 71-74DISCLAIMER 74
CONTENTS

During the month of November, equity markets performed well with both SENSEXand Nifty reaching new highs. The SENSEX
and Nifty were up ~3% each. The CNX MidcapIndex outperformed and gained ~4.6%. Healthcare,IT, FMCG and Banking sectors performed wellwhile Metal, Capital Goods and Oil & Gas underperformed.
INR appreciated ~1.1% in November. FII’sbought ~US$ 2.2bn net of Indian equities inNovember. Domestic Mutual funds continue to seehealthy inflows, equity mutual funds net inflowsbetween April and October 2014 have been around` 39,220 crs.
The global equity markets also continue to per-form well with US markets reaching new highs. TheDow Jones and the NASDAQ were up 2.5% and3.5% respectively. In Europe, the FTSE, CAC andDAX were up 2.7-7%. In Asia, the ShanghaiComposite & Nikkei were up 10.9% & 6.4% respec-tively, Taiex and Kospi was up 1-2% and Hang Sengended almost flat.
Commodities continued to move lower duringthe month. Brent Crude fell sharply by ~19% and isnow down ~33% in last three months. Gold was
down 0.5% and silver also went down sharply by~4% during the month. Aluminium, Copper & Zincwere down 1.7-5% while Lead was up 1%.
India is a key beneficiary from lower commodi-ty prices, especially crude oil. Fall in commodityprices is likely to lead to a sharp fall in CAD, infla-tion and lower fiscal deficit as well. A strong,growth oriented and business friendly governmentbodes well for economic growth and for businesses.Current P/E multiples of equity markets are reason-able – neither expensive, nor cheap. However, cor-porate earnings should be better than estimates ascorporate margins are significantly below the longterm averages and should improve as capacity uti-lization and business conditions improve. There isthus room for multiples to expand on expectationsof growth to improve and as interest rates to movelower besides strong earnings growth.
In our opinion therefore, the outlook for equitiesis promising and there is merit in increasing alloca-tion to equities (for those with a medium to longterm view) in a phased manner and to stay invested.However, given the sharp rally in markets in lastyear or so, it is not advisable to invest in marketswith a short term view.
Equity market update
During the month of November 2014, theyield on 10-year benchmark Governmentbond (8.4% GoI 2024) ended at 8.09% as
against 8.28% in end October. The liquidity availed through various sources
(Liquidity Adjustment Facility, export refinance,marginal standing facility and term repos) from RBIduring the month was lower at ` 49,545 crs as com-pared to ` 61,299 crs in September 2014. The NSEovernight MIBOR ended at 8.02%, higher than therate seen in end September 2014 (7.4%).
The INR depreciated to 62.0 against the US dollar as compared to 61.4 at the end of previousmonth. The net FII investment in equities & debtwas an inflow of ~US$ 4.1 billion in November2014 as compared to an inflow of US$ 2.9 billion in October. The net FII investment in equities &debt has been US$ 40.4 billion so far in calendaryear 2014.
The annual rate of inflation, based on monthlyWPI, stood at 1.8% (provisional) for the month ofOctober, 2014 (over October, 2013) as compared to2.4% (provisional) for the previous month and 7.2%during the corresponding month of the previousyear. Headline CPI came in at ~5.5% in Octobercompared to ~6.5% in September. Core CPI wasstable at 5.9%.
Industrial production (IP) growth was 2.5% y-o-y in September, unchanged from July. Excludingcapital goods industrial production grew 1.2%
y-o-y in September from 2.2% in August.In the December credit policy review, RBI kept
the repo and reverse repo rates on hold at 8.00% and7.00% respectively in line with consensus expecta-tions. The RBI has maintained its estimate for realGDP growth in 2014-15 at 5.5% and expects only agradual pick-up in growth momentum in 2015-16.RBI has acknowledged the recent deceleration ininflation and has revised downwards its March 2015CPI Inflation projection to 6% from 8% and itsJanuary 2016 inflation projection has also been keptat 6%. RBI now sees the medium term risks aroundits January 2016 target of 6% as evenly balancedrather than to the upside as in the last policy meeting.
OutlookIn the December credit policy review RBI has clear-ly turned more dovish with its guidance for a changein monetary policy stance likely early next year.The recent correction in crude oil prices (of nearly33% over last 3 months) has multiple benefits in theform of decline in inflation, current account deficit(CAD) and savings in subsidy. Apart from the dropin crude prices, we continue to expect growth togradually improve leading to a possibility of a sov-ereign rating upgrade. In view of the above, we reit-erate our view of lower rates over the medium term.We recommend investors to take some exposure toGilt Funds with high duration to benefit from ourview of likely fall in rates.
Debt market update
November 2014 3Intouchmutually
Market Review - November 2014
Source for various data points: Bloomberg, Reuters, www.sebi.gov.in, www.rbi.org.in and Central Statistics Office (CSO).

Suddenly, India’s hotel industry issitting pretty. Foreign touristshave begun pouring into the
country in greater numbers, triggeringan increase in demand for qualityhotel rooms; a steady stream of for-eigners coming to India for medicaltreatment is adding to the demand for
rooms and keeping revenues buoyant; and,as more and more companies organiseevents such as ‘off-sites’ or retreats fortheir employees in an effort to createopportunities for them to bond togetherand build team spirit, this has emerged asyet another revenue stream for the hospi-tality industry.
Between May and October this year,foreign tourist arrivals in India increasedby 12 per cent to 3.2 million, compared tothe same period of 2013, according to gov-ernment data. Growth in May-October2013 had been a mere 6 per cent over May-October 2012. Premium hotel companiesthat had seen revenue of growth of a mere2-3 per cent in 2013-14 have enjoyed rev-enue growth of between 5 per cent and 10per cent in the first half of 2014-15,according to the hospitality industry.
Hospitality industry executives say thattwo factors are responsible for thesehealthy numbers. First, the perception ofIndia as an investment destination hasimproved; second, the decision to offervisas on arrival to nationals of select coun-tries has also helped. India had started thefiscal year 2014-15 with a surplus of hotelrooms, but this helped absorb theincreased influx of tourists without caus-ing room shortages.
The big boom is in medical tourism,with business for hotels from this segmentgrowing at over 25 per cent year on year.The great advantage of medical tourism,according to the hospitality industry, isthat it is a year-round business, unlikebusiness and leisure travel, in which thereis an element of seasonality. And it ispoised to grow further.
According to a study done by a chamberof commerce and industry, since the cost ofsurgeries in India is much lower than in theWestern countries (and with several devel-oping countries lacking the kind of medical
expertise that is available in India), med-ical tourism is poised to grow into a`12,000 crore industry by 2015, with morethan 4.5 million people expected to travelto India in search of medical treatment.
This growing business potential haseven triggered a new trend, of hotel prop-erties coming up near well-known special-ty hospitals in Mumbai, Delhi, Gurgaonand Chennai, to name a few cities. Andwith their special guests in view, suchhotels are offering facilities such as rampsat the entrances for easy of entry, large liftsto accommodate stretchers, special mealsto suit the dietary needs of patients, andspecial tariffs. Finally, amidst the new opti-mism that is a feature of the Indian corpo-rate sector and the economy in general,companies are increasingly using ‘off-site’activities to motivate employees, buildmorale and create bonding opportunitiesthat boost the effectiveness of teams.
A toothpaste manufacturer recentlyhad a two-day off-site activity at a five-starhotel in Goa, which featured a variety ofcompetitive activities. Another organisa-tion conducted a ‘firewalk’ activity at itsemployee off-site at a hotel in Bangalore,while a third organised culinary classes forits employees during a three-day off-site ata Goa hotel. A leading pharma manufac-turer also conducted a two-day retreat at aBangalore hotel as a reward for its salesforce. A company that specialises in con-ferences and events recently conducted athree-day off-site at a hotel in Kochi for aKochi-based company, the high point ofwhich was a boat cruise in the backwaters.
This trend has boosted hotel revenues,which have seen a substantial increase inincome from such events. One luxuryresort located in the Western Ghats, whichconducts such events, has seen a 60 percent increase in bookings for corporate off-sites this year. According to a hospitalityindustry executive, hotels have increasedtheir budget for such events by between 10per cent and 20 per cent this year.
B S REPORTER
This article is issued in general investor interest.
Please refer Page No. 74 for disclaimer.
Hotels have it good
Intouchmutually4 November 2014

Intouchmutually November 2014 5
NNaattuurree ooff SScchheemmee
TThhiiss pprroodduucctt iiss ssuuiittaabbllee ffoorr iinnvveessttoorrsswwhhoo aarree sseeeekkiinngg ~~
FFuunndd MMaannaaggeerr
IInncceeppttiioonn DDaattee((DDaattee ooff AAlllloottmmeenntt))
EEnnttrryy // SSaalleess LLooaadd
EExxiitt LLooaadd
IInnvveessttmmeenntt PPllaann
IInnvveessttmmeenntt OOppttiioonnss
MMiinniimmuumm AApppplliiccaattiioonn AAmmoouunntt((UUnnddeerr eeaacchh PPllaann //OOppttiioonn))
NNeett AAsssseett VVaalluuee((NNAAVV))
RReeddeemmppttiioonnPPrroocceeeeddss
HDFC Growth Fund
Open-ended Growth Scheme
● Capital appreciation over long term.
● Investment predominantly in equity and equity related instruments
● High risk. ((BBrroowwnn))
Srinivas Rao Ravuri (since April 3, 06)#
September 11, 2000
HDFC Growth Fund, HDFC Growth Fund - Direct Plan
HDFC Equity Fund
Open-ended Growth Scheme
● Capital appreciation over long term.
● Investment predominantly in equity and equity related instruments of medium to largesized companies
● High risk. ((BBrroowwnn))
Prashant Jain (since June 19, 03)*#
January 1, 1995
HDFC Equity Fund, HDFC Equity Fund - Direct Plan
HDFC Top 200 Fund
Open-ended Growth Scheme
● Capital appreciation over long term.
● Investment in equity and equitylinked instruments including equity derivatives primarily drawnfrom the companies in the S&PBSE 200 Index.
● High risk. ((BBrroowwnn))
Prashant Jain (since June19, 03)*#
October 11, 1996
HDFC Top 200 Fund, HDFC Top 200 Fund - Direct Plan
HDFC Capital Builder Fund
Open-ended Growth Scheme
● Capital appreciation over long term.
● Investment predominantly in equity and equity related instruments of strong companies.
● High risk. ((BBrroowwnn))
Chirag Setalvad (since April 2, 07) & Miten Lathia (since May 10, 12)#
February 1, 1994
● In respect of eeaacchh purchase /switch-in of Units, an Exit Load of1.00% is payable if Units areredeemed / switched-out within18 months from the date of allotment.
● No Exit Load is payable if Unitsare redeemed / switched-out after 18 months from the date of allotment.
HDFC Capital Builder Fund, HDFCCapital Builder Fund - Direct Plan
Investors are advised to consult their tax advisors with respect to the tax consequences of the purchase, ownership and disposal of mutual fund units. For Tax Benefits / Consequences, Please refer to page 16* Date of migration from Zurich India Mutual Fund (Close of business hours - June 19, 03)# Dedicated Fund Manager for Overseas Investments: Mr Rakesh Vyas.
Features of our select schemes
NNoott AApppplliiccaabbllee.. Upfront commission shall be paid directly by the investor to the ARN Holder (AMFI registered Distributor) based on the investors’assessment of various factors including the service rendered by the ARN Holder.
Under Each Plan : Growth & Dividend. The Dividend Option offers Dividend Payout and Reinvestment facility.
(Brown) - Investors understand that their principal will be at high risk.
(Blue) - Investors understand that their principal will be at low risk.(Yellow) - Investors understand that their principal will be at medium risk.
~~ Investors should consult their financial advisers if in doubt about whether the product is suitable for them.NNoottee:: RRiisskk iiss rreepprreesseenntteedd aass::
● In respect of eeaacchh purchase / switch-in of Units, an Exit Load of 1% is payable if units are redeemed /switched-out within 1 year from the date of allotment.
● No Exit Load is payable if Units are redeemed / switched-out after 1 year from the date of allotment.
FFoorr ffuurrtthheerr ddeettaaiillss,, pplleeaassee rreeffeerr ttoo ppaarraa ‘‘EExxiitt LLooaadd’’ oonn PPgg 1166..
Normally despatched within 3-4 Business Days.
Every Business Day
Purchase : ` 5,000 and any amount thereafter. Additional Purchase : ` 1,000 and any amount thereafter.

Features of our select schemes
Intouchmutually6 November 2014
NNaattuurree ooff SScchheemmee
TThhiiss pprroodduucctt iiss ssuuiittaabbllee ffoorr iinnvveessttoorrsswwhhoo aarree sseeeekkiinngg ~~
FFuunndd MMaannaaggeerr
IInncceeppttiioonn DDaattee((DDaattee ooff AAlllloottmmeenntt))
EEnnttrryy // SSaalleess LLooaadd
EExxiitt LLooaadd
IInnvveessttmmeenntt PPllaann
IInnvveessttmmeenntt OOppttiioonnss
MMiinniimmuumm AApppplliiccaattiioonn AAmmoouunntt((UUnnddeerr eeaacchh PPllaann //OOppttiioonn))
NNeett AAsssseett VVaalluuee((NNAAVV))
RReeddeemmppttiioonnPPrroocceeeeddss
HDFC Core & Satellite Fund
Open-ended Growth Scheme
● Capital appreciation over long term.
● Investment primarily in equity and equityrelated instruments of companies whoseshares are quoting at prices below theirtrue value.
● High risk. ((BBrroowwnn))
Vinay Kulkarni(since November 21, 06)#
September 17, 2004
● In respect of each purchase / switch-in ofUnits, an Exit Load of 3.00% is payable ifUnits are redeemed / switched-out within12 months from the date of allotment.
● In respect of each purchase / switch-in ofUnits, an Exit Load of 2.00% is payable ifUnits are redeemed / switched-out after 12months but within 24 months from thedate of allotment.
● In respect of each purchase / switch-in ofUnits, an Exit Load of 1.00% is payable ifUnits are redeemed / switched-out after 24months but within 36 months from thedate of allotment.
● No Exit Load is payable if Units areredeemed / switched-out after 36 monthsfrom the date of allotment.(With effect from December 1, 2014)
HDFC Core & Satellite Fund, HDFC Core &Satellite Fund - Direct Plan
HDFC Premier Multi-Cap Fund
Open-ended Growth Scheme
● Capital appreciation over long term.
● Investment predominantly in equity and equity related instruments of Mid Cap and Large Cap ‘blue chip’ companies.
● High risk. ((BBrroowwnn))
Vinay Kulkarni(since November 21, 06)#
April 6, 2005
HDFC Premier Multi-Cap Fund,HDFC Premier Multi-Cap Fund -Direct Plan
HDFC Mid-Cap Opportunities Fund
Open-ended Equity Scheme
● Capital appreciation over long term.
● Investment predominantly in equity and equity related instruments of Small and Mid Cap companies.
● High risk. ((BBrroowwnn))
Chirag Setalvad (since June 25, 07)#
June 25, 2007
HDFC Mid-Cap Opportunities Fund,HDFC Mid-Cap Opportunities Fund- Direct Plan
Investors are advised to consult their tax advisors with respect to the tax consequences of the purchase, ownership and disposal of mutual fund units. For Tax Benefits / Consequences, Please refer to page 16* Date of migration from Morgan Stanley Mutual Fund (Close of business hours - June 27, 14) # Dedicated Fund Manager for Overseas Investments: Mr Rakesh Vyas.
HDFC Large Cap Fund (Erstwhile Morgan Stanley Growth Fund)
Open-ended Equity Scheme
● Capital appreciation over long term.
● Investment in equity and equity related instruments ofLarge Cap companies.
● High risk. ((BBrroowwnn))
Vinay Kulkarni (since June 28, 14)*#
February 18, 1994
HDFC Large Cap Fund - Regular PlanHDFC Large Cap Fund - Direct Plan
(Brown) - Investors understand that their principal will be at high risk.
(Blue) - Investors understand that their principal will be at low risk.(Yellow) - Investors understand that their principal will be at medium risk.
~~ Investors should consult their financial advisers if in doubt about whether the product is suitable for them.NNoottee:: RRiisskk iiss rreepprreesseenntteedd aass::
NNoott AApppplliiccaabbllee.. Upfront commission shall be paid directly by the investor to the ARN Holder (AMFI registered Distributor) based on the investors’ assessment of various factors including the service rendered by the ARN Holder.
● In respect of eeaacchh purchase / switch-in of Units, an Exit Load of 1% is payable if units are redeemed/ switched-out within 1 year from the date of allotment.
● No Exit Load is payable if Units are redeemed / switched-out after 1 year from the date of allotment.
FFoorr ffuurrtthheerr ddeettaaiillss,, pplleeaassee rreeffeerr ttoo ppaarraa ‘‘EExxiitt LLooaadd’’ oonn PPgg 1166..
Under Each Plan : Growth & Dividend. The Dividend Option offers Dividend Payout and Reinvestment facility.
Purchase : ` 5,000 and any amount thereafter. Additional Purchase : ` 1,000 and any amount thereafter.
Every Business Day
Normally despatched within 3-4 Business Days.
Intouchmutually November 2014 7
Features of our select schemes
Investors are advised to consult their tax advisors with respect to the tax consequences of the purchase, ownership and disposal of mutual fund units. For Tax Benefits / Consequences, Please refer to page 16 # Dedicated Fund Manager for Overseas Investments: Mr Rakesh Vyas.
NNaattuurree ooff SScchheemmee
TThhiiss pprroodduucctt iiss ssuuiittaabbllee ffoorr iinnvveessttoorrsswwhhoo aarree sseeeekkiinngg ~~
FFuunndd MMaannaaggeerr
IInncceeppttiioonn DDaattee((DDaattee ooff AAlllloottmmeenntt))
EEnnttrryy // SSaalleess LLooaadd
EExxiitt LLooaadd
IInnvveessttmmeenntt PPllaann
IInnvveessttmmeenntt OOppttiioonnss
MMiinniimmuumm AApppplliiccaattiioonn AAmmoouunntt((UUnnddeerr eeaacchh PPllaann //OOppttiioonn))
LLoocckk-iinn PPeerriioodd
NNeett AAsssseett VVaalluuee((NNAAVV))
RReeddeemmppttiioonnPPrroocceeeeddss
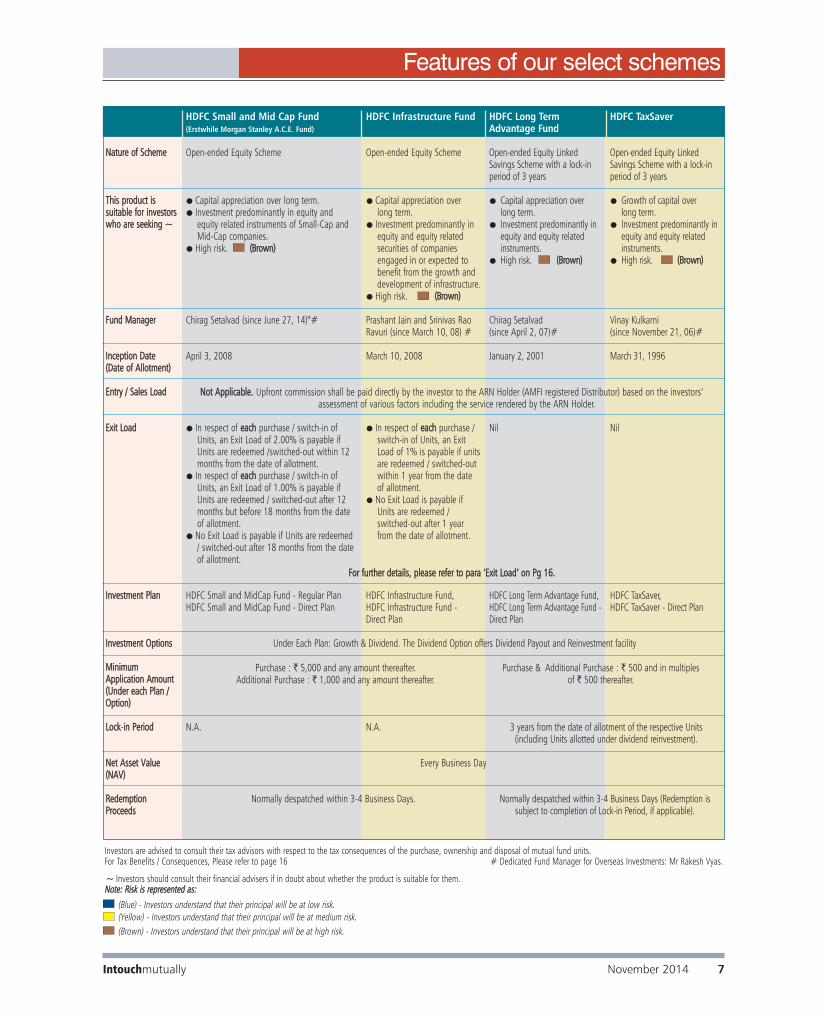
HDFC Infrastructure Fund
Open-ended Equity Scheme
● Capital appreciation over long term.
● Investment predominantly inequity and equity related securities of companiesengaged in or expected tobenefit from the growth anddevelopment of infrastructure.
● High risk. ((BBrroowwnn))
Prashant Jain and Srinivas RaoRavuri (since March 10, 08) #
March 10, 2008
● In respect of eeaacchh purchase /switch-in of Units, an ExitLoad of 1% is payable if unitsare redeemed / switched-out within 1 year from the date of allotment.
● No Exit Load is payable ifUnits are redeemed /switched-out after 1 yearfrom the date of allotment.
HDFC Infrastructure Fund, HDFC Infrastructure Fund - Direct Plan
N.A.
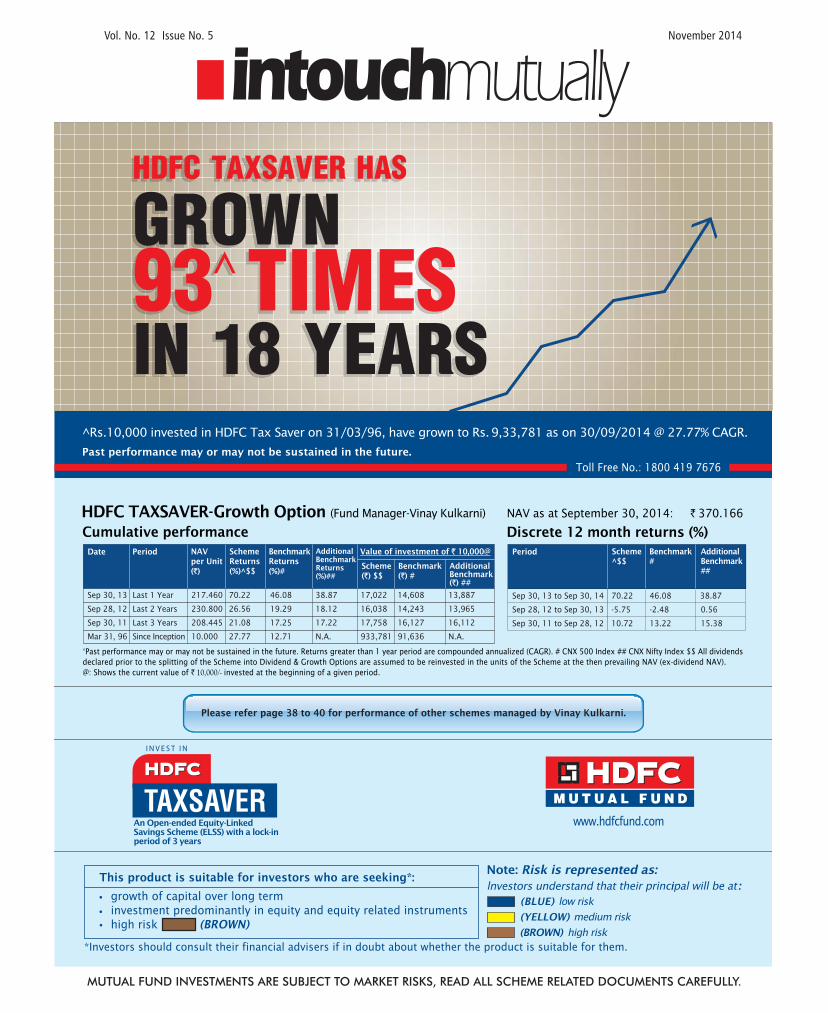
HDFC TaxSaver
Open-ended Equity LinkedSavings Scheme with a lock-inperiod of 3 years
● Growth of capital over long term.
● Investment predominantly inequity and equity related instruments.
● High risk. ((BBrroowwnn))
Vinay Kulkarni (since November 21, 06)#
March 31, 1996
Nil
HDFC TaxSaver, HDFC TaxSaver - Direct Plan
HDFC Long TermAdvantage Fund
Open-ended Equity LinkedSavings Scheme with a lock-inperiod of 3 years
● Capital appreciation over long term.
● Investment predominantly inequity and equity related instruments.
● High risk. ((BBrroowwnn))
Chirag Setalvad (since April 2, 07)#
January 2, 2001
Nil
HDFC Long Term Advantage Fund, HDFC Long Term Advantage Fund -Direct Plan
Purchase & Additional Purchase : ` 500 and in multiples of ` 500 thereafter.
3 years from the date of allotment of the respective Units(including Units allotted under dividend reinvestment).
Normally despatched within 3-4 Business Days (Redemption issubject to completion of Lock-in Period, if applicable).
(Brown) - Investors understand that their principal will be at high risk.
(Blue) - Investors understand that their principal will be at low risk.(Yellow) - Investors understand that their principal will be at medium risk.
~~ Investors should consult their financial advisers if in doubt about whether the product is suitable for them.NNoottee:: RRiisskk iiss rreepprreesseenntteedd aass::
HDFC Small and Mid Cap Fund (Erstwhile Morgan Stanley A.C.E. Fund)
Open-ended Equity Scheme
● Capital appreciation over long term.● Investment predominantly in equity and
equity related instruments of Small-Cap and Mid-Cap companies.
● High risk. ((BBrroowwnn))
Chirag Setalvad (since June 27, 14)*#
April 3, 2008
● In respect of eeaacchh purchase / switch-in ofUnits, an Exit Load of 2.00% is payable ifUnits are redeemed /switched-out within 12months from the date of allotment.
● In respect of eeaacchh purchase / switch-in ofUnits, an Exit Load of 1.00% is payable ifUnits are redeemed / switched-out after 12months but before 18 months from the dateof allotment.
● No Exit Load is payable if Units are redeemed/ switched-out after 18 months from the dateof allotment.
HDFC Small and MidCap Fund - Regular PlanHDFC Small and MidCap Fund - Direct Plan
N.A.
NNoott AApppplliiccaabbllee.. Upfront commission shall be paid directly by the investor to the ARN Holder (AMFI registered Distributor) based on the investors’ assessment of various factors including the service rendered by the ARN Holder.
Under Each Plan: Growth & Dividend. The Dividend Option offers Dividend Payout and Reinvestment facility
FFoorr ffuurrtthheerr ddeettaaiillss,, pplleeaassee rreeffeerr ttoo ppaarraa ‘‘EExxiitt LLooaadd’’ oonn PPgg 1166..
Purchase : ` 5,000 and any amount thereafter.Additional Purchase : ` 1,000 and any amount thereafter.
Every Business Day
Normally despatched within 3-4 Business Days.
NNaattuurree ooff SScchheemmee
TThhiiss pprroodduucctt iiss ssuuiittaabbllee ffoorr iinnvveessttoorrsswwhhoo aarree sseeeekkiinngg ~~
FFuunndd MMaannaaggeerr
IInncceeppttiioonn DDaattee((DDaattee ooff AAlllloottmmeenntt))
EEnnttrryy // SSaalleess LLooaadd
EExxiitt LLooaadd
IInnvveessttmmeenntt PPllaann
IInnvveessttmmeenntt OOppttiioonnss
MMiinniimmuumm AApppplliiccaattiioonn AAmmoouunntt((UUnnddeerr eeaacchh PPllaann //OOppttiioonn))
NNeett AAsssseett VVaalluuee((NNAAVV))
RReeddeemmppttiioonnPPrroocceeeeddss
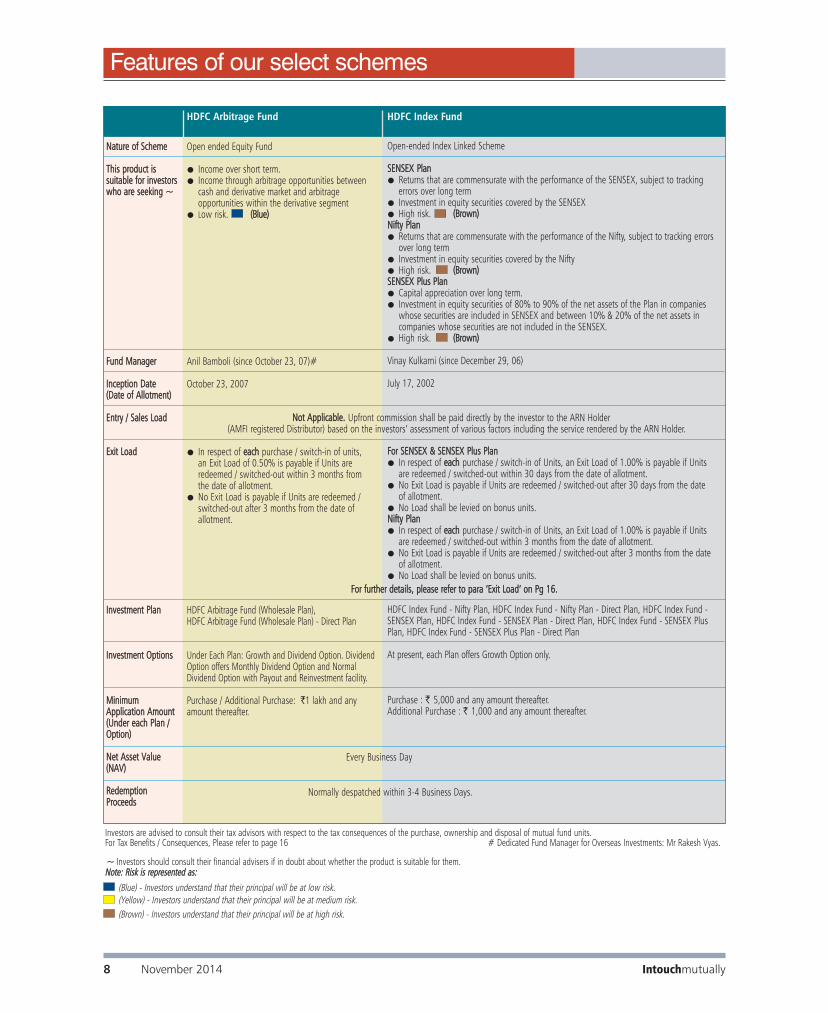
HDFC Index Fund
Open-ended Index Linked Scheme
SSEENNSSEEXX PPllaann● Returns that are commensurate with the performance of the SENSEX, subject to tracking
errors over long term● Investment in equity securities covered by the SENSEX● High risk. ((BBrroowwnn))NNiiffttyy PPllaann● Returns that are commensurate with the performance of the Nifty, subject to tracking errors
over long term● Investment in equity securities covered by the Nifty ● High risk. ((BBrroowwnn))SSEENNSSEEXX PPlluuss PPllaann● Capital appreciation over long term. ● Investment in equity securities of 80% to 90% of the net assets of the Plan in companies
whose securities are included in SENSEX and between 10% & 20% of the net assets in companies whose securities are not included in the SENSEX.
● High risk. ((BBrroowwnn))
Vinay Kulkarni (since December 29, 06)
July 17, 2002
FFoorr SSEENNSSEEXX && SSEENNSSEEXX PPlluuss PPllaann● In respect of eeaacchh purchase / switch-in of Units, an Exit Load of 1.00% is payable if Units
are redeemed / switched-out within 30 days from the date of allotment.● No Exit Load is payable if Units are redeemed / switched-out after 30 days from the date
of allotment.● No Load shall be levied on bonus units.NNiiffttyy PPllaann● In respect of eeaacchh purchase / switch-in of Units, an Exit Load of 1.00% is payable if Units
are redeemed / switched-out within 3 months from the date of allotment.● No Exit Load is payable if Units are redeemed / switched-out after 3 months from the date
of allotment.● No Load shall be levied on bonus units.
HDFC Index Fund - Nifty Plan, HDFC Index Fund - Nifty Plan - Direct Plan, HDFC Index Fund -SENSEX Plan, HDFC Index Fund - SENSEX Plan - Direct Plan, HDFC Index Fund - SENSEX PlusPlan, HDFC Index Fund - SENSEX Plus Plan - Direct Plan
At present, each Plan offers Growth Option only.
Purchase : ` 5,000 and any amount thereafter. Additional Purchase : ` 1,000 and any amount thereafter.
HDFC Arbitrage Fund
Open ended Equity Fund
● Income over short term. ● Income through arbitrage opportunities between
cash and derivative market and arbitrage opportunities within the derivative segment
● Low risk. ((BBlluuee))
Anil Bamboli (since October 23, 07)#
October 23, 2007
● In respect of eeaacchh purchase / switch-in of units, an Exit Load of 0.50% is payable if Units areredeemed / switched-out within 3 months fromthe date of allotment.
● No Exit Load is payable if Units are redeemed /switched-out after 3 months from the date of allotment.
HDFC Arbitrage Fund (Wholesale Plan), HDFC Arbitrage Fund (Wholesale Plan) - Direct Plan
Under Each Plan: Growth and Dividend Option. DividendOption offers Monthly Dividend Option and NormalDividend Option with Payout and Reinvestment facility.
Purchase / Additional Purchase: `1 lakh and anyamount thereafter.
NNoott AApppplliiccaabbllee.. Upfront commission shall be paid directly by the investor to the ARN Holder (AMFI registered Distributor) based on the investors’ assessment of various factors including the service rendered by the ARN Holder.
Every Business Day
Normally despatched within 3-4 Business Days.
Investors are advised to consult their tax advisors with respect to the tax consequences of the purchase, ownership and disposal of mutual fund units. For Tax Benefits / Consequences, Please refer to page 16 # Dedicated Fund Manager for Overseas Investments: Mr Rakesh Vyas.
FFoorr ffuurrtthheerr ddeettaaiillss,, pplleeaassee rreeffeerr ttoo ppaarraa ‘‘EExxiitt LLooaadd’’ oonn PPgg 1166..
Intouchmutually8 November 2014
Features of our select schemes
(Brown) - Investors understand that their principal will be at high risk.
(Blue) - Investors understand that their principal will be at low risk.(Yellow) - Investors understand that their principal will be at medium risk.
~~ Investors should consult their financial advisers if in doubt about whether the product is suitable for them.NNoottee:: RRiisskk iiss rreepprreesseenntteedd aass::
Intouchmutually November 2014 9
Features of our select schemes
Investors are advised to consult their tax advisors with respect to the tax consequences of the purchase, ownership and disposal of mutual fund units. For Tax Benefits / Consequences, Please refer to page 16* Date of migration from Zurich India Mutual Fund (Close of business hours - June 19, 03) # Dedicated Fund Manager for Overseas Investments: Mr Rakesh Vyas. $ For Large Investors, subscriptions shall only be allowed by payment of requisite Cash through RTGS/NEFT or Funds Transfer Letter/ Transfer Cheque of a bank where the Scheme has a collection account.
NNaattuurree ooff SScchheemmee
TThhiiss pprroodduucctt iiss ssuuiittaabbllee ffoorr iinnvveessttoorrsswwhhoo aarree sseeeekkiinngg ~~
FFuunndd MMaannaaggeerr
IInncceeppttiioonn DDaattee((DDaattee ooff AAlllloottmmeenntt))
EEnnttrryy // SSaalleess LLooaadd
EExxiitt LLooaadd
IInnvveessttmmeenntt PPllaann
IInnvveessttmmeenntt OOppttiioonnss
MMiinniimmuumm AApppplliiccaattiioonn AAmmoouunntt((UUnnddeerr eeaacchh PPllaann //OOppttiioonn))
NNeett AAsssseett VVaalluuee((NNAAVV))
RReeddeemmppttiioonnPPrroocceeeeddss
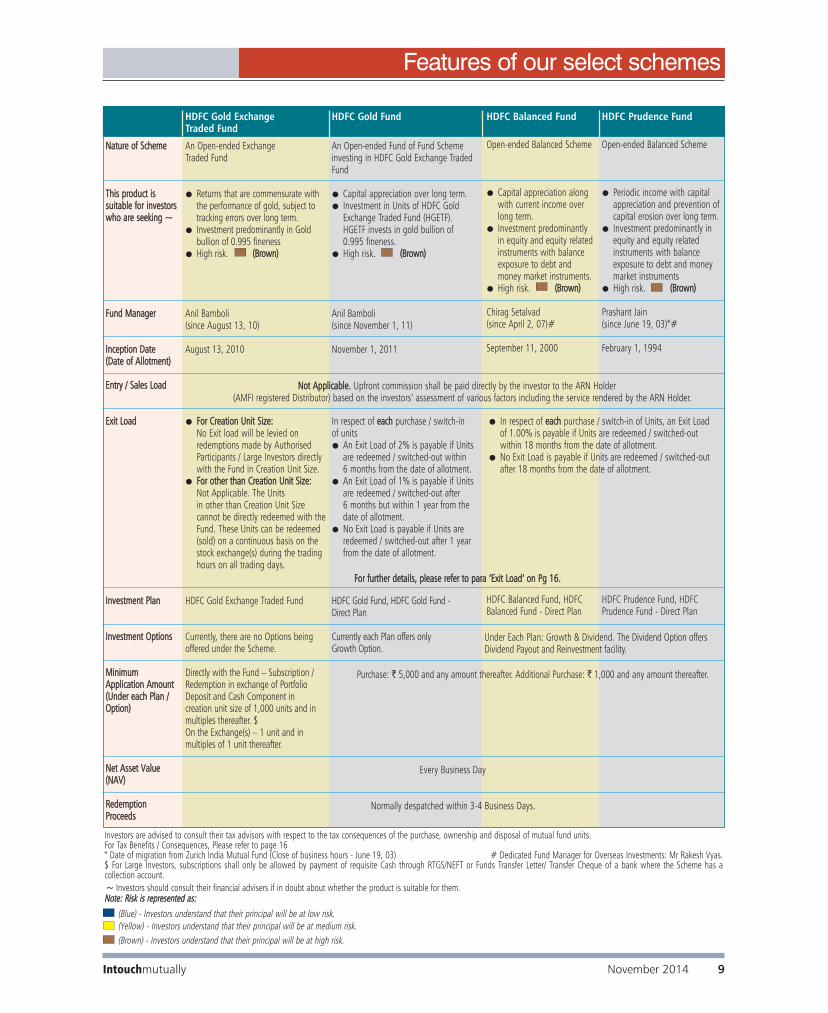
HDFC Gold Exchange Traded Fund
An Open-ended Exchange Traded Fund
● Returns that are commensurate withthe performance of gold, subject totracking errors over long term.
● Investment predominantly in Goldbullion of 0.995 fineness
● High risk. ((BBrroowwnn))
Anil Bamboli (since August 13, 10)
August 13, 2010
● FFoorr CCrreeaattiioonn UUnniitt SSiizzee::No Exit load will be levied on redemptions made by AuthorisedParticipants / Large Investors directlywith the Fund in Creation Unit Size.
● FFoorr ootthheerr tthhaann CCrreeaattiioonn UUnniitt SSiizzee::Not Applicable. The Units in other than Creation Unit Size cannot be directly redeemed with theFund. These Units can be redeemed(sold) on a continuous basis on thestock exchange(s) during the tradinghours on all trading days.
HDFC Gold Exchange Traded Fund
Currently, there are no Options beingoffered under the Scheme.
Directly with the Fund – Subscription /Redemption in exchange of PortfolioDeposit and Cash Component in creation unit size of 1,000 units and inmultiples thereafter. $ On the Exchange(s) – 1 unit and in multiples of 1 unit thereafter.
HDFC Gold Fund
An Open-ended Fund of Fund Schemeinvesting in HDFC Gold Exchange TradedFund
● Capital appreciation over long term.● Investment in Units of HDFC Gold
Exchange Traded Fund (HGETF). HGETF invests in gold bullion of 0.995 fineness.
● High risk. ((BBrroowwnn))
Anil Bamboli (since November 1, 11)
November 1, 2011
In respect of eeaacchh purchase / switch-in of units ● An Exit Load of 2% is payable if Units
are redeemed / switched-out within 6 months from the date of allotment.
● An Exit Load of 1% is payable if Unitsare redeemed / switched-out after 6 months but within 1 year from thedate of allotment.
● No Exit Load is payable if Units areredeemed / switched-out after 1 yearfrom the date of allotment.
HDFC Gold Fund, HDFC Gold Fund - Direct Plan
Currently each Plan offers only Growth Option.
HDFC Balanced Fund
Open-ended Balanced Scheme
● Capital appreciation alongwith current income overlong term.
● Investment predominantlyin equity and equity related instruments with balance exposure to debt andmoney market instruments.
● High risk. ((BBrroowwnn))
Chirag Setalvad (since April 2, 07)#
September 11, 2000
HDFC Balanced Fund, HDFCBalanced Fund - Direct Plan
HDFC Prudence Fund
Open-ended Balanced Scheme
● Periodic income with capitalappreciation and prevention ofcapital erosion over long term.
● Investment predominantly inequity and equity related instruments with balance exposure to debt and moneymarket instruments
● High risk. ((BBrroowwnn))
Prashant Jain (since June 19, 03)*#
February 1, 1994
HDFC Prudence Fund, HDFCPrudence Fund - Direct Plan
NNoott AApppplliiccaabbllee.. Upfront commission shall be paid directly by the investor to the ARN Holder (AMFI registered Distributor) based on the investors’ assessment of various factors including the service rendered by the ARN Holder.
FFoorr ffuurrtthheerr ddeettaaiillss,, pplleeaassee rreeffeerr ttoo ppaarraa ‘‘EExxiitt LLooaadd’’ oonn PPgg 1166..
Under Each Plan: Growth & Dividend. The Dividend Option offersDividend Payout and Reinvestment facility.
Purchase: ` 5,000 and any amount thereafter. Additional Purchase: ` 1,000 and any amount thereafter.
Every Business Day
Normally despatched within 3-4 Business Days.
(Brown) - Investors understand that their principal will be at high risk.
(Blue) - Investors understand that their principal will be at low risk.(Yellow) - Investors understand that their principal will be at medium risk.
~~ Investors should consult their financial advisers if in doubt about whether the product is suitable for them.NNoottee:: RRiisskk iiss rreepprreesseenntteedd aass::
● In respect of eeaacchh purchase / switch-in of Units, an Exit Loadof 1.00% is payable if Units are redeemed / switched-outwithin 18 months from the date of allotment.
● No Exit Load is payable if Units are redeemed / switched-outafter 18 months from the date of allotment.

Intouchmutually10 November 2014
Features of our select schemes
^̂ EElliiggiibbiilliittyy ((ooff UUnniitt hhoollddeerr)) :: Children less than 18 years of age as on the date of investment by the Investor / Applicant are eligible as Unit holders in the Scheme. @@ Personal Accident InsuranceCover for Parent / Legal Guardian (upto the age of 80 years) of the Unit holder, equivalent to 10 times the cost value of the outstanding Units held by the Unit holder under all the applications /account statements / folios, subject to a maximum amount of ` 10 lakhs per Unit holder. The insurance premium in respect of the personal accident insurance cover will be borne by the AMC. Thisaccident insurance cover is subject to conditions of the group personal accident insurance policy. Investors are advised to consult their tax advisors with respect to the tax consequences of the purchase, ownership and disposal of mutual fund units. For Tax Benefits / Consequences, Please refer to page 16 # Dedicated Fund Manager for Overseas Investments: Mr Rakesh Vyas.
NNaattuurree ooff SScchheemmee
TThhiiss pprroodduucctt iiss ssuuiittaabbllee ffoorr iinnvveessttoorrsswwhhoo aarree sseeeekkiinngg ~~
FFuunndd MMaannaaggeerr
IInncceeppttiioonn DDaattee((DDaattee ooff AAlllloottmmeenntt))
EEnnttrryy // SSaalleess LLooaadd
EExxiitt LLooaadd
IInnvveessttmmeenntt PPllaann
IInnvveessttmmeenntt OOppttiioonnss
MMiinniimmuumm AApppplliiccaattiioonn AAmmoouunntt((UUnnddeerr eeaacchh PPllaann //OOppttiioonn))
LLoocckk-iinn PPeerriioodd
NNeett AAsssseett VVaalluuee((NNAAVV))
RReeddeemmppttiioonnPPrroocceeeeddss
HDFC Children’s Gift Fund (CGF)^@
Open-ended Balanced Scheme
CCGGFF - IInnvveessttmmeenntt PPllaann ● Capital appreciation over long term ● Investment in equity and equity related instruments as
well as debt and money market instruments.● High risk. ((BBrroowwnn))CCGGFF - SSaavviinnggss PPllaann● Capital appreciation over medium to long term.● Investment in debt and money market instruments as
well as equity and equity related instruments.● Medium risk. ((YYeellllooww))
Chirag Setalvad (since April 2, 07)#
March 2, 2001
● For Units subject to Lock-in Period: NIL● For Units not subject to Lock-in Period:
■ 3% if the Units are redeemed / switched-out within one year from the date of allotment;
■ 2% if the Units are redeemed / switched-out between the first and second year of the date of allotment;
■ 1% if Units are redeemed / switched-out between the second and third year of the date of allotment;
■ Nil if the Units are redeemed / switched-out after third year from the date of allotment.
EEqquuiittyy OOrriieenntteedd - Investment Plan, Investment Plan - Direct Plan
DDeebbtt OOrriieenntteedd - Savings Plan, Savings Plan - Direct Plan
Nil
Purchase : ` 5,000 and any amount thereafter. Additional Purchase : ` 1,000 and any amount thereafter.
IIff oopptteedd :: Until the Unit holder (being the beneficiary child)attains the age of 18 years or until completion of 3 yearsfrom date of allotment, whichever is later.
Normally despatched within 3-4 Business Days (Redemption issubject to completion of Lock-in Period, if opted).
(Brown) - Investors understand that their principal will be at high risk.
(Blue) - Investors understand that their principal will be at low risk.(Yellow) - Investors understand that their principal will be at medium risk.
~~ Investors should consult their financial advisers if in doubt about whether the product is suitable for them.NNoottee:: RRiisskk iiss rreepprreesseenntteedd aass::
HDFC MF Monthly Income Plan (HDFC MF MIP)
An open-ended income scheme. Monthly income is not assured and is subject to availability of dis-tributable surplus
HHDDFFCC MMFF MMIIPP - SShhoorrtt TTeerrmm PPllaann ((SSTTPP)) && LLoonngg TTeerrmm PPllaann ((LLTTPP))● Regular income over medium to long term.● Investment in debt and money market instruments as well as equity and equity
related instruments.● Medium risk. ((YYeellllooww))
LTP – Prashant Jain (Equities) (since December 26, 03),Shobhit Mehrotra (Debt) (since September 1, 07)#,STP – Vinay Kulkarni (Equities) (since November 21, 06),Shobhit Mehrotra (Debt) (since February 16, 04)#
December 26, 2003
MMIIPP - SShhoorrtt TTeerrmm PPllaann && MMIIPP - LLoonngg TTeerrmm PPllaann ● In respect of eeaacchh purchase / switch-in of Units, an Exit Load of 2.00% is payable if
Units are redeemed / switched-out within 12 months from the date of allotment.● In respect of eeaacchh purchase / switch-in of Units, an Exit Load of 1.00% is payable if Units are
redeemed / switched-out after 12 months but within 24 months from the date of allotment.● In respect of eeaacchh purchase / switch-in of Units, an Exit Load of 0.50% is payable if Units are
redeemed / switched-out after 24 months but within 36 months from the date of allotment.● No Exit Load is payable if Units are redeemed / switched-out after 36 months from the date
of allotment.(For MIP- Long Term Plan with effect from December 1, 2014)
HDFC MF MIP - Short Term Plan (STP), HDFC MF MIP - STP - Direct Plan, HDFC MF MIP - Long Term Plan (LTP), HDFC MF MIP - LTP - Direct Plan
Each Plan offers Growth, Monthly Dividend & Quarterly Dividend Option. The Dividend Optionoffers Dividend Payout and Reinvestment facility.
Purchase :(Growth & Quarterly Dividend Option) – ` 5,000 and any amount thereafter.(Monthly Dividend Option) – ` 25,000 and any amount thereafter. Additional Purchase : ` 1,000 and any amount thereafter.
N.A.
Normally despatched within 3-4 Business Days.
NNoott AApppplliiccaabbllee.. Upfront commission shall be paid directly by the investor to the ARN Holder (AMFI registered Distributor) based on the investors’ assessment of various factors including the service rendered by the ARN Holder.
FFoorr ffuurrtthheerr ddeettaaiillss,, pplleeaassee rreeffeerr ttoo ppaarraa ‘‘EExxiitt LLooaadd’’ oonn PPgg 1166..
Every Business Day

Intouchmutually November 2014 11
Features of our select schemes
NNaattuurree ooff SScchheemmee
TThhiiss pprroodduucctt iiss ssuuiittaabbllee ffoorr iinnvveessttoorrsswwhhoo aarree sseeeekkiinngg ~~
FFuunndd MMaannaaggeerr
IInncceeppttiioonn DDaattee((DDaattee ooff AAlllloottmmeenntt))
EEnnttrryy // SSaalleess LLooaadd
EExxiitt LLooaadd
IInnvveessttmmeenntt PPllaann
IInnvveessttmmeenntt OOppttiioonnss
MMiinniimmuumm AApppplliiccaattiioonn AAmmoouunntt((UUnnddeerr eeaacchh PPllaann //OOppttiioonn))
NNeett AAsssseett VVaalluuee((NNAAVV))
RReeddeemmppttiioonnPPrroocceeeeddss
HDFC Multiple Yield Fund
Open-ended Income Scheme
● Positive returns over medium term with lowrisk of capital loss over medium term.
● Investment in debt and money market instruments with maturity of 1 year (85%) as well as equity and equity related instruments (15%).
● Medium risk. ((YYeellllooww))
Vinay Kulkarni (Equities), (since Nov 21, 06)Anil Bamboli (Debt) (since September 17, 04)#
September 17, 2004
● In respect of eeaacchh purchase / switch-in ofUnits, an Exit Load of 1% is payable if unitsare redeemed / switched-out within 1 yearfrom the date of allotment.
● No Exit Load is payable if Units are redeemed/ switched-out after 1 year from the date ofallotment.
HDFC Multiple Yield Fund, HDFC Multiple Yield Fund - Direct Plan
HDFC Multiple Yield Fund (MYF) – Plan 2005
Open-ended Income Scheme
● Positive returns over medium term with lowrisk of capital loss over medium term.
● Investment in debt and money market instruments with maturity of 15 months (85%) as well as equity and equity relatedinstruments (15%).
● Medium risk. ((YYeellllooww))
Chirag Setalvad (Equities), (since April 2, 07)Anil Bamboli (Debt) (since Aug 17, 05)#
August 17, 2005
● In respect of eeaacchh purchase / switch-in ofUnits, an Exit Load of 1% is payable if unitsare redeemed / switched-out within 15months from the date of allotment.
● No Exit Load is payable if Units are redeemed/ switched-out after 15 months from the dateof allotment.
HDFC MYF - Plan 2005, HDFC MYF - Plan 2005 - Direct Plan
FFoorr ffuurrtthheerr ddeettaaiillss,, pplleeaassee rreeffeerr ttoo ppaarraa ‘‘EExxiitt LLooaadd’’ oonn PPgg 1166..
Investors are advised to consult their tax advisors with respect to the tax consequences of the purchase, ownership and disposal of mutual fund units. For Tax Benefits / Consequences, Please refer to page 16* Date of migration from Morgan Stanley Mutual Fund (Close of business hours - June 27, 14)# Dedicated Fund Manager for Overseas Investments: Mr Rakesh Vyas.
(Brown) - Investors understand that their principal will be at high risk.
(Blue) - Investors understand that their principal will be at low risk.(Yellow) - Investors understand that their principal will be at medium risk.
~~ Investors should consult their financial advisers if in doubt about whether the product is suitable for them.NNoottee:: RRiisskk iiss rreepprreesseenntteedd aass::
HDFC Dynamic PE Ratio Fund of Funds(Erstwhile Morgan Stanley Multi Asset Fund)
Open-ended Fund of Funds Scheme
● Capital appreciation over long term.● Investment in specified equity and debt
schemes of HDFC Mutual Fund based on PE Ratios.
● High risk. ((BBrroowwnn))
Miten Lathia (Equities), (since June 27, 14)*Anil Bamboli (Debt) (since June 27, 14)*
February 6, 2012
● In respect of eeaacchh purchase / switch-in of Units,an Exit Load of 1% is payable if units areredeemed / switched-out within 1 year from thedate of allotment.
● No Exit Load is payable if Units are redeemed /switched-out after 1 year from the date of allotment.
HDFC Dynamic PE Ratio Fund of Funds - Regular PlanHDFC Dynamic PE Ratio Fund of Funds - Direct Plan
NNoott AApppplliiccaabbllee.. Upfront commission shall be paid directly by the investor to the ARN Holder (AMFI registered Distributor) based on the investors’ assessment of various factors including the service rendered by the ARN Holder.
Under Each Plan: Growth & Dividend. The Dividend Option offers Dividend Payout and Reinvestment facility.
Purchase : ` 5,000 and any amount thereafter. Additional Purchase : ` 1,000 and any amount thereafter.
Every Business Day
Normally despatched within 3-4 Business Days.
Intouchmutually12 November 2014
Features of our select schemes
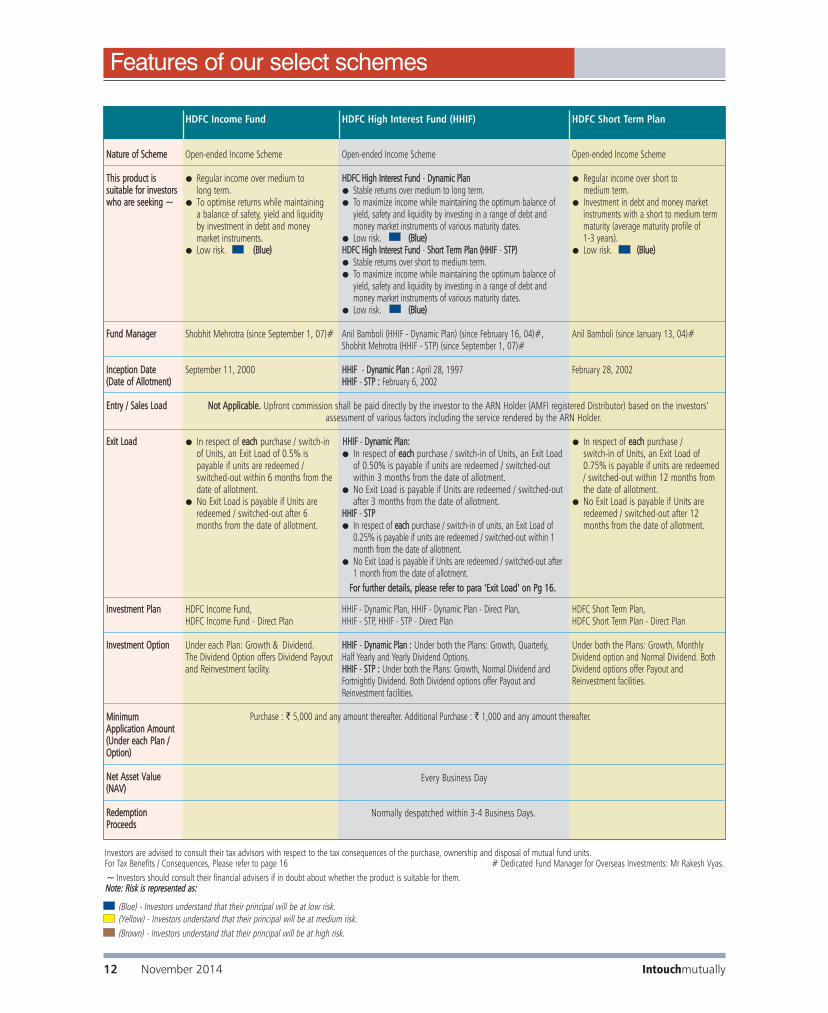
HDFC Income Fund
Open-ended Income Scheme
● Regular income over medium to long term.
● To optimise returns while maintaining a balance of safety, yield and liquidity by investment in debt and money market instruments.
● Low risk. ((BBlluuee))
Shobhit Mehrotra (since September 1, 07)#
September 11, 2000
● In respect of eeaacchh purchase / switch-inof Units, an Exit Load of 0.5% ispayable if units are redeemed /switched-out within 6 months from the date of allotment.
● No Exit Load is payable if Units areredeemed / switched-out after 6 months from the date of allotment.
HDFC Income Fund, HDFC Income Fund - Direct Plan
Under each Plan: Growth & Dividend. The Dividend Option offers Dividend Payoutand Reinvestment facility.
NNaattuurree ooff SScchheemmee
TThhiiss pprroodduucctt iiss ssuuiittaabbllee ffoorr iinnvveessttoorrsswwhhoo aarree sseeeekkiinngg ~~
FFuunndd MMaannaaggeerr
IInncceeppttiioonn DDaattee((DDaattee ooff AAlllloottmmeenntt))
EEnnttrryy // SSaalleess LLooaadd
EExxiitt LLooaadd
IInnvveessttmmeenntt PPllaann
IInnvveessttmmeenntt OOppttiioonn
MMiinniimmuumm AApppplliiccaattiioonn AAmmoouunntt((UUnnddeerr eeaacchh PPllaann //OOppttiioonn))
NNeett AAsssseett VVaalluuee((NNAAVV))
RReeddeemmppttiioonnPPrroocceeeeddss
HDFC Short Term Plan
Open-ended Income Scheme
● Regular income over short to medium term.
● Investment in debt and money marketinstruments with a short to medium termmaturity (average maturity profile of 1-3 years).
● Low risk. ((BBlluuee))
Anil Bamboli (since January 13, 04)#
February 28, 2002
● In respect of eeaacchh purchase / switch-in of Units, an Exit Load of0.75% is payable if units are redeemed/ switched-out within 12 months fromthe date of allotment.
● No Exit Load is payable if Units areredeemed / switched-out after 12months from the date of allotment.
HDFC Short Term Plan, HDFC Short Term Plan - Direct Plan
Under both the Plans: Growth, MonthlyDividend option and Normal Dividend. BothDividend options offer Payout andReinvestment facilities.
HDFC High Interest Fund (HHIF)
Open-ended Income Scheme
HHDDFFCC HHiigghh IInntteerreesstt FFuunndd - DDyynnaammiicc PPllaann ● Stable returns over medium to long term.● To maximize income while maintaining the optimum balance of
yield, safety and liquidity by investing in a range of debt andmoney market instruments of various maturity dates.
● Low risk. ((BBlluuee))HHDDFFCC HHiigghh IInntteerreesstt FFuunndd - SShhoorrtt TTeerrmm PPllaann ((HHHHIIFF - SSTTPP))● Stable returns over short to medium term.● To maximize income while maintaining the optimum balance of
yield, safety and liquidity by investing in a range of debt andmoney market instruments of various maturity dates.
● Low risk. ((BBlluuee))
Anil Bamboli (HHIF - Dynamic Plan) (since February 16, 04)#, Shobhit Mehrotra (HHIF - STP) (since September 1, 07)#
HHHHIIFF - DDyynnaammiicc PPllaann :: April 28, 1997HHHHIIFF - SSTTPP :: February 6, 2002
HHHHIIFF - DDyynnaammiicc PPllaann::● In respect of eeaacchh purchase / switch-in of Units, an Exit Load
of 0.50% is payable if units are redeemed / switched-outwithin 3 months from the date of allotment.
● No Exit Load is payable if Units are redeemed / switched-outafter 3 months from the date of allotment.
HHHHIIFF - SSTTPP● In respect of eeaacchh purchase / switch-in of units, an Exit Load of
0.25% is payable if units are redeemed / switched-out within 1month from the date of allotment.
● No Exit Load is payable if Units are redeemed / switched-out after1 month from the date of allotment.
HHIF - Dynamic Plan, HHIF - Dynamic Plan - Direct Plan, HHIF - STP, HHIF - STP - Direct Plan
HHHHIIFF - DDyynnaammiicc PPllaann :: Under both the Plans: Growth, Quarterly, Half Yearly and Yearly Dividend Options.HHHHIIFF - SSTTPP :: Under both the Plans: Growth, Normal Dividend andFortnightly Dividend. Both Dividend options offer Payout andReinvestment facilities.
FFoorr ffuurrtthheerr ddeettaaiillss,, pplleeaassee rreeffeerr ttoo ppaarraa ‘‘EExxiitt LLooaadd’’ oonn PPgg 1166..
Every Business Day
Normally despatched within 3-4 Business Days.
NNoott AApppplliiccaabbllee.. Upfront commission shall be paid directly by the investor to the ARN Holder (AMFI registered Distributor) based on the investors’ assessment of various factors including the service rendered by the ARN Holder.
Investors are advised to consult their tax advisors with respect to the tax consequences of the purchase, ownership and disposal of mutual fund units. For Tax Benefits / Consequences, Please refer to page 16 # Dedicated Fund Manager for Overseas Investments: Mr Rakesh Vyas.
Purchase : ` 5,000 and any amount thereafter. Additional Purchase : ` 1,000 and any amount thereafter.
(Brown) - Investors understand that their principal will be at high risk.
(Blue) - Investors understand that their principal will be at low risk.(Yellow) - Investors understand that their principal will be at medium risk.
~~ Investors should consult their financial advisers if in doubt about whether the product is suitable for them.NNoottee:: RRiisskk iiss rreepprreesseenntteedd aass::

Intouchmutually Novemberr 2014 13
Features of our select schemes
NNaattuurree ooff SScchheemmee
TThhiiss pprroodduucctt iiss ssuuiittaabbllee ffoorr iinnvveessttoorrsswwhhoo aarree sseeeekkiinngg ~~
FFuunndd MMaannaaggeerr
IInncceeppttiioonn DDaattee((DDaattee ooff AAlllloottmmeenntt))
EEnnttrryy // SSaalleess LLooaadd
EExxiitt LLooaadd
IInnvveessttmmeenntt PPllaann
IInnvveessttmmeenntt OOppttiioonn
MMiinniimmuumm AApppplliiccaattiioonn AAmmoouunntt ((UUnnddeerr eeaacchh PPllaann)) //OOppttiioonn
NNeett AAsssseett VVaalluuee((NNAAVV))
RReeddeemmppttiioonnPPrroocceeeeddss
Investors are advised to consult their tax advisors with respect to the tax consequences of the purchase, ownership and disposal of mutual fund units. For Tax Benefits / Consequences, Please refer to page 16 # Dedicated Fund Manager for Overseas Investments: Mr Rakesh Vyas. * Date of migration from Morgan Stanley Mutual Fund (Close of business hours - June 27, 14)
HDFC Gilt Fund
Open-ended Income Scheme
SShhoorrtt TTeerrmm PPllaann● Credit risk free returns over short to
medium term. ● Investment in sovereign securities
issued by Central/ State Governmentwith short to medium term maturities.
● Low risk. ((BBlluuee))LLoonngg TTeerrmm PPllaann● Credit risk free returns over medium
to long term.● Investment in sovereign securities
issued by Central / State Governmentwith medium to long term maturities.
● Low risk. ((BBlluuee))
Anil Bamboli (since September 1, 07)
July 25, 2001
SShhoorrtt TTeerrmm PPllaann :: NilLLoonngg TTeerrmm PPllaann :: Nil
Short Term Plan, Short Term Plan - Direct Plan,Long Term Plan, Long Term Plan - Direct Plan
Under both the Plans: Growth & DividendOption (Dividend Option offers DividendPayout and Reinvestment facility).
HDFC Medium Term Opportunities Fund
Open-ended Income Scheme
● Regular income over medium tolong term.
● Investment in debt, money marketinstruments and government securities with maturities notexceeding 60 months.
● Low risk. ((BBlluuee))
Shobhit Mehrotra (since June 29, 10) #
June 29, 2010
● In respect of each purchase/switch-in of units, an exit load of 1% is payable if units areredeemed/switched out within 12 months from the date of allotment.
● No exit load is payable if units are redeemed/ switched-out after 12 months from the date ofallotment.
HDFC Medium Term OpportunitiesFund, HDFC Medium TermOpportunities Fund - Direct Plan
Under both the Plans: Growth,Quarterly Dividend and NormalDividend. Both Dividend options offerPayout and Reinvestment facilities.
HDFC Short Term Opportunities Fund
Open-ended Income Scheme
● Regular income over short to medium term.
● Investment in debt and money market instruments and government securities with maturities not exceeding 36months.
● Low risk. ((BBlluuee))
Anil Bamboli (since June 25, 10) #
June 25, 2010
● In respect of each purchase/switch-in of units, an Exit load of0.50% is payable if units areredeemed/ switched-out within 3 months from the date of allotment.
● No Exit Load is payable if unitsare redeemed/switched-out after 3 months from the date of allotment.
HDFC Short Term Opportunities Fund, HDFC Short Term Opportunities Fund -Direct Plan
Under both the Plans: Growth &Fortnightly Dividend Option (DividendOption offers Dividend Payout andReinvestment facility).
HDFC Inflation Indexed BondFund (Erstwhile Morgan Stanley Gilt Fund)
Open-ended Income Scheme
● Generate income and capitalappreciation indexed to inflation.
● Investment in inflation indexedsecurities issued by governmentand corporate issuers
● Low risk. ((BBlluuee))
Anil Bamboli (since June 27, 14)*
Mar 4, 2013
● In respect of each purchase /switch-in of units, an exit load of1.5% is payable if units areredeemed/switched out within 12months from the date of allotment.
● No exit load is payable if units areredeemed/switched-out after 12months from the date of allotment.
HDFC Inflation Indexed Bond Fund -Regular Plan, HDFC Inflation Indexed Bond Fund -Direct Plan
Under both the Plans: Growth, RegularDividend and Quarterly Dividend. BothDividend Options offer Payout andReinvestment facilities.
NNoott AApppplliiccaabbllee.. Upfront commission shall be paid directly by the investor to the ARN Holder (AMFI registered Distributor) based on the investors’ assessment of various factors including the service rendered by the ARN Holder.
Purchase : ` 5,000 and any amount thereafter. Additional Purchase : ` 1,000 and any amount thereafter.
Every Business Day
Normally despatched within 3-4 Business Days.
(Brown) - Investors understand that their principal will be at high risk.
(Blue) - Investors understand that their principal will be at low risk.(Yellow) - Investors understand that their principal will be at medium risk.
~~ Investors should consult their financial advisers if in doubt about whether the product is suitable for them.NNoottee:: RRiisskk iiss rreepprreesseenntteedd aass::
FFoorr ffuurrtthheerr ddeettaaiillss,, pplleeaassee rreeffeerr ttoo ppaarraa ‘‘EExxiitt LLooaadd’’ oonn PPgg 1166..
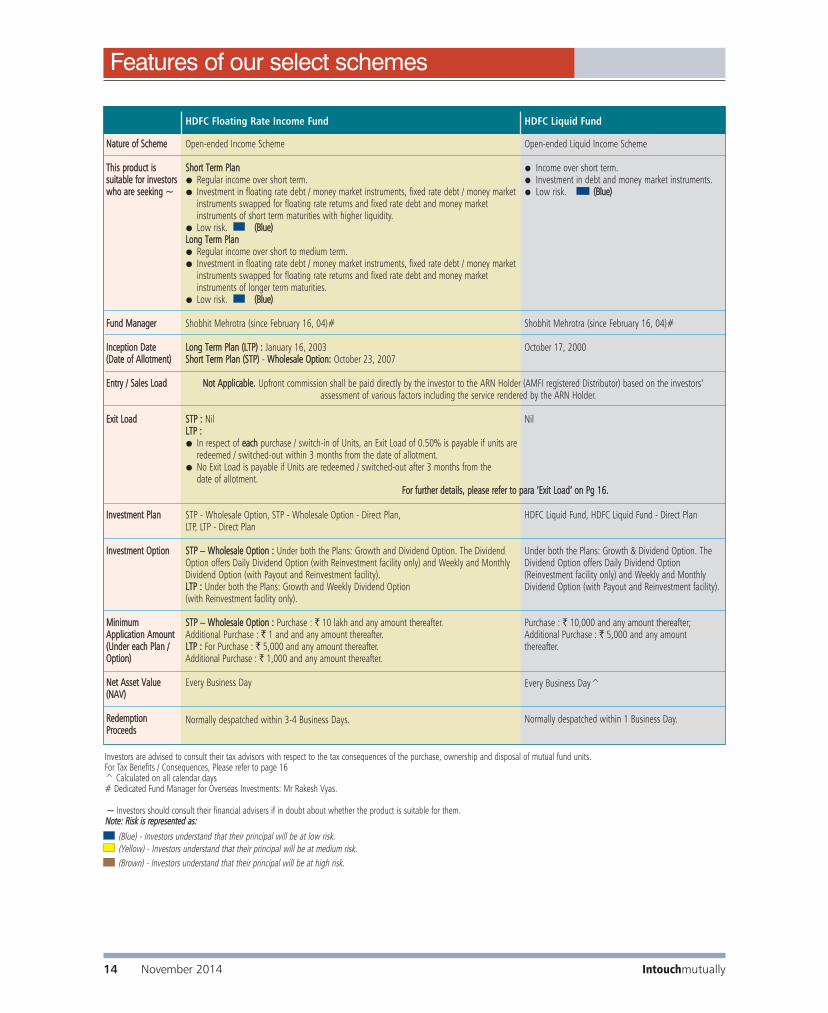
HDFC Floating Rate Income Fund
Open-ended Income Scheme
SShhoorrtt TTeerrmm PPllaann● Regular income over short term.● Investment in floating rate debt / money market instruments, fixed rate debt / money market
instruments swapped for floating rate returns and fixed rate debt and money market instruments of short term maturities with higher liquidity.
● Low risk. ((BBlluuee))LLoonngg TTeerrmm PPllaann● Regular income over short to medium term.● Investment in floating rate debt / money market instruments, fixed rate debt / money market
instruments swapped for floating rate returns and fixed rate debt and money market instruments of longer term maturities.
● Low risk. ((BBlluuee))
Shobhit Mehrotra (since February 16, 04)#
LLoonngg TTeerrmm PPllaann ((LLTTPP)) :: January 16, 2003 SShhoorrtt TTeerrmm PPllaann ((SSTTPP)) - WWhhoolleessaallee OOppttiioonn:: October 23, 2007
SSTTPP :: NilLLTTPP :: ● In respect of eeaacchh purchase / switch-in of Units, an Exit Load of 0.50% is payable if units are
redeemed / switched-out within 3 months from the date of allotment.● No Exit Load is payable if Units are redeemed / switched-out after 3 months from the
date of allotment.
STP - Wholesale Option, STP - Wholesale Option - Direct Plan,LTP, LTP - Direct Plan
SSTTPP –– WWhhoolleessaallee OOppttiioonn :: Under both the Plans: Growth and Dividend Option. The DividendOption offers Daily Dividend Option (with Reinvestment facility only) and Weekly and MonthlyDividend Option (with Payout and Reinvestment facility).LLTTPP :: Under both the Plans: Growth and Weekly Dividend Option (with Reinvestment facility only).
SSTTPP –– WWhhoolleessaallee OOppttiioonn :: Purchase : ` 10 lakh and any amount thereafter. Additional Purchase : ` 1 and and any amount thereafter.LLTTPP :: For Purchase : ` 5,000 and any amount thereafter.Additional Purchase : ` 1,000 and any amount thereafter.
Every Business Day
Normally despatched within 3-4 Business Days.
NNaattuurree ooff SScchheemmee
TThhiiss pprroodduucctt iiss ssuuiittaabbllee ffoorr iinnvveessttoorrsswwhhoo aarree sseeeekkiinngg ~~
FFuunndd MMaannaaggeerr
IInncceeppttiioonn DDaattee((DDaattee ooff AAlllloottmmeenntt))
EEnnttrryy // SSaalleess LLooaadd
EExxiitt LLooaadd
IInnvveessttmmeenntt PPllaann
IInnvveessttmmeenntt OOppttiioonn
MMiinniimmuumm AApppplliiccaattiioonn AAmmoouunntt((UUnnddeerr eeaacchh PPllaann //OOppttiioonn))
NNeett AAsssseett VVaalluuee((NNAAVV))
RReeddeemmppttiioonnPPrroocceeeeddss
Investors are advised to consult their tax advisors with respect to the tax consequences of the purchase, ownership and disposal of mutual fund units. For Tax Benefits / Consequences, Please refer to page 16^ Calculated on all calendar days# Dedicated Fund Manager for Overseas Investments: Mr Rakesh Vyas.
HDFC Liquid Fund
Open-ended Liquid Income Scheme
● Income over short term.● Investment in debt and money market instruments.● Low risk. ((BBlluuee))
Shobhit Mehrotra (since February 16, 04)#
October 17, 2000
Nil
HDFC Liquid Fund, HDFC Liquid Fund - Direct Plan
Under both the Plans: Growth & Dividend Option. TheDividend Option offers Daily Dividend Option(Reinvestment facility only) and Weekly and MonthlyDividend Option (with Payout and Reinvestment facility).
Purchase : ` 10,000 and any amount thereafter; Additional Purchase : ` 5,000 and any amount thereafter.
Every Business Day^
Normally despatched within 1 Business Day.
NNoott AApppplliiccaabbllee.. Upfront commission shall be paid directly by the investor to the ARN Holder (AMFI registered Distributor) based on the investors’ assessment of various factors including the service rendered by the ARN Holder.
FFoorr ffuurrtthheerr ddeettaaiillss,, pplleeaassee rreeffeerr ttoo ppaarraa ‘‘EExxiitt LLooaadd’’ oonn PPgg 1166..
Intouchmutually14 November 2014
Features of our select schemes
(Brown) - Investors understand that their principal will be at high risk.
(Blue) - Investors understand that their principal will be at low risk.(Yellow) - Investors understand that their principal will be at medium risk.
~~ Investors should consult their financial advisers if in doubt about whether the product is suitable for them.NNoottee:: RRiisskk iiss rreepprreesseenntteedd aass::

Intouchmutually November 2014 15
Features of our select schemes
Investors are advised to consult their tax advisors with respect to the tax consequences of the purchase, ownership and disposal of mutual fund units.For Tax Benefits / Consequences, Please refer to page 16^ Calculated on all calendar days# Dedicated Fund Manager for Overseas Investments: Mr Rakesh Vyas.
(Brown) - Investors understand that their principal will be at high risk.
(Blue) - Investors understand that their principal will be at low risk.(Yellow) - Investors understand that their principal will be at medium risk.
~~ Investors should consult their financial advisers if in doubt about whether the product is suitable for them.NNoottee:: RRiisskk iiss rreepprreesseenntteedd aass::
Nature of Scheme
TThhiiss pprroodduucctt iiss ssuuiittaabbllee ffoorr iinnvveessttoorrsswwhhoo aarree sseeeekkiinngg ~~
Fund Manager
Inception Date(Date of Allotment)
Entry / Sales Load
Exit Load
Investment Plan
Investment Option
Minimum Application Amount((UUnnddeerr eeaacchh PPllaann //OOppttiioonn))
Net Asset Value (NAV)
RedemptionProceeds
HDFC Cash Management Fund
SSaavviinnggss && CCaallll PPllaann:: Open-ended High Liquidity Income SchemeTTrreeaassuurryy AAddvvaannttaaggee PPllaann:: Open-ended Income Scheme
Anil Bamboli SSaavviinnggss && CCaallll PPllaann (since July 25, 12)# TTrreeaassuurryy AAddvvaannttaaggee PPllaann (since September 1, 07)#
SSaavviinnggss && TTrreeaassuurryy AAddvvaannttaaggee PPllaann ((RReettaaiill OOppttiioonn)):: November 18, 1999 CCaallll PPllaann :: February 6, 2002
NNoott AApppplliiccaabbllee.. Upfront commission shall be paid directly by the investor to the ARN Holder (AMFI registered Distributor) based on the investors’assessment of various factors including the service rendered by the ARN Holder.
SSaavviinnggss,, CCaallll && TTrreeaassuurryy AAddvvaannttaaggee PPllaann :: Nil
Savings Plan, Savings Plan - Direct Plan, Call Plan, Call Plan - Direct Plan, Treasury Advantage Plan, Treasury Advantage Plan - Direct Plan
SSaavviinnggss && CCaallll PPllaann :: Each Plan offers Growth Option & Daily Dividend Option (with Reinvestment facility only). Savings Plan also offers Weekly DividendOption (with Payout and Reinvestment facility). TTrreeaassuurryy AAddvvaannttaaggee PPllaann ((RReettaaiill OOppttiioonn)):: Each Plan offers Growth and Dividend Option. Dividend Option offers Daily Dividend Option with Reinvestment facility only and Weekly and Monthly Dividend Option with Payout and Reinvestment facility.
SSaavviinnggss && CCaallll PPllaann :: Purchase ` 10,000 and any amount thereafter; Additional Purchase ` 5,000 and any amount thereafter.TTrreeaassuurryy AAddvvaannttaaggee PPllaann –– RReettaaiill OOppttiioonn:: Growth, Weekly and Monthly Dividend Option : Purchase ` 5,000 and any amount thereafter.Additional Purchase: ` 1,000 and any amount thereafter. Daily Dividend Option : Purchase ` 10,000 and any amount thereafter; Additional Purchase ` 5,000 and any amount thereafter.
SSaavviinnggss && CCaallll PPllaann:: Every Business Day^ TTrreeaassuurryy AAddvvaannttaaggee PPllaann:: Every Business Day
SSaavviinnggss && CCaallll PPllaann :: Normally despatched within 1 Business Day.TTrreeaassuurryy AAddvvaannttaaggee PPllaann:: Normally despatched within 3-4 Business Days.
SSaavviinnggss PPllaann● Optimal returns over short term. ● Investment in debt and money
market instruments with maturityof upto 91 days only.
● Low risk. ((BBlluuee))
TTrreeaassuurryy AAddvvaannttaaggee PPllaann● Regular income over short term.● Investment in debt and money
market instruments.● Low risk. ((BBlluuee))
CCaallll PPllaann● Optimal returns over short term that may be in line with the
overnight call rates. ● Investment typically in Collateralised Borrowing & Lending
Obligations (CBLO), overnight reverse repos in Government securitiesand fixed income instruments with overnight maturity/ liquidity.
● Low risk. ((BBlluuee))
FFoorr ffuurrtthheerr ddeettaaiillss,, pplleeaassee rreeffeerr ttoo ppaarraa ‘‘EExxiitt LLooaadd’’ oonn PPgg 1166..

Intouchmutually16 November 2014
Features of our select schemes
Nature of Scheme
TThhiiss pprroodduucctt iiss ssuuiittaabbllee ffoorr iinnvveessttoorrsswwhhoo aarree sseeeekkiinngg ~~
Fund Manager
Inception Date(Date of Allotment)
Entry / Sales Load
Exit Load
Investment Plan
Investment Option
Minimum Application Amount((UUnnddeerr eeaacchh PPllaann //OOppttiioonn))
Net Asset Value (NAV)
RedemptionProceeds
HDFC Banking and PSU Debt Fund
Open-ended Income Scheme
● Regular income over medium to long term● Investments in debt and money market instruments
consisting predominantly of securities issued by ScheduledCommercial Banks and Public Sector undertakings.
● Low risk. ((BBlluuee))
Anil Bamboli (since March 26, 14) #
March 26, 2014
● In respect of eeaacchh purchase/switch-in of units, an Exitload of 0.25% is payable if units are redeemed / switched-out within 1 month from the date of allotment.
● No Exit Load is payable if units are redeemed / switched-out after 1 month from the date of allotment.
HDFC Banking and PSU Debt Fund - Regular PlanHDFC Banking and PSU Debt Fund - Direct Plan
Under Each Plan: Growth & Dividend. The Dividend Optionoffers Dividend Payout and Dividend Reinvestment facility.
HDFC Corporate Debt Opportunities Fund
Open-ended Income Scheme
● Regular income over medium to long term.● To generate regular income and capital appreciation by investing predominantly in
corporate debt.● Medium risk. ((YYeellllooww))
Shobhit Mehrotra (since March 25, 14) #
March 25, 2014
● In respect of eeaacchh purchase / switch-in of Units, an Exit Load of 2.00% is payable ifUnits are redeemed / switched-out within 12 months from the date of allotment.
● In respect of eeaacchh purchase / switch-in of Units, an Exit Load of 1.00% is payable ifUnits are redeemed / switched-out after 12 months but within 24 months from thedate of allotment.
● In respect of eeaacchh purchase / switch-in of Units, an Exit Load of 0.50% is payable ifUnits are redeemed / switched-out after 24 months but within 36 months from thedate of allotment.
● No Exit Load is payable if Units are redeemed / switched-out after 36 months from thedate of allotment.
HDFC Corporate Debt Opportunities Fund - Regular Plan, HDFC Corporate DebtOpportunities Fund - Direct Plan
Under Each Plan: Growth, Half Yearly Dividend and Normal Dividend. Both Dividendoptions offer Payout and Reinvestment facilities. (with effect from November 20, 2014)
NNoott AApppplliiccaabbllee.. Upfront commission shall be paid directly by the investor to the ARN Holder (AMFI registered Distributor) based on the investors’ assessment of various factors including the service rendered by the ARN Holder.
Investors are advised to consult their tax advisors with respect to the tax consequences of the purchase, ownership and disposal of mutual fund units.^ Calculated on all calendar days # Dedicated Fund Manager for Overseas Investments: Mr Rakesh Vyas since May 10, 2012. EExxiitt LLooaadd:: (i) No exit load shall be levied for switching between Options under the same Plan within a Scheme. (ii) Switch of investments to Direct Plan within the same Scheme shall be subjectto applicable exit load, unless the investments were made without any distributor code. However, any subsequent switch-out or redemption of such investments from the Direct Plan will not besubject to any exit load.(iii) No exit load shall be levied for switch-out from Direct Plan to other Plan within the same Scheme. However, any subsequent switch-out or redemption of such investment from the other Plan shall be subject to exit load based on the original date of investment in the Direct Plan. (iv) Switch of investments between Plans under a Scheme having separate portfolios, will be subject to applicable exit load. (v) No exit load will be levied on Bonus Units and Units allotted on Dividend Re-investment.
TTaaxx BBeenneeffiittss // CCoonnsseeqquueenncceess :: Income distributed by the Scheme(s) is free from Income–tax in the hands of Investors. The additional income-tax on distribution of income by any other fund(not being an equity oriented fund) to an individual / HUF shall be payable at the rate of 28.325%* and at the rate of 33.99%* on distribution of income to any other investor. Units of theScheme(s) are not subject to Wealth-tax and Gift-tax. Unit holders are required to pay Securities Transaction Tax (STT) at the rate of 0.001% at the time of redemption / switch-out of units of an equity-oriented fund.* including applicable surcharge, education cess and secondary and higher education cessIInnvveessttoorrss sshhoouulldd bbee aawwaarree tthhaatt tthhee ffiissccaall rruulleess // ttaaxx llaawwss mmaayy cchhaannggee aanndd tthheerree ccaann bbee nnoo gguuaarraanntteeee tthhaatt tthhee ccuurrrreenntt ttaaxx ppoossiittiioonn mmaayy ccoonnttiinnuuee iinnddeeffiinniitteellyy.. IInn vviieeww ooff iinnddiivviidduuaall nnaattuurree ooff ttaaxxccoonnsseeqquueenncceess,, eeaacchh iinnvveessttoorr iiss aaddvviisseedd ttoo ccoonnssuulltt hhiiss // hheerr oowwnn pprrooffeessssiioonnaall ttaaxx aaddvviissoorr..
Prashant Jain Over 23 yearsVinay Kulkarni Over 24 yearsSrinivas Rao Ravuri Over 19 yearsChirag Setalvad Over 17 years
Shobhit Mehrotra Over 21 yearsAnil Bamboli Over 20 yearsMiten Lathia Over 14 yearsRakesh Vyas Over 10 years
FFuunndd MMaannaaggeerr TToottaall EExxppeerriieennccee FFuunndd MMaannaaggeerr TToottaall EExxppeerriieennccee
(Brown) - Investors understand that their principal will be at high risk.
(Blue) - Investors understand that their principal will be at low risk.(Yellow) - Investors understand that their principal will be at medium risk.
~~ Investors should consult their financial advisers if in doubt about whether the product is suitable for them.NNoottee:: RRiisskk iiss rreepprreesseenntteedd aass::
Every Business Day
Normally despatched within 3-4 Business Days.
Purchase : ` 5,000 and any amount thereafter. Additional Purchase : ` 1,000 and any amount thereafter

Portfolio – Top 10 Holdings
HDFC Growth Fund
$ Sponsor
An open-ended growth scheme
HDFC Equity FundAn open-ended growth scheme
Banks 27.31Software 14.13Petroleum Products 10.77Auto 6.78Pharmaceuticals 6.18Industrial Capital Goods 4.16Oil 3.79Construction Project 3.54Telecom - Services 3.36Finance 2.80
Chemicals 2.76Consumer Non Durables 2.62Minerals / Mining 1.88Power 1.77Ferrous Metals 1.33Gas 1.28Cement 1.26Construction 1.22Industrial Products 0.64Gas 0.42
Industry Allocation of Equity Holding (% of Net Assets)
PPoorrttffoolliioo TTuurrnnoovveerr RRaattiioo ((LLaasstt 11 YYeeaarr)) 3300..6655%%
NAV (as of November 28, 2014) NAV per Unit (`)
Growth Option 135.922Dividend Option 34.335Direct Plan - Growth Option 137.097Direct Plan - Dividend Option 34.657
Std Deviation Beta Sharpe Ratio*
Risk Ratio 5.00% 1.1113 0.207(for the 3-yr period ended Nov 28, 14)Based on month-end NAV
Std Deviation Beta Sharpe Ratio*
Risk Ratio 5.92% 1.1532 0.261(for the 3-yr period ended Nov 28, 14)Based on month-end NAV
NAV (as of November 28, 2014) NAV per Unit (`)
Growth Option 485.587Dividend Option 61.198Direct Plan - Growth Option 491.936Direct Plan - Dividend Option 62.054
Portfolio – Top 10 Holdings
PPoorrttffoolliioo TTuurrnnoovveerr RRaattiioo ((LLaasstt 11 YYeeaarr)) 3399..6633%%
Banks 26.41Software 13.72Petroleum Products 8.43Auto 7.56Construction Project 6.60Pharmaceuticals 6.33Finance 4.58Industrial Capital Goods 4.24Consumer Non Durables 3.51Power 3.49
Telecom - Services 3.19Oil 2.32Cement 1.58Auto Ancillaries 1.52Ferrous Metals 1.12Gas 1.09Industrial Products 0.97Construction 0.77Media And Entertainment 0.68
Industry Allocation of Equity Holding (% of Net Assets)
CCoommppaannyy IInndduussttrryy++ %% ttoo NNAAVV
EEQQUUIITTYY && EEQQUUIITTYY RREELLAATTEEDD
Infosys Ltd. Software 8.35
ICICI Bank Ltd. Banks 8.31
State Bank of India Banks 7.03
Reliance Industries Ltd. Petroleum Products 6.30
HDFC Bank Ltd. Banks 4.77
Bharat Petroleum Corporation Ltd. Petroleum Products 4.47
Tata Motors Ltd. DVR Auto 3.89
Tata Consultancy Services Ltd. Software 3.57
Larsen & Toubro Ltd. Construction Project 3.54
Housing Development Finance Corporation Ltd. $ Finance 2.80
TToottaall ooff TToopp TTeenn HHoollddiinnggss 5533..0033
TToottaall EEqquuiittyy && EEqquuiittyy RReellaatteedd HHoollddiinnggss 9988..0000
Cash, Cash Equivalents and Net Current Assets 2.00
GGrraanndd TToottaall 110000..0000
AAvveerraaggee AAUUMM ffoorr tthhee qquuaarrtteerr eennddeedd SSeepptteemmbbeerr 3300,, 22001144 ((`̀ IInn LLaakkhhss)) 111166,,555588..8833
CCoommppaannyy IInndduussttrryy++ %% ttoo NNAAVV
EEQQUUIITTYY && EEQQUUIITTYY RREELLAATTEEDD
State Bank of India Banks 10.17
ICICI Bank Ltd. Banks 7.60
Infosys Ltd. Software 6.85
Larsen & Toubro Ltd. Construction Project 5.79
Aurobindo Pharma Ltd. Pharmaceuticals 4.52
Bharat Petroleum Corporation Ltd. Petroleum Products 4.37
Maruti Suzuki India Ltd. Auto 4.12
Bank of Baroda Banks 3.75
Tata Motors Ltd. DVR Auto 3.44
Info Edge (India) Ltd. Software 2.60 TToottaall ooff TToopp TTeenn HHoollddiinnggss 5533..2211
TToottaall EEqquuiittyy && EEqquuiittyy RReellaatteedd HHoollddiinnggss 9988..1111
Cash margin 0.03
Other Cash, Cash Equivalents and Net Current Assets 1.86 GGrraanndd TToottaall 110000..0000
AAvveerraaggee AAUUMM ffoorr tthhee qquuaarrtteerr eennddeedd SSeepptteemmbbeerr 3300,, 22001144 ((`̀ IInn LLaakkhhss)) 11,,556633,,778855..3366
Source for Risk ratio: CRISIL Fund Analyser * Risk-free rate assumed to be 8.23% (364-day Treasury Bill yield on 31-10-14)
Face Value per Unit: ` 10 unless otherwise specified + Industry Classification as recommended by AMFI Data is as of November 30, 2014 unless otherwise specified.
Intouchmutually November 2014 17

HDFC Top 200 FundAn open-ended growth scheme
HDFC Capital Builder FundAn open-ended growth scheme
NAV (as of November 28, 2014) NAV per Unit (`)
Growth Option 199.785Dividend Option 30.492Direct Plan - Growth Option 201.341Direct Plan - Dividend Option 30.785
NAV (as of November 28, 2014) NAV per Unit (`)
Growth Option 355.726Dividend Option 57.585Direct Plan - Growth Option 359.593Direct Plan - Dividend Option 58.254
CCoommppaannyy IInndduussttrryy++ %% ttoo NNAAVV
EEQQUUIITTYY && EEQQUUIITTYY RREELLAATTEEDD
State Bank of India Banks 8.99
Infosys Ltd. Software 7.51
ICICI Bank Ltd. Banks 5.94
Larsen & Toubro Ltd. Construction Project 4.32
Reliance Industries Ltd. Petroleum Products 4.23
Maruti Suzuki India Ltd. Auto 3.61
Tata Motors Ltd. DVR Auto 3.45
Aurobindo Pharma Ltd. Pharmaceuticals 3.20
Housing Development Finance Corporation Ltd. $ Finance 3.17
Bank of Baroda Banks 3.16TToottaall ooff TToopp TTeenn HHoollddiinnggss 4477..5588
TToottaall EEqquuiittyy && EEqquuiittyy RReellaatteedd HHoollddiinnggss 9999..5555
Cash margin 0.11
Other Cash, Cash Equivalents and Net Current Assets 0.34GGrraanndd TToottaall 110000..0000
AAvveerraaggee AAUUMM ffoorr tthhee qquuaarrtteerr eennddeedd SSeepptteemmbbeerr 3300,, 22001144 ((`̀ IInn LLaakkhhss)) 11,,228800,,002233..1155
Portfolio – Top 10 Holdings Portfolio – Top 10 Holdings
PPoorrttffoolliioo TTuurrnnoovveerr RRaattiioo ((LLaasstt 11 YYeeaarr)) 4422..4488%%
CCoommppaannyy IInndduussttrryy++ %% ttoo NNAAVV
EEQQUUIITTYY && EEQQUUIITTYY RREELLAATTEEDD
Infosys Ltd. Software 7.02
ICICI Bank Ltd. Banks 6.03
State Bank of India Banks 5.97
Bharat Petroleum Corporation Ltd. Petroleum Products 3.90
Reliance Industries Ltd. Petroleum Products 3.55
Tata Motors Ltd. Auto 3.49
Solar Industries India Ltd. Chemicals 3.47
HDFC Bank Ltd. Banks 3.42
Indusind Bank Ltd. Banks 3.20
Wipro Ltd. Software 2.77
TToottaall ooff TToopp TTeenn HHoollddiinnggss 4422..8822
TToottaall EEqquuiittyy && EEqquuiittyy RReellaatteedd HHoollddiinnggss 9955..1155
Cash, Cash Equivalents and Net Current Assets 4.85
GGrraanndd TToottaall 110000..0000
AAvveerraaggee AAUUMM ffoorr tthhee qquuaarrtteerr eennddeedd SSeepptteemmbbeerr 3300,, 22001144 ((`̀ IInn LLaakkhhss)) 5599,,999955..3388
Banks 27.86
Software 13.19
Petroleum Products 8.80
Auto 7.80
Pharmaceuticals 5.26
Construction Project 4.94
Industrial Capital Goods 4.90
Finance 4.84
Oil 3.89
Consumer Non Durables 3.59
Power 2.97
Cement 2.54
Telecom - Services 2.34
Ferrous Metals 1.86
Gas 1.58
Auto Ancillaries 0.86
Minerals / Mining 0.85
Media And Entertainment 0.64
Transportation 0.30
Construction 0.25
Industrial Products 0.18
Non - Ferrous Metals 0.10
Telecom - Equipment & Accessories 0.01
Industry Allocation of Equity Holding (% of Net Assets)Banks 28.38Software 14.05Pharmaceuticals 7.86Petroleum Products 7.45Construction Project 5.39Chemicals 5.22Consumer Non Durables 4.95Auto 3.49Cement 1.96Auto Ancillaries 1.91
Oil 1.89Consumer Durables 1.85Industrial Capital Goods 1.77Telecom - Services 1.75Gas 1.69Media And Entertainment 1.67Industrial Products 1.66Power 1.14Services 1.07
Industry Allocation of Equity Holding (% of Net Assets)
Std Deviation Beta Sharpe Ratio*
Risk Ratio 5.68% 1.1471 0.242(for the 3-yr period ended Nov 28, 14)Based on month-end NAV
Std Deviation Beta Sharpe Ratio*
Risk Ratio 4.41% 0.8393 0.338(for the 3-yr period ended Nov 28, 14)Based on month-end NAV
PPoorrttffoolliioo TTuurrnnoovveerr RRaattiioo ((LLaasstt 11 YYeeaarr)) 2277..5577%%
Face Value per Unit: ` 10 unless otherwise specified + Industry Classification as recommended by AMFI Data is as of November 30, 2014 unless otherwise specified.
Source for Risk ratio: CRISIL Fund Analyser * Risk-free rate assumed to be 8.23% (364-day Treasury Bill yield on 31-10-14)
18 November 2014 Intouchmutually
$ Sponsor Total outstanding position (as at November 30, 2014) in Derivative Instruments
(Interest Rate Swap) (Gross Notional) ` 3,347.40 lakhs.

An open-ended growth scheme An open-ended growth scheme
HDFC Core & Satellite Fund
PPoorrttffoolliioo TTuurrnnoovveerr RRaattiioo ((LLaasstt 11 YYeeaarr)) 7799..9966%%
Banks 23.64Software 14.27Auto 9.17Petroleum Products 8.81Industrial Capital Goods 6.73Cement 6.56Pharmaceuticals 6.17Construction Project 5.52Oil 3.63
Ferrous Metals 3.40Consumer Non Durables 2.20Power 1.59Industrial Products 1.52Consumer Durables 0.90Construction 0.89Gas 0.81Finance 0.75Retailing 0.38
Industry Allocation of Equity Holding (% of Net Assets)
NAV (as of November 28, 2014) NAV per Unit (`)
Growth Option 60.656Dividend Option 22.536Direct Plan - Growth Option 61.270Direct Plan - Dividend Option 22.852
NAV (as of November 28, 2014) NAV per Unit (`)
Growth Option 44.388Dividend Option 16.865Direct Plan - Growth Option 44.834Direct Plan - Dividend Option 17.058
Banks 30.01Software 13.02Industrial Capital Goods 8.02Auto 6.43Cement 6.34Construction Project 5.33Petroleum Products 4.17Gas 3.89Consumer Non Durables 2.91
Pharmaceuticals 2.83Ferrous Metals 2.65Industrial Products 2.35Oil 1.68Consumer Durables 1.66Auto Ancillaries 1.13Minerals / Mining 0.97Power 0.82Media And Entertainment 0.57
Industry Allocation of Equity Holding (% of Net Assets)
PPoorrttffoolliioo TTuurrnnoovveerr RRaattiioo ((LLaasstt 11 YYeeaarr)) 5500..8877%%
HDFC Premier Multi-Cap Fund
CCoommppaannyy IInndduussttrryy++ %% ttoo NNAAVV
EEQQUUIITTYY && EEQQUUIITTYY RREELLAATTEEDD
State Bank of India Banks 9.37
Infosys Ltd. Software 6.93
Tata Motors Ltd. DVR Auto 5.87
ICICI Bank Ltd. Banks 5.77
Punjab National Bank Banks 5.19
Reliance Industries Ltd. Petroleum Products 4.73
Bharat Petroleum Corporation Ltd. Petroleum Products 4.08
Oil India Ltd. Oil 3.63
Tata Steel Ltd. Ferrous Metals 3.40
Cipla Ltd. Pharmaceuticals 3.35
TToottaall ooff TToopp TTeenn HHoollddiinnggss 5522..3322
TToottaall EEqquuiittyy && EEqquuiittyy RReellaatteedd HHoollddiinnggss 9966..9944
Cash, Cash Equivalents and Net Current Assets 3.06
GGrraanndd TToottaall 110000..0000
AAvveerraaggee AAUUMM ffoorr tthhee qquuaarrtteerr eennddeedd SSeepptteemmbbeerr 3300,, 22001144 ((`̀ IInn LLaakkhhss)) 2288,,775533..1177
Portfolio – Top 10 Holdings
Std Deviation Beta Sharpe Ratio*
Risk Ratio 6.20% 1.1614 0.181(for the 3-yr period ended Nov 28, 14)Based on month-end NAV
Source for Risk ratio: CRISIL Fund Analyser * Risk-free rate assumed to be 8.23% (364-day Treasury Bill yield on 31-10-14)
Std Deviation Beta Sharpe Ratio*
Risk Ratio 5.72% 1.0462 0.183(for the 3-yr period ended Nov 28, 14)Based on month-end NAV
Large-Cap 00.00Mid Cap 00.00
Segment-wise Break-up of Equity Holding (% of Net Assets)
CCoommppaannyy IInndduussttrryy++ %% ttoo NNAAVV
EEQQUUIITTYY && EEQQUUIITTYY RREELLAATTEEDD
State Bank of India Banks 9.22
Infosys Ltd. Software 7.29
ICICI Bank Ltd. Banks 5.42
Punjab National Bank Banks 5.38
Bharat Petroleum Corporation Ltd. Petroleum Products 4.17
HDFC Bank Ltd. Banks 4.00
Gujarat State Petronet Ltd. Gas 3.89
KEC International Ltd. Construction Project 3.48
Crompton Greaves Ltd. Industrial Capital Goods 3.39
Tata Motors Ltd. DVR Auto 3.35TToottaall ooff TToopp TTeenn HHoollddiinnggss 4499..5599
TToottaall EEqquuiittyy && EEqquuiittyy RReellaatteedd HHoollddiinnggss 9944..7788
Cash, Cash Equivalents and Net Current Assets 5.22 GGrraanndd TToottaall 110000..0000
AAvveerraaggee AAUUMM ffoorr tthhee qquuaarrtteerr eennddeedd SSeepptteemmbbeerr 3300,, 22001144 ((`̀ IInn LLaakkhhss)) 3333,,442233..0022
Portfolio – Top 10 Holdings
Face Value per Unit: ` 10 unless otherwise specified + Industry Classification as recommended by AMFI Data is as of November 30, 2014 unless otherwise specified.
Intouchmutually November 2014 19

PPoorrttffoolliioo TTuurrnnoovveerr RRaattiioo ((LLaasstt 11 YYeeaarr)) 1111..9988%%
HDFC Mid-Cap Opportunities FundAn open-ended equity scheme
NAV (as of November 28, 2014) NAV per Unit (`)
Growth Option 35.040Dividend Option 26.508Direct Plan - Growth Option 35.426Direct Plan - Dividend Option 29.771
Portfolio – Top 10 Holdings
Banks 16.42Pharmaceuticals 12.38Industrial Products 10.61Auto Ancillaries 8.22Consumer Durables 8.20Software 6.40Industrial Capital Goods 5.88Finance 5.24Chemicals 4.04
Media And Entertainment 3.81Pesticides 3.65Construction Project 2.61Consumer Non Durables 2.56Petroleum Products 2.28Oil 1.49Construction 1.29Transportation 1.04
Industry Allocation of Equity Holding (% of Net Assets)
Large-Cap 00.00Mid-Cap 00.00
Segment-wise Break-up of Equity Holding (% of Net Assets)
CCoommppaannyy IInndduussttrryy++ %% ttoo NNAAVV
EEQQUUIITTYY && EEQQUUIITTYY RREELLAATTEEDD
Aurobindo Pharma Ltd. Pharmaceuticals 3.42
AIA Engineering Ltd. Industrial Capital Goods 2.66
Voltas Ltd. Construction Project 2.44
Torrent Pharmaceuticals Ltd. Pharmaceuticals 2.41
Bank of Baroda Banks 2.39
Bayer Cropscience Ltd. Pesticides 2.28
Hindustan Petroleum Corporation Ltd. Petroleum Products 2.28
Bajaj Finance Ltd. Finance 2.26
SKF India Ltd. Industrial Products 2.25
Amara Raja Batteries Ltd. Auto Ancillaries 2.25
TToottaall ooff TToopp TTeenn HHoollddiinnggss 2244..6644
TToottaall EEqquuiittyy && EEqquuiittyy RReellaatteedd HHoollddiinnggss 9966..1122
Cash, Cash Equivalents and Net Current Assets 3.88
GGrraanndd TToottaall 110000..0000
AAvveerraaggee AAUUMM ffoorr tthhee qquuaarrtteerr eennddeedd SSeepptteemmbbeerr 3300,, 22001144 ((`̀ IInn LLaakkhhss)) 666644,,229999..3399
Std Deviation Beta Sharpe Ratio*
Risk Ratio 5.19% 0.7432 0.375(for the 3-yr period ended Nov 28, 14)Based on month-end NAV
Std Deviation Beta Sharpe Ratio*
Risk Ratio 3.98% 0.7950 0.256(for the 3-yr period ended Nov 28, 14)Based on month-end NAV
PPoorrttffoolliioo TTuurrnnoovveerr RRaattiioo ((LLaasstt 11 YYeeaarr)) 6611..6644%%
HDFC Large-Cap FundAn open-ended equity scheme
NAV (as of November 28, 2014) NAV per Unit (`))
Growth Option 91.972Dividend Option 26.124Direct Plan - Growth Option 92.472Direct Plan - Dividend Option 26.350
Portfolio – Top 10 Holdings
Banks 25.50
Software 18.98
Auto 11.09
Petroleum Products 10.59
Telecom - Services 5.40
Construction Project 5.22
Consumer Non Durables 4.74
Finance 4.32
Ferrous Metals 4.10
Oil 2.27
Pharmaceuticals 1.50
Minerals / Mining 1.38
Power 1.07
Industry Allocation of Equity Holding (% of Net Assets)
CCoommppaannyy IInndduussttrryy++ %% ttoo NNAAVV
EEQQUUIITTYY && EEQQUUIITTYY RREELLAATTEEDD
State Bank of India Banks 9.42
Infosys Ltd. Software 9.11
ICICI Bank Ltd. Banks 8.16
Reliance Industries Ltd. Petroleum Products 6.98
HDFC Bank Ltd. Banks 6.29
Larsen & Toubro Ltd. Construction Project 5.22
Tata Motors Ltd. DVR Auto 5.15
Cognizant Technology Solutions Corp Software 4.80
ITC Ltd. Consumer Non Durables 4.74
Housing Development Finance Corporation Ltd. $ Finance 4.32
TToottaall ooff TToopp TTeenn HHoollddiinnggss 6644..1199
TToottaall EEqquuiittyy && EEqquuiittyy RReellaatteedd HHoollddiinnggss 9966..1166
Cash, Cash Equivalents and Net Current Assets 3.84
GGrraanndd TToottaall 110000..0000
AAvveerraaggee AAUUMM ffoorr tthhee qquuaarrtteerr eennddeedd SSeepptteemmbbeerr 3300,, 22001144 ((`̀ IInn LLaakkhhss)) 112244,,111199..1177
Source for Risk ratio: CRISIL Fund Analyser * Risk-free rate assumed to be 8.23% (364-day Treasury Bill yield on 31-10-14)
Face Value per Unit: ` 10 unless otherwise specified + Industry Classification as recommended by AMFI Data is as of November 30, 2014 unless otherwise specified.
20 November 2014 Intouchmutually
$ Sponsor
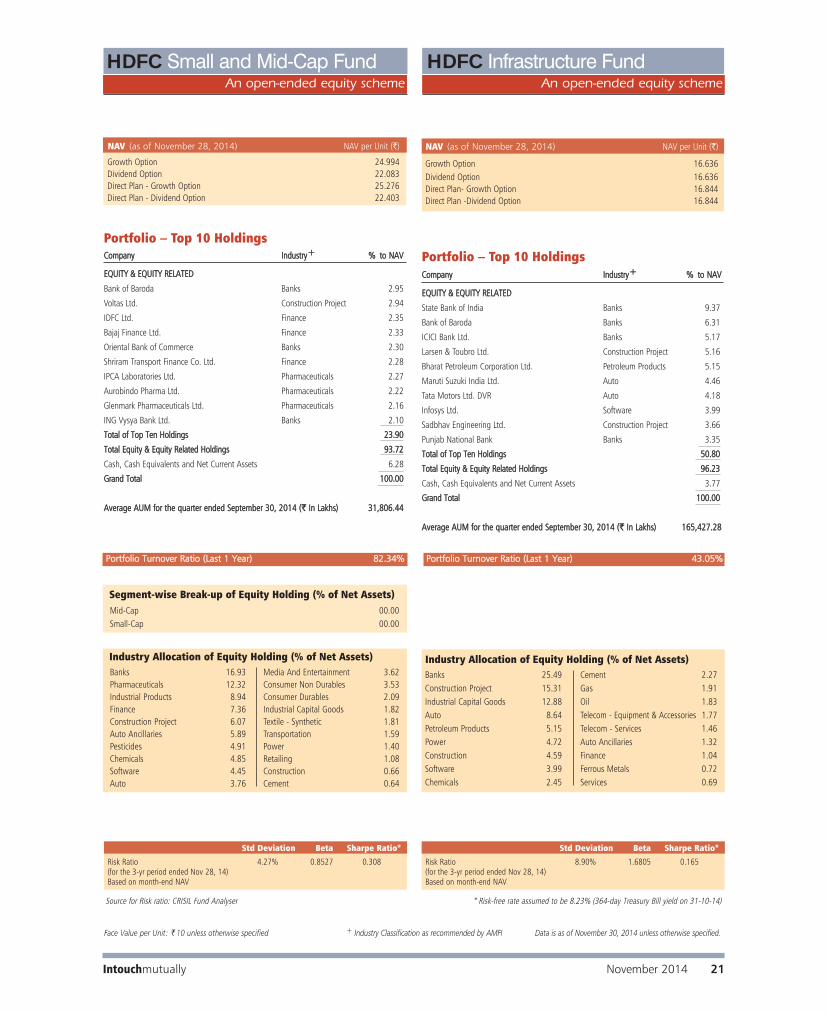
Intouchmutually November 2014 21
HDFC Infrastructure FundAn open-ended equity scheme
Portfolio – Top 10 Holdings
NAV (as of November 28, 2014) NAV per Unit (`)
Growth Option 16.636Dividend Option 16.636Direct Plan- Growth Option 16.844Direct Plan -Dividend Option 16.844
CCoommppaannyy IInndduussttrryy++ %% ttoo NNAAVV
EEQQUUIITTYY && EEQQUUIITTYY RREELLAATTEEDD
State Bank of India Banks 9.37
Bank of Baroda Banks 6.31
ICICI Bank Ltd. Banks 5.17
Larsen & Toubro Ltd. Construction Project 5.16
Bharat Petroleum Corporation Ltd. Petroleum Products 5.15
Maruti Suzuki India Ltd. Auto 4.46
Tata Motors Ltd. DVR Auto 4.18
Infosys Ltd. Software 3.99
Sadbhav Engineering Ltd. Construction Project 3.66
Punjab National Bank Banks 3.35
TToottaall ooff TToopp TTeenn HHoollddiinnggss 5500..8800
TToottaall EEqquuiittyy && EEqquuiittyy RReellaatteedd HHoollddiinnggss 9966..2233
Cash, Cash Equivalents and Net Current Assets 3.77
GGrraanndd TToottaall 110000..0000
AAvveerraaggee AAUUMM ffoorr tthhee qquuaarrtteerr eennddeedd SSeepptteemmbbeerr 3300,, 22001144 ((`̀ IInn LLaakkhhss)) 116655,,442277..2288
Banks 25.49Construction Project 15.31Industrial Capital Goods 12.88Auto 8.64Petroleum Products 5.15Power 4.72Construction 4.59Software 3.99Chemicals 2.45
Cement 2.27Gas 1.91Oil 1.83Telecom - Equipment & Accessories 1.77Telecom - Services 1.46Auto Ancillaries 1.32Finance 1.04Ferrous Metals 0.72Services 0.69
Industry Allocation of Equity Holding (% of Net Assets)
PPoorrttffoolliioo TTuurrnnoovveerr RRaattiioo ((LLaasstt 11 YYeeaarr)) 4433..0055%%
Std Deviation Beta Sharpe Ratio*
Risk Ratio 8.90% 1.6805 0.165(for the 3-yr period ended Nov 28, 14)Based on month-end NAV
Std Deviation Beta Sharpe Ratio*
Risk Ratio 4.27% 0.8527 0.308(for the 3-yr period ended Nov 28, 14)Based on month-end NAV
Source for Risk ratio: CRISIL Fund Analyser * Risk-free rate assumed to be 8.23% (364-day Treasury Bill yield on 31-10-14)
Face Value per Unit: ` 10 unless otherwise specified + Industry Classification as recommended by AMFI Data is as of November 30, 2014 unless otherwise specified.
PPoorrttffoolliioo TTuurrnnoovveerr RRaattiioo ((LLaasstt 11 YYeeaarr)) 8822..3344%%
HDFC Small and Mid-Cap FundAn open-ended equity scheme
NAV (as of November 28, 2014) NAV per Unit (`)
Growth Option 24.994Dividend Option 22.083Direct Plan - Growth Option 25.276Direct Plan - Dividend Option 22.403
Portfolio – Top 10 Holdings
Banks 16.93Pharmaceuticals 12.32Industrial Products 8.94Finance 7.36Construction Project 6.07Auto Ancillaries 5.89Pesticides 4.91Chemicals 4.85Software 4.45Auto 3.76
Media And Entertainment 3.62Consumer Non Durables 3.53Consumer Durables 2.09Industrial Capital Goods 1.82Textile - Synthetic 1.81Transportation 1.59Power 1.40Retailing 1.08Construction 0.66Cement 0.64
Industry Allocation of Equity Holding (% of Net Assets)
CCoommppaannyy IInndduussttrryy++ %% ttoo NNAAVV
EEQQUUIITTYY && EEQQUUIITTYY RREELLAATTEEDD
Bank of Baroda Banks 2.95
Voltas Ltd. Construction Project 2.94
IDFC Ltd. Finance 2.35
Bajaj Finance Ltd. Finance 2.33
Oriental Bank of Commerce Banks 2.30
Shriram Transport Finance Co. Ltd. Finance 2.28
IPCA Laboratories Ltd. Pharmaceuticals 2.27
Aurobindo Pharma Ltd. Pharmaceuticals 2.22
Glenmark Pharmaceuticals Ltd. Pharmaceuticals 2.16
ING Vysya Bank Ltd. Banks 2.10
TToottaall ooff TToopp TTeenn HHoollddiinnggss 2233..9900
TToottaall EEqquuiittyy && EEqquuiittyy RReellaatteedd HHoollddiinnggss 9933..7722
Cash, Cash Equivalents and Net Current Assets 6.28
GGrraanndd TToottaall 110000..0000
AAvveerraaggee AAUUMM ffoorr tthhee qquuaarrtteerr eennddeedd SSeepptteemmbbeerr 3300,, 22001144 ((`̀ IInn LLaakkhhss)) 3311,,880066..4444
Mid-Cap 00.00Small-Cap 00.00
Segment-wise Break-up of Equity Holding (% of Net Assets)

22 November 2014 Intouchmutually
HDFC TaxSaverAn open-ended equity linked savings scheme with
a lock-in period of 3 years
NAV (as of November 28, 2014) NAV per Unit (`)
Growth Option 408.483Dividend Option 73.018Direct Plan - Growth Option 413.169Direct Plan - Dividend Option 73.928
Portfolio – Top 10 Holdings
PPoorrttffoolliioo TTuurrnnoovveerr RRaattiioo ((LLaasstt 11 YYeeaarr)) 2222..5544%%
Banks 28.06Software 12.24Auto 8.20Construction Project 6.17Pharmaceuticals 5.76Petroleum Products 5.50Industrial Capital Goods 5.21Consumer Non Durables 4.67Cement 4.33Oil 2.88Finance 2.52
Ferrous Metals 2.33Auto Ancillaries 1.83Industrial Products 1.80Power 1.36Minerals / Mining 1.26Chemicals 1.11Services 0.84Gas 0.49Transportation 0.43Paper 0.32
Industry Allocation of Equity Holding (% of Net Assets)
CCoommppaannyy IInndduussttrryy++ %% ttoo NNAAVV
EEQQUUIITTYY && EEQQUUIITTYY RREELLAATTEEDD
State Bank of India Banks 9.85
ICICI Bank Ltd. Banks 7.17
Infosys Ltd. Software 6.02
Bharat Petroleum Corporation Ltd. Petroleum Products 4.68
Tata Motors Ltd. DVR Auto 4.41
Maruti Suzuki India Ltd. Auto 3.79
Larsen & Toubro Ltd. Construction Project 3.40
Tata Consultancy Services Ltd. Software 3.34
Procter & Gamble Hygiene and Health Care Ltd. Consumer Non Durables 3.08
Oil India Ltd. Oil 2.88
TToottaall ooff TToopp TTeenn HHoollddiinnggss 4488..6622
TToottaall EEqquuiittyy && EEqquuiittyy RReellaatteedd HHoollddiinnggss 9977..3311
Cash, Cash Equivalents and Net Current Assets 2.69
GGrraanndd TToottaall 110000..0000
AAvveerraaggee AAUUMM ffoorr tthhee qquuaarrtteerr eennddeedd SSeepptteemmbbeerr 3300,, 22001144 ((`̀ IInn LLaakkhhss)) 446622,,113300..9933
Std Deviation Beta Sharpe Ratio*
Risk Ratio 5.32% 1.0117 0.267(for the 3-yr period ended Nov 28, 14)Based on month-end NAV
Source for Risk ratio: CRISIL Fund Analyser * Risk-free rate assumed to be 8.23% (364-day Treasury Bill yield on 31-10-14)
HDFC Long Term Advantage FundAn open-ended equity linked savings scheme with
a lock-in period of 3 years
Portfolio – Top 10 Holdings
NAV (as of November 28, 2014) NAV per Unit (`)
Growth Option 243.119Dividend Option 44.250Direct Plan - Growth Option 245.585Direct Plan - Dividend Option 44.715
PPoorrttffoolliioo TTuurrnnoovveerr RRaattiioo ((LLaasstt 11 YYeeaarr)) 55..7711%%
CCoommppaannyy IInndduussttrryy++ %% ttoo NNAAVV
EEQQUUIITTYY && EEQQUUIITTYY RREELLAATTEEDD
ICICI Bank Ltd. Banks 8.64
Infosys Ltd. Software 6.80
Tata Consultancy Services Ltd. Software 5.53
Larsen & Toubro Ltd. Construction Project 5.45
Tata Motors Ltd. DVR Auto 4.88
Motherson Sumi Systems Ltd. Auto Ancillaries 4.43
ITC Ltd. Consumer Non Durables 4.17
AIA Engineering Ltd. Industrial Capital Goods 4.15
State Bank of India Banks 3.96
Housing Development Finance Corporation Ltd. $ Finance 3.81
TToottaall ooff TToopp TTeenn HHoollddiinnggss 5511..8822
TToottaall EEqquuiittyy && EEqquuiittyy RReellaatteedd HHoollddiinnggss 9999..5577
Cash, Cash Equivalents and Net Current Assets 0.43
GGrraanndd TToottaall 110000..0000
AAvveerraaggee AAUUMM ffoorr tthhee qquuaarrtteerr eennddeedd SSeepptteemmbbeerr 3300,, 22001144 ((`̀ IInn LLaakkhhss)) 111100,,774411..8899
Banks 19.10
Software 12.74
Industrial Products 10.37
Auto Ancillaries 7.12
Consumer Non Durables 6.29
Petroleum Products 6.26
Auto 6.03
Industrial Capital Goods 5.53
Construction Project 5.45
Finance 5.08
Consumer Durables 4.31
Pharmaceuticals 4.19
Oil 2.89
Telecom - Services 2.51
Ferrous Metals 1.17
Media And Entertainment 0.53
Industry Allocation of Equity Holding (% of Net Assets)
Std Deviation Beta Sharpe Ratio*
Risk Ratio 4.54% 1.0119 0.308(for the 3-yr period ended Nov 28, 14)Based on month-end NAV
$ Sponsor
Face Value per Unit: ` 10 unless otherwise specified + Industry Classification as recommended by AMFI Data is as of November 30, 2014 unless otherwise specified.
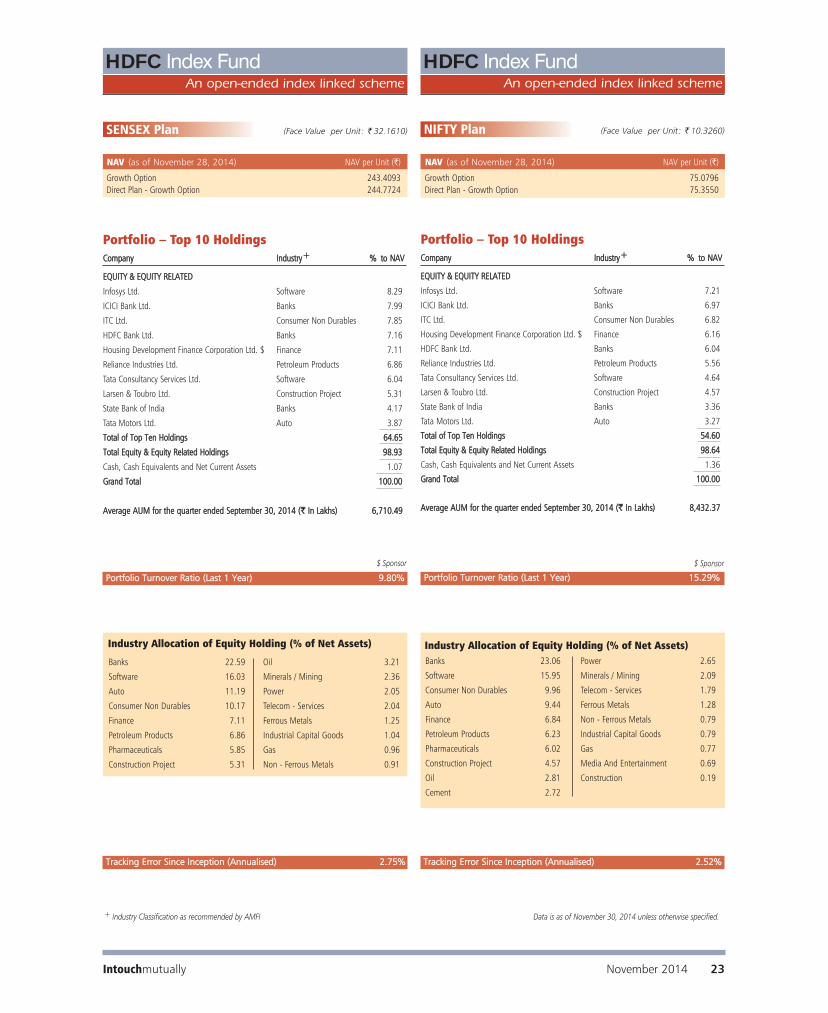
Intouchmutually November 2014 23
HDFC Index Fund
NIFTY Plan (Face Value per Unit: ` 10.3260)
NAV (as of November 28, 2014) NAV per Unit (`)
Growth Option 75.0796Direct Plan - Growth Option 75.3550
CCoommppaannyy IInndduussttrryy++ %% ttoo NNAAVV
EEQQUUIITTYY && EEQQUUIITTYY RREELLAATTEEDD
Infosys Ltd. Software 7.21
ICICI Bank Ltd. Banks 6.97
ITC Ltd. Consumer Non Durables 6.82
Housing Development Finance Corporation Ltd. $ Finance 6.16
HDFC Bank Ltd. Banks 6.04
Reliance Industries Ltd. Petroleum Products 5.56
Tata Consultancy Services Ltd. Software 4.64
Larsen & Toubro Ltd. Construction Project 4.57
State Bank of India Banks 3.36
Tata Motors Ltd. Auto 3.27
TToottaall ooff TToopp TTeenn HHoollddiinnggss 5544..6600
TToottaall EEqquuiittyy && EEqquuiittyy RReellaatteedd HHoollddiinnggss 9988..6644
Cash, Cash Equivalents and Net Current Assets 1.36
GGrraanndd TToottaall 110000..0000
AAvveerraaggee AAUUMM ffoorr tthhee qquuaarrtteerr eennddeedd SSeepptteemmbbeerr 3300,, 22001144 ((`̀ IInn LLaakkhhss)) 88,,443322..3377
Portfolio – Top 10 Holdings
PPoorrttffoolliioo TTuurrnnoovveerr RRaattiioo ((LLaasstt 11 YYeeaarr)) 1155..2299%%
$ Sponsor
An open-ended index linked scheme
Banks 23.06
Software 15.95
Consumer Non Durables 9.96
Auto 9.44
Finance 6.84
Petroleum Products 6.23
Pharmaceuticals 6.02
Construction Project 4.57
Oil 2.81
Cement 2.72
Power 2.65
Minerals / Mining 2.09
Telecom - Services 1.79
Ferrous Metals 1.28
Non - Ferrous Metals 0.79
Industrial Capital Goods 0.79
Gas 0.77
Media And Entertainment 0.69
Construction 0.19
Industry Allocation of Equity Holding (% of Net Assets)
TTrraacckkiinngg EErrrroorr SSiinnccee IInncceeppttiioonn ((AAnnnnuuaalliisseedd)) 22..5522%%
CCoommppaannyy IInndduussttrryy++ %% ttoo NNAAVV
EEQQUUIITTYY && EEQQUUIITTYY RREELLAATTEEDD
Infosys Ltd. Software 8.29
ICICI Bank Ltd. Banks 7.99
ITC Ltd. Consumer Non Durables 7.85
HDFC Bank Ltd. Banks 7.16
Housing Development Finance Corporation Ltd. $ Finance 7.11
Reliance Industries Ltd. Petroleum Products 6.86
Tata Consultancy Services Ltd. Software 6.04
Larsen & Toubro Ltd. Construction Project 5.31
State Bank of India Banks 4.17
Tata Motors Ltd. Auto 3.87
TToottaall ooff TToopp TTeenn HHoollddiinnggss 6644..6655
TToottaall EEqquuiittyy && EEqquuiittyy RReellaatteedd HHoollddiinnggss 9988..9933
Cash, Cash Equivalents and Net Current Assets 1.07
GGrraanndd TToottaall 110000..0000
AAvveerraaggee AAUUMM ffoorr tthhee qquuaarrtteerr eennddeedd SSeepptteemmbbeerr 3300,, 22001144 ((`̀ IInn LLaakkhhss)) 66,,771100..4499
Portfolio – Top 10 Holdings
PPoorrttffoolliioo TTuurrnnoovveerr RRaattiioo ((LLaasstt 11 YYeeaarr)) 99..8800%%
$ Sponsor
SENSEX Plan (Face Value per Unit: ` 32.1610)
NAV (as of November 28, 2014) NAV per Unit (`)
Growth Option 243.4093Direct Plan - Growth Option 244.7724
An open-ended index linked scheme
HDFC Index Fund
Banks 22.59
Software 16.03
Auto 11.19
Consumer Non Durables 10.17
Finance 7.11
Petroleum Products 6.86
Pharmaceuticals 5.85
Construction Project 5.31
Oil 3.21
Minerals / Mining 2.36
Power 2.05
Telecom - Services 2.04
Ferrous Metals 1.25
Industrial Capital Goods 1.04
Gas 0.96
Non - Ferrous Metals 0.91
Industry Allocation of Equity Holding (% of Net Assets)
TTrraacckkiinngg EErrrroorr SSiinnccee IInncceeppttiioonn ((AAnnnnuuaalliisseedd)) 22..7755%%
+ Industry Classification as recommended by AMFI Data is as of November 30, 2014 unless otherwise specified.
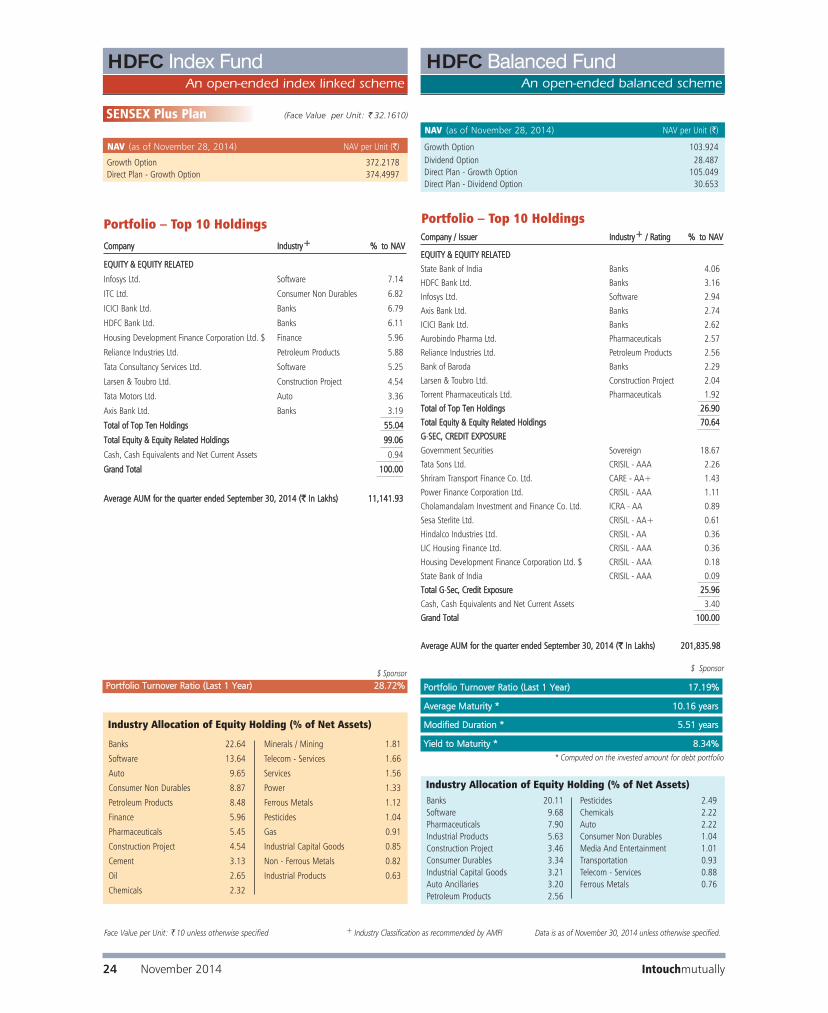
Face Value per Unit: ` 10 unless otherwise specified + Industry Classification as recommended by AMFI Data is as of November 30, 2014 unless otherwise specified.
24 November 2014 Intouchmutually
NAV (as of November 28, 2014) NAV per Unit (`)
Growth Option 103.924Dividend Option 28.487Direct Plan - Growth Option 105.049Direct Plan - Dividend Option 30.653
HDFC Balanced FundAn open-ended balanced scheme
CCoommppaannyy // IIssssuueerr IInndduussttrryy++ // RRaattiinngg %% ttoo NNAAVV
EEQQUUIITTYY && EEQQUUIITTYY RREELLAATTEEDD
State Bank of India Banks 4.06
HDFC Bank Ltd. Banks 3.16
Infosys Ltd. Software 2.94
Axis Bank Ltd. Banks 2.74
ICICI Bank Ltd. Banks 2.62
Aurobindo Pharma Ltd. Pharmaceuticals 2.57
Reliance Industries Ltd. Petroleum Products 2.56
Bank of Baroda Banks 2.29
Larsen & Toubro Ltd. Construction Project 2.04
Torrent Pharmaceuticals Ltd. Pharmaceuticals 1.92TToottaall ooff TToopp TTeenn HHoollddiinnggss 2266..9900
TToottaall EEqquuiittyy && EEqquuiittyy RReellaatteedd HHoollddiinnggss 7700..6644
GG-SSEECC,, CCRREEDDIITT EEXXPPOOSSUURREE
Government Securities Sovereign 18.67
Tata Sons Ltd. CRISIL - AAA 2.26
Shriram Transport Finance Co. Ltd. CARE - AA+ 1.43
Power Finance Corporation Ltd. CRISIL - AAA 1.11
Cholamandalam Investment and Finance Co. Ltd. ICRA - AA 0.89
Sesa Sterlite Ltd. CRISIL - AA+ 0.61
Hindalco Industries Ltd. CRISIL - AA 0.36
LIC Housing Finance Ltd. CRISIL - AAA 0.36
Housing Development Finance Corporation Ltd. $ CRISIL - AAA 0.18
State Bank of India CRISIL - AAA 0.09TToottaall GG-SSeecc,, CCrreeddiitt EExxppoossuurree 2255..9966
Cash, Cash Equivalents and Net Current Assets 3.40GGrraanndd TToottaall 110000..0000
AAvveerraaggee AAUUMM ffoorr tthhee qquuaarrtteerr eennddeedd SSeepptteemmbbeerr 3300,, 22001144 ((`̀ IInn LLaakkhhss)) 220011,,883355..9988
Portfolio – Top 10 Holdings
Banks 20.11Software 9.68Pharmaceuticals 7.90Industrial Products 5.63Construction Project 3.46Consumer Durables 3.34Industrial Capital Goods 3.21Auto Ancillaries 3.20Petroleum Products 2.56
Pesticides 2.49Chemicals 2.22Auto 2.22Consumer Non Durables 1.04Media And Entertainment 1.01Transportation 0.93Telecom - Services 0.88Ferrous Metals 0.76
Industry Allocation of Equity Holding (% of Net Assets)
$ Sponsor
CCoommppaannyy IInndduussttrryy++ %% ttoo NNAAVV
EEQQUUIITTYY && EEQQUUIITTYY RREELLAATTEEDD
Infosys Ltd. Software 7.14
ITC Ltd. Consumer Non Durables 6.82
ICICI Bank Ltd. Banks 6.79
HDFC Bank Ltd. Banks 6.11
Housing Development Finance Corporation Ltd. $ Finance 5.96
Reliance Industries Ltd. Petroleum Products 5.88
Tata Consultancy Services Ltd. Software 5.25
Larsen & Toubro Ltd. Construction Project 4.54
Tata Motors Ltd. Auto 3.36
Axis Bank Ltd. Banks 3.19
TToottaall ooff TToopp TTeenn HHoollddiinnggss 5555..0044
TToottaall EEqquuiittyy && EEqquuiittyy RReellaatteedd HHoollddiinnggss 9999..0066
Cash, Cash Equivalents and Net Current Assets 0.94
GGrraanndd TToottaall 110000..0000
AAvveerraaggee AAUUMM ffoorr tthhee qquuaarrtteerr eennddeedd SSeepptteemmbbeerr 3300,, 22001144 ((`̀ IInn LLaakkhhss)) 1111,,114411..9933
Portfolio – Top 10 Holdings
PPoorrttffoolliioo TTuurrnnoovveerr RRaattiioo ((LLaasstt 11 YYeeaarr)) 2288..7722%%$ Sponsor
SENSEX Plus Plan (Face Value per Unit: ` 32.1610)
NAV (as of November 28, 2014) NAV per Unit (`)
Growth Option 372.2178Direct Plan - Growth Option 374.4997
An open-ended index linked scheme
HDFC Index Fund
Banks 22.64
Software 13.64
Auto 9.65
Consumer Non Durables 8.87
Petroleum Products 8.48
Finance 5.96
Pharmaceuticals 5.45
Construction Project 4.54
Cement 3.13
Oil 2.65
Chemicals 2.32
Minerals / Mining 1.81
Telecom - Services 1.66
Services 1.56
Power 1.33
Ferrous Metals 1.12
Pesticides 1.04
Gas 0.91
Industrial Capital Goods 0.85
Non - Ferrous Metals 0.82
Industrial Products 0.63
Industry Allocation of Equity Holding (% of Net Assets)
YYiieelldd ttoo MMaattuurriittyy ** 88..3344%%
MMooddiiffiieedd DDuurraattiioonn ** 55..5511 yyeeaarrss
AAvveerraaggee MMaattuurriittyy ** 1100..1166 yyeeaarrss
PPoorrttffoolliioo TTuurrnnoovveerr RRaattiioo ((LLaasstt 11 YYeeaarr)) 1177..1199%%
* Computed on the invested amount for debt portfolio

Face Value per Unit: ` 10 unless otherwise specified + Industry Classification as recommended by AMFI Data is as of November 30, 2014 unless otherwise specified.
Intouchmutually November 2014 25
HDFC Children’s Gift FundAn open-ended balanced scheme
Investment Plan
NAV (as of November 28, 2014) NAV per Unit (`)
Investment Plan 81.204Investment Plan - Direct Plan 82.195
$ Sponsor
Portfolio – Top 10 Holdings
Banks 13.84Industrial Products 10.90Software 7.83Pharmaceuticals 6.87Auto Ancillaries 6.64Industrial Capital Goods 4.47Construction Project 4.10Pesticides 3.09Consumer Non Durables 2.82Finance 2.77
Auto 2.55Petroleum Products 1.64Media And Entertainment 1.53Ferrous Metals 1.20Transportation 0.90Telecom - Services 0.79Power 0.79Consumer Durables 0.71Fertilisers 0.43
Industry Allocation of Equity Holding (% of Net Assets)
CCoommppaannyy // IIssssuueerr IInndduussttrryy++ // RRaattiinngg %% ttoo NNAAVV
EEQQUUIITTYY && EEQQUUIITTYY RREELLAATTEEDDState Bank of India Banks 4.20Motherson Sumi Systems Ltd. Auto Ancillaries 3.65Infosys Ltd. Software 3.00Larsen & Toubro Ltd. Construction Project 2.93HDFC Bank Ltd. Banks 2.63Fag Bearings India Ltd. Industrial Products 2.59AIA Engineering Ltd. Industrial Capital Goods 2.55Axis Bank Ltd. Banks 2.35Sun Pharmaceuticals Industries Ltd. Pharmaceuticals 2.31ICICI Bank Ltd. Banks 2.22 TToottaall ooff TToopp TTeenn HHoollddiinnggss 2288..4433TToottaall EEqquuiittyy && EEqquuiittyy RReellaatteedd HHoollddiinnggss 7733..8877GG-SSEECC,, CCRREEDDIITT EEXXPPOOSSUURREEGovernment Securities Sovereign 16.20Tata Sons Ltd. CRISIL - AAA 4.40Power Finance Corporation Ltd. CRISIL - AAA 1.38Sesa Sterlite Ltd. CRISIL - AA+ 0.69Housing Development Finance Corporation Ltd. $ CRISIL - AAA 0.69Bajaj Auto Ltd. CRISIL - AAA(SO) 0.00TToottaall GG-SSeecc,, CCrreeddiitt EExxppoossuurree 2233..3366 Cash, Cash Equivalents and Net Current Assets 2.77GGrraanndd TToottaall 110000..0000
AAvveerraaggee AAUUMM ffoorr tthhee qquuaarrtteerr eennddeedd SSeepptteemmbbeerr 3300,, 22001144 ((`̀ IInn LLaakkhhss)) 6622,,336644..2266
HDFC Prudence FundAn open-ended balanced scheme
NAV (as of November 28, 2014) NAV per Unit (`)
Growth Option 379.099Dividend Option 35.760Direct Plan - Growth Option 383.240Direct Plan - Dividend Option 38.929
CCoommppaannyy // IIssssuueerr IInndduussttrryy++ // RRaattiinngg %% ttoo NNAAVV
EEQQUUIITTYY && EEQQUUIITTYY RREELLAATTEEDDState Bank of India Banks 6.84Infosys Ltd. Software 5.61ICICI Bank Ltd. Banks 4.16Larsen & Toubro Ltd. Construction Project 3.59Aurobindo Pharma Ltd. Pharmaceuticals 2.54Aarti Industries Ltd. Chemicals 2.34Tata Motors Ltd. DVR Auto 2.28Bharat Petroleum Corporation Ltd. Petroleum Products 2.25Bank of Baroda Banks 2.16Procter & Gamble Hygiene and Health Care Ltd. Consumer Non Durables 2.15 TToottaall ooff TToopp TTeenn HHoollddiinnggss 3333..9922TToottaall EEqquuiittyy && EEqquuiittyy RReellaatteedd HHoollddiinnggss 7744..3300 GG-SSEECC,, CCRREEDDIITT EEXXPPOOSSUURREE Government Securities Sovereign 18.35IDBI Bank Ltd. CRISIL - AA- 1.29Power Finance Corporation Ltd. CRISIL - AAA 0.93Andhra Pradesh Expressway Ltd. ICRA - AAA(SO) 0.73Tata Power Co. Ltd. CRISIL - AA- 0.67Bank of India BRICKWORKS - AAA 0.67Punjab National Bank CRISIL - AAA 0.26State Bank of Indore CRISIL - AAA 0.20State Bank of Bikaner & Jaipur CRISIL - AAA 0.13ICICI Bank Ltd. CRISIL - AAA 0.10 TToottaall ooff TToopp TTeenn HHoollddiinnggss 2233..3333TToottaall GG-SSeecc,, CCrreeddiitt EExxppoossuurree 2233..4400 Cash margin 0.03Other Cash, Cash Equivalents and Net Current Assets 2.27 GGrraanndd TToottaall 110000..0000
AAvveerraaggee AAUUMM ffoorr tthhee qquuaarrtteerr eennddeedd SSeepptteemmbbeerr 3300,, 22001144 ((`̀ IInn LLaakkhhss)) 667744,,449944..2244
Portfolio – Top 10 Holdings
Banks 17.95Software 9.19Industrial Capital Goods 5.79Construction Project 4.78Petroleum Products 4.42Auto 4.36Pharmaceuticals 3.46Chemicals 3.39Consumer Non Durables 2.15Industrial Products 2.13Telecom - Services 2.07Auto Ancillaries 2.00Power 1.87
Media And Entertainment 1.72Oil 1.55Cement 1.53Consumer Durables 1.19Pesticides 0.98Finance 0.92Paper 0.75Construction 0.72Telecom - Equipment & Accessories 0.58Services 0.32Ferrous Metals 0.28Textile - Synthetic 0.20
Industry Allocation of Equity Holding (% of Net Assets)
YYiieelldd ttoo MMaattuurriittyy ** 88..4444%%
MMooddiiffiieedd DDuurraattiioonn ** 66..8899 yyeeaarrss
AAvveerraaggee MMaattuurriittyy ** 1144..2244 yyeeaarrss
PPoorrttffoolliioo TTuurrnnoovveerr RRaattiioo ((LLaasstt 11 YYeeaarr)) 4411..9966%%
YYiieelldd ttoo MMaattuurriittyy ** 88..3333%%
MMooddiiffiieedd DDuurraattiioonn ** 55..5511 yyeeaarrss
AAvveerraaggee MMaattuurriittyy ** 99..7733 yyeeaarrss
PPoorrttffoolliioo TTuurrnnoovveerr RRaattiioo ((LLaasstt 11 YYeeaarr)) 2211..4422%%
* Computed on the invested amount for debt portfolio * Computed on the invested amount for debt portfolio

CCoommppaannyy // IIssssuueerr IInndduussttrryy++ // RRaattiinngg %% ttoo NNAAVV
EEQQUUIITTYY && EEQQUUIITTYY RREELLAATTEEDDBank of Baroda Banks 1.94ICICI Bank Ltd. Banks 1.88State Bank of India Banks 1.72Solar Industries India Ltd. Chemicals 1.35Oil India Ltd. Oil 0.98Tata Consultancy Services Ltd. Software 0.94Century Textiles & Industries Ltd. Cement 0.85Zuari Agro Chemicals Ltd. Fertilisers 0.77NHPC Ltd. Power 0.73Tata Steel Ltd. Ferrous Metals 0.68TToottaall ooff TToopp TTeenn HHoollddiinnggss 1111..8844 TToottaall EEqquuiittyy && EEqquuiittyy RReellaatteedd HHoollddiinnggss 1166..9933GG-SSEECC,, CCRREEDDIITT EEXXPPOOSSUURREEGovernment Securities Sovereign 20.01State Bank of India CRISIL - AAA 10.84Rural Electrification Corporation Ltd. CRISIL - AAA 9.10Hindalco Industries Ltd. CRISIL - AA 5.40Infiniti Retail Ltd. CARE - A+ 4.92Shriram City Union Finance Ltd. CRISIL - AA- 3.97BMW India Financial Services Pvt. Ltd. CRISIL - AAA 3.62Power Finance Corporation Ltd. CRISIL - AAA 3.20Tata Steel Ltd. CARE - AA 1.93India Infoline Housing Finance Ltd. CRISIL - AA- 1.85TToottaall ooff TToopp TTeenn HHoollddiinnggss 6644..8844TToottaall GG-SSeecc,, CCrreeddiitt EExxppoossuurree 7777..5555 Cash, Cash Equivalents and Net Current Assets 5.52GGrraanndd TToottaall 110000..0000
AAvveerraaggee AAUUMM ffoorr tthhee qquuaarrtteerr eennddeedd SSeepptteemmbbeerr 3300,, 22001144 ((`̀ IInn LLaakkhhss)) 2200,,226699..2200
Portfolio – Top 10 Holdings
YYiieelldd ttoo MMaattuurriittyy ** 88..8800%%* Computed on the invested amount for debt portfolio
MMooddiiffiieedd DDuurraattiioonn ** 33..5533 yyeeaarrss
AAvveerraaggee MMaattuurriittyy ** 55..3366 yyeeaarrss
NAV (as of November 28, 2014) NAV per Unit (`)Growth Option 24.2847Monthly Dividend Option 12.2561Quarterly Dividend Option 12.7665Direct Plan - Growth Option 24.4324Direct Plan - Monthly Dividend Option 12.3368Direct Plan - Quarterly Dividend Option 12.8500
HDFC MF MIP - Short Term PlanAn open-ended income scheme. Monthly income is not
assured and is subject to availability of distributable surplus
Intouchmutually26 November 2014
CD - Certificate of Deposit; CP - Commercial Papers
Face Value per Unit: ` 10 unless otherwise specified + Industry Classification as recommended by AMFI Data is as of November 30, 2014 unless otherwise specified.
HDFC Children’s Gift FundAn open-ended balanced scheme
Savings Plan
NAV (as of November 28, 2014) NAV per Unit (`)
Savings Plan 34.3190Savings Plan - Direct Plan 34.8492
YYiieelldd ttoo MMaattuurriittyy ** 88..4411%%
MMooddiiffiieedd DDuurraattiioonn ** 44..5577 yyeeaarrss
AAvveerraaggee MMaattuurriittyy ** 77..3333 yyeeaarrss
* Computed on the invested amount for debt portfolio
CCoommppaannyy // IIssssuueerr IInndduussttrryy++ // RRaattiinngg %% ttoo NNAAVV
EEQQUUIITTYY && EEQQUUIITTYY RREELLAATTEEDDInfosys Ltd. Software 1.53ICICI Bank Ltd. Banks 1.33State Bank of India Banks 1.04Axis Bank Ltd. Banks 1.04AIA Engineering Ltd. Industrial Capital Goods 0.82Torrent Pharmaceuticals Ltd. Pharmaceuticals 0.78Banco Products (I) Ltd. Auto Ancillaries 0.77Timken India Ltd. Industrial Products 0.77Sundram Fasteners Ltd. Auto Ancillaries 0.74Sadbhav Engineering Ltd. Construction Project 0.73TToottaall ooff TToopp TTeenn HHoollddiinnggss 99..5555 TToottaall EEqquuiittyy && EEqquuiittyy RReellaatteedd HHoollddiinnggss 1199..7755GG-SSEECC,, CCRREEDDIITT EEXXPPOOSSUURREEGovernment Securities Sovereign 45.41Tata Sons Ltd. CRISIL - AAA 11.21Power Finance Corporation Ltd. CRISIL - AAA 7.29LIC Housing Finance Ltd. CRISIL - AAA 5.49Sesa Sterlite Ltd. CRISIL - AA+ 3.26State Bank of India CRISIL - AAA 2.82Bajaj Auto Ltd. CRISIL - AAA(SO) 0.01TToottaall ooff GG-SSeecc,, CCrreeddiitt EExxppoossuurree 7755..4499 Cash, Cash Equivalents and Net Current Assets 4.76GGrraanndd TToottaall 110000..0000
AAvveerraaggee AAUUMM ffoorr tthhee qquuaarrtteerr eennddeedd SSeepptteemmbbeerr 3300,, 22001144 ((`̀ IInn LLaakkhhss)) 88,,668866..7700
Portfolio – Top 10 Holdings
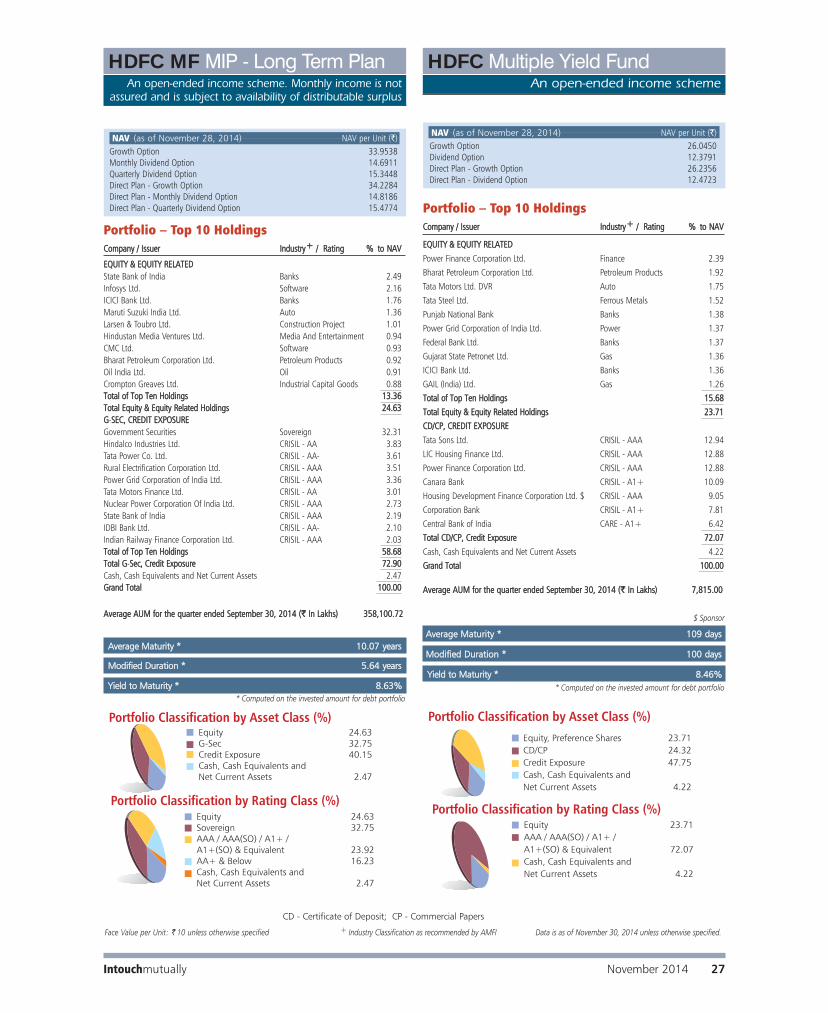
CCoommppaannyy // IIssssuueerr IInndduussttrryy++ // RRaattiinngg %% ttoo NNAAVV
EEQQUUIITTYY && EEQQUUIITTYY RREELLAATTEEDDState Bank of India Banks 2.49Infosys Ltd. Software 2.16ICICI Bank Ltd. Banks 1.76Maruti Suzuki India Ltd. Auto 1.36Larsen & Toubro Ltd. Construction Project 1.01Hindustan Media Ventures Ltd. Media And Entertainment 0.94CMC Ltd. Software 0.93Bharat Petroleum Corporation Ltd. Petroleum Products 0.92Oil India Ltd. Oil 0.91Crompton Greaves Ltd. Industrial Capital Goods 0.88TToottaall ooff TToopp TTeenn HHoollddiinnggss 1133..3366 TToottaall EEqquuiittyy && EEqquuiittyy RReellaatteedd HHoollddiinnggss 2244..6633GG-SSEECC,, CCRREEDDIITT EEXXPPOOSSUURREEGovernment Securities Sovereign 32.31Hindalco Industries Ltd. CRISIL - AA 3.83Tata Power Co. Ltd. CRISIL - AA- 3.61Rural Electrification Corporation Ltd. CRISIL - AAA 3.51Power Grid Corporation of India Ltd. CRISIL - AAA 3.36Tata Motors Finance Ltd. CRISIL - AA 3.01Nuclear Power Corporation Of India Ltd. CRISIL - AAA 2.73State Bank of India CRISIL - AAA 2.19IDBI Bank Ltd. CRISIL - AA- 2.10Indian Railway Finance Corporation Ltd. CRISIL - AAA 2.03TToottaall ooff TToopp TTeenn HHoollddiinnggss 5588..6688TToottaall GG-SSeecc,, CCrreeddiitt EExxppoossuurree 7722..9900Cash, Cash Equivalents and Net Current Assets 2.47 GGrraanndd TToottaall 110000..0000
AAvveerraaggee AAUUMM ffoorr tthhee qquuaarrtteerr eennddeedd SSeepptteemmbbeerr 3300,, 22001144 ((`̀ IInn LLaakkhhss)) 335588,,110000..7722
Portfolio – Top 10 Holdings
* Computed on the invested amount for debt portfolio
$ Sponsor
MMooddiiffiieedd DDuurraattiioonn ** 55..6644 yyeeaarrss
YYiieelldd ttoo MMaattuurriittyy ** 88..6633%%
AAvveerraaggee MMaattuurriittyy ** 1100..0077 yyeeaarrss
NAV (as of November 28, 2014) NAV per Unit (`)Growth Option 33.9538Monthly Dividend Option 14.6911Quarterly Dividend Option 15.3448Direct Plan - Growth Option 34.2284Direct Plan - Monthly Dividend Option 14.8186Direct Plan - Quarterly Dividend Option 15.4774
HDFC Multiple Yield FundAn open-ended income scheme
* Computed on the invested amount for debt portfolio
NAV (as of November 28, 2014) NAV per Unit (`)Growth Option 26.0450Dividend Option 12.3791Direct Plan - Growth Option 26.2356Direct Plan - Dividend Option 12.4723
MMooddiiffiieedd DDuurraattiioonn ** 110000 ddaayyss
AAvveerraaggee MMaattuurriittyy ** 110099 ddaayyss
HDFC MF MIP - Long Term PlanAn open-ended income scheme. Monthly income is not
assured and is subject to availability of distributable surplus
CCoommppaannyy // IIssssuueerr IInndduussttrryy++ // RRaattiinngg %% ttoo NNAAVV
EEQQUUIITTYY && EEQQUUIITTYY RREELLAATTEEDD
Power Finance Corporation Ltd. Finance 2.39
Bharat Petroleum Corporation Ltd. Petroleum Products 1.92
Tata Motors Ltd. DVR Auto 1.75
Tata Steel Ltd. Ferrous Metals 1.52
Punjab National Bank Banks 1.38
Power Grid Corporation of India Ltd. Power 1.37
Federal Bank Ltd. Banks 1.37
Gujarat State Petronet Ltd. Gas 1.36
ICICI Bank Ltd. Banks 1.36
GAIL (India) Ltd. Gas 1.26 TToottaall ooff TToopp TTeenn HHoollddiinnggss 1155..6688 TToottaall EEqquuiittyy && EEqquuiittyy RReellaatteedd HHoollddiinnggss 2233..7711
CCDD//CCPP,, CCRREEDDIITT EEXXPPOOSSUURREE
Tata Sons Ltd. CRISIL - AAA 12.94
LIC Housing Finance Ltd. CRISIL - AAA 12.88
Power Finance Corporation Ltd. CRISIL - AAA 12.88
Canara Bank CRISIL - A1+ 10.09
Housing Development Finance Corporation Ltd. $ CRISIL - AAA 9.05
Corporation Bank CRISIL - A1+ 7.81
Central Bank of India CARE - A1+ 6.42TToottaall CCDD//CCPP,, CCrreeddiitt EExxppoossuurree 7722..0077
Cash, Cash Equivalents and Net Current Assets 4.22GGrraanndd TToottaall 110000..0000
AAvveerraaggee AAUUMM ffoorr tthhee qquuaarrtteerr eennddeedd SSeepptteemmbbeerr 3300,, 22001144 ((`̀ IInn LLaakkhhss)) 77,,881155..0000
Portfolio – Top 10 Holdings
November 2014 27Intouchmutually
CD - Certificate of Deposit; CP - Commercial Papers
Face Value per Unit: ` 10 unless otherwise specified + Industry Classification as recommended by AMFI Data is as of November 30, 2014 unless otherwise specified.
YYiieelldd ttoo MMaattuurriittyy ** 88..4466%%

NAV (as of November 28, 2014) NAV per Unit (`)Growth Option 30.6184Dividend Option 11.2638Direct Plan - Growth Option 31.0774Direct Plan - Dividend Option 11.4513
HDFC Income FundAn open-ended income scheme
MMooddiiffiieedd DDuurraattiioonn ** 66..9988 yyeeaarrss
AAvveerraaggee MMaattuurriittyy ** 1122..9900 yyeeaarrss
IIssssuueerr RRaattiinngg %% ttoo NNAAVV
GG-SSEECC,, CCRREEDDIITT EEXXPPOOSSUURREE
Government Securities Sovereign 53.86
Union Bank of India CRISIL - AAA 7.17
Power Finance Corporation Ltd. CRISIL - AAA 5.37
Hindalco Industries Ltd. CRISIL - AA 2.87
State Bank of India CRISIL - AAA 2.66
Power Grid Corporation of India Ltd. CRISIL - AAA 2.65
Tata Power Co. Ltd. CRISIL - AA- 2.55
Mahanagar Telephone Nigam Ltd. CARE - AAA(SO) 2.35
NTPC Ltd. CRISIL - AAA 2.26
Food Corporation of India CRISIL - AAA(SO) 2.24
TToottaall ooff TToopp TTeenn HHoollddiinnggss 8833..9988
TToottaall GG-SSeecc,, CCrreeddiitt EExxppoossuurree 9955..4499
Cash, Cash Equivalents and Net Current Assets 4.51
GGrraanndd TToottaall 110000..0000
AAvveerraaggee AAUUMM ffoorr tthhee qquuaarrtteerr eennddeedd SSeepptteemmbbeerr 3300,, 22001144 ((`̀ IInn LLaakkhhss)) 221188,,664466..7788
Portfolio – Top 10 Holdings
* Computed on the invested amount
Intouchmutually28 November 2014
CD - Certificate of Deposit; CP - Commercial Papers
Face Value per Unit: ` 10 unless otherwise specified + Industry Classification as recommended by AMFI Data is as of November 30, 2014 unless otherwise specified.
YYiieelldd ttoo MMaattuurriittyy ** 88..4400%%
* Computed on the invested amount for debt portfolio
NAV (as of November 28, 2014) NAV per Unit (`)Growth Option 24.2740Dividend Option 12.5802Direct Plan - Growth Option 24.5538Direct Plan - Dividend Option 13.1156
HDFC Multiple Yield Fund - Plan 2005An open-ended income scheme
AAvveerraaggee MMaattuurriittyy ** 115599 ddaayyss
CCoommppaannyy // IIssssuueerr IInndduussttrryy++ // RRaattiinngg %% ttoo NNAAVV
EEQQUUIITTYY && EEQQUUIITTYY RREELLAATTEEDDTata Motors Ltd. DVR Auto 1.45State Bank of India Banks 1.39Rural Electrification Corporation Ltd. Finance 0.99Indian Bank Banks 0.91IDFC Ltd. Finance 0.89Union Bank of India Banks 0.86Carborundum Universal Ltd. Industrial Products 0.85Torrent Pharmaceuticals Ltd. Pharmaceuticals 0.82Navneet Education Ltd. Media And Entertainment 0.78Grindwell Norton Ltd. Industrial Products 0.77TToottaall ooff TToopp TTeenn HHoollddiinnggss 99..7711TToottaall EEqquuiittyy && EEqquuiittyy RReellaatteedd HHoollddiinnggss 1188..6677CCDD//CCPP,, CCRREEDDIITT EEXXPPOOSSUURREETata Sons Ltd. CRISIL - AAA 13.43Tata Motors Ltd. CARE - AA 13.38Small Industries Development Bank of India [SIDBI] CARE - AAA 13.37Housing Development Finance Corporation Ltd. $ CRISIL - AAA 9.67Power Finance Corporation Ltd. CRISIL - AAA 8.02Shriram City Union Finance Ltd. CARE - AA 3.29Sundaram BNP Paribas Home Finance Ltd. CARE - AA+ 3.24Bharat Petroleum Corporation Ltd. CRISIL - AAA 2.68Central Bank of India CARE - A1+ 2.61National Bank for Agriculture & Rural Development CRISIL - AAA 0.48TToottaall ooff TToopp TTeenn HHoollddiinnggss 7700..1177TToottaall CCDD//CCPP,, CCrreeddiitt EExxppoossuurree 7700..3300Cash, Cash Equivalents and Net Current Assets 11.03 GGrraanndd TToottaall 110000..0000
AAvveerraaggee AAUUMM ffoorr tthhee qquuaarrtteerr eennddeedd SSeepptteemmbbeerr 3300,, 22001144 ((`̀ IInn LLaakkhhss)) 1188,,554444..3322
Portfolio – Top 10 Holdings
MMooddiiffiieedd DDuurraattiioonn ** 114433 ddaayyss
YYiieelldd ttoo MMaattuurriittyy ** 88..6600%%
$ Sponsor

NAV (as of November 28, 2014) NAV per Unit (`)Growth Option 26.7355Dividend Option 10.1439Fortnightly Dividend Option 10.5938Direct Plan - Growth Option 26.9647Direct Plan - Dividend Option 10.1015Direct Plan - Fortnightly Dividend Option 10.5941
NAV (as of November 28, 2014) NAV per Unit (`)Growth Option 45.9472Quarterly Dividend Option 11.9190Half-Yearly Dividend Option 11.4881Yearly Dividend Option 12.9427Direct Plan - Growth Option 46.6698Direct Plan - Quarterly Dividend Option 12.1160Direct Plan - Half-Yearly Dividend Option 11.9745Direct Plan - Yearly Dividend Option 13.1590
AAvveerraaggee MMaattuurriittyy ** 1133..4477 yyeeaarrss
HDFC High Interest Fund - Dynamic PlanAn open-ended income scheme
HDFC High Interest Fund - Short Term PlanAn open-ended income scheme
MMooddiiffiieedd DDuurraattiioonn ** 66..9988 yyeeaarrssMMooddiiffiieedd DDuurraattiioonn ** 22..1133 yyeeaarrss
AAvveerraaggee MMaattuurriittyy ** 22..9933 yyeeaarrss
IIssssuueerr RRaattiinngg %% ttoo NNAAVV
GG-SSEECC,, CCRREEDDIITT EEXXPPOOSSUURREEGovernment Securities Sovereign 69.26Power Finance Corporation Ltd. CRISIL - AAA 6.09State Government of Gujarat Sovereign 3.40Mahanagar Telephone Nigam Ltd. CARE - AAA(SO) 2.90State Government of Maharashtra Sovereign 2.84Rural Electrification Corporation Ltd. CRISIL - AAA 2.83Hindalco Industries Ltd. CRISIL - AA 2.71Power Grid Corporation of India Ltd. CRISIL - AAA 2.25Food Corporation of India CRISIL - AAA(SO) 1.17Steel Authority of India Ltd. CARE - AAA 1.11
TToottaall ooff TToopp TTeenn HHoollddiinnggss 9944..5566 TToottaall GG-SSeecc,, CCrreeddiitt EExxppoossuurree 9955..7755 Cash, Cash Equivalents and Net Current Assets 4.25 GGrraanndd TToottaall 110000..0000
AAvveerraaggee AAUUMM ffoorr tthhee qquuaarrtteerr eennddeedd SSeepptteemmbbeerr 3300,, 22001144 ((`̀ IInn LLaakkhhss)) 8833,,118833..5577
Portfolio – Top 10 Holdings IIssssuueerr RRaattiinngg %% ttoo NNAAVV
GG-SSEECC,, CCDD//CCPP,, CCRREEDDIITT EEXXPPOOSSUURREE
Government Securities Sovereign 10.48
Tube Investments of India Ltd. CRISIL - AA 5.39
Rural Electrification Corporation Ltd. CRISIL - AAA 4.93
Power Finance Corporation Ltd. CRISIL - AAA 4.69
Sesa Sterlite Ltd. CRISIL - AA+ 4.21
Power Grid Corporation of India Ltd. CRISIL - AAA 3.62
BMW India Financial Services Pvt. Ltd. CRISIL - AAA 3.36
Cholamandalam Investment and Finance Co. Ltd. ICRA - AA 3.33
ICICI Bank Ltd. CARE - A1+ 3.10
Volkswagen Finance Private Limited FITCH - AAA 2.90TToottaall ooff TToopp TTeenn HHoollddiinnggss 4466..0011 TToottaall GG-SSeecc,, CCDD//CCPP,, CCrreeddiitt EExxppoossuurree 8866..4499
Cash, Cash Equivalents and Net Current Assets 13.51 GGrraanndd TToottaall 110000..0000
AAvveerraaggee AAUUMM ffoorr tthhee qquuaarrtteerr eennddeedd SSeepptteemmbbeerr 3300,, 22001144 ((`̀ IInn LLaakkhhss)) 115500,,559955..3399
Portfolio – Top 10 Holdings
* Computed on the invested amount
Total outstanding position (as at November 30, 2014) in Derivative Instruments(Interest Rate Swap) (Gross Notional) ` 500 lakhs.
* Computed on the invested amount
Intouchmutually November 2014 29
CD - Certificate of Deposit; CP - Commercial Papers
Face Value per Unit: ` 10 unless otherwise specified Data is as of November 30, 2014 unless otherwise specified.
YYiieelldd ttoo MMaattuurriittyy ** 88..2288%% YYiieelldd ttoo MMaattuurriittyy ** 88..7766%%

Intouchmutually30 November 2014
Portfolio – Top 10 HoldingsIIssssuueerr RRaattiinngg %% ttoo NNAAVV
HDFC Short Term Opportunities FundAn open-ended income scheme
$ Sponsor
AAvveerraaggee MMaattuurriittyy ** 11..6644 yyeeaarrss
MMooddiiffiieedd DDuurraattiioonn ** 11..3355 yyeeaarrss
NAV (as of November 28, 2014) NAV per Unit (`)
Growth Option 14.7963Monthly Dividend Option 10.1013Direct Plan - Growth Option 14.8299Direct Plan - Monthly Dividend Option 10.1615
GG-SSEECC,, CCDD//CCPP,, CCRREEDDIITT EEXXPPOOSSUURREE
Rural Electrification Corporation Ltd. CRISIL - AAA 13.18
Power Finance Corporation Ltd. CRISIL - AAA 11.22
Housing Development Finance Corporation Ltd. $ CRISIL - AAA 9.05
LIC Housing Finance Ltd. CARE - AAA / CRISIL - AAA 8.29
Steel Authority of India Ltd. CARE - AAA 5.24
Bank of Baroda CRISIL - A1+ 4.29
Shriram Transport Finance Co. Ltd. CARE - AA+ / CRISIL - AA 4.04
Petronet LNG Ltd. CRISIL - AA+ 3.00
Tata Motors Finance Ltd. CRISIL - AA 2.98
Power Grid Corporation of India Ltd. CRISIL - AAA 2.95
TToottaall ooff TToopp TTeenn HHoollddiinnggss 6644..2244
TToottaall GG-SSeecc,, CCDD//CCPP,, CCrreeddiitt EExxppoossuurree 9944..2255
Cash, Cash Equivalents and Net Current Assets 5.75
GGrraanndd TToottaall 110000..0000
AAvveerraaggee AAUUMM ffoorr tthhee qquuaarrtteerr eennddeedd SSeepptteemmbbeerr 3300,, 22001144 ((`̀ IInn LLaakkhhss)) 227722,,992222..5544
CD - Certificate of Deposit; CP - Commercial Papers
* Computed on the invested amount
Face Value per Unit: ` 10 unless otherwise specified Data is as of November 30, 2014 unless otherwise specified.
YYiieelldd ttoo MMaattuurriittyy ** 88..6644%%
NAV (as of November 28, 2014) NAV per Unit (`)Growth Option 26.1973Dividend Option 10.1321Monthly Dividend Option 10.3273Direct Plan - Growth Option 26.3149Direct Plan - Dividend Option 10.0239Direct Plan - Monthly Dividend Option 10.3274
HDFC Short Term PlanAn open-ended income scheme
MMooddiiffiieedd DDuurraattiioonn ** 11..6600 yyeeaarrss
AAvveerraaggee MMaattuurriittyy ** 11..9999 yyeeaarrss
Portfolio – Top 10 HoldingsIIssssuueerr RRaattiinngg %% ttoo NNAAVV
CCDD//CCPP,, CCRREEDDIITT EEXXPPOOSSUURREEPetronet LNG Ltd. CRISIL - AA+ 4.94Aditya Birla Retail Ltd. CRISIL - A- 4.91Adani Ports and Special Economic Zone Ltd. ICRA - A1+, AA- 4.63Sesa Sterlite Ltd. CRISIL - AA+ 4.48Indiabulls Housing Finance Ltd. CARE - AA+ 4.29Samvardhana Motherson International Ltd. (Secured with shares of Motherson Sumi Systems Ltd.) BWR - A+(SO) 3.78Prime Publishing Private Ltd. (Secured with shares of ZEE Entertainment Enterprise Ltd.) Unrated 3.55Aarti Industries Ltd. CRISIL - A+ 3.47Prism Cement Ltd. FITCH - A- / ICRA - A- 3.43Bank of India CRISIL - A1+ 3.12TToottaall ooff TToopp TTeenn HHoollddiinnggss 4400..6600 TToottaall CCDD//CCPP,, CCrreeddiitt EExxppoossuurree 8866..6644 Cash, Cash Equivalents and Net Current Assets 13.36 GGrraanndd TToottaall 110000..0000
AAvveerraaggee AAUUMM ffoorr tthhee qquuaarrtteerr eennddeedd SSeepptteemmbbeerr 3300,, 22001144 ((`̀ IInn LLaakkhhss)) 220011,,889911..8833
* Computed on the invested amount
YYiieelldd ttoo MMaattuurriittyy ** 99..6666%%
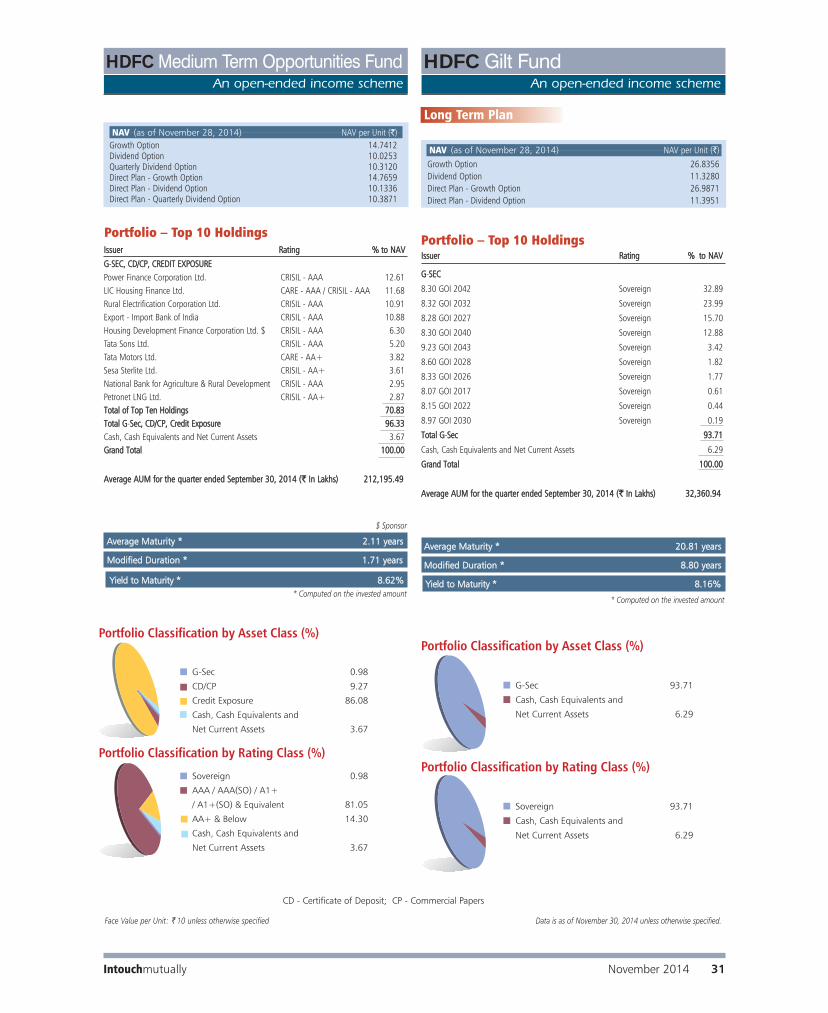
Long Term Plan
MMooddiiffiieedd DDuurraattiioonn ** 88..8800 yyeeaarrss
AAvveerraaggee MMaattuurriittyy ** 2200..8811 yyeeaarrss
IIssssuueerr RRaattiinngg %% ttoo NNAAVV
GG-SSEECC
8.30 GOI 2042 Sovereign 32.89
8.32 GOI 2032 Sovereign 23.99
8.28 GOI 2027 Sovereign 15.70
8.30 GOI 2040 Sovereign 12.88
9.23 GOI 2043 Sovereign 3.42
8.60 GOI 2028 Sovereign 1.82
8.33 GOI 2026 Sovereign 1.77
8.07 GOI 2017 Sovereign 0.61
8.15 GOI 2022 Sovereign 0.44
8.97 GOI 2030 Sovereign 0.19
TToottaall GG-SSeecc 9933..7711
Cash, Cash Equivalents and Net Current Assets 6.29
GGrraanndd TToottaall 110000..0000
AAvveerraaggee AAUUMM ffoorr tthhee qquuaarrtteerr eennddeedd SSeepptteemmbbeerr 3300,, 22001144 ((`̀ IInn LLaakkhhss)) 3322,,336600..9944
Portfolio – Top 10 Holdings
Face Value per Unit: ` 10 unless otherwise specified Data is as of November 30, 2014 unless otherwise specified.
Intouchmutually November 2014 31
An open-ended income scheme
HDFC Medium Term Opportunities FundAn open-ended income scheme
HDFC Gilt Fund
* Computed on the invested amount
$ Sponsor
AAvveerraaggee MMaattuurriittyy ** 22..1111 yyeeaarrss
MMooddiiffiieedd DDuurraattiioonn ** 11..7711 yyeeaarrss
Portfolio – Top 10 HoldingsIIssssuueerr RRaattiinngg %% ttoo NNAAVV
NAV (as of November 28, 2014) NAV per Unit (`)Growth Option 14.7412Dividend Option 10.0253Quarterly Dividend Option 10.3120Direct Plan - Growth Option 14.7659Direct Plan - Dividend Option 10.1336Direct Plan - Quarterly Dividend Option 10.3871
NAV (as of November 28, 2014) NAV per Unit (`)
Growth Option 26.8356Dividend Option 11.3280Direct Plan - Growth Option 26.9871Direct Plan - Dividend Option 11.3951
GG-SSEECC,, CCDD//CCPP,, CCRREEDDIITT EEXXPPOOSSUURREEPower Finance Corporation Ltd. CRISIL - AAA 12.61LIC Housing Finance Ltd. CARE - AAA / CRISIL - AAA 11.68Rural Electrification Corporation Ltd. CRISIL - AAA 10.91Export - Import Bank of India CRISIL - AAA 10.88Housing Development Finance Corporation Ltd. $ CRISIL - AAA 6.30Tata Sons Ltd. CRISIL - AAA 5.20Tata Motors Ltd. CARE - AA+ 3.82Sesa Sterlite Ltd. CRISIL - AA+ 3.61National Bank for Agriculture & Rural Development CRISIL - AAA 2.95Petronet LNG Ltd. CRISIL - AA+ 2.87TToottaall ooff TToopp TTeenn HHoollddiinnggss 7700..8833TToottaall GG-SSeecc,, CCDD//CCPP,, CCrreeddiitt EExxppoossuurree 9966..3333Cash, Cash Equivalents and Net Current Assets 3.67 GGrraanndd TToottaall 110000..0000
AAvveerraaggee AAUUMM ffoorr tthhee qquuaarrtteerr eennddeedd SSeepptteemmbbeerr 3300,, 22001144 ((`̀ IInn LLaakkhhss)) 221122,,119955..4499
* Computed on the invested amount
YYiieelldd ttoo MMaattuurriittyy ** 88..6622%% YYiieelldd ttoo MMaattuurriittyy ** 88..1166%%
CD - Certificate of Deposit; CP - Commercial Papers

MMooddiiffiieedd DDuurraattiioonn ** 115500 ddaayyss
YYiieelldd ttoo MMaattuurriittyy ** 88..6699%%
Short Term Plan
TT-BBIILLLLSS,, CCDD//CCPP,, CCRREEDDIITT EEXXPPOOSSUURREEGovernment Securities Sovereign 9.89Canara Bank CRISIL - A1+ 6.05Housing Development Finance Corporation Ltd. $ CRISIL - AAA 5.34Ranbaxy Laboratories Ltd. CARE - AA / ICRA - A1+ 4.29L&T Fincorp Ltd. CARE - AA+ 4.19Adani Ports and Special Economic Zone Ltd. ICRA - A1+, AA- 3.22ICICI Bank Ltd. CARE - A1+ 3.14Cholamandalam Investment and Finance Co. Ltd. ICRA - A1+, AA 2.92Magma Fincorp Ltd. CARE - AA 2.52Daimler Fin Ser (I) Pvt Ltd. FITCH - A1+ 2.43TToottaall ooff TToopp TTeenn HHoollddiinnggss 4433..9999TToottaall TT-BBiillllss,, CCDD//CCPP,, CCrreeddiitt EExxppoossuurree 8899..7722Cash, Cash Equivalents and Net Current Assets 10.28GGrraanndd TToottaall 110000..0000
AAvveerraaggee AAUUMM ffoorr tthhee qquuaarrtteerr eennddeedd SSeepptteemmbbeerr 3300,, 22001144 ((`̀ IInn LLaakkhhss)) 550088,,222233..2222
Portfolio – Top 10 HoldingsIIssssuueerr RRaattiinngg %% ttoo NNAAVV
CCDD//CCPP
Punjab & Sind Bank ICRA - A1+ 16.16
Central Bank of India CARE - A1+ 15.38
UCO Bank CRISIL - A1+ 13.43
Vijaya Bank CARE - A1+ 11.27
Andhra Bank FITCH - A1+ 7.44
Punjab National Bank FITCH - A1+ 7.44
Axis Bank Ltd. CRISIL - A1+ 4.73
Indusind Bank Ltd. CRISIL - A1+ 4.61
Canara Bank CRISIL - A1+ 3.96
Dena Bank CRISIL - A1+ 3.72
TToottaall ooff TToopp TTeenn HHoollddiinnggss 8888..1144
TToottaall CCDD//CCPP 9999..9988
Cash, Cash Equivalents and Net Current Assets 0.02
GGrraanndd TToottaall 110000..0000
AAvveerraaggee AAUUMM ffoorr tthhee qquuaarrtteerr eennddeedd SSeepptteemmbbeerr 3300,, 22001144 ((`̀ IInn LLaakkhhss)) 119922,,221155..2255
Portfolio – Top 10 HoldingsIIssssuueerr RRaattiinngg %% ttoo NNAAVV
HDFC Floating Rate Income FundAn open-ended income scheme
HDFC Floating Rate Income FundAn open-ended income scheme
Long Term Plan
MMooddiiffiieedd DDuurraattiioonn ** 110011 ddaayyss
YYiieelldd ttoo MMaattuurriittyy ** 88..3399%%
AAvveerraaggee MMaattuurriittyy ** 116699 ddaayyss
AAvveerraaggee MMaattuurriittyy ** 110099 ddaayyss
NAV (as of November 28, 2014) NAV per Unit (`)RReettaaiill OOppttiioonnGrowth Option 22.7049Daily Dividend Reinvestment Option 10.0809Weekly Dividend Option 10.1456Monthly Dividend Option 10.1544WWhhoolleessaallee OOppttiioonnGrowth Option 23.2487Daily Dividend Reinvestment Option 10.0809Weekly Dividend Option 10.1461Monthly Dividend Option 10.1547Direct Plan - Growth Option 23.2715Direct Plan - Daily Dividend Reinvestment Option 10.0809Direct Plan - Weekly Dividend Option 10.1461Direct Plan - Monthly Dividend Option 10.1548
NAV (as of November 28, 2014) NAV per Unit (`)Growth Option 23.6668Weekly Dividend Reinvestment Option 10.2404Direct Plan - Growth Option 23.6922Direct Plan - Weekly Dividend Reinvestment Option 10.2405
CD - Certificate of Deposit; CP - Commercial Papers
* Computed on the invested amount
* Computed on the invested amount
Face Value per Unit: ` 10 unless otherwise specified Data is as of November 30, 2014 unless otherwise specified.
$ Sponsor
Intouchmutually32 November 2014

Savings PlanAn open-ended high liquidity income scheme
Portfolio – Top 10 HoldingsIIssssuueerr RRaattiinngg %% ttoo NNAAVV
HDFC Liquid FundAn open-ended liquid income scheme
HDFC Cash Management Fund
* Computed on the invested amount
* Computed on the invested amount
AAvveerraaggee MMaattuurriittyy ** 2277 ddaayyss
AAvveerraaggee MMaattuurriittyy ** 3311 ddaayyss
MMooddiiffiieedd DDuurraattiioonn ** 2299 ddaayyss
MMooddiiffiieedd DDuurraattiioonn ** 2255 ddaayyss
Portfolio – Top 10 HoldingsIIssssuueerr RRaattiinngg %% ttoo NNAAVV
NAV (as of November 30, 2014) NAV per Unit (`)Growth Option 28.3761Daily Dividend Reinvestment Option 10.6364Weekly Dividend Option 10.6295Direct Plan - Growth Option 28.4057Direct Plan - Daily Dividend Reinvestment Option 10.6364Direct Plan - Weekly Dividend Option 10.6295
NAV (as of November 30, 2014) NAV per Unit (`)
HHDDFFCC LLiiqquuiidd FFuunnddGrowth Option 26.8141Daily Dividend Reinvestment Option 10.1982Weekly Dividend Option 10.3247Monthly Dividend Option 10.2772Direct Plan - Growth Option 26.8452Direct Plan - Daily Dividend Reinvestment Option 10.1982Direct Plan - Weekly Dividend Option 10.3247Direct Plan - Monthly Dividend Option 10.2773HHDDFFCC LLiiqquuiidd FFuunndd - PPrreemmiiuumm PPllaannGrowth Option 27.2642Daily Dividend Reinvestment Option 12.2598 TT-BBIILLLLSS,, BBRRDDSS,, CCDD//CCPP,, CCRREEDDIITT EEXXPPOOSSUURREE
Government Securities Sovereign 19.30
Canara Bank CRISIL - A1+ 4.79
Axis Bank Ltd. CRISIL - A1+ / BRDS 4.69
National Bank for Agriculture & Rural Development CRISIL - A1+ 4.55
L&T Finance Ltd. CARE - A1+ 3.19
Sundaram Finance Ltd. ICRA - A1+, AA+ 2.96
Oriental Bank of Commerce CRISIL - A1+ 2.93
Sesa Sterlite Ltd. CRISIL - A1+ 2.92
Union Bank of India CRISIL - A1+ 2.57
Steel Authority of India Ltd. CARE - A1+ 2.14
TToottaall ooff TToopp TTeenn HHoollddiinnggss 5500..0044
TToottaall TT-BBiillllss,, BBRRDDSS,, CCDD//CCPP,, CCrreeddiitt EExxppoossuurree 8888..3399
Cash, Cash Equivalents and Net Current Assets 11.61
GGrraanndd TToottaall 110000..0000
AAvveerraaggee AAUUMM ffoorr tthhee qquuaarrtteerr eennddeedd SSeepptteemmbbeerr 3300,, 22001144 ((`̀ IInn LLaakkhhss)) 772200,,664477..6677
TT-BBIILLLLSS,, BBRRDDSS,, CCDD//CCPP,, CCRREEDDIITT EEXXPPOOSSUURREE
Government Securities Sovereign 17.40
Punjab & Sind Bank ICRA - A1+ 3.64
Canara Bank CRISIL - A1+ 2.92
Larsen & Toubro Ltd. CARE - A1+ / CRISIL - A1+ 2.78
Tata Capital Financial Services Ltd. ICRA - A1+ 2.21
Bharat Aluminium Co. Ltd. CRISIL - A1+ 2.21
Housing Development Finance Corporation Ltd. $ CRISIL - AAA 2.21
Axis Bank Ltd. CRISIL - A1+ / BRDS 2.05
Sundaram Finance Ltd. CRISIL - A1+ / ICRA - A1+ 2.05
Indusind Bank Ltd. CRISIL - A1+ 2.04TToottaall ooff TToopp TTeenn HHoollddiinnggss 3399..5511 TToottaall TT-BBiillllss,, BBRRDDSS,, CCDD//CCPP,, CCrreeddiitt EExxppoossuurree 8877..8855
Cash, Cash Equivalents and Net Current Assets 12.15 GGrraanndd TToottaall 110000..0000
AAvveerraaggee AAUUMM ffoorr tthhee qquuaarrtteerr eennddeedd SSeepptteemmbbeerr 3300,, 22001144 ((`̀ IInn LLaakkhhss)) 11,,887799,,112277..4488
BRDS - Bills Rediscounting (not rated); CD - Certificate of Deposit; CP - Commercial Papers
Face Value per Unit: ` 10 unless otherwise specified Data is as of November 30, 2014 unless otherwise specified.
YYiieelldd ttoo MMaattuurriittyy ** 88..4499%%
YYiieelldd ttoo MMaattuurriittyy ** 88..4422%%
$ Sponsor
Intouchmutually November 2014 33

Portfolio – Top 10 Holdings
AAvveerraaggee MMaattuurriittyy ** 33..9977 yyeeaarrss
MMooddiiffiieedd DDuurraattiioonn ** 22..8811 yyeeaarrss
HDFC Cash Management Fund HDFC Corporate Debt Opportunities Fund
NNoottee ffoorr AAllll AAffoorreessaaiidd OOppeenn-EEnnddeedd SScchheemmeess ((aass aatt NNoovveemmbbeerr 3300,, 22001144))i) Total NPAs provided for and its percentage to NAV : Nilii) Investment in ADR/GDR/Foreign Securities :iii) Total outstanding exposure in derivative instruments (Gross Notional)
a) Equity : NilHDFC Top 200 Fund (Notional Value) `̀ 3,347.40 lakhs
Total `̀ 33,,334477..4400 llaakkhhss
b) Debt : Interest Rates Swaps / Forward Rate Agreement :HDFC High Interest Fund - Dynamic Plan (Interest Rates Swaps) `̀ 500.00 lakhs
Total `̀ 550000..0000 llaakkhhss
Treasury Advantage PlanAn open-ended income scheme An open-ended income scheme
* Computed on the invested amount
* Computed on the invested amount
AAvveerraaggee MMaattuurriittyy ** 221155 ddaayyss
MMooddiiffiieedd DDuurraattiioonn ** 118866 ddaayyss
IIssssuueerr RRaattiinngg %% ttoo NNAAVV
NAV (as of November 28, 2014) NAV per Unit (`)RReettaaiill OOppttiioonnGrowth Option 28.7428Daily Dividend Reinvestment Option 10.0315Weekly Dividend Option 10.0722Monthly Dividend Option 10.0597Direct Plan - Growth Option 29.1219Direct Plan - Daily Dividend Reinvestment Option 10.0315Direct Plan - Weekly Dividend Option 10.0780Direct Plan - Monthly Dividend Option 10.1532WWhhoolleessaallee OOppttiioonnGrowth Option 29.6955Daily Dividend Reinvestment Option 10.0315Weekly Dividend Option 10.0729Monthly Dividend Option 10.0603
NAV (as of November 28, 2014) NAV per Unit (`)Growth Option 10.8941Dividend Option 10.0308Half-yearly Dividend Option 10.3995Direct Plan - Growth Option 10.9347Direct Plan - Half-yearly Dividend Option 10.4114
TT-BBIILLLLSS,, CCDD//CCPP,, CCRREEDDIITT EEXXPPOOSSUURREEGovernment Securities Sovereign 8.68Canara Bank CRISIL - A1+ 7.85Housing Development Finance Corporation Ltd. $ CRISIL - AAA 4.19Tata Capital Financial Services Ltd. CARE - AA+ / CRISIL - AA+
/ ICRA - A1+, AA+ 3.38Ranbaxy Laboratories Ltd. ICRA - A1+ 3.25Corporation Bank CRISIL - A1+ 3.13LIC Housing Finance Ltd. CARE - AAA / CRISIL - AAA 3.09Union Bank of India CRISIL - A1+ 3.06Adani Ports and Special Economic Zone Ltd. ICRA - A1+, AA- 2.97ICICI Bank Ltd. CARE - A1+ 2.87 TToottaall ooff TToopp TTeenn HHoollddiinnggss 4422..4477 TToottaall TT-BBiillllss,, BBRRDDSS,, CCDD//CCPP,, CCrreeddiitt EExxppoossuurree 9922..1166 Cash, Cash Equivalents and Net Current Assets 7.84 GGrraanndd TToottaall 110000..0000
AAvveerraaggee AAUUMM ffoorr tthhee qquuaarrtteerr eennddeedd SSeepptteemmbbeerr 3300,, 22001144 ((`̀ IInn LLaakkhhss)) 995511,,884400..7766
Portfolio – Top 10 HoldingsIIssssuueerr RRaattiinngg %% ttoo NNAAVVCCRREEDDIITT EEXXPPOOSSUURREEIDBI Bank Ltd. CRISIL - AA- 6.26Shriram Transport Finance Co. Ltd. CARE - AA+ / CRISIL - AA 4.80Samvardhana Motherson International Ltd. (Secured with shares of Motherson Sumi Systems Ltd.) BWR - A+(SO) 4.26Aditya Birla Retail Ltd. CRISIL - A- 4.16Power Finance Corporation Ltd. CRISIL - AAA 4.01Sesa Sterlite Ltd. CRISIL - AA+ 3.94Peninsula Land Ltd. ICRA - A 3.85Prism Cement Ltd. FITCH - A- / ICRA - A- 3.71Sadbhav Engineering Ltd. CARE - A+ 3.65Aarti Industries Ltd. CRISIL - A+ 3.58TToottaall ooff TToopp TTeenn HHoollddiinnggss 4422..2222 TToottaall CCrreeddiitt EExxppoossuurree 9933..0088 Cash, Cash Equivalents and Net Current Assets 6.92 GGrraanndd TToottaall 110000..0000
AAvveerraaggee AAUUMM ffoorr tthhee qquuaarrtteerr eennddeedd SSeepptteemmbbeerr 3300,, 22001144 ((`̀ IInn LLaakkhhss)) 224422,,999955..2244
CD - Certificate of Deposit; CP - Commercial Papers
Face Value per Unit: ` 10 unless otherwise specified Data is as of November 30, 2014 unless otherwise specified.
YYiieelldd ttoo MMaattuurriittyy ** 88..6655%%
YYiieelldd ttoo MMaattuurriittyy ** 1100..3344%%
$ Sponsor
Intouchmutually34 November 2014

Benefits of Systematic Investment Plan (SIP) - SIP Performance of Select Schemes - Fund Manager-wise
PPaasstt ppeerrffoorrmmaannccee mmaayy oorr mmaayy nnoott bbee ssuussttaaiinneedd iinn tthhee ffuuttuurree.. # S&P BSE 200##S&P BSE SENSEX Inception Date: September 17, 2004
SSIIPP IInnvveessttmmeennttss SSiinnccee 1100 yyeeaarr 55 YYeeaarr 33 YYeeaarr 11 YYeeaarrIInncceeppttiioonn SSIIPP SSIIPP SSIIPP SSIIPP SSIIPP
Total Amount Invested (` ‘000) 121.00 120.00 60.00 36.00 12.0Mkt Value as on Sep 30, 14 (` ‘000) 267.21 261.62 89.44 53.78 15.99 RReettuurrnnss ((AAnnnnuuaalliisseedd)) ((%%)) 1155..0011 1144..9900 1155..9988 2277..9933 6677..1111Benchmark Returns (Annualised) (%) # 1122..7766 1122..6666 1133..7777 2222..6655 4411..9999Addl. Benchmark Ret. (Annualised) (%) ## 1133..0099 1122..9988 1144..0044 2222..2266 3377..1133
HDFC CORE & SATELLITE FUND - GROWTH OPTION
PPaasstt ppeerrffoorrmmaannccee mmaayy oorr mmaayy nnoott bbee ssuussttaaiinneedd iinn tthhee ffuuttuurree.. # CNX 500 Index ## CNX Nifty Index Inception Date: January 01, 1995
SSIIPP IInnvveessttmmeennttss SSiinnccee 1155 yyeeaarr 1100 yyeeaarr 55 YYeeaarr 33 YYeeaarr 11 YYeeaarrIInncceeppttiioonn SSIIPP SSIIPP SSIIPP SSIIPP SSIIPP SSIIPP
Total Amount Invested (` ‘000) 237.00 180.00 120.00 60.00 36.00 12.00Mkt Value as on Sep 30, 14 (` ‘000) 4,777.10 1,473.07 331.95 98.19 56.78 16.08RReettuurrnnss ((AAnnnnuuaalliisseedd)) ((%%)) 2255..6655 2244..8888 1199..3322 1199..8800 3322..0000 6688..8855Benchmark Returns (Annualised) (%) # 1144..3344 1155..7744 1122..4477 1144..1166 2233..5566 4455..1144Addl. Benchmark Ret. (Annualised) (%) ## 1133..5522 1155..0077 1122..8844 1133..8888 2211..8855 3388..0066
HDFC EQUITY FUND - GROWTH OPTION
PPaasstt ppeerrffoorrmmaannccee mmaayy oorr mmaayy nnoott bbee ssuussttaaiinneedd iinn tthhee ffuuttuurree.. # S&P BSE 200##S&P BSE SENSEX Inception Date: October 11, 1996
SSIIPP IInnvveessttmmeennttss SSiinnccee 1155 yyeeaarr 1100 yyeeaarr 55 YYeeaarr 33 YYeeaarr 11 YYeeaarrIInncceeppttiioonn SSIIPP SSIIPP SSIIPP SSIIPP SSIIPP SSIIPP
Total Amount Invested (` ‘000) 216.00 180.00 120.00 60.00 36.00 12.00Mkt Value as on Sep 30, 14 (` ‘000) $$ 2,477.90 1,370.86 312.57 93.04 53.62 15.35RReettuurrnnss ((AAnnnnuuaalliisseedd)) ((%%)) $$$$ 2233..4400 2244..0077 1188..2211 1177..6600 2277..7700 5555..6699Benchmark Returns (Annualised) (%) # 1155..1188 1155..9911 1122..6666 1133..7777 2222..6655 4411..9999Addl. Benchmark Ret. (Annualised) (%) ## 1144..3388 1155..5544 1122..9988 1144..0044 2222..2266 3377..1133
HDFC TOP 200 FUND - GROWTH OPTION
PPaasstt ppeerrffoorrmmaannccee mmaayy oorr mmaayy nnoott bbee ssuussttaaiinneedd iinn tthhee ffuuttuurree.. # CNX 500 Index ##CNX Nifty Index Inception Date: March 10, 2008TThhee SScchheemmee iiss ccoo-mmaannaaggeedd bbyy PPrraasshhaanntt JJaaiinn aanndd SSrriinniivvaass RRaaoo RRaavvuurrii
SSIIPP IInnvveessttmmeennttss SSiinnccee IInncceeppttiioonn SSIIPP 55 YYeeaarr SSIIPP 33 YYeeaarr SSIIPP 11 YYeeaarr SSIIPP
Total Amount Invested (` ‘000) 79.00 60.00 36.00 12.00Mkt Value as on Sep 30, 14 (` ‘000) 125.44 85.74 54.78 17,10 RReettuurrnnss ((AAnnnnuuaalliisseedd)) ((%%)) 1133..8866 1144..2266 2299..3300 8877..5544Benchmark Returns (Annualised) (%) # 1144..1122 1144..1166 2233..5566 4455..1144Addl. Benchmark Ret. (Annualised)(%) ## 1133..7766 1133..8888 2211..8855 3388..0066
HDFC INFRASTRUCTURE FUND - GROWTH OPTION
PPaasstt ppeerrffoorrmmaannccee mmaayy oorr mmaayy nnoott bbee ssuussttaaiinneedd iinn tthhee ffuuttuurree.. N.A. Not Available# CRISIL Balanced Fund Index ## CNX Nifty Index Inception Date: February 01, 1994
SSIIPP IInnvveessttmmeennttss SSiinnccee 1155 yyeeaarr 1100 yyeeaarr 55 YYeeaarr 33 YYeeaarr 11 YYeeaarrIInncceeppttiioonn SSIIPP SSIIPP SSIIPP SSIIPP SSIIPP SSIIPP
Total Amount Invested (` ‘000) 248.00 180.00 120.00 60.00 36.00 12.00Mkt Value as on Sep 30, 14 (` ‘000) $$ 3,857.12 1,223.31 324.31 97.73 54.81 15.80RReettuurrnnss ((AAnnnnuuaalliisseedd)) ((%%)) $$$$ 2222..4422 2222..7799 1188..8899 1199..6611 2299..3355 6633..8811Benchmark Returns (Annualised) (%) # NN..AA.. NN..AA.. 1111..2233 1111..9999 1177..1188 2288..4411Addl. Benchmark Ret. (Annualised) (%) ##^1133..0033 1155..0077 1122..8844 1133..8888 2211..8855 3388..0066
HDFC PRUDENCE FUND - GROWTH OPTION
PPaasstt ppeerrffoorrmmaannccee mmaayy oorr mmaayy nnoott bbee ssuussttaaiinneedd iinn tthhee ffuuttuurree.. # CNX 500 Index##CNX Nifty Index Inception Date: March 31, 1996
SSIIPP IInnvveessttmmeennttss SSiinnccee 1155 yyeeaarr 1100 yyeeaarr 55 YYeeaarr 33 YYeeaarr 11 YYeeaarrIInncceeppttiioonn SSIIPP SSIIPP SSIIPP SSIIPP SSIIPP SSIIPP
Total Amount Invested (` ‘000) 222.00 180.00 120.00 60.00 36.00 12.00Mkt Value as on Sep 30, 14 (` ‘000) $$ 4,650.91 1,380.62 299.88 97.11 56.30 15.92RReettuurrnnss ((AAnnnnuuaalliisseedd)) ((%%)) $$$$ 2277..9944 2244..1155 1177..4444 1199..3355 3311..3366 6655..9944Benchmark Returns (Annualised) (%) # 1144..9922 1155..7744 1122..4477 1144..1166 2233..5566 4455..1144Addl. Benchmark Ret. (Annualised) (%) ## 1144..0000 1155..0077 1122..8844 1133..8888 2211..8855 3388..0066
HDFC TAXSAVER - GROWTH OPTION
PPaasstt ppeerrffoorrmmaannccee mmaayy oorr mmaayy nnoott bbee ssuussttaaiinneedd iinn tthhee ffuuttuurree.. # CRISIL MIP Blended Index## CRISIL 10 year Gilt Index Inception Date: December 26, 2003TThhee SScchheemmee iiss ccoo-mmaannaaggeedd bbyy PPrraasshhaanntt JJaaiinn ((EEqquuiittiieess)) aanndd SShhoobbhhiitt MMeehhrroottrraa ((DDeebbtt))
SSIIPP IInnvveessttmmeennttss SSiinnccee 1100 yyeeaarr 55 YYeeaarr 33 YYeeaarr 11 YYeeaarrIInncceeppttiioonn SSIIPP SSIIPP SSIIPP SSIIPP SSIIPP
Total Amount Invested (` ‘000) 130.00 120.00 60.00 36.00 12.00Mkt Value as on Sep 30, 14 (` ‘000) 246.66 215.46 79.53 44.45 13.53 RReettuurrnnss ((AAnnnnuuaalliisseedd)) ((%%)) 1111..3311 1111..2277 1111..2222 1144..2211 2244..4499Benchmark Returns (Annualised) (%) # 88..0055 88..1122 88..7777 1100..2244 1155..4455Addl. Benchmark Ret. (Annualised) (%) ##^ 55..3311 55..4455 55..1111 55..1122 88..6633
HDFC MF MIP - LONG TERM PLAN - GROWTH OPTION
PPaasstt ppeerrffoorrmmaannccee mmaayy oorr mmaayy nnoott bbee ssuussttaaiinneedd iinn tthhee ffuuttuurree.. # CNX 500 Index ## CNX Nifty Index Inception Date: April 06, 2005
SSIIPP IInnvveessttmmeennttss SSiinnccee IInncceeppttiioonn SSIIPP 55 YYeeaarr SSIIPP 33 YYeeaarr SSIIPP 11 YYeeaarr SSIIPP
Total Amount Invested (` ‘000) 114.00 60.00 36.00 12.00Mkt Value as on Sep 30, 14 (` ‘000) 228.57 89.31 53.47 15.96RReettuurrnnss ((AAnnnnuuaalliisseedd)) ((%%)) 1144..0088 1155..9922 2277..5500 6666..6633Benchmark Returns (Annualised) (%) # 1122..0088 1144..1166 2233..5566 4455..1144Addl. Benchmark Ret. (Annualised) (%) ## 1122..3399 1133..8888 2211..8855 3388..0066
HDFC PREMIER MULTI-CAP FUND - GROWTH OPTION
PPaasstt ppeerrffoorrmmaannccee mmaayy oorr mmaayy nnoott bbee ssuussttaaiinneedd iinn tthhee ffuuttuurree.. Inception Date: July 17, 2002# S&P BSE SENSEX (Total Returns Index) ## CNX Nifty Index
SSIIPP IInnvveessttmmeennttss SSiinnccee 1100 yyeeaarr 55 YYeeaarr 33 YYeeaarr 11 YYeeaarrIInncceeppttiioonn SSIIPP SSIIPP SSIIPP SSIIPP SSIIPP
Total Amount Invested (` ‘000) 147.00 120.00 60.00 36.00 12.00Mkt Value as on Sep 30, 14 (` ‘000) 383.50 226.52 86.59 50.44 14.35RReettuurrnnss ((AAnnnnuuaalliisseedd)) ((%%)) 1144..6677 1122..2211 1144..6677 2233..2222 3388..3311Benchmark Returns (Annualised) (%) # 1177..7755 1144..2244 1155..1155 2244..3311 3399..7788Addl. Benchmark Ret. (Annualised) (%) ## 1155..5511 1122..8844 1133..8888 2211..8855 3388..0066
HDFC INDEX FUND - SENSEX PLAN
PPaasstt ppeerrffoorrmmaannccee mmaayy oorr mmaayy nnoott bbee ssuussttaaiinneedd iinn tthhee ffuuttuurree.. Inception Date: July 17, 2002# CNX Nifty Index (Total Returns Index) ## S&P BSE SENSEX
SSIIPP IInnvveessttmmeennttss SSiinnccee 1100 yyeeaarr 55 YYeeaarr 33 YYeeaarr 11 YYeeaarrIInncceeppttiioonn SSIIPP SSIIPP SSIIPP SSIIPP SSIIPP
Total Amount Invested (` ‘000) 147.00 120.00 60.00 36.00 12.00Mkt Value as on Sep 30, 14 (` ‘000) 371.69 222.34 85.71 50.06 14.42RReettuurrnnss ((AAnnnnuuaalliisseedd)) ((%%)) 1144..2211 1111..8866 1144..2255 2222..6666 3399..5511Benchmark Returns (Annualised) (%) # 1177..1133 1144..2244 1155..2255 2233..4411 4400..0099Addl. Benchmark Ret. (Annualised) (%) ## 1155..9988 1122..9988 1144..0044 2222..2266 3377..1133
HDFC INDEX FUND - NIFTY PLAN
PPaasstt ppeerrffoorrmmaannccee mmaayy oorr mmaayy nnoott bbee ssuussttaaiinneedd iinn tthhee ffuuttuurree.. Inception Date: July 17, 2002# S&P BSE SENSEX (Total Returns Index) ##CNX Nifty Index
SSIIPP IInnvveessttmmeennttss SSiinnccee 1100 yyeeaarr 55 YYeeaarr 33 YYeeaarr 11 YYeeaarrIInncceeppttiioonn SSIIPP SSIIPP SSIIPP SSIIPP SSIIPP
Total Amount Invested (` ‘000) 147.00 120.00 60.00 36.00 12.00Mkt Value as on Sep 30, 14 (` ‘000) 497.68 268.35 89.13 50.96 14.69 RReettuurrnnss ((AAnnnnuuaalliisseedd)) ((%%)) 1188..4488 1155..3388 1155..8844 2233..9955 4444..1177Benchmark Returns (Annualised) (%) # 1177..7755 1144..2244 1155..1155 2244..3311 3399..7788Addl. Benchmark Ret. (Annualised)(%) ## 1155..5511 1122..8844 1133..8888 2211..8855 3388..0066
HDFC INDEX FUND - SENSEX PLUS PLAN
The Fund offers flexible and convenient Systematic Investment Plan (SIP) facility. To illustrate the advantages of SIP investments, this is how your investments wouldhave grown if you had invested say ` 1,000 systematically on the first Business Dayof every month over a period of time.
PRASHANT JAIN
VINAY KULKARNI
PPaasstt ppeerrffoorrmmaannccee mmaayy oorr mmaayy nnoott bbee ssuussttaaiinneedd iinn tthhee ffuuttuurree.. ## CNX Nifty Index# S&P BSE SENSEX Inception Date: February 18, 1994
SSIIPP IInnvveessttmmeennttss SSiinnccee IInncceeppttiioonn SSIIPP 55 YYeeaarr SSIIPP 33 YYeeaarr SSIIPP 11 YYeeaarr SSIIPP
Total Amount Invested (` ‘000) 77.00 60.00 36.00 12.00Mkt Value as on Sep 30, 14 (` ‘000) 118.66 82.31 48.57 13.99RReettuurrnnss ((AAnnnnuuaalliisseedd)) ((%%)) 1133..3311 1122..6611 2200..4477 3322..2288Benchmark Returns (Annualised) (%) # 1144..0099 1133..8888 2211..8855 3388..0066Addl. Benchmark Ret. (Annualised) (%) ## 1144..2266 1144..0044 2222..2266 3377..1133
HDFC LARGE CAP FUND - GROWTH OPTION
PPaasstt ppeerrffoorrmmaannccee mmaayy oorr mmaayy nnoott bbee ssuussttaaiinneedd iinn tthhee ffuuttuurree.. # CRISIL MIP Blended Index## CRISIL 10 year Gilt Index Inception Date: December 26, 2003TThhee SScchheemmee iiss ccoo-mmaannaaggeedd bbyy VViinnaayy KKuullkkaarrnnii ((EEqquuiittiieess)) aanndd SShhoobbhhiitt MMeehhrroottrraa ((DDeebbtt))
SSIIPP IInnvveessttmmeennttss SSiinnccee 1100 yyeeaarr 55 YYeeaarr 33 YYeeaarr 11 YYeeaarrIInncceeppttiioonn SSIIPP SSIIPP SSIIPP SSIIPP SSII
Total Amount Invested (` ‘000) 130.00 120.00 60.00 36.00 12.00Mkt Value as on Sep 30, 14 (` ‘000) 209.92 187.17 76.82 43.16 13.17 RReettuurrnnss ((AAnnnnuuaalliisseedd)) ((%%)) 88..5533 88..6611 99..8833 1122..1155 1188..7711Benchmark Returns (Annualised) (%) # 88..0055 88..1122 88..7777 1100..2244 1155..4455Addl. Benchmark Ret. (Annualised)(%) ##^ 55..3311 55..4455 55..1111 55..1122 88..6633
HDFC MF MIP - SHORT TERM PLAN - GROWTH OPTION
Intouchmutually November 2014 35

Benefits of Systematic Investment Plan (SIP) - SIP Performance of Select Schemes - Fund Manager-wise
PPaasstt ppeerrffoorrmmaannccee mmaayy oorr mmaayy nnoott bbee ssuussttaaiinneedd iinn tthhee ffuuttuurree.. #CRISIL MIP Blended Index## CRISIL 1 year T-Bill Index Inception Date: September 17, 2004TThhee SScchheemmee iiss ccoo-mmaannaaggeedd bbyy VViinnaayy KKuullkkaarrnnii ((EEqquuiittiieess)) aanndd AAnniill BBaammbboollii ((DDeebbtt))
SSIIPP IInnvveessttmmeennttss SSiinnccee 1100 yyeeaarr 55 YYeeaarr 33 YYeeaarr 11 YYeeaarrIInncceeppttiioonn SSIIPP SSIIPP SSIIPP SSIIPP SSIIPP
Total Amount Invested (` ‘000) 121.00 120.00 60.00 36.00 12.00Mkt Value as on Sep 30, 14 (` ‘000) 204.92 202.40 78.43 43.12 13.06 RReettuurrnnss ((AAnnnnuuaalliisseedd)) ((%%)) 1100..0088 1100..0099 1100..6666 1122..1100 1166..8822Benchmark Returns (Annualised) (%) # 88..1122 88..1122 88..7777 1100..2244 1155..4455Addl. Benchmark Ret. (Annualised)(%) ##^ 66..0099 66..1100 66..8877 77..2266 88..2233
HDFC MULTIPLE YIELD FUND - GROWTH OPTION
PPaasstt ppeerrffoorrmmaannccee mmaayy oorr mmaayy nnoott bbee ssuussttaaiinneedd iinn tthhee ffuuttuurree.. #CRISIL MIP Blended Index## CRISIL 1 year T-Bill Index Inception Date: August 17, 2005TThhee SScchheemmee iiss ccoo-mmaannaaggeedd bbyy CChhiirraagg SSeettaallvvaadd ((EEqquuiittiieess)) aanndd AAnniill BBaammbboollii ((DDeebbtt))
SSIIPP IInnvveessttmmeennttss SSiinnccee IInncceeppttiioonn SSIIPP 55 YYeeaarr SSIIPP 33 YYeeaarr SSIIPP 11 YYeeaarr SSIIPP
Total Amount Invested (` ‘000) 110.00 60.00 36.00 12.00Mkt Value as on Sep 30, 14 (` ‘000) 184.40 80.90 44.52 13.42 RReettuurrnnss ((AAnnnnuuaalliisseedd)) ((%%)) 1100..9922 1111..9911 1144..3311 2222..7766Benchmark Returns (Annualised) (%) # 88..1122 88..7777 1100..2244 1155..4455Addl. Benchmark Ret. (Annualised)(%) ##^ 66..1177 66..8877 77..2266 88..2233
HDFC MULTIPLE YIELD FUND - PLAN 2005 - GROWTH OPTION
PPaasstt ppeerrffoorrmmaannccee mmaayy oorr mmaayy nnoott bbee ssuussttaaiinneedd iinn tthhee ffuuttuurree.. # CNX Smallcap Index ## CNX Nifty Index Inception Date: April 3, 2008
SSIIPP IInnvveessttmmeennttss SSiinnccee IInncceeppttiioonn SSIIPP 55 YYeeaarr SSIIPP 33 YYeeaarr SSIIPP 11 YYeeaarr SSIIPP
Total Amount Invested (` ‘000) 78.00 60.00 36.00 12.00Mkt Value as on Sep 30, 14 (` ‘000) 147.14 94.59 55.06 15.50 RReettuurrnnss ((AAnnnnuuaalliisseedd)) ((%%)) 1199..3300 1188..2277 2299..6699 5588..4422Benchmark Returns (Annualised) (%) # 1133..9955 1133..9966 2266..3399 6655..0011Addl. Benchmark Ret. (Annualised)(%) ## 1133..9922 1133..8888 2211..8855 3388..0066
HDFC SMALL AND MID CAP FUND - GROWTH OPTION
PPaasstt ppeerrffoorrmmaannccee mmaayy oorr mmaayy nnoott bbee ssuussttaaiinneedd iinn tthhee ffuuttuurree.. # S&P BSE SENSEX## CNX Nifty Index Inception Date: January 02, 2001
SSIIPP IInnvveessttmmeennttss SSiinnccee 1100 yyeeaarr 55 YYeeaarr 33 YYeeaarr 11 YYeeaarrIInncceeppttiioonn SSIIPP SSIIPP SSIIPP SSIIPP SSIIPP
Total Amount Invested (` ‘000) 165.00 120.00 60.00 36.00 12.00Mkt Value as on Sep 30, 14 (` ‘000) 1,023.23 284.80 98.51 55.81 15.46 RReettuurrnnss ((AAnnnnuuaalliisseedd)) ((%%)) 2233..9944 1166..4488 1199..9944 3300..7700 5577..6688Benchmark Returns (Annualised) (%) # 1166..3311 1122..9988 1144..0044 2222..2266 3377..1133Addl. Benchmark Ret. (Annualised)(%) ## 1155..7766 1122..8844 1133..8888 2211..8855 3388..0066
HDFC LONG TERM ADVANTAGE FUND - GROWTH OPTION
PPaasstt ppeerrffoorrmmaannccee mmaayy oorr mmaayy nnoott bbee ssuussttaaiinneedd iinn tthhee ffuuttuurree.. # CNX 500 Index ## CNX Nifty Index Inception Date: February 01, 1994TThhee SScchheemmee iiss ccoo-mmaannaaggeedd bbyy CChhiirraagg SSeettaallvvaadd && MMiitteenn LLaatthhiiaa
SSIIPP IInnvveessttmmeennttss SSiinnccee 1155 yyeeaarr 1100 yyeeaarr 55 YYeeaarr 33 YYeeaarr 11 YYeeaarrIInncceeppttiioonn SSIIPP SSIIPP SSIIPP SSIIPP SSIIPP SSIIPP
Total Amount Invested (` ‘000) 248.00 180.00 120.00 60.00 36.00 12.00Mkt Value as on Sep 30, 14 (` ‘000) 2,645.32 1,164.37 299.34 97.95 55.90 15.54 RReettuurrnnss ((AAnnnnuuaalliisseedd)) ((%%)) 1199..5544 2222..2233 1177..4411 1199..7700 3300..8833 5599..0077Benchmark Returns (Annualised) (%) # 1133..7744 1155..7744 1122..4477 1144..1166 2233..5566 4455..1144Addl. Benchmark Ret.(Annualised) (%) ## 1133..0033 1155..0077 1122..8844 1133..8888 2211..8855 3388..0066
HDFC CAPITAL BUILDER FUND - GROWTH OPTION
PPaasstt ppeerrffoorrmmaannccee mmaayy oorr mmaayy nnoott bbee ssuussttaaiinneedd iinn tthhee ffuuttuurree.. N.A. Not Available # CRISIL Balanced Fund Index ## CNX Nifty Index Inception Date: September 11, 2000
SSIIPP IInnvveessttmmeennttss SSiinnccee 1100 yyeeaarr 55 YYeeaarr 33 YYeeaarr 11 YYeeaarrIInncceeppttiioonn SSIIPP SSIIPP SSIIPP SSIIPP SSIIPP
Total Amount Invested (` ‘000) 169.00 120.00 60.00 36.00 12.00Mkt Value as on Sep 30, 14 (` ‘000) 734.89 309.86 100.20 54.71 15.44 RReettuurrnnss ((AAnnnnuuaalliisseedd)) ((%%)) 1188..9988 1188..0055 2200..6644 2299..2200 5577..3300Benchmark Returns (Annualised) (%) # NN..AA.. 1111..2233 1111..9999 1177..1188 2288..4411Addl. Benchmark Ret. (Annualised)(%) ##^ 1155..6633 1122..8844 1133..8888 2211..8855 3388..0066
HDFC BALANCED FUND - GROWTH OPTION
PPaasstt ppeerrffoorrmmaannccee mmaayy oorr mmaayy nnoott bbee ssuussttaaiinneedd iinn tthhee ffuuttuurree.. N.A. Not Available# CRISIL Balanced Fund Index ## CNX Nifty Index Inception Date: March 02, 2001
SSIIPP IInnvveessttmmeennttss SSiinnccee 1100 yyeeaarr 55 YYeeaarr 33 YYeeaarr 11 YYeeaarrIInncceeppttiioonn SSIIPP SSIIPP SSIIPP SSIIPP SSIIPP
Total Amount Invested (` ‘000) 163.00 120.00 60.00 36.00 12.00Mkt Value as on Sep 30, 14 (` ‘000) $ 653.83 310.361 102.94 54.52 15.04RReettuurrnnss ((AAnnnnuuaalliisseedd)) ((%%)) $$ 1188..7711 1188..0088 2211..7755 2288..9955 5500..3311Benchmark Returns (Annualised) (%) # NN..AA.. 1111..2233 1111..9999 1177..1188 2288..4411Addl. Benchmark Ret. (Annualised)(%) ##^ 1155..8844 1122..8844 1133..8888 2211..8855 3388..0066
HDFC CHILDREN’S GIFT FUND - INVESTMENT PLAN
PPaasstt ppeerrffoorrmmaannccee mmaayy oorr mmaayy nnoott bbee ssuussttaaiinneedd iinn tthhee ffuuttuurree.. # CRISIL MIP Blended Index## CRISIL 10 year Gilt Index N.A. Not Available Inception Date: March 02, 2001
SSIIPP IInnvveessttmmeennttss SSiinnccee 1100 yyeeaarr 55 YYeeaarr 33 YYeeaarr 11 YYeeaarrIInncceeppttiioonn SSIIPP SSIIPP SSIIPP SSIIPP SSIIPP
Total Amount Invested (` ‘000) 163.00 120.00 60.00 36.00 12.00Mkt Value as on Sep 30, 14 (` ‘000) $ 359.26 212.25 81.33 44.59 13.56RReettuurrnnss ((AAnnnnuuaalliisseedd)) ((%%)) $$ 1100..9933 1100..9999 1122..1133 1144..4422 2244..9999Benchmark Returns (Annualised) (%) # NN..AA.. 88..1122 88..7777 1100..2244 1155..4455Addl. Benchmark Ret. (Annualised)(%) ##^ NN..AA.. 55..4455 55..1111 55..1122 88..6633
HDFC CHILDREN’S GIFT FUND - SAVINGS PLAN
PPaasstt ppeerrffoorrmmaannccee mmaayy oorr mmaayy nnoott bbee ssuussttaaiinneedd iinn tthhee ffuuttuurree.. # CNX Midcap Index ## CNX Nifty Index Inception Date: June 25, 2007
SSIIPP IInnvveessttmmeennttss SSiinnccee IInncceeppttiioonn SSIIPP 55 YYeeaarr SSIIPP 33 YYeeaarr SSIIPP 11 YYeeaarr SSIIPP
Total Amount Invested (` ‘000) 88.00 60.00 36.00 12.00Mkt Value as on Sep 30, 14 (` ‘000) 221.78 117.71 63.56 17.09 RReettuurrnnss ((AAnnnnuuaalliisseedd)) ((%%)) 2244..6699 2277..3344 4400..7700 8877..3388Benchmark Returns (Annualised) (%) # 1144..0077 1155..1144 2266..7755 6644..1111Addl. Benchmark Ret. (Annualised)(%) ## 1122..3311 1133..8888 2211..8855 3388..0066
HDFC MID-CAP OPPORTUNITIES FUND - GROWTH OPTION
PPaasstt ppeerrffoorrmmaannccee mmaayy oorr mmaayy nnoott bbee ssuussttaaiinneedd iinn tthhee ffuuttuurree.. # S&P BSE SENSEX ## CNX Nifty Index Inception Date: September 11, 2000
SSIIPP IInnvveessttmmeennttss SSiinnccee 1100 yyeeaarr 55 YYeeaarr 33 YYeeaarr 11 YYeeaarrIInncceeppttiioonn SSIIPP SSIIPP SSIIPP SSIIPP SSIIPP
Total Amount Invested (` ‘000) 169.00 120.00 60.00 36.00 12.00Mkt Value as on Sep 30, 14 (` ‘000) 916.32 277.48 87.34 50.29 15.07RReettuurrnnss ((AAnnnnuuaalliisseedd)) ((%%)) 2211..6688 1166..0000 1155..0022 2222..9999 5500..8866Benchmark Returns (Annualised) (%) # 1166..1166 1122..9988 1144..0044 2222..2266 3377..1133Addl. Benchmark Ret. (Annualised) (%) ## 1155..6633 1122..8844 1133..8888 2211..8855 3388..0066
HDFC GROWTH FUND - GROWTH OPTION
PPaasstt ppeerrffoorrmmaannccee mmaayy oorr mmaayy nnoott bbee ssuussttaaiinneedd iinn tthhee ffuuttuurree.. # CNX 500 Index ## CNX Nifty Index Inception Date: March 10, 2008TThhee SScchheemmee iiss ccoo-mmaannaaggeedd bbyy PPrraasshhaanntt JJaaiinn aanndd SSrriinniivvaass RRaaoo RRaavvuurrii
SSIIPP IInnvveessttmmeennttss SSiinnccee IInncceeppttiioonn SSIIPP 55 YYeeaarr SSIIPP 33 YYeeaarr SSIIPP 11 YYeeaarr SSIIPP
Total Amount Invested (` ‘000) 79.00 60.00 36.00 12.00Mkt Value as on Sep 30, 14 (` ‘000) 125.44 85.74 54.78 17,10 RReettuurrnnss ((AAnnnnuuaalliisseedd)) ((%%)) 1133..8866 1144..2266 2299..3300 8877..5544Benchmark Returns (Annualised) (%) # 1144..1122 1144..1166 2233..5566 4455..1144Addl. Benchmark Ret. (Annualised)(%) ## 1133..7766 1133..8888 2211..8855 3388..0066
HDFC INFRASTRUCTURE FUND - GROWTH OPTION
$ Adjusted for Bonus units declared under the Scheme. ^ Scheme performance may not strictly be comparable with that of its Additional Benchmark in view of hybrid nature of the scheme$$ All dividends declared prior to the splitting of the Scheme into Dividend & Growth Options are assumed to be reinvested in the units of the Scheme at the then prevailing NAV (ex-dividend NAV).Load is not taken into consideration for computation of performance.IInnvveessttoorrss aarree aaddvviisseedd ttoo rreeffeerr ttoo tthhee ppeerrffoorrmmaannccee ssuummmmaarryy ttaabbllee oonn ppaaggee 3377-7700 DDiissccllaaiimmeerr:: The above investment simulation is for illustrative purposes only and should not be construed as a promise on minimum returns and safeguard of capital. The AMC / Mutual Fund is not guaranteeing or promising or forecasting any returns. SIP does not assure a profit or guarantee protection against a loss in a declining market.PPlleeaassee rreeffeerr SSIIPP EEnnrroollmmeenntt FFoorrmm oorr ccoonnttaacctt nneeaarreesstt IISSCC ffoorr SSIIPP LLooaadd SSttrruuccttuurree aanndd ootthheerr ddeettaaiillss..
CHIRAG SETALVAD
PPaasstt ppeerrffoorrmmaannccee mmaayy oorr mmaayy nnoott bbee ssuussttaaiinneedd iinn tthhee ffuuttuurree.. # CNX 500 Index ## CNX Nifty Index Inception Date: February 01, 1994TThhee SScchheemmee iiss ccoo-mmaannaaggeedd bbyy CChhiirraagg SSeettaallvvaadd && MMiitteenn LLaatthhiiaa
SSIIPP IInnvveessttmmeennttss SSiinnccee 1155 yyeeaarr 1100 yyeeaarr 55 YYeeaarr 33 YYeeaarr 11 YYeeaarrIInncceeppttiioonn SSIIPP SSIIPP SSIIPP SSIIPP SSIIPP SSIIPP
Total Amount Invested (` ‘000) 248.00 180.00 120.00 60.00 36.00 12.00Mkt Value as on Sep 30, 14 (` ‘000) 2,645.32 1,164.37 299.34 97.95 55.90 15.54 RReettuurrnnss ((AAnnnnuuaalliisseedd)) ((%%)) 1199..5544 2222..2233 1177..4411 1199..7700 3300..8833 5599..0077Benchmark Returns (Annualised) (%) # 1133..7744 1155..7744 1122..4477 1144..1166 2233..5566 4455..1144Addl. Benchmark Ret.(Annualised) (%) ## 1133..0033 1155..0077 1122..8844 1133..8888 2211..8855 3388..0066
HDFC CAPITAL BUILDER FUND - GROWTH OPTION
MITEN LATHIA
SRINIVAS RAO RAVURI
Intouchmutually36 November 2014
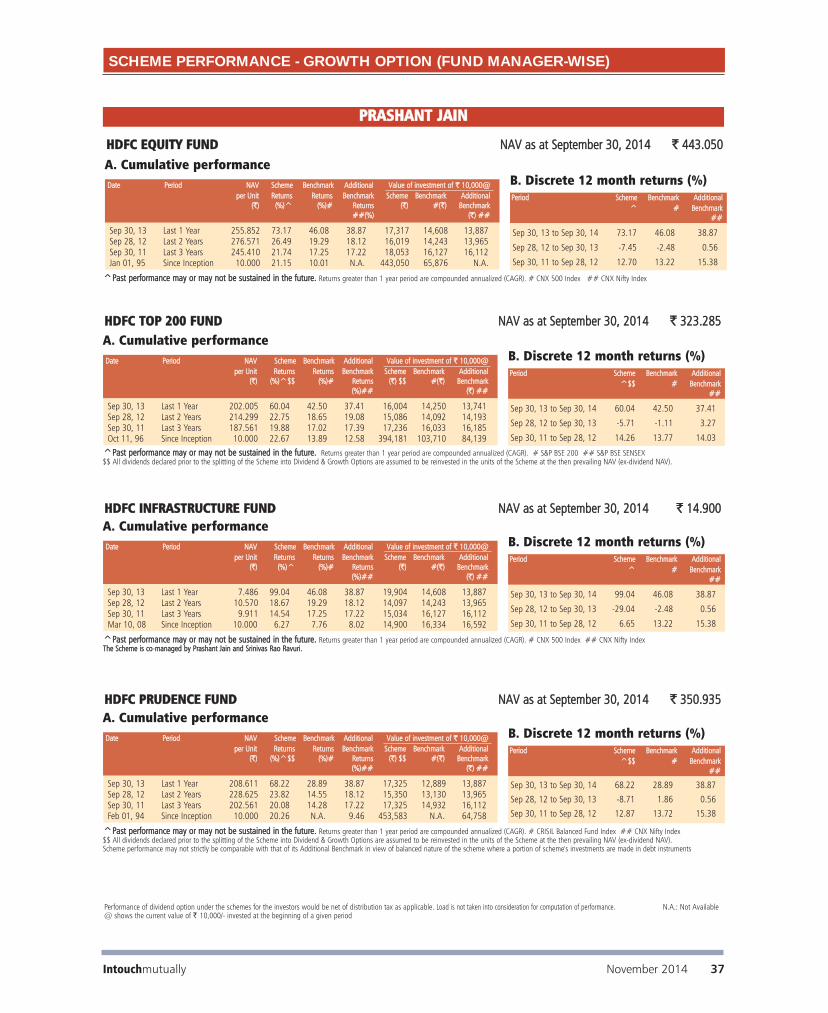
SCHEME PERFORMANCE - GROWTH OPTION (FUND MANAGER-WISE)
Date Period NAV Scheme Benchmark Additional Value of investment of ` 10,000@ per Unit Returns Returns Benchmark Scheme Benchmark Additional
(`) (%)^ (%)# Returns (`) #(`) Benchmark##(%) (`) ##
^̂PPaasstt ppeerrffoorrmmaannccee mmaayy oorr mmaayy nnoott bbee ssuussttaaiinneedd iinn tthhee ffuuttuurree.. Returns greater than 1 year period are compounded annualized (CAGR). # CNX 500 Index ## CNX Nifty Index
A. Cumulative performance
Sep 30, 13 Last 1 Year 255.852 73.17 46.08 38.87 17,317 14,608 13,887Sep 28, 12 Last 2 Years 276.571 26.49 19.29 18.12 16,019 14,243 13,965Sep 30, 11 Last 3 Years 245.410 21.74 17.25 17.22 18,053 16,127 16,112Jan 01, 95 Since Inception 10.000 21.15 10.01 N.A. 443,050 65,876 N.A.
Period Scheme Benchmark Additional ^ # Benchmark
##
B. Discrete 12 month returns (%)
Sep 30, 13 to Sep 30, 14 73.17 46.08 38.87
Sep 28, 12 to Sep 30, 13 -7.45 -2.48 0.56
Sep 30, 11 to Sep 28, 12 12.70 13.22 15.38
HDFC EQUITY FUND NAV as at September 30, 2014 ` 443.050
Date Period NAV Scheme Benchmark Additional Value of investment of ` 10,000@ per Unit Returns Returns Benchmark Scheme Benchmark Additional
(`) (%)^$$ (%)# Returns (`) $$ #(`) Benchmark(%)## (`) ##
^̂PPaasstt ppeerrffoorrmmaannccee mmaayy oorr mmaayy nnoott bbee ssuussttaaiinneedd iinn tthhee ffuuttuurree.. Returns greater than 1 year period are compounded annualized (CAGR). # S&P BSE 200 ## S&P BSE SENSEX$$ All dividends declared prior to the splitting of the Scheme into Dividend & Growth Options are assumed to be reinvested in the units of the Scheme at the then prevailing NAV (ex-dividend NAV).
A. Cumulative performance
Sep 30, 13 Last 1 Year 202.005 60.04 42.50 37.41 16,004 14,250 13,741Sep 28, 12 Last 2 Years 214.299 22.75 18.65 19.08 15,086 14,092 14,193Sep 30, 11 Last 3 Years 187.561 19.88 17.02 17.39 17,236 16,033 16,185Oct 11, 96 Since Inception 10.000 22.67 13.89 12.58 394,181 103,710 84,139
Period Scheme Benchmark Additional ^$$ # Benchmark
##
B. Discrete 12 month returns (%)
Sep 30, 13 to Sep 30, 14 60.04 42.50 37.41
Sep 28, 12 to Sep 30, 13 -5.71 -1.11 3.27
Sep 30, 11 to Sep 28, 12 14.26 13.77 14.03
HDFC TOP 200 FUND NAV as at September 30, 2014 ` 323.285
PRASHANT JAIN
Date Period NAV Scheme Benchmark Additional Value of investment of ` 10,000@ per Unit Returns Returns Benchmark Scheme Benchmark Additional
(`) (%)^ (%)# Returns (`) #(`) Benchmark(%)## (`) ##
^̂PPaasstt ppeerrffoorrmmaannccee mmaayy oorr mmaayy nnoott bbee ssuussttaaiinneedd iinn tthhee ffuuttuurree.. Returns greater than 1 year period are compounded annualized (CAGR). # CNX 500 Index ## CNX Nifty Index The Scheme is co-mmanaged by Prashant Jain and Srinivas Rao Ravuri.
A. Cumulative performance
Sep 30, 13 Last 1 Year 7.486 99.04 46.08 38.87 19,904 14,608 13,887Sep 28, 12 Last 2 Years 10.570 18.67 19.29 18.12 14,097 14,243 13,965Sep 30, 11 Last 3 Years 9.911 14.54 17.25 17.22 15,034 16,127 16,112Mar 10, 08 Since Inception 10.000 6.27 7.76 8.02 14,900 16,334 16,592
Period Scheme Benchmark Additional ^ # Benchmark
##
B. Discrete 12 month returns (%)
Sep 30, 13 to Sep 30, 14 99.04 46.08 38.87
Sep 28, 12 to Sep 30, 13 -29.04 -2.48 0.56
Sep 30, 11 to Sep 28, 12 6.65 13.22 15.38
HDFC INFRASTRUCTURE FUND NAV as at September 30, 2014 ` 14.900
Date Period NAV Scheme Benchmark Additional Value of investment of ` 10,000@ per Unit Returns Returns Benchmark Scheme Benchmark Additional
(`) (%)^$$ (%)# Returns (`) $$ #(`) Benchmark(%)## (`) ##
^̂PPaasstt ppeerrffoorrmmaannccee mmaayy oorr mmaayy nnoott bbee ssuussttaaiinneedd iinn tthhee ffuuttuurree.. Returns greater than 1 year period are compounded annualized (CAGR). # CRISIL Balanced Fund Index ## CNX Nifty Index$$ All dividends declared prior to the splitting of the Scheme into Dividend & Growth Options are assumed to be reinvested in the units of the Scheme at the then prevailing NAV (ex-dividend NAV).Scheme performance may not strictly be comparable with that of its Additional Benchmark in view of balanced nature of the scheme where a portion of scheme's investments are made in debt instruments
A. Cumulative performance
Sep 30, 13 Last 1 Year 208.611 68.22 28.89 38.87 17,325 12,889 13,887Sep 28, 12 Last 2 Years 228.625 23.82 14.55 18.12 15,350 13,130 13,965Sep 30, 11 Last 3 Years 202.561 20.08 14.28 17.22 17,325 14,932 16,112Feb 01, 94 Since Inception 10.000 20.26 N.A. 9.46 453,583 N.A. 64,758
Period Scheme Benchmark Additional ^$$ # Benchmark
##
B. Discrete 12 month returns (%)
Sep 30, 13 to Sep 30, 14 68.22 28.89 38.87
Sep 28, 12 to Sep 30, 13 -8.71 1.86 0.56
Sep 30, 11 to Sep 28, 12 12.87 13.72 15.38
HDFC PRUDENCE FUND NAV as at September 30, 2014 ` 350.935
Performance of dividend option under the schemes for the investors would be net of distribution tax as applicable. Load is not taken into consideration for computation of performance. N.A.: Not Available@ shows the current value of ` 10,000/- invested at the beginning of a given period
Intouchmutually November 2014 37

VINAY KULKARNI
Date Period NAV Scheme Benchmark Additional Value of investment of ` 10,000@ per Unit Returns Returns Benchmark Scheme Benchmark Additional
(`) (%)^ (%)# Returns (`) (`)# Benchmark(%)## (`) ##
^̂PPaasstt ppeerrffoorrmmaannccee mmaayy oorr mmaayy nnoott bbee ssuussttaaiinneedd iinn tthhee ffuuttuurree.. Returns greater than 1 year period are compounded annualized (CAGR). # CNX 500 Index ## CNX Nifty Index
A. Cumulative performance
Sep 30, 13 Last 1 Year 23.610 72.73 46.08 38.87 17,273 14,608 13,887Sep 28, 12 Last 2 Years 27.685 21.30 19.29 18.12 14,730 14,243 13,965Sep 30, 11 Last 3 Years 26.751 15.08 17.25 17.22 15,245 16,127 16,112Apr 06, 05 Since Inception 10.000 15.96 14.28 15.26 40,781 35,505 38,490
Period Scheme Benchmark Additional ^ # Benchmark
##
B. Discrete 12 month returns (%)
Sep 30, 13 to Sep 30, 14 72.73 46.08 38.87
Sep 28, 12 to Sep 30, 13 -14.65 -2.48 0.56
Sep 30, 11 to Sep 28, 12 3.49 13.22 15.38
HDFC PREMIER MULTI-CCAP FUND NAV as at September 30, 2014 ` 40.781
Date Period NAV Scheme Benchmark Additional Value of investment of ` 10,000@ per Unit Returns Returns Benchmark Scheme Benchmark Additional
(`) (%)^ (%)# Returns (`) (`)# Benchmark(%)## (`) ##
^̂PPaasstt ppeerrffoorrmmaannccee mmaayy oorr mmaayy nnoott bbee ssuussttaaiinneedd iinn tthhee ffuuttuurree.. Returns greater than 1 year period are compounded annualized (CAGR). # S&P BSE 200 ## S&P BSE SENSEX
A. Cumulative performance
Sep 30, 13 Last 1 Year 31.995 74.88 42.50 37.41 17,488 14,250 13,741Sep 28, 12 Last 2 Years 37.734 21.71 18.65 19.08 14,828 14,092 14,193Sep 30, 11 Last 3 Years 35.832 16.00 17.02 17.39 15,615 16,033 16,185Sep 17, 04 Since Inception 10.000 18.71 16.13 16.88 55,953 44,867 47,887
Period Scheme Benchmark Additional ^ # Benchmark
##
B. Discrete 12 month returns (%)
Sep 30, 13 to Sep 30, 14 74.88 42.50 37.41
Sep 28, 12 to Sep 30, 13 -15.13 -1.11 3.27
Sep 30, 11 to Sep 28, 12 5.31 13.77 14.03
HDFC CORE & SATELLITE FUND NAV as at September 30, 2014 ` 55.953
SCHEME PERFORMANCE - GROWTH OPTION (FUND MANAGER-WISE)
Date Period NAV Scheme Benchmark Additional Value of investment of ` 10,000@ per Unit Returns Returns Benchmark Scheme Benchmark Additional
(`) (%)^ (%)# Returns (`) #(`) Benchmark(%)## (`) ##
^̂PPaasstt ppeerrffoorrmmaannccee mmaayy oorr mmaayy nnoott bbee ssuussttaaiinneedd iinn tthhee ffuuttuurree.. Returns greater than 1 year period are compounded annualized (CAGR). # CRISIL MIP Blended Index ## CRISIL 10 year Gilt IndexScheme performance may not strictly be comparable with that of its Additional Benchmark in view of hybrid nature of the scheme where a portion of scheme's investments are made in equity instruments.
The Scheme is co-mmanaged by Prashant Jain (Equities) and Shobhit Mehrotra (Debt).
A. Cumulative performance
Sep 30, 13 Last 1 Year 25.5167 26.06 15.45 6.85 12,606 11,545 10,685Sep 28, 12 Last 2 Years 25.5658 12.14 9.14 4.61 12,582 11,917 10,946Sep 30, 11 Last 3 Years 23.1615 11.55 9.55 5.74 13,888 13,154 11,825Dec 26, 03 Since Inception 10.0000 11.46 7.47 4.41 32,168 21,735 15,913
Period Scheme Benchmark Additional ^ # Benchmark
##
B. Discrete 12 month returns (%)
Sep 30, 13 to Sep 30, 14 26.06 15.45 6.85
Sep 28, 12 to Sep 30, 13 -0.19 3.20 2.43
Sep 30, 11 to Sep 28, 12 10.38 10.60 8.03
HDFC MF MIP LONG TERM PLAN NAV as at September 30, 2014 ` 32.1675
PRASHANT JAIN...CONTINUED
Performance of dividend option under the schemes for the investors would be net of distribution tax as applicable. Load is not taken into consideration for computation of performance. N.A.: Not Available@ shows the current value of ` 10,000/- invested at the beginning of a given period
Intouchmutually38 November 2014
Date Period NAV Scheme Benchmark Additional Value of investment of ` 10,000@ per Unit Returns Returns Benchmark Scheme Benchmark Additional
(`) (%)^ (%)# Returns (`) (`)# Benchmark(%)## (`) ##
^̂PPaasstt ppeerrffoorrmmaannccee mmaayy oorr mmaayy nnoott bbee ssuussttaaiinneedd iinn tthhee ffuuttuurree.. Returns greater than 1 year period are compounded annualized (CAGR). # CNX Nifty Index ## S&P BSE SENSEX
A. Cumulative performance
Sep 30, 13 Last 1 Year 63.229 33.88 38.87 37.41 13,388 13,887 13,741Sep 28, 12 Last 2 Years 61.163 17.59 18.12 19.08 13,841 13,965 14,193Sep 30, 11 Last 3 Years 53.416 16.57 17.22 17.39 15,848 16,112 16,185Feb 18, 94 Since Inception 9.4442 11.87 N.A. N.A. 101,108 N.A. N.A.
Period Scheme Benchmark Additional ^ # Benchmark
##
B. Discrete 12 month returns (%)
Sep 30, 13 to Sep 30, 14 33.88 38.87 37.41Sep 28, 12 to Sep 30, 13 3.36 0.56 3.27Sep 30, 11 to Sep 28, 12 14.50 15.38 14.03
HDFC LARGE CAP FUND NAV as at September 30, 2014 ` 84.653

Date Period NAV Scheme Benchmark Additional Value of investment of ` 10,000@ per Unit Returns Returns Benchmark Scheme Benchmark Additional
(`) (%)^$$ (%)# Returns (`) $$ (`)# Benchmark(%)## (`) ##
^̂PPaasstt ppeerrffoorrmmaannccee mmaayy oorr mmaayy nnoott bbee ssuussttaaiinneedd iinn tthhee ffuuttuurree.. Returns greater than 1 year period are compounded annualized (CAGR). # CNX 500 Index ## CNX Nifty Index$$ All dividends declared prior to the splitting of the Scheme into Dividend & Growth Options are assumed to be reinvested in the units of the Scheme at the then prevailing NAV (ex-dividend NAV).
A. Cumulative performance
Sep 30, 13 Last 1 Year 217.460 70.22 46.08 38.87 17,022 14,608 13,887Sep 28, 12 Last 2 Years 230.800 26.56 19.29 18.12 16,038 14,243 13,965Sep 30, 11 Last 3 Years 208.445 21.08 17.25 17.22 17,758 16,127 16,112Mar 31, 96 Since Inception 10.000 27.77 12.71 N.A. 933,781 91,636 N.A.
Period Scheme Benchmark Additional ^$$ # Benchmark
##
B. Discrete 12 month returns (%)
Sep 30, 13 to Sep 30, 14 70.22 46.08 38.87
Sep 28, 12 to Sep 30, 13 -5.75 -2.48 0.56
Sep 30, 11 to Sep 28, 12 10.72 13.22 15.38
HDFC TAXSAVER NAV as at September 30, 2014 ` 370.166
SCHEME PERFORMANCE - GROWTH OPTION (FUND MANAGER-WISE)
Performance of dividend option under the schemes for the investors would be net of distribution tax as applicable. Load is not taken into consideration for computation of performance. N.A.: Not Available@ shows the current value of ` 10,000/- invested at the beginning of a given period
VINAY KULKARNI...CONTINUED
Date Period NAV Scheme Benchmark Additional Value of investment of ` 10,000@ per Unit Returns Returns Benchmark Scheme Benchmark Additional
(`) (%)^ (%)# Returns (`) (`)# Benchmark(%)## (`) ##
^̂PPaasstt ppeerrffoorrmmaannccee mmaayy oorr mmaayy nnoott bbee ssuussttaaiinneedd iinn tthhee ffuuttuurree.. Returns greater than 1 year period are compounded annualized (CAGR). # CNX Nifty Index (Total Returns Index) ## S&P BSE SENSEXSince inception returns are calculated on ` 10.3260 ( allotment price)
A. Cumulative performance
Sep 30, 13 Last 1 Year 49.8393 39.89 40.51 37.41 13,989 14,051 13,741Sep 28, 12 Last 2 Years 49.3036 18.86 19.55 19.08 14,141 14,307 14,193Sep 30, 11 Last 3 Years 42.8556 17.59 18.67 17.39 16,268 16,719 16,185Jul 17, 02 Since Inception 10.3260 16.93 19.98 18.90 67,518 92,503 82,805
Period Scheme Benchmark Additional ^ # Benchmark
##
B. Discrete 12 month returns (%)
Sep 30, 13 to Sep 30, 14 39.89 40.51 37.41
Sep 28, 12 to Sep 30, 13 1.08 1.81 3.27
Sep 30, 11 to Sep 28, 12 15.05 16.86 14.03
HDFC INDEX FUND - NIFTY PLAN NAV as at September 30, 2014 ` 69.7192
Date Period NAV Scheme Benchmark Additional Value of investment of ` 10,000@ per Unit Returns Returns Benchmark Scheme Benchmark Additional
(`) (%)^ (%)# Returns (`) (`)# Benchmark(%)## (`) ##
^̂PPaasstt ppeerrffoorrmmaannccee mmaayy oorr mmaayy nnoott bbee ssuussttaaiinneedd iinn tthhee ffuuttuurree.. Returns greater than 1 year period are compounded annualized (CAGR). # S&P BSE SENSEX (Total Returns Index) ## CNX Nifty IndexSince inception returns are calculated on ` 32.1610 ( allotment price)
A. Cumulative performance
Sep 30, 13 Last 1 Year 240.4296 43.41 39.53 38.87 14,341 13,953 13,887Sep 28, 12 Last 2 Years 239.9173 19.82 20.97 18.12 14,371 14,648 13,965Sep 30, 11 Last 3 Years 206.2688 18.66 19.40 17.22 16,715 17,031 16,112Jul 17, 02 Since Inception 32.1610 21.44 20.96 18.21 107,207 102,144 77,137
Period Scheme Benchmark Additional ^ # Benchmark
##
B. Discrete 12 month returns (%)
Sep 30, 13 to Sep 30, 14 43.41 39.53 38.87
Sep 28, 12 to Sep 30, 13 0.21 4.96 0.56
Sep 30, 11 to Sep 28, 12 16.31 16.27 15.38
HDFC INDEX FUND - SENSEX PLUS PLAN NAV as at September 30, 2014 ` 344.7885
Intouchmutually November 2014 39
Date Period NAV Scheme Benchmark Additional Value of investment of ` 10,000@ per Unit Returns Returns Benchmark Scheme Benchmark Additional
(`) (%)^ (%)# Returns (`) (`)# Benchmark(%)## (`) ##
^̂PPaasstt ppeerrffoorrmmaannccee mmaayy oorr mmaayy nnoott bbee ssuussttaaiinneedd iinn tthhee ffuuttuurree.. Returns greater than 1 year period are compounded annualized (CAGR). # S&P BSE SENSEX (Total Returns Index) ## CNX Nifty IndexSince inception returns are calculated on ` 32.1610 ( allotment price)
A. Cumulative performance
Sep 30, 13 Last 1 Year 163.7001 38.07 39.53 38.87 13,807 13,953 13,887Sep 28, 12 Last 2 Years 156.9041 19.96 20.97 18.12 14,405 14,648 13,965Sep 30, 11 Last 3 Years 136.9204 18.17 19.40 17.22 16,507 17,031 16,112Jul 17, 02 Since Inception 32.1610 17.31 20.96 18.21 70,277 102,144 77,137
Period Scheme Benchmark Additional ^ # Benchmark
##
B. Discrete 12 month returns (%)
Sep 30, 13 to Sep 30, 14 38.07 39.53 38.87
Sep 28, 12 to Sep 30, 13 4.31 4.96 0.56
Sep 30, 11 to Sep 28, 12 14.60 16.27 15.38
HDFC INDEX FUND - SENSEX PLAN NAV as at September 30, 2014 ` 226.0175
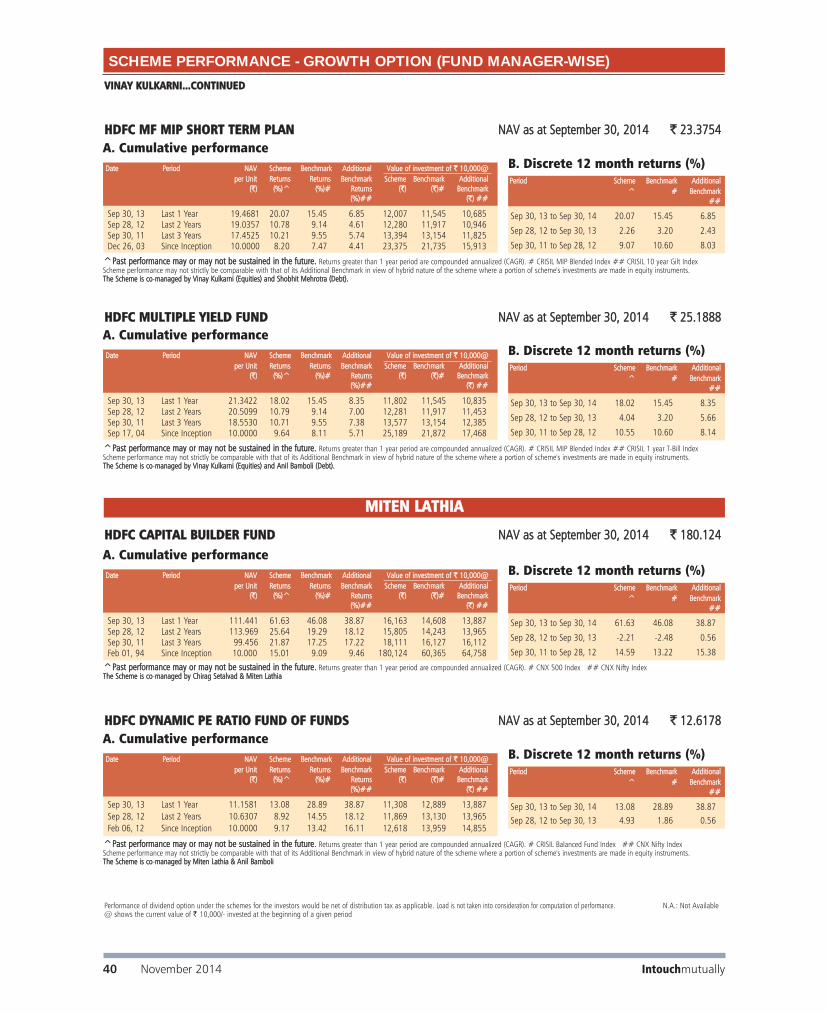
SCHEME PERFORMANCE - GROWTH OPTION (FUND MANAGER-WISE)
Performance of dividend option under the schemes for the investors would be net of distribution tax as applicable. Load is not taken into consideration for computation of performance. N.A.: Not Available@ shows the current value of ` 10,000/- invested at the beginning of a given period
Date Period NAV Scheme Benchmark Additional Value of investment of ` 10,000@ per Unit Returns Returns Benchmark Scheme Benchmark Additional
(`) (%)^ (%)# Returns (`) (`)# Benchmark(%)## (`) ##
^̂PPaasstt ppeerrffoorrmmaannccee mmaayy oorr mmaayy nnoott bbee ssuussttaaiinneedd iinn tthhee ffuuttuurree.. Returns greater than 1 year period are compounded annualized (CAGR). # CRISIL MIP Blended Index ## CRISIL 1 year T-Bill IndexScheme performance may not strictly be comparable with that of its Additional Benchmark in view of hybrid nature of the scheme where a portion of scheme's investments are made in equity instruments. The Scheme is co-mmanaged by Vinay Kulkarni (Equities) and Anil Bamboli (Debt).
A. Cumulative performance
Sep 30, 13 Last 1 Year 21.3422 18.02 15.45 8.35 11,802 11,545 10,835Sep 28, 12 Last 2 Years 20.5099 10.79 9.14 7.00 12,281 11,917 11,453Sep 30, 11 Last 3 Years 18.5530 10.71 9.55 7.38 13,577 13,154 12,385Sep 17, 04 Since Inception 10.0000 9.64 8.11 5.71 25,189 21,872 17,468
Period Scheme Benchmark Additional ^ # Benchmark
##
B. Discrete 12 month returns (%)
Sep 30, 13 to Sep 30, 14 18.02 15.45 8.35
Sep 28, 12 to Sep 30, 13 4.04 3.20 5.66
Sep 30, 11 to Sep 28, 12 10.55 10.60 8.14
HDFC MULTIPLE YIELD FUND NAV as at September 30, 2014 ` 25.1888
MITEN LATHIA
Date Period NAV Scheme Benchmark Additional Value of investment of ` 10,000@ per Unit Returns Returns Benchmark Scheme Benchmark Additional
(`) (%)^ (%)# Returns (`) (`)# Benchmark(%)## (`) ##
^̂PPaasstt ppeerrffoorrmmaannccee mmaayy oorr mmaayy nnoott bbee ssuussttaaiinneedd iinn tthhee ffuuttuurree. Returns greater than 1 year period are compounded annualized (CAGR). # CNX 500 Index ## CNX Nifty IndexThe Scheme is co-mmanaged by Chirag Setalvad & Miten Lathia
A. Cumulative performance
Sep 30, 13 Last 1 Year 111.441 61.63 46.08 38.87 16,163 14,608 13,887Sep 28, 12 Last 2 Years 113.969 25.64 19.29 18.12 15,805 14,243 13,965Sep 30, 11 Last 3 Years 99.456 21.87 17.25 17.22 18,111 16,127 16,112Feb 01, 94 Since Inception 10.000 15.01 9.09 9.46 180,124 60,365 64,758
Period Scheme Benchmark Additional ^ # Benchmark
##
B. Discrete 12 month returns (%)
Sep 30, 13 to Sep 30, 14 61.63 46.08 38.87
Sep 28, 12 to Sep 30, 13 -2.21 -2.48 0.56
Sep 30, 11 to Sep 28, 12 14.59 13.22 15.38
HDFC CAPITAL BUILDER FUND NAV as at September 30, 2014 ` 180.124
Date Period NAV Scheme Benchmark Additional Value of investment of ` 10,000@ per Unit Returns Returns Benchmark Scheme Benchmark Additional
(`) (%)^ (%)# Returns (`) (`)# Benchmark(%)## (`) ##
^̂PPaasstt ppeerrffoorrmmaannccee mmaayy oorr mmaayy nnoott bbee ssuussttaaiinneedd iinn tthhee ffuuttuurree. Returns greater than 1 year period are compounded annualized (CAGR). # CRISIL Balanced Fund Index ## CNX Nifty IndexScheme performance may not strictly be comparable with that of its Additional Benchmark in view of hybrid nature of the scheme where a portion of scheme's investments are made in equity instruments. The Scheme is co-mmanaged by Miten Lathia & Anil Bamboli
A. Cumulative performance
Sep 30, 13 Last 1 Year 11.1581 13.08 28.89 38.87 11,308 12,889 13,887Sep 28, 12 Last 2 Years 10.6307 8.92 14.55 18.12 11,869 13,130 13,965Feb 06, 12 Since Inception 10.0000 9.17 13.42 16.11 12,618 13,959 14,855
Period Scheme Benchmark Additional ^ # Benchmark
##
B. Discrete 12 month returns (%)
Sep 30, 13 to Sep 30, 14 13.08 28.89 38.87Sep 28, 12 to Sep 30, 13 4.93 1.86 0.56
HDFC DYNAMIC PE RATIO FUND OF FUNDS NAV as at September 30, 2014 ` 12.6178
VINAY KULKARNI...CONTINUED
Intouchmutually40 November 2014
Date Period NAV Scheme Benchmark Additional Value of investment of ` 10,000@ per Unit Returns Returns Benchmark Scheme Benchmark Additional
(`) (%)^ (%)# Returns (`) (`)# Benchmark(%)## (`) ##
^̂PPaasstt ppeerrffoorrmmaannccee mmaayy oorr mmaayy nnoott bbee ssuussttaaiinneedd iinn tthhee ffuuttuurree.. Returns greater than 1 year period are compounded annualized (CAGR). # CRISIL MIP Blended Index ## CRISIL 10 year Gilt IndexScheme performance may not strictly be comparable with that of its Additional Benchmark in view of hybrid nature of the scheme where a portion of scheme's investments are made in equity instruments. The Scheme is co-mmanaged by Vinay Kulkarni (Equities) and Shobhit Mehrotra (Debt).
A. Cumulative performance
Sep 30, 13 Last 1 Year 19.4681 20.07 15.45 6.85 12,007 11,545 10,685Sep 28, 12 Last 2 Years 19.0357 10.78 9.14 4.61 12,280 11,917 10,946Sep 30, 11 Last 3 Years 17.4525 10.21 9.55 5.74 13,394 13,154 11,825Dec 26, 03 Since Inception 10.0000 8.20 7.47 4.41 23,375 21,735 15,913
Period Scheme Benchmark Additional ^ # Benchmark
##
B. Discrete 12 month returns (%)
Sep 30, 13 to Sep 30, 14 20.07 15.45 6.85
Sep 28, 12 to Sep 30, 13 2.26 3.20 2.43
Sep 30, 11 to Sep 28, 12 9.07 10.60 8.03
HDFC MF MIP SHORT TERM PLAN NAV as at September 30, 2014 ` 23.3754
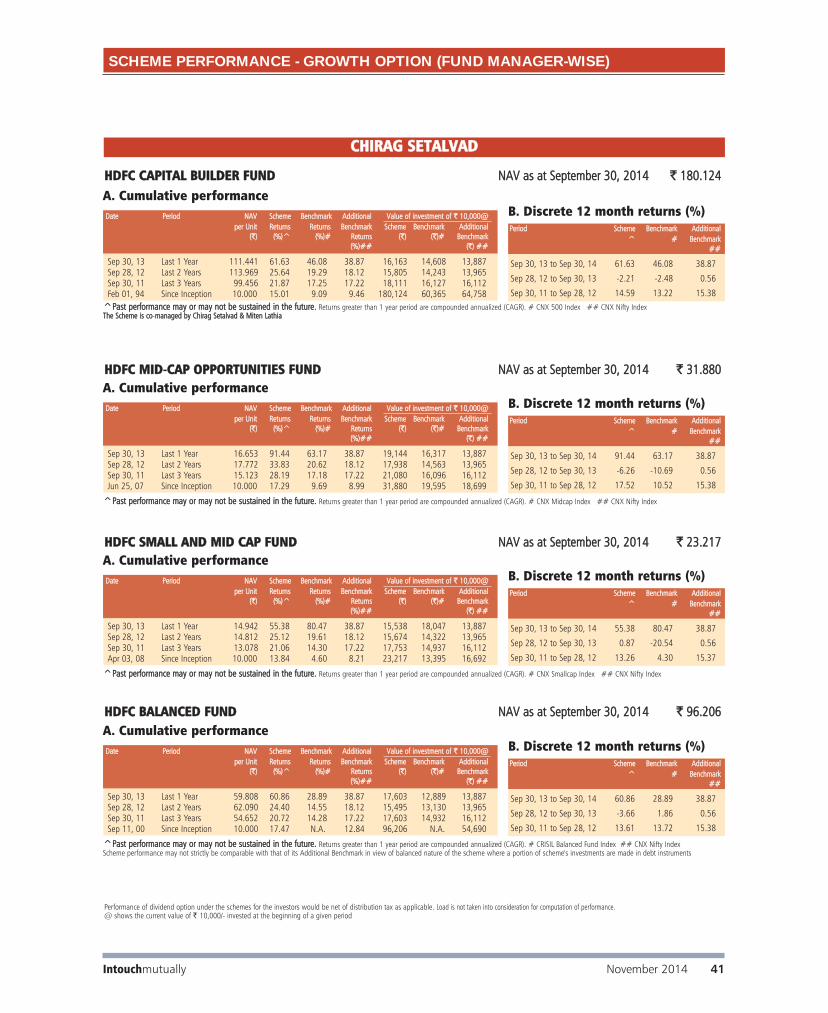
SCHEME PERFORMANCE - GROWTH OPTION (FUND MANAGER-WISE)
Performance of dividend option under the schemes for the investors would be net of distribution tax as applicable. Load is not taken into consideration for computation of performance.@ shows the current value of ` 10,000/- invested at the beginning of a given period
Date Period NAV Scheme Benchmark Additional Value of investment of ` 10,000@ per Unit Returns Returns Benchmark Scheme Benchmark Additional
(`) (%)^ (%)# Returns (`) (`)# Benchmark(%)## (`) ##
^̂PPaasstt ppeerrffoorrmmaannccee mmaayy oorr mmaayy nnoott bbee ssuussttaaiinneedd iinn tthhee ffuuttuurree.. Returns greater than 1 year period are compounded annualized (CAGR). # CRISIL Balanced Fund Index ## CNX Nifty IndexScheme performance may not strictly be comparable with that of its Additional Benchmark in view of balanced nature of the scheme where a portion of scheme's investments are made in debt instruments
A. Cumulative performance
Sep 30, 13 Last 1 Year 59.808 60.86 28.89 38.87 17,603 12,889 13,887Sep 28, 12 Last 2 Years 62.090 24.40 14.55 18.12 15,495 13,130 13,965Sep 30, 11 Last 3 Years 54.652 20.72 14.28 17.22 17,603 14,932 16,112Sep 11, 00 Since Inception 10.000 17.47 N.A. 12.84 96,206 N.A. 54,690
Period Scheme Benchmark Additional ^ # Benchmark
##
B. Discrete 12 month returns (%)
Sep 30, 13 to Sep 30, 14 60.86 28.89 38.87
Sep 28, 12 to Sep 30, 13 -3.66 1.86 0.56
Sep 30, 11 to Sep 28, 12 13.61 13.72 15.38
HDFC BALANCED FUND NAV as at September 30, 2014 ` 96.206
Intouchmutually November 2014 41
Date Period NAV Scheme Benchmark Additional Value of investment of ` 10,000@ per Unit Returns Returns Benchmark Scheme Benchmark Additional
(`) (%)^ (%)# Returns (`) (`)# Benchmark(%)## (`) ##
^̂PPaasstt ppeerrffoorrmmaannccee mmaayy oorr mmaayy nnoott bbee ssuussttaaiinneedd iinn tthhee ffuuttuurree.. Returns greater than 1 year period are compounded annualized (CAGR). # CNX Midcap Index ## CNX Nifty Index
A. Cumulative performance
Sep 30, 13 Last 1 Year 16.653 91.44 63.17 38.87 19,144 16,317 13,887Sep 28, 12 Last 2 Years 17.772 33.83 20.62 18.12 17,938 14,563 13,965Sep 30, 11 Last 3 Years 15.123 28.19 17.18 17.22 21,080 16,096 16,112Jun 25, 07 Since Inception 10.000 17.29 9.69 8.99 31,880 19,595 18,699
Period Scheme Benchmark Additional ^ # Benchmark
##
B. Discrete 12 month returns (%)
Sep 30, 13 to Sep 30, 14 91.44 63.17 38.87
Sep 28, 12 to Sep 30, 13 -6.26 -10.69 0.56
Sep 30, 11 to Sep 28, 12 17.52 10.52 15.38
HDFC MID-CCAP OPPORTUNITIES FUND NAV as at September 30, 2014 ` 31.880
Date Period NAV Scheme Benchmark Additional Value of investment of ` 10,000@ per Unit Returns Returns Benchmark Scheme Benchmark Additional
(`) (%)^ (%)# Returns (`) (`)# Benchmark(%)## (`) ##
^̂PPaasstt ppeerrffoorrmmaannccee mmaayy oorr mmaayy nnoott bbee ssuussttaaiinneedd iinn tthhee ffuuttuurree.. Returns greater than 1 year period are compounded annualized (CAGR). # CNX Smallcap Index ## CNX Nifty Index
A. Cumulative performance
Sep 30, 13 Last 1 Year 14.942 55.38 80.47 38.87 15,538 18,047 13,887Sep 28, 12 Last 2 Years 14.812 25.12 19.61 18.12 15,674 14,322 13,965Sep 30, 11 Last 3 Years 13.078 21.06 14.30 17.22 17,753 14,937 16,112Apr 03, 08 Since Inception 10.000 13.84 4.60 8.21 23,217 13,395 16,692
Period Scheme Benchmark Additional ^ # Benchmark
##
B. Discrete 12 month returns (%)
Sep 30, 13 to Sep 30, 14 55.38 80.47 38.87
Sep 28, 12 to Sep 30, 13 0.87 -20.54 0.56
Sep 30, 11 to Sep 28, 12 13.26 4.30 15.37
HDFC SMALL AND MID CAP FUND NAV as at September 30, 2014 ` 23.217
CHIRAG SETALVAD
Date Period NAV Scheme Benchmark Additional Value of investment of ` 10,000@ per Unit Returns Returns Benchmark Scheme Benchmark Additional
(`) (%)^ (%)# Returns (`) (`)# Benchmark(%)## (`) ##
^̂PPaasstt ppeerrffoorrmmaannccee mmaayy oorr mmaayy nnoott bbee ssuussttaaiinneedd iinn tthhee ffuuttuurree. Returns greater than 1 year period are compounded annualized (CAGR). # CNX 500 Index ## CNX Nifty IndexThe Scheme is co-mmanaged by Chirag Setalvad & Miten Lathia
A. Cumulative performance
Sep 30, 13 Last 1 Year 111.441 61.63 46.08 38.87 16,163 14,608 13,887Sep 28, 12 Last 2 Years 113.969 25.64 19.29 18.12 15,805 14,243 13,965Sep 30, 11 Last 3 Years 99.456 21.87 17.25 17.22 18,111 16,127 16,112Feb 01, 94 Since Inception 10.000 15.01 9.09 9.46 180,124 60,365 64,758
Period Scheme Benchmark Additional ^ # Benchmark
##
B. Discrete 12 month returns (%)
Sep 30, 13 to Sep 30, 14 61.63 46.08 38.87
Sep 28, 12 to Sep 30, 13 -2.21 -2.48 0.56
Sep 30, 11 to Sep 28, 12 14.59 13.22 15.38
HDFC CAPITAL BUILDER FUND NAV as at September 30, 2014 ` 180.124

SCHEME PERFORMANCE - GROWTH OPTION (FUND MANAGER-WISE)
Performance of dividend option under the schemes for the investors would be net of distribution tax as applicable. Load is not taken into consideration for computation of performance.@ shows the current value of ` 10,000/- invested at the beginning of a given period
Date Period NAV Scheme Benchmark Additional Value of investment of ` 10,000@ per Unit Returns Returns Benchmark Scheme Benchmark Additional
(`) (%)^ (%)# Returns (`) (`)# Benchmark(%)## (`) ##
^̂PPaasstt ppeerrffoorrmmaannccee mmaayy oorr mmaayy nnoott bbee ssuussttaaiinneedd iinn tthhee ffuuttuurree.. Returns greater than 1 year period are compounded annualized (CAGR). # CRISIL MIP Blended Index ## CRISIL 1 year T-Bill IndexScheme performance may not strictly be comparable with that of its Additional Benchmark in view of hybrid nature of the scheme where a portion of scheme's investments are made in equity instruments. The Scheme is co-mmanaged by Chirag Setalvad (Equities) and Anil Bamboli (Debt).
A. Cumulative performance
Sep 30, 13 Last 1 Year 19.2577 22.93 15.45 8.35 12,293 11,545 10,835Sep 28, 12 Last 2 Years 18.6330 12.68 9.14 7.00 12,705 11,917 11,453Sep 30, 11 Last 3 Years 17.0039 11.64 9.55 7.38 13,922 13,154 12,385Aug 17, 05 Since Inception 10.0000 9.90 7.97 5.79 23,673 20,125 16,721
Period Scheme Benchmark Additional ^ # Benchmark
##
B. Discrete 12 month returns (%)
Sep 30, 13 to Sep 30, 14 22.93 15.45 8.35
Sep 28, 12 to Sep 30, 13 3.33 3.26 5.66
Sep 30, 11 to Sep 28, 12 9.58 10.60 8.14
HDFC MULTIPLE YIELD FUND - PLAN 2005 NAV as at September 30, 2014 ` 23.6732
CHIRAG SETALVAD...CONTINUED
Intouchmutually42 November 2014
Date Period NAV Scheme Benchmark Additional Value of investment of ` 10,000@ per Unit Returns Returns Benchmark Scheme Benchmark Additional
(`) (%)^ (%)# Returns (`) (`)# Benchmark(%)## (`) ##
^̂PPaasstt ppeerrffoorrmmaannccee mmaayy oorr mmaayy nnoott bbee ssuussttaaiinneedd iinn tthhee ffuuttuurree.. Returns greater than 1 year period are compounded annualized (CAGR). #S&P BSE SENSEX ## CNX Nifty Index
A. Cumulative performance
Sep 30, 13 Last 1 Year 140.410 61.80 37.41 38.87 16,180 13,741 13,887Sep 28, 12 Last 2 Years 141.446 26.65 19.08 18.12 16,062 14,193 13,965Sep 30, 11 Last 3 Years 124.372 22.22 17.39 17.22 18,267 16,185 16,112Jan 02, 01 Since Inception 10.000 25.50 14.74 14.27 227,188 66,264 62,626
Period Scheme Benchmark Additional ^ # Benchmark
##
B. Discrete 12 month returns (%)
Sep 30, 13 to Sep 30, 14 61.80 37.41 38.87
Sep 28, 12 to Sep 30, 13 -0.73 3.27 0.56
Sep 30, 11 to Sep 28, 12 13.73 14.03 15.38
HDFC LONG TERM ADVANTAGE FUND NAV as at September 30, 2014 ` 227.188
Date Period NAV Scheme Benchmark Additional Value of investment of ` 10,000@ per Unit Returns Returns Benchmark Scheme Benchmark Additional
(`) (%)^$ (%)# Returns (`) $ (`)# Benchmark(%)## (`) ##
^̂PPaasstt ppeerrffoorrmmaannccee mmaayy oorr mmaayy nnoott bbee ssuussttaaiinneedd iinn tthhee ffuuttuurree.. Returns greater than 1 year period are compounded annualized (CAGR). # CRISIL Balanced Fund Index ## CNX Nifty Index$ Adjusted for bonus units declared under the schemeScheme performance may not strictly be comparable with that of its Additional Benchmark in view of balanced nature of the scheme where a portion of scheme's investments are made in debt instruments
A. Cumulative performance
Sep 30, 13 Last 1 Year 50.249 51.81 28.89 38.87 17,927 12,889 13,887Sep 28, 12 Last 2 Years 48.564 25.25 14.55 18.12 15,708 13,130 13,965Sep 30, 11 Last 3 Years 42.552 21.46 14.28 17.22 17,927 14,932 16,112Mar 02, 01 Since Inception 10.000 18.39 N.A. 14.23 99,168 N.A. 60,970
Period Scheme Benchmark Additional ^$ # Benchmark
##
B. Discrete 12 month returns (%)
Sep 30, 13 to Sep 30, 14 51.81 28.89 38.87
Sep 28, 12 to Sep 30, 13 3.45 1.86 0.56
Sep 30, 11 to Sep 28, 12 14.13 13.72 15.38
HDFC CHILDREN’S GIFT FUND - INVESTMENT PLAN NAV as at September 30, 2014 ` 76.283
Date Period NAV Scheme Benchmark Additional Value of investment of ` 10,000@ per Unit Returns Returns Benchmark Scheme Benchmark Additional
(`) (%)^$ (%)# Returns (`) $ (`)# Benchmark(%)## (`) ##
^̂PPaasstt ppeerrffoorrmmaannccee mmaayy oorr mmaayy nnoott bbee ssuussttaaiinneedd iinn tthhee ffuuttuurree.. Returns greater than 1 year period are compounded annualized (CAGR). # CRISIL MIP Blended Index ## CRISIL 10 year Gilt Index$ Adjusted for bonus units declared under the schemeScheme performance may not strictly be comparable with that of its Additional Benchmark in view of hybrid nature of the scheme where a portion of scheme's investments are made in equity instruments.
A. Cumulative performance
Sep 30, 13 Last 1 Year 26.2951 24.74 15.45 6.85 12,474 11,545 10,685Sep 28, 12 Last 2 Years 25.9731 12.34 9.14 4.61 12,629 11,917 10,946Sep 30, 11 Last 3 Years 23.6200 11.54 9.55 5.74 13,887 13,154 11,825Mar 02, 01 Since Inception 10.0000 11.26 N.A. N.A. 42,641 N.A. N.A.
Period Scheme Benchmark Additional ^$ # Benchmark
##
B. Discrete 12 month returns (%)
Sep 30, 13 to Sep 30, 14 24.74 15.45 6.85
Sep 28, 12 to Sep 30, 13 1.23 3.20 2.43
Sep 30, 11 to Sep 28, 12 9.96 10.60 8.03
HDFC CHILDREN’S GIFT FUND - SAVINGS PLAN NAV as at September 30, 2014 ` 32.8005

SHOBHIT MEHROTRA
Date Period NAV Scheme Benchmark Additional Value of investment of ` 10,000@ per Unit Returns Returns Benchmark Scheme Benchmark Additional
(`) (%)^ (%)# Returns (`) (`)# Benchmark(%)## (`) ##
^̂PPaasstt ppeerrffoorrmmaannccee mmaayy oorr mmaayy nnoott bbee ssuussttaaiinneedd iinn tthhee ffuuttuurree.. Returns greater than 1 year period are compounded annualized (CAGR). # CRISIL MIP Blended Index ## CRISIL 10 year Gilt IndexScheme performance may not strictly be comparable with that of its Additional Benchmark in view of hybrid nature of the scheme where a portion of scheme's investments are made in equity instruments.
The Scheme is co-mmanaged by Vinay Kulkarni (Equities) and Shobhit Mehrotra (Debt).
A. Cumulative performance
Sep 30, 13 Last 1 Year 19.4681 20.07 15.45 6.85 12,007 11,545 10,685Sep 28, 12 Last 2 Years 19.0357 10.78 9.14 4.61 12,280 11,917 10,946Sep 30, 11 Last 3 Years 17.4525 10.21 9.55 5.74 13,394 13,154 11,825Dec 26, 03 Since Inception 10.0000 8.20 7.47 4.41 23,375 21,735 15,913
Period Scheme Benchmark Additional ^ # Benchmark
##
B. Discrete 12 month returns (%)
Sep 30, 13 to Sep 30, 14 20.07 15.45 6.85
Sep 28, 12 to Sep 30, 13 2.26 3.26 2.43
Sep 30, 11 to Sep 28, 12 9.07 10.60 8.03
HDFC MF MIP SHORT TERM PLAN NAV as at September 30, 2014 ` 23.3754
Performance of dividend option under the schemes for the investors would be net of distribution tax as applicable. Load is not taken into consideration for computation of performance. N.A.: Not Available@ shows the current value of ` 10,000/- invested at the beginning of a given period
SCHEME PERFORMANCE - GROWTH OPTION (FUND MANAGER-WISE)
Intouchmutually November 2014 43
Date Period NAV Scheme Benchmark Additional Value of investment of ` 10,000@ per Unit Returns Returns Benchmark Scheme Benchmark Additional
(`) (%)^ (%)# Returns (`) (`) # Benchmark(%)## (`) ##
^̂PPaasstt ppeerrffoorrmmaannccee mmaayy oorr mmaayy nnoott bbee ssuussttaaiinneedd iinn tthhee ffuuttuurree.. Returns greater than 1 year period are compounded annualized (CAGR). # CNX 500 Index ## CNX Nifty IndexThe Scheme is co-mmanaged by Prashant Jain and Srinivas Rao Ravuri.
A. Cumulative performance
Sep 30, 13 Last 1 Year 7.486 99.04 46.08 38.87 19,904 14,608 13,887Sep 28, 12 Last 2 Years 10.570 18.67 19.29 18.12 14,097 14,243 13,965Sep 30, 11 Last 3 Years 9.911 14.54 17.25 17.22 15,034 16,127 16,112Mar 10, 08 Since Inception 10.000 6.27 7.76 8.02 14,900 16,334 16,592
Period Scheme Benchmark Additional ^ # Benchmark
##
B. Discrete 12 month returns (%)
Sep 30, 13 to Sep 30, 14 99.04 46.08 38.87
Sep 28, 12 to Sep 30, 13 -29.04 -2.48 0.56
Sep 30, 11 to Sep 28, 12 6.65 13.22 15.38
HDFC INFRASTRUCTURE FUND NAV as at September 30, 2014 ` 14.900
SRINIVAS RAO RAVURI
Date Period NAV Scheme Benchmark Additional Value of investment of ` 10,000@ per Unit Returns Returns Benchmark Scheme Benchmark Additional
(`) (%)^ (%)# Returns (`) (`)# Benchmark(%)## (`) ##
^̂PPaasstt ppeerrffoorrmmaannccee mmaayy oorr mmaayy nnoott bbee ssuussttaaiinneedd iinn tthhee ffuuttuurree.. Returns greater than 1 year period are compounded annualized (CAGR). # S&P BSE SENSEX ## CNX Nifty Index
A. Cumulative performance
Sep 30, 13 Last 1 Year 82.261 51.64 37.41 38.87 15,164 13,741 13,887Sep 28, 12 Last 2 Years 90.739 17.20 19.08 18.12 13,747 14,193 13,965Sep 30, 11 Last 3 Years 79.427 16.22 17.39 17.22 15,705 16,185 16,112Sep 11, 00 Since Inception 10.000 19.66 13.14 12.84 124,737 56,702 54,690
Period Scheme Benchmark Additional ^ # Benchmark
##
B. Discrete 12 month returns (%)
Sep 30, 13 to Sep 30, 14 51.64 37.41 38.87
Sep 28, 12 to Sep 30, 13 -9.29 3.27 0.56
Sep 30, 11 to Sep 28, 12 14.24 14.03 15.38
HDFC GROWTH FUND NAV as at September 30, 2014 ` 124.737
Date Period NAV Scheme Benchmark Additional Value of investment of ` 10,000@ per Unit Returns Returns Benchmark Scheme Benchmark Additional
(`) (%)^ (%)# Returns (`) (`)# Benchmark(%)## (`)##
^Past performance may or may not be sustained in the future. Returns greater than 1 year period are compounded annualized (CAGR). # S&P BSE 100 ## S&P BSE SENSEX
Sep 30, 13 Last 1 Year 9.816 50.55 40.05 37.41 15,055 14,005 13,741Mar 22, 13 Since Inception 10.000 29.17 25.88 25.91 14,778 14,208 14,214
Period Scheme Benchmark Additional ^ # Benchmark
##
B. Discrete 12 month returns (%)
Sep 30, 13 to Sep 30, 14 50.55 40.05 37.41
HDFC RAJIV GANDHI EQUITY SAVINGS SCHEME - SERIES I - FEBRUARY 2013NAV as at September 30, 2014 ` 14.778A. Cumulative performance

Performance of dividend option under the schemes for the investors would be net of distribution tax as applicable. Load is not taken into consideration for computation of performance. N.A.: Not Available@ shows the current value of ` 10,000/- invested at the beginning of a given period
SHOBHIT MEHROTRA...CONTINUED
Date Period NAV Scheme Benchmark Additional Value of investment of ` 10,000@ per Unit Returns Returns Benchmark Scheme Benchmark Additional
(`) (%)^ (%)# Returns (`) (`)# Benchmark(%)## (`)##
^̂PPaasstt ppeerrffoorrmmaannccee mmaayy oorr mmaayy nnoott bbee ssuussttaaiinneedd iinn tthhee ffuuttuurree.. Returns greater than 1 year period are compounded annualized (CAGR). # CRISIL Liquid Fund Index ## CRISIL 1 year T-Bill IndexSince inception returns are calculated on ` 10.0104 ( allotment price)
A. Cumulative performance
Sep 30, 13 Last 1 Year 21.2565 9.70 9.49 8.35 10,970 10,949 10,835Sep 28, 12 Last 2 Years 19.6249 8.98 9.01 7.00 11,882 11,889 11,453Sep 30, 11 Last 3 Years 17.6989 9.61 8.90 7.38 13,175 12,920 12,385Jan 16, 03 Since Inception 10.0104 7.49 6.61 5.56 23,294 21,175 18,839
Period Scheme Benchmark Additional ^ # Benchmark
##
B. Discrete 12 month returns (%)
Sep 30, 13 to Sep 30, 14 9.70 9.49 8.35Sep 28, 12 to Sep 30, 13 8.27 8.54 5.66Sep 30, 11 to Sep 28, 12 10.88 8.65 8.14
HDFC FLOATING RATE INCOME FUND - LTP NAV as at September 30, 2014 ` 23.3184
Date Period NAV Scheme Benchmark Additional Value of investment of ` 10,000@ per Unit Returns Returns Benchmark Scheme Benchmark Additional
(`) (%)^ (%)# Returns (`) (`)# Benchmark(%)## (`)##
^̂PPaasstt ppeerrffoorrmmaannccee mmaayy oorr mmaayy nnoott bbee ssuussttaaiinneedd iinn tthhee ffuuttuurree.. Returns greater than 1 year period are compounded annualized (CAGR). # CRISIL Liquid Fund Index ## CRISIL 1 year T-Bill IndexSince inception returns are calculated on ` 13.1821 ( allotment price)
A. Cumulative performance
Sep 30, 13 Last 1 Year 20.8874 9.62 9.49 8.35 10,962 10,949 10,835Sep 28, 12 Last 2 Years 19.2054 9.16 9.01 7.00 11,922 11,889 11,453Sep 30, 11 Last 3 Years 17.4772 9.40 8.90 7.38 13,101 12,920 12,385Oct 23, 07 Since Inception 13.1821 8.28 7.53 6.00 17,370 16,553 14,986
Period Scheme Benchmark Additional ^ # Benchmark
##
B. Discrete 12 month returns (%)
Sep 30, 13 to Sep 30, 14 9.62 9.49 8.35Sep 28, 12 to Sep 30, 13 8.71 8.54 5.66Sep 30, 11 to Sep 28, 12 9.89 8.65 8.14
HDFC FLOATING RATE INCOME FUND - STP - WHOLESALE OPTION NAV as at September 30, 2014 ` 22.8972
SCHEME PERFORMANCE - GROWTH OPTION (FUND MANAGER-WISE)
Intouchmutually44 November 2014
Date Period NAV Scheme Benchmark Additional Value of investment of ` 10,000@ per Unit Returns Returns Benchmark Scheme Benchmark Additional
(`) (%)^ (%)# Returns (`) (`)# Benchmark(%)## (`) ##
^̂PPaasstt ppeerrffoorrmmaannccee mmaayy oorr mmaayy nnoott bbee ssuussttaaiinneedd iinn tthhee ffuuttuurree.. Returns greater than 1 year period are compounded annualized (CAGR). # CRISIL Composite Bond Fund Index ## CRISIL 10 year Gilt Index
A. Cumulative performance
Sep 30, 13 Last 1 Year 26.3356 10.78 11.61 6.85 11,078 11,161 10,685Sep 28, 12 Last 2 Years 25.7485 6.43 7.46 4.61 11,331 11,551 10,946Sep 30, 11 Last 3 Years 23.3821 7.64 8.14 5.74 12,478 12,652 11,825Sep 11, 00 Since Inception 10.0000 7.91 N.A. N.A. 29,175 N.A. N.A.
Period Scheme Benchmark Additional ^ # Benchmark
##
B. Discrete 12 month returns (%)
Sep 30, 13 to Sep 30, 14 10.78 11.61 6.85Sep 28, 12 to Sep 30, 13 2.27 3.48 2.43Sep 30, 11 to Sep 28, 12 10.12 9.53 8.03
HDFC INCOME FUND NAV as at September 30, 2014 ` 29.1753
Date Period NAV Scheme Benchmark Additional Value of investment of ` 10,000@ per Unit Returns Returns Benchmark Scheme Benchmark Additional
(`) (%)^ (%)# Returns (`) (`)# Benchmark(%)## (`)##
^Past performance may or may not be sustained in the future. Returns greater than 1 year period are compounded annualized (CAGR). # CRISIL Short Term Bond Fund Index ## CRISIL 1 year T-Bill Index
A. Cumulative performance
Sep 30, 13 Last 1 Year 23.6032 10.61 10.12 8.35 11,061 11,012 10,835Sep 28, 12 Last 2 Years 22.1828 8.46 8.91 7.00 11,769 11,868 11,453Sep 30, 11 Last 3 Years 20.1583 8.99 9.01 7.38 12,951 12,961 12,385Feb 06, 02 Since Inception 10.0000 7.88 N.A. 5.64 26,108 N.A. 20,021
Period Scheme Benchmark Additional ^ # Benchmark
##
B. Discrete 12 month returns (%)
Sep 30, 13 to Sep 30, 14 10.61 10.12 8.35Sep 28, 12 to Sep 30, 13 6.37 7.73 5.66Sep 30, 11 to Sep 28, 12 10.04 9.21 8.14
HDFC HIGH INTEREST FUND - STP NAV as at September 30, 2014 ` 26.1075
Date Period NAV Scheme Benchmark Additional Value of investment of ` 10,000@ per Unit Returns Returns Benchmark Scheme Benchmark Additional
(`) (%)^ (%)# Returns (`) (`)# Benchmark(%)## (`) ##
^̂PPaasstt ppeerrffoorrmmaannccee mmaayy oorr mmaayy nnoott bbee ssuussttaaiinneedd iinn tthhee ffuuttuurree.. Returns greater than 1 year period are compounded annualized (CAGR). # CRISIL MIP Blended Index ## CRISIL 10 year Gilt IndexScheme performance may not strictly be comparable with that of its Additional Benchmark in view of hybrid nature of the scheme where a portion of scheme's investments are made in equity instruments.
The Scheme is co-mmanaged by Prashant Jain (Equities) and Shobhit Mehrotra (Debt).
A. Cumulative performance
Sep 30, 13 Last 1 Year 25.5167 26.06 15.45 6.85 12,606 11,545 10,685Sep 28, 12 Last 2 Years 25.5658 12.14 9.14 4.61 12,582 11,917 10,946Sep 30, 11 Last 3 Years 23.1615 11.55 9.55 5.74 13,888 13,154 11,825Dec 26, 03 Since Inception 10.0000 11.46 7.47 4.41 32,168 21,735 15,913
Period Scheme Benchmark Additional ^ # Benchmark
##
B. Discrete 12 month returns (%)
Sep 30, 13 to Sep 30, 14 26.06 15.45 6.85Sep 28, 12 to Sep 30, 13 -0.19 3.20 2.43Sep 30, 11 to Sep 28, 12 10.38 10.60 8.03
HDFC MF MIP LONG TERM PLAN NAV as at September 30, 2014 ` 32.1675

Performance of dividend option under the schemes for the investors would be net of distribution tax as applicable. Load is not taken into consideration for computation of performance.@ shows the current value of ` 10,000/- invested at the beginning of a given period
SHOBHIT MEHROTRA...CONTINUED
Date Period NAV Scheme Benchmark Additional Value of investment of ` 10,000@ per Unit Returns Returns Benchmark Scheme Benchmark Additional
(`) (%)^ (%)# Returns (`) (`)# Benchmark(%)## (`)##
^̂PPaasstt ppeerrffoorrmmaannccee mmaayy oorr mmaayy nnoott bbee ssuussttaaiinneedd iinn tthhee ffuuttuurree.. Returns greater than 1 year period are compounded annualized (CAGR). # CRISIL Short Term Bond Fund Index. ## CRISIL 1 year T-Bill IndexPerformance of FMP schemes, being close-ended in nature, is not strictly comparable with that of open-ended schemes since the investment strategy for FMP schemes is primarily buy-and-hold whereas open-ended schemes are actively managed.
A. Cumulative performance
Sep 30, 13 Last 1 Year 11.7890 10.93 10.12 8.35 11,093 11,012 10,835Sep 28, 12 Last 2 Years 10.8701 9.66 8.91 7.00 12,031 11,868 11,453Dec 01, 11 Since Inception 10.0000 9.94 9.07 7.33 13,078 12,788 12,218
HDFC FMP 36M NOVEMBER 2011 (1) NAV as at September 30, 2014 ` 13.0779
Period Scheme Benchmark Additional ^ # Benchmark
##
B. Discrete 12 month returns (%)
Sep 30, 13 to Sep 30, 14 10.93 10.12 8.35Sep 28, 12 to Sep 30, 13 8.41 7.73 5.66
Date Period NAV Scheme Benchmark Additional Value of investment of ` 10,000@ per Unit Returns Returns Benchmark Scheme Benchmark Additional
(`) (%)^ (%)# Returns (`) (`)# Benchmark(%)## (`)##
^̂PPaasstt ppeerrffoorrmmaannccee mmaayy oorr mmaayy nnoott bbee ssuussttaaiinneedd iinn tthhee ffuuttuurree.. Returns greater than 1 year period are compounded annualized (CAGR). # CRISIL Short Term Bond Fund Index. ## CRISIL 1 year T-Bill IndexPerformance of FMP schemes, being close-ended in nature, is not strictly comparable with that of open-ended schemes since the investment strategy for FMP schemes is primarily buy-and-hold whereas open-ended schemes are actively managed.
A. Cumulative performance
Sep 30, 13 Last 1 Year 11.9145 10.34 10.12 8.35 11,034 11,012 10,835Sep 28, 12 Last 2 Years 10.9687 9.45 8.91 7.00 11,986 11,868 11,453Nov 11, 11 Since Inception 10.0000 9.94 9.07 7.46 13,147 12,850 12,311
HDFC FMP 36M OCTOBER 2011 (1) NAV as at September 30, 2014 ` 13.1469
Period Scheme Benchmark Additional ^ # Benchmark
##
B. Discrete 12 month returns (%)
Sep 30, 13 to Sep 30, 14 10.34 10.12 8.35Sep 28, 12 to Sep 30, 13 8.57 7.73 5.66
SCHEME PERFORMANCE - GROWTH OPTION (FUND MANAGER-WISE)
Intouchmutually November 2014 45
Date Period NAV Scheme Benchmark Additional Value of investment of ` 10,000@ per Unit Returns Returns Benchmark Scheme Benchmark Additional
(`) (%)^ (%)# Returns (`) (`)# Benchmark(%)## (`)##
^̂PPaasstt ppeerrffoorrmmaannccee mmaayy oorr mmaayy nnoott bbee ssuussttaaiinneedd iinn tthhee ffuuttuurree.. Returns greater than 1 year period are compounded annualized (CAGR). # CRISIL Composite Bond Fund Index. ## CRISIL 10 year Gilt Index
A. Cumulative performance
Sep 30, 13 Last 1 Year 13.0184 10.69 11.61 6.85 11,069 11,161 10,685Sep 28, 12 Last 2 Years 12.1573 8.85 7.46 4.61 11,853 11,551 10,946Sep 30, 11 Last 3 Years 11.0024 9.39 8.14 5.74 13,097 12,652 11,825Jun 29, 10 Since Inception 10.0000 8.96 7.26 4.80 14,410 13,476 12,211
HDFC MEDIUM TERM OPPORTUNITIES FUND NAV as at September 30, 2014 ` 14.4103
Period Scheme Benchmark Additional ^ # Benchmark
##
B. Discrete 12 month returns (%)
Sep 30, 13 to Sep 30, 14 10.69 11.61 6.85Sep 28, 12 to Sep 30, 13 7.04 3.48 2.43Sep 30, 11 to Sep 28, 12 10.50 9.53 8.03
Date Period NAV Scheme Benchmark Additional Value of investment of ` 10,000@ per Unit Returns Returns Benchmark Scheme Benchmark Additional
(`) (%)^ (%)# Returns (`) (`)# Benchmark(%)## (`)##
^̂PPaasstt ppeerrffoorrmmaannccee mmaayy oorr mmaayy nnoott bbee ssuussttaaiinneedd iinn tthhee ffuuttuurree.. Returns greater than 1 year period are compounded annualized (CAGR). # CRISIL Liquid Fund Index ## CRISIL 1 year T-Bill Index
A. Cumulative performance
Sep 23, 14 Last 7 days 26.3896 0.17 0.18 0.17 10,017 10,018 10,017Sep 15, 14 Last 15 days 26.3398 0.36 0.37 0.32 10,036 10,037 10,032Aug 31, 14 Last 1 Month 26.2476 0.71 N.A. N.A. 10,071 N.A. N.A.Sep 30, 13 Last 1 Year 24.1703 9.37 9.49 8.35 10,937 10,949 10,835Sep 30, 12 Last 2 Years 22.1776 9.18 9.01 N.A. 11,919 11,884 N.A.Sep 29, 11 Last 3 Years 20.2187 9.33 8.90 7.38 13,074 12,920 12,385Oct 17, 00 Since Inception 10.0000 7.21 N.A. 6.14 26,434 N.A. 22,967
Period Scheme Benchmark Additional ^ # Benchmark
##
B. Discrete 12 month returns (%)
Sep 30, 13 to Sep 30, 14 9.37 9.49 8.35
Sep 28, 12 to Sep 30, 13 8.99 8.54 N.A.
Sep 30, 11 to Sep 28, 12 9.63 8.67 N.A.
HDFC LIQUID FUND NAV as at September 30, 2014 ` 26.4341

SHOBHIT MEHROTRA...CONTINUED
SCHEME PERFORMANCE - GROWTH OPTION (FUND MANAGER-WISE)
Intouchmutually46 November 2014
Date Period NAV Scheme Benchmark Additional Value of investment of ` 10,000@ per Unit Returns Returns Benchmark Scheme Benchmark Additional
(`) (%)^ (%)# Returns (`) (`)# Benchmark(%)## (`)##
^̂PPaasstt ppeerrffoorrmmaannccee mmaayy oorr mmaayy nnoott bbee ssuussttaaiinneedd iinn tthhee ffuuttuurree.. Returns greater than 1 year period are compounded annualized (CAGR). # CRISIL Short Term Bond Fund Index. ## CRISIL 1 year T-Bill IndexPerformance of FMP schemes, being close-ended in nature, is not strictly comparable with that of open-ended schemes since the investment strategy for FMP schemes is primarily buy-and-hold whereas open-ended schemes are actively managed.
A. Cumulative performance
Sep 30, 13 Last 1 Year 10.0136 10.31 10.12 8.35 11,031 11,012 10,835Sep 25, 13 Since Inception 10.0000 10.31 10.26 8.47 11,046 11,040 10,859
HDFC FMP 742D SEPTEMBER 2013 (1) NAV as at September 30, 2014 ` 11.0459
Period Scheme Benchmark Additional ^ # Benchmark
##
B. Discrete 12 month returns (%)
Sep 30, 13 to Sep 30, 14 10.31 10.12 8.35
Date Period NAV Scheme Benchmark Additional Value of investment of ` 10,000@ per Unit Returns Returns Benchmark Scheme Benchmark Additional
(`) (%)^ (%)# Returns (`) (`)# Benchmark(%)## (`)##
^̂PPaasstt ppeerrffoorrmmaannccee mmaayy oorr mmaayy nnoott bbee ssuussttaaiinneedd iinn tthhee ffuuttuurree.. Returns greater than 1 year period are compounded annualized (CAGR). # CRISIL Composite Bond Fund Index. ## CRISIL 1 year T-Bill IndexPerformance of FMP schemes, being close-ended in nature, is not strictly comparable with that of open-ended schemes since the investment strategy for FMP schemes is primarily buy-and-hold whereas open-ended schemes are actively managed.
A. Cumulative performance
Sep 30, 13 Last 1 Year 11.1217 9.51 11.61 8.35 10,951 11,161 10,835Sep 28, 12 Last 2 Years 10.3708 8.35 7.46 7.00 11,744 11,551 11,453Jun 20, 12 Since Inception 10.0000 9.04 7.84 7.13 12,180 11,877 11,701
HDFC FMP 1120D JUNE 2012 (1) NAV as at September 30, 2014 ` 12.1796
Period Scheme Benchmark Additional ^ # Benchmark
##
B. Discrete 12 month returns (%)
Sep 30, 13 to Sep 30, 14 9.51 11.61 8.35
Sep 28, 12 to Sep 30, 13 7.20 3.48 5.66
Date Period NAV Scheme Benchmark Additional Value of investment of ` 10,000@ per Unit Returns Returns Benchmark Scheme Benchmark Additional
(`) (%)^ (%)# Returns (`) (`)# Benchmark(%)## (`)##
^̂PPaasstt ppeerrffoorrmmaannccee mmaayy oorr mmaayy nnoott bbee ssuussttaaiinneedd iinn tthhee ffuuttuurree.. Returns greater than 1 year period are compounded annualized (CAGR). # CRISIL Composite Bond Fund Index. ## CRISIL 1 year T-Bill IndexPerformance of FMP schemes, being close-ended in nature, is not strictly comparable with that of open-ended schemes since the investment strategy for FMP schemes is primarily buy-and-hold whereas open-ended schemes are actively managed.
A. Cumulative performanceHDFC FMP 1198D FEBRUARY 2013 (1) NAV as at September 30, 2014 ` 11.4320
Period Scheme Benchmark Additional ^ # Benchmark
##
B. Discrete 12 month returns (%)
Sep 30, 13 to Sep 30, 14 10.85 11.61 8.35Sep 30, 13 Last 1 Year 10.3129 10.85 11.61 8.35 11,085 11,161 10,835Feb 13, 13 Since Inception 10.0000 8.57 6.95 6.72 11,432 11,156 11,117
Date Period NAV Scheme Benchmark Additional Value of investment of ` 10,000@ per Unit Returns Returns Benchmark Scheme Benchmark Additional
(`) (%)^ (%)# Returns (`) (`)# Benchmark(%)## (`)##
^̂PPaasstt ppeerrffoorrmmaannccee mmaayy oorr mmaayy nnoott bbee ssuussttaaiinneedd iinn tthhee ffuuttuurree.. Returns greater than 1 year period are compounded annualized (CAGR). # CRISIL Composite Bond Fund Index. ## CRISIL 1 year T-Bill IndexPerformance of FMP schemes, being close-ended in nature, is not strictly comparable with that of open-ended schemes since the investment strategy for FMP schemes is primarily buy-and-hold whereas open-ended schemes are actively managed.
A. Cumulative performance
Sep 30, 13 Last 1 Year 9.9089 11.76 11.61 8.35 11,176 11,161 10,835May 23, 13 Since Inception 10.0016 7.80 4.17 6.18 11,073 10,570 10,848
HDFC FMP 1107D MAY 2013 (1) NAV as at September 30, 2014 ` 11.0745
Period Scheme Benchmark Additional ^ # Benchmark
##
B. Discrete 12 month returns (%)
Sep 30, 13 to Sep 30, 14 11.76 11.61 8.35
Performance of dividend option under the schemes for the investors would be net of distribution tax as applicable. Load is not taken into consideration for computation of performance.@ shows the current value of ` 10,000/- invested at the beginning of a given period

SHOBHIT MEHROTRA...CONTINUED
Performance of dividend option under the schemes for the investors would be net of distribution tax as applicable. Load is not taken into consideration for computation of performance.@ shows the current value of ` 10,000/- invested at the beginning of a given period
SCHEME PERFORMANCE - GROWTH OPTION (FUND MANAGER-WISE)
Date Period NAV Scheme Benchmark Additional Value of investment of ` 10,000@ per Unit Returns Returns Benchmark Scheme Benchmark Additional
(`) (%)^ (%)# Returns (`) (`)# Benchmark(%)## (`)##
^̂PPaasstt ppeerrffoorrmmaannccee mmaayy oorr mmaayy nnoott bbee ssuussttaaiinneedd iinn tthhee ffuuttuurree.. Returns greater than 1 year period are compounded annualized (CAGR). # CRISIL Composite Bond Fund Index. ## CRISIL 1 year T-Bill IndexPerformance of FMP schemes, being close-ended in nature, is not strictly comparable with that of open-ended schemes since the investment strategy for FMP schemes is primarily buy-and-hold whereas open-ended schemes are actively managed.
A. Cumulative performance
Sep 30, 13 Last 1 Year 11.3859 11.36 11.61 8.35 11,136 11,161 10,835Sep 28, 12 Last 2 Years 10.5241 9.74 7.46 7.00 12,048 11,551 11,453Feb 15, 12 Since Inception 10.0000 9.47 7.81 7.32 12,680 12,181 12,036
HDFC FMP 1203D JANUARY 2012 (1) NAV as at September 30, 2014 ` 12.6799
Period Scheme Benchmark Additional ^ # Benchmark
##
B. Discrete 12 month returns (%)
Sep 30, 13 to Sep 30, 14 11.36 11.61 8.35Sep 28, 12 to Sep 30, 13 8.14 3.48 5.66
Date Period NAV Scheme Benchmark Additional Value of investment of ` 10,000@ per Unit Returns Returns Benchmark Scheme Benchmark Additional
(`) (%)^ (%)# Returns (`) (`)# Benchmark(%)## (`)##
^̂PPaasstt ppeerrffoorrmmaannccee mmaayy oorr mmaayy nnoott bbee ssuussttaaiinneedd iinn tthhee ffuuttuurree.. Returns greater than 1 year period are compounded annualized (CAGR). # CRISIL Composite Bond Fund Index. ## CRISIL 1 year T-Bill IndexPerformance of FMP schemes, being close-ended in nature, is not strictly comparable with that of open-ended schemes since the investment strategy for FMP schemes is primarily buy-and-hold whereas open-ended schemes are actively managed.
A. Cumulative performance
Sep 30, 13 Last 1 Year 10.2166 12.34 11.61 8.35 11,234 11,161 10,835Jan 08, 13 Since Inception 10.0000 8.31 6.97 6.81 11,477 11,233 11,205
HDFC FMP 1919D JANUARY 2013 (1) NAV as at September 30, 2014 ` 11.4773
Period Scheme Benchmark Additional ^ # Benchmark
##
B. Discrete 12 month returns (%)
Sep 30, 13 to Sep 30, 14 12.34 11.61 8.35
Date Period NAV Scheme Benchmark Additional Value of investment of ` 10,000@ per Unit Returns Returns Benchmark Scheme Benchmark Additional
(`) (%)^ (%)# Returns (`) (`)# Benchmark(%)## (`)##
^̂PPaasstt ppeerrffoorrmmaannccee mmaayy oorr mmaayy nnoott bbee ssuussttaaiinneedd iinn tthhee ffuuttuurree.. Returns greater than 1 year period are compounded annualized (CAGR). # CRISIL Short Term Bond Fund Index. ## CRISIL 1 year T-Bill IndexPerformance of FMP schemes, being close-ended in nature, is not strictly comparable with that of open-ended schemes since the investment strategy for FMP schemes is primarily buy-and-hold whereas open-ended schemes are actively managed.
A. Cumulative performance
Sep 30, 13 Last 1 Year 10.0630 9.65 10.12 8.35 10,965 11,012 10,835Sep 19, 13 Since Inception 10.0000 10.02 10.00 8.39 11,034 11,032 10,866
HDFC FMP 370D SEPTEMBER 2013 (4) NAV as at September 30, 2014 ` 11.0342
Period Scheme Benchmark Additional ^ # Benchmark
##
B. Discrete 12 month returns (%)
Sep 30, 13 to Sep 30, 14 9.65 10.12 8.35
Intouchmutually November 2014 47
ANIL BAMBOLI
Date Period NAV Scheme Benchmark Additional Value of investment of ` 10,000@ per Unit Returns Returns Benchmark Scheme Benchmark Additional
(`) (%)^ (%)# Returns (`) (`)# Benchmark(%)## (`) ##
^̂PPaasstt ppeerrffoorrmmaannccee mmaayy oorr mmaayy nnoott bbee ssuussttaaiinneedd iinn tthhee ffuuttuurree.. Returns greater than 1 year period are compounded annualized (CAGR). # CRISIL Liquid Fund Index ## CNX Nifty IndexScheme performance is not strictly comparable with that of its Additional Benchmark since the scheme does not take directional call in equity markets but is limited to availing arbitrage opportunities, etc.
A. Cumulative performance
Sep 30, 13 Last 1 Year 15.350 8.51 9.49 38.87 12,772 10,949 13,887Sep 28, 12 Last 2 Years 14.214 8.23 9.01 18.12 11,718 11,889 13,965Sep 30, 11 Last 3 Years 13.041 8.49 8.90 17.22 12,772 12,917 16,112Oct 23, 07 Since Inception 10.000 7.63 7.53 5.55 16,656 16,553 14,551
Period Scheme Benchmark Additional ^ # Benchmark
##
B. Discrete 12 month returns (%)
Sep 30, 13 to Sep 30, 14 8.51 9.49 38.87
Sep 28, 12 to Sep 30, 13 7.95 8.54 0.56
Sep 30, 11 to Sep 28, 12 8.99 8.65 15.38
HDFC ARBITRAGE FUND - WHOLESALE PLAN NAV as at September 30, 2014 ` 16.656
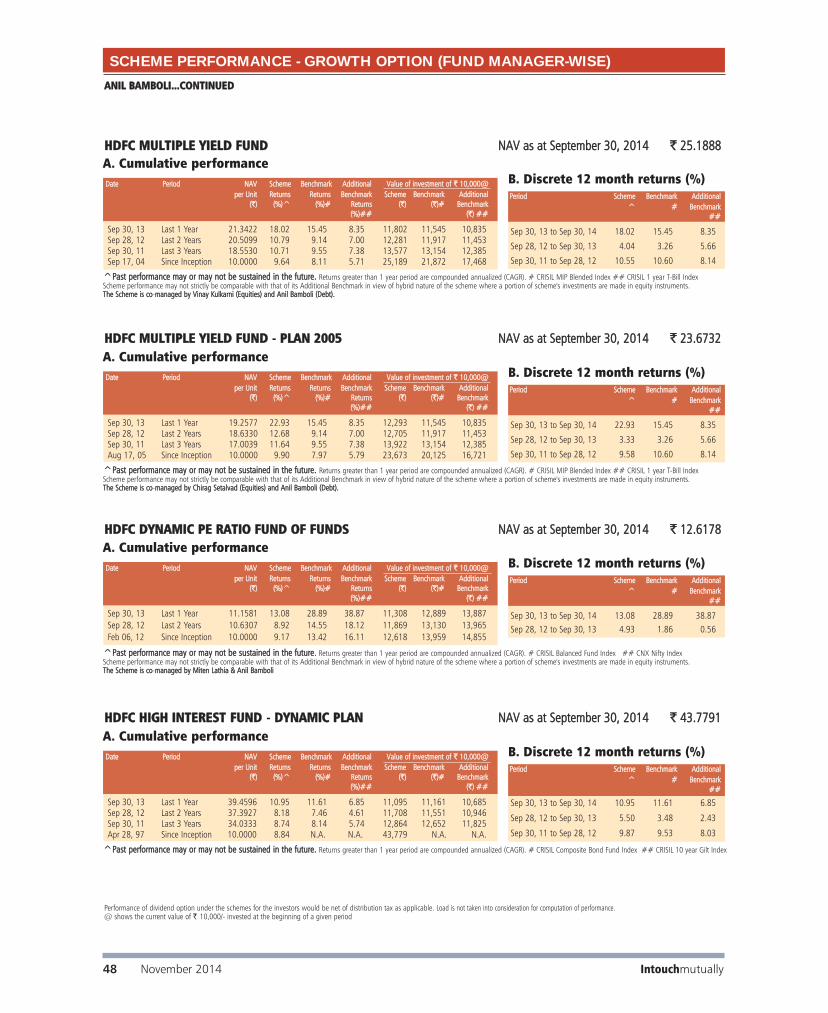
Date Period NAV Scheme Benchmark Additional Value of investment of ` 10,000@ per Unit Returns Returns Benchmark Scheme Benchmark Additional
(`) (%)^ (%)# Returns (`) (`)# Benchmark(%)## (`) ##
^̂PPaasstt ppeerrffoorrmmaannccee mmaayy oorr mmaayy nnoott bbee ssuussttaaiinneedd iinn tthhee ffuuttuurree.. Returns greater than 1 year period are compounded annualized (CAGR). # CRISIL MIP Blended Index ## CRISIL 1 year T-Bill IndexScheme performance may not strictly be comparable with that of its Additional Benchmark in view of hybrid nature of the scheme where a portion of scheme's investments are made in equity instruments. The Scheme is co-mmanaged by Vinay Kulkarni (Equities) and Anil Bamboli (Debt).
A. Cumulative performance
Sep 30, 13 Last 1 Year 21.3422 18.02 15.45 8.35 11,802 11,545 10,835Sep 28, 12 Last 2 Years 20.5099 10.79 9.14 7.00 12,281 11,917 11,453Sep 30, 11 Last 3 Years 18.5530 10.71 9.55 7.38 13,577 13,154 12,385Sep 17, 04 Since Inception 10.0000 9.64 8.11 5.71 25,189 21,872 17,468
Period Scheme Benchmark Additional ^ # Benchmark
##
B. Discrete 12 month returns (%)
Sep 30, 13 to Sep 30, 14 18.02 15.45 8.35
Sep 28, 12 to Sep 30, 13 4.04 3.26 5.66
Sep 30, 11 to Sep 28, 12 10.55 10.60 8.14
HDFC MULTIPLE YIELD FUND NAV as at September 30, 2014 ` 25.1888
SCHEME PERFORMANCE - GROWTH OPTION (FUND MANAGER-WISE)
Intouchmutually48 November 2014
Performance of dividend option under the schemes for the investors would be net of distribution tax as applicable. Load is not taken into consideration for computation of performance.@ shows the current value of ` 10,000/- invested at the beginning of a given period
ANIL BAMBOLI...CONTINUED
Date Period NAV Scheme Benchmark Additional Value of investment of ` 10,000@ per Unit Returns Returns Benchmark Scheme Benchmark Additional
(`) (%)^ (%)# Returns (`) (`)# Benchmark(%)## (`) ##
^̂PPaasstt ppeerrffoorrmmaannccee mmaayy oorr mmaayy nnoott bbee ssuussttaaiinneedd iinn tthhee ffuuttuurree.. Returns greater than 1 year period are compounded annualized (CAGR). # CRISIL MIP Blended Index ## CRISIL 1 year T-Bill IndexScheme performance may not strictly be comparable with that of its Additional Benchmark in view of hybrid nature of the scheme where a portion of scheme's investments are made in equity instruments. The Scheme is co-mmanaged by Chirag Setalvad (Equities) and Anil Bamboli (Debt).
A. Cumulative performance
Sep 30, 13 Last 1 Year 19.2577 22.93 15.45 8.35 12,293 11,545 10,835Sep 28, 12 Last 2 Years 18.6330 12.68 9.14 7.00 12,705 11,917 11,453Sep 30, 11 Last 3 Years 17.0039 11.64 9.55 7.38 13,922 13,154 12,385Aug 17, 05 Since Inception 10.0000 9.90 7.97 5.79 23,673 20,125 16,721
Period Scheme Benchmark Additional ^ # Benchmark
##
B. Discrete 12 month returns (%)
Sep 30, 13 to Sep 30, 14 22.93 15.45 8.35
Sep 28, 12 to Sep 30, 13 3.33 3.26 5.66
Sep 30, 11 to Sep 28, 12 9.58 10.60 8.14
HDFC MULTIPLE YIELD FUND - PLAN 2005 NAV as at September 30, 2014 ` 23.6732
Date Period NAV Scheme Benchmark Additional Value of investment of ` 10,000@ per Unit Returns Returns Benchmark Scheme Benchmark Additional
(`) (%)^ (%)# Returns (`) (`)# Benchmark(%)## (`) ##
^̂PPaasstt ppeerrffoorrmmaannccee mmaayy oorr mmaayy nnoott bbee ssuussttaaiinneedd iinn tthhee ffuuttuurree. Returns greater than 1 year period are compounded annualized (CAGR). # CRISIL Balanced Fund Index ## CNX Nifty IndexScheme performance may not strictly be comparable with that of its Additional Benchmark in view of hybrid nature of the scheme where a portion of scheme's investments are made in equity instruments. The Scheme is co-mmanaged by Miten Lathia & Anil Bamboli
A. Cumulative performance
Sep 30, 13 Last 1 Year 11.1581 13.08 28.89 38.87 11,308 12,889 13,887Sep 28, 12 Last 2 Years 10.6307 8.92 14.55 18.12 11,869 13,130 13,965Feb 06, 12 Since Inception 10.0000 9.17 13.42 16.11 12,618 13,959 14,855
Period Scheme Benchmark Additional ^ # Benchmark
##
B. Discrete 12 month returns (%)
Sep 30, 13 to Sep 30, 14 13.08 28.89 38.87Sep 28, 12 to Sep 30, 13 4.93 1.86 0.56
HDFC DYNAMIC PE RATIO FUND OF FUNDS NAV as at September 30, 2014 ` 12.6178
Date Period NAV Scheme Benchmark Additional Value of investment of ` 10,000@ per Unit Returns Returns Benchmark Scheme Benchmark Additional
(`) (%)^ (%)# Returns (`) (`)# Benchmark(%)## (`) ##
^̂PPaasstt ppeerrffoorrmmaannccee mmaayy oorr mmaayy nnoott bbee ssuussttaaiinneedd iinn tthhee ffuuttuurree.. Returns greater than 1 year period are compounded annualized (CAGR). # CRISIL Composite Bond Fund Index ## CRISIL 10 year Gilt Index
A. Cumulative performance
Sep 30, 13 Last 1 Year 39.4596 10.95 11.61 6.85 11,095 11,161 10,685Sep 28, 12 Last 2 Years 37.3927 8.18 7.46 4.61 11,708 11,551 10,946Sep 30, 11 Last 3 Years 34.0333 8.74 8.14 5.74 12,864 12,652 11,825Apr 28, 97 Since Inception 10.0000 8.84 N.A. N.A. 43,779 N.A. N.A.
Period Scheme Benchmark Additional ^ # Benchmark
##
B. Discrete 12 month returns (%)
Sep 30, 13 to Sep 30, 14 10.95 11.61 6.85
Sep 28, 12 to Sep 30, 13 5.50 3.48 2.43
Sep 30, 11 to Sep 28, 12 9.87 9.53 8.03
HDFC HIGH INTEREST FUND - DYNAMIC PLAN NAV as at September 30, 2014 ` 43.7791
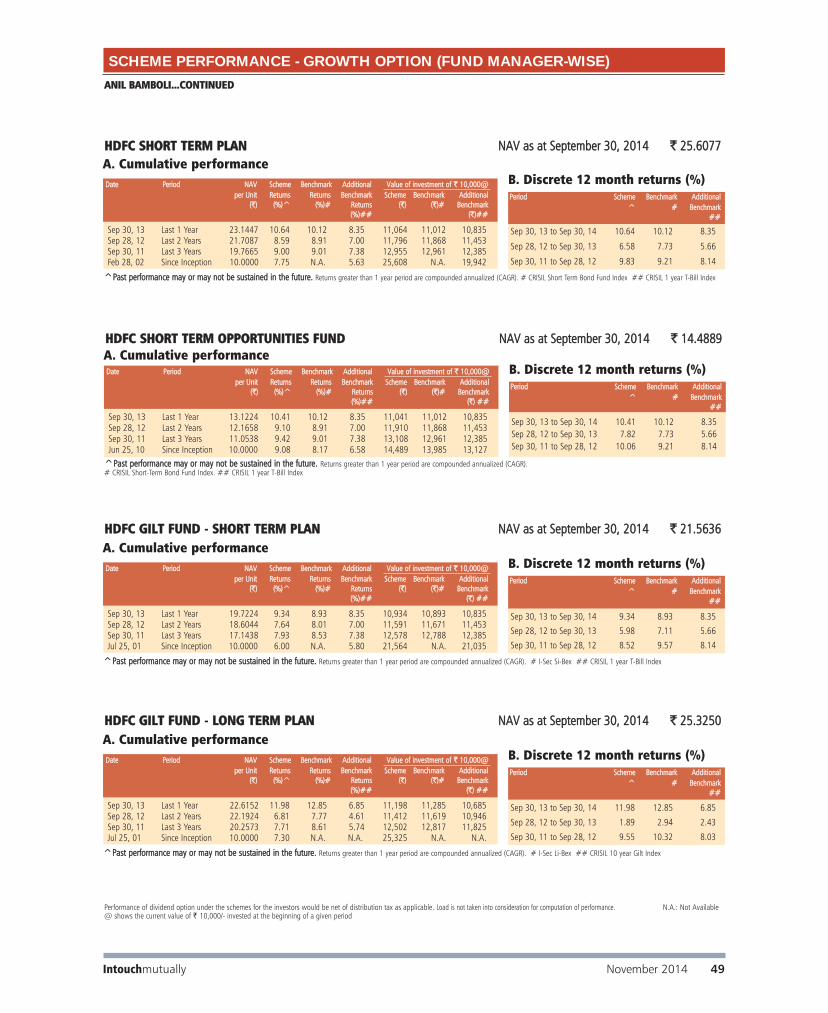
Performance of dividend option under the schemes for the investors would be net of distribution tax as applicable. Load is not taken into consideration for computation of performance. N.A.: Not Available@ shows the current value of ` 10,000/- invested at the beginning of a given period
ANIL BAMBOLI...CONTINUED
SCHEME PERFORMANCE - GROWTH OPTION (FUND MANAGER-WISE)
Intouchmutually November 2014 49
Date Period NAV Scheme Benchmark Additional Value of investment of ` 10,000@ per Unit Returns Returns Benchmark Scheme Benchmark Additional
(`) (%)^ (%)# Returns (`) (`)# Benchmark(%)## (`)##
^̂PPaasstt ppeerrffoorrmmaannccee mmaayy oorr mmaayy nnoott bbee ssuussttaaiinneedd iinn tthhee ffuuttuurree.. Returns greater than 1 year period are compounded annualized (CAGR). # CRISIL Short Term Bond Fund Index ## CRISIL 1 year T-Bill Index
A. Cumulative performance
Sep 30, 13 Last 1 Year 23.1447 10.64 10.12 8.35 11,064 11,012 10,835Sep 28, 12 Last 2 Years 21.7087 8.59 8.91 7.00 11,796 11,868 11,453Sep 30, 11 Last 3 Years 19.7665 9.00 9.01 7.38 12,955 12,961 12,385Feb 28, 02 Since Inception 10.0000 7.75 N.A. 5.63 25,608 N.A. 19,942
Period Scheme Benchmark Additional ^ # Benchmark
##
B. Discrete 12 month returns (%)
Sep 30, 13 to Sep 30, 14 10.64 10.12 8.35
Sep 28, 12 to Sep 30, 13 6.58 7.73 5.66
Sep 30, 11 to Sep 28, 12 9.83 9.21 8.14
HDFC SHORT TERM PLAN NAV as at September 30, 2014 ` 25.6077
Period Scheme Benchmark Additional ^ # Benchmark
##
B. Discrete 12 month returns (%)
Sep 30, 13 to Sep 30, 14 10.41 10.12 8.35Sep 28, 12 to Sep 30, 13 7.82 7.73 5.66Sep 30, 11 to Sep 28, 12 10.06 9.21 8.14
Date Period NAV Scheme Benchmark Additional Value of investment of ` 10,000@ per Unit Returns Returns Benchmark Scheme Benchmark Additional
(`) (%)^ (%)# Returns (`) (`)# Benchmark(%)## (`) ##
^̂PPaasstt ppeerrffoorrmmaannccee mmaayy oorr mmaayy nnoott bbee ssuussttaaiinneedd iinn tthhee ffuuttuurree.. Returns greater than 1 year period are compounded annualized (CAGR). # CRISIL Short-Term Bond Fund Index. ## CRISIL 1 year T-Bill Index
A. Cumulative performance
Sep 30, 13 Last 1 Year 13.1224 10.41 10.12 8.35 11,041 11,012 10,835Sep 28, 12 Last 2 Years 12.1658 9.10 8.91 7.00 11,910 11,868 11,453Sep 30, 11 Last 3 Years 11.0538 9.42 9.01 7.38 13,108 12,961 12,385Jun 25, 10 Since Inception 10.0000 9.08 8.17 6.58 14,489 13,985 13,127
HDFC SHORT TERM OPPORTUNITIES FUND NAV as at September 30, 2014 ` 14.4889
Date Period NAV Scheme Benchmark Additional Value of investment of ` 10,000@ per Unit Returns Returns Benchmark Scheme Benchmark Additional
(`) (%)^ (%)# Returns (`) (`)# Benchmark(%)## (`) ##
^̂PPaasstt ppeerrffoorrmmaannccee mmaayy oorr mmaayy nnoott bbee ssuussttaaiinneedd iinn tthhee ffuuttuurree.. Returns greater than 1 year period are compounded annualized (CAGR). # I-Sec Si-Bex ## CRISIL 1 year T-Bill Index
A. Cumulative performance
Sep 30, 13 Last 1 Year 19.7224 9.34 8.93 8.35 10,934 10,893 10,835Sep 28, 12 Last 2 Years 18.6044 7.64 8.01 7.00 11,591 11,671 11,453Sep 30, 11 Last 3 Years 17.1438 7.93 8.53 7.38 12,578 12,788 12,385Jul 25, 01 Since Inception 10.0000 6.00 N.A. 5.80 21,564 N.A. 21,035
Period Scheme Benchmark Additional ^ # Benchmark
##
B. Discrete 12 month returns (%)
Sep 30, 13 to Sep 30, 14 9.34 8.93 8.35
Sep 28, 12 to Sep 30, 13 5.98 7.11 5.66
Sep 30, 11 to Sep 28, 12 8.52 9.57 8.14
HDFC GILT FUND - SHORT TERM PLAN NAV as at September 30, 2014 ` 21.5636
Date Period NAV Scheme Benchmark Additional Value of investment of ` 10,000@ per Unit Returns Returns Benchmark Scheme Benchmark Additional
(`) (%)^ (%)# Returns (`) (`)# Benchmark(%)## (`) ##
^̂PPaasstt ppeerrffoorrmmaannccee mmaayy oorr mmaayy nnoott bbee ssuussttaaiinneedd iinn tthhee ffuuttuurree.. Returns greater than 1 year period are compounded annualized (CAGR). # I-Sec Li-Bex ## CRISIL 10 year Gilt Index
A. Cumulative performance
Sep 30, 13 Last 1 Year 22.6152 11.98 12.85 6.85 11,198 11,285 10,685Sep 28, 12 Last 2 Years 22.1924 6.81 7.77 4.61 11,412 11,619 10,946Sep 30, 11 Last 3 Years 20.2573 7.71 8.61 5.74 12,502 12,817 11,825Jul 25, 01 Since Inception 10.0000 7.30 N.A. N.A. 25,325 N.A. N.A.
Period Scheme Benchmark Additional ^ # Benchmark
##
B. Discrete 12 month returns (%)
Sep 30, 13 to Sep 30, 14 11.98 12.85 6.85
Sep 28, 12 to Sep 30, 13 1.89 2.94 2.43
Sep 30, 11 to Sep 28, 12 9.55 10.32 8.03
HDFC GILT FUND - LONG TERM PLAN NAV as at September 30, 2014 ` 25.3250

Performance of dividend option under the schemes for the investors would be net of distribution tax as applicable. Load is not taken into consideration for computation of performance. N.A.: Not Available@ shows the current value of ` 10,000/- invested at the beginning of a given period
ANIL BAMBOLI...CONTINUED
Date Period NAV Scheme Benchmark Additional Value of investment of ` 10,000@ per Unit Returns Returns Benchmark Scheme Benchmark Additional
(`) (%)^ (%)# Returns (`) (`)# Benchmark(%)## (`) ##
^̂PPaasstt ppeerrffoorrmmaannccee mmaayy oorr mmaayy nnoott bbee ssuussttaaiinneedd iinn tthhee ffuuttuurree.. Returns greater than 1 year period are compounded annualized (CAGR). # I-Sec Composite Index ## CRISIL 10 year Gilt Index
A. Cumulative performance
Sep 30, 13 Last 1 Year 10.1321 6.93 11.12 6.85 10,693 11,112 10,685
Mar 04, 13 Since Inception 10.0000 5.22 6.78 2.50 10,834 11,089 10,396
Period Scheme Benchmark Additional ^ # Benchmark
##
B. Discrete 12 month returns (%)
Sep 30, 13 to Sep 30, 14 6.93 11.12 6.85
HDFC INFLATION INDEXED BOND FUND NAV as at September 30, 2014 ` 10.8342
SCHEME PERFORMANCE - GROWTH OPTION (FUND MANAGER-WISE)
Intouchmutually50 November 2014
Date Period NAV Scheme Benchmark Additional Value of investment of ` 10,000@ per Unit Returns Returns Benchmark Scheme Benchmark Additional
(`) (%)^$$ (%)# Returns (`) $$ (`)# Benchmark(%)## (`)##
^̂PPaasstt ppeerrffoorrmmaannccee mmaayy oorr mmaayy nnoott bbee ssuussttaaiinneedd iinn tthhee ffuuttuurree.. Returns greater than 1 year period are compounded annualized (CAGR). # CRISIL Liquid Fund Index ## CRISIL 1 year T-Bill Index$$ All dividends declared prior to the splitting of the Scheme into Dividend & Growth Options are assumed to be reinvested in the units of the Scheme at the then prevailing NAV (ex-dividend NAV).
A. Cumulative performance
Sep 23, 14 Last 7 days 27.9263 0.17 0.18 0.17 10,017 10,018 10,017Sep 15, 14 Last 15 days 27.8735 0.36 0.37 0.32 10,036 10,037 10,032Aug 31, 14 Last 1 Month 27.7762 0.71 N.A. N.A. 10,071 N.A. N.A.Sep 30, 13 Last 1 Year 25.5870 9.33 9.49 8.35 10,933 10,949 10,835Sep 30, 12 Last 2 Years 23.4924 9.12 9.01 N.A. 11,907 11,884 N.A.Sep 29, 11 Last 3 Years 21.3857 9.35 8.90 7.38 13,080 12,920 12,385Nov 18, 99 Since Inception 10.0000 7.18 N.A. 6.27 28,069 N.A. 24,717
Period Scheme Benchmark Additional ^$$ # Benchmark
##
B. Discrete 12 month returns (%)
Sep 30, 13 to Sep 30, 14 9.33 9.49 8.35
Sep 28, 12 to Sep 30, 13 8.92 8.54 N.A.
Sep 30, 11 to Sep 28, 12 9.79 8.67 N.A.
HDFC CASH MANAGEMENT FUND - SAVINGS PLAN NAV as at September 30, 2014 ` 27.9734
Date Period NAV Scheme Benchmark Additional Value of investment of ` 10,000@ per Unit Returns Returns Benchmark Scheme Benchmark Additional
(`) (%)^ (%)# Returns (`) (`)# Benchmark(%)## (`) ##
^̂PPaasstt ppeerrffoorrmmaannccee mmaayy oorr mmaayy nnoott bbee ssuussttaaiinneedd iinn tthhee ffuuttuurree.. Returns greater than 1 year period are compounded annualized (CAGR). # CRISIL Liquid Fund Index ## CRISIL 1 year T-Bill Index
A. Cumulative performance
Sep 30, 13 Last 1 Year 26.0738 8.68 9.49 8.35 10,868 10,949 10,835Sep 28, 12 Last 2 Years 24.1754 8.24 9.01 7.00 11,722 11,889 11,453Sep 30, 11 Last 3 Years 22.1660 8.52 8.90 7.38 12,784 12,920 12,385Nov 18, 99 Since Inception 10.0000 7.25 N.A. 6.27 28,337 N.A. 24,717
Period Scheme Benchmark Additional ^ # Benchmark
##
B. Discrete 12 month returns (%)
Sep 30, 13 to Sep 30, 14 8.68 9.49 8.35
Sep 28, 12 to Sep 30, 13 7.81 8.54 5.66
Sep 30, 11 to Sep 28, 12 9.07 8.65 8.14
HDFC CASH MANAGEMENT FUND - TREASURY ADVANTAGE PLAN - RETAIL OPTIONNAV as at September 30, 2014 ` 28.3374
Date Period NAV Scheme Benchmark Additional Value of investment of ` 10,000@ per Unit Returns Returns Benchmark Scheme Benchmark Additional
(`) (%)^ (%)# Returns (`) (`)# Benchmark(%)## (`)##
^̂PPaasstt ppeerrffoorrmmaannccee mmaayy oorr mmaayy nnoott bbee ssuussttaaiinneedd iinn tthhee ffuuttuurree.. Returns greater than 1 year period are compounded annualized (CAGR). # CRISIL Liquid Fund Index ## CRISIL 1 year T-Bill Index
A. Cumulative performance
Sep 23, 14 Last 7 days 21.1399 0.14 0.18 0.17 10,014 10,018 10,017Sep 15, 14 Last 15 days 21.1046 0.31 0.37 0.32 10,031 10,037 10,032Aug 31, 14 Last 1 Month 21.0424 0.60 N.A. N.A. 10,061 N.A. N.A.Sep 30, 13 Last 1 Year 19.5554 8.26 9.49 8.35 10,826 10,949 10,835Sep 30, 12 Last 2 Years 18.0926 8.17 9.01 N.A. 11,701 11,884 N.A.Sep 29, 11 Last 3 Years 16.6937 8.22 8.90 7.38 12,681 12,920 12,385Feb 06, 02 Since Inception 10.0000 6.11 N.A. 5.64 21,170 N.A. 20,021
Period Scheme Benchmark Additional ^ # Benchmark
##
B. Discrete 12 month returns (%)
Sep 30, 13 to Sep 30, 14 8.26 9.49 8.35
Sep 28, 12 to Sep 30, 13 8.09 8.54 N.A.
Sep 30, 11 to Sep 28, 12 8.33 8.67 N.A.
HDFC CASH MANAGEMENT FUND - CALL PLAN NAV as at September 30, 2014 ` 21.1697
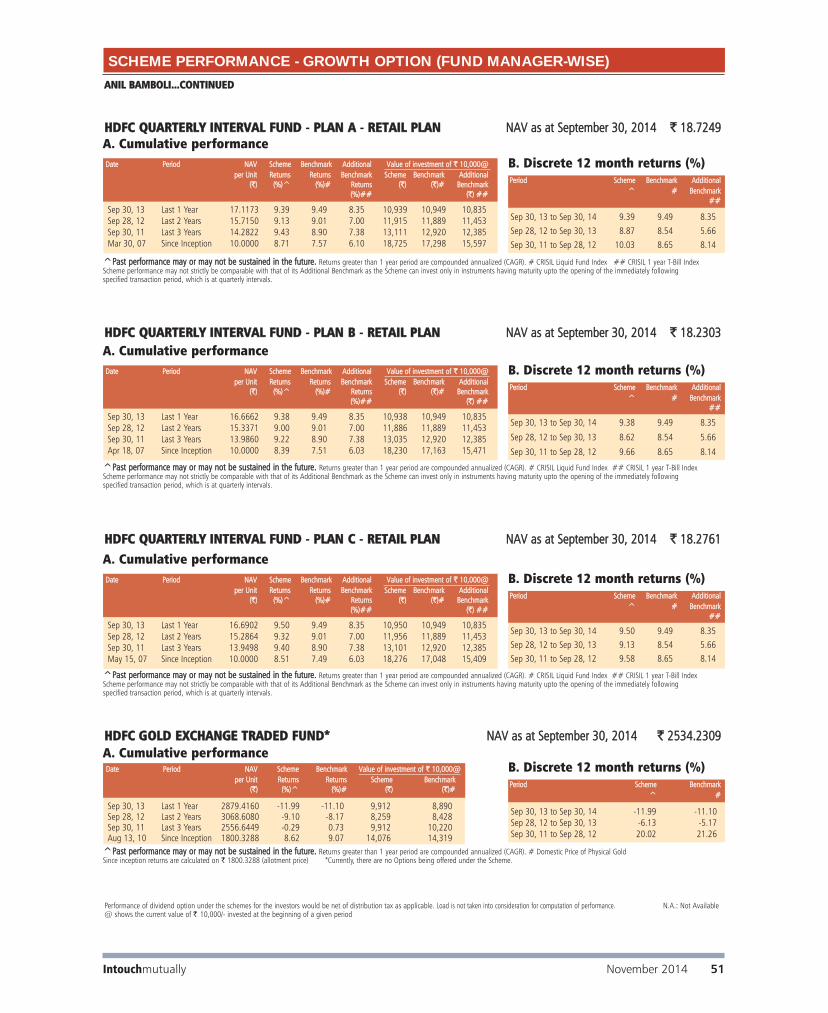
Performance of dividend option under the schemes for the investors would be net of distribution tax as applicable. Load is not taken into consideration for computation of performance. N.A.: Not Available@ shows the current value of ` 10,000/- invested at the beginning of a given period
ANIL BAMBOLI...CONTINUED
SCHEME PERFORMANCE - GROWTH OPTION (FUND MANAGER-WISE)
Intouchmutually November 2014 51
Date Period NAV Scheme Benchmark Additional Value of investment of ` 10,000@ per Unit Returns Returns Benchmark Scheme Benchmark Additional
(`) (%)^ (%)# Returns (`) (`)# Benchmark(%)## (`) ##
^̂PPaasstt ppeerrffoorrmmaannccee mmaayy oorr mmaayy nnoott bbee ssuussttaaiinneedd iinn tthhee ffuuttuurree.. Returns greater than 1 year period are compounded annualized (CAGR). # CRISIL Liquid Fund Index ## CRISIL 1 year T-Bill IndexScheme performance may not strictly be comparable with that of its Additional Benchmark as the Scheme can invest only in instruments having maturity upto the opening of the immediately following specified transaction period, which is at quarterly intervals.
A. Cumulative performance
Sep 30, 13 Last 1 Year 16.6662 9.38 9.49 8.35 10,938 10,949 10,835Sep 28, 12 Last 2 Years 15.3371 9.00 9.01 7.00 11,886 11,889 11,453Sep 30, 11 Last 3 Years 13.9860 9.22 8.90 7.38 13,035 12,920 12,385Apr 18, 07 Since Inception 10.0000 8.39 7.51 6.03 18,230 17,163 15,471
Period Scheme Benchmark Additional ^ # Benchmark
##
B. Discrete 12 month returns (%)
Sep 30, 13 to Sep 30, 14 9.38 9.49 8.35
Sep 28, 12 to Sep 30, 13 8.62 8.54 5.66
Sep 30, 11 to Sep 28, 12 9.66 8.65 8.14
HDFC QUARTERLY INTERVAL FUND - PLAN B - RETAIL PLAN NAV as at September 30, 2014 ` 18.2303
Date Period NAV Scheme Benchmark Additional Value of investment of ` 10,000@ per Unit Returns Returns Benchmark Scheme Benchmark Additional
(`) (%)^ (%)# Returns (`) (`)# Benchmark(%)## (`) ##
^̂PPaasstt ppeerrffoorrmmaannccee mmaayy oorr mmaayy nnoott bbee ssuussttaaiinneedd iinn tthhee ffuuttuurree.. Returns greater than 1 year period are compounded annualized (CAGR). # CRISIL Liquid Fund Index ## CRISIL 1 year T-Bill IndexScheme performance may not strictly be comparable with that of its Additional Benchmark as the Scheme can invest only in instruments having maturity upto the opening of the immediately following specified transaction period, which is at quarterly intervals.
Sep 30, 13 Last 1 Year 16.6902 9.50 9.49 8.35 10,950 10,949 10,835Sep 28, 12 Last 2 Years 15.2864 9.32 9.01 7.00 11,956 11,889 11,453Sep 30, 11 Last 3 Years 13.9498 9.40 8.90 7.38 13,101 12,920 12,385May 15, 07 Since Inception 10.0000 8.51 7.49 6.03 18,276 17,048 15,409
Period Scheme Benchmark Additional ^ # Benchmark
##
B. Discrete 12 month returns (%)
Sep 30, 13 to Sep 30, 14 9.50 9.49 8.35Sep 28, 12 to Sep 30, 13 9.13 8.54 5.66Sep 30, 11 to Sep 28, 12 9.58 8.65 8.14
HDFC QUARTERLY INTERVAL FUND - PLAN C - RETAIL PLAN NAV as at September 30, 2014 ` 18.2761
A. Cumulative performance
Date Period NAV Scheme Benchmark Additional Value of investment of ` 10,000@ per Unit Returns Returns Benchmark Scheme Benchmark Additional
(`) (%)^ (%)# Returns (`) (`)# Benchmark(%)## (`) ##
^̂PPaasstt ppeerrffoorrmmaannccee mmaayy oorr mmaayy nnoott bbee ssuussttaaiinneedd iinn tthhee ffuuttuurree.. Returns greater than 1 year period are compounded annualized (CAGR). # CRISIL Liquid Fund Index ## CRISIL 1 year T-Bill IndexScheme performance may not strictly be comparable with that of its Additional Benchmark as the Scheme can invest only in instruments having maturity upto the opening of the immediately following specified transaction period, which is at quarterly intervals.
Sep 30, 13 Last 1 Year 17.1173 9.39 9.49 8.35 10,939 10,949 10,835Sep 28, 12 Last 2 Years 15.7150 9.13 9.01 7.00 11,915 11,889 11,453Sep 30, 11 Last 3 Years 14.2822 9.43 8.90 7.38 13,111 12,920 12,385Mar 30, 07 Since Inception 10.0000 8.71 7.57 6.10 18,725 17,298 15,597
Period Scheme Benchmark Additional ^ # Benchmark
##
B. Discrete 12 month returns (%)
Sep 30, 13 to Sep 30, 14 9.39 9.49 8.35
Sep 28, 12 to Sep 30, 13 8.87 8.54 5.66
Sep 30, 11 to Sep 28, 12 10.03 8.65 8.14
HDFC QUARTERLY INTERVAL FUND - PLAN A - RETAIL PLAN NAV as at September 30, 2014 ` 18.7249A. Cumulative performance
Period Scheme Benchmark^ #
B. Discrete 12 month returns (%)
Sep 30, 13 to Sep 30, 14 -11.99 -11.10Sep 28, 12 to Sep 30, 13 -6.13 -5.17Sep 30, 11 to Sep 28, 12 20.02 21.26
Date Period NAV Scheme Benchmark Value of investment of ` 10,000@ per Unit Returns Returns Scheme Benchmark
(`) (%)^ (%)# (`) (`)#
^̂PPaasstt ppeerrffoorrmmaannccee mmaayy oorr mmaayy nnoott bbee ssuussttaaiinneedd iinn tthhee ffuuttuurree.. Returns greater than 1 year period are compounded annualized (CAGR). # Domestic Price of Physical GoldSince inception returns are calculated on ` 1800.3288 (allotment price) *Currently, there are no Options being offered under the Scheme.
A. Cumulative performance
Sep 30, 13 Last 1 Year 2879.4160 -11.99 -11.10 9,912 8,890Sep 28, 12 Last 2 Years 3068.6080 -9.10 -8.17 8,259 8,428Sep 30, 11 Last 3 Years 2556.6449 -0.29 0.73 9,912 10,220Aug 13, 10 Since Inception 1800.3288 8.62 9.07 14,076 14,319
HDFC GOLD EXCHANGE TRADED FUND* NAV as at September 30, 2014 ` 2534.2309
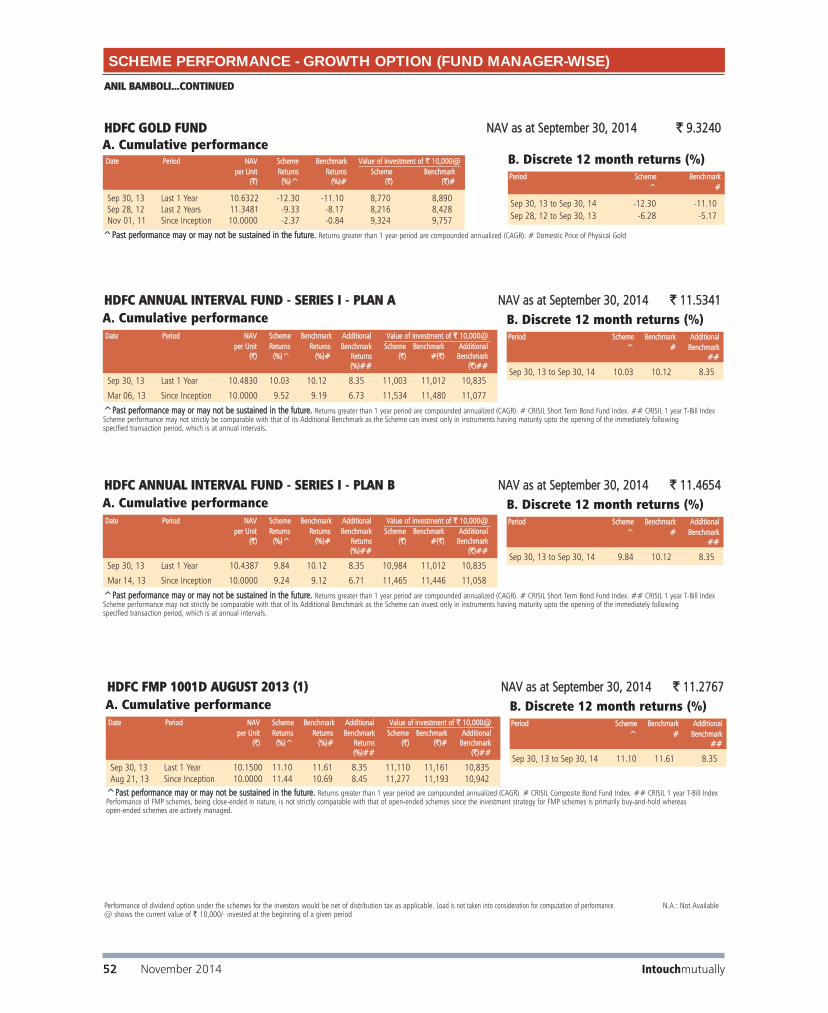
ANIL BAMBOLI...CONTINUED
Performance of dividend option under the schemes for the investors would be net of distribution tax as applicable. Load is not taken into consideration for computation of performance. N.A.: Not Available@ shows the current value of ` 10,000/- invested at the beginning of a given period
SCHEME PERFORMANCE - GROWTH OPTION (FUND MANAGER-WISE)
Intouchmutually52 November 2014
Date Period NAV Scheme Benchmark Additional Value of investment of ` 10,000@ per Unit Returns Returns Benchmark Scheme Benchmark Additional
(`) (%)^ (%)# Returns (`) #(`) Benchmark(%)## (`)##
^̂PPaasstt ppeerrffoorrmmaannccee mmaayy oorr mmaayy nnoott bbee ssuussttaaiinneedd iinn tthhee ffuuttuurree.. Returns greater than 1 year period are compounded annualized (CAGR). # CRISIL Short Term Bond Fund Index. ## CRISIL 1 year T-Bill IndexScheme performance may not strictly be comparable with that of its Additional Benchmark as the Scheme can invest only in instruments having maturity upto the opening of the immediately following specified transaction period, which is at annual intervals.
A. Cumulative performance
Sep 30, 13 Last 1 Year 10.4830 10.03 10.12 8.35 11,003 11,012 10,835
Mar 06, 13 Since Inception 10.0000 9.52 9.19 6.73 11,534 11,480 11,077
HDFC ANNUAL INTERVAL FUND - SERIES I - PLAN A NAV as at September 30, 2014 ` 11.5341
Period Scheme Benchmark Additional ^ # Benchmark
##
B. Discrete 12 month returns (%)
Sep 30, 13 to Sep 30, 14 10.03 10.12 8.35
Date Period NAV Scheme Benchmark Additional Value of investment of ` 10,000@ per Unit Returns Returns Benchmark Scheme Benchmark Additional
(`) (%)^ (%)# Returns (`) #(`) Benchmark(%)## (`)##
^̂PPaasstt ppeerrffoorrmmaannccee mmaayy oorr mmaayy nnoott bbee ssuussttaaiinneedd iinn tthhee ffuuttuurree.. Returns greater than 1 year period are compounded annualized (CAGR). # CRISIL Short Term Bond Fund Index. ## CRISIL 1 year T-Bill IndexScheme performance may not strictly be comparable with that of its Additional Benchmark as the Scheme can invest only in instruments having maturity upto the opening of the immediately following specified transaction period, which is at annual intervals.
A. Cumulative performance
Sep 30, 13 Last 1 Year 10.4387 9.84 10.12 8.35 10,984 11,012 10,835
Mar 14, 13 Since Inception 10.0000 9.24 9.12 6.71 11,465 11,446 11,058
HDFC ANNUAL INTERVAL FUND - SERIES I - PLAN B NAV as at September 30, 2014 ` 11.4654
Period Scheme Benchmark Additional ^ # Benchmark
##
B. Discrete 12 month returns (%)
Sep 30, 13 to Sep 30, 14 9.84 10.12 8.35
Period Scheme Benchmark^ #
B. Discrete 12 month returns (%)
Sep 30, 13 to Sep 30, 14 -12.30 -11.10Sep 28, 12 to Sep 30, 13 -6.28 -5.17
Date Period NAV Scheme Benchmark Value of investment of ` 10,000@ per Unit Returns Returns Scheme Benchmark
(`) (%)^ (%)# (`) (`)#
^̂PPaasstt ppeerrffoorrmmaannccee mmaayy oorr mmaayy nnoott bbee ssuussttaaiinneedd iinn tthhee ffuuttuurree.. Returns greater than 1 year period are compounded annualized (CAGR). # Domestic Price of Physical Gold
A. Cumulative performance
Sep 30, 13 Last 1 Year 10.6322 -12.30 -11.10 8,770 8,890Sep 28, 12 Last 2 Years 11.3481 -9.33 -8.17 8,216 8,428Nov 01, 11 Since Inception 10.0000 -2.37 -0.84 9,324 9,757
HDFC GOLD FUND NAV as at September 30, 2014 ` 9.3240
Date Period NAV Scheme Benchmark Additional Value of investment of ` 10,000@ per Unit Returns Returns Benchmark Scheme Benchmark Additional
(`) (%)^ (%)# Returns (`) (`)# Benchmark(%)## (`)##
^̂PPaasstt ppeerrffoorrmmaannccee mmaayy oorr mmaayy nnoott bbee ssuussttaaiinneedd iinn tthhee ffuuttuurree.. Returns greater than 1 year period are compounded annualized (CAGR). # CRISIL Composite Bond Fund Index. ## CRISIL 1 year T-Bill IndexPerformance of FMP schemes, being close-ended in nature, is not strictly comparable with that of open-ended schemes since the investment strategy for FMP schemes is primarily buy-and-hold whereas open-ended schemes are actively managed.
A. Cumulative performance
Sep 30, 13 Last 1 Year 10.1500 11.10 11.61 8.35 11,110 11,161 10,835Aug 21, 13 Since Inception 10.0000 11.44 10.69 8.45 11,277 11,193 10,942
HDFC FMP 1001D AUGUST 2013 (1) NAV as at September 30, 2014 ` 11.2767
Period Scheme Benchmark Additional ^ # Benchmark
##
B. Discrete 12 month returns (%)
Sep 30, 13 to Sep 30, 14 11.10 11.61 8.35

Performance of dividend option under the schemes for the investors would be net of distribution tax as applicable. Load is not taken into consideration for computation of performance. N.A.: Not Available@ shows the current value of ` 10,000/- invested at the beginning of a given period
ANIL BAMBOLI...CONTINUED
Intouchmutually November 2014 53
SCHEME PERFORMANCE - GROWTH OPTION (FUND MANAGER-WISE)
Date Period NAV Scheme Benchmark Additional Value of investment of ` 10,000@ per Unit Returns Returns Benchmark Scheme Benchmark Additional
(`) (%)^ (%)# Returns (`) (`)# Benchmark(%)## (`)##
^̂PPaasstt ppeerrffoorrmmaannccee mmaayy oorr mmaayy nnoott bbee ssuussttaaiinneedd iinn tthhee ffuuttuurree.. Returns greater than 1 year period are compounded annualized (CAGR). # CRISIL Composite Bond Fund Index. ## CRISIL 1 year T-Bill IndexPerformance of FMP schemes, being close-ended in nature, is not strictly comparable with that of open-ended schemes since the investment strategy for FMP schemes is primarily buy-and-hold whereas open-ended schemes are actively managed.
A. Cumulative performance
Sep 30, 13 Last 1 Year 10.2025 11.00 11.61 8.35 11,100 11,161 10,835Aug 14, 13 Since Inception 10.0000 11.65 11.34 8.69 11,325 11,289 10,986
HDFC FMP 1846D AUGUST 2013 (1) NAV as at September 30, 2014 ` 11.3250
Period Scheme Benchmark Additional ^ # Benchmark
##
B. Discrete 12 month returns (%)
Sep 30, 13 to Sep 30, 14 11.00 11.61 8.35
Date Period NAV Scheme Benchmark Additional Value of investment of ` 10,000@ per Unit Returns Returns Benchmark Scheme Benchmark Additional
(`) (%)^ (%)# Returns (`) (`)# Benchmark(%)## (`)##
^̂PPaasstt ppeerrffoorrmmaannccee mmaayy oorr mmaayy nnoott bbee ssuussttaaiinneedd iinn tthhee ffuuttuurree.. Returns greater than 1 year period are compounded annualized (CAGR). # CRISIL Composite Bond Fund Index. ## CRISIL 1 year T-Bill IndexPerformance of FMP schemes, being close-ended in nature, is not strictly comparable with that of open-ended schemes since the investment strategy for FMP schemes is primarily buy-and-hold whereas open-ended schemes are actively managed.
A. Cumulative performance
Sep 30, 13 Last 1 Year 10.0851 11.54 11.61 8.35 11,154 11,161 10,835Sep 04, 13 Since Inception 10.0000 11.62 10.82 8.35 11,249 11,164 10,897
HDFC FMP 1875D AUGUST 2013 (1) NAV as at September 30, 2014 ` 11.2493
Period Scheme Benchmark Additional ^ # Benchmark
##
B. Discrete 12 month returns (%)
Sep 30, 13 to Sep 30, 14 11.54 11.61 8.35
Date Period NAV Scheme Benchmark Additional Value of investment of ` 10,000@ per Unit Returns Returns Benchmark Scheme Benchmark Additional
(`) (%)^ (%)# Returns (`) (`)# Benchmark(%)## (`)##
^̂PPaasstt ppeerrffoorrmmaannccee mmaayy oorr mmaayy nnoott bbee ssuussttaaiinneedd iinn tthhee ffuuttuurree.. Returns greater than 1 year period are compounded annualized (CAGR). # CRISIL Short Term Bond Fund Index. ## CRISIL 1 year T-Bill IndexPerformance of FMP schemes, being close-ended in nature, is not strictly comparable with that of open-ended schemes since the investment strategy for FMP schemes is primarily buy-and-hold whereas open-ended schemes are actively managed.
A. Cumulative performance
Sep 30, 13 Last 1 Year 10.1504 9.71 10.12 8.35 10,971 11,012 10,835Aug 08, 13 Since Inception 10.0000 9.85 10.34 8.32 11,136 11,193 10,958
HDFC FMP 370D AUGUST 2013 (1) NAV as at September 30, 2014 ` 11.1363
Period Scheme Benchmark Additional ^ # Benchmark
##
B. Discrete 12 month returns (%)
Sep 30, 13 to Sep 30, 14 9.71 10.12 8.35
Date Period NAV Scheme Benchmark Additional Value of investment of ` 10,000@ per Unit Returns Returns Benchmark Scheme Benchmark Additional
(`) (%)^ (%)# Returns (`) (`)# Benchmark(%)## (`)##
^̂PPaasstt ppeerrffoorrmmaannccee mmaayy oorr mmaayy nnoott bbee ssuussttaaiinneedd iinn tthhee ffuuttuurree.. Returns greater than 1 year period are compounded annualized (CAGR). # CRISIL Composite Bond Fund Index. ## CRISIL 1 year T-Bill IndexPerformance of FMP schemes, being close-ended in nature, is not strictly comparable with that of open-ended schemes since the investment strategy for FMP schemes is primarily buy-and-hold whereas open-ended schemes are actively managed.
A. Cumulative performance
Sep 30, 13 Last 1 Year 10.1550 10.78 11.61 8.35 11,078 11,161 10,835Aug 06, 13 Since Inception 10.0000 10.78 9.85 8.32 11,250 11,142 10,964
HDFC FMP 1143D JULY 2013 (1) NAV as at September 30, 2014 ` 11.2500
Period Scheme Benchmark Additional ^ # Benchmark
##
B. Discrete 12 month returns (%)
Sep 30, 13 to Sep 30, 14 10.78 11.61 8.35
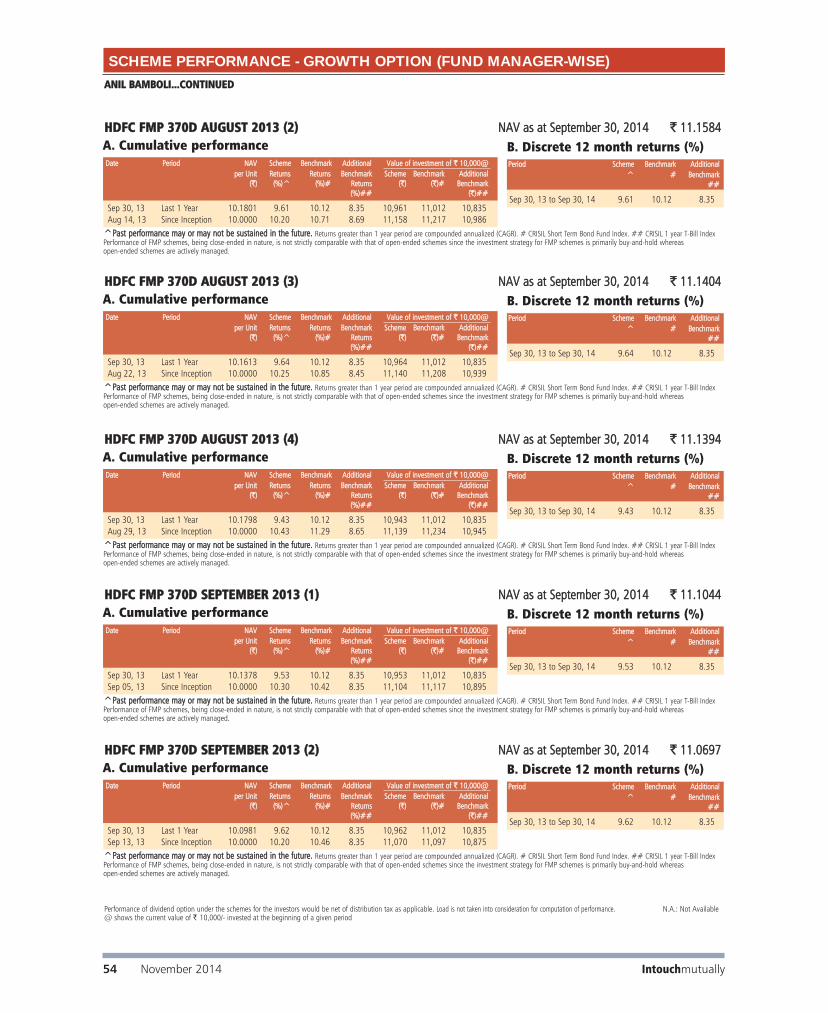
Performance of dividend option under the schemes for the investors would be net of distribution tax as applicable. Load is not taken into consideration for computation of performance. N.A.: Not Available@ shows the current value of ` 10,000/- invested at the beginning of a given period
ANIL BAMBOLI...CONTINUED
SCHEME PERFORMANCE - GROWTH OPTION (FUND MANAGER-WISE)
Intouchmutually54 November 2014
Date Period NAV Scheme Benchmark Additional Value of investment of ` 10,000@ per Unit Returns Returns Benchmark Scheme Benchmark Additional
(`) (%)^ (%)# Returns (`) (`)# Benchmark(%)## (`)##
^̂PPaasstt ppeerrffoorrmmaannccee mmaayy oorr mmaayy nnoott bbee ssuussttaaiinneedd iinn tthhee ffuuttuurree.. Returns greater than 1 year period are compounded annualized (CAGR). # CRISIL Short Term Bond Fund Index. ## CRISIL 1 year T-Bill IndexPerformance of FMP schemes, being close-ended in nature, is not strictly comparable with that of open-ended schemes since the investment strategy for FMP schemes is primarily buy-and-hold whereas open-ended schemes are actively managed.
A. Cumulative performance
Sep 30, 13 Last 1 Year 10.0981 9.62 10.12 8.35 10,962 11,012 10,835Sep 13, 13 Since Inception 10.0000 10.20 10.46 8.35 11,070 11,097 10,875
HDFC FMP 370D SEPTEMBER 2013 (2) NAV as at September 30, 2014 ` 11.0697
Period Scheme Benchmark Additional ^ # Benchmark
##
B. Discrete 12 month returns (%)
Sep 30, 13 to Sep 30, 14 9.62 10.12 8.35
Date Period NAV Scheme Benchmark Additional Value of investment of ` 10,000@ per Unit Returns Returns Benchmark Scheme Benchmark Additional
(`) (%)^ (%)# Returns (`) (`)# Benchmark(%)## (`)##
^̂PPaasstt ppeerrffoorrmmaannccee mmaayy oorr mmaayy nnoott bbee ssuussttaaiinneedd iinn tthhee ffuuttuurree.. Returns greater than 1 year period are compounded annualized (CAGR). # CRISIL Short Term Bond Fund Index. ## CRISIL 1 year T-Bill IndexPerformance of FMP schemes, being close-ended in nature, is not strictly comparable with that of open-ended schemes since the investment strategy for FMP schemes is primarily buy-and-hold whereas open-ended schemes are actively managed.
A. Cumulative performance
Sep 30, 13 Last 1 Year 10.1378 9.53 10.12 8.35 10,953 11,012 10,835Sep 05, 13 Since Inception 10.0000 10.30 10.42 8.35 11,104 11,117 10,895
HDFC FMP 370D SEPTEMBER 2013 (1) NAV as at September 30, 2014 ` 11.1044
Period Scheme Benchmark Additional ^ # Benchmark
##
B. Discrete 12 month returns (%)
Sep 30, 13 to Sep 30, 14 9.53 10.12 8.35
Date Period NAV Scheme Benchmark Additional Value of investment of ` 10,000@ per Unit Returns Returns Benchmark Scheme Benchmark Additional
(`) (%)^ (%)# Returns (`) (`)# Benchmark(%)## (`)##
^̂PPaasstt ppeerrffoorrmmaannccee mmaayy oorr mmaayy nnoott bbee ssuussttaaiinneedd iinn tthhee ffuuttuurree.. Returns greater than 1 year period are compounded annualized (CAGR). # CRISIL Short Term Bond Fund Index. ## CRISIL 1 year T-Bill IndexPerformance of FMP schemes, being close-ended in nature, is not strictly comparable with that of open-ended schemes since the investment strategy for FMP schemes is primarily buy-and-hold whereas open-ended schemes are actively managed.
A. Cumulative performance
Sep 30, 13 Last 1 Year 10.1798 9.43 10.12 8.35 10,943 11,012 10,835Aug 29, 13 Since Inception 10.0000 10.43 11.29 8.65 11,139 11,234 10,945
HDFC FMP 370D AUGUST 2013 (4) NAV as at September 30, 2014 ` 11.1394
Period Scheme Benchmark Additional ^ # Benchmark
##
B. Discrete 12 month returns (%)
Sep 30, 13 to Sep 30, 14 9.43 10.12 8.35
Date Period NAV Scheme Benchmark Additional Value of investment of ` 10,000@ per Unit Returns Returns Benchmark Scheme Benchmark Additional
(`) (%)^ (%)# Returns (`) (`)# Benchmark(%)## (`)##
^̂PPaasstt ppeerrffoorrmmaannccee mmaayy oorr mmaayy nnoott bbee ssuussttaaiinneedd iinn tthhee ffuuttuurree.. Returns greater than 1 year period are compounded annualized (CAGR). # CRISIL Short Term Bond Fund Index. ## CRISIL 1 year T-Bill IndexPerformance of FMP schemes, being close-ended in nature, is not strictly comparable with that of open-ended schemes since the investment strategy for FMP schemes is primarily buy-and-hold whereas open-ended schemes are actively managed.
A. Cumulative performance
Sep 30, 13 Last 1 Year 10.1613 9.64 10.12 8.35 10,964 11,012 10,835Aug 22, 13 Since Inception 10.0000 10.25 10.85 8.45 11,140 11,208 10,939
HDFC FMP 370D AUGUST 2013 (3) NAV as at September 30, 2014 ` 11.1404
Period Scheme Benchmark Additional ^ # Benchmark
##
B. Discrete 12 month returns (%)
Sep 30, 13 to Sep 30, 14 9.64 10.12 8.35
Date Period NAV Scheme Benchmark Additional Value of investment of ` 10,000@ per Unit Returns Returns Benchmark Scheme Benchmark Additional
(`) (%)^ (%)# Returns (`) (`)# Benchmark(%)## (`)##
^̂PPaasstt ppeerrffoorrmmaannccee mmaayy oorr mmaayy nnoott bbee ssuussttaaiinneedd iinn tthhee ffuuttuurree.. Returns greater than 1 year period are compounded annualized (CAGR). # CRISIL Short Term Bond Fund Index. ## CRISIL 1 year T-Bill IndexPerformance of FMP schemes, being close-ended in nature, is not strictly comparable with that of open-ended schemes since the investment strategy for FMP schemes is primarily buy-and-hold whereas open-ended schemes are actively managed.
A. Cumulative performance
Sep 30, 13 Last 1 Year 10.1801 9.61 10.12 8.35 10,961 11,012 10,835Aug 14, 13 Since Inception 10.0000 10.20 10.71 8.69 11,158 11,217 10,986
HDFC FMP 370D AUGUST 2013 (2) NAV as at September 30, 2014 ` 11.1584
Period Scheme Benchmark Additional ^ # Benchmark
##
B. Discrete 12 month returns (%)
Sep 30, 13 to Sep 30, 14 9.61 10.12 8.35
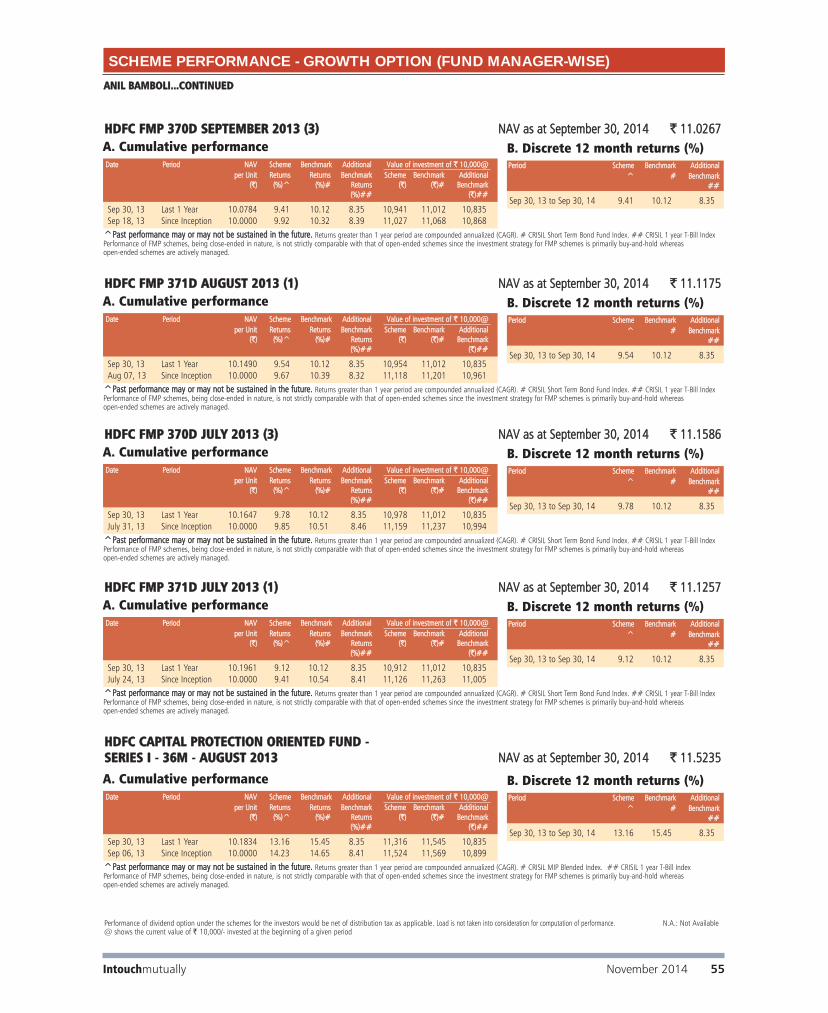
Intouchmutually November 2014 55
SCHEME PERFORMANCE - GROWTH OPTION (FUND MANAGER-WISE)
Date Period NAV Scheme Benchmark Additional Value of investment of ` 10,000@ per Unit Returns Returns Benchmark Scheme Benchmark Additional
(`) (%)^ (%)# Returns (`) (`)# Benchmark(%)## (`)##
^̂PPaasstt ppeerrffoorrmmaannccee mmaayy oorr mmaayy nnoott bbee ssuussttaaiinneedd iinn tthhee ffuuttuurree.. Returns greater than 1 year period are compounded annualized (CAGR). # CRISIL Short Term Bond Fund Index. ## CRISIL 1 year T-Bill IndexPerformance of FMP schemes, being close-ended in nature, is not strictly comparable with that of open-ended schemes since the investment strategy for FMP schemes is primarily buy-and-hold whereas open-ended schemes are actively managed.
A. Cumulative performance
Sep 30, 13 Last 1 Year 10.0784 9.41 10.12 8.35 10,941 11,012 10,835Sep 18, 13 Since Inception 10.0000 9.92 10.32 8.39 11,027 11,068 10,868
HDFC FMP 370D SEPTEMBER 2013 (3) NAV as at September 30, 2014 ` 11.0267
Period Scheme Benchmark Additional ^ # Benchmark
##
B. Discrete 12 month returns (%)
Sep 30, 13 to Sep 30, 14 9.41 10.12 8.35
Date Period NAV Scheme Benchmark Additional Value of investment of ` 10,000@ per Unit Returns Returns Benchmark Scheme Benchmark Additional
(`) (%)^ (%)# Returns (`) (`)# Benchmark(%)## (`)##
^̂PPaasstt ppeerrffoorrmmaannccee mmaayy oorr mmaayy nnoott bbee ssuussttaaiinneedd iinn tthhee ffuuttuurree.. Returns greater than 1 year period are compounded annualized (CAGR). # CRISIL MIP Blended Index. ## CRISIL 1 year T-Bill IndexPerformance of FMP schemes, being close-ended in nature, is not strictly comparable with that of open-ended schemes since the investment strategy for FMP schemes is primarily buy-and-hold whereas open-ended schemes are actively managed.
A. Cumulative performance
Sep 30, 13 Last 1 Year 10.1834 13.16 15.45 8.35 11,316 11,545 10,835Sep 06, 13 Since Inception 10.0000 14.23 14.65 8.41 11,524 11,569 10,899
HDFC CAPITAL PROTECTION ORIENTED FUND - SERIES I - 36M - AUGUST 2013 NAV as at September 30, 2014 ` 11.5235
Period Scheme Benchmark Additional ^ # Benchmark
##
B. Discrete 12 month returns (%)
Sep 30, 13 to Sep 30, 14 13.16 15.45 8.35
ANIL BAMBOLI...CONTINUED
Performance of dividend option under the schemes for the investors would be net of distribution tax as applicable. Load is not taken into consideration for computation of performance. N.A.: Not Available@ shows the current value of ` 10,000/- invested at the beginning of a given period
Date Period NAV Scheme Benchmark Additional Value of investment of ` 10,000@ per Unit Returns Returns Benchmark Scheme Benchmark Additional
(`) (%)^ (%)# Returns (`) (`)# Benchmark(%)## (`)##
^̂PPaasstt ppeerrffoorrmmaannccee mmaayy oorr mmaayy nnoott bbee ssuussttaaiinneedd iinn tthhee ffuuttuurree.. Returns greater than 1 year period are compounded annualized (CAGR). # CRISIL Short Term Bond Fund Index. ## CRISIL 1 year T-Bill IndexPerformance of FMP schemes, being close-ended in nature, is not strictly comparable with that of open-ended schemes since the investment strategy for FMP schemes is primarily buy-and-hold whereas open-ended schemes are actively managed.
A. Cumulative performance
Sep 30, 13 Last 1 Year 10.1490 9.54 10.12 8.35 10,954 11,012 10,835Aug 07, 13 Since Inception 10.0000 9.67 10.39 8.32 11,118 11,201 10,961
HDFC FMP 371D AUGUST 2013 (1) NAV as at September 30, 2014 ` 11.1175
Period Scheme Benchmark Additional ^ # Benchmark
##
B. Discrete 12 month returns (%)
Sep 30, 13 to Sep 30, 14 9.54 10.12 8.35
Date Period NAV Scheme Benchmark Additional Value of investment of ` 10,000@ per Unit Returns Returns Benchmark Scheme Benchmark Additional
(`) (%)^ (%)# Returns (`) (`)# Benchmark(%)## (`)##
^̂PPaasstt ppeerrffoorrmmaannccee mmaayy oorr mmaayy nnoott bbee ssuussttaaiinneedd iinn tthhee ffuuttuurree.. Returns greater than 1 year period are compounded annualized (CAGR). # CRISIL Short Term Bond Fund Index. ## CRISIL 1 year T-Bill IndexPerformance of FMP schemes, being close-ended in nature, is not strictly comparable with that of open-ended schemes since the investment strategy for FMP schemes is primarily buy-and-hold whereas open-ended schemes are actively managed.
A. Cumulative performance
Sep 30, 13 Last 1 Year 10.1647 9.78 10.12 8.35 10,978 11,012 10,835July 31, 13 Since Inception 10.0000 9.85 10.51 8.46 11,159 11,237 10,994
HDFC FMP 370D JULY 2013 (3) NAV as at September 30, 2014 ` 11.1586
Period Scheme Benchmark Additional ^ # Benchmark
##
B. Discrete 12 month returns (%)
Sep 30, 13 to Sep 30, 14 9.78 10.12 8.35
Date Period NAV Scheme Benchmark Additional Value of investment of ` 10,000@ per Unit Returns Returns Benchmark Scheme Benchmark Additional
(`) (%)^ (%)# Returns (`) (`)# Benchmark(%)## (`)##
^̂PPaasstt ppeerrffoorrmmaannccee mmaayy oorr mmaayy nnoott bbee ssuussttaaiinneedd iinn tthhee ffuuttuurree.. Returns greater than 1 year period are compounded annualized (CAGR). # CRISIL Short Term Bond Fund Index. ## CRISIL 1 year T-Bill IndexPerformance of FMP schemes, being close-ended in nature, is not strictly comparable with that of open-ended schemes since the investment strategy for FMP schemes is primarily buy-and-hold whereas open-ended schemes are actively managed.
A. Cumulative performance
Sep 30, 13 Last 1 Year 10.1961 9.12 10.12 8.35 10,912 11,012 10,835July 24, 13 Since Inception 10.0000 9.41 10.54 8.41 11,126 11,263 11,005
HDFC FMP 371D JULY 2013 (1) NAV as at September 30, 2014 ` 11.1257
Period Scheme Benchmark Additional ^ # Benchmark
##
B. Discrete 12 month returns (%)
Sep 30, 13 to Sep 30, 14 9.12 10.12 8.35

SCHEME PERFORMANCE - DIRECT PLAN - GROWTH OPTION (FUND MANAGER-WISE)
Date Period NAV Scheme Benchmark Additional Value of investment of ` 10,000@ per Unit Returns Returns Benchmark Scheme Benchmark Additional
(`) (%)^ (%)# Returns (`) #(`) Benchmark##(%) (`) ##
^̂PPaasstt ppeerrffoorrmmaannccee mmaayy oorr mmaayy nnoott bbee ssuussttaaiinneedd iinn tthhee ffuuttuurree.. Returns greater than 1 year period are compounded annualized (CAGR). # CNX 500 Index ## CNX Nifty Index
A. Cumulative performance
Sep 30, 13 Last 1 Year 257.126 74.34 46.08 38.87 17,434 14,608 13,887Jan 01, 13 Since Inception 296.876 26.63 18.28 18.18 15,100 13,405 13,384
Period Scheme Benchmark Additional ^ # Benchmark
##
B. Discrete 12 month returns (%)
Sep 30, 13 to Sep 30, 14 74.34 46.08 38.87
HDFC EQUITY FUND NAV as at September 30, 2014 ` 448.273
Date Period NAV Scheme Benchmark Additional Value of investment of ` 10,000@ per Unit Returns Returns Benchmark Scheme Benchmark Additional
(`) (%)^ (%)# Returns (`) #(`) Benchmark(%)## (`) ##
^̂PPaasstt ppeerrffoorrmmaannccee mmaayy oorr mmaayy nnoott bbee ssuussttaaiinneedd iinn tthhee ffuuttuurree.. Returns greater than 1 year period are compounded annualized (CAGR). # S&P BSE 200 ## S&P BSE SENSEX
A. Cumulative performance
Sep 30, 13 Last 1 Year 202.859 60.94 42.50 37.41 16,094 14,250 13,741Jan 01, 13 Since Inception 228.943 22.55 17.72 19.27 14,260 13,293 13,600
Period Scheme Benchmark Additional ^ # Benchmark
##
B. Discrete 12 month returns (%)
Sep 30, 13 to Sep 30, 14 60.94 42.50 37.41
HDFC TOP 200 FUND NAV as at September 30, 2014 ` 326.482
PRASHANT JAIN
Date Period NAV Scheme Benchmark Additional Value of investment of ` 10,000@ per Unit Returns Returns Benchmark Scheme Benchmark Additional
(`) (%)^ (%)# Returns (`) #(`) Benchmark(%)## (`) ##
^̂PPaasstt ppeerrffoorrmmaannccee mmaayy oorr mmaayy nnoott bbee ssuussttaaiinneedd iinn tthhee ffuuttuurree.. Returns greater than 1 year period are compounded annualized (CAGR). # CNX 500 Index ## CNX Nifty Index The Scheme is co-mmanaged by Prashant Jain and Srinivas Rao Ravuri.
A. Cumulative performance
Sep 30, 13 Last 1 Year 7.514 100.39 46.08 38.87 20,039 14,608 13,887Jan 01, 13 Since Inception 11.152 18.77 18.28 18.18 13,502 13,405 13,384
Period Scheme Benchmark Additional ^ # Benchmark
##
B. Discrete 12 month returns (%)
Sep 30, 13 to Sep 30, 14 100.39 46.08 38.87
HDFC INFRASTRUCTURE FUND NAV as at September 30, 2014 ` 15.057
Date Period NAV Scheme Benchmark Additional Value of investment of ` 10,000@ per Unit Returns Returns Benchmark Scheme Benchmark Additional
(`) (%)^ (%)# Returns (`) #(`) Benchmark(%)## (`) ##
^̂PPaasstt ppeerrffoorrmmaannccee mmaayy oorr mmaayy nnoott bbee ssuussttaaiinneedd iinn tthhee ffuuttuurree.. Returns greater than 1 year period are compounded annualized (CAGR). # CRISIL Balanced Fund Index ## CNX Nifty IndexScheme performance may not strictly be comparable with that of its Additional Benchmark in view of balanced nature of the scheme where a portion of scheme's investments are made in debt instruments
A. Cumulative performance
Sep 30, 13 Last 1 Year 209.495 69.19 28.89 38.87 16,919 12,889 13,887Jan 01, 13 Since Inception 243.322 24.05 14.50 18.18 14,567 12,666 13,384
Period Scheme Benchmark Additional ^ # Benchmark
##
B. Discrete 12 month returns (%)
Sep 30, 13 to Sep 30, 14 69.19 28.89 38.87
HDFC PRUDENCE FUND NAV as at September 30, 2014 ` 354.436
Performance of dividend option under the schemes for the investors would be net of distribution tax as applicable. Load is not taken into consideration for computation of performance. N.A.: Not Available@ shows the current value of ` 10,000/- invested at the beginning of a given period
Date Period NAV Scheme Benchmark Additional Value of investment of ` 10,000@ per Unit Returns Returns Benchmark Scheme Benchmark Additional
(`) (%)^ (%)# Returns (`) #(`) Benchmark(%)## (`) ##
^̂PPaasstt ppeerrffoorrmmaannccee mmaayy oorr mmaayy nnoott bbee ssuussttaaiinneedd iinn tthhee ffuuttuurree.. Returns greater than 1 year period are compounded annualized (CAGR). # CRISIL MIP Blended Index ## CRISIL 10 year Gilt IndexScheme performance may not strictly be comparable with that of its Additional Benchmark in view of hybrid nature of the scheme where a portion of scheme's investments are made in equity instruments.
The Scheme is co-mmanaged by Prashant Jain (Equities) and Shobhit Mehrotra (Debt).
A. Cumulative performance
Sep 30, 13 Last 1 Year 25.5984 26.59 15.45 6.85 12,659 11,545 10,685Jan 01, 13 Since Inception 26.4746 12.28 8.92 3.47 12,240 11,608 10,613
Period Scheme Benchmark Additional ^ # Benchmark
##
B. Discrete 12 month returns (%)
Sep 30, 13 to Sep 30, 14 26.59 15.45 6.85
HDFC MF MIP LONG TERM PLAN NAV as at September 30, 2014 ` 32.4040
Intouchmutually56 November 2014

VINAY KULKARNI
Date Period NAV Scheme Benchmark Additional Value of investment of ` 10,000@ per Unit Returns Returns Benchmark Scheme Benchmark Additional
(`) (%)^ (%)# Returns (`) (`)# Benchmark(%)## (`) ##
^̂PPaasstt ppeerrffoorrmmaannccee mmaayy oorr mmaayy nnoott bbee ssuussttaaiinneedd iinn tthhee ffuuttuurree.. Returns greater than 1 year period are compounded annualized (CAGR). # S&P BSE SENSEX (Total Returns Index) ## CNX Nifty Index
A. Cumulative performance
Sep 30, 13 Last 1 Year 164.1891 38.39 39.53 38.87 13,839 13,953 13,887Jan 01, 13 Since Inception 163.6338 20.70 21.29 18.18 13,886 14,005 13,384
Period Scheme Benchmark Additional ^ # Benchmark
##
B. Discrete 12 month returns (%)
Sep 30, 13 to Sep 30, 14 38.39 39.53 38.87
HDFC INDEX FUND - SENSEX PLAN NAV as at September 30, 2014 ` 227.2262
Date Period NAV Scheme Benchmark Additional Value of investment of ` 10,000@ per Unit Returns Returns Benchmark Scheme Benchmark Additional
(`) (%)^ (%)# Returns (`) (`)# Benchmark(%)## (`) ##
^̂PPaasstt ppeerrffoorrmmaannccee mmaayy oorr mmaayy nnoott bbee ssuussttaaiinneedd iinn tthhee ffuuttuurree.. Returns greater than 1 year period are compounded annualized (CAGR). # CNX 500 Index ## CNX Nifty Index
A. Cumulative performance
Sep 30, 13 Last 1 Year 23.701 73.63 46.08 38.87 17,363 14,608 13,887Jan 01, 13 Since Inception 28.957 22.31 18.28 18.18 14,211 13,405 13,384
Period Scheme Benchmark Additional ^ # Benchmark
##
B. Discrete 12 month returns (%)
Sep 30, 13 to Sep 30, 14 73.63 46.08 38.87
HDFC PREMIER MULTI-CCAP FUND NAV as at September 30, 2014 ` 41.152
Date Period NAV Scheme Benchmark Additional Value of investment of ` 10,000@ per Unit Returns Returns Benchmark Scheme Benchmark Additional
(`) (%)^ (%)# Returns (`) (`)# Benchmark(%)## (`) ##
^̂PPaasstt ppeerrffoorrmmaannccee mmaayy oorr mmaayy nnoott bbee ssuussttaaiinneedd iinn tthhee ffuuttuurree.. Returns greater than 1 year period are compounded annualized (CAGR). # S&P BSE 200 ## S&P BSE SENSEX
A. Cumulative performance
Sep 30, 13 Last 1 Year 32.122 75.81 42.50 37.41 17,581 14,250 13,741Jan 01, 13 Since Inception 40.302 21.33 17.72 19.27 14,012 13,293 13,600
Period Scheme Benchmark Additional ^ # Benchmark
##
B. Discrete 12 month returns (%)
Sep 30, 13 to Sep 30, 14 75.81 42.50 37.41
HDFC CORE & SATELLITE FUND NAV as at September 30, 2014 ` 56.473
SCHEME PERFORMANCE - DIRECT PLAN - GROWTH OPTION (FUND MANAGER-WISE)
Date Period NAV Scheme Benchmark Additional Value of investment of ` 10,000@ per Unit Returns Returns Benchmark Scheme Benchmark Additional
(`) (%)^ (%)# Returns (`) (`)# Benchmark(%)## (`) ##
^̂PPaasstt ppeerrffoorrmmaannccee mmaayy oorr mmaayy nnoott bbee ssuussttaaiinneedd iinn tthhee ffuuttuurree.. Returns greater than 1 year period are compounded annualized (CAGR). # CNX Nifty Index ## S&P BSE SENSEX
A. Cumulative performance
Sep 30, 13 Last 1 Year 63.371 34.27 38.87 37.41 13,427 13,887 13,741Jan 02, 13 Since Inception 67.276 14.43 17.73 18.84 12,647 13,290 13,508
Period Scheme Benchmark Additional ^ # Benchmark
##
B. Discrete 12 month returns (%)
Sep 30, 13 to Sep 30, 14 34.27 38.87 37.41
HDFC LARGE CAP FUND NAV as at September 30, 2014 ` 85.086
Performance of dividend option under the schemes for the investors would be net of distribution tax as applicable. Load is not taken into consideration for computation of performance. N.A.: Not Available@ shows the current value of ` 10,000/- invested at the beginning of a given period
Date Period NAV Scheme Benchmark Additional Value of investment of ` 10,000@ per Unit Returns Returns Benchmark Scheme Benchmark Additional
(`) (%)^ (%)# Returns (`) (`)# Benchmark(%)## (`) ##
^̂PPaasstt ppeerrffoorrmmaannccee mmaayy oorr mmaayy nnoott bbee ssuussttaaiinneedd iinn tthhee ffuuttuurree.. Returns greater than 1 year period are compounded annualized (CAGR). # CNX Nifty Index (Total Returns Index) ## S&P BSE SENSEX
A. Cumulative performance
Sep 30, 13 Last 1 Year 49.9309 40.11 40.51 37.41 14,011 14,051 13,741Jan 01, 13 Since Inception 51.3793 19.35 19.72 19.27 13,616 13,691 13,600
Period Scheme Benchmark Additional ^ # Benchmark
##
B. Discrete 12 month returns (%)
Sep 30, 13 to Sep 30, 14 40.11 40.51 37.41
HDFC INDEX FUND - NIFTY PLAN NAV as at September 30, 2014 ` 69.9578
Intouchmutually November 2014 57

Date Period NAV Scheme Benchmark Additional Value of investment of ` 10,000@ per Unit Returns Returns Benchmark Scheme Benchmark Additional
(`) (%)^ (%)# Returns (`) (`)# Benchmark(%)## (`) ##
^̂PPaasstt ppeerrffoorrmmaannccee mmaayy oorr mmaayy nnoott bbee ssuussttaaiinneedd iinn tthhee ffuuttuurree.. Returns greater than 1 year period are compounded annualized (CAGR). # CNX 500 Index ## CNX Nifty Index
A. Cumulative performance
Sep 30, 13 Last 1 Year 218.530 71.22 46.08 38.87 17,122 14,608 13,887Jan 01, 13 Since Inception 246.413 27.04 18.28 18.18 15,185 13,405 13,384
Period Scheme Benchmark Additional ^ # Benchmark
##
B. Discrete 12 month returns (%)
Sep 30, 13 to Sep 30, 14 71.22 46.08 38.87
HDFC TAXSAVER NAV as at September 30, 2014 ` 374.170
Date Period NAV Scheme Benchmark Additional Value of investment of ` 10,000@ per Unit Returns Returns Benchmark Scheme Benchmark Additional
(`) (%)^ (%)# Returns (`) (`)# Benchmark(%)## (`) ##
^̂PPaasstt ppeerrffoorrmmaannccee mmaayy oorr mmaayy nnoott bbee ssuussttaaiinneedd iinn tthhee ffuuttuurree.. Returns greater than 1 year period are compounded annualized (CAGR). # CRISIL MIP Blended Index ## CRISIL 10 year Gilt IndexScheme performance may not strictly be comparable with that of its Additional Benchmark in view of hybrid nature of the scheme where a portion of scheme's investments are made in equity instruments. The Scheme is co-mmanaged by Vinay Kulkarni (Equities) and Shobhit Mehrotra (Debt).
A. Cumulative performance
Sep 30, 13 Last 1 Year 19.5132 20.43 15.45 6.85 12,043 11,545 10,685Jan 01, 13 Since Inception 19.5587 11.09 8.92 3.47 12,015 11,608 10,613
Period Scheme Benchmark Additional ^ # Benchmark
##
B. Discrete 12 month returns (%)
Sep 30, 13 to Sep 30, 14 20.43 15.45 6.85
HDFC MF MIP SHORT TERM PLAN NAV as at September 30, 2014 ` 23.5007
SCHEME PERFORMANCE - DIRECT PLAN - GROWTH OPTION (FUND MANAGER-WISE)
Performance of dividend option under the schemes for the investors would be net of distribution tax as applicable. Load is not taken into consideration for computation of performance. N.A.: Not Available@ shows the current value of ` 10,000/- invested at the beginning of a given period
VINAY KULKARNI...CONTINUED
Date Period NAV Scheme Benchmark Additional Value of investment of ` 10,000@ per Unit Returns Returns Benchmark Scheme Benchmark Additional
(`) (%)^ (%)# Returns (`) (`)# Benchmark(%)## (`) ##
^̂PPaasstt ppeerrffoorrmmaannccee mmaayy oorr mmaayy nnoott bbee ssuussttaaiinneedd iinn tthhee ffuuttuurree.. Returns greater than 1 year period are compounded annualized (CAGR). # CRISIL MIP Blended Index ## CRISIL 1 year T-Bill IndexScheme performance may not strictly be comparable with that of its Additional Benchmark in view of hybrid nature of the scheme where a portion of scheme's investments are made in equity instruments. The Scheme is co-mmanaged by Vinay Kulkarni (Equities) and Anil Bamboli (Debt).
A. Cumulative performance
Sep 30, 13 Last 1 Year 21.3979 18.47 15.45 8.35 11,847 11,545 10,835Jan 01, 13 Since Inception 21.0517 11.23 8.92 6.89 12,042 11,608 11,233
Period Scheme Benchmark Additional ^ # Benchmark
##
B. Discrete 12 month returns (%)
Sep 30, 13 to Sep 30, 14 18.47 15.45 8.35
HDFC MULTIPLE YIELD FUND NAV as at September 30, 2014 ` 25.3505
MITEN LATHIA
Date Period NAV Scheme Benchmark Additional Value of investment of ` 10,000@ per Unit Returns Returns Benchmark Scheme Benchmark Additional
(`) (%)^ (%)# Returns (`) (`)# Benchmark(%)## (`) ##
^̂PPaasstt ppeerrffoorrmmaannccee mmaayy oorr mmaayy nnoott bbee ssuussttaaiinneedd iinn tthhee ffuuttuurree. Returns greater than 1 year period are compounded annualized (CAGR). # CNX 500 Index ## CNX Nifty IndexThe Scheme is co-mmanaged by Chirag Setalvad & Miten Lathia
A. Cumulative performance
Sep 30, 13 Last 1 Year 111.798 62.26 46.08 38.87 16,226 14,608 13,887Jan 01, 13 Since Inception 117.724 28.11 18.28 18.18 15,409 13,405 13,384
Period Scheme Benchmark Additional ^ # Benchmark
##
B. Discrete 12 month returns (%)
Sep 30, 13 to Sep 30, 14 62.26 46.08 38.87
HDFC CAPITAL BUILDER FUND NAV as at September 30, 2014 ` 181.401
Intouchmutually58 November 2014
Date Period NAV Scheme Benchmark Additional Value of investment of ` 10,000@ per Unit Returns Returns Benchmark Scheme Benchmark Additional
(`) (%)^ (%)# Returns (`) (`)# Benchmark(%)## (`) ##
^̂PPaasstt ppeerrffoorrmmaannccee mmaayy oorr mmaayy nnoott bbee ssuussttaaiinneedd iinn tthhee ffuuttuurree.. Returns greater than 1 year period are compounded annualized (CAGR). # S&P BSE SENSEX (Total Returns Index) ## CNX Nifty Index
A. Cumulative performance
Sep 30, 13 Last 1 Year 241.0449 43.85 39.53 38.87 14,385 13,953 13,887Jan 01, 13 Since Inception 251.2631 20.27 21.29 18.18 13,800 14,005 13,384
Period Scheme Benchmark Additional ^ # Benchmark
##
B. Discrete 12 month returns (%)
Sep 30, 13 to Sep 30, 14 43.85 39.53 38.87
HDFC INDEX FUND - SENSEX PLUS PLAN NAV as at September 30, 2014 ` 346.7318

SCHEME PERFORMANCE - DIRECT PLAN - GROWTH OPTION (FUND MANAGER-WISE)
Performance of dividend option under the schemes for the investors would be net of distribution tax as applicable. Load is not taken into consideration for computation of performance. N.A.: Not Available@ shows the current value of ` 10,000/- invested at the beginning of a given period
Date Period NAV Scheme Benchmark Additional Value of investment of ` 10,000@ per Unit Returns Returns Benchmark Scheme Benchmark Additional
(`) (%)^ (%)# Returns (`) (`)# Benchmark(%)## (`) ##
^̂PPaasstt ppeerrffoorrmmaannccee mmaayy oorr mmaayy nnoott bbee ssuussttaaiinneedd iinn tthhee ffuuttuurree.. Returns greater than 1 year period are compounded annualized (CAGR). # CNX Midcap Index ## CNX Nifty Index
A. Cumulative performance
Sep 30, 13 Last 1 Year 16.712 92.60 63.17 38.87 19,260 16,317 13,887Jan 01, 13 Since Inception 18.799 36.09 17.62 18.18 17,122 13,273 13,384
Period Scheme Benchmark Additional ^ # Benchmark
##
B. Discrete 12 month returns (%)
Sep 30, 13 to Sep 30, 14 92.60 63.17 38.87
HDFC MID-CCAP OPPORTUNITIES FUND NAV as at September 30, 2014 ` 32.187
Date Period NAV Scheme Benchmark Additional Value of investment of ` 10,000@ per Unit Returns Returns Benchmark Scheme Benchmark Additional
(`) (%)^ (%)# Returns (`) (`)# Benchmark(%)## (`) ##
^̂PPaasstt ppeerrffoorrmmaannccee mmaayy oorr mmaayy nnoott bbee ssuussttaaiinneedd iinn tthhee ffuuttuurree.. Returns greater than 1 year period are compounded annualized (CAGR). # CNX Smallcap Index ## CNX Nifty Index
A. Cumulative performance
Sep 30, 13 Last 1 Year 14.998 56.27 80.47 38.87 15,627 18,047 13,887Jan 02, 13 Since Inception 15.985 24.56 16.13 17.73 14,663 12,977 13,290
Period Scheme Benchmark Additional ^ # Benchmark
##
B. Discrete 12 month returns (%)
Sep 30, 13 to Sep 30, 14 56.27 80.47 38.87
HDFC SMALL AND MID CAP FUND NAV as at September 30, 2014 ` 23.438
CHIRAG SETALVAD
Date Period NAV Scheme Benchmark Additional Value of investment of ` 10,000@ per Unit Returns Returns Benchmark Scheme Benchmark Additional
(`) (%)^ (%)# Returns (`) (`)# Benchmark(%)## (`) ##
^̂PPaasstt ppeerrffoorrmmaannccee mmaayy oorr mmaayy nnoott bbee ssuussttaaiinneedd iinn tthhee ffuuttuurree. Returns greater than 1 year period are compounded annualized (CAGR). # CNX Balanced Fund Index ## CNX Nifty IndexThe Scheme is co-mmanaged by Chirag Setalvad & Miten Lathia
A. Cumulative performance
Sep 30, 13 Last 1 Year 111.798 62.26 46.08 38.87 16,226 14,608 13,887Jan 01, 13 Since Inception 117.724 28.11 18.28 18.18 15,409 13,405 13,384
Period Scheme Benchmark Additional ^ # Benchmark
##
B. Discrete 12 month returns (%)
Sep 30, 13 to Sep 30, 14 62.26 46.08 38.87
HDFC CAPITAL BUILDER FUND NAV as at September 30, 2014 ` 181.401
Date Period NAV Scheme Benchmark Additional Value of investment of ` 10,000@ per Unit Returns Returns Benchmark Scheme Benchmark Additional
(`) (%)^ (%)# Returns (`) (`)# Benchmark(%)## (`) ##
^̂PPaasstt ppeerrffoorrmmaannccee mmaayy oorr mmaayy nnoott bbee ssuussttaaiinneedd iinn tthhee ffuuttuurree.. Returns greater than 1 year period are compounded annualized (CAGR). # CRISIL Balanced Fund Index ## CNX Nifty IndexScheme performance may not strictly be comparable with that of its Additional Benchmark in view of balanced nature of the scheme where a portion of scheme's investments are made in debt instruments
A. Cumulative performance
Sep 30, 13 Last 1 Year 60.029 61.80 28.89 38.87 16,180 12,889 13,887Jan 01, 13 Since Inception 64.365 26.59 14.50 18.18 15,090 12,666 13,384
Period Scheme Benchmark Additional ^ # Benchmark
##
B. Discrete 12 month returns (%)
Sep 30, 13 to Sep 30, 14 61.80 28.89 38.87
HDFC BALANCED FUND NAV as at September 30, 2014 ` 97.129
Intouchmutually November 2014 59
MITEN LATHIA...CONTINUED
Date Period NAV Scheme Benchmark Additional Value of investment of ` 10,000@ per Unit Returns Returns Benchmark Scheme Benchmark Additional
(`) (%)^ (%)# Returns (`) (`)# Benchmark(%)## (`) ##
^̂PPaasstt ppeerrffoorrmmaannccee mmaayy oorr mmaayy nnoott bbee ssuussttaaiinneedd iinn tthhee ffuuttuurree. Returns greater than 1 year period are compounded annualized (CAGR). # CRISIL Balanced Fund Index ## CNX Nifty IndexScheme performance may not strictly be comparable with that of its Additional Benchmark in view of hybrid nature of the scheme where a portion of scheme's investments are made in equity instruments. The Scheme is co-mmanaged by Miten Lathia & Anil Bamboli
A. Cumulative performance
Sep 30, 13 Last 1 Year 11.1998 13.72 28.89 38.87 11,372 12,889 13,887Jan 02, 13 Since Inception 10.8980 9.36 14.20 17.73 11,687 12,603 13,290
Period Scheme Benchmark Additional ^ # Benchmark
##
B. Discrete 12 month returns (%)
Sep 30, 13 to Sep 30, 14 13.72 28.89 38.87
HDFC DYNAMIC PE RATIO FUND OF FUNDS NAV as at September 30, 2014 ` 12.7364
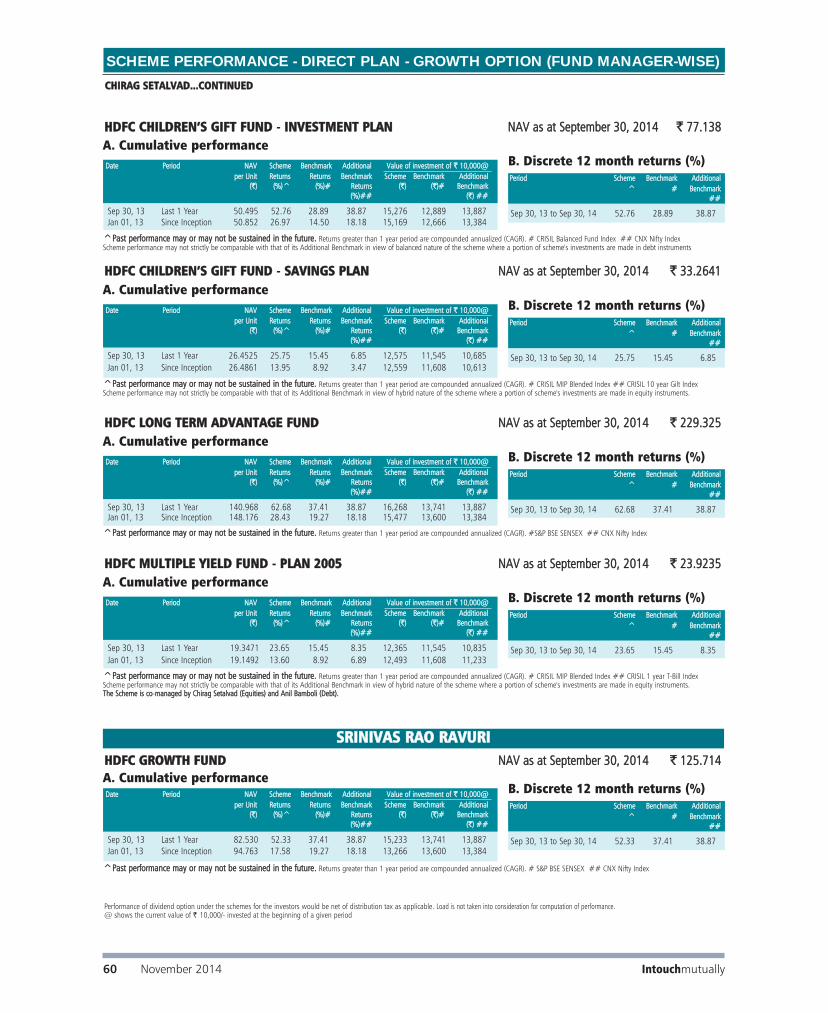
SCHEME PERFORMANCE - DIRECT PLAN - GROWTH OPTION (FUND MANAGER-WISE) CHIRAG SETALVAD...CONTINUED
Performance of dividend option under the schemes for the investors would be net of distribution tax as applicable. Load is not taken into consideration for computation of performance.@ shows the current value of ` 10,000/- invested at the beginning of a given period
Date Period NAV Scheme Benchmark Additional Value of investment of ` 10,000@ per Unit Returns Returns Benchmark Scheme Benchmark Additional
(`) (%)^ (%)# Returns (`) (`)# Benchmark(%)## (`) ##
^̂PPaasstt ppeerrffoorrmmaannccee mmaayy oorr mmaayy nnoott bbee ssuussttaaiinneedd iinn tthhee ffuuttuurree.. Returns greater than 1 year period are compounded annualized (CAGR). #S&P BSE SENSEX ## CNX Nifty Index
A. Cumulative performance
Sep 30, 13 Last 1 Year 140.968 62.68 37.41 38.87 16,268 13,741 13,887Jan 01, 13 Since Inception 148.176 28.43 19.27 18.18 15,477 13,600 13,384
Period Scheme Benchmark Additional ^ # Benchmark
##
B. Discrete 12 month returns (%)
Sep 30, 13 to Sep 30, 14 62.68 37.41 38.87
HDFC LONG TERM ADVANTAGE FUND NAV as at September 30, 2014 ` 229.325
Date Period NAV Scheme Benchmark Additional Value of investment of ` 10,000@ per Unit Returns Returns Benchmark Scheme Benchmark Additional
(`) (%)^ (%)# Returns (`) (`)# Benchmark(%)## (`) ##
^̂PPaasstt ppeerrffoorrmmaannccee mmaayy oorr mmaayy nnoott bbee ssuussttaaiinneedd iinn tthhee ffuuttuurree.. Returns greater than 1 year period are compounded annualized (CAGR). # CRISIL MIP Blended Index ## CRISIL 1 year T-Bill IndexScheme performance may not strictly be comparable with that of its Additional Benchmark in view of hybrid nature of the scheme where a portion of scheme's investments are made in equity instruments. The Scheme is co-mmanaged by Chirag Setalvad (Equities) and Anil Bamboli (Debt).
A. Cumulative performance
Sep 30, 13 Last 1 Year 19.3471 23.65 15.45 8.35 12,365 11,545 10,835Jan 01, 13 Since Inception 19.1492 13.60 8.92 6.89 12,493 11,608 11,233
Period Scheme Benchmark Additional ^ # Benchmark
##
B. Discrete 12 month returns (%)
Sep 30, 13 to Sep 30, 14 23.65 15.45 8.35
HDFC MULTIPLE YIELD FUND - PLAN 2005 NAV as at September 30, 2014 ` 23.9235
SRINIVAS RAO RAVURI
Date Period NAV Scheme Benchmark Additional Value of investment of ` 10,000@ per Unit Returns Returns Benchmark Scheme Benchmark Additional
(`) (%)^ (%)# Returns (`) (`)# Benchmark(%)## (`) ##
^̂PPaasstt ppeerrffoorrmmaannccee mmaayy oorr mmaayy nnoott bbee ssuussttaaiinneedd iinn tthhee ffuuttuurree.. Returns greater than 1 year period are compounded annualized (CAGR). # S&P BSE SENSEX ## CNX Nifty Index
A. Cumulative performance
Sep 30, 13 Last 1 Year 82.530 52.33 37.41 38.87 15,233 13,741 13,887Jan 01, 13 Since Inception 94.763 17.58 19.27 18.18 13,266 13,600 13,384
Period Scheme Benchmark Additional ^ # Benchmark
##
B. Discrete 12 month returns (%)
Sep 30, 13 to Sep 30, 14 52.33 37.41 38.87
HDFC GROWTH FUND NAV as at September 30, 2014 ` 125.714
Intouchmutually60 November 2014
Date Period NAV Scheme Benchmark Additional Value of investment of ` 10,000@ per Unit Returns Returns Benchmark Scheme Benchmark Additional
(`) (%)^ (%)# Returns (`) (`)# Benchmark(%)## (`) ##
^̂PPaasstt ppeerrffoorrmmaannccee mmaayy oorr mmaayy nnoott bbee ssuussttaaiinneedd iinn tthhee ffuuttuurree.. Returns greater than 1 year period are compounded annualized (CAGR). # CRISIL Balanced Fund Index ## CNX Nifty IndexScheme performance may not strictly be comparable with that of its Additional Benchmark in view of balanced nature of the scheme where a portion of scheme's investments are made in debt instruments
A. Cumulative performance
Sep 30, 13 Last 1 Year 50.495 52.76 28.89 38.87 15,276 12,889 13,887Jan 01, 13 Since Inception 50.852 26.97 14.50 18.18 15,169 12,666 13,384
Period Scheme Benchmark Additional ^ # Benchmark
##
B. Discrete 12 month returns (%)
Sep 30, 13 to Sep 30, 14 52.76 28.89 38.87
HDFC CHILDREN’S GIFT FUND - INVESTMENT PLAN NAV as at September 30, 2014 ` 77.138
Date Period NAV Scheme Benchmark Additional Value of investment of ` 10,000@ per Unit Returns Returns Benchmark Scheme Benchmark Additional
(`) (%)^ (%)# Returns (`) (`)# Benchmark(%)## (`) ##
^̂PPaasstt ppeerrffoorrmmaannccee mmaayy oorr mmaayy nnoott bbee ssuussttaaiinneedd iinn tthhee ffuuttuurree.. Returns greater than 1 year period are compounded annualized (CAGR). # CRISIL MIP Blended Index ## CRISIL 10 year Gilt IndexScheme performance may not strictly be comparable with that of its Additional Benchmark in view of hybrid nature of the scheme where a portion of scheme's investments are made in equity instruments.
A. Cumulative performance
Sep 30, 13 Last 1 Year 26.4525 25.75 15.45 6.85 12,575 11,545 10,685Jan 01, 13 Since Inception 26.4861 13.95 8.92 3.47 12,559 11,608 10,613
Period Scheme Benchmark Additional ^ # Benchmark
##
B. Discrete 12 month returns (%)
Sep 30, 13 to Sep 30, 14 25.75 15.45 6.85
HDFC CHILDREN’S GIFT FUND - SAVINGS PLAN NAV as at September 30, 2014 ` 33.2641
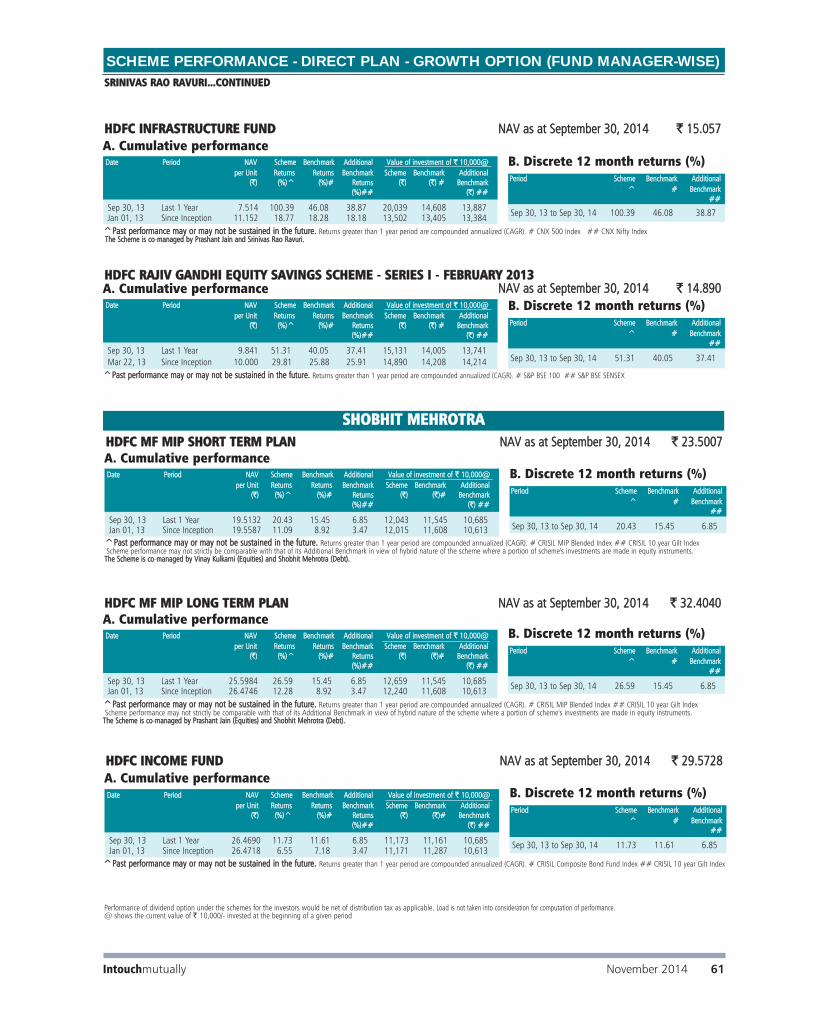
SCHEME PERFORMANCE - DIRECT PLAN - GROWTH OPTION (FUND MANAGER-WISE)
Performance of dividend option under the schemes for the investors would be net of distribution tax as applicable. Load is not taken into consideration for computation of performance.@ shows the current value of ` 10,000/- invested at the beginning of a given period
SHOBHIT MEHROTRA
Date Period NAV Scheme Benchmark Additional Value of investment of ` 10,000@ per Unit Returns Returns Benchmark Scheme Benchmark Additional
(`) (%)^ (%)# Returns (`) (`)# Benchmark(%)## (`) ##
^̂PPaasstt ppeerrffoorrmmaannccee mmaayy oorr mmaayy nnoott bbee ssuussttaaiinneedd iinn tthhee ffuuttuurree.. Returns greater than 1 year period are compounded annualized (CAGR). # CRISIL MIP Blended Index ## CRISIL 10 year Gilt IndexScheme performance may not strictly be comparable with that of its Additional Benchmark in view of hybrid nature of the scheme where a portion of scheme's investments are made in equity instruments.
The Scheme is co-mmanaged by Prashant Jain (Equities) and Shobhit Mehrotra (Debt).
A. Cumulative performance
Sep 30, 13 Last 1 Year 25.5984 26.59 15.45 6.85 12,659 11,545 10,685Jan 01, 13 Since Inception 26.4746 12.28 8.92 3.47 12,240 11,608 10,613
Period Scheme Benchmark Additional ^ # Benchmark
##
B. Discrete 12 month returns (%)
Sep 30, 13 to Sep 30, 14 26.59 15.45 6.85
HDFC MF MIP LONG TERM PLAN NAV as at September 30, 2014 ` 32.4040
Date Period NAV Scheme Benchmark Additional Value of investment of ` 10,000@ per Unit Returns Returns Benchmark Scheme Benchmark Additional
(`) (%)^ (%)# Returns (`) (`)# Benchmark(%)## (`) ##
^̂PPaasstt ppeerrffoorrmmaannccee mmaayy oorr mmaayy nnoott bbee ssuussttaaiinneedd iinn tthhee ffuuttuurree.. Returns greater than 1 year period are compounded annualized (CAGR). # CRISIL MIP Blended Index ## CRISIL 10 year Gilt IndexScheme performance may not strictly be comparable with that of its Additional Benchmark in view of hybrid nature of the scheme where a portion of scheme's investments are made in equity instruments.
The Scheme is co-mmanaged by Vinay Kulkarni (Equities) and Shobhit Mehrotra (Debt).
Sep 30, 13 Last 1 Year 19.5132 20.43 15.45 6.85 12,043 11,545 10,685Jan 01, 13 Since Inception 19.5587 11.09 8.92 3.47 12,015 11,608 10,613
Period Scheme Benchmark Additional ^ # Benchmark
##
B. Discrete 12 month returns (%)
Sep 30, 13 to Sep 30, 14 20.43 15.45 6.85
HDFC MF MIP SHORT TERM PLAN NAV as at September 30, 2014 ` 23.5007
Date Period NAV Scheme Benchmark Additional Value of investment of ` 10,000@ per Unit Returns Returns Benchmark Scheme Benchmark Additional
(`) (%)^ (%)# Returns (`) (`)# Benchmark(%)## (`) ##
^̂PPaasstt ppeerrffoorrmmaannccee mmaayy oorr mmaayy nnoott bbee ssuussttaaiinneedd iinn tthhee ffuuttuurree.. Returns greater than 1 year period are compounded annualized (CAGR). # CRISIL Composite Bond Fund Index ## CRISIL 10 year Gilt Index
A. Cumulative performance
Sep 30, 13 Last 1 Year 26.4690 11.73 11.61 6.85 11,173 11,161 10,685Jan 01, 13 Since Inception 26.4718 6.55 7.18 3.47 11,171 11,287 10,613
Period Scheme Benchmark Additional ^ # Benchmark
##
B. Discrete 12 month returns (%)
Sep 30, 13 to Sep 30, 14 11.73 11.61 6.85
HDFC INCOME FUND NAV as at September 30, 2014 ` 29.5728
Intouchmutually November 2014 61
Date Period NAV Scheme Benchmark Additional Value of investment of ` 10,000@ per Unit Returns Returns Benchmark Scheme Benchmark Additional
(`) (%)^ (%)# Returns (`) (`) # Benchmark(%)## (`) ##
^̂PPaasstt ppeerrffoorrmmaannccee mmaayy oorr mmaayy nnoott bbee ssuussttaaiinneedd iinn tthhee ffuuttuurree.. Returns greater than 1 year period are compounded annualized (CAGR). # CNX 500 Index ## CNX Nifty IndexThe Scheme is co-mmanaged by Prashant Jain and Srinivas Rao Ravuri.
A. Cumulative performance
Sep 30, 13 Last 1 Year 7.514 100.39 46.08 38.87 20,039 14,608 13,887Jan 01, 13 Since Inception 11.152 18.77 18.28 18.18 13,502 13,405 13,384
Period Scheme Benchmark Additional ^ # Benchmark
##
B. Discrete 12 month returns (%)
Sep 30, 13 to Sep 30, 14 100.39 46.08 38.87
HDFC INFRASTRUCTURE FUND NAV as at September 30, 2014 ` 15.057
Date Period NAV Scheme Benchmark Additional Value of investment of ` 10,000@ per Unit Returns Returns Benchmark Scheme Benchmark Additional
(`) (%)^ (%)# Returns (`) (`) # Benchmark(%)## (`) ##
^Past performance may or may not be sustained in the future. Returns greater than 1 year period are compounded annualized (CAGR). # S&P BSE 100 ## S&P BSE SENSEX
Sep 30, 13 Last 1 Year 9.841 51.31 40.05 37.41 15,131 14,005 13,741Mar 22, 13 Since Inception 10.000 29.81 25.88 25.91 14,890 14,208 14,214
Period Scheme Benchmark Additional ^ # Benchmark
##
B. Discrete 12 month returns (%)
Sep 30, 13 to Sep 30, 14 51.31 40.05 37.41
HDFC RAJIV GANDHI EQUITY SAVINGS SCHEME - SERIES I - FEBRUARY 2013 NAV as at September 30, 2014 ` 14.890
SRINIVAS RAO RAVURI...CONTINUED
A. Cumulative performance
A. Cumulative performance

Performance of dividend option under the schemes for the investors would be net of distribution tax as applicable. Load is not taken into consideration for computation of performance. N.A.: Not Available@ shows the current value of ` 10,000/- invested at the beginning of a given period
SCHEME PERFORMANCE - DIRECT PLAN - GROWTH OPTION (FUND MANAGER-WISE)
Date Period NAV Scheme Benchmark Additional Value of investment of ` 10,000@ per Unit Returns Returns Benchmark Scheme Benchmark Additional
(`) (%)^ (%)# Returns (`) (`)# Benchmark(%)## (`)##
^̂PPaasstt ppeerrffoorrmmaannccee mmaayy oorr mmaayy nnoott bbee ssuussttaaiinneedd iinn tthhee ffuuttuurree.. Returns greater than 1 year period are compounded annualized (CAGR). # CRISIL Liquid Fund Index ## CRISIL 1 year T-Bill Index
A. Cumulative performance
Sep 30, 13 Last 1 Year 21.2632 9.77 9.49 8.35 10,977 10,949 10,835Jan 01, 13 Since Inception 20.0689 9.04 9.19 6.89 11,631 11,657 11,233
Period Scheme Benchmark Additional ^ # Benchmark
##
B. Discrete 12 month returns (%)
Sep 30, 13 to Sep 30, 14 9.77 9.49 8.35
HDFC FLOATING RATE INCOME FUND - LTP NAV as at September 30, 2014 ` 23.3416
Date Period NAV Scheme Benchmark Additional Value of investment of ` 10,000@ per Unit Returns Returns Benchmark Scheme Benchmark Additional
(`) (%)^ (%)# Returns (`) (`)# Benchmark(%)## (`)##
^̂PPaasstt ppeerrffoorrmmaannccee mmaayy oorr mmaayy nnoott bbee ssuussttaaiinneedd iinn tthhee ffuuttuurree.. Returns greater than 1 year period are compounded annualized (CAGR). # CRISIL Composite Bond Fund Index. ## CRISIL 10 year Gilt Index
A. Cumulative performance
Sep 30, 13 Last 1 Year 13.0255 10.80 11.61 6.85 11,080 11,161 10,685Jan 01, 13 Since Inception 12.4504 8.83 7.18 3.47 11,592 11,287 10,613
HDFC MEDIUM TERM OPPORTUNITIES FUND NAV as at September 30, 2014 ` 14.4324
Period Scheme Benchmark Additional ^ # Benchmark
##
B. Discrete 12 month returns (%)
Sep 30, 13 to Sep 30, 14 10.80 11.61 6.85
SHOBHIT MEHROTRA...CONTINUED
Date Period NAV Scheme Benchmark Additional Value of investment of ` 10,000@ per Unit Returns Returns Benchmark Scheme Benchmark Additional
(`) (%)^ (%)# Returns (`) (`)# Benchmark(%)## (`)##
^̂PPaasstt ppeerrffoorrmmaannccee mmaayy oorr mmaayy nnoott bbee ssuussttaaiinneedd iinn tthhee ffuuttuurree.. Returns greater than 1 year period are compounded annualized (CAGR). # CRISIL Liquid Fund Index ## CRISIL 1 year T-Bill Index
A. Cumulative performance
Sep 23, 14 Last 7 days 26.4177 0.17 0.18 0.17 10,017 10,018 10,017Sep 15, 14 Last 15 days 26.3675 0.36 0.37 0.32 10,036 10,037 10,032Aug 31, 14 Last 1 Month 26.2747 0.71 N.A. N.A. 10,071 N.A. N.A.Sep 30, 13 Last 1 Year 24.1840 9.42 9.49 8.35 10,942 10,949 10,835Dec 31, 12 Since Inception 22.6510 9.31 9.18 6.91 11,683 11,660 11,238
Period Scheme Benchmark Additional ^ # Benchmark
##
B. Discrete 12 month returns (%)
Sep 30, 13 to Sep 30, 14 9.42 9.49 8.35
HDFC LIQUID FUND NAV as at September 30, 2014 ` 26.4624
Intouchmutually62 November 2014
Date Period NAV Scheme Benchmark Additional Value of investment of ` 10,000@ per Unit Returns Returns Benchmark Scheme Benchmark Additional
(`) (%)^ (%)# Returns (`) (`)# Benchmark(%)## (`)##
^̂PPaasstt ppeerrffoorrmmaannccee mmaayy oorr mmaayy nnoott bbee ssuussttaaiinneedd iinn tthhee ffuuttuurree.. Returns greater than 1 year period are compounded annualized (CAGR). # CRISIL Liquid Fund Index ## CRISIL 1 year T-Bill Index
A. Cumulative performance
Sep 30, 13 Last 1 Year 20.8956 9.68 9.49 8.35 10,968 10,949 10,835Jan 01, 13 Since Inception 19.6301 9.28 9.19 6.89 11,675 11,657 11,233
Period Scheme Benchmark Additional ^ # Benchmark
##
B. Discrete 12 month returns (%)
Sep 30, 13 to Sep 30, 14 9.68 9.49 8.35
HDFC FLOATING RATE INCOME FUND - STP - WHOLESALE OPTION NAV as at September 30, 2014 ` 22.9178
Date Period NAV Scheme Benchmark Additional Value of investment of ` 10,000@ per Unit Returns Returns Benchmark Scheme Benchmark Additional
(`) (%)^ (%)# Returns (`) (`)# Benchmark(%)## (`)##
^Past performance may or may not be sustained in the future. Returns greater than 1 year period are compounded annualized (CAGR). # CRISIL Short Term Bond Fund Index ## CRISIL 1 year T-Bill Index
Sep 30, 13 Last 1 Year 23.6726 11.15 10.12 8.35 11,115 11,012 10,835Jan 01, 13 Since Inception 22.6787 8.89 9.02 6.89 11,602 11,627 11,233
Period Scheme Benchmark Additional ^ # Benchmark
##
B. Discrete 12 month returns (%)
Sep 30, 13 to Sep 30, 14 11.15 10.12 8.35
HDFC HIGH INTEREST FUND - STP NAV as at September 30, 2014 ` 26.3121A. Cumulative performance

SCHEME PERFORMANCE - DIRECT PLAN - GROWTH OPTION (FUND MANAGER-WISE)
Performance of dividend option under the schemes for the investors would be net of distribution tax as applicable. Load is not taken into consideration for computation of performance. N.A.: Not Available@ shows the current value of ` 10,000/- invested at the beginning of a given period
Intouchmutually November 2014 63
Date Period NAV Scheme Benchmark Additional Value of investment of ` 10,000@ per Unit Returns Returns Benchmark Scheme Benchmark Additional
(`) (%)^ (%)# Returns (`) (`)# Benchmark(%)## (`)##
^̂PPaasstt ppeerrffoorrmmaannccee mmaayy oorr mmaayy nnoott bbee ssuussttaaiinneedd iinn tthhee ffuuttuurree.. Returns greater than 1 year period are compounded annualized (CAGR). # CRISIL Composite Bond Fund Index. ## CRISIL 1 year T-Bill IndexPerformance of FMP schemes, being close-ended in nature, is not strictly comparable with that of open-ended schemes since the investment strategy for FMP schemes is primarily buy-and-hold whereas open-ended schemes are actively managed.
A. Cumulative performance
Sep 30, 13 Last 1 Year 10.2166 12.34 11.61 8.35 11,234 11,161 10,835Jan 08, 13 Since Inception 10.0000 8.31 6.97 6.81 11,477 11,233 11,205
HDFC FMP 1919D JANUARY 2013 (1) NAV as at September 30, 2014 ` 11.4773
Period Scheme Benchmark Additional ^ # Benchmark
##
B. Discrete 12 month returns (%)
Sep 30, 13 to Sep 30, 14 12.34 11.61 8.35
Date Period NAV Scheme Benchmark Additional Value of investment of ` 10,000@ per Unit Returns Returns Benchmark Scheme Benchmark Additional
(`) (%)^ (%)# Returns (`) (`)# Benchmark(%)## (`)##
^̂PPaasstt ppeerrffoorrmmaannccee mmaayy oorr mmaayy nnoott bbee ssuussttaaiinneedd iinn tthhee ffuuttuurree.. Returns greater than 1 year period are compounded annualized (CAGR). # CRISIL Short Term Bond Fund Index. ## CRISIL 1 year T-Bill IndexPerformance of FMP schemes, being close-ended in nature, is not strictly comparable with that of open-ended schemes since the investment strategy for FMP schemes is primarily buy-and-hold whereas open-ended schemes are actively managed.
A. Cumulative performance
Sep 30, 13 Last 1 Year 10.0631 9.71 10.12 8.35 10,971 11,012 10,835Sep 19, 13 Since Inception 10.0000 10.08 10.00 8.39 11,040 11,032 10,866
HDFC FMP 370D SEPTEMBER 2013 (4) NAV as at September 30, 2014 ` 11.0399
Period Scheme Benchmark Additional ^ # Benchmark
##
B. Discrete 12 month returns (%)
Sep 30, 13 to Sep 30, 14 9.71 10.12 8.35
SHOBHIT MEHROTRA...CONTINUED
Date Period NAV Scheme Benchmark Additional Value of investment of ` 10,000@ per Unit Returns Returns Benchmark Scheme Benchmark Additional
(`) (%)^ (%)# Returns (`) (`)# Benchmark(%)## (`)##
^̂PPaasstt ppeerrffoorrmmaannccee mmaayy oorr mmaayy nnoott bbee ssuussttaaiinneedd iinn tthhee ffuuttuurree.. Returns greater than 1 year period are compounded annualized (CAGR). # CRISIL Composite Bond Fund Index. ## CRISIL 1 year T-Bill IndexPerformance of FMP schemes, being close-ended in nature, is not strictly comparable with that of open-ended schemes since the investment strategy for FMP schemes is primarily buy-and-hold whereas open-ended schemes are actively managed.
A. Cumulative performance
Sep 30, 13 Last 1 Year 10.3440 11.13 11.61 8.35 11,113 11,161 10,835Feb 13, 13 Since Inception 10.0000 8.94 6.95 6.72 11,495 11,156 11,117
HDFC FMP 1198D FEBRUARY 2013 (1) NAV as at September 30, 2014 ` 11.4952
Period Scheme Benchmark Additional ^ # Benchmark
##
B. Discrete 12 month returns (%)
Sep 30, 13 to Sep 30, 14 11.13 11.61 8.35
Date Period NAV Scheme Benchmark Additional Value of investment of ` 10,000@ per Unit Returns Returns Benchmark Scheme Benchmark Additional
(`) (%)^ (%)# Returns (`) (`)# Benchmark(%)## (`)##
^̂PPaasstt ppeerrffoorrmmaannccee mmaayy oorr mmaayy nnoott bbee ssuussttaaiinneedd iinn tthhee ffuuttuurree.. Returns greater than 1 year period are compounded annualized (CAGR). # CRISIL Composite Bond Fund Index. ## CRISIL 1 year T-Bill IndexPerformance of FMP schemes, being close-ended in nature, is not strictly comparable with that of open-ended schemes since the investment strategy for FMP schemes is primarily buy-and-hold whereas open-ended schemes are actively managed.
A. Cumulative performance
Sep 30, 13 Last 1 Year 9.9160 11.99 11.61 8.35 11,199 11,161 10,835May 23, 13 Since Inception 10.0016 8.02 4.17 6.18 11,103 10,570 10,848
HDFC FMP 1107D MAY 2013 (1) NAV as at September 30, 2014 ` 11.1046
Period Scheme Benchmark Additional ^ # Benchmark
##
B. Discrete 12 month returns (%)
Sep 30, 13 to Sep 30, 14 11.99 11.61 8.35
Date Period NAV Scheme Benchmark Additional Value of investment of ` 10,000@ per Unit Returns Returns Benchmark Scheme Benchmark Additional
(`) (%)^ (%)# Returns (`) (`)# Benchmark(%)## (`)##
^̂PPaasstt ppeerrffoorrmmaannccee mmaayy oorr mmaayy nnoott bbee ssuussttaaiinneedd iinn tthhee ffuuttuurree.. Returns greater than 1 year period are compounded annualized (CAGR). # CRISIL Short Term Bond Fund Index. ## CRISIL 1 year T-Bill IndexPerformance of FMP schemes, being close-ended in nature, is not strictly comparable with that of open-ended schemes since the investment strategy for FMP schemes is primarily buy-and-hold whereas open-ended schemes are actively managed.
A. Cumulative performance
Sep 30, 13 Last 1 Year 10.0136 10.59 10.12 8.35 11,059 11,012 10,835Sep 25, 13 Since Inception 10.0000 10.58 10.26 8.47 11,074 11,040 10,859
HDFC FMP 742D SEPTEMBER 2013 (1) NAV as at September 30, 2014 ` 11.0736
Period Scheme Benchmark Additional ^ # Benchmark
##
B. Discrete 12 month returns (%)
Sep 30, 13 to Sep 30, 14 10.59 10.12 8.35
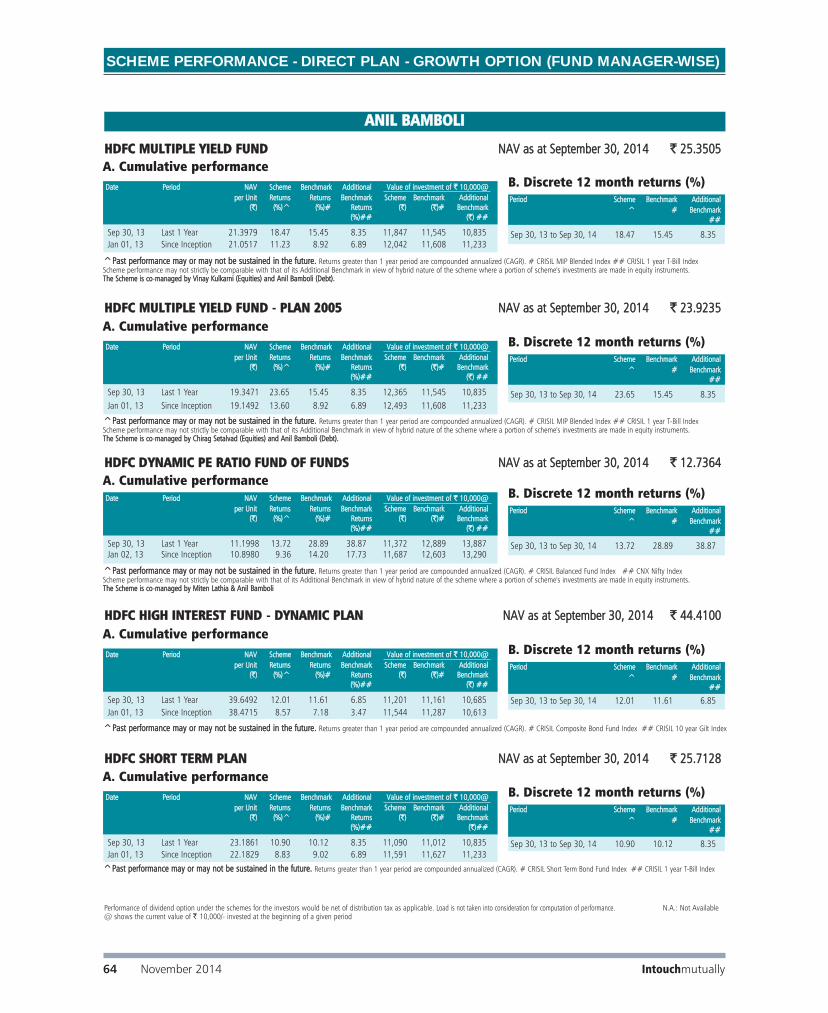
SCHEME PERFORMANCE - DIRECT PLAN - GROWTH OPTION (FUND MANAGER-WISE)
Performance of dividend option under the schemes for the investors would be net of distribution tax as applicable. Load is not taken into consideration for computation of performance. N.A.: Not Available@ shows the current value of ` 10,000/- invested at the beginning of a given period
Intouchmutually64 November 2014
Date Period NAV Scheme Benchmark Additional Value of investment of ` 10,000@ per Unit Returns Returns Benchmark Scheme Benchmark Additional
(`) (%)^ (%)# Returns (`) (`)# Benchmark(%)## (`)##
^̂PPaasstt ppeerrffoorrmmaannccee mmaayy oorr mmaayy nnoott bbee ssuussttaaiinneedd iinn tthhee ffuuttuurree.. Returns greater than 1 year period are compounded annualized (CAGR). # CRISIL Short Term Bond Fund Index ## CRISIL 1 year T-Bill Index
A. Cumulative performance
Sep 30, 13 Last 1 Year 23.1861 10.90 10.12 8.35 11,090 11,012 10,835Jan 01, 13 Since Inception 22.1829 8.83 9.02 6.89 11,591 11,627 11,233
Period Scheme Benchmark Additional ^ # Benchmark
##
B. Discrete 12 month returns (%)
Sep 30, 13 to Sep 30, 14 10.90 10.12 8.35
HDFC SHORT TERM PLAN NAV as at September 30, 2014 ` 25.7128
Date Period NAV Scheme Benchmark Additional Value of investment of ` 10,000@ per Unit Returns Returns Benchmark Scheme Benchmark Additional
(`) (%)^ (%)# Returns (`) (`)# Benchmark(%)## (`) ##
^̂PPaasstt ppeerrffoorrmmaannccee mmaayy oorr mmaayy nnoott bbee ssuussttaaiinneedd iinn tthhee ffuuttuurree.. Returns greater than 1 year period are compounded annualized (CAGR). # CRISIL Composite Bond Fund Index ## CRISIL 10 year Gilt Index
A. Cumulative performance
Sep 30, 13 Last 1 Year 39.6492 12.01 11.61 6.85 11,201 11,161 10,685Jan 01, 13 Since Inception 38.4715 8.57 7.18 3.47 11,544 11,287 10,613
Period Scheme Benchmark Additional ^ # Benchmark
##
B. Discrete 12 month returns (%)
Sep 30, 13 to Sep 30, 14 12.01 11.61 6.85
HDFC HIGH INTEREST FUND - DYNAMIC PLAN NAV as at September 30, 2014 ` 44.4100
Date Period NAV Scheme Benchmark Additional Value of investment of ` 10,000@ per Unit Returns Returns Benchmark Scheme Benchmark Additional
(`) (%)^ (%)# Returns (`) (`)# Benchmark(%)## (`) ##
^̂PPaasstt ppeerrffoorrmmaannccee mmaayy oorr mmaayy nnoott bbee ssuussttaaiinneedd iinn tthhee ffuuttuurree.. Returns greater than 1 year period are compounded annualized (CAGR). # CRISIL MIP Blended Index ## CRISIL 1 year T-Bill IndexScheme performance may not strictly be comparable with that of its Additional Benchmark in view of hybrid nature of the scheme where a portion of scheme's investments are made in equity instruments. The Scheme is co-mmanaged by Chirag Setalvad (Equities) and Anil Bamboli (Debt).
A. Cumulative performance
Sep 30, 13 Last 1 Year 19.3471 23.65 15.45 8.35 12,365 11,545 10,835Jan 01, 13 Since Inception 19.1492 13.60 8.92 6.89 12,493 11,608 11,233
Period Scheme Benchmark Additional ^ # Benchmark
##
B. Discrete 12 month returns (%)
Sep 30, 13 to Sep 30, 14 23.65 15.45 8.35
HDFC MULTIPLE YIELD FUND - PLAN 2005 NAV as at September 30, 2014 ` 23.9235
Date Period NAV Scheme Benchmark Additional Value of investment of ` 10,000@ per Unit Returns Returns Benchmark Scheme Benchmark Additional
(`) (%)^ (%)# Returns (`) (`)# Benchmark(%)## (`) ##
^̂PPaasstt ppeerrffoorrmmaannccee mmaayy oorr mmaayy nnoott bbee ssuussttaaiinneedd iinn tthhee ffuuttuurree. Returns greater than 1 year period are compounded annualized (CAGR). # CRISIL Balanced Fund Index ## CNX Nifty IndexScheme performance may not strictly be comparable with that of its Additional Benchmark in view of hybrid nature of the scheme where a portion of scheme's investments are made in equity instruments. The Scheme is co-mmanaged by Miten Lathia & Anil Bamboli
A. Cumulative performance
Sep 30, 13 Last 1 Year 11.1998 13.72 28.89 38.87 11,372 12,889 13,887Jan 02, 13 Since Inception 10.8980 9.36 14.20 17.73 11,687 12,603 13,290
Period Scheme Benchmark Additional ^ # Benchmark
##
B. Discrete 12 month returns (%)
Sep 30, 13 to Sep 30, 14 13.72 28.89 38.87
HDFC DYNAMIC PE RATIO FUND OF FUNDS NAV as at September 30, 2014 ` 12.7364
ANIL BAMBOLI
Date Period NAV Scheme Benchmark Additional Value of investment of ` 10,000@ per Unit Returns Returns Benchmark Scheme Benchmark Additional
(`) (%)^ (%)# Returns (`) (`)# Benchmark(%)## (`) ##
^̂PPaasstt ppeerrffoorrmmaannccee mmaayy oorr mmaayy nnoott bbee ssuussttaaiinneedd iinn tthhee ffuuttuurree.. Returns greater than 1 year period are compounded annualized (CAGR). # CRISIL MIP Blended Index ## CRISIL 1 year T-Bill IndexScheme performance may not strictly be comparable with that of its Additional Benchmark in view of hybrid nature of the scheme where a portion of scheme's investments are made in equity instruments. The Scheme is co-mmanaged by Vinay Kulkarni (Equities) and Anil Bamboli (Debt).
A. Cumulative performance
Sep 30, 13 Last 1 Year 21.3979 18.47 15.45 8.35 11,847 11,545 10,835Jan 01, 13 Since Inception 21.0517 11.23 8.92 6.89 12,042 11,608 11,233
Period Scheme Benchmark Additional ^ # Benchmark
##
B. Discrete 12 month returns (%)
Sep 30, 13 to Sep 30, 14 18.47 15.45 8.35
HDFC MULTIPLE YIELD FUND NAV as at September 30, 2014 ` 25.3505

ANIL BAMBOLI...CONTINUED
SCHEME PERFORMANCE - DIRECT PLAN - GROWTH OPTION (FUND MANAGER-WISE)
Performance of dividend option under the schemes for the investors would be net of distribution tax as applicable. Load is not taken into consideration for computation of performance. N.A.: Not Available@ shows the current value of ` 10,000/- invested at the beginning of a given period
Intouchmutually November 2014 65
Date Period NAV Scheme Benchmark Additional Value of investment of ` 10,000@ per Unit Returns Returns Benchmark Scheme Benchmark Additional
(`) (%)^ (%)# Returns (`) (`)# Benchmark(%)## (`)##
^̂PPaasstt ppeerrffoorrmmaannccee mmaayy oorr mmaayy nnoott bbee ssuussttaaiinneedd iinn tthhee ffuuttuurree.. Returns greater than 1 year period are compounded annualized (CAGR). # CRISIL Liquid Fund Index ## CRISIL 1 year T-Bill Index
Sep 23, 14 Last 7 days 27.9528 0.17 0.18 0.17 10,017 10,018 10,017Sep 15, 14 Last 15 days 27.8996 0.36 0.37 0.32 10,036 10,037 10,032Aug 31, 14 Last 1 Month 27.8016 0.71 N.A. N.A. 10,071 N.A. N.A.Sep 30, 13 Last 1 Year 25.5987 9.38 9.49 8.35 10,938 10,949 10,835Dec 31, 12 Since Inception 23.9920 9.24 9.18 6.91 11,671 11,660 11,238
Period Scheme Benchmark Additional ^ # Benchmark
##
B. Discrete 12 month returns (%)
Sep 30, 13 to Sep 30, 14 9.38 9.49 8.35
HDFC CASH MANAGEMENT FUND - SAVINGS PLAN NAV as at September 30, 2014 ` 28.0002A. Cumulative performance
Date Period NAV Scheme Benchmark Additional Value of investment of ` 10,000@ per Unit Returns Returns Benchmark Scheme Benchmark Additional
(`) (%)^ (%)# Returns (`) (`)# Benchmark(%)## (`) ##
^̂PPaasstt ppeerrffoorrmmaannccee mmaayy oorr mmaayy nnoott bbee ssuussttaaiinneedd iinn tthhee ffuuttuurree.. Returns greater than 1 year period are compounded annualized (CAGR). # CRISIL Liquid Fund Index ## CRISIL 1 year T-Bill Index
Sep 30, 13 Last 1 Year 26.2073 9.42 9.49 8.35 10,942 10,949 10,835
Jan 01, 13 Since Inception 24.6535 9.05 9.19 6.89 11,632 11,657 11,233
Period Scheme Benchmark Additional ^ # Benchmark
##
B. Discrete 12 month returns (%)
Sep 30, 13 to Sep 30, 14 9.42 9.49 8.35
HDFC CASH MANAGEMENT FUND - TREASURY ADVANTAGE PLAN - RETAIL OPTIONNAV as at September 30, 2014 ` 28.6763A. Cumulative performance
Date Period NAV Scheme Benchmark Additional Value of investment of ` 10,000@ per Unit Returns Returns Benchmark Scheme Benchmark Additional
(`) (%)^ (%)# Returns (`) (`)# Benchmark(%)## (`) ##
^̂PPaasstt ppeerrffoorrmmaannccee mmaayy oorr mmaayy nnoott bbee ssuussttaaiinneedd iinn tthhee ffuuttuurree.. Returns greater than 1 year period are compounded annualized (CAGR). # I-Sec Li-Bex ## CRISIL 10 year Gilt Index
A. Cumulative performance
Sep 30, 13 Last 1 Year 22.6550 12.34 12.85 6.85 11,234 11,285 10,685Jan 01, 13 Since Inception 22.9789 6.03 6.63 3.47 11,076 11,186 10,613
Period Scheme Benchmark Additional ^ # Benchmark
##
B. Discrete 12 month returns (%)
Sep 30, 13 to Sep 30, 14 12.34 12.85 6.85
HDFC GILT FUND - LONG TERM PLAN NAV as at September 30, 2014 ` 25.4515
Date Period NAV Scheme Benchmark Additional Value of investment of ` 10,000@ per Unit Returns Returns Benchmark Scheme Benchmark Additional
(`) (%)^ (%)# Returns (`) (`)# Benchmark(%)## (`) ##
^̂PPaasstt ppeerrffoorrmmaannccee mmaayy oorr mmaayy nnoott bbee ssuussttaaiinneedd iinn tthhee ffuuttuurree.. Returns greater than 1 year period are compounded annualized (CAGR). # I-Sec Si-Bex ## CRISIL 1 year T-Bill Index
Sep 30, 13 Last 1 Year 19.7652 9.63 8.93 8.35 10,963 10,893 10,835Jan 01, 13 Since Inception 19.0767 7.57 7.85 6.89 11,358 11,409 11,233
Period Scheme Benchmark Additional ^ # Benchmark
##
B. Discrete 12 month returns (%)
Sep 30, 13 to Sep 30, 14 9.63 8.93 8.35
HDFC GILT FUND - SHORT TERM PLAN NAV as at September 30, 2014 ` 21.6677A. Cumulative performance
Period Scheme Benchmark Additional ^ # Benchmark
##
B. Discrete 12 month returns (%)
Sep 30, 13 to Sep 30, 14 10.55 10.12 8.35
Date Period NAV Scheme Benchmark Additional Value of investment of ` 10,000@ per Unit Returns Returns Benchmark Scheme Benchmark Additional
(`) (%)^ (%)# Returns (`) (`)# Benchmark(%)## (`) ##
^̂PPaasstt ppeerrffoorrmmaannccee mmaayy oorr mmaayy nnoott bbee ssuussttaaiinneedd iinn tthhee ffuuttuurree.. Returns greater than 1 year period are compounded annualized (CAGR). # CRISIL Short-Term Bond Fund Index. ## CRISIL 1 year T-Bill Index
A. Cumulative performance
Sep 30, 13 Last 1 Year 13.1322 10.55 10.12 8.35 11,055 11,012 10,835Jan 01, 13 Since Inception 12.4477 9.21 9.02 6.89 11,662 11,627 11,233
HDFC SHORT TERM OPPORTUNITIES FUND NAV as at September 30, 2014 ` 14.5171

SCHEME PERFORMANCE - DIRECT PLAN - GROWTH OPTION (FUND MANAGER-WISE)
Intouchmutually66 November 2014
Date Period NAV Scheme Benchmark Additional Value of investment of ` 10,000@ per Unit Returns Returns Benchmark Scheme Benchmark Additional
(`) (%)^ (%)# Returns (`) (`)# Benchmark(%)## (`) ##
^̂PPaasstt ppeerrffoorrmmaannccee mmaayy oorr mmaayy nnoott bbee ssuussttaaiinneedd iinn tthhee ffuuttuurree.. Returns greater than 1 year period are compounded annualized (CAGR). # CRISIL Liquid Fund Index ## CRISIL 1 year T-Bill IndexScheme performance may not strictly be comparable with that of its Additional Benchmark as the Scheme can invest only in instruments having maturity upto the opening of the immediately following specified transaction period, which is at quarterly intervals.
Sep 30, 13 Last 1 Year 17.1174 9.45 9.49 8.35 10,945 10,949 10,835Mar 18, 13 Since Inception 16.3297 9.35 9.32 6.70 11,473 11,468 11,049
Period Scheme Benchmark Additional ^ # Benchmark
##
B. Discrete 12 month returns (%)
Sep 30, 13 to Sep 30, 14 9.45 9.49 8.35
HDFC QUARTERLY INTERVAL FUND - PLAN A - RETAIL PLAN NAV as at September 30, 2014 ` 18.7343A. Cumulative performance
Date Period NAV Scheme Benchmark Additional Value of investment of ` 10,000@ per Unit Returns Returns Benchmark Scheme Benchmark Additional
(`) (%)^ (%)# Returns (`) (`)# Benchmark(%)## (`) ##
^̂PPaasstt ppeerrffoorrmmaannccee mmaayy oorr mmaayy nnoott bbee ssuussttaaiinneedd iinn tthhee ffuuttuurree.. Returns greater than 1 year period are compounded annualized (CAGR). # CRISIL Liquid Fund Index ## CRISIL 1 year T-Bill IndexScheme performance may not strictly be comparable with that of its Additional Benchmark as the Scheme can invest only in instruments having maturity upto the opening of the immediately following specified transaction period, which is at quarterly intervals.
A. Cumulative performance
Sep 30, 13 Last 1 Year 16.6983 9.56 9.49 8.35 10,956 10,949 10,835Feb 05, 13 Since Inception 15.7379 9.55 9.26 6.72 11,624 11,573 11,132
Period Scheme Benchmark Additional ^ # Benchmark
##
B. Discrete 12 month returns (%)
Sep 30, 13 to Sep 30, 14 9.56 9.49 8.35
HDFC QUARTERLY INTERVAL FUND - PLAN C - RETAIL PLAN NAV as at September 30, 2014 ` 18.2940
Date Period NAV Scheme Benchmark Additional Value of investment of ` 10,000@ per Unit Returns Returns Benchmark Scheme Benchmark Additional
(`) (%)^ (%)# Returns (`) (`)# Benchmark(%)## (`)##
^̂PPaasstt ppeerrffoorrmmaannccee mmaayy oorr mmaayy nnoott bbee ssuussttaaiinneedd iinn tthhee ffuuttuurree.. Returns greater than 1 year period are compounded annualized (CAGR). # CRISIL Short Term Bond Fund Index. ## CRISIL 1 year T-Bill IndexScheme performance may not strictly be comparable with that of its Additional Benchmark as the Scheme can invest only in instruments having maturity upto the opening of the immediately following specified transaction period, which is at annual intervals.
A. Cumulative performance
Sep 30, 13 Last 1 Year 10.4860 10.08 10.12 8.35 11,008 11,012 10,835Mar 06, 13 Since Inception 10.0000 9.57 9.19 6.73 11,543 11,480 11,077
HDFC ANNUAL INTERVAL FUND - SERIES I - PLAN A NAV as at September 30, 2014 ` 11.5434
Period Scheme Benchmark Additional ^ # Benchmark
##
B. Discrete 12 month returns (%)
Sep 30, 13 to Sep 30, 14 10.08 10.12 8.35
Performance of dividend option under the schemes for the investors would be net of distribution tax as applicable. Load is not taken into consideration for computation of performance. N.A.: Not Available@ shows the current value of ` 10,000/- invested at the beginning of a given period
ANIL BAMBOLI...CONTINUED
Date Period NAV Scheme Benchmark Additional Value of investment of ` 10,000@ per Unit Returns Returns Benchmark Scheme Benchmark Additional
(`) (%)^ (%)# Returns (`) (`)# Benchmark(%)## (`) ##
^̂PPaasstt ppeerrffoorrmmaannccee mmaayy oorr mmaayy nnoott bbee ssuussttaaiinneedd iinn tthhee ffuuttuurree.. Returns greater than 1 year period are compounded annualized (CAGR). # I-Sec Composite Index ## CRISIL 10 year Gilt Index
A. Cumulative performance
Sep 30, 13 Last 1 Year 10.1761 7.50 11.12 6.85 10,750 11,112 10,685Mar 04, 13 Since Inception 10.0000 5.86 6.78 2.50 10,939 11,089 10,396
Period Scheme Benchmark Additional ^ # Benchmark
##
B. Discrete 12 month returns (%)
Sep 30, 13 to Sep 30, 14 7.50 11.12 6.85
HDFC INFLATION INDEXED BOND FUND NAV as at September 30, 2014 ` 10.9392
Date Period NAV Scheme Benchmark Additional Value of investment of ` 10,000@ per Unit Returns Returns Benchmark Scheme Benchmark Additional
(`) (%)^ (%)# Returns (`) (`)# Benchmark(%)## (`)##
^̂PPaasstt ppeerrffoorrmmaannccee mmaayy oorr mmaayy nnoott bbee ssuussttaaiinneedd iinn tthhee ffuuttuurree.. Returns greater than 1 year period are compounded annualized (CAGR). # CRISIL Liquid Fund Index ## CRISIL 1 year T-Bill Index
Sep 23, 14 Last 7 days 21.1585 0.14 0.18 0.17 10,014 10,018 10,017Sep 15, 14 Last 15 days 21.1230 0.31 0.37 0.32 10,031 10,037 10,032Aug 31, 14 Last 1 Month 21.0604 0.61 N.A. N.A. 10,061 N.A. N.A.Sep 30, 13 Last 1 Year 19.5636 8.31 9.49 8.35 10,831 10,949 10,835Dec 31, 12 Since Inception 18.4446 8.26 9.18 6.91 11,488 11,660 11,238
Period Scheme Benchmark Additional ^ # Benchmark
##
B. Discrete 12 month returns (%)
Sep 30, 13 to Sep 30, 14 8.31 9.49 8.35
HDFC CASH MANAGEMENT FUND - CALL PLAN NAV as at September 30, 2014 ` 21.1886A. Cumulative performance
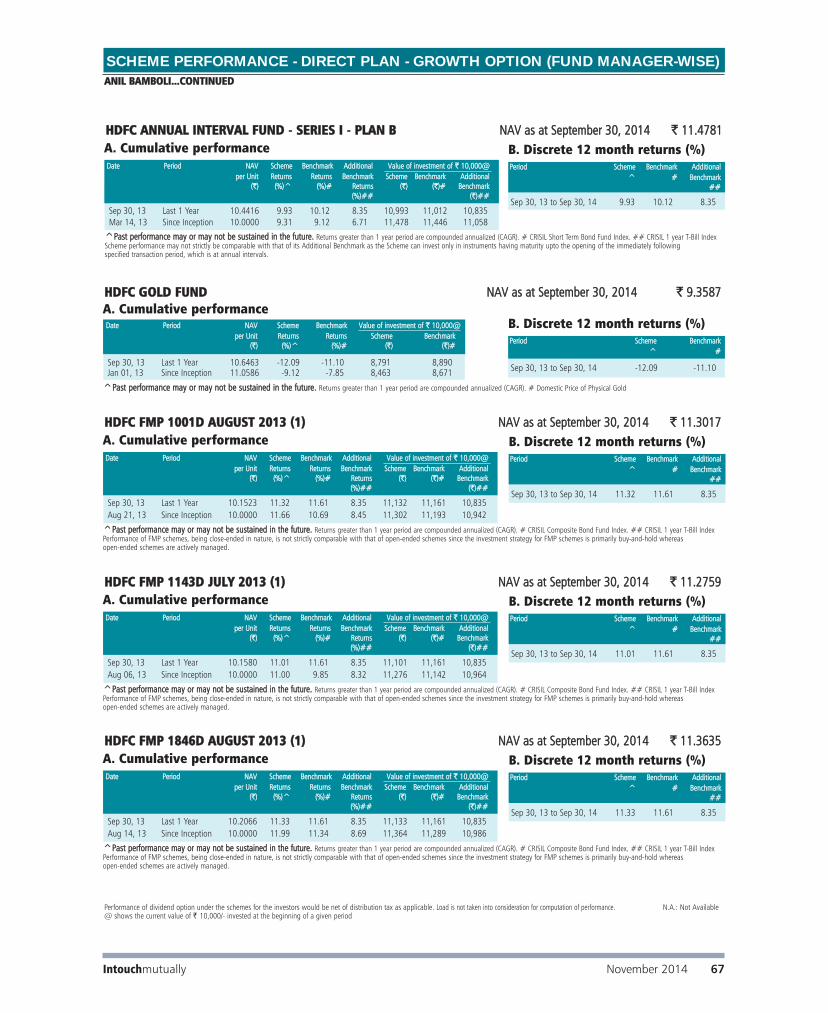
SCHEME PERFORMANCE - DIRECT PLAN - GROWTH OPTION (FUND MANAGER-WISE) ANIL BAMBOLI...CONTINUED
Date Period NAV Scheme Benchmark Additional Value of investment of ` 10,000@ per Unit Returns Returns Benchmark Scheme Benchmark Additional
(`) (%)^ (%)# Returns (`) (`)# Benchmark(%)## (`)##
^̂PPaasstt ppeerrffoorrmmaannccee mmaayy oorr mmaayy nnoott bbee ssuussttaaiinneedd iinn tthhee ffuuttuurree.. Returns greater than 1 year period are compounded annualized (CAGR). # CRISIL Composite Bond Fund Index. ## CRISIL 1 year T-Bill IndexPerformance of FMP schemes, being close-ended in nature, is not strictly comparable with that of open-ended schemes since the investment strategy for FMP schemes is primarily buy-and-hold whereas open-ended schemes are actively managed.
A. Cumulative performance
Sep 30, 13 Last 1 Year 10.1580 11.01 11.61 8.35 11,101 11,161 10,835Aug 06, 13 Since Inception 10.0000 11.00 9.85 8.32 11,276 11,142 10,964
HDFC FMP 1143D JULY 2013 (1) NAV as at September 30, 2014 ` 11.2759
Period Scheme Benchmark Additional ^ # Benchmark
##
B. Discrete 12 month returns (%)
Sep 30, 13 to Sep 30, 14 11.01 11.61 8.35
Date Period NAV Scheme Benchmark Additional Value of investment of ` 10,000@ per Unit Returns Returns Benchmark Scheme Benchmark Additional
(`) (%)^ (%)# Returns (`) (`)# Benchmark(%)## (`)##
^̂PPaasstt ppeerrffoorrmmaannccee mmaayy oorr mmaayy nnoott bbee ssuussttaaiinneedd iinn tthhee ffuuttuurree.. Returns greater than 1 year period are compounded annualized (CAGR). # CRISIL Composite Bond Fund Index. ## CRISIL 1 year T-Bill IndexPerformance of FMP schemes, being close-ended in nature, is not strictly comparable with that of open-ended schemes since the investment strategy for FMP schemes is primarily buy-and-hold whereas open-ended schemes are actively managed.
A. Cumulative performance
Sep 30, 13 Last 1 Year 10.1523 11.32 11.61 8.35 11,132 11,161 10,835Aug 21, 13 Since Inception 10.0000 11.66 10.69 8.45 11,302 11,193 10,942
HDFC FMP 1001D AUGUST 2013 (1) NAV as at September 30, 2014 ` 11.3017
Period Scheme Benchmark Additional ^ # Benchmark
##
B. Discrete 12 month returns (%)
Sep 30, 13 to Sep 30, 14 11.32 11.61 8.35
Date Period NAV Scheme Benchmark Additional Value of investment of ` 10,000@ per Unit Returns Returns Benchmark Scheme Benchmark Additional
(`) (%)^ (%)# Returns (`) (`)# Benchmark(%)## (`)##
^̂PPaasstt ppeerrffoorrmmaannccee mmaayy oorr mmaayy nnoott bbee ssuussttaaiinneedd iinn tthhee ffuuttuurree.. Returns greater than 1 year period are compounded annualized (CAGR). # CRISIL Composite Bond Fund Index. ## CRISIL 1 year T-Bill IndexPerformance of FMP schemes, being close-ended in nature, is not strictly comparable with that of open-ended schemes since the investment strategy for FMP schemes is primarily buy-and-hold whereas open-ended schemes are actively managed.
A. Cumulative performance
Sep 30, 13 Last 1 Year 10.2066 11.33 11.61 8.35 11,133 11,161 10,835Aug 14, 13 Since Inception 10.0000 11.99 11.34 8.69 11,364 11,289 10,986
HDFC FMP 1846D AUGUST 2013 (1) NAV as at September 30, 2014 ` 11.3635
Period Scheme Benchmark Additional ^ # Benchmark
##
B. Discrete 12 month returns (%)
Sep 30, 13 to Sep 30, 14 11.33 11.61 8.35
Performance of dividend option under the schemes for the investors would be net of distribution tax as applicable. Load is not taken into consideration for computation of performance. N.A.: Not Available@ shows the current value of ` 10,000/- invested at the beginning of a given period
Period Scheme Benchmark^ #
B. Discrete 12 month returns (%)
Sep 30, 13 to Sep 30, 14 -12.09 -11.10
Date Period NAV Scheme Benchmark Value of investment of ` 10,000@ per Unit Returns Returns Scheme Benchmark
(`) (%)^ (%)# (`) (`)#
^̂PPaasstt ppeerrffoorrmmaannccee mmaayy oorr mmaayy nnoott bbee ssuussttaaiinneedd iinn tthhee ffuuttuurree.. Returns greater than 1 year period are compounded annualized (CAGR). # Domestic Price of Physical Gold
A. Cumulative performance
Sep 30, 13 Last 1 Year 10.6463 -12.09 -11.10 8,791 8,890Jan 01, 13 Since Inception 11.0586 -9.12 -7.85 8,463 8,671
HDFC GOLD FUND NAV as at September 30, 2014 ` 9.3587
Intouchmutually November 2014 67
Date Period NAV Scheme Benchmark Additional Value of investment of ` 10,000@ per Unit Returns Returns Benchmark Scheme Benchmark Additional
(`) (%)^ (%)# Returns (`) (`)# Benchmark(%)## (`)##
^̂PPaasstt ppeerrffoorrmmaannccee mmaayy oorr mmaayy nnoott bbee ssuussttaaiinneedd iinn tthhee ffuuttuurree.. Returns greater than 1 year period are compounded annualized (CAGR). # CRISIL Short Term Bond Fund Index. ## CRISIL 1 year T-Bill IndexScheme performance may not strictly be comparable with that of its Additional Benchmark as the Scheme can invest only in instruments having maturity upto the opening of the immediately following specified transaction period, which is at annual intervals.
A. Cumulative performance
Sep 30, 13 Last 1 Year 10.4416 9.93 10.12 8.35 10,993 11,012 10,835Mar 14, 13 Since Inception 10.0000 9.31 9.12 6.71 11,478 11,446 11,058
HDFC ANNUAL INTERVAL FUND - SERIES I - PLAN B NAV as at September 30, 2014 ` 11.4781
Period Scheme Benchmark Additional ^ # Benchmark
##
B. Discrete 12 month returns (%)
Sep 30, 13 to Sep 30, 14 9.93 10.12 8.35

SCHEME PERFORMANCE - DIRECT PLAN - GROWTH OPTION (FUND MANAGER-WISE)
Intouchmutually68 November 2014
ANIL BAMBOLI...CONTINUED
Date Period NAV Scheme Benchmark Additional Value of investment of ` 10,000@ per Unit Returns Returns Benchmark Scheme Benchmark Additional
(`) (%)^ (%)# Returns (`) (`)# Benchmark(%)## (`)##
^̂PPaasstt ppeerrffoorrmmaannccee mmaayy oorr mmaayy nnoott bbee ssuussttaaiinneedd iinn tthhee ffuuttuurree.. Returns greater than 1 year period are compounded annualized (CAGR). # CRISIL Short Term Bond Fund Index. ## CRISIL 1 year T-Bill IndexPerformance of FMP schemes, being close-ended in nature, is not strictly comparable with that of open-ended schemes since the investment strategy for FMP schemes is primarily buy-and-hold whereas open-ended schemes are actively managed.
A. Cumulative performance
Sep 30, 13 Last 1 Year 10.1509 9.77 10.12 8.35 10,977 11,012 10,835Aug 08, 13 Since Inception 10.0000 9.91 10.34 8.32 11,143 11,193 10,958
HDFC FMP 370D AUGUST 2013 (1) NAV as at September 30, 2014 ` 11.1429
Period Scheme Benchmark Additional ^ # Benchmark
##
B. Discrete 12 month returns (%)
Sep 30, 13 to Sep 30, 14 9.77 10.12 8.35
Date Period NAV Scheme Benchmark Additional Value of investment of ` 10,000@ per Unit Returns Returns Benchmark Scheme Benchmark Additional
(`) (%)^ (%)# Returns (`) (`)# Benchmark(%)## (`)##
^̂PPaasstt ppeerrffoorrmmaannccee mmaayy oorr mmaayy nnoott bbee ssuussttaaiinneedd iinn tthhee ffuuttuurree.. Returns greater than 1 year period are compounded annualized (CAGR). # CRISIL Short Term Bond Fund Index. ## CRISIL 1 year T-Bill IndexPerformance of FMP schemes, being close-ended in nature, is not strictly comparable with that of open-ended schemes since the investment strategy for FMP schemes is primarily buy-and-hold whereas open-ended schemes are actively managed.
A. Cumulative performance
Sep 30, 13 Last 1 Year 10.1618 9.69 10.12 8.35 10,969 11,012 10,835Aug 22, 13 Since Inception 10.0000 10.31 10.85 8.45 11,147 11,208 10,939
HDFC FMP 370D AUGUST 2013 (3) NAV as at September 30, 2014 ` 11.1469
Period Scheme Benchmark Additional ^ # Benchmark
##
B. Discrete 12 month returns (%)
Sep 30, 13 to Sep 30, 14 9.69 10.12 8.35
Date Period NAV Scheme Benchmark Additional Value of investment of ` 10,000@ per Unit Returns Returns Benchmark Scheme Benchmark Additional
(`) (%)^ (%)# Returns (`) (`)# Benchmark(%)## (`)##
^̂PPaasstt ppeerrffoorrmmaannccee mmaayy oorr mmaayy nnoott bbee ssuussttaaiinneedd iinn tthhee ffuuttuurree.. Returns greater than 1 year period are compounded annualized (CAGR). # CRISIL Short Term Bond Fund Index. ## CRISIL 1 year T-Bill IndexPerformance of FMP schemes, being close-ended in nature, is not strictly comparable with that of open-ended schemes since the investment strategy for FMP schemes is primarily buy-and-hold whereas open-ended schemes are actively managed.
A. Cumulative performance
Sep 30, 13 Last 1 Year 10.1808 9.67 10.12 8.35 10,967 11,012 10,835Aug 14, 13 Since Inception 10.0000 10.26 10.71 8.69 11,165 11,217 10,986
HDFC FMP 370D AUGUST 2013 (2) NAV as at September 30, 2014 ` 11.1653
Period Scheme Benchmark Additional ^ # Benchmark
##
B. Discrete 12 month returns (%)
Sep 30, 13 to Sep 30, 14 9.67 10.12 8.35
Date Period NAV Scheme Benchmark Additional Value of investment of ` 10,000@ per Unit Returns Returns Benchmark Scheme Benchmark Additional
(`) (%)^ (%)# Returns (`) (`)# Benchmark(%)## (`)##
^̂PPaasstt ppeerrffoorrmmaannccee mmaayy oorr mmaayy nnoott bbee ssuussttaaiinneedd iinn tthhee ffuuttuurree.. Returns greater than 1 year period are compounded annualized (CAGR). # CRISIL Composite Bond Fund Index. ## CRISIL 1 year T-Bill IndexPerformance of FMP schemes, being close-ended in nature, is not strictly comparable with that of open-ended schemes since the investment strategy for FMP schemes is primarily buy-and-hold whereas open-ended schemes are actively managed.
A. Cumulative performance
Sep 30, 13 Last 1 Year 10.0881 11.99 11.61 8.35 11,199 11,161 10,835Sep 04, 13 Since Inception 10.0000 12.06 10.82 8.35 11,298 11,164 10,897
HDFC FMP 1875D AUGUST 2013 (1) NAV as at September 30, 2014 ` 11.2977
Period Scheme Benchmark Additional ^ # Benchmark
##
B. Discrete 12 month returns (%)
Sep 30, 13 to Sep 30, 14 11.99 11.61 8.35
Performance of dividend option under the schemes for the investors would be net of distribution tax as applicable. Load is not taken into consideration for computation of performance. N.A.: Not Available@ shows the current value of ` 10,000/- invested at the beginning of a given period
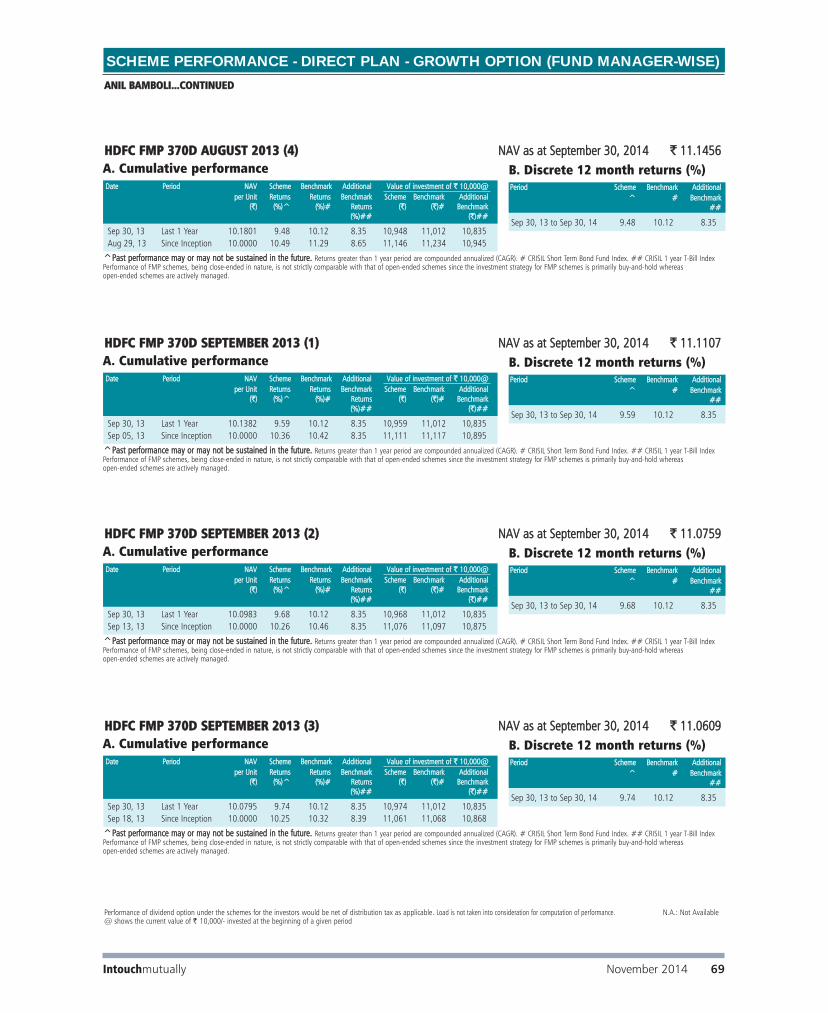
SCHEME PERFORMANCE - DIRECT PLAN - GROWTH OPTION (FUND MANAGER-WISE)
Intouchmutually November 2014 69
Date Period NAV Scheme Benchmark Additional Value of investment of ` 10,000@ per Unit Returns Returns Benchmark Scheme Benchmark Additional
(`) (%)^ (%)# Returns (`) (`)# Benchmark(%)## (`)##
^̂PPaasstt ppeerrffoorrmmaannccee mmaayy oorr mmaayy nnoott bbee ssuussttaaiinneedd iinn tthhee ffuuttuurree.. Returns greater than 1 year period are compounded annualized (CAGR). # CRISIL Short Term Bond Fund Index. ## CRISIL 1 year T-Bill IndexPerformance of FMP schemes, being close-ended in nature, is not strictly comparable with that of open-ended schemes since the investment strategy for FMP schemes is primarily buy-and-hold whereas open-ended schemes are actively managed.
A. Cumulative performance
Sep 30, 13 Last 1 Year 10.1801 9.48 10.12 8.35 10,948 11,012 10,835Aug 29, 13 Since Inception 10.0000 10.49 11.29 8.65 11,146 11,234 10,945
HDFC FMP 370D AUGUST 2013 (4) NAV as at September 30, 2014 ` 11.1456
Period Scheme Benchmark Additional ^ # Benchmark
##
B. Discrete 12 month returns (%)
Sep 30, 13 to Sep 30, 14 9.48 10.12 8.35
Date Period NAV Scheme Benchmark Additional Value of investment of ` 10,000@ per Unit Returns Returns Benchmark Scheme Benchmark Additional
(`) (%)^ (%)# Returns (`) (`)# Benchmark(%)## (`)##
^̂PPaasstt ppeerrffoorrmmaannccee mmaayy oorr mmaayy nnoott bbee ssuussttaaiinneedd iinn tthhee ffuuttuurree.. Returns greater than 1 year period are compounded annualized (CAGR). # CRISIL Short Term Bond Fund Index. ## CRISIL 1 year T-Bill IndexPerformance of FMP schemes, being close-ended in nature, is not strictly comparable with that of open-ended schemes since the investment strategy for FMP schemes is primarily buy-and-hold whereas open-ended schemes are actively managed.
A. Cumulative performance
Sep 30, 13 Last 1 Year 10.1382 9.59 10.12 8.35 10,959 11,012 10,835Sep 05, 13 Since Inception 10.0000 10.36 10.42 8.35 11,111 11,117 10,895
HDFC FMP 370D SEPTEMBER 2013 (1) NAV as at September 30, 2014 ` 11.1107
Period Scheme Benchmark Additional ^ # Benchmark
##
B. Discrete 12 month returns (%)
Sep 30, 13 to Sep 30, 14 9.59 10.12 8.35
Date Period NAV Scheme Benchmark Additional Value of investment of ` 10,000@ per Unit Returns Returns Benchmark Scheme Benchmark Additional
(`) (%)^ (%)# Returns (`) (`)# Benchmark(%)## (`)##
^̂PPaasstt ppeerrffoorrmmaannccee mmaayy oorr mmaayy nnoott bbee ssuussttaaiinneedd iinn tthhee ffuuttuurree.. Returns greater than 1 year period are compounded annualized (CAGR). # CRISIL Short Term Bond Fund Index. ## CRISIL 1 year T-Bill IndexPerformance of FMP schemes, being close-ended in nature, is not strictly comparable with that of open-ended schemes since the investment strategy for FMP schemes is primarily buy-and-hold whereas open-ended schemes are actively managed.
A. Cumulative performance
Sep 30, 13 Last 1 Year 10.0983 9.68 10.12 8.35 10,968 11,012 10,835Sep 13, 13 Since Inception 10.0000 10.26 10.46 8.35 11,076 11,097 10,875
HDFC FMP 370D SEPTEMBER 2013 (2) NAV as at September 30, 2014 ` 11.0759
Period Scheme Benchmark Additional ^ # Benchmark
##
B. Discrete 12 month returns (%)
Sep 30, 13 to Sep 30, 14 9.68 10.12 8.35
Date Period NAV Scheme Benchmark Additional Value of investment of ` 10,000@ per Unit Returns Returns Benchmark Scheme Benchmark Additional
(`) (%)^ (%)# Returns (`) (`)# Benchmark(%)## (`)##
^̂PPaasstt ppeerrffoorrmmaannccee mmaayy oorr mmaayy nnoott bbee ssuussttaaiinneedd iinn tthhee ffuuttuurree.. Returns greater than 1 year period are compounded annualized (CAGR). # CRISIL Short Term Bond Fund Index. ## CRISIL 1 year T-Bill IndexPerformance of FMP schemes, being close-ended in nature, is not strictly comparable with that of open-ended schemes since the investment strategy for FMP schemes is primarily buy-and-hold whereas open-ended schemes are actively managed.
A. Cumulative performance
Sep 30, 13 Last 1 Year 10.0795 9.74 10.12 8.35 10,974 11,012 10,835Sep 18, 13 Since Inception 10.0000 10.25 10.32 8.39 11,061 11,068 10,868
HDFC FMP 370D SEPTEMBER 2013 (3) NAV as at September 30, 2014 ` 11.0609
Period Scheme Benchmark Additional ^ # Benchmark
##
B. Discrete 12 month returns (%)
Sep 30, 13 to Sep 30, 14 9.74 10.12 8.35
ANIL BAMBOLI...CONTINUED
Performance of dividend option under the schemes for the investors would be net of distribution tax as applicable. Load is not taken into consideration for computation of performance. N.A.: Not Available@ shows the current value of ` 10,000/- invested at the beginning of a given period

SCHEME PERFORMANCE - DIRECT PLAN - GROWTH OPTION (FUND MANAGER-WISE)
Intouchmutually70 November 2014
ANIL BAMBOLI...CONTINUED
Date Period NAV Scheme Benchmark Additional Value of investment of ` 10,000@ per Unit Returns Returns Benchmark Scheme Benchmark Additional
(`) (%)^ (%)# Returns (`) (`)# Benchmark(%)## (`)##
^̂PPaasstt ppeerrffoorrmmaannccee mmaayy oorr mmaayy nnoott bbee ssuussttaaiinneedd iinn tthhee ffuuttuurree.. Returns greater than 1 year period are compounded annualized (CAGR). # CRISIL Short Term Bond Fund Index. ## CRISIL 1 year T-Bill IndexPerformance of FMP schemes, being close-ended in nature, is not strictly comparable with that of open-ended schemes since the investment strategy for FMP schemes is primarily buy-and-hold whereas open-ended schemes are actively managed.
A. Cumulative performance
Sep 30, 13 Last 1 Year 10.1528 9.82 10.12 8.35 10,982 11,012 10,835Aug 07, 13 Since Inception 10.0000 9.94 10.39 8.32 11,150 11,201 10,961
HDFC FMP 371D AUGUST 2013 (1) NAV as at September 30, 2014 ` 11.1495
Period Scheme Benchmark Additional ^ # Benchmark
##
B. Discrete 12 month returns (%)
Sep 30, 13 to Sep 30, 14 9.82 10.12 8.35
Date Period NAV Scheme Benchmark Additional Value of investment of ` 10,000@ per Unit Returns Returns Benchmark Scheme Benchmark Additional
(`) (%)^ (%)# Returns (`) (`)# Benchmark(%)## (`)##
^̂PPaasstt ppeerrffoorrmmaannccee mmaayy oorr mmaayy nnoott bbee ssuussttaaiinneedd iinn tthhee ffuuttuurree.. Returns greater than 1 year period are compounded annualized (CAGR). # CRISIL Short Term Bond Fund Index. ## CRISIL 1 year T-Bill IndexPerformance of FMP schemes, being close-ended in nature, is not strictly comparable with that of open-ended schemes since the investment strategy for FMP schemes is primarily buy-and-hold whereas open-ended schemes are actively managed.
A. Cumulative performance
Sep 30, 13 Last 1 Year 10.1655 9.83 10.12 8.35 10,983 11,012 10,835July 31, 13 Since Inception 10.0000 9.90 10.51 8.46 11,165 11,237 10,994
HDFC FMP 370D JULY 2013 (3) NAV as at September 30, 2014 ` 11.1651
Period Scheme Benchmark Additional ^ # Benchmark
##
B. Discrete 12 month returns (%)
Sep 30, 13 to Sep 30, 14 9.83 10.12 8.35
Date Period NAV Scheme Benchmark Additional Value of investment of ` 10,000@ per Unit Returns Returns Benchmark Scheme Benchmark Additional
(`) (%)^ (%)# Returns (`) (`)# Benchmark(%)## (`)##
^̂PPaasstt ppeerrffoorrmmaannccee mmaayy oorr mmaayy nnoott bbee ssuussttaaiinneedd iinn tthhee ffuuttuurree.. Returns greater than 1 year period are compounded annualized (CAGR). # CRISIL Short Term Bond Fund Index. ## CRISIL 1 year T-Bill IndexPerformance of FMP schemes, being close-ended in nature, is not strictly comparable with that of open-ended schemes since the investment strategy for FMP schemes is primarily buy-and-hold whereas open-ended schemes are actively managed.
A. Cumulative performance
Sep 30, 13 Last 1 Year 10.1971 9.17 10.12 8.35 10,917 11,012 10,835July 24, 13 Since Inception 10.0000 9.47 10.54 8.41 11,133 11,263 11,005
HDFC FMP 371D JULY 2013 (1) NAV as at September 30, 2014 ` 11.1325
Period Scheme Benchmark Additional ^ # Benchmark
##
B. Discrete 12 month returns (%)
Sep 30, 13 to Sep 30, 14 9.17 10.12 8.35
Date Period NAV Scheme Benchmark Additional Value of investment of ` 10,000@ per Unit Returns Returns Benchmark Scheme Benchmark Additional
(`) (%)^ (%)# Returns (`) (`)# Benchmark(%)## (`)##
^̂PPaasstt ppeerrffoorrmmaannccee mmaayy oorr mmaayy nnoott bbee ssuussttaaiinneedd iinn tthhee ffuuttuurree.. Returns greater than 1 year period are compounded annualized (CAGR). # CRISIL MIP Blended Index. ## CRISIL 1 year T-Bill IndexPerformance of FMP schemes, being close-ended in nature, is not strictly comparable with that of open-ended schemes since the investment strategy for FMP schemes is primarily buy-and-hold whereas open-ended schemes are actively managed.
A. Cumulative performance
Sep 30, 13 Last 1 Year 10.1909 13.73 15.45 8.35 11,373 11,545 10,835Sep 06, 13 Since Inception 10.0000 14.85 14.65 8.41 11,590 11,569 10,899
HDFC CAPITAL PROTECTION ORIENTED FUND - SERIES I - 36M - AUGUST 2013 NAV as at September 30, 2014 ` 11.5898
Period Scheme Benchmark Additional ^ # Benchmark
##
B. Discrete 12 month returns (%)
Sep 30, 13 to Sep 30, 14 13.73 15.45 8.35
Performance of dividend option under the schemes for the investors would be net of distribution tax as applicable. Load is not taken into consideration for computation of performance. N.A.: Not Available@ shows the current value of ` 10,000/- invested at the beginning of a given period

Mar 23, 12 43.951 4.00 4.00Mar 21, 13 41.388 4.00 4.00Mar 20, 14 43.809 4.00 4.00
DDiirreecctt PPllaannMar 21, 13 41.447 4.00 4.00Mar 20, 14 44.172 4.00 4.00
RReeccoorrdd CCuumm DDiivv DDiivviiddeenndd PPeerr uunniitt ((`̀)) FFoorr DDaattee NNAAVV ((`̀)) IInnddiivviidduuaallss && HHUUFF OOtthheerrss
RReeccoorrdd CCuumm DDiivv DDiivviiddeenndd PPeerr uunniitt ((`̀)) FFoorr DDaattee NNAAVV ((`̀)) IInnddiivviidduuaallss && HHUUFF OOtthheerrss
HDFC Equity Fund (Past 3 years)
Mar 07, 12 42.778 4.00 4.00Mar 07, 13 43.247 4.00 4.00Mar 06, 14 42.484 4.00 4.00
DDiirreecctt PPllaannMar 07, 13 43.293 4.00 4.00Mar 06, 14 42.768 4.00 4.00
RReeccoorrdd CCuumm DDiivv DDiivviiddeenndd PPeerr uunniitt ((`̀)) FFoorr DDaattee NNAAVV ((`̀)) IInnddiivviidduuaallss && HHUUFF OOtthheerrss
RReeccoorrdd CCuumm DDiivv DDiivviiddeenndd PPeerr uunniitt ((`̀)) FFoorr DDaattee NNAAVV ((`̀)) IInnddiivviidduuaallss && HHUUFF OOtthheerrss
HDFC Top 200 Fund (Past 3 years)
Mar 07, 12 22.595 2.50 2.50Feb 21, 13 22.391 2.50 2.50Feb 20, 14 21.788 2.50 2.50
RReeccoorrdd CCuumm DDiivv DDiivviiddeenndd PPeerr uunniitt ((`̀)) FFoorr DDaattee NNAAVV ((`̀)) IInnddiivviidduuaallss && HHUUFF OOtthheerrss
HDFC Capital Builder Fund (Past 3 years)
Feb 23, 12 30.629 3.00 3.00Feb 21, 13 29.331 3.00 3.00Feb 13, 14 25.019 3.00 3.00
DDiirreecctt PPllaannFeb 21, 13 29.352 3.00 3.00Feb 13, 14 25.143 3.00 3.00
RReeccoorrdd CCuumm DDiivv DDiivviiddeenndd PPeerr uunniitt ((`̀)) FFoorr DDaattee NNAAVV ((`̀)) IInnddiivviidduuaallss && HHUUFF OOtthheerrss
HDFC Growth Fund
RReeccoorrdd CCuumm DDiivv DDiivviiddeenndd PPeerr uunniitt ((`̀)) FFoorr DDaattee NNAAVV ((`̀)) IInnddiivviidduuaallss && HHUUFF OOtthheerrss
DDiirreecctt PPllaannFeb 21, 13 22.408 2.50 2.50Feb 20, 14 21.897 2.50 2.50
HDFC Balanced Fund (Past 3 years)
RReeccoorrdd CCuumm DDiivv DDiivviiddeenndd PPeerr uunniitt ((`̀)) FFoorr DDaattee NNAAVV ((`̀)) IInnddiivviidduuaallss && HHUUFF OOtthheerrss
Mar 01, 12 20.353 2.25 2.25Feb 27, 13 19.322 1.25 1.25Feb 26, 14 20.682 1.25 1.25
RReeccoorrdd CCuumm DDiivv DDiivviiddeenndd PPeerr uunniitt ((`̀)) FFoorr DDaattee NNAAVV ((`̀)) IInnddiivviidduuaallss && HHUUFF OOtthheerrss
DDiirreecctt PPllaannFeb 27, 13 19.339 1.25 1.25
Mar 15, 12 29.516 3.50 3.50Feb 27, 13 27.526 3.00 3.00Feb 26, 14 25.965 3.00 3.00
DDiirreecctt PPllaannFeb 27, 13 27.552 3.00 3.00Feb 26, 14 26.141 1.25 1.25
RReeccoorrdd CCuumm DDiivv DDiivviiddeenndd PPeerr uunniitt ((`̀)) FFoorr DDaattee NNAAVV ((`̀)) IInnddiivviidduuaallss && HHUUFF OOtthheerrss
RReeccoorrdd CCuumm DDiivv DDiivviiddeenndd PPeerr uunniitt ((`̀)) FFoorr DDaattee NNAAVV ((`̀)) IInnddiivviidduuaallss && HHUUFF OOtthheerrss
HDFC Prudence Fund (Past 3 years)
RReeccoorrdd CCuumm DDiivv DDiivviiddeenndd PPeerr uunniitt ((`̀)) FFoorr DDaattee NNAAVV ((`̀)) IInnddiivviidduuaallss && HHUUFF OOtthheerrss
Dividend Option
Dividend Option
Dividend Option
Dividend Option
Feb 16, 12 19.647 2.00 2.00Feb 14, 13 17.613 2.00 2.00Feb 20, 14 15.197 1.50 1.50
RReeccoorrdd CCuumm DDiivv DDiivviiddeenndd PPeerr uunniitt ((`̀)) FFoorr DDaattee NNAAVV ((`̀)) IInnddiivviidduuaallss && HHUUFF OOtthheerrss
HDFC Core & Satellite Fund (Past 3 years)
RReeccoorrdd CCuumm DDiivv DDiivviiddeenndd PPeerr uunniitt ((`̀)) FFoorr DDaattee NNAAVV ((`̀)) IInnddiivviidduuaallss && HHUUFF OOtthheerrss
DDiirreecctt PPllaannFeb 14, 13 17.602 2.00 2.00Feb 20, 14 15.327 1.50 1.50
Dividend Option
Feb 09, 12 13.912 1.50 1.50Feb 07, 13 12.762 1.50 1.50Feb 06, 14 10.783 0.60 0.60
RReeccoorrdd CCuumm DDiivv DDiivviiddeenndd PPeerr uunniitt ((`̀)) FFoorr DDaattee NNAAVV ((`̀)) IInnddiivviidduuaallss && HHUUFF OOtthheerrss
HDFC Premier Multi-Cap Fund (Past 3 years)
RReeccoorrdd CCuumm DDiivv DDiivviiddeenndd PPeerr uunniitt ((`̀)) FFoorr DDaattee NNAAVV ((`̀)) IInnddiivviidduuaallss && HHUUFF OOtthheerrss
DDiirreecctt PPllaannFeb 07, 13 12.769 1.50 1.50Feb 06, 14 10.854 0.60 0.60
Dividend Option
Dividend Option
Dividend Option
(Past 3 years)
Feb 09, 12 34.468 4.00 4.00Feb 07, 13 34.167 4.00 4.00Feb 06, 14 32.125 3.50 3.50
DDiirreecctt PPllaannFeb 07, 13 34.186 4.00 4.00Feb 06, 14 32.304 3.50 3.50
RReeccoorrdd CCuumm DDiivv DDiivviiddeenndd PPeerr uunniitt ((`̀)) FFoorr DDaattee NNAAVV ((`̀)) IInnddiivviidduuaallss && HHUUFF OOtthheerrss
HDFC Long Term Advantage Fund (Past 3 years)
(An open-ended equity linked savings scheme with a lock-in period of 3 years)
RReeccoorrdd CCuumm DDiivv DDiivviiddeenndd PPeerr uunniitt ((`̀)) FFoorr DDaattee NNAAVV ((`̀)) IInnddiivviidduuaallss && HHUUFF OOtthheerrss
Dividend Option
Mar 01, 12 56.738 6.00 6.00Mar 14, 13 53.602 6.00 6.00Mar 13, 14 52.658 6.00 6.00
DDiirreecctt PPllaannMar 14, 13 53.675 6.00 6.00Mar 13, 14 53.067 6.00 6.00
RReeccoorrdd CCuumm DDiivv DDiivviiddeenndd PPeerr uunniitt ((`̀)) FFoorr DDaattee NNAAVV ((`̀)) IInnddiivviidduuaallss && HHUUFF OOtthheerrss
RReeccoorrdd CCuumm DDiivv DDiivviiddeenndd PPeerr uunniitt ((`̀)) FFoorr DDaattee NNAAVV ((`̀)) IInnddiivviidduuaallss && HHUUFF OOtthheerrss
HDFC TaxSaver (Past 3 years)
(An open-ended equity linked savings scheme with a lock-in period of 3 years)Dividend Option
WWhhoolleessaallee PPllaannMar 25, 14 10.492 0.213 0.213Jun 25, 14 10.494 0.215 0.215Sep 25, 14 10.462 0.183 0.183
DDiirreecctt PPllaannJun 25, 14 10.027 0.027 0.027Sep 25, 14 10.181 0.092 0.092
RReeccoorrdd CCuumm DDiivv DDiivviiddeenndd PPeerr uunniitt ((`̀)) FFoorr DDaattee NNAAVV ((`̀)) IInnddiivviidduuaallss && HHUUFF OOtthheerrss
RReeccoorrdd CCuumm DDiivv DDiivviiddeenndd PPeerr uunniitt ((`̀)) FFoorr DDaattee NNAAVV ((`̀)) IInnddiivviidduuaallss && HHUUFF OOtthheerrss
Quarterly (Dividend Option) (Past 3 quarters)
HDFC Arbitrage Fund
Dividend History ^
Feb 23, 12 16.058 1.50 1.50Feb 27, 13 15.980 1.15 1.15Feb 26, 14 17.588 1.75 1.75
DDiirreecctt PPllaannFeb 27, 13 15.994 1.15 1.15
RReeccoorrdd CCuumm DDiivv DDiivviiddeenndd PPeerr uunniitt ((`̀)) FFoorr DDaattee NNAAVV ((`̀)) IInnddiivviidduuaallss && HHUUFF OOtthheerrss
RReeccoorrdd CCuumm DDiivv DDiivviiddeenndd PPeerr uunniitt ((`̀)) FFoorr DDaattee NNAAVV ((`̀)) IInnddiivviidduuaallss && HHUUFF OOtthheerrss
HDFC Mid-Cap Opportunities Fund (Past 3 years)Dividend Option
^̂ PPaasstt ppeerrffoorrmmaannccee mmaayy oorr mmaayy nnoott bbee ssuussttaaiinneedd iinn tthhee ffuuttuurree.. There is no assurance or guarantee to Unit holders as to rate/quantum of dividend distribution northat the dividends will be paid regularly. All dividends are on face value of `̀ 10 per Unit. After payment of the dividend, the per Unit NAV fallsto the extent of the payout and statutory levy, if any.* Please log on to www.hdfcfund.com for Record Date-wise listing of dividends declared
November 2014 71Intouchmutually

^̂ PPaasstt ppeerrffoorrmmaannccee mmaayy oorr mmaayy nnoott bbee ssuussttaaiinneedd iinn tthhee ffuuttuurree.. There is no assurance or guarantee to Unit holders as to rate/quantum of dividend distribution northat the dividends will be paid regularly. All dividends are on face value of `̀ 10 per Unit. After payment of the dividend, the per Unit NAV fallsto the extent of the payout and statutory levy, if any.* Please log on to www.hdfcfund.com for Record Date-wise listing of dividends declared
Monthly Dividend Option(Past 3 months)
RReeccoorrdd CCuumm DDiivv DDiivviiddeenndd PPeerr uunniitt ((`̀)) FFoorr DDaattee NNAAVV ((`̀)) IInnddiivviidduuaallss && HHUUFF OOtthheerrss
Sep 25, 14 11.9969 0.0600 0.0574Oct 27, 14 12.0882 0.0600 0.0557Nov 25, 14 12.2682 0.0600 0.0557
DDiirreecctt PPllaann Sep 25, 14 12.0652 0.0600 0.0574Oct 27, 14 12.1616 0.0600 0.0557Nov 25, 14 12.3479 0.0600 0.0557
Quarterly Dividend Option(Past 3 quarters)
RReeccoorrdd CCuumm DDiivv DDiivviiddeenndd PPeerr uunniitt ((`̀)) FFoorr DDaattee NNAAVV ((`̀)) IInnddiivviidduuaallss && HHUUFF OOtthheerrss
Mar 25, 14 11.6475 0.1800 0.1724Jun 25, 14 12.5468 0.1800 0.1724Sep 25, 14 12.4790 0.1800 0.1724
DDiirreecctt PPllaann Mar 25, 14 11.6934 0.1800 0.1724Jun 25, 14 12.6068 0.1800 0.1724Sep 25, 14 12.5496 0.1800 0.1724
HDFC High Interest Fund - Dynamic Plan
Mar 25, 14 11.3712 0.1500 0.1437Jun 25, 14 11.6298 0.2000 0.1915Sep 25, 14 11.6131 0.2000 0.1915
DDiirreecctt PPllaannMar 25, 14 11.4808 0.1500 0.1437Jun 25, 14 11.7734 0.2000 0.1915Sep 25, 14 11.7846 0.2000 0.1915
Sep 25, 13 11.1219 0.2704 0.2589Mar 25, 14 11.2992 0.4000 0.3831Sep 25, 14 11.4586 0.4000 0.3831
DDiirreecctt PPllaannSep 25, 13 11.1749 0.0787 0.0753Mar 25, 14 11.6682 0.4000 0.3831Sep 25, 14 11.9061 0.4000 0.3831
RReeccoorrdd CCuumm DDiivv DDiivviiddeenndd PPeerr uunniitt ((`̀)) FFoorr DDaattee NNAAVV ((`̀)) IInnddiivviidduuaallss && HHUUFF OOtthheerrss
RReeccoorrdd CCuumm DDiivv DDiivviiddeenndd PPeerr uunniitt ((`̀)) FFoorr DDaattee NNAAVV ((`̀)) IInnddiivviidduuaallss && HHUUFF OOtthheerrss
Quarterly (Dividend Option)(Past 3 quarters)
Half-yearly (Dividend Option)(Past 2 years)
Yearly (Dividend Option) (Past 3 years)
Mar 25, 14 10.7776 0.1500 0.1437June 25, 14 11.0339 0.2000 0.1915Sep 25, 14 10.9859 0.2000 0.1915
DDiirreecctt PPllaannMar 25, 14 10.8793 0.1500 0.1437June 25, 14 11.1701 0.2000 0.1915Sep 25, 14 11.1488 0.2000 0.1915
RReeccoorrdd DDaattee CCuumm DDiivviiddeenndd NNAAVV ((`̀)) DDiivviiddeenndd PPeerr uunniitt ((`̀)) FFoorr IInnddiivviidduuaallss && HHUUFF OOtthheerrss
Dividend Option (Past 3 quarters)
Mar 26, 12 12.3397 0.6000 0.5143Mar 25, 13 12.9081 0.9500 0.8142Mar 25, 14 12.4424 0.6500 0.6225
DDiirreecctt PPllaannMar 25, 13 12.9251 0.9500 0.8142Mar 25, 14 12.5647 0.6500 0.6225
RReeccoorrdd DDaattee CCuumm DDiivviiddeenndd NNAAVV ((`̀)) DDiivviiddeenndd PPeerr uunniitt ((`̀)) FFoorr IInnddiivviidduuaallss && HHUUFF OOtthheerrss
HDFC Income Fund
Short Term Plan (Dividend Option)
Dividend History ^
HDFC MF Monthly Income Plan (MIP)(An open-ended income scheme. Monthly income is not assured and is subject to availability of distributable surplus)
Long Term Plan (Dividend Option)
Monthly Dividend Option(Past 3 months)
RReeccoorrdd CCuumm DDiivv DDiivviiddeenndd PPeerr uunniitt ((`̀)) FFoorr DDaattee NNAAVV ((`̀)) IInnddiivviidduuaallss && HHUUFF OOtthheerrss
Sep 25, 14 14.1306 0.0700 0.0670Oct 27, 14 14.3179 0.0700 0.0649Nov 25, 14 14.6755 0.0700 0.0649
DDiirreecctt PPllaannSep 25, 14 14.2397 0.0700 0.0670Oct 27, 14 14.4349 0.0700 0.0649Nov 25, 14 14.8015 0.0700 0.0649
Quarterly Dividend Option(Past 3 quarters)
RReeccoorrdd CCuumm DDiivv DDiivviiddeenndd PPeerr uunniitt ((`̀)) FFoorr DDaattee NNAAVV ((`̀)) IInnddiivviidduuaallss && HHUUFF OOtthheerrss
Mar 25, 14 13.4660 0.2100 0.2011Jun 25, 14 14.7754 0.2100 0.2011Sep 25, 14 14.7400 0.2100 0.2011
DDiirreecctt PPllaann Mar 25, 14 13.5384 0.2100 0.2011Jun 25, 14 14.8718 0.2100 0.2011Sep 25, 14 14.8536 0.2100 0.2011
HDFC Multiple Yield Fund (Past 3 years)
Feb 17, 12 12.8281 0.7500 0.6428Feb 14, 13 11.6548 0.7500 0.6428Feb 13, 14 11.5427 0.7500 0.7183
DDiirreecctt PPllaannFeb 14, 13 11.6602 0.7500 0.6428Feb 13, 14 11.5842 0.7500 0.7183
RReeccoorrdd CCuumm DDiivv DDiivviiddeenndd PPeerr uunniitt ((`̀)) FFoorr DDaattee NNAAVV ((`̀)) IInnddiivviidduuaallss && HHUUFF OOtthheerrss
RReeccoorrdd CCuumm DDiivv DDiivviiddeenndd PPeerr uunniitt ((`̀)) FFoorr DDaattee NNAAVV ((`̀)) IInnddiivviidduuaallss && HHUUFF OOtthheerrss
(Dividend Option)
HDFC Multiple Yield Fund - Plan 2005 (Past 3 years)
Feb 17, 12 11.6454 0.7500 0.6428Feb 14, 13 11.5963 0.7500 0.6428Feb 13, 14 11.4924 0.7500 0.7183
DDiirreecctt PPllaannFeb 14, 13 11.6048 0.7500 0.6428Feb 13, 14 11.5689 0.5000 0.4788
RReeccoorrdd CCuumm DDiivv DDiivviiddeenndd PPeerr uunniitt ((`̀)) FFoorr DDaattee NNAAVV ((`̀)) IInnddiivviidduuaallss && HHUUFF OOtthheerrss
RReeccoorrdd CCuumm DDiivv DDiivviiddeenndd PPeerr uunniitt ((`̀)) FFoorr DDaattee NNAAVV ((`̀)) IInnddiivviidduuaallss && HHUUFF OOtthheerrss
(Dividend Option)
HDFC Short Term PlanDDiivviiddeenndd OOppttiioonn - RReeiinnvveessttmmeenntt (Past 3 months)
RReeccoorrdd CCuumm DDiivv DDiivviiddeenndd PPeerr uunniitt ((`̀)) FFoorr DDaattee NNAAVV ((`̀)) IInnddiivviidduuaallss && HHUUFF OOtthheerrss
RReeccoorrdd CCuumm DDiivv DDiivviiddeenndd PPeerr uunniitt ((`̀)) FFoorr DDaattee NNAAVV ((`̀)) IInnddiivviidduuaallss && HHUUFF OOtthheerrss
Sep 25, 14 10.4160 0.0770 0.0737Oct 27, 14 10.4495 0.0960 0.0891Nov 25, 14 10.4269 0.0796 0.0738
Direct PlanSep 25, 14 10.4179 0.0785 0.0752Oct 27, 14 10.4515 0.0975 0.0904Nov 25, 14 10.4290 0.0812 0.0753
Sep 10, 14 10.1052 0.0372 0.0356
Sep 25, 14 10.0992 0.0325 0.0311
Oct 10, 14 10.1045 0.0341 0.0316
Oct 27, 14 10.1263 0.0445 0.0413
Nov 10, 14 10.1266 0.0266 0.0246
Nov 25, 14 10.1280 0.0276 0.0256
DDiirreecctt PPllaann
Sep 10, 14 10.1487 0.0380 0.0363
Sep 25, 14 10.1427 0.0333 0.0319
Oct 10, 14 10.1485 0.0294 0.0273
Oct 27, 14 10.1781 0.0509 0.0472
Nov 10, 14 10.1706 0.0150 0.0139
Nov 25, 14 10.1890 0.0283 0.0263
RReeccoorrdd CCuumm DDiivv DDiivviiddeenndd PPeerr uunniitt ((`̀)) FFoorr DDaattee NNAAVV ((`̀)) IInnddiivviidduuaallss && HHUUFF OOtthheerrss
RReeccoorrdd CCuumm DDiivv DDiivviiddeenndd PPeerr uunniitt ((`̀)) FFoorr DDaattee NNAAVV ((`̀)) IInnddiivviidduuaallss && HHUUFF OOtthheerrss
DDiivviiddeenndd OOppttiioonn - FFoorrttnniigghhttllyy (Past 3 months)HDFC Short Term Opportunities Fund
Sep 25, 14 10.2822 0.1701 0.1629
DDiirreecctt PPllaann
Sep 25, 14 10.3584 0.1736 0.1663
RReeccoorrdd CCuumm DDiivv DDiivviiddeenndd PPeerr uunniitt ((`̀)) FFoorr DDaattee NNAAVV ((`̀)) IInnddiivviidduuaallss && HHUUFF OOtthheerrss
RReeccoorrdd CCuumm DDiivv DDiivviiddeenndd PPeerr uunniitt ((`̀)) FFoorr DDaattee NNAAVV ((`̀)) IInnddiivviidduuaallss && HHUUFF OOtthheerrss
Dividend Option - Reinvestment (Past 3 months)
HDFC Medium Term Opportunities Fund
Oct 10, 14 10.6285 0.0368 0.0341Oct 27, 14 10.6590 0.0589 0.0547Nov 10, 14 10.6573 0.0577 0.0535Nov 25, 14 10.6156 0.0274 0.0254
DDiirreecctt PPllaannOct 10, 14 10.6306 0.0383 0.0355Oct 27, 14 10.6612 0.0605 0.0561Nov 10, 14 10.6592 0.0591 0.0548Nov 25, 14 10.6176 0.0289 0.0268
RReeccoorrdd CCuumm DDiivv DDiivviiddeenndd PPeerr uunniitt ((`̀)) FFoorr DDaattee NNAAVV ((`̀)) IInnddiivviidduuaallss && HHUUFF OOtthheerrss
RReeccoorrdd CCuumm DDiivv DDiivviiddeenndd PPeerr uunniitt ((`̀)) FFoorr DDaattee NNAAVV ((`̀)) IInnddiivviidduuaallss && HHUUFF OOtthheerrss
DDiivviiddeenndd OOppttiioonn - FFoorrttnniigghhttllyy (Past 2 months)HDFC High Interest Fund - Short Term Plan
72 November 2014 Intouchmutually

^̂ PPaasstt ppeerrffoorrmmaannccee mmaayy oorr mmaayy nnoott bbee ssuussttaaiinneedd iinn tthhee ffuuttuurree.. There is no assurance or guarantee to Unit holders as to rate/quantum of dividend distribution northat the dividends will be paid regularly. All dividends are on face value of `̀ 10 per Unit. After payment of the dividend, the per Unit NAV fallsto the extent of the payout and statutory levy, if any.* Please log on to www.hdfcfund.com for Record Date-wise listing of dividends declared
Dividend History ^
WWeeeekkllyy DDiivviiddeenndd OOppttiioonn (Past 1 month)
RReeccoorrdd CCuumm DDiivv DDiivviiddeenndd PPeerr uunniitt ((`̀)) FFoorr RReeccoorrdd CCuumm DDiivv DDiivviiddeenndd PPeerr uunniitt ((`̀)) FFoorr DDaattee NNAAVV ((`̀)) IInnddiivviidduuaallss && HHUUFF OOtthheerrss DDaattee NNAAVV ((`̀)) IInnddiivviidduuaallss && HHUUFF OOtthheerrss
Nov 03, 14 10.3273 0.0132 0.0127Nov 10, 14 10.3272 0.0123 0.0114Nov 17, 14 10.3269 0.0120 0.0112Nov 24, 14 10.3270 0.0121 0.0112
DDiirreecctt PPllaannNov 03, 14 10.3275 0.0134 0.0128Nov 10, 14 10.3271 0.0122 0.0113Nov 17, 14 10.3273 0.0123 0.0114Nov 24, 14 10.3271 0.0122 0.0113
Sep 29, 14 10.3478 0.0661 0.0633Oct 27, 14 10.3312 0.0495 0.0459Nov 24, 14 10.3302 0.0488 0.0452
DDiirreecctt PPllaannSep 29, 14 10.3482 0.0664 0.0636Oct 27, 14 10.3317 0.0499 0.0462Nov 24, 14 10.3306 0.0491 0.0455
RReeccoorrdd DDaattee CCuumm DDiivviiddeenndd NNAAVV ((`̀)) DDiivviiddeenndd PPeerr uunniitt ((`̀)) FFoorr IInnddiivviidduuaallss && HHUUFF OOtthheerrss
MMoonntthhllyy DDiivviiddeenndd OOppttiioonn (Past 3 months)
September 2014 Daily 10.1982 0.0563 0.0536October 2014 Daily 10.1982 0.0562 0.0517November 2014 Daily 10.1982 0.0496 0.0463
DDiirreecctt PPllaannSeptember 2014 Daily 10.1982 0.0564 0.0540October 2014 Daily 10.1982 0.0565 0.0521November 2014 Daily 10.1982 0.0498 0.0466
MMoonntthh RReeccoorrdd DDaattee EExx-ddiivviiddeenndd NNAAVV ppeerr UUnniitt ((`̀)) AAggggrreeggaattee DDiivviiddeenndd PPeerr UUnniitt ((`̀)) ffoorr tthhee mmoonntthh IInnddiivviidduuaallss && HHUUFF OOtthheerrss
DDaaiillyy DDiivviiddeenndd RReeiinnvveessttmmeenntt OOppttiioonn** (Past 3 months)
HDFC Liquid Fund
WWhhoolleessaallee OOppttiioonnNov 03, 14 10.1560 0.0149 0.0139Nov 10, 14 10.1556 0.0147 0.0136Nov 17, 14 10.1525 0.0124 0.0115Nov 24, 14 10.1526 0.0125 0.0116
WWhhoolleessaallee OOppttiioonn - DDiirreecctt PPllaannNov 03, 14 10.1560 0.0149 0.0138Nov 10, 14 10.1556 0.0147 0.0136Nov 17, 14 10.1527 0.0126 0.0116Nov 24, 14 10.1526 0.0125 0.0116
RReeccoorrdd CCuumm DDiivv DDiivviiddeenndd PPeerr uunniitt ((`̀)) FFoorr DDaattee NNAAVV ((`̀)) IInnddiivviidduuaallss && HHUUFF OOtthheerrss
RReeccoorrdd CCuumm DDiivv DDiivviiddeenndd PPeerr uunniitt ((`̀)) FFoorr DDaattee NNAAVV ((`̀)) IInnddiivviidduuaallss && HHUUFF OOtthheerrss
(Weekly Dividend Option) (Past 1 month)
RReettaaiill OOppttiioonnNov 03, 14 10.2503 0.0140 0.0130Nov 10, 14 10.2501 0.0139 0.0129Nov 17, 14 10.2461 0.0110 0.0102Nov 24, 14 10.2471 0.0117 0.0108
RReettaaiill OOppttiioonn - DDiirreecctt PPllaannNov 03, 14 10.2503 0.0140 0.0140Nov 10, 14 10.2502 0.0139 0.0129Nov 17, 14 10.2462 0.0110 0.0102Nov 24, 14 10.2473 0.0118 0.0110
RReeccoorrdd CCuumm DDiivv DDiivviiddeenndd PPeerr uunniitt ((`̀)) FFoorr DDaattee NNAAVV ((`̀)) IInnddiivviidduuaallss && HHUUFF OOtthheerrss
RReeccoorrdd CCuumm DDiivv DDiivviiddeenndd PPeerr uunniitt ((`̀)) FFoorr DDaattee NNAAVV ((`̀)) IInnddiivviidduuaallss && HHUUFF OOtthheerrss
(Weekly Dividend Reinvestment Option) (Past 1 month)
HDFC Floating Rate Income Fund - Long Term Plan
WWhhoolleessaallee OOppttiioonnSep 29, 14 10.2302 0.0671 0.0643Oct 27, 14 10.2171 0.0530 0.0491Nov 24, 14 10.2194 0.0547 0.0507
WWhhoolleessaallee OOppttiioonn - DDiirreecctt PPllaannSep 29, 14 10.2306 0.0674 0.0646Oct 27, 14 10.2175 0.0533 0.0494Nov 24, 14 10.2198 0.0549 0.0510
RReeccoorrdd DDaattee CCuumm DDiivviiddeenndd NNAAVV ((`̀)) DDiivviiddeenndd PPeerr uunniitt ((`̀)) FFoorr IInnddiivviidduuaallss && HHUUFF OOtthheerrss
MMoonntthhllyy DDiivviiddeenndd OOppttiioonn (Past 3 months)
WWhhoolleessaallee OOppttiioonnSeptember 2014 Daily 10.0809 0.0580 0.0557October 2014 Daily 10.0809 0.0566 0.0525November 2014 Daily 10.0809 0.0523 0.0483
WWhhoolleessaallee OOppttiioonn - DDiirreecctt PPllaannSeptember 2014 Daily 10.0809 0.0583 0.0558October 2014 Daily 10.0809 0.0570 0.0527November 2014 Daily 10.0809 0.0521 0.0488
MMoonntthh RReeccoorrdd DDaattee EExx-ddiivviiddeenndd NNAAVV ppeerr UUnniitt ((`̀)) AAggggrreeggaattee DDiivviiddeenndd PPeerr UUnniitt ((`̀)) ffoorr tthhee mmoonntthh IInnddiivviidduuaallss && HHUUFF OOtthheerrss
DDaaiillyy DDiivviiddeenndd RReeiinnvveessttmmeenntt OOppttiioonn** (Past 3 months)
HDFC Floating Rate Income Fund - Short Term Plan
HDFC Gilt Fund (Past 3 quarters)
Mar 25, 14 11.0671 0.1500 0.1437Jun 25, 14 11.1624 0.1500 0.1437Sep 25, 14 11.1879 0.2000 0.1915
Direct PlanMar 25, 14 11.1075 0.1500 0.1437Jun 25, 14 11.1624 0.2117 0.1437Sep 25, 14 11.2458 0.2000 0.1915
Mar 25, 14 10.6364 0.1000 0.0958Jun 25, 14 10.9535 0.2000 0.1915Sep 25, 14 10.9557 0.2000 0.1915
Direct PlanMar 25, 14 10.6703 0.1000 0.0958Jun 25, 14 10.9973 0.2000 0.1915Sep 25, 14 11.0114 0.2000 0.1915
RReeccoorrdd CCuumm DDiivv DDiivviiddeenndd PPeerr uunniitt ((`̀)) FFoorr DDaattee NNAAVV ((`̀)) IInnddiivviidduuaallss && HHUUFF OOtthheerrss
RReeccoorrdd CCuumm DDiivv DDiivviiddeenndd PPeerr uunniitt ((`̀)) FFoorr DDaattee NNAAVV ((`̀)) IInnddiivviidduuaallss && HHUUFF OOtthheerrss
Short Term Plan (Dividend Option) Long Term Plan (Dividend Option)
November 2014 73Intouchmutually

Disclaimer:
The information contained herein should not be altered in any way, transmitted to, copiedor distributed, in part or in whole, to any other person or to the media or reproduced in anyform, without prior written consent of HDFC Asset Management Company Limited (HDFC AMC)or the relevant owner of the intellectual property, as the case may be. All Intellectual propertyand intellectual property rights belong to the relevant owner of the intellectual property, and“Intouch Mutually” is a trademark of HDFC AMC.
Any information herein contained does not constitute and shall be deemed not to consti-tute an advice, an offer to sell/ purchase or as an invitation or solicitation to do so for any secu-rities of any entity, and further, HDFC AMC / its subsidiaries / affiliates / sponsors / trustee (HDFCAMC Group) or their officers, employees, personnel, directors may be associated in a commer-cial, professional or personal capacity or may have a commercial interest including as propri-etary traders in or with the securities and/ or companies or issues or matters as contained in thispublication and such commercial capacity or interest whether or not differing with or conflictingwith this publication, shall not make or render (HDFC AMC Group) liable in any manner what-soever & (HDFC AMC Group) or any of their officers, employees, personnel, directors shall notbe liable for any loss, damage, liability whatsoever for any direct or indirect loss arising from theuse or access of any information that may be displayed in this publication from time to time.Recipients of the information contained herein should exercise due care and caution and readthe Scheme Information Document(s) and Statement of Additional Information (including if nec-essary, obtaining the advice of tax / legal / accounting / financial / other professionals) prior totaking of any decision, acting or omitting to act, on the basis of the information contained here-in. The printing and mailing cost of this newsletter is charged to the respective schemes subjectto Securities & Exchange Board of India (Mutual Funds) Regulations, 1996.
The author’s opinions, beliefs and viewpoints published in Intouch Mutually (Page No. 4)are his own views and not of HDFC AMC Group, or any of their officers, employees, personneland directors. HDFC AMC Group or any of their officers, employees, personnel, directors do notaccept responsibility for the author’s content and make no representation as to the accuracy,completeness or reliability of the author’s content and hereby disclaim any liability with regardto the same.
HDFC Index Fund – SENSEX Plan & SENSEX Plus Plan (“Schemes”) is based on the S&P BSESENSEX Index. S&P® is a registered trademark of S&P Financial Services Limited (S&P). BSE®and SENSEX® are registered trademarks of BSE Limited. The Schemes is not sponsored,endorsed marketed or promoted by S&P, BSE or their respective affiliates. Please refer to theScheme Information Document for disclaimers w.r.t. S&P BSE SENSEX Index.
MUTUAL FUND INVESTMENTS ARE SUBJECT TO MARKETRISKS, READ ALL SCHEME RELATED DOCUMENTS CAREFULLY.
HDFC Cash Management Fund - Treasury Advantage Plan
RReettaaiill OOppttiioonnNov 03, 14 10.0826 0.0146 0.0135Nov 10, 14 10.0818 0.01404 0.0130Nov 17, 14 10.0775 0.0109 0.0101Nov 24, 14 10.0768 0.0104 0.0096
RReettaaiill OOppttiioonn - DDiirreecctt PPllaannNov 03, 14 10.0841 0.0157 0.0146Nov 10, 14 10.0832 0.0114 0.0106Nov 17, 14 10.0840 0.0120 0.0111Nov 24, 14 10.0832 0.0114 0.0106
WWhhoolleessaallee OOppttiioonnNov 03, 14 10.0837 0.0154 0.01435Nov 10, 14 10.0829 0.0148 0.0137
Nov 17, 14 10.0788 0.0118 0.0110Nov 24, 14 10.0779 0.0112 0.0104
RReeccoorrdd CCuumm DDiivv DDiivviiddeenndd PPeerr uunniitt ((`̀)) FFoorr DDaattee NNAAVV ((`̀)) IInnddiivviidduuaallss && HHUUFF OOtthheerrss
RReeccoorrdd CCuumm DDiivv DDiivviiddeenndd PPeerr uunniitt ((`̀)) FFoorr DDaattee NNAAVV ((`̀)) IInnddiivviidduuaallss && HHUUFF OOtthheerrss
WWeeeekkllyy DDiivviiddeenndd OOppttiioonn (Past 1 month)
MMoonntthhllyy DDiivviiddeenndd OOppttiioonn (Past 3 months)
DDaaiillyy DDiivviiddeenndd RReeiinnvveessttmmeenntt OOppttiioonn** (Past 3 months)
HDFC Cash Management Fund - Call Plan
MMoonntthh RReeccoorrdd DDaattee EExx-ddiivviiddeenndd NNAAVV ppeerr UUnniitt ((`̀)) AAggggrreeggaattee DDiivviiddeenndd PPeerr UUnniitt ((`̀)) ffoorr tthhee mmoonntthh IInnddiivviidduuaallss && HHUUFF OOtthheerrss
RReettaaiill OOppttiioonnSeptember 2014 Daily 10.0315 0.0520 0.0496October 2014 Daily 10.0315 0.0540 0.0501November 2014 Daily 10.0315 0.0469 0.0434
RReettaaiill OOppttiioonn - DDiirreecctt PPllaannSeptember 2014 Daily 10.0315 0.0568 0.0543October 2014 Daily 10.0315 0.0583 0.0543November 2014 Daily 10.0315 0.0511 0.0472
September 2014 Daily 10.4266 0.0490 0.0465October 2014 Daily 10.4266 0.0510 0.0474November 2014 Daily 10.4266 0.0457 0.0426
DDiirreecctt PPllaannSeptember 2014 Daily 10.4266 0.0492 0.0473October 2014 Daily 10.4266 0.0514 0.0479November 2014 Daily 10.4266 0.0459 0.0428
MMoonntthh RReeccoorrdd DDaattee EExx-ddiivviiddeenndd NNAAVV ppeerr UUnniitt ((`̀)) AAggggrreeggaattee DDiivviiddeenndd PPeerr UUnniitt ((`̀)) ffoorr tthhee mmoonntthh IInnddiivviidduuaallss && HHUUFF OOtthheerrss
RReeccoorrdd CCuumm DDiivv DDiivviiddeenndd PPeerr uunniitt ((`̀)) FFoorr DDaattee NNAAVV ((`̀)) IInnddiivviidduuaallss && HHUUFF OOtthheerrss
RReettaaiill OOppttiioonnSep 29, 14 10.1265 0.0596 0.0571Oct 27, 14 10.1183 0.0496 0.0460Nov 24, 14 10.1187 0.0499 0.0462
RReettaaiill OOppttiioonn - DDiirreecctt PPllaannSep 29, 14 10.2271 0.0659 0.0631Oct 27, 14 10.2176 0.0545 0.0506Nov 24, 14 10.2177 0.0546 0.0506
WWhhoolleessaallee OOppttiioonnSep 29, 14 10.1324 0.0642 0.0615Oct 27, 14 10.1230 0.0530 0.0491Nov 24, 14 10.1234 0.0533 0.0494
DDaaiillyy DDiivviiddeenndd RReeiinnvveessttmmeenntt OOppttiioonn** (Past 3 months)
HDFC Cash Management Fund - Savings PlanDDaaiillyy DDiivviiddeenndd RReeiinnvveessttmmeenntt OOppttiioonn** (Past 3 months)
MMoonntthh RReeccoorrdd DDaattee EExx-ddiivviiddeenndd NNAAVV ppeerr UUnniitt ((`̀)) AAggggrreeggaattee DDiivviiddeenndd PPeerr UUnniitt ((`̀)) ffoorr tthhee mmoonntthh IInnddiivviidduuaallss && HHUUFF OOtthheerrss
WWeeeekkllyy DDiivviiddeenndd OOppttiioonn (Past 1 month)
Nov 07, 14 10.6423 0.0128 0.0118Nov 14, 14 10.6419 0.0125 0.0116Nov 21, 14 10.6421 0.0126 0.0117Nov 28, 14 10.6419 0.0125 0.0116
DDiirreecctt PPllaannNov 07, 14 10.6424 0.0128 0.0119Nov 14, 14 10.6421 0.0126 0.0117Nov 21, 14 10.6422 0.0127 0.0118Nov 28, 14 10.6420 0.0126 0.0116
RReeccoorrdd CCuumm DDiivv DDiivviiddeenndd PPeerr uunniitt ((`̀)) FFoorr DDaattee NNAAVV ((`̀)) IInnddiivviidduuaallss && HHUUFF OOtthheerrss
RReeccoorrdd CCuumm DDiivv DDiivviiddeenndd PPeerr uunniitt ((`̀)) FFoorr DDaattee NNAAVV ((`̀)) IInnddiivviidduuaallss && HHUUFF OOtthheerrss
September 2014 Daily 10.6364 0.0582 0.0558October 2014 Daily 10.6364 0.0585 0.0543November 2014 Daily 10.6364 0.0523 0.0482
DDiirreecctt PPllaannSeptember 2014 Daily 10.6364 0.0588 0.0560October 2014 Daily 10.6364 0.0589 0.0547November 2014 Daily 10.6364 0.0524 0.0486
Dividend History ^
^̂ PPaasstt ppeerrffoorrmmaannccee mmaayy oorr mmaayy nnoott bbee ssuussttaaiinneedd iinn tthhee ffuuttuurree.. There is no assurance or guarantee to Unit holders as to rate/quantum of dividend distribution northat the dividends will be paid regularly. All dividends are on face value of `̀ 10 per Unit. After payment of the dividend, the per Unit NAV fallsto the extent of the payout and statutory levy, if any.* Please log on to www.hdfcfund.com for Record Date-wise listing of dividends declared
74 November 2014 Intouchmutually

INVESTOR SERVICE CENTRES (ISCs)AANNDDHHRRAA PPRRAADDEESSHHHDFC AMC Ltd., 18-2-299/B, 1st Floor, Leela MahalCircle, Tirumala Bypass Road, TTiirruuppaattii - 517 507. Tel: (0877) 2222 871 / 872 / 873 / 874, Fax: (0877) 2222689. HDFC AMC Ltd., 2nd Floor, Centurion Bank Complex,Near Benz Circle, M. G. Road, VViijjaayyaawwaaddaa - 520 010. Tel. No: (0866) 3988029. HDFC AMC Ltd., First Floor, Saigopal Arcade, WaltairMain Road, Siripuram, VViissaakkhhaappaattnnaamm - 530 003. Tel: (0891) 3263457, 6634001, Fax. No.: (0891) 6634004. AASSSSAAMMHDFC AMC Ltd., Premises- 1C, 1st Floor, GanpatiEnclave, G.S.Road, GGuuwwaahhaattii - 781 007. Tel: (0361) 2464759/60. Fax: (0361) 2464758. BBIIHHAARRHDFC AMC Ltd., Ishwari Complex, 1st Floor, Dr. Rajendra Prasad Road, BBhhaaggaallppuurr - 812 002. Tel: (0641) 2300 390, Fax: (0641) 2300391. HDFC AMC Ltd., Ravi Market, 1st Floor, JawaharlalRoad, MMuuzzaaffffaarrppuurr – 842001.Tel: (0621) 2245036/37, Fax: (0621) 2245037. HDFC AMC Ltd., C/o Hera Enclave (Above TATADocomo Office), 1st Floor, New Dak Bunglow Road,PPaattnnaa - 800 001. Tel: (0612) 6457554/6457557/3201439, Telefax: (0612) 2200747. CCHHHHAATTTTIISSGGAARRHHHDFC AMC Ltd., Shop No 1, Ground Floor, Old Sada Office Block, Nehru Nagar East, BBhhiillaaii - 490020. Tel: (0788) 4092948, 4092846, Fax: (0788) 4092901. HDFC AMC Ltd., 2nd Floor, Rama Trade Centre,Opposite Rajiv Plaza, Near Bus stand, BBiillaassppuurr – 495 001. Tel: (07752) 400305/ 06. Fax: (07752) 400307. HDFC AMC Ltd., Ground Floor, Chawla Complex,Devendra Nagar, Sai Nagar Road, Near VanijyaBhawan, Near Indhira Gandhi Square, RRaaiippuurr - 492 001. Tel: (0771) 4020 167 / 168. DDEELLHHIIHDFC AMC Ltd., Ground Floor - 2 & 3 and First Floor,Prakashdeep Building, 7, Tolstoy Marg, ConnaughtPlace, NNeeww DDeellhhii - 110 001. Tel: (011) 6632 4000,Fax: (011) 23351317 /18. HDFC AMC Ltd. Unit Nos. 402, 404, 406, 4th floor, Mahatta Tower, 54 B-1 Block, Community Center , Janakpuri, NNeeww DDeellhhii – 110 058. Fax: (011) 41082131 HDFC AMC Ltd., 134/4 , Bhandari House, Lala Lajpat Rai Marg, Kailash Colony - Main Road,Near Kailash Colony Metro Station, South Delhi, NNeeww DDeellhhii – 110 048. Tel : 011-29244801/02. Fax : 011-29244805.GGOOAAHDFC AMC Ltd., Ground Floor, G3 & G4, Jivottam,Minguel Miranda Road, Off. Abade Faria Road,MMaarrggaaoo - 403 601. Salcete. Tel: (0832) 2737410 / 11.Fax: (0832) 2736477. HDFC AMC Ltd., S1, Second Floor, Above Axis Bank,Edcon Centre, Angod, MMaappuussaa - 403 507, Bardez, Goa. Tel: (0832) 2253 460 / 461, Fax: (0832) 2253465. HDFC AMC Ltd., A-3, First Floor, Krishna Building, Opp. Education Department, Behind SusheelaBuilding, G. P. Road, PPaannaajjii - 403 001. Tel: 0832 - 2425609, 2425610, Fax: 0832 - 2425614. HDFC AMC Ltd., 6, Ground Floor, Pereira Chambers,Padre Jose Vaz Road, VVaassccoo - 403 802, Mormugao. Tel: (0832) 2513 402 / 406, Fax: (0832) 2513448. GGUUJJAARRAATTHDFC AMC Ltd., 2nd Floor, Megha House, BesidesGRUH House, Mithakhali Six Roads, AAhhmmeeddaabbaadd - 380 009. Tel.: 079 – 40220099/00, Fax: 079 - 40050506. HDFC AMC Ltd., Maruti Sharanam, No.117, 1st Floor, Anand-Vidhyanagar Road, Opposite Nandbhumi PartyPlot, AAnnaanndd - 388 001. Tel: (02692) - 398200, Fax: (02692) - 398222. HDFC AMC Ltd., 3rd Floor, Shreemangalam Complex,Above IDBI Bank, Patel Society Road, Ward No. 1,Kasak Circle, BBhhaarruucchh - 392 012. Tel: (0264) 2227205, Fax: (0264) 2227206. HDFC AMC Ltd., 2nd Floor, Gangotri Plaza, OppositeDaxinamurty School, Waghawadi Road, BBhhaavvnnaaggaarr - 364 001. Tel: (0278) - 3988029, Fax: (0278) - 3984039. HDFC AMC Ltd., 1st Floor, B Wing, Katira Complex,
RTO Circle, BBhhuujj - 370 001. Tel: (02832) 223 223, Fax: (02832) 251. 946 HDFC AMC Ltd., 2nd Floor, Keshav Complex, P N Marg, Opposite Dhanvantry, JJaammnnaaggaarr - 361 001.Tel: (0288) - 3988029, 2555663, Fax: (0288) - 3982426. HDFC AMC Ltd., 1st Floor, Nos. 104 – 105, MaryGold-2 Complex, Opp. Bahhaudin College,College Road, JJuunnaaggaaddhh - 362001. Tel: (0285) 2670622/23, Fax: (0285) 2670624. HDFC AMC Ltd., 2nd Floor, Rajendra Estate, State Highway, MMeehhssaannaa - 384 002. Tel: (02762) 302000. Fax: (02762) 302020. HDFC AMC Ltd., 1st Floor, Nandini Complex, Above HDFC Bank, Opp. Daboo Hospital, Station Road, Navsari- 396445. Tel: (02637) 252681/82/83, Fax: (02637) 252684. HDFC AMC Ltd., 2nd Floor, Shiv Darshan, Dr. Radha Krishnan Road, 5, Jagnath, Plot Corner,RRaajjkkoott - 360 001. Tel: 0281- 6624881 / 82, Fax: 0281 - 6624883. HDFC AMC Ltd., U1 - U3, Jolly Plaza, Opp. AthwaGate Police Station, Athwa Gate, SSuurraatt - 395 001. Tel: 0261 – 2460082 / 83, Fax: 0261 - 2460091. HDFC AMC Ltd., Upper Ground Floor, Gokulesh, R. C. Dutt Road, VVaaddooddaarraa - 390 007. Tel: 0265 - 6621110 / 20, Fax: 0265 - 6621150. HDFC AMC Ltd., 5-B, 2nd Floor, Sapphire Building,Daulatnagar, Chala-Vapi Road, VVaappii - 396 191. Tel: (0260) 3983900, Fax: (0260) 3983908. HHAARRYYAANNAAHDFC AMC Ltd., 1st Floor, Sudarshan Tower, CrossRoad # 1, Nicholson Road, AAmmbbaallaa CCaanntttt -133 001. Tel: (0171) 2631995/6, Fax: (0171) 2631994. HDFC AMC Ltd., TA - 12A, 15-18, Third Floor, Crown Plaza, Sector 15A, Mathura Road, FFaarriiddaabbaadd - 121 001. Tel: (0124) 2221 338 / 339 /341 / 342 / 343, Fax: (0129) 2221340. HDFC AMC Ltd., Premises 105, 106 & 107, 1st Floor, Vipul Agora Building, MG Road, GGuurrggaaoonn - 122 002. Tel: (0124) 2560 450/ 51, Fax: (0124) 2560455. HDFC AMC Ltd., 1175 B Royal 1, 1st Floor, AdjoiningGurudawara, G.T Road, PPaanniippaatt - 132 103. Tel: (0180) 3985400/ 01, Fax: (0180) 3985403. HHIIMMAACCHHAALL PPRRAADDEESSHHHDFC AMC Ltd., 2nd Floor, Opposite Town Hall, 30,The Mall, SShhiimmllaa – 171 001. Tel: (0177) 2816861. JJAAMMMMUU && KKAASSHHMMIIRRHDFC AMC Ltd., Hall No-102 A/2, South Block, Bahu Plaza, Gandhi Nagar, JJaammmmuu - 180 012. Tel: (0191)-2477911/12/13 / (0191) 2474297/98/99. JJHHAARRKKHHAANNDDHDFC AMC Ltd., Vardhan Complex, 1st Floor, Opp. Woodland Showroom, Bank More, DDhhaannbbaadd - 826 001. Tel: (0326) 3205352, 2300552,Fax: (0326) 2301756. HDFC AMC Ltd., Gayatri Enclave, 2nd Floor, "K Road", Bistupur, JJaammsshheeddppuurr - 831 001. Tel: (0657) 3021203/05, Telefax: (0657) 3021204. HDFC AMC Ltd., Pradhan Towers, 1st Floor, 5, Main Road, RRaanncchhii - 834 001. Tel: (0651) 6003358, 3242077. Fax: (0651) 3988029. KKAARRNNAATTAAKKAAHDFC AMC Ltd., Nitesh Broadway, No. 9/3, 1-A, Ground Floor, M. G. Road, Opposite Trinity Metro Station, BBaannggaalloorree – 560001. Tel: 080-66205300, Fax: 080-41125255. HDFC AMC Ltd., # 493, 1st Floor, 4th Cross, 2nd Main, Sampige Road, Malleshwaram, BBaannggaalloorree - 560 003. HDFC AMC Ltd., Garla Garnet No. 119/A/36, 9th Main, 4th Block, Jayanagar, BBaannggaalloorree – 560011. Tel No: (080) 41460260/61/62, Fax No: (080) 41460263. HDFC AMC Ltd., # 145, 1st Floor, 60 ft Road, 5th Block, Koramangala, BBaannggaalloorree - 560 034. HDFC AMC Ltd., Premises No. 4830 / B, First Floor, Dr. Ambedkar Road, Opp. Civil Medical College, BBeellggaauumm - 590 002. Tel: (0831) 4206 915 / 916 / 918,Fax: (0831) 4206919. HDFC AMC Ltd., Office No. 39 (Old No - 41), GroundFloor, Behind Maremma Temple, Opposite HDFC Bank,Kappagal Road, BBeellllaarryy – 583103. Tel: 08392-256577. Fax: 08392-256575. HDFC AMC Ltd., 190/3, 1st Floor, S.V.C. Plaza, Opposite Mothi Talkies, Gandhi Circle, DDaavvaannggeerree - 577 002. Tel: (08192) 250 240 / 241 /242, Fax: (08192) 250243.
HDFC AMC Ltd., No. 1, First Floor, Revankar Comforts,Vivekanand Road, Court Circle, HHuubbllii - 580 029. Tel: (0836) 4252 294 / 95. Fax: (0836) 4252 290. HDFC AMC Ltd., UG-II, 6 & 7, Upper Ground Floor, Maximus Commercial Complex, Light House Hill Road, Opp. KMC, MMaannggaalloorree - 575 001. Tel. 0824 – 6620667/668, Fax: 0824 – 6620666. HDFC AMC Ltd., No. 2918, CH 51 / 1 B, 1st Floor, Patel Mansion, Kantharaj Urs Road, Saraswathipuram, MMyyssoorree - 570 009. Tel: (0821) 4000 530, Fax: (0821) 4000 535. KKEERRAALLAAHDFC AMC Ltd., 3rd Floor, City Mall, Opposite YMCA, Kannur Road, CCaalliiccuutt - 673 001. Tel: (0495) - 4099222 / 333, 3982310, Fax: (0495) - 3982330. HDFC AMC Ltd., Ground Floor, Cinema cumCommercial Complex, Behind Ravipuram Bus Stop, M. G. Road, KKoocchhii - 682 016. Tel: 0484 - 2357707 /8, 3243058 / 59, Fax: 0484 - 2358462. HDFC AMC Ltd., 14/868, Ground Floor, Sri KrishnaComplex, Coimbatore Road, PPaallgghhaatt - 678 001. Tel: (0491) 2548300/302, 6452188, Fax: (0491) 2548303. HDFC AMC Ltd., 2nd Floor, E-Town Shopping, College Road, East Fort, TThhrriissssuurr - 680 005. Tel: (0487) 2441976. Telefax: (0487) 2422925. HDFC AMC Ltd., 1st Floor, Kaniamparambil Arcade, G S Junction, Shastri Road, KKoottttaayyaamm - 686 001. Tel: (0481) 3018392/93. Fax: (0481) 3018397. HDFC AMC Ltd., Ground Floor, Bhadra Tower, Cotton Hill Road, Vazhuthacaud, Thycaud P.O.,TTrriivvaannddrruumm – 695 014. Tel: (0471) 3983 730 / 731 /732 Fax: (0471) 3983738. MMAADDHHYYAA PPRRAADDEESSHHHDFC AMC Ltd., 1st Floor, Ranjeet Tower, 8, Zone-II, M. P. Nagar, BBhhooppaall - 462 011. Tel: 0755 - 4285385, 4246995, Fax: 0755 - 4058890. HDFC AMC Ltd., M1, M2 & M3, Mezzanine Floor, Sterling Arcade,15 / 3, Race Course Road, IInnddoorree - 452 001. Tel: 0731 - 4022241 / 42. Fax: 0731 - 4245436. HDFC AMC Ltd., First Floor, Muthye UdyogBhawan,1039, Wright Town, Opp. TelephoneExchange, JJaabbaallppuurr - 482 002. Tel: (0761) - 4049800,3988029 Fax: (0761) - 4068814. HDFC AMC Ltd., First Floor, Alakhnanda Towers, Shrimant Madhav Rao Scindia Marg, City Centre, GGwwaalliioorr - 474 001. Tel: (0751) - 4066060, 3988029 Fax: (0751) – 3982803. MMAAHHAARRAASSHHTTRRAAHDFC AMC Ltd., 1st Floor, Amar Arcade - 2, Opp. Rajapeth Police Station, Raja Peth, AAmmrraavvaattii - 444 601. Tel: (0721) 2562 112 / 113 Fax: (0721) 2564115. HDFC AMC Ltd., 2nd Floor, Renuka CommercialComplex, Samarth Nagar, Nirala Bazar, NageshwarWadi Road, AAuurraannggaabbaadd - 431 001. Tel: (0240) 3988029, Fax: (0240) 3982068. HDFC AMC Ltd., 138, Ground Floor, Kavya RatnavaliChowk, Omkareshwar Road, JJaallggaaoonn – 425 002. Tel: (0257) 3982100/ 01. Fax: (0257) 3982114. HDFC AMC Ltd., Royal Prestige, C1/C9, 1st Floor, E - Ward, Sykes Extension, Rajarampuri Road,KKoollhhaappuurr - 416 008. Tel: (0231) - 3988029, Fax: (0231) - 3982060. HDFC AMC Ltd.**, Premises Nos.. F1, 2, 3 & 4, 1st Floor, “Center Square”, S.V. Road, Andheri (W),MMuummbbaaii – 400 058. Tel: (022) 26708239 / 26285389.Fax: (022) 26241131. HDFC AMC Ltd.** Shop # 7, Abhilasha Building,Punjabi Lane, Borivali (W), MMuummbbaaii - 400 092. Tel: (022) 28952702/ 28901497, Fax: (022) 28949392. HDFC AMC Ltd.,* HUL House, 2nd floor, H.T. ParekhMarg, 165-166 Backbay Reclamation, Churchgate,MMuummbbaaii – 400 020 Tel: (022) 66316333, Fax: (022) 66580200. HDFC AMC Ltd., Mistry Bhavan, 2nd Floor, 122, Backbay Reclamation, Dinsha Vachha Road,Churchgate, MMuummbbaaii - 400 020. Tel: (022) 60006767, Fax: (022) 66580211. HDFC AMC Ltd.**, Shop No. 1 & 2, Ground Floor, Atlantic Tower, R B Mehta Road, Near Railway Station,Ghatkopar (East), MMuummbbaaii - 400 077. Tel: (022) 25011507, 25011664, Fax: (022) 25116805.
(Continued on next page)
November 2014 7755Intouchmutually

Registered Office: HUL House, 2nd floor, H.T. Parekh Marg, 165-166 Backbay Reclamation, Churchgate, Mumbai – 400 020.
Published and printed by Shailendra Sharad Kalelkar for and on behalf of Business Standard Limited from H4, Paragon Condominium, Opposite Century Mills, P B Marg, Worli, Mumbai 400013, and printed at M. P. Printers (A Unit of D.B.Corp. Ltd.), B- 220, Industrial Area, Phase – II, Noida – 201305 ( U.P.) India. Editor: Rajiv Shirali.
HDFC AMC Ltd.**, Unit No. 101, 1st Floor, Landmark Building, 136 Hill Road,Opp. St. PetersChurch, Bandra (West), MMuummbbaaii - 400 050. Tel: (022) 2643 4760 / 762 / 763 / 764, Fax: (022) 2643 4768. HDFC AMC Ltd.**, Shop no. 1 & 2, Ground floor,Gurangi Chambers, Opp. Damani Chambers, Near Teen Haath Naka, LBS Marg, TThhaannee (West) - 400 602. Tel: (022) 2538 5659, 2539 1125, 2538 6848, 6502 0205, 6536 5246,6536 5245, 6414 2389, Fax: (022) 25301125. HDFC AMC Ltd., 106-110, 2nd Floor, Shriram ShyamTowers, Near NIT Building, Kingsway, Sadar, NNaaggppuurr - 440 001. Tel: (0712) 663 0301/02/04, Fax: (0712) 663 0206. HDFC AMC Ltd. G- 1 & G-2, "Suyojit Heights", Opp. Rajiv Gandhi Bhavan, Sharanpur Road, NNaasshhiikk - 422 002. Tel: (0253) 6611831 / 32. Fax: (0253) 6611836. HDFC AMC Ltd., 6, Chetana Apartment, 2423, East Street, Pune Camp, PPuunnee - 411 001. Tel.: (020) 41223301/02, Fax: (020) 41223310. HDFC AMC Ltd., Ground Floor, City Mall, University Circle, Ganeshkhind Road, PPuunnee - 411 007.Tel: (020) 66073301, Fax: (020) 66073310. HDFC AMC Ltd.,** Office No. 13, Shanti CenterPremises, Plot No. 8, Sector 17, Vashi, NNaavvii MMuummbbaaii - 400 703. Tel: (022) 39880299. Fax: (022) 39855612.HDFC AMC Ltd.**, 1st Floor, Anant Kuti (BibikarBldg.), Manpada Road, Opp. Muncipal CorporationBldg., Dombivli (East), MMuummbbaaii - 421 201. Tel: (0251) 2860 648 / 649 / 645 / 656, Fax: (0251) 2863953. OORRIISSSSAAHDFC AMC Ltd., Sri Jagannath Complex, 1st Floor, Opposite Hari - Omm Bhawan, BBaarrbbiill - 758 035. Tel: 09238106515 / 09238106525, Fax: (06767) 275565. HDFC AMC Ltd., Vinayak, 2nd Floor, 96, Janpath, BBhhuubbaanneesswwaarr - 751 001. Tel: (0674) 6450502 / 1502, Fax: 0674 - 2531483. HDFC AMC Ltd., 1st Floor, Plot No. 2690 (P),Bajrakabati Road, Ranihat, CCuuttttaacckk – 753 001. Tel: (0671) 2323724/ 725, Fax: (0671) 2324741. HDFC AMC Ltd., Praful Tower, 1st Floor, PanposhRoad, RRoouurrkkeellaa - 769 004. Tel: (0661) 3988029,3982060/70, Fax: (0661) 3982068. HDFC AMC Ltd., Kadambari Complex, 1st Floor, Unit - 4, Nayapara, Golbazar, SSaammbbaallppuurr - 768 001. Tel: (0663) 2400 323 / 339, Fax: (0663) 2400324. PPOONNDDIICCHHEERRRRYYHDFC AMC Ltd., No.17, I Floor, Sree VelayudhamComplex, Near Indhira Gandhi Square, Natesan Nagar, PPoonnddiicchheerrrryy - 605 005. Tel: (0413) 3043 293 / 500 /600. Fax: (0413) 2206776. PPUUNNJJAABBHDFC AMC Ltd., SCO-28, 1st Floor, Taneja Towers, District Shopping Complex, Ranjit Avenue, AAmmrriittssaarr -143 001. Tel: (0183) 3988028 /29/ 2570,Fax: (0183) 3982599. HDFC AMC Ltd., Ground Floor, Liberty Chowk, Corner Building, Municipal No. 83 - B, 3A, BBhhaattiinnddaa - 151 001. Tel.: (0164) 5001982, Fax: (0164) 5191283. HDFC AMC Ltd., 1st Floor, SCO- 2909- 2910, Sector - 22-C, Opp. Hotel J W Marriot, CChhaannddiiggaarrhh - 160 022. Tel: (0172) 5050888, Fax: (0172) 277 1219. HDFC AMC Ltd., Ground Floor , Eminent Mall, SutheriRoad, Near Indusind Bank, HHoosshhiiaarrppuurr – 146 001. Tel : 01882- 502029, Fax : 01882- 502078.
HDFC AMC Ltd., 2nd Floor, Above ING Vysya Bank, Adjacent to Sekhon Grand Hotel, Namdev Chowk, G T Road, JJaallaannddhhaarr CCiittyy - 144 001. Tel: (0181) 3988029 / 970, Fax: (0181) 3982966. HDFC AMC Ltd., SCO 122, Feroze Gandhi Market, LLuuddhhiiaannaa - 141 001. Tel.: (0161) 277 4321 / 5014321. Fax: (0161) 3013838. HDFC AMC Ltd., SCO no - 70 , Ground Floor, New Leela Bhawan Market, PPaattiiaallaa -147 001. Tel : 0175 - 5010082, Fax : 0175 - 5010084.RRAAJJAASSTTHHAANNHDFC AMC Ltd., 4th Floor, K.C. Complex, Opp. Daulat Bagh, AAjjmmeerr - 305 001. Tel: (0145) 3099000.Fax: (0145) 3099001. HDFC AMC Ltd., “Moondhra Bhavan”, 3-Ajmer Road, JJaaiippuurr - 302 001. Tel: (0141) 511 6681/ 82 , 237 4968, Fax: (0141) 5111126. HDFC AMC Ltd., Gulab Singh Bhavan, 11, Chopasni Road, JJooddhhppuurr - 342 003. Tel: (0291) 510 1927, 510 1937, Fax: (0291) 510 5919. HDFC AMC Ltd., 1st Floor, Gowardhan Plaza, 25, Trench Colony, Opposite Lok Kalamandal, UUddaaiippuurr - 313 001. Tel: (0294) 3988029, Fax: (0294) 3982000. TTAAMMIILL NNAADDUUHDFC AMC Ltd., ITC Centre, 1st Floor, 760, Anna Salai, CChheennnnaaii - 600 002. Tel: (044) 43979797 /43979716, Fax: (044) 28415855. HDFC AMC Ltd., 1371A, Ground Floor, Nadar Building, Trichy Road, CCooiimmbbaattoorree - 641 018. Tel: (0422) 4391861/62/63. Fax: (0422) 4391714. HDFC AMC Ltd., 127 C/3 East Veli Street, MMaadduurraaii - 625 001. TeleFax: (0452) 3988029. HDFC AMC Ltd., 1st Floor, No1 Bhimsena GardenStreet, Royapettah High Road, Mylapore, CChheennnnaaii – 600 004. Tel: (044) 30913060, Fax: (044) 30913082. HDFC AMC Ltd., 1st floor, Ram Complex, No. 454/3, Meyanoor Main Road, SSaalleemm - 636 009. HDFC AMC Ltd., 1st floor, No. 142/7, Sri Balaji Arcade, Opp. Alagar Jewellery, Trivandrum Road, Palayamkottai, TTiirruunneellvveellii - 627 002.Tel: (0462) 2576174, Fax: (0462) 2576173. Tel: (0427) 3982680/700. Fax: (0427) 2333617. HDFC AMC Ltd., No. 60, Sri Krishna Arcade, First Floor, Tennur High Road, Tennur, TTrriicchhyy - 620 017.Tel: (0431) 3982830, Fax: (0431) 3982835. HDFC AMC Ltd., Premises No.73, 1st Floor Door No. 73/19, Thiyagarjapuram Officer’sLine Officer’s Line, VVeelllloorree - 632 001, Tel: (0416) 2214670/2. Fax: (0416) 2214671. TTEELLAANNGGAANNAAHDFC AMC Ltd., 6-3-883/7, IInd Floor, Saphire Square, Somajiguda, HHyyddeerraabbaadd - 500 282.Tel.: (040) 23417401 / 02 / 03 / 04 / 05, Fax: (040) 23417407. HDFC AMC Ltd., 2-5-83/84, 1st Floor, MitralaxmiNarayana Arcade, Nakkala Gutta, Hanmakonda,WWaarraannggaall - 506 002. Tel: (0870) 2566 005 / 006 / 007 / 008/ 009, Fax: (0870) 2566010.UUTTTTAARRAAKKHHAANNDDHDFC AMC Ltd., 76, Rajpur Road, Near RTO, DDeehhrraadduunn - 248 001. Tel: (0135) 3988029 / 7434, Fax: (0135) 3987444. HDFC AMC Ltd., Plot No. 1, 1st Floor, Durga City Centre, Bhotia Parao, Nainital Road,HHaallddwwaannii - 263 139. Tel: (05946) 285286 Fax: (05946) 285290.HDFC AMC Ltd., 1st Floor, Kumar Complex, Chandracharya Chowk, HHaarriiddwwaarr - 249407 Tel: (01334) 222406/7 Fax: (01334) 222410. UUTTTTAARR PPRRAADDEESSHHHDFC AMC Ltd., B2, 1st Floor, 9/4, Shankar Point,Sanjay Place, AAggrraa - 282 002.
Tel: (0562) 3984761-73, Fax: (0562) 3984777. HDFC AMC Ltd., 3/260-A, Arena Complex, Laxmibai Marg, Marris Road, AAlliiggaarrhh - 202 001. Tel: (0571) 2740 770 / 771 / 772, Fax: (0571) 2740772. HDFC AMC Ltd., 3rd Floor, Agarwal Arcade, Hyundai Motors Showroom, 4 Sardar Patel Marg, Civil Lines, AAllllaahhaabbaadd - 211 001. Tel: (0532) 2561 035/036/038, Fax: (0532) 2561035. HDFC AMC Ltd., 146 Civil Lines, 1st Floor, Gupta Complex, Near Circuit House Chouraha, BBaarreeiillllyy - 243 001. Tel: (0581) 2510 749 / 759, Fax: (0581) 2510709. HDFC AMC Ltd., D-2, 1st Floor, Raj Nagar DistrictCentre, Raj Nagar, GGaazziiaabbaadd - 201 010. Tel: (0120)301 0635, Fax: (0120) 3010636. HDFC AMC Ltd., 4th Floor, A.D. Tower Compound,Bank Road, GGoorraakkhhppuurr -273 001, Tel. No: (0551) 6060011/2/3. HDFC AMC Ltd., 101 & 201, Sai Arcade, 16/34 Bhargava Estate, Civil Lines, KKaannppuurr - 208 001. Tel: (0512) 3935592/93/94, Fax: (0512) 3935596. HDFC AMC Ltd., 1st Floor, Narain Ford Building, 4 Shah Najaf Road, Hazratganj, LLuucckknnooww - 226 001. Tel: (0522) 4155500/ 01, Fax: (0522) 4155555. HDFC AMC Ltd., 143/145/1, Ganpati Plaza, GroundFloor, Magal Pandey Nagar, MMeeeerruutt - 250 005. Tel: (0121) 2602 380 / 2601 965, Fax: (0121) 2602380. HDFC AMC Ltd., Parsvnath Plaza-II, UGF Hall No.4,Delhi Road, MMoorraaddaabbaadd - 244 001. Tel: (0591) 3988029 / 3982131. Fax: (0591) 3982137. HDFC AMC Ltd., K-24/25, First Floor, Pearl Plaza Building, Sector-18, NNooiiddaa - 204 301. Tel: (0120) 432 5757/ 5959. Fax: (0120) 423 4349. HDFC AMC Ltd., D-64/127, 4th Floor, ArihantComplex, Sigra, VVaarraannaassii - 221 010. Tel: (0542) 6450711/ 6450712. WWEESSTT BBEENNGGAALLHDFC AMC Ltd., 2nd Floor, Chatterjee Plaza, 69/101,GT Road, Rambandhutala, AAssaannssooll - 713 303. Tel: (0341) 2221220, Fax: (0341) 2221219. HDFC AMC Ltd., City Plaza, City Centre, 1st Floor, DDuurrggaappuurr - 713 216. Tel: (0343) 3982150, Fax: (0343) 3982153. HDFC AMC Ltd., Krishna Enclave, 2nd Floor, 2/1, Bhajanlal Lohia Lane, Opposite Howrah A.C. Market, HHoowwrraahh - 711 101, Phone: (033) 33546150/163, Fax: (033) 33546157. HDFC AMC Ltd., Menaka Estate, 1st Floor, 3 Red Cross Place, KKoollkkaattaa - 700 001. Tel: (033) 22312875, 22312876, Fax: (033) 22439582. HDFC AMC Ltd., 2nd Floor, 209A, Sarat Bose Road, Besides Sarat Bose Road Post Office, KKoollkkaattaa - 700029. Tel: (033) 33541166/67/68/70/71,Fax: (033) 33541172.HDFC AMC Ltd., Gitanjali Complex, 2nd Floor, AboveCorporation Bank, Sevoke Road, SSiilliigguurrii - 734 001. Tel: (0353) 6453474. Fax: (0353) 2545270.* This is not an Investor Service Centre for HDFCMutual Fund. However, this is an official point of acceptance for acceptance of all on-going transactions from Institutional Investors only, i.e.broadly covering all entities other than resident / non resident individuals. Institutional Investors are free to lodge their applications at any other officialpoints of acceptance also.** Official points of acceptance of transactions forschemes of HDFC Mutual Fund except purchase transactions of Liquid Schemes / Plans viz. HDFC Liquid Fund, HDFC Liquid Fund - Premium Planand HDFC Cash Management Fund - Savings Plan &Call Plan.
WANT TO HAVE THE LATEST INFORMATION ABOUT US ?
Toll-free number : 1800 3010 6767/1800 419 7676
e-mail For any query or suggestions:-
Investors may contact us at: [email protected]
Distributors may contact us at: [email protected]
SMS: HDFCMF to 56767
Telephone Services
Visit us at www.hdfcfund.com
(Continued from previous page)
INVESTOR SERVICE CENTRES (ISCs)
Intouchmutually, November 2014, Registered with Registrar of Newspapers under RNI No. MAHENG/2003/10804


