46
CRIST|KOLDER ASSOCIATES Volatility Report 2015
CRIST|KOLDER ASSOCIATESVolatility Report 2015
CRIST|KOLDER Volatility Report
Table of Contents
Page 1 Report Methodology
Page 4 Report Highlights
Page 5 Executive Turnover
Page 13 C-Suite Career Paths
Page 28 Diversity Landscape
Page 36 Education Background
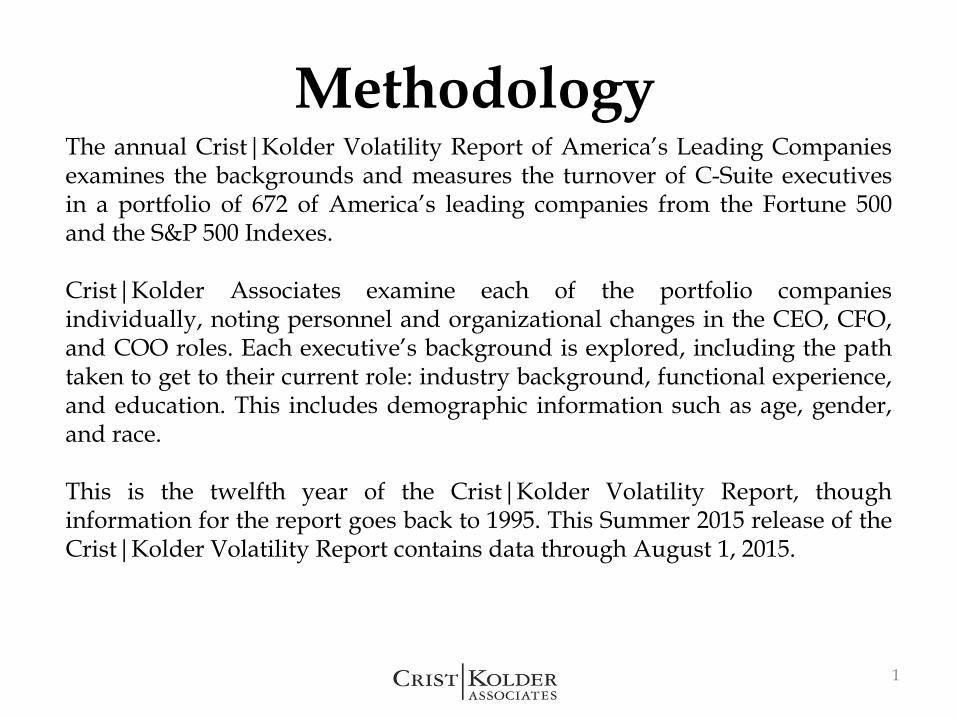
The annual Crist|Kolder Volatility Report of America’s Leading Companiesexamines the backgrounds and measures the turnover of C-Suite executivesin a portfolio of 672 of America’s leading companies from the Fortune 500and the S&P 500 Indexes.
Crist|Kolder Associates examine each of the portfolio companiesindividually, noting personnel and organizational changes in the CEO, CFO,and COO roles. Each executive’s background is explored, including the pathtaken to get to their current role: industry background, functional experience,and education. This includes demographic information such as age, gender,and race.
This is the twelfth year of the Crist|Kolder Volatility Report, thoughinformation for the report goes back to 1995. This Summer 2015 release of theCrist|Kolder Volatility Report contains data through August 1, 2015.
Methodology
1
Methodology Notes
2
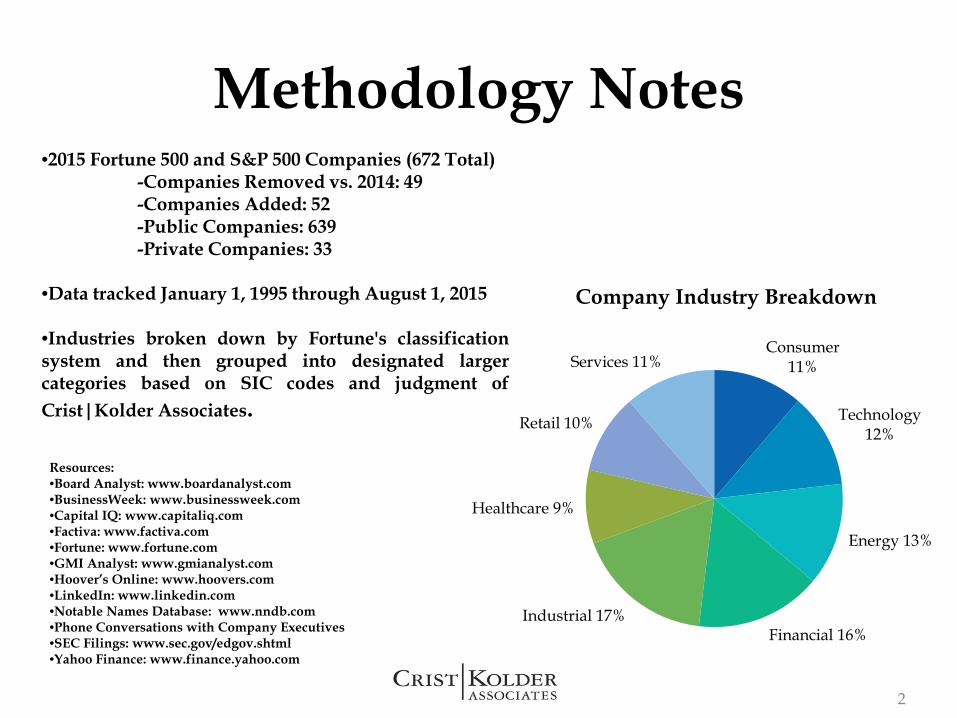
•2015 Fortune 500 and S&P 500 Companies (672 Total) -Companies Removed vs. 2014: 49 -Companies Added: 52-Public Companies: 639-Private Companies: 33
•Data tracked January 1, 1995 through August 1, 2015
•Industries broken down by Fortune's classificationsystem and then grouped into designated largercategories based on SIC codes and judgment ofCrist|Kolder Associates.
Resources:•Board Analyst: www.boardanalyst.com•BusinessWeek: www.businessweek.com•Capital IQ: www.capitaliq.com•Factiva: www.factiva.com•Fortune: www.fortune.com•GMI Analyst: www.gmianalyst.com•Hoover’s Online: www.hoovers.com•LinkedIn: www.linkedin.com •Notable Names Database: www.nndb.com•Phone Conversations with Company Executives•SEC Filings: www.sec.gov/edgov.shtml•Yahoo Finance: www.finance.yahoo.com
Company Industry Breakdown
Consumer11%
Technology12%
Energy 13%
Financial 16%Industrial 17%
Healthcare 9%
Retail 10%
Services 11%
Volatility: Turnover is noted when the executive starts in the new role (as opposed to the data of announcement).
Internal change: An executive is promoted to a new role at the company where he/she is already employed.
External change: An executive is recruited to a position at a company to which he/she has no formal ties.
Mergers: In a merger of equals, the combined company is considered a new entity. A change in leadership, therefore, is marked for all mergers. A change is internal if the executive was previously employed by either of the merging companies.
Acquisitions: In the event an executive from the acquired company is appointed to a role in the acquiring company, it is an external change.
COO Definitions:
COO Role: If no individual operates under the title of COO at a given company, description of duties, executive hierarchy, and compensation are simultaneously analyzed to determine if someone with another title (i.e. President) fulfills this role.
CEO-COO: Should a COO be promoted to CEO, or an individual be simultaneously elected to both positions, the COO role is considered vacant since the functions of the COO are handled by the CEO.
Definitions
3
Report Highlights
4
The following are some of the highlights from this year’s report:
• As the economy improves, CEO and CFO turnover rates continue to decrease. (Page 9)
• The number of companies utilizing the COO position continues to decrease; 33% of the S&P and Fortune 500
companies have COOs down from a high of 48% in 2000. (Page 11)
• Nearly 65% of CEOs are promoted directly from a COO chair or a Divisional President position. (Page 14)
• The Financial sector has the longest tenure average for CEOs, while retail has the longest tenure for CFOs.
(Pages 22-23)
• Nearly 50% of CEOs were under the age of 50 when moved into the chair. (Page 24)
• While the number of African American CEOs has remained static, the number of Hispanic CEOs has tripled
in the last ten years. (Page 30)
• 2015 has seen the largest increase of female CFOs in the history of this study. (Page 33)
• Foreign Universities have produced the most sitting CEOs, while Big Ten Universities have the highest
number of sitting CFOs. (Pages 37-38)
• Half of CFOs in our study have completed their education through the MBA level. (Page 43)
Executive Turnover
5
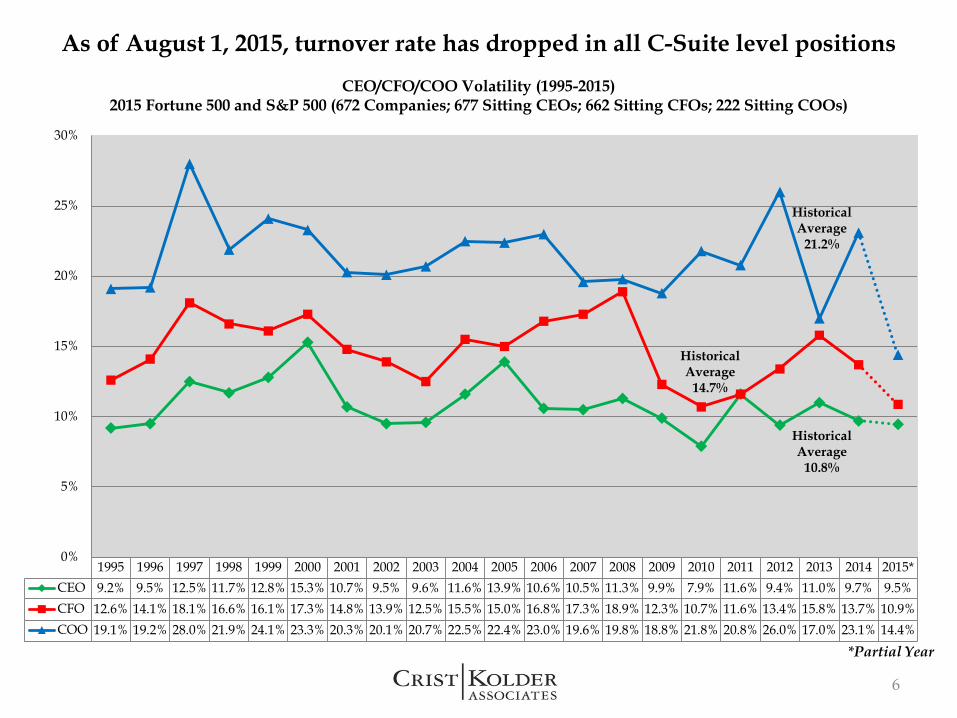
1995 1996 1997 1998 1999 2000 2001 2002 2003 2004 2005 2006 2007 2008 2009 2010 2011 2012 2013 2014 2015*CEO 9.2% 9.5% 12.5% 11.7% 12.8% 15.3% 10.7% 9.5% 9.6% 11.6% 13.9% 10.6% 10.5% 11.3% 9.9% 7.9% 11.6% 9.4% 11.0% 9.7% 9.5%CFO 12.6% 14.1% 18.1% 16.6% 16.1% 17.3% 14.8% 13.9% 12.5% 15.5% 15.0% 16.8% 17.3% 18.9% 12.3% 10.7% 11.6% 13.4% 15.8% 13.7% 10.9%COO 19.1% 19.2% 28.0% 21.9% 24.1% 23.3% 20.3% 20.1% 20.7% 22.5% 22.4% 23.0% 19.6% 19.8% 18.8% 21.8% 20.8% 26.0% 17.0% 23.1% 14.4%
0%
5%
10%
15%
20%
25%
30%
CEO/CFO/COO Volatility (1995-2015) 2015 Fortune 500 and S&P 500 (672 Companies; 677 Sitting CEOs; 662 Sitting CFOs; 222 Sitting COOs)
Historical Average
10.8%
Historical Average
14.7%
Historical Average
21.2%
As of August 1, 2015, turnover rate has dropped in all C-Suite level positions
6
*Partial Year
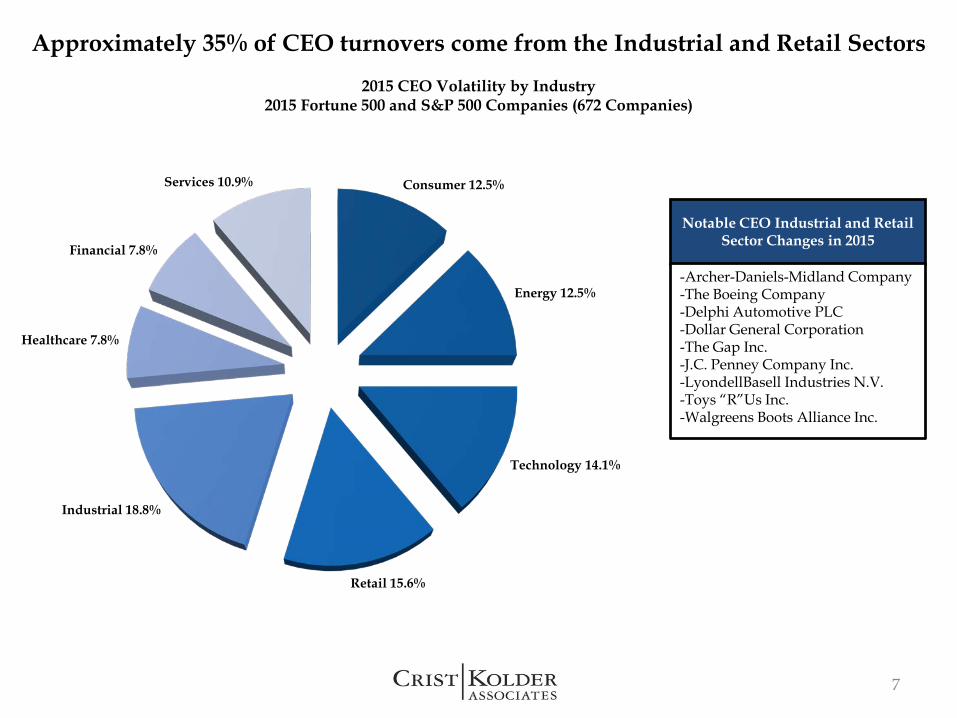
Approximately 35% of CEO turnovers come from the Industrial and Retail Sectors 2015 CEO Volatility by Industry
2015 Fortune 500 and S&P 500 Companies (672 Companies)
Notable CEO Industrial and Retail Sector Changes in 2015
-Archer-Daniels-Midland Company -The Boeing Company-Delphi Automotive PLC-Dollar General Corporation-The Gap Inc.-J.C. Penney Company Inc.-LyondellBasell Industries N.V.-Toys “R”Us Inc.-Walgreens Boots Alliance Inc.
7
Consumer 12.5%
Energy 12.5%
Technology 14.1%
Retail 15.6%
Industrial 18.8%
Healthcare 7.8%
Financial 7.8%
Services 10.9%
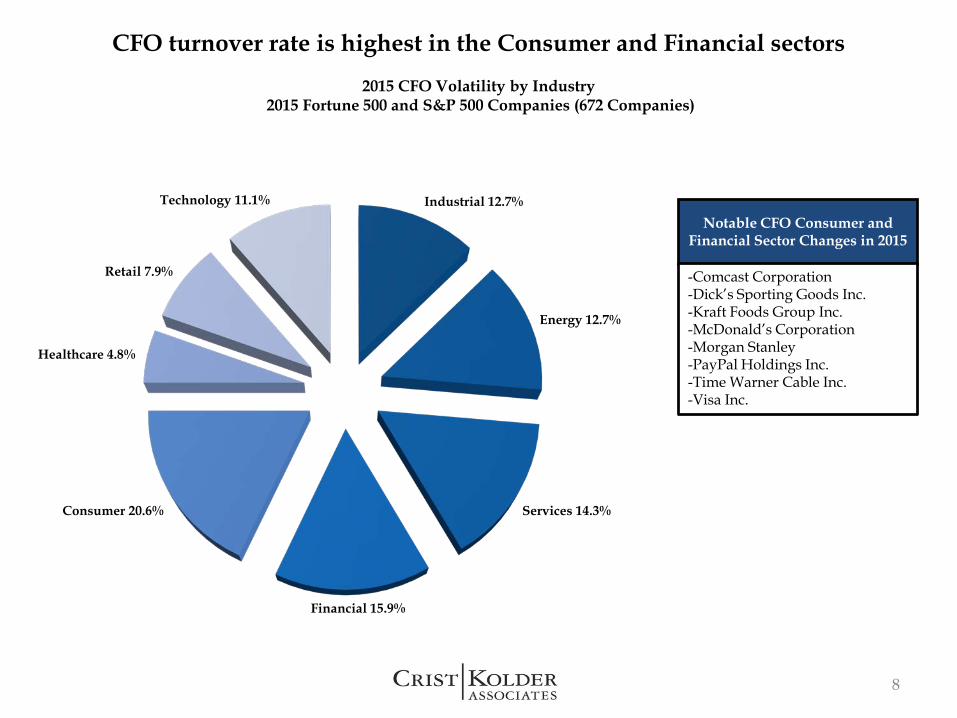
CFO turnover rate is highest in the Consumer and Financial sectors2015 CFO Volatility by Industry
2015 Fortune 500 and S&P 500 Companies (672 Companies)
Notable CFO Consumer and Financial Sector Changes in 2015
-Comcast Corporation-Dick’s Sporting Goods Inc.-Kraft Foods Group Inc. -McDonald’s Corporation-Morgan Stanley-PayPal Holdings Inc. -Time Warner Cable Inc.-Visa Inc.
8
Industrial 12.7%
Energy 12.7%
Services 14.3%
Financial 15.9%
Consumer 20.6%
Healthcare 4.8%
Retail 7.9%
Technology 11.1%
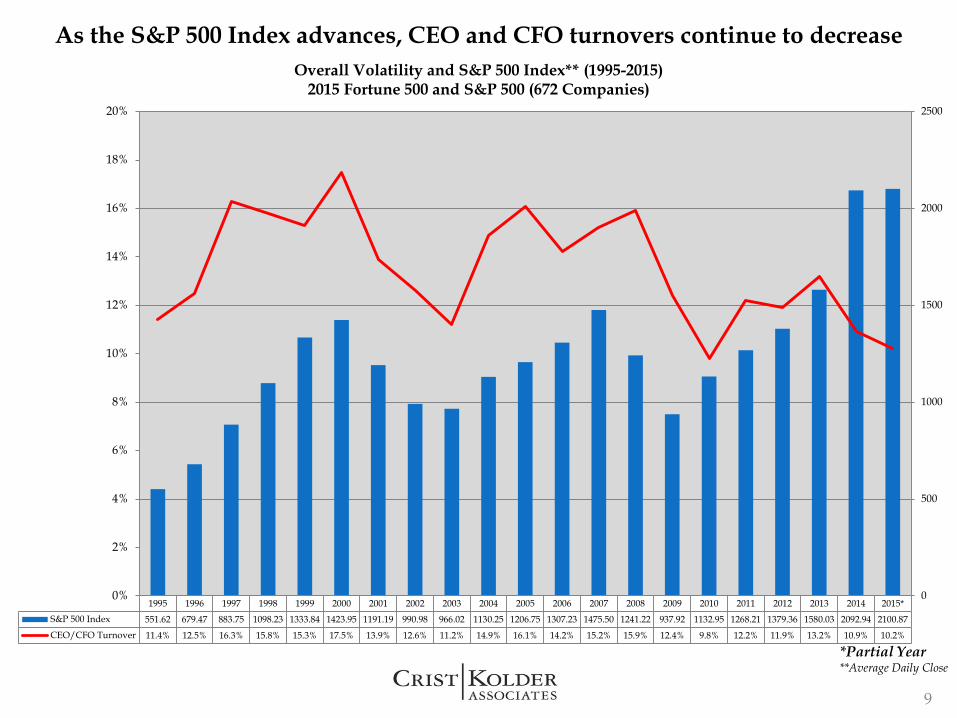
As the S&P 500 Index advances, CEO and CFO turnovers continue to decrease Overall Volatility and S&P 500 Index** (1995-2015)
2015 Fortune 500 and S&P 500 (672 Companies)
*Partial Year**Average Daily Close
9
1995 1996 1997 1998 1999 2000 2001 2002 2003 2004 2005 2006 2007 2008 2009 2010 2011 2012 2013 2014 2015*
S&P 500 Index 551.62 679.47 883.75 1098.23 1333.84 1423.95 1191.19 990.98 966.02 1130.25 1206.75 1307.23 1475.50 1241.22 937.92 1132.95 1268.21 1379.36 1580.03 2092.94 2100.87
CEO/CFO Turnover 11.4% 12.5% 16.3% 15.8% 15.3% 17.5% 13.9% 12.6% 11.2% 14.9% 16.1% 14.2% 15.2% 15.9% 12.4% 9.8% 12.2% 11.9% 13.2% 10.9% 10.2%
0%
2%
4%
6%
8%
10%
12%
14%
16%
18%
20%
0
500
1000
1500
2000
2500
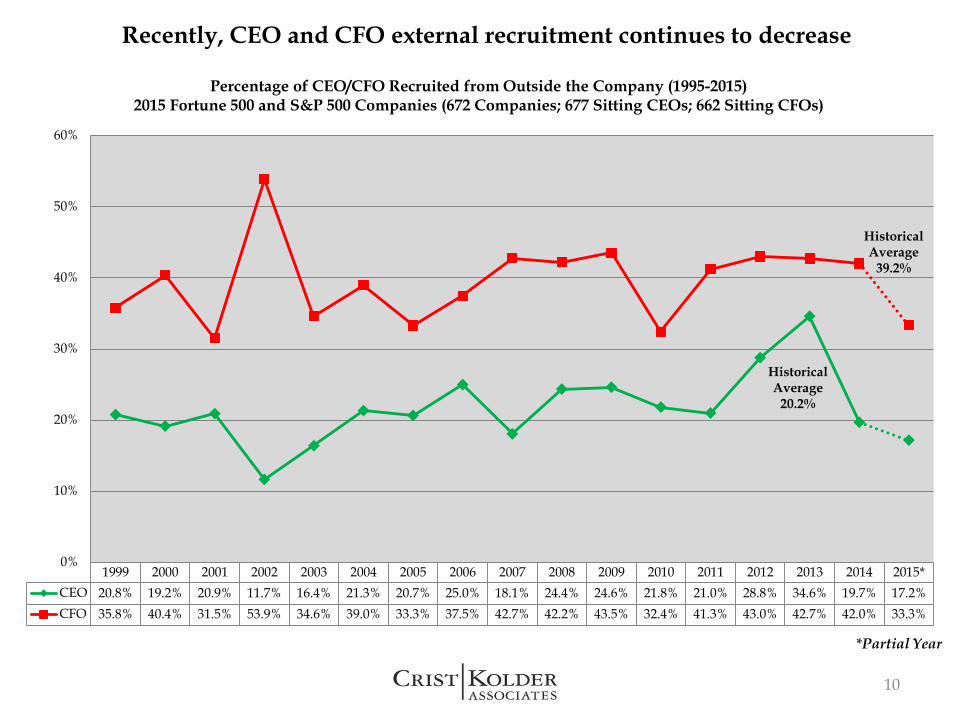
1999 2000 2001 2002 2003 2004 2005 2006 2007 2008 2009 2010 2011 2012 2013 2014 2015*CEO 20.8% 19.2% 20.9% 11.7% 16.4% 21.3% 20.7% 25.0% 18.1% 24.4% 24.6% 21.8% 21.0% 28.8% 34.6% 19.7% 17.2%CFO 35.8% 40.4% 31.5% 53.9% 34.6% 39.0% 33.3% 37.5% 42.7% 42.2% 43.5% 32.4% 41.3% 43.0% 42.7% 42.0% 33.3%
0%
10%
20%
30%
40%
50%
60%
Percentage of CEO/CFO Recruited from Outside the Company (1995-2015)2015 Fortune 500 and S&P 500 Companies (672 Companies; 677 Sitting CEOs; 662 Sitting CFOs)
Recently, CEO and CFO external recruitment continues to decrease
Historical Average
20.2%
Historical Average
39.2%
10
*Partial Year
0%
5%
10%
15%
20%
25%
30%
35%
40%
45%
50%
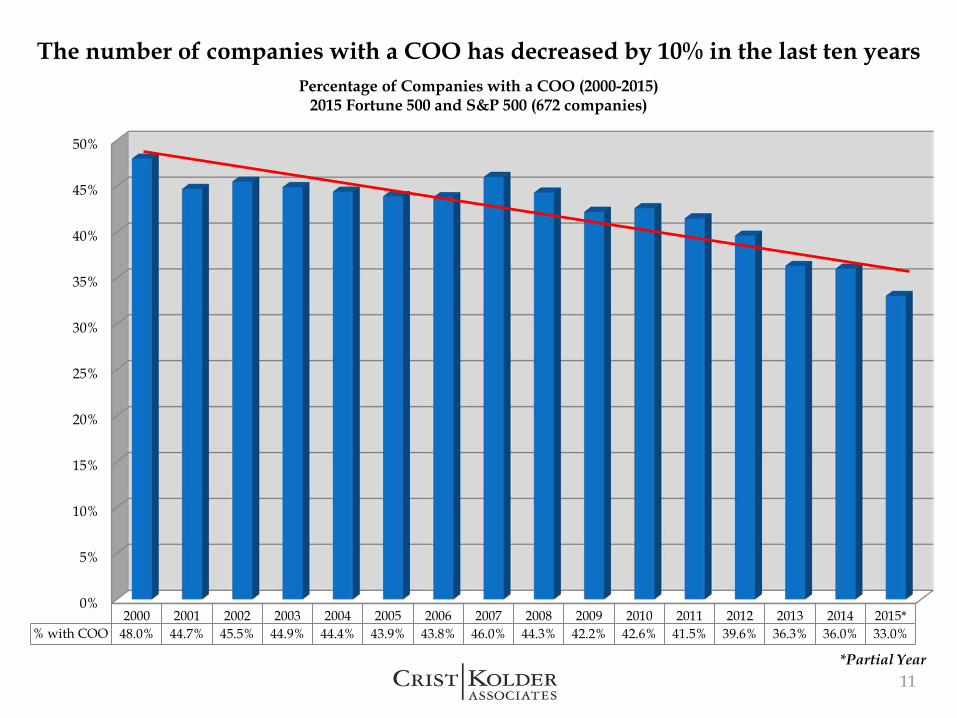
2000 2001 2002 2003 2004 2005 2006 2007 2008 2009 2010 2011 2012 2013 2014 2015*% with COO 48.0% 44.7% 45.5% 44.9% 44.4% 43.9% 43.8% 46.0% 44.3% 42.2% 42.6% 41.5% 39.6% 36.3% 36.0% 33.0%
The number of companies with a COO has decreased by 10% in the last ten yearsPercentage of Companies with a COO (2000-2015)
2015 Fortune 500 and S&P 500 (672 companies)
11*Partial Year
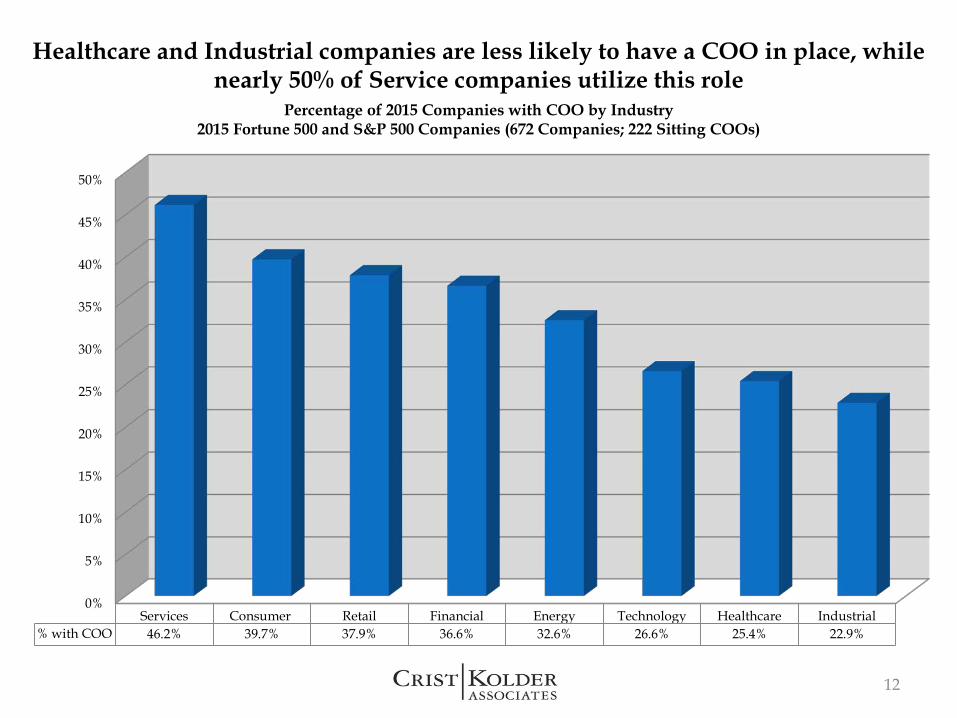
Percentage of 2015 Companies with COO by Industry2015 Fortune 500 and S&P 500 Companies (672 Companies; 222 Sitting COOs)
Healthcare and Industrial companies are less likely to have a COO in place, while nearly 50% of Service companies utilize this role
12
0%
5%
10%
15%
20%
25%
30%
35%
40%
45%
50%
Services Consumer Retail Financial Energy Technology Healthcare Industrial% with COO 46.2% 39.7% 37.9% 36.6% 32.6% 26.6% 25.4% 22.9%
C-Suite Career Paths
13
0%
5%
10%
15%
20%
25%
30%
35%
40%
45%
COO DivisionalPresident
CEO OperatingExecutive
CFO Founder Other Interim
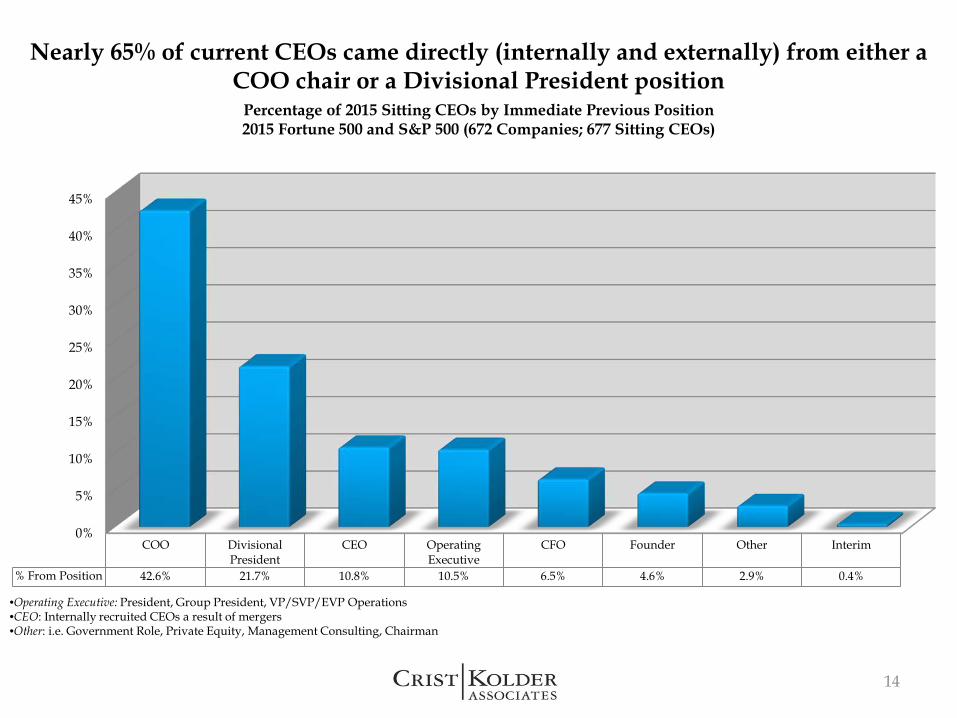
% From Position 42.6% 21.7% 10.8% 10.5% 6.5% 4.6% 2.9% 0.4%
Nearly 65% of current CEOs came directly (internally and externally) from either a COO chair or a Divisional President position
Percentage of 2015 Sitting CEOs by Immediate Previous Position2015 Fortune 500 and S&P 500 (672 Companies; 677 Sitting CEOs)
•Operating Executive: President, Group President, VP/SVP/EVP Operations•CEO: Internally recruited CEOs a result of mergers•Other: i.e. Government Role, Private Equity, Management Consulting, Chairman
14
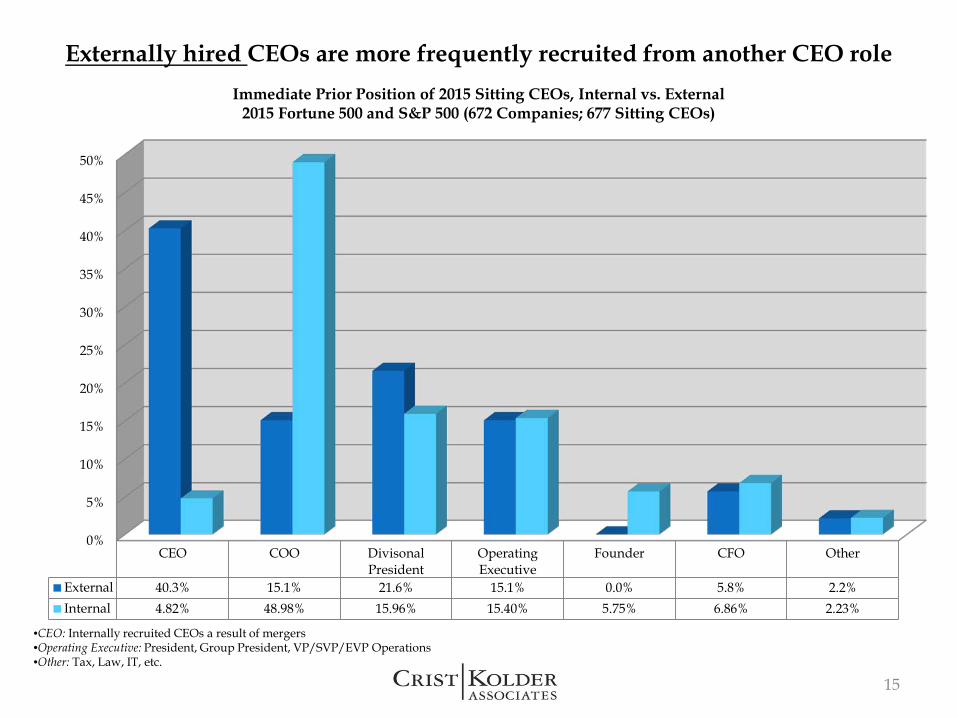
Externally hired CEOs are more frequently recruited from another CEO role Immediate Prior Position of 2015 Sitting CEOs, Internal vs. External
2015 Fortune 500 and S&P 500 (672 Companies; 677 Sitting CEOs)
•CEO: Internally recruited CEOs a result of mergers•Operating Executive: President, Group President, VP/SVP/EVP Operations•Other: Tax, Law, IT, etc.
15
0%
5%
10%
15%
20%
25%
30%
35%
40%
45%
50%
CEO COO DivisonalPresident
OperatingExecutive
Founder CFO Other
External 40.3% 15.1% 21.6% 15.1% 0.0% 5.8% 2.2%Internal 4.82% 48.98% 15.96% 15.40% 5.75% 6.86% 2.23%
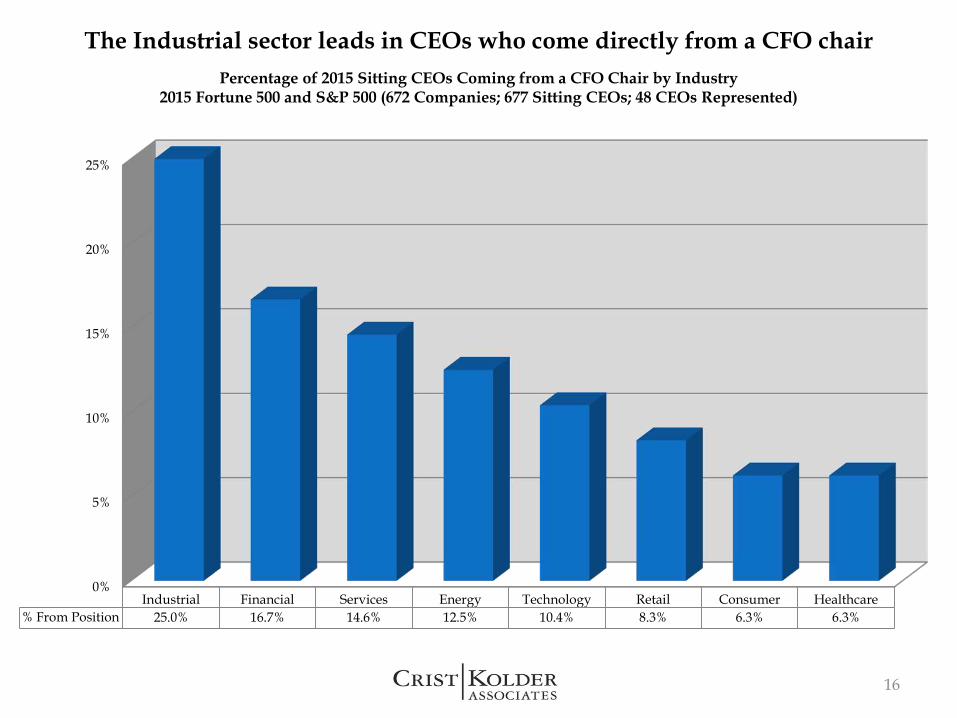
The Industrial sector leads in CEOs who come directly from a CFO chairPercentage of 2015 Sitting CEOs Coming from a CFO Chair by Industry
2015 Fortune 500 and S&P 500 (672 Companies; 677 Sitting CEOs; 48 CEOs Represented)
16
0%
5%
10%
15%
20%
25%
Industrial Financial Services Energy Technology Retail Consumer Healthcare% From Position 25.0% 16.7% 14.6% 12.5% 10.4% 8.3% 6.3% 6.3%
0%
5%
10%
15%
20%
25%
OperatingExecutive
CFO Controller Treasuer CorporateFinance
Executive
Strat/MA DivisonalFinanceOfficer
Other Executives Consulting InvestorRelations
Risk
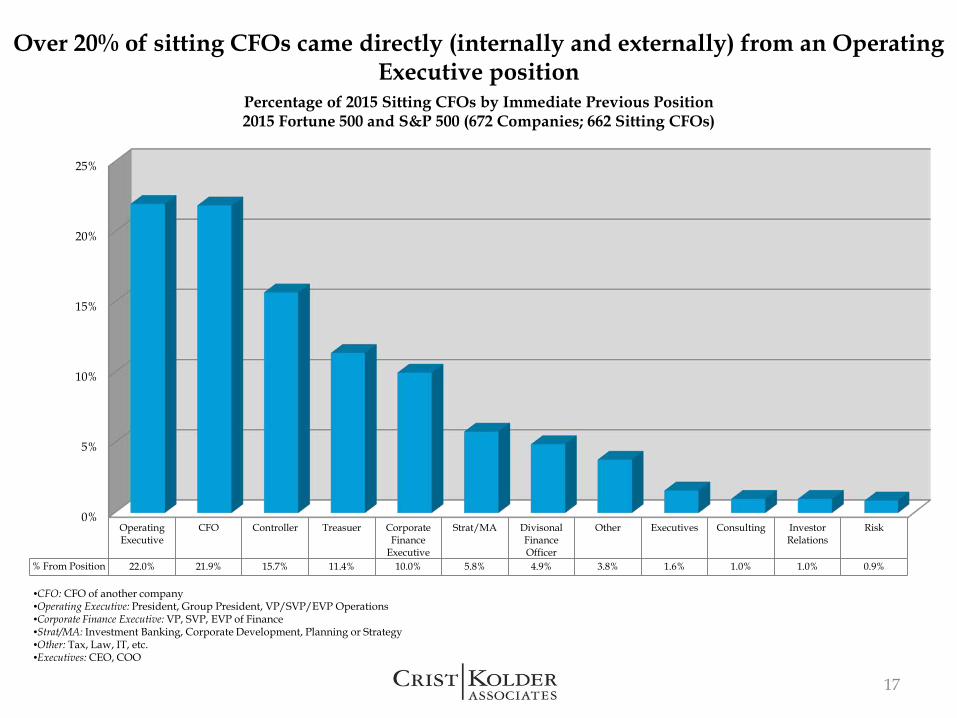
% From Position 22.0% 21.9% 15.7% 11.4% 10.0% 5.8% 4.9% 3.8% 1.6% 1.0% 1.0% 0.9%
Over 20% of sitting CFOs came directly (internally and externally) from an Operating Executive position
Percentage of 2015 Sitting CFOs by Immediate Previous Position2015 Fortune 500 and S&P 500 (672 Companies; 662 Sitting CFOs)
•CFO: CFO of another company•Operating Executive: President, Group President, VP/SVP/EVP Operations•Corporate Finance Executive: VP, SVP, EVP of Finance•Strat/MA: Investment Banking, Corporate Development, Planning or Strategy•Other: Tax, Law, IT, etc.•Executives: CEO, COO
17
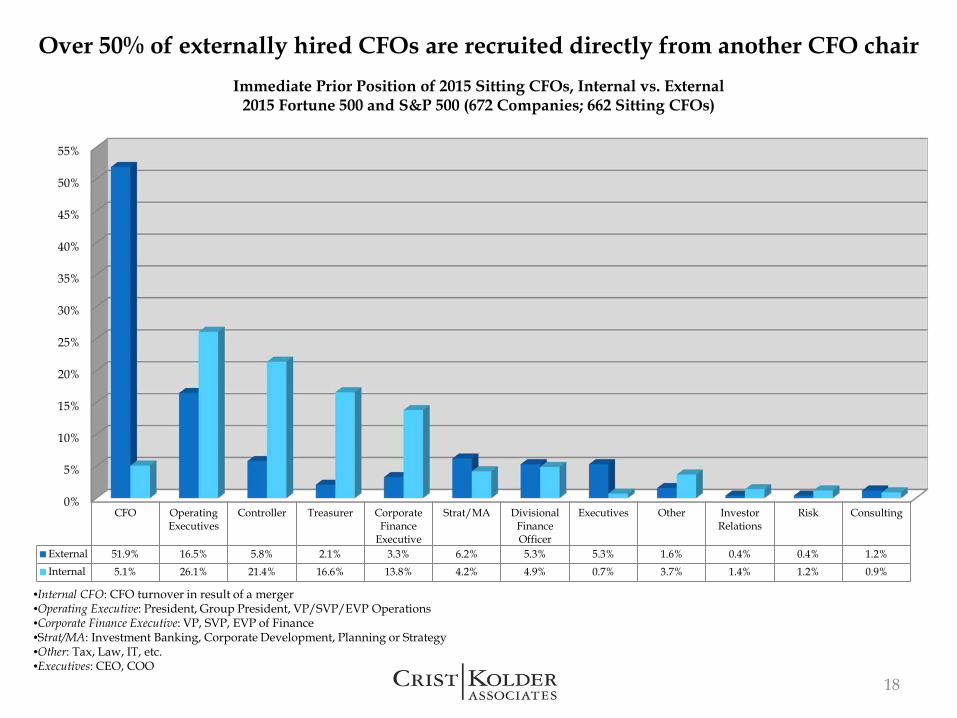
Over 50% of externally hired CFOs are recruited directly from another CFO chair
•Internal CFO: CFO turnover in result of a merger•Operating Executive: President, Group President, VP/SVP/EVP Operations•Corporate Finance Executive: VP, SVP, EVP of Finance•Strat/MA: Investment Banking, Corporate Development, Planning or Strategy•Other: Tax, Law, IT, etc.•Executives: CEO, COO
Immediate Prior Position of 2015 Sitting CFOs, Internal vs. External2015 Fortune 500 and S&P 500 (672 Companies; 662 Sitting CFOs)
18
0%
5%
10%
15%
20%
25%
30%
35%
40%
45%
50%
55%
CFO OperatingExecutives
Controller Treasurer CorporateFinance
Executive
Strat/MA DivisionalFinanceOfficer
Executives Other InvestorRelations
Risk Consulting
External 51.9% 16.5% 5.8% 2.1% 3.3% 6.2% 5.3% 5.3% 1.6% 0.4% 0.4% 1.2%Internal 5.1% 26.1% 21.4% 16.6% 13.8% 4.2% 4.9% 0.7% 3.7% 1.4% 1.2% 0.9%
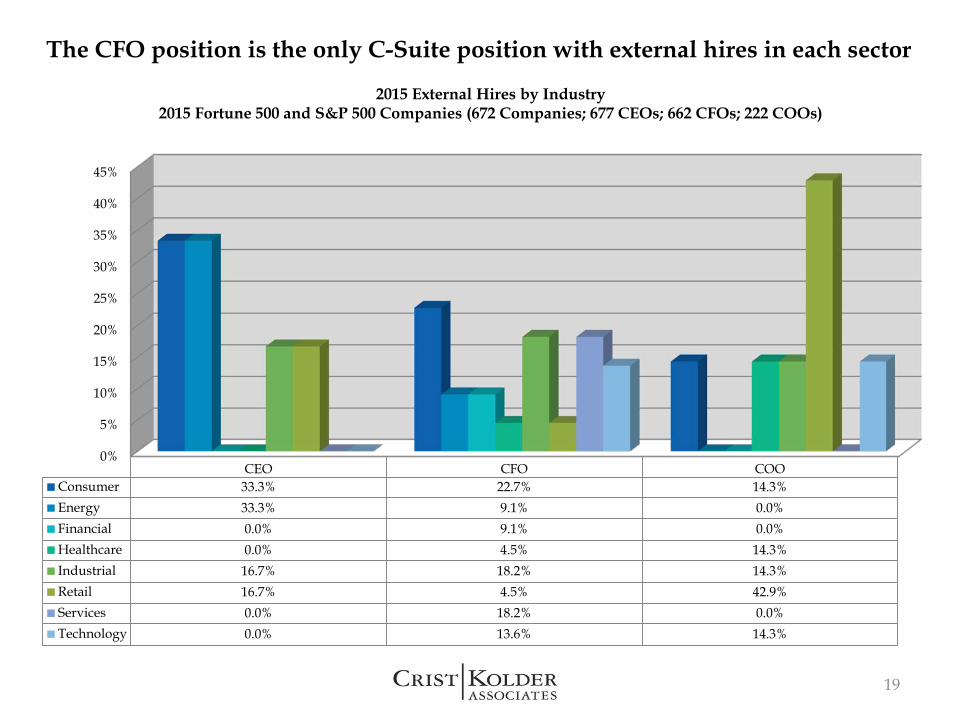
The CFO position is the only C-Suite position with external hires in each sector
2015 External Hires by Industry2015 Fortune 500 and S&P 500 Companies (672 Companies; 677 CEOs; 662 CFOs; 222 COOs)
19
0%
5%
10%
15%
20%
25%
30%
35%
40%
45%
CEO CFO COOConsumer 33.3% 22.7% 14.3%Energy 33.3% 9.1% 0.0%Financial 0.0% 9.1% 0.0%Healthcare 0.0% 4.5% 14.3%Industrial 16.7% 18.2% 14.3%Retail 16.7% 4.5% 42.9%Services 0.0% 18.2% 0.0%Technology 0.0% 13.6% 14.3%
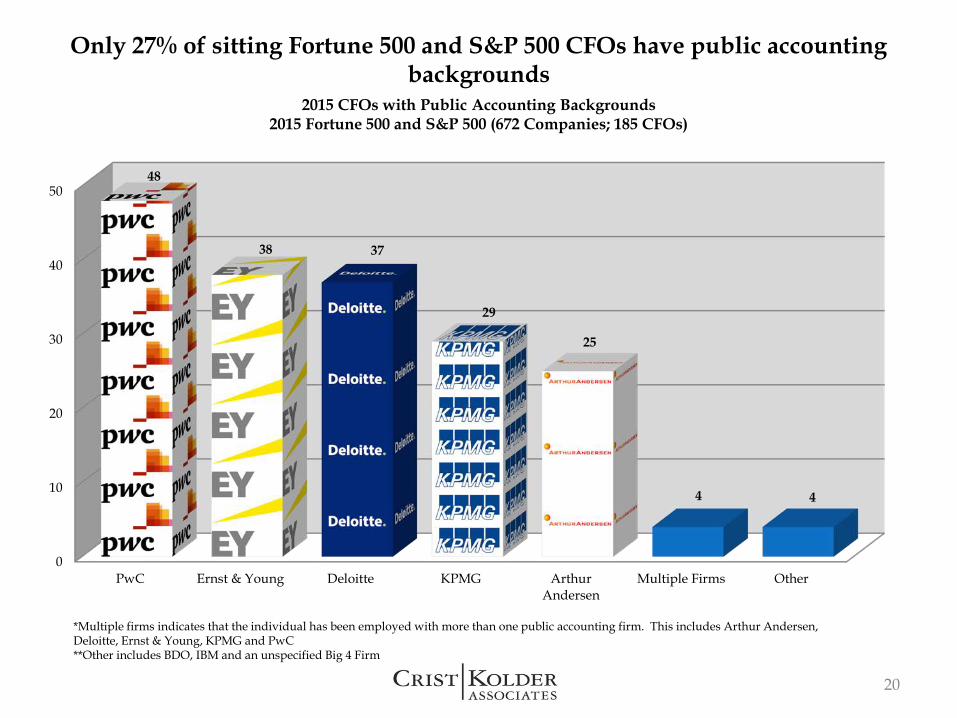
Only 27% of sitting Fortune 500 and S&P 500 CFOs have public accounting backgrounds
*Multiple firms indicates that the individual has been employed with more than one public accounting firm. This includes Arthur Andersen, Deloitte, Ernst & Young, KPMG and PwC**Other includes BDO, IBM and an unspecified Big 4 Firm
2015 CFOs with Public Accounting Backgrounds 2015 Fortune 500 and S&P 500 (672 Companies; 185 CFOs)
20
0
10
20
30
40
50
PwC Ernst & Young Deloitte KPMG ArthurAndersen
Multiple Firms Other
48
38 37
29
25
4 4
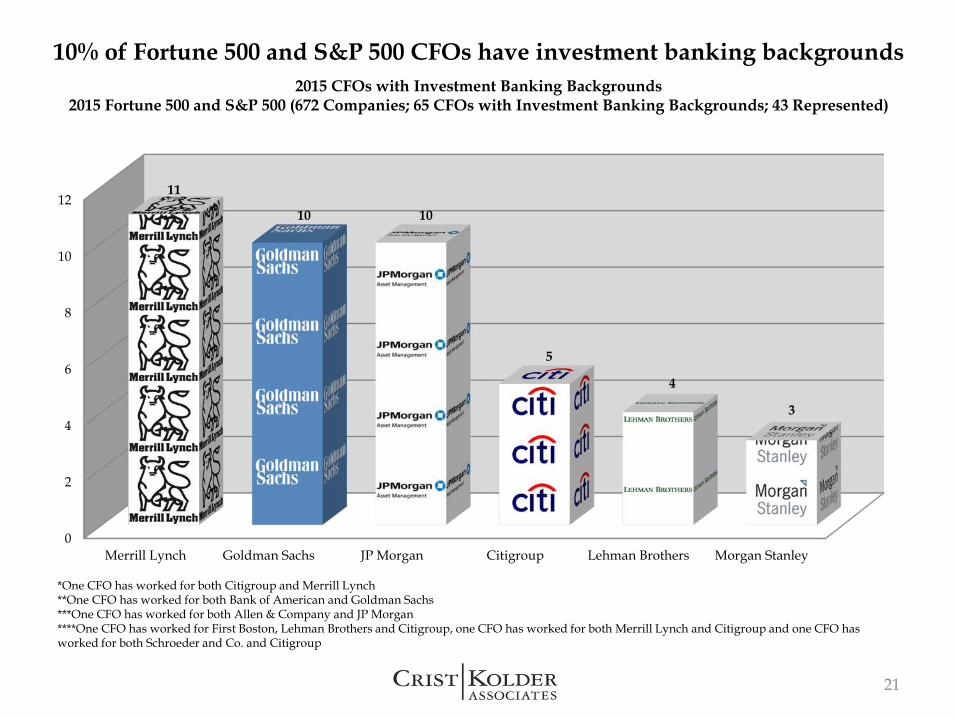
10% of Fortune 500 and S&P 500 CFOs have investment banking backgrounds
21
*One CFO has worked for both Citigroup and Merrill Lynch**One CFO has worked for both Bank of American and Goldman Sachs***One CFO has worked for both Allen & Company and JP Morgan****One CFO has worked for First Boston, Lehman Brothers and Citigroup, one CFO has worked for both Merrill Lynch and Citigroup and one CFO has worked for both Schroeder and Co. and Citigroup
0
2
4
6
8
10
12
Merrill Lynch Goldman Sachs JP Morgan Citigroup Lehman Brothers Morgan Stanley
11
10 10
5
4
3
2015 CFOs with Investment Banking Backgrounds2015 Fortune 500 and S&P 500 (672 Companies; 65 CFOs with Investment Banking Backgrounds; 43 Represented)
22
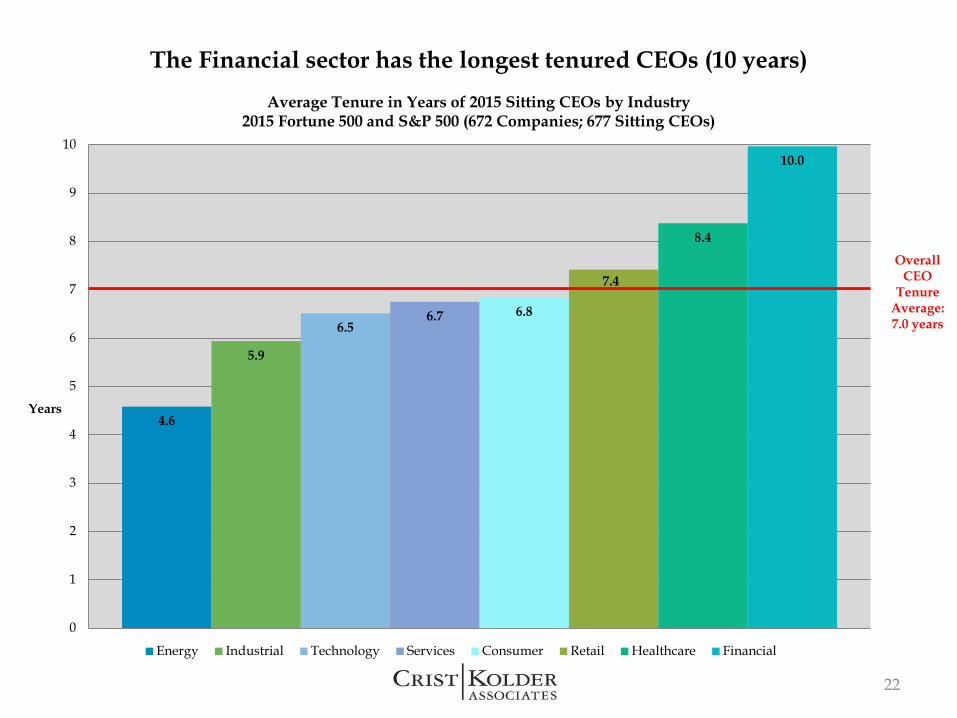
The Financial sector has the longest tenured CEOs (10 years)Average Tenure in Years of 2015 Sitting CEOs by Industry
2015 Fortune 500 and S&P 500 (672 Companies; 677 Sitting CEOs)
4.6
5.9
6.56.7 6.8
7.4
8.4
10.0
0
1
2
3
4
5
6
7
8
9
10
Years
Energy Industrial Technology Services Consumer Retail Healthcare Financial
Overall CEO
Tenure Average: 7.0 years
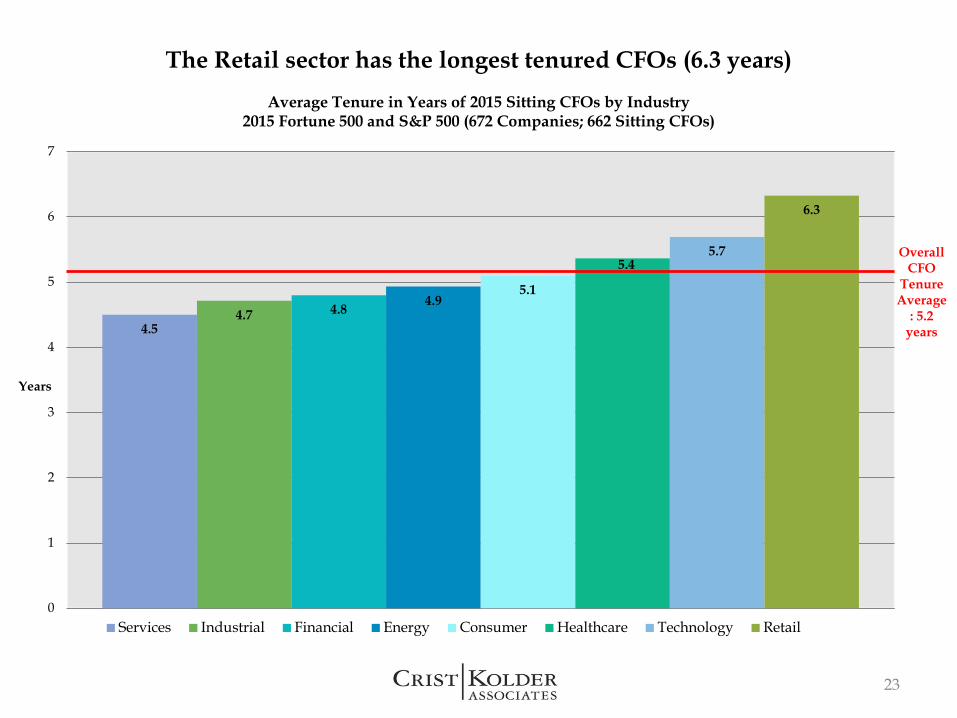
4.54.7 4.8 4.9
5.1
5.45.7
6.3
0
1
2
3
4
5
6
7
Years
Services Industrial Financial Energy Consumer Healthcare Technology Retail
The Retail sector has the longest tenured CFOs (6.3 years)
23
Average Tenure in Years of 2015 Sitting CFOs by Industry2015 Fortune 500 and S&P 500 (672 Companies; 662 Sitting CFOs)
Overall CFO
Tenure Average
: 5.2 years
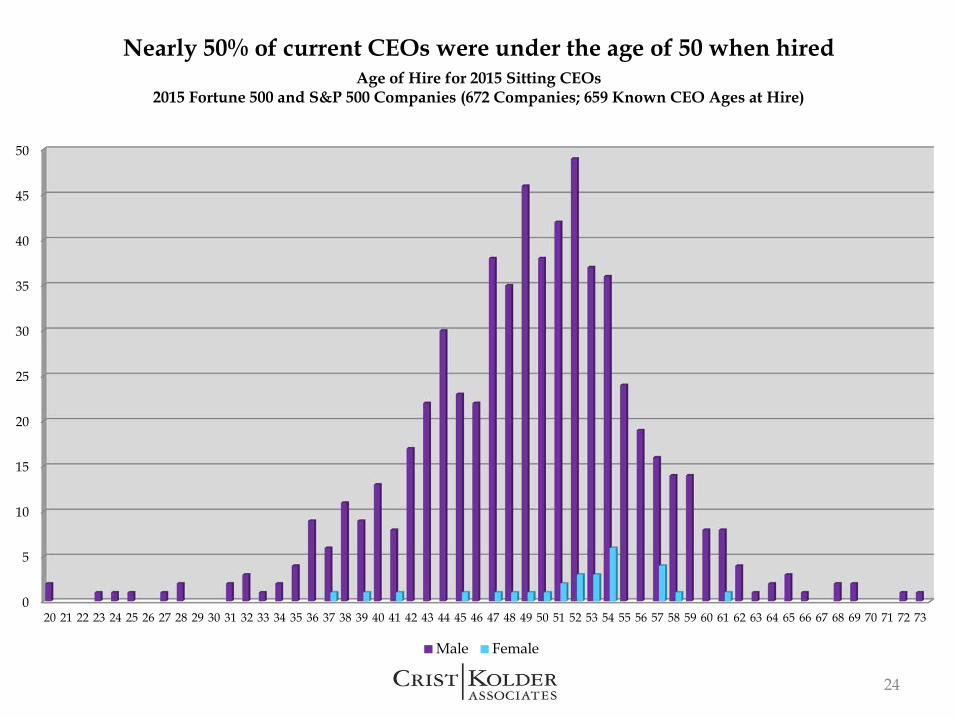
24
Age of Hire for 2015 Sitting CEOs2015 Fortune 500 and S&P 500 Companies (672 Companies; 659 Known CEO Ages at Hire)
Nearly 50% of current CEOs were under the age of 50 when hired
0
5
10
15
20
25
30
35
40
45
50
20 21 22 23 24 25 26 27 28 29 30 31 32 33 34 35 36 37 38 39 40 41 42 43 44 45 46 47 48 49 50 51 52 53 54 55 56 57 58 59 60 61 62 63 64 65 66 67 68 69 70 71 72 73
Male Female
0
5
10
15
20
25
30
35
40
45
31 36 39 41 42 43 44 45 46 47 48 49 50 51 52 53 54 55 56 57 58 59 60 61 62 63 64 65 66 67 68 69 70 71 72 73 74 75 76 77 78 79 80 82 85
Males Females
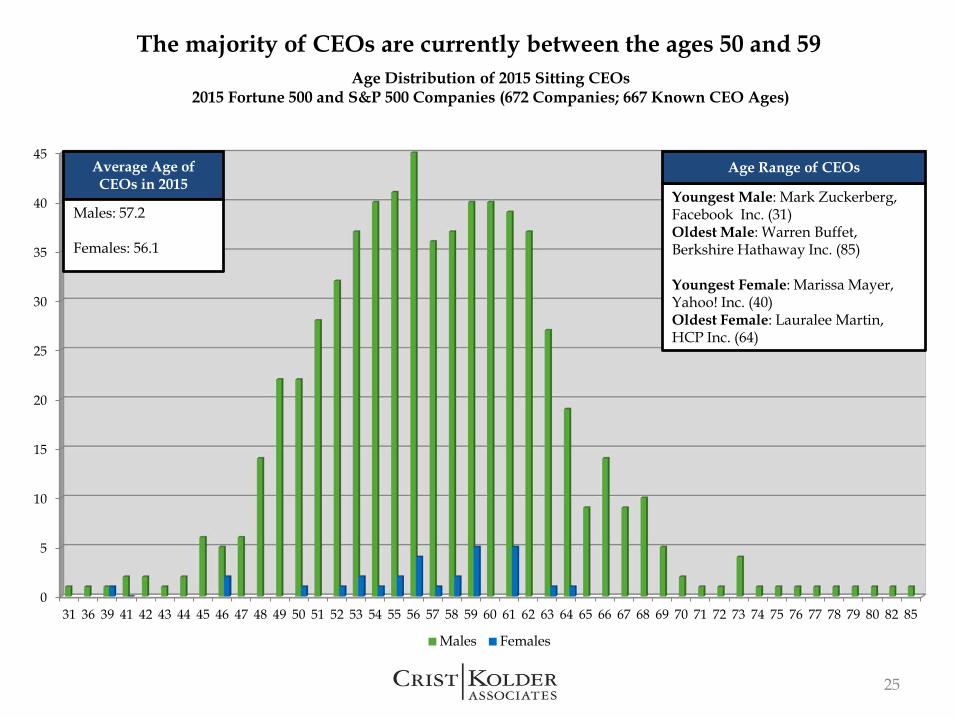
The majority of CEOs are currently between the ages 50 and 59
Average Age of CEOs in 2015
Males: 57.2
Females: 56.1
Age Distribution of 2015 Sitting CEOs2015 Fortune 500 and S&P 500 Companies (672 Companies; 667 Known CEO Ages)
25
Youngest Male: Mark Zuckerberg, Facebook Inc. (31)Oldest Male: Warren Buffet, Berkshire Hathaway Inc. (85)
Youngest Female: Marissa Mayer, Yahoo! Inc. (40)Oldest Female: Lauralee Martin, HCP Inc. (64)
Age Range of CEOs
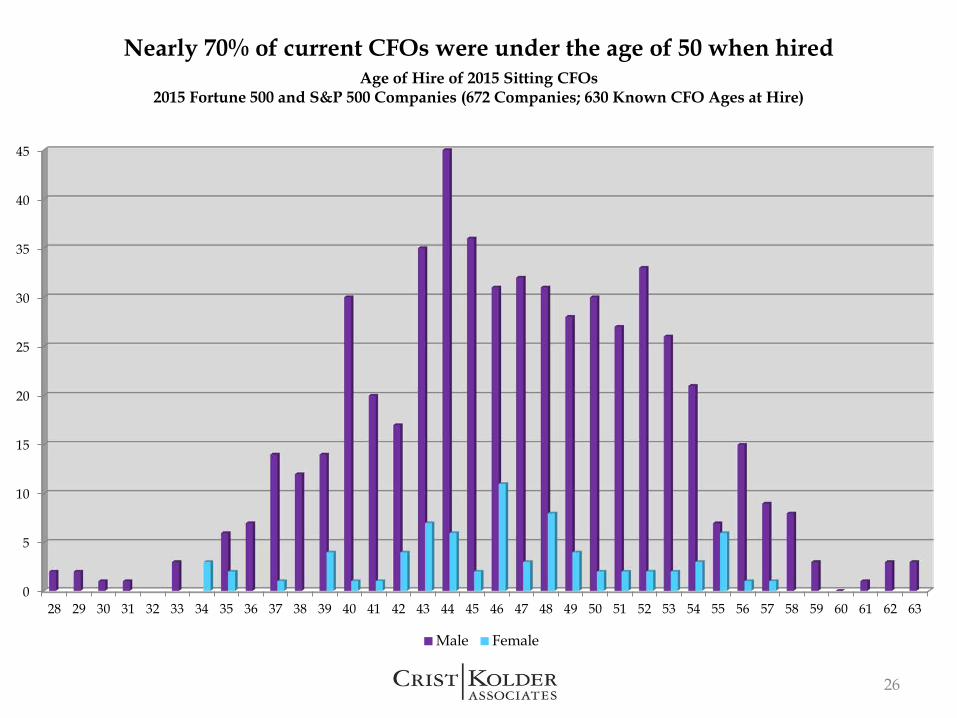
26
Age of Hire of 2015 Sitting CFOs 2015 Fortune 500 and S&P 500 Companies (672 Companies; 630 Known CFO Ages at Hire)
Nearly 70% of current CFOs were under the age of 50 when hired
0
5
10
15
20
25
30
35
40
45
28 29 30 31 32 33 34 35 36 37 38 39 40 41 42 43 44 45 46 47 48 49 50 51 52 53 54 55 56 57 58 59 60 61 62 63
Male Female
0
5
10
15
20
25
30
35
40
45
50
37 38 39 40 41 42 43 44 45 46 47 48 49 50 51 52 53 54 55 56 57 58 59 60 61 62 63 64 65 66 67 68 70 72
Male Female
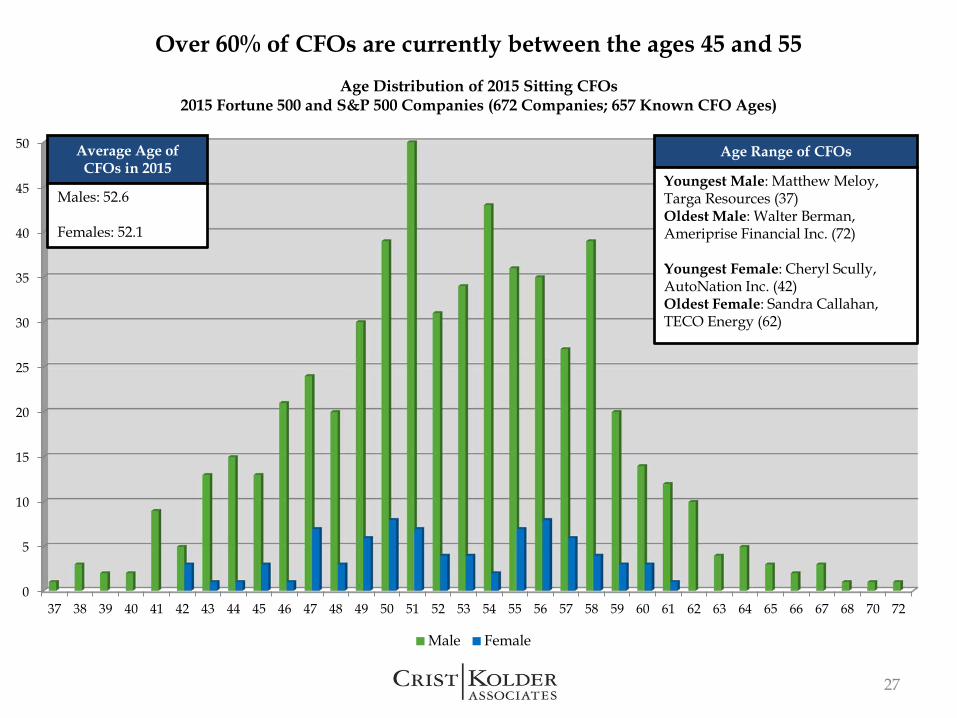
Over 60% of CFOs are currently between the ages 45 and 55Age Distribution of 2015 Sitting CFOs
2015 Fortune 500 and S&P 500 Companies (672 Companies; 657 Known CFO Ages)
27
Average Age of CFOs in 2015
Males: 52.6
Females: 52.1
Age Range of CFOs
Youngest Male: Matthew Meloy, Targa Resources (37)Oldest Male: Walter Berman, Ameriprise Financial Inc. (72)
Youngest Female: Cheryl Scully, AutoNation Inc. (42)Oldest Female: Sandra Callahan, TECO Energy (62)

Diversity Landscape
28
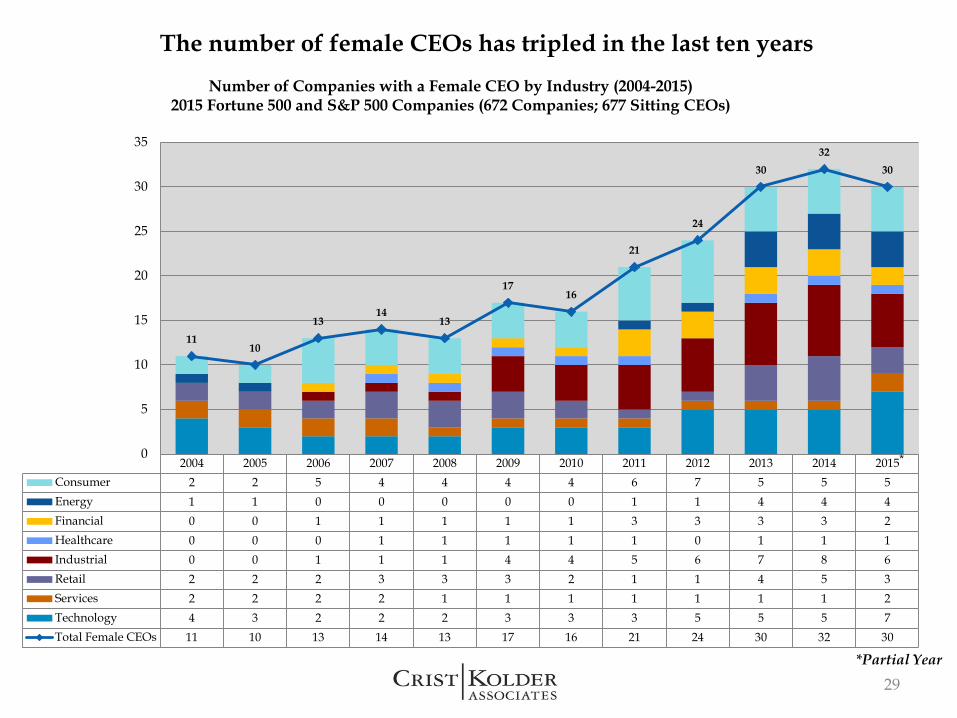
The number of female CEOs has tripled in the last ten yearsNumber of Companies with a Female CEO by Industry (2004-2015)
2015 Fortune 500 and S&P 500 Companies (672 Companies; 677 Sitting CEOs)
29
2004 2005 2006 2007 2008 2009 2010 2011 2012 2013 2014 2015Consumer 2 2 5 4 4 4 4 6 7 5 5 5Energy 1 1 0 0 0 0 0 1 1 4 4 4Financial 0 0 1 1 1 1 1 3 3 3 3 2Healthcare 0 0 0 1 1 1 1 1 0 1 1 1Industrial 0 0 1 1 1 4 4 5 6 7 8 6Retail 2 2 2 3 3 3 2 1 1 4 5 3Services 2 2 2 2 1 1 1 1 1 1 1 2Technology 4 3 2 2 2 3 3 3 5 5 5 7Total Female CEOs 11 10 13 14 13 17 16 21 24 30 32 30
1110
1314
13
1716
21
24
3032
30
0
5
10
15
20
25
30
35
*Partial Year
*
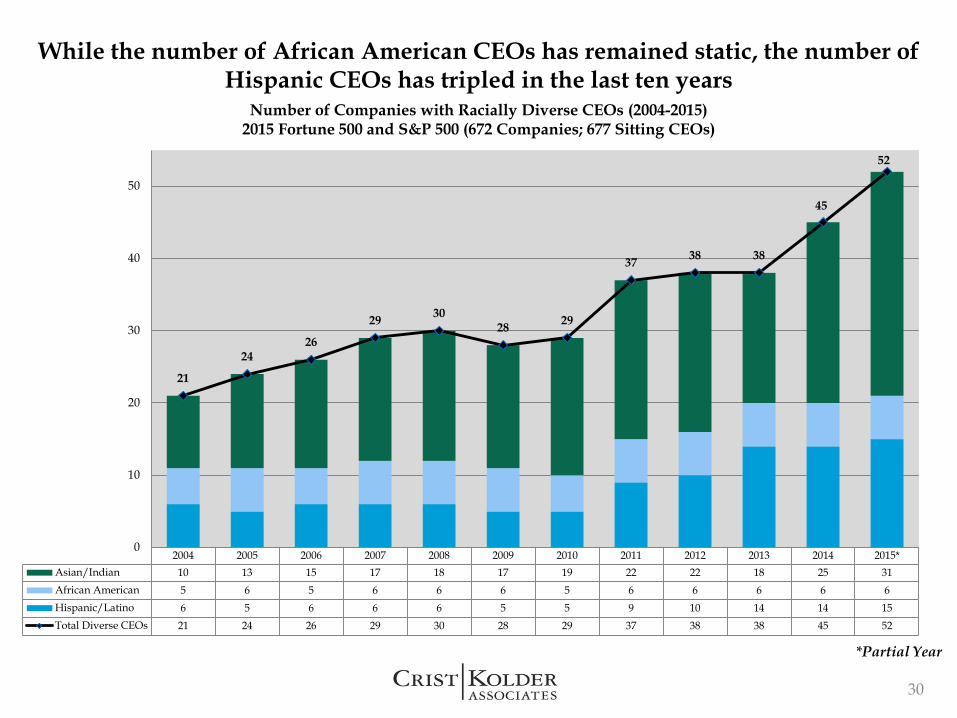
While the number of African American CEOs has remained static, the number of Hispanic CEOs has tripled in the last ten years
Number of Companies with Racially Diverse CEOs (2004-2015) 2015 Fortune 500 and S&P 500 (672 Companies; 677 Sitting CEOs)
30
*Partial Year
2004 2005 2006 2007 2008 2009 2010 2011 2012 2013 2014 2015*Asian/Indian 10 13 15 17 18 17 19 22 22 18 25 31African American 5 6 5 6 6 6 5 6 6 6 6 6Hispanic/Latino 6 5 6 6 6 5 5 9 10 14 14 15Total Diverse CEOs 21 24 26 29 30 28 29 37 38 38 45 52
21
2426
29 3028 29
37 38 38
45
52
0
10
20
30
40
50
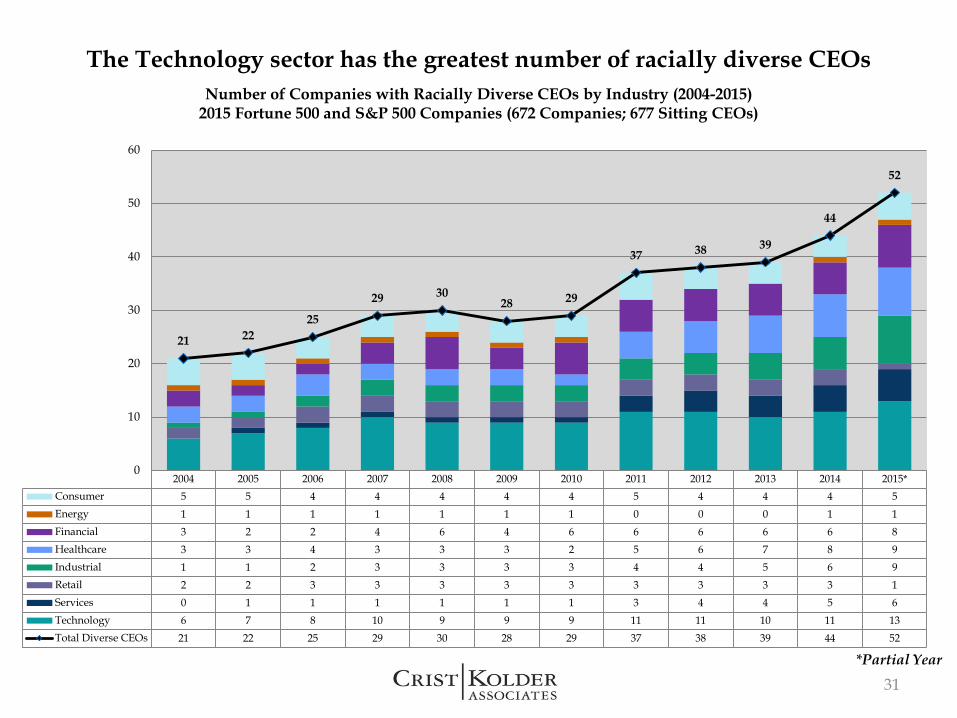
The Technology sector has the greatest number of racially diverse CEOsNumber of Companies with Racially Diverse CEOs by Industry (2004-2015)
2015 Fortune 500 and S&P 500 Companies (672 Companies; 677 Sitting CEOs)
31*Partial Year
2004 2005 2006 2007 2008 2009 2010 2011 2012 2013 2014 2015*Consumer 5 5 4 4 4 4 4 5 4 4 4 5Energy 1 1 1 1 1 1 1 0 0 0 1 1Financial 3 2 2 4 6 4 6 6 6 6 6 8Healthcare 3 3 4 3 3 3 2 5 6 7 8 9Industrial 1 1 2 3 3 3 3 4 4 5 6 9Retail 2 2 3 3 3 3 3 3 3 3 3 1Services 0 1 1 1 1 1 1 3 4 4 5 6Technology 6 7 8 10 9 9 9 11 11 10 11 13Total Diverse CEOs 21 22 25 29 30 28 29 37 38 39 44 52
21 2225
29 3028 29
37 38 39
44
52
0
10
20
30
40
50
60
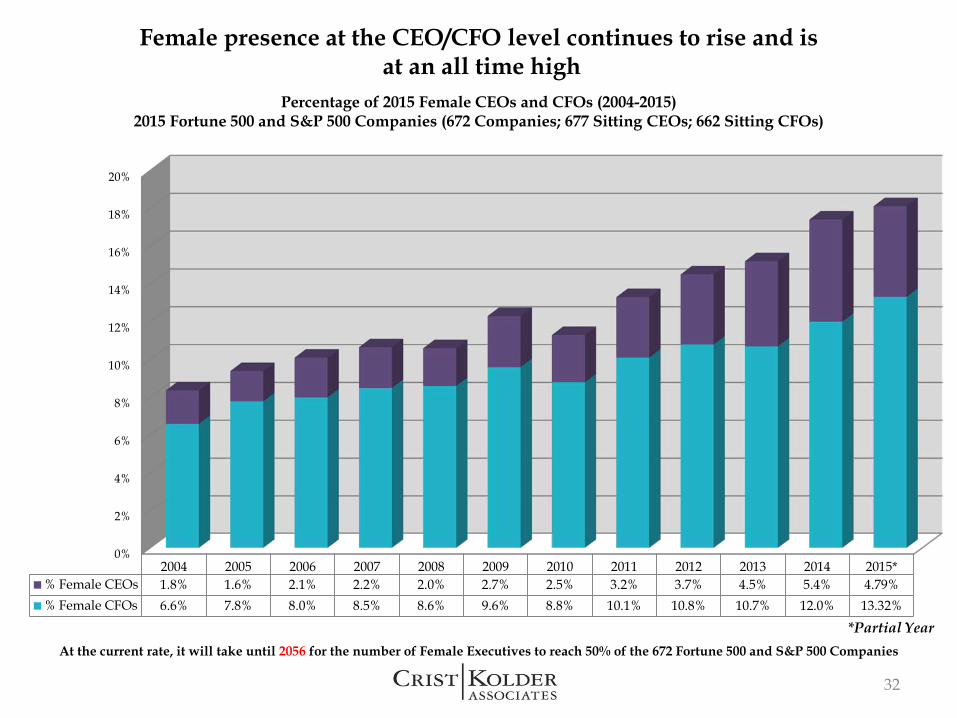
Female presence at the CEO/CFO level continues to rise and isat an all time high
32
Percentage of 2015 Female CEOs and CFOs (2004-2015)2015 Fortune 500 and S&P 500 Companies (672 Companies; 677 Sitting CEOs; 662 Sitting CFOs)
At the current rate, it will take until 2056 for the number of Female Executives to reach 50% of the 672 Fortune 500 and S&P 500 Companies
*
*Partial Year
0%
2%
4%
6%
8%
10%
12%
14%
16%
18%
20%
2004 2005 2006 2007 2008 2009 2010 2011 2012 2013 2014 2015*% Female CEOs 1.8% 1.6% 2.1% 2.2% 2.0% 2.7% 2.5% 3.2% 3.7% 4.5% 5.4% 4.79%% Female CFOs 6.6% 7.8% 8.0% 8.5% 8.6% 9.6% 8.8% 10.1% 10.8% 10.7% 12.0% 13.32%
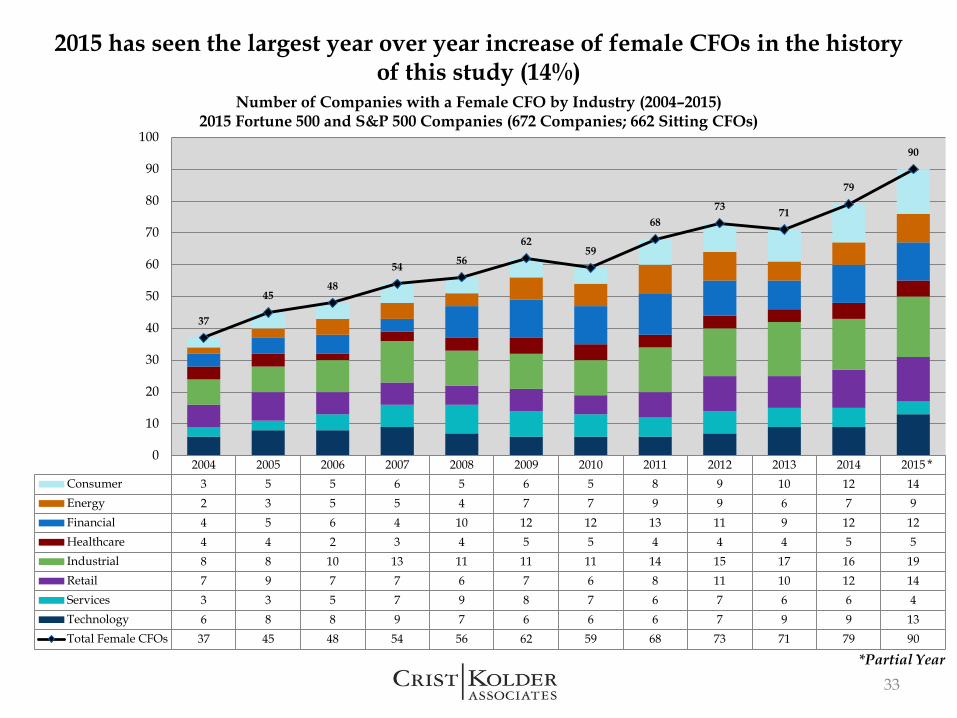
2004 2005 2006 2007 2008 2009 2010 2011 2012 2013 2014 2015Consumer 3 5 5 6 5 6 5 8 9 10 12 14Energy 2 3 5 5 4 7 7 9 9 6 7 9Financial 4 5 6 4 10 12 12 13 11 9 12 12Healthcare 4 4 2 3 4 5 5 4 4 4 5 5Industrial 8 8 10 13 11 11 11 14 15 17 16 19Retail 7 9 7 7 6 7 6 8 11 10 12 14Services 3 3 5 7 9 8 7 6 7 6 6 4Technology 6 8 8 9 7 6 6 6 7 9 9 13Total Female CFOs 37 45 48 54 56 62 59 68 73 71 79 90
37
4548
54 56
6259
6873 71
79
90
0
10
20
30
40
50
60
70
80
90
100
*Partial Year
2015 has seen the largest year over year increase of female CFOs in the history of this study (14%)
Number of Companies with a Female CFO by Industry (2004–2015)2015 Fortune 500 and S&P 500 Companies (672 Companies; 662 Sitting CFOs)
33
*
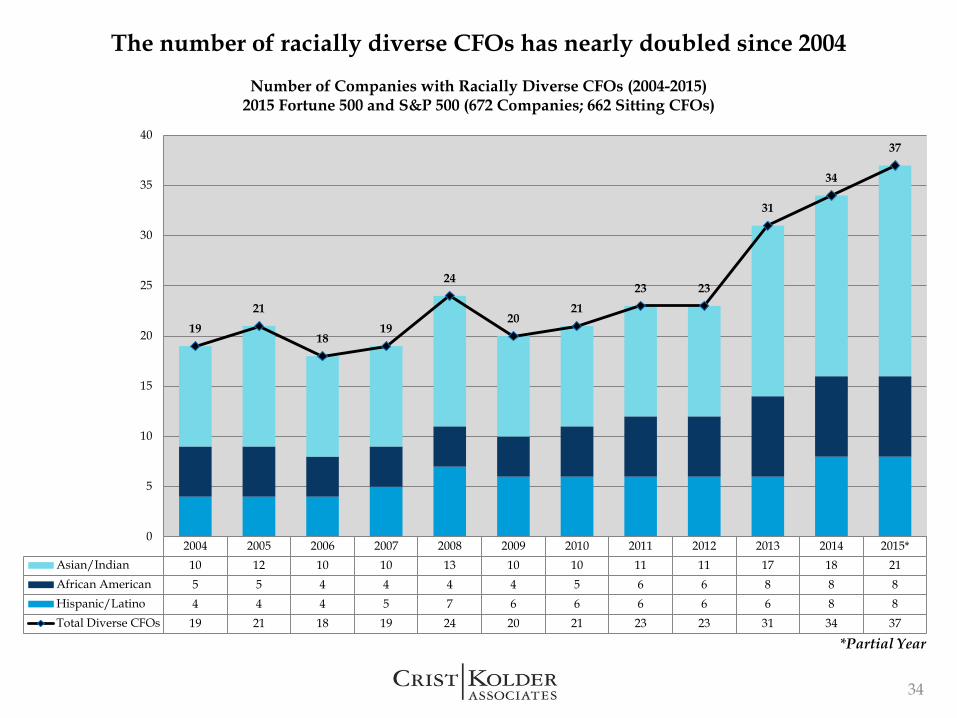
2004 2005 2006 2007 2008 2009 2010 2011 2012 2013 2014 2015*Asian/Indian 10 12 10 10 13 10 10 11 11 17 18 21African American 5 5 4 4 4 4 5 6 6 8 8 8Hispanic/Latino 4 4 4 5 7 6 6 6 6 6 8 8Total Diverse CFOs 19 21 18 19 24 20 21 23 23 31 34 37
1921
1819
24
2021
23 23
31
34
37
0
5
10
15
20
25
30
35
40
The number of racially diverse CFOs has nearly doubled since 2004Number of Companies with Racially Diverse CFOs (2004-2015)
2015 Fortune 500 and S&P 500 (672 Companies; 662 Sitting CFOs)
34
*Partial Year
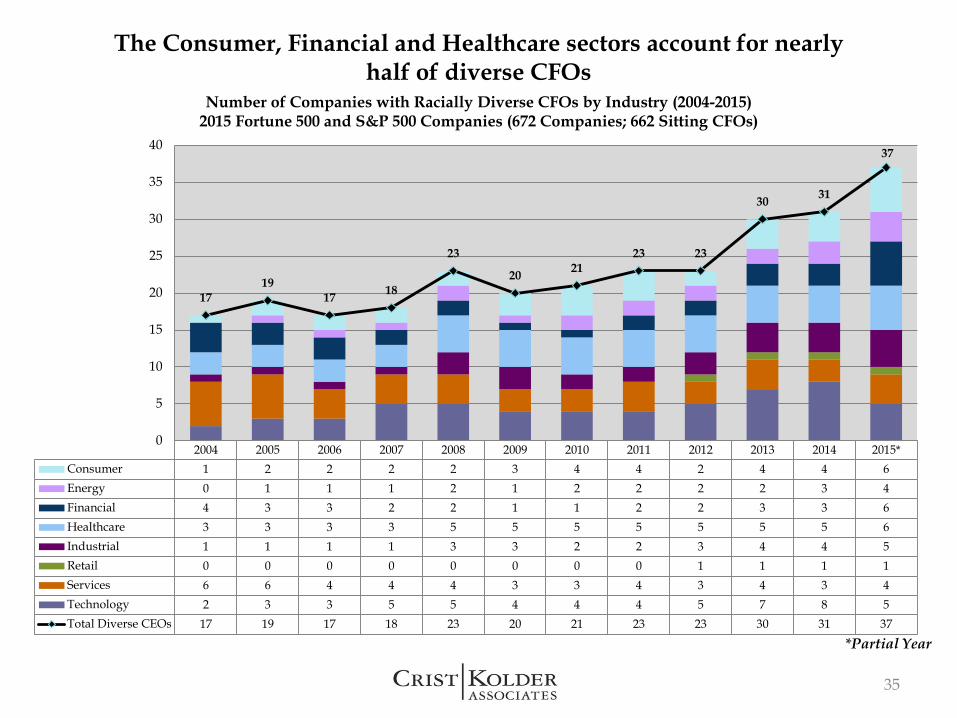
2004 2005 2006 2007 2008 2009 2010 2011 2012 2013 2014 2015*Consumer 1 2 2 2 2 3 4 4 2 4 4 6Energy 0 1 1 1 2 1 2 2 2 2 3 4Financial 4 3 3 2 2 1 1 2 2 3 3 6Healthcare 3 3 3 3 5 5 5 5 5 5 5 6Industrial 1 1 1 1 3 3 2 2 3 4 4 5Retail 0 0 0 0 0 0 0 0 1 1 1 1Services 6 6 4 4 4 3 3 4 3 4 3 4Technology 2 3 3 5 5 4 4 4 5 7 8 5Total Diverse CEOs 17 19 17 18 23 20 21 23 23 30 31 37
1719
17 18
23
20 2123 23
30 31
37
0
5
10
15
20
25
30
35
40
*Partial Year
The Consumer, Financial and Healthcare sectors account for nearlyhalf of diverse CFOs
Number of Companies with Racially Diverse CFOs by Industry (2004-2015)2015 Fortune 500 and S&P 500 Companies (672 Companies; 662 Sitting CFOs)
35

Education Background
36
0
10
20
30
40
50
60
70
80
Foreign Ivy League Big TenConference
Pacific 12Conference
SoutheasternConference
Big EastConference
AtlanticCoast
Conference
Big 12Conference
PatriotLeague
Mid-American
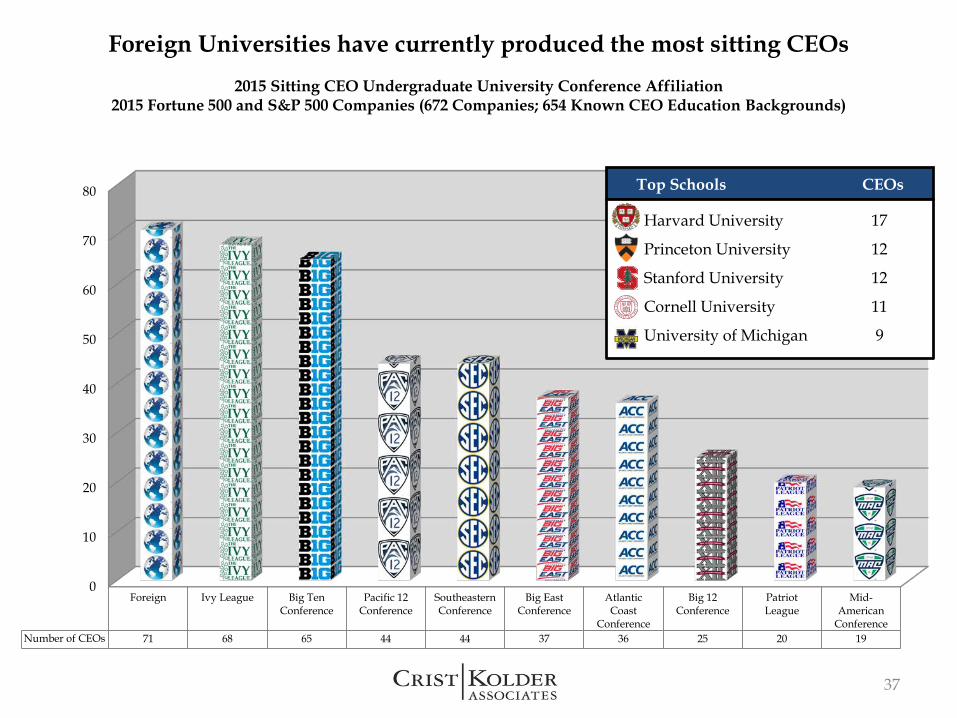
ConferenceNumber of CEOs 71 68 65 44 44 37 36 25 20 19
2015 Sitting CEO Undergraduate University Conference Affiliation2015 Fortune 500 and S&P 500 Companies (672 Companies; 654 Known CEO Education Backgrounds)
Foreign Universities have currently produced the most sitting CEOs
37
Top Schools CEOs
Harvard University 17
Princeton University 12
Stanford University 12
Cornell University 11
University of Michigan 9
0
10
20
30
40
50
60
70
80
Big TenConference
Foreign Atlantic CoastConference
Big EastConference
Ivy League Pacific 12Conference
SoutheasternConference
Big 12Conference
Mid-American
Conference
PatriotLeague
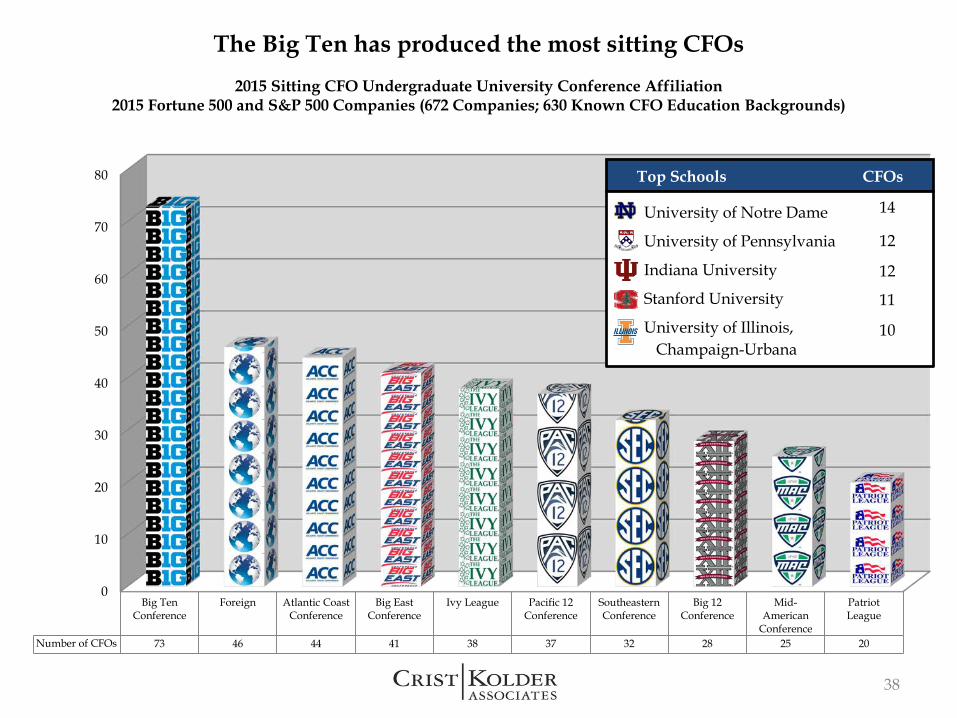
Number of CFOs 73 46 44 41 38 37 32 28 25 20
The Big Ten has produced the most sitting CFOs2015 Sitting CFO Undergraduate University Conference Affiliation
2015 Fortune 500 and S&P 500 Companies (672 Companies; 630 Known CFO Education Backgrounds)
38
Top Schools CFOs
University of Notre Dame
University of Pennsylvania
Indiana University
Stanford University
University of Illinois, Champaign-Urbana
14
12
12
11
10
0
2
4
6
8
10
12
14
16
18
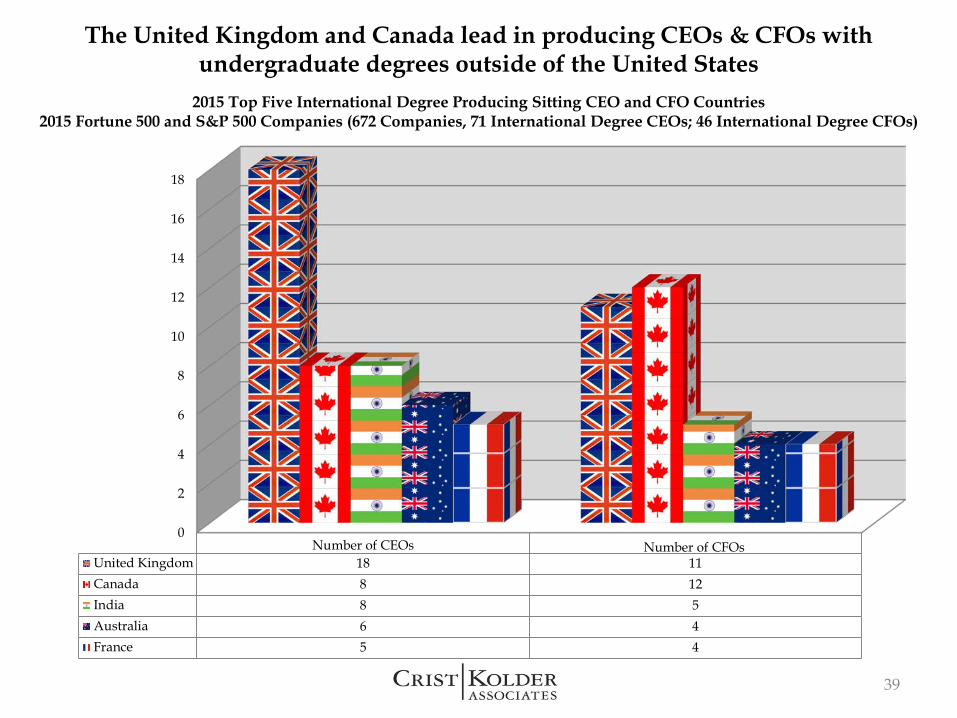
Number of CEOsUnited Kingdom 18 11Canada 8 12India 8 5Australia 6 4France 5 4
39
The United Kingdom and Canada lead in producing CEOs & CFOs with undergraduate degrees outside of the United States
Number of CFOs
2015 Top Five International Degree Producing Sitting CEO and CFO Countries2015 Fortune 500 and S&P 500 Companies (672 Companies, 71 International Degree CEOs; 46 International Degree CFOs)
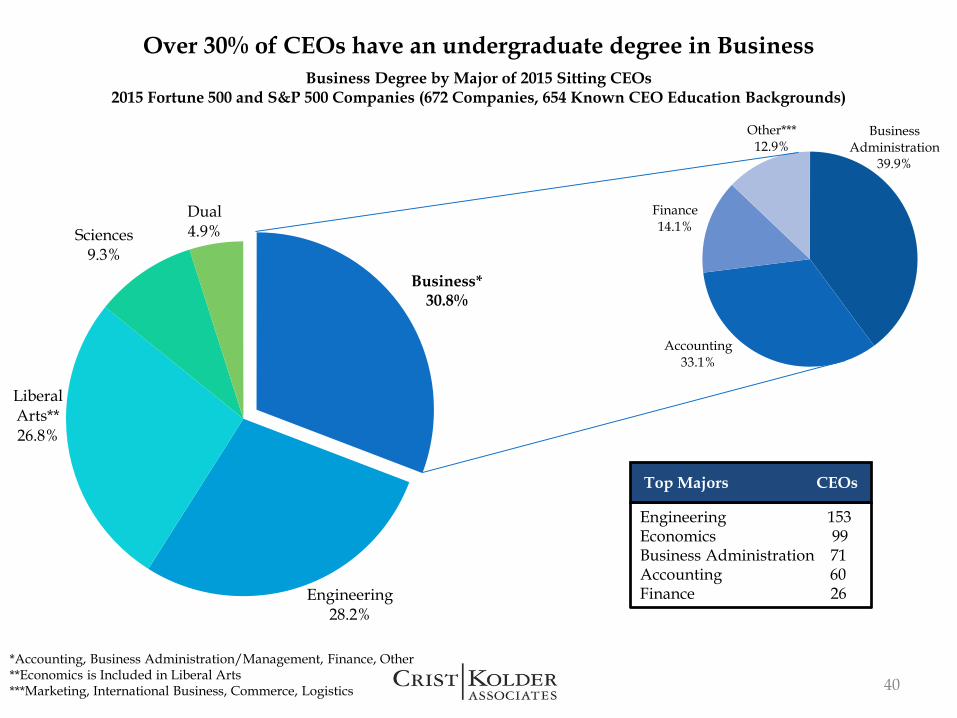
Business Administration
39.9%
Accounting33.1%
Finance14.1%
Other***12.9%
Business*30.8%
Engineering28.2%
Liberal Arts**26.8%
Sciences9.3%
Dual4.9%
Over 30% of CEOs have an undergraduate degree in BusinessBusiness Degree by Major of 2015 Sitting CEOs
2015 Fortune 500 and S&P 500 Companies (672 Companies, 654 Known CEO Education Backgrounds)
Engineering 153Economics 99Business Administration 71Accounting 60Finance 26
Top Majors CEOs
40*Accounting, Business Administration/Management, Finance, Other**Economics is Included in Liberal Arts***Marketing, International Business, Commerce, Logistics
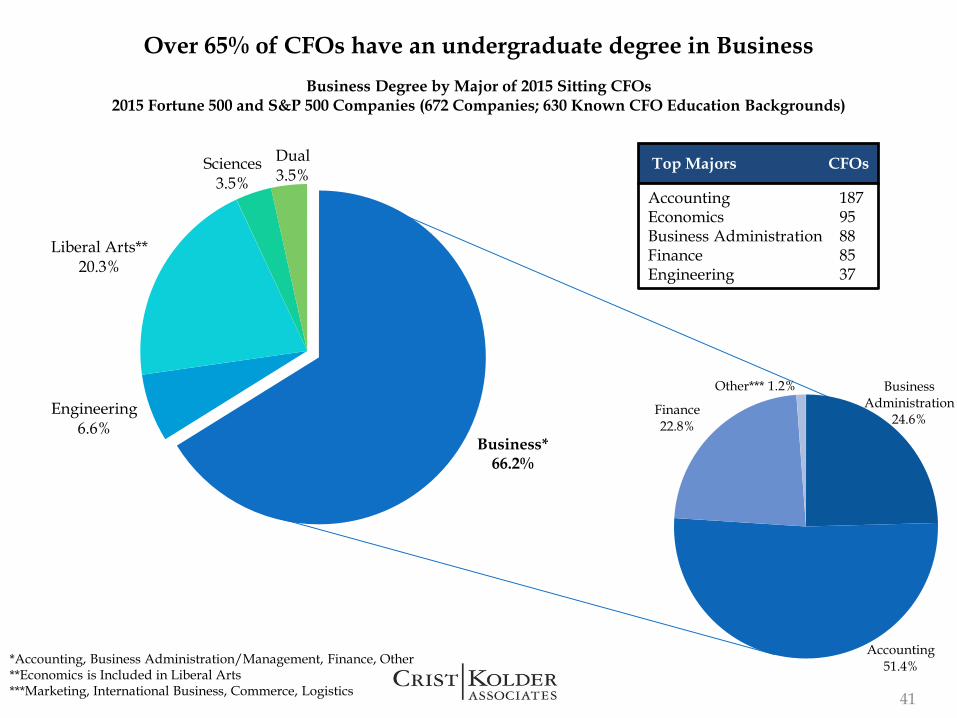
Over 65% of CFOs have an undergraduate degree in BusinessBusiness Degree by Major of 2015 Sitting CFOs
2015 Fortune 500 and S&P 500 Companies (672 Companies; 630 Known CFO Education Backgrounds)
Top Majors CFOs
AccountingEconomics Business Administration Finance Engineering
41
*Accounting, Business Administration/Management, Finance, Other**Economics is Included in Liberal Arts***Marketing, International Business, Commerce, Logistics
Business*66.2%
Engineering6.6%
Liberal Arts**20.3%
Sciences3.5%
Dual3.5%
Business Administration
24.6%
Accounting51.4%
Finance22.8%
Other*** 1.2%
18795888537
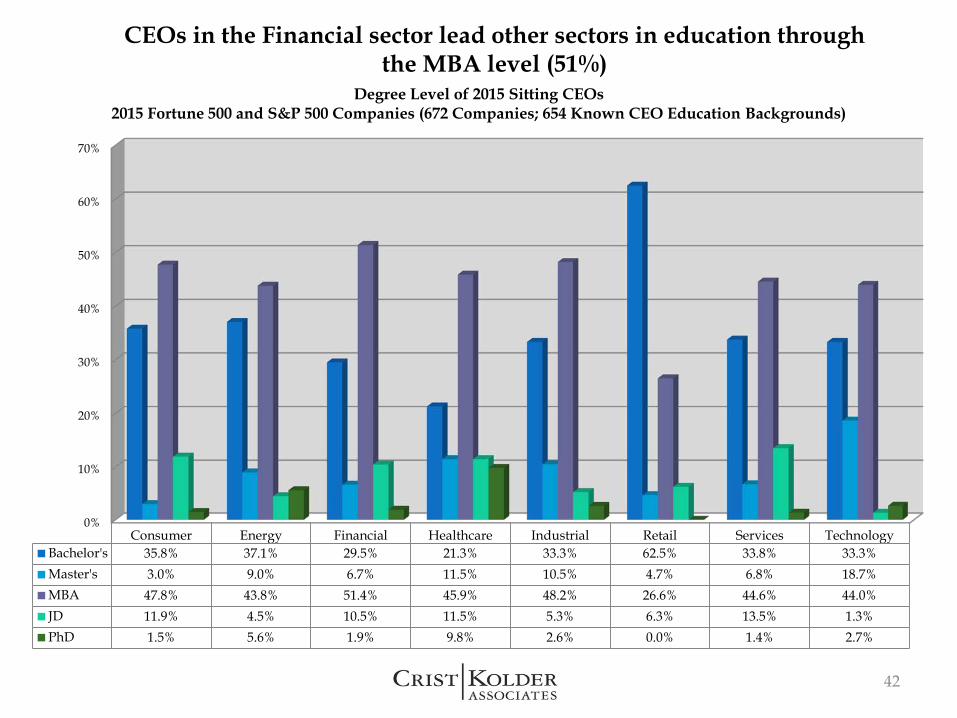
CEOs in the Financial sector lead other sectors in education through the MBA level (51%)
Degree Level of 2015 Sitting CEOs2015 Fortune 500 and S&P 500 Companies (672 Companies; 654 Known CEO Education Backgrounds)
42
0%
10%
20%
30%
40%
50%
60%
70%
Consumer Energy Financial Healthcare Industrial Retail Services TechnologyBachelor's 35.8% 37.1% 29.5% 21.3% 33.3% 62.5% 33.8% 33.3%Master's 3.0% 9.0% 6.7% 11.5% 10.5% 4.7% 6.8% 18.7%MBA 47.8% 43.8% 51.4% 45.9% 48.2% 26.6% 44.6% 44.0%JD 11.9% 4.5% 10.5% 11.5% 5.3% 6.3% 13.5% 1.3%PhD 1.5% 5.6% 1.9% 9.8% 2.6% 0.0% 1.4% 2.7%
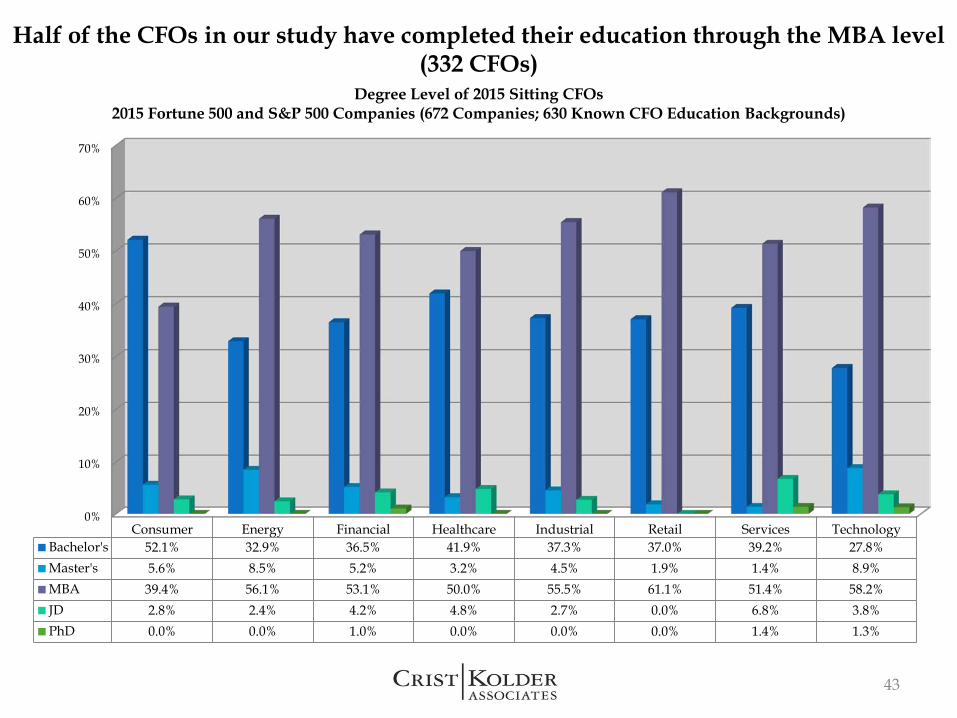
Half of the CFOs in our study have completed their education through the MBA level (332 CFOs)
Degree Level of 2015 Sitting CFOs 2015 Fortune 500 and S&P 500 Companies (672 Companies; 630 Known CFO Education Backgrounds)
43
0%
10%
20%
30%
40%
50%
60%
70%
Consumer Energy Financial Healthcare Industrial Retail Services TechnologyBachelor's 52.1% 32.9% 36.5% 41.9% 37.3% 37.0% 39.2% 27.8%Master's 5.6% 8.5% 5.2% 3.2% 4.5% 1.9% 1.4% 8.9%MBA 39.4% 56.1% 53.1% 50.0% 55.5% 61.1% 51.4% 58.2%JD 2.8% 2.4% 4.2% 4.8% 2.7% 0.0% 6.8% 3.8%PhD 0.0% 0.0% 1.0% 0.0% 0.0% 0.0% 1.4% 1.3%
44
0
5
10
15
20
25
30
35
40
45
50
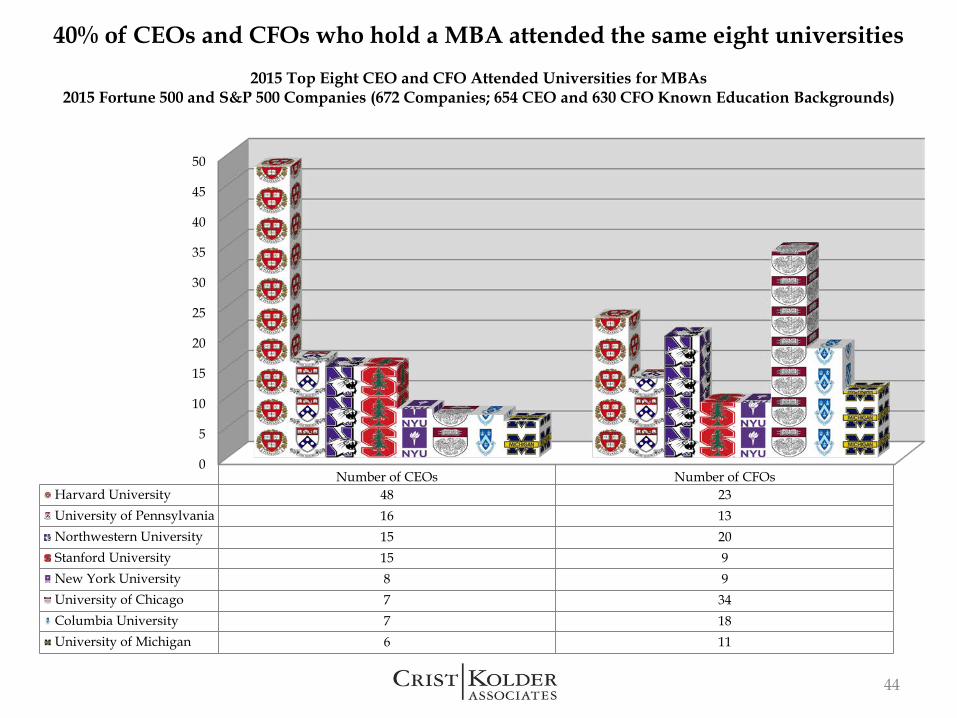
Number of CEOs Number of CFOsHarvard University 48 23University of Pennsylvania 16 13Northwestern University 15 20Stanford University 15 9New York University 8 9University of Chicago 7 34Columbia University 7 18University of Michigan 6 11
40% of CEOs and CFOs who hold a MBA attended the same eight universities2015 Top Eight CEO and CFO Attended Universities for MBAs
2015 Fortune 500 and S&P 500 Companies (672 Companies; 654 CEO and 630 CFO Known Education Backgrounds)


