Final version, December, 1996 Voltage Collapse Mitigation Report to IEEE Power System Relaying Committee Prepared by IEEE Power System Relaying Committee, Substation Protection Subcommittee, Working Group K12 - M. Begovic (Vice Chair), J. Bright, T. Domin, S. Easterday-McPadden, A. Girgis, W. Hartmann, C. Henville (Chair), M. Ibrahim, K. Kozminski, R. Marttila, G. Michel, K. Mustaphi, D. Novosel, B. Pettigrew, M. Sachdev, H. Shuh, P. Solanics, J. Williams. Table of Contents I. Introduction.............................................................................................................................................. 1 II. Voltage Collapse .................................................................................................................................... 1 A. Introduction 1 B. Modeling of Voltage Collapse 1 C. Voltage Collapse Proximity Indicators 2 D. Conventional Indicators 4 E. Future possibilities 5 F. Time Frame of Voltage Collapse 6 G. Load Types 7 III. Dynamic Sources of Reactive Power ................................................................................................. 9 A. Static Sources 9 B. Synchronous Machines 10 C. Measurement of Dynamic Reactive Power Reserve 12 D. Excitation Control Devices 14 E. Protection Issues 18 IV. Switched Capacitance ......................................................................................................................... 20 A. Long-term Time Frame. 20 B. Transient Time Frame 21 V. Automatic Reclosing ............................................................................................................................. 23 VI. Load Shedding...................................................................................................................................... 24 A. Manual Load Shedding 24 B. Load Shedding as Part of Energy Management Systems (EMS) 25 C. Automatic Load Shedding 25 VII. Distribution Voltage Control ................................................................................................................ 28 A. General 28 B. LTC Blocking Schemes 28 C. Distribution Voltage Reduction 29 D. Comparison of Voltage Reduction and Blocking Schemes 30 VIII. Conclusion .......................................................................................................................................... 31 A. The fundamental principles of mitigation actions 31 B. Choice of action(s) depends to a large extent on dynamics 32 IX. Acknowledgments ................................................................................................................................. 33 X. References ............................................................................................................................................ 33
Transcript
Final version, December, 1996
Voltage Collapse Mitigation
Report to IEEE Power System Relaying Committee
Prepared by IEEE Power System Relaying Committee, Substation Protection Subcommittee, WorkingGroup K12 - M. Begovic (Vice Chair), J. Bright, T. Domin, S. Easterday-McPadden, A. Girgis, W.
Hartmann, C. Henville (Chair), M. Ibrahim, K. Kozminski, R. Marttila, G. Michel, K. Mustaphi, D. Novosel, B.Pettigrew, M. Sachdev, H. Shuh, P. Solanics, J. Williams.
Table of Contents
I. Introduction..............................................................................................................................................1II. Voltage Collapse....................................................................................................................................1
A. Introduction 1B. Modeling of Voltage Collapse 1C. Voltage Collapse Proximity Indicators 2D. Conventional Indicators 4E. Future possibilities 5F. Time Frame of Voltage Collapse 6G. Load Types 7
III. Dynamic Sources of Reactive Power .................................................................................................9A. Static Sources 9B. Synchronous Machines 10C. Measurement of Dynamic Reactive Power Reserve 12D. Excitation Control Devices 14E. Protection Issues 18
IV. Switched Capacitance .........................................................................................................................20A. Long-term Time Frame. 20B. Transient Time Frame 21
V. Automatic Reclosing .............................................................................................................................23VI. Load Shedding......................................................................................................................................24
A. Manual Load Shedding 24B. Load Shedding as Part of Energy Management Systems (EMS) 25C. Automatic Load Shedding 25
VII. Distribution Voltage Control................................................................................................................28A. General 28B. LTC Blocking Schemes 28C. Distribution Voltage Reduction 29D. Comparison of Voltage Reduction and Blocking Schemes 30
VIII. Conclusion..........................................................................................................................................31A. The fundamental principles of mitigation actions 31B. Choice of action(s) depends to a large extent on dynamics 32
IX. Acknowledgments.................................................................................................................................33X. References............................................................................................................................................33
Final version, December, 1996
This page left blank intentionally
Final version, December, 1996
1
I. Introduction
Proper application of protective relaying andcontrol schemes and other remedial actions canreduce the probability of voltage collapse. TheIEEE Power System Relaying Committee(PSRC) decided to review the factors affectingthe choice and application of protection andcontrol schemes, to assist relay engineers inmaking their contribution to the design of reliablepower systems.
In January 1994 the PSRC produced a specialpublication [1] discussing the phenomenon anddescribing various automatic load sheddingschemes. During the preparation of thatpublication it became apparent that there were anumber of protection and control strategies thatcould be applied to reduce the probability ofvoltage collapse. This report discusses theprotection aspects of the various schemes, andfactors affecting their application. By pointing outrelay highlights and concerns, it will supplement amore comprehensive reference [2].
Voltage control problems are not new to the utilityindustry but the problems in the past wereprimarily associated with the transfer of powerfrom remote generation sites to load centers.These problems were addressed by specificcontrol and/or protection schemes dedicated tothe particular transmission systems.
More recently, the combined effects of inter-utilitypower transfers, wholesale wheeling,interconnection of NUGs and difficulty in buildingnew transmission facilities have resulted inoperating transmission systems closer to theirvoltage/reactive limits. Voltage control problemsare now appearing in more tightly meshedtransmission systems and over wide areas.Maintaining adequate network voltage withreduced transmission margins has become amajor source of vulnerability for manyinterconnected systems.
The phenomenon of voltage collapse has createdsignificant interest and much research. Themajor issue in dealing with voltage collapse is the
proper diagnosis of the underlying factorscausing low voltage. Proper coordination ofprotective schemes and system controls duringdeclining or low voltage conditions is essential.
II. Voltage Collapse
A. IntroductionThe main symptoms of voltage collapse are - lowvoltage profiles, heavy reactive power flows,inadequate reactive support, and heavily loadedsystems. The collapse is often precipitated bylow-probability single or multiple contingencies.The consequences of collapse often require longsystem restoration, while large groups ofcustomers are left without supply for extendedperiods of time. Schemes which mitigate againstcollapse need to use the symptoms to diagnosethe approach of the collapse in time to initiatecorrective action.
The following subsections will discuss themodeling of the collapse (required in order todetermine the symptoms) and techniques to usethe symptoms to make the diagnosis. Moreinformation on modeling systems subject tovoltage stability concerns are available in [3].
B. Modeling of Voltage CollapseModeling techniques can be divided into two maincategories, static or dynamic. In determining thesuitability of the different approaches, it isimportant to distinguish between various eventswhich affect the speed and probability of voltagecollapse:
• disturbances of topology, which may involveequipment outages, or faults followed byequipment outages. Many of thesedisturbances are similar to those which aretraditionally associated with transient stabilityanalysis, and sometimes the distinction ishard to make. For analysis of these events, adynamic system model is required.
• load disturbances; these are the fluctuationsof load which may have dynamics of theirown, which can be split into
Final version, December, 1996
2
- slow load fluctuations (normal random loadfluctuations)- fast load fluctuations (such as outages oflarge blocks of loads)Slow load fluctuations may be treated asinherently static. They cause the stableequilibrium of the system to move slowly,which makes it possible to approximatevoltage profile changes by a discretesequence of steady states rather than adynamic model.
The following table briefly summarizes the typesof disturbances which may cause voltageinstability and the appropriate modeling approach:
While the three types of disturbances whichrequire dynamic analysis are also known as theleading causes of other types of transientinstability, they may cause voltage instability ifeither one of the following happens:
• the post-disturbance equilibrium has a lowvoltage profile
• the transient voltage dips during thedisturbance are too long
• the post-disturbance equilibrium is voltageunstable (i.e., adding reactive power supportat any bus lowers the voltage at the samebus)
The best way to identify all the aspects oftransient and/or steady state performance of thesystem before, during, and after the disturbance,as well as the effects of various contingencies, isby time-domain simulation. This, unfortunately, issometimes a computationally expensive way.
C. Voltage Collapse Proximity IndicatorsPresently, static simulations are still widely usedfor planning and operating purposes to determine
reactive support requirements and systemloading capability. However, time-domainsimulations may also be used for voltage stabilityanalysis. Following is a brief account of proximityindicators of steady state voltage instability.
Historically, early attempts to investigate voltageunstable conditions were based on attempts toimprove the solution of static load flow programsapplied to heavily loaded power systems havinglow voltage profiles. It was difficult to arrive atload flow solutions for such systems because atthe point of voltage collapse (and at higher loads)there is no real steady state solution to the loadflow. Later, the dual solution (with two differentvoltages for the same power delivered) wereobserved to converge to a single point beyondwhich it became impossible to solve the powerflow.
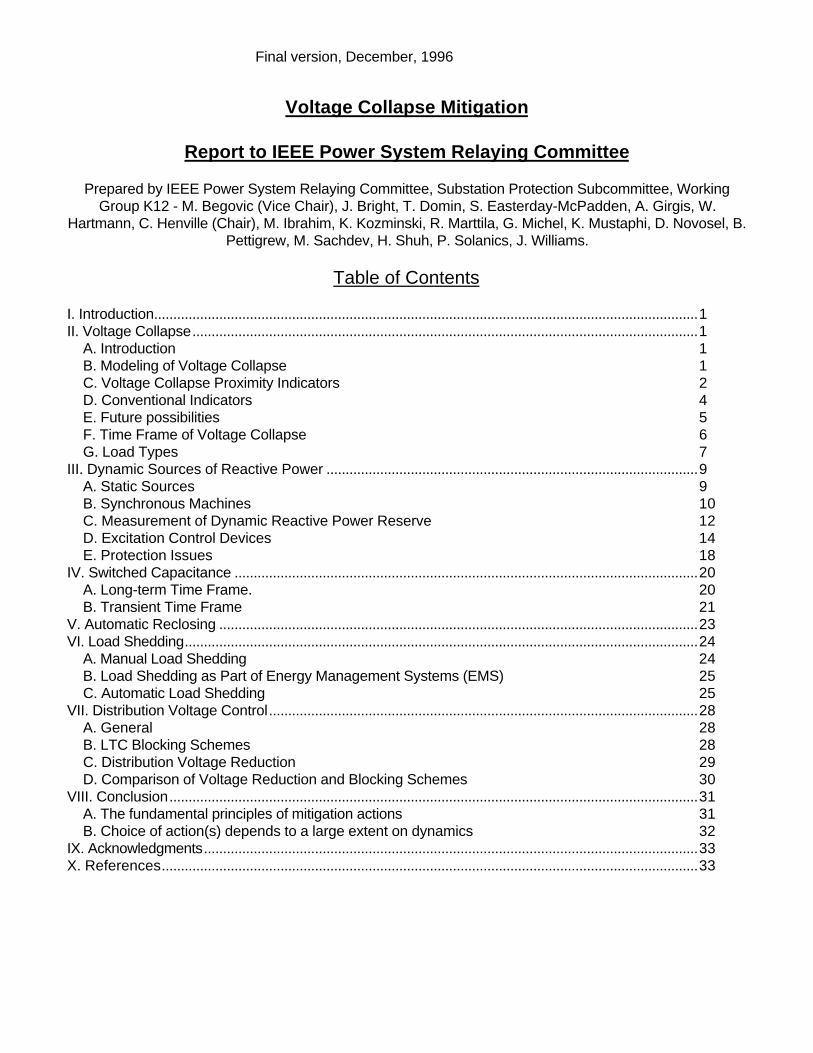
Early indicators used the distance of the twosolution points as an indicator of proximity tocollapse, since this distance decreases as thepoint of maximum loadability approaches. FigureII-1 shows a VP diagram of a particular system ata particular operating point, with the two solutionpoints.
The upper point VU is the normal operating point,but a solution at VL is also possible. It can beseen that the distance between the two solutions
1
0
V o l t a g e(p.u.)
Power
VU
VL
Pm
∆V
Figure II-1 VP Curve and Power Margin
Final version, December, 1996
3
∆V tends to zero as the margin of power Pm
between the operating point and the point ofmaximum power approaches zero.
VP curves do not take into account the reactivepower component of the load. To include thereactive component, a third dimension must beadded, as shown in Figure II-2 following.
Figure II-2 represents a trajectory of the loadincrease when active and reactive power canchange independently, as well as the active andreactive power margins. The voltage stabilityboundary is represented by a projection onto thePQ plane (a bold curve). It can be observed that:(a) there may be many possible trajectories to(and points of) voltage collapse; (b) active andreactive power margins depend on the initialoperating point and the trajectory to collapse.
There have been numerous later attempts to usethese initial observations and find more refinedand accurate voltage collapse proximityindicators. They are usually based onmeasurement of the state of a given systemunder stress and derivation of certainparameters which indicate the stability orcloseness to instability of that system.
Parameters based on measurement of systemcondition are useful for planning and operatingpurposes to avoid the situation where a collapse
might occur. However, it is difficult to calculatethe system condition and derive the parametersin real time. Rapid derivation and analysis ofthese parameters is important to initiateautomatic corrective actions fast enough to avoidcollapse under emergency conditions which arisedue to topological changes or very fast loadchanges.
It is much better if a few critical parameters thatcan be directly measured could be used in realtime to quickly indicate proximity to collapse. Anexample of such indicator is the sensitivity of thegenerated reactive powers with respect to theload parameters (active and reactive powers ofthe loads). When the system is close to collapse,small increases in load result in relatively largeincreases in reactive power absorption in thesystem. These increases in reactive powerabsorption must be supplied by dynamic sourcesof reactive power in the region. At the point ofcollapse, the rate of change of generatedreactive power at key sources with respect toload increases at key busses tends to infinity.
The sensitivity matrix of the generated reactivepowers with respect to loading parameters isrelatively easy to calculate in off-line studies, butcould be a problem in real-time applications,because of the need for system-widemeasurement information. Large sensitivityfactors reveal both critical generators (thoserequired to supply most of the newly neededreactive power), and critical loads (those whoselocation in the system topology imposes thelargest increase in reactive transmission losses,even for the modest changes of their own loadparameters). The norm of such a sensitivitymatrix represents a useful proximity indicator, butone that is still relatively difficult to interpret. It isnot the generated reactive power, but itsderivatives with respect to loading parameterswhich become infinite at the point of imminentcollapse.
Other useful indicators that can be directlymeasured are the power margins themselves -they can be defined as margins of active, orreactive power on a single bus, or a collection of
P
Q
V trajectory (P,Q,V)
point of voltage collapse
an operating point
active powermargin
reactive power margin
Figure II-2 VPQ Curve Representing aTrajectory Where Both Active and ReactivePower Can Change Arbitrarily
Final version, December, 1996
4
busses in the system when a restricted numberof load parameters are allowed to freely change.
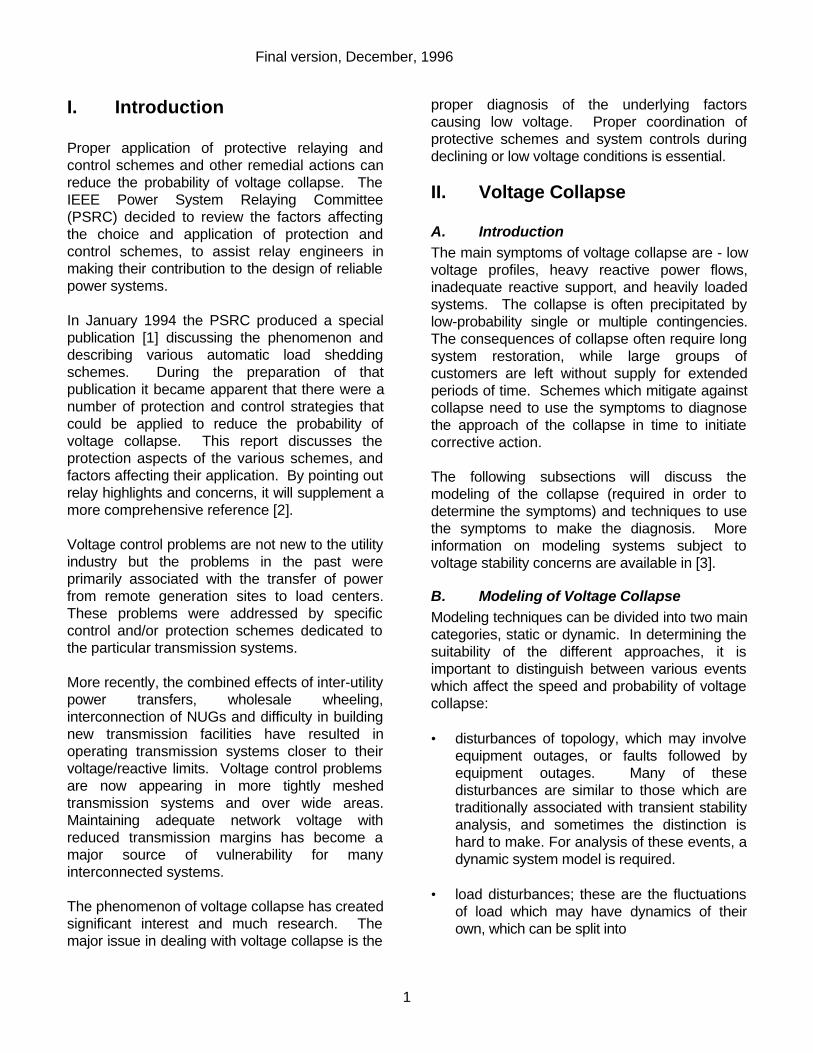
For example, Figure II-3 shows a VQ diagram ofa bus in a particular power system at threedifferent loads, P1, P2, and P3. The y axisshows the amount of additional reactive powerthat must be injected into the bus to operate at agiven voltage. The operating point is theintersection of the power curve with the x axis,where no reactive power is required to beinjected or absorbed. If the slope of the curve atthe intersection is positive, the system is stable,because any additional reactive power will raisethe voltage, and vice versa. It can be seen thatthe system is voltage stable with the lightest load,P1. For this load, there is a reserve of reactivepower (Qreserve) that can be used to maintainstability even if the load increases. The systemis only marginally stable with the medium load P2.The system is not stable with the heaviest loadP3, since an amount of reactive power(Qmissing) must be injected into the bus to causean intersection with the x axis. Thus the measureof Qreserve gives an indication of the marginbetween stability and instability.
Although Qreserve may be difficult or impossibleto measure directly, some means of estimating itare available. One method is to find dynamicsources (or a single lumped source) of reactivepower that play a significant role in supporting the
voltage in a specific area that may be subject tovoltage collapse. Power flow studies will showhow these sources respond to voltagedepressions in the region of interest. Whenstudies have defined the relationship of the Varreserve in these specific sources, to total Varreserve in the region, it may be possible to usethe Var reserve of these sources as an indicatorof total Var reserve in the region. Anothermethod may be to compute the significance of alldynamic sources in the region, measure theirunused Var capability, and compute the amountof Qreserve available to the region of interest.
Important aspects to consider in voltage stabilityanalyses:
• Operating limits, such as reactive powergeneration limits, are important factors involtage stability analysis. An example of theapplication of such limits follows in thediscussion on conventional indicators.
• Many loads (especially the composite loads,
as viewed from the transmission network),are sensitive to voltage, and the effects oftheir voltage-related behavior are to beaccounted for in accurate analysis of voltagestability. Load characteristics are discussedlater in this paper.
• Accurate short-term load forecasting
techniques are to be used in order to assessthe most likely direction of the load changesand corresponding margins.
D. Conventional IndicatorsSystem planning static loadflow studies, candefine possible scenarios. For example, recenttransmission network assessments conducted bythe reliability regions which compose the NorthAmerican Electric Reliability Council (NERC)indicate that portions of the regional transmissionnetworks continue to be loaded to their limitswhen accommodating power transfers. Specialoperating procedures are in place to coordinatetransfers and maintain system reliability duringcontingency conditions. In the EasternInterconnection, reliability of the transmission
-0.4
0
0.4
0.8
Voltage (p.u.)
Q in
ject
ed (
p.u.
)
P1P2
P3
Qreserve
Qmissing
1.0
Figure II-3 VQ Curve for Three Loads
Final version, December, 1996
5
system will continue to be maintained through theuse of operating procedures such as theReliability Coordination Plan (RCP). The RCPwas developed by utilities owning and operatingthe transmission systems in various NorthAmerican regions. It is used to curtail or limittransfers to insure adequate voltage profiles inthat part of the Eastern Interconnection.
Some common indicators of system conditionsthat are presently measured to determine anemergency system state, requiring voltagecollapse mitigation actions are
• Tie line status, generator status• Voltage, time• Reactive power limiters in action• Reactive power reserves.
These indicators may be used individually, ortogether to determine the need for automaticaction. The status of tie lines or important localgenerators can be a very good indicator, if theirpresence is required for stable operatingconditions. Such indicators cannot normally beused by themselves however, since voltagecollapse is a system wide phenomenon whichcannot be described by knowledge of localconditions alone. To allow use of a schemelooking at the status of the critical equipment,manual arming and disarming by systemoperators may be required. This would placeextra burden on system operators however, andresults in less than optimum arming of themitigation scheme. Thus the status of equipmentcan be considered as one part of the indicationof impending collapse. Other important factorslike tie line loads or reactive power sourceoutputs may be combined with equipment statusto make the decision. The Florida Power andLight scheme [4] is one such scheme that uses acombination of equipment status and otherfactors.
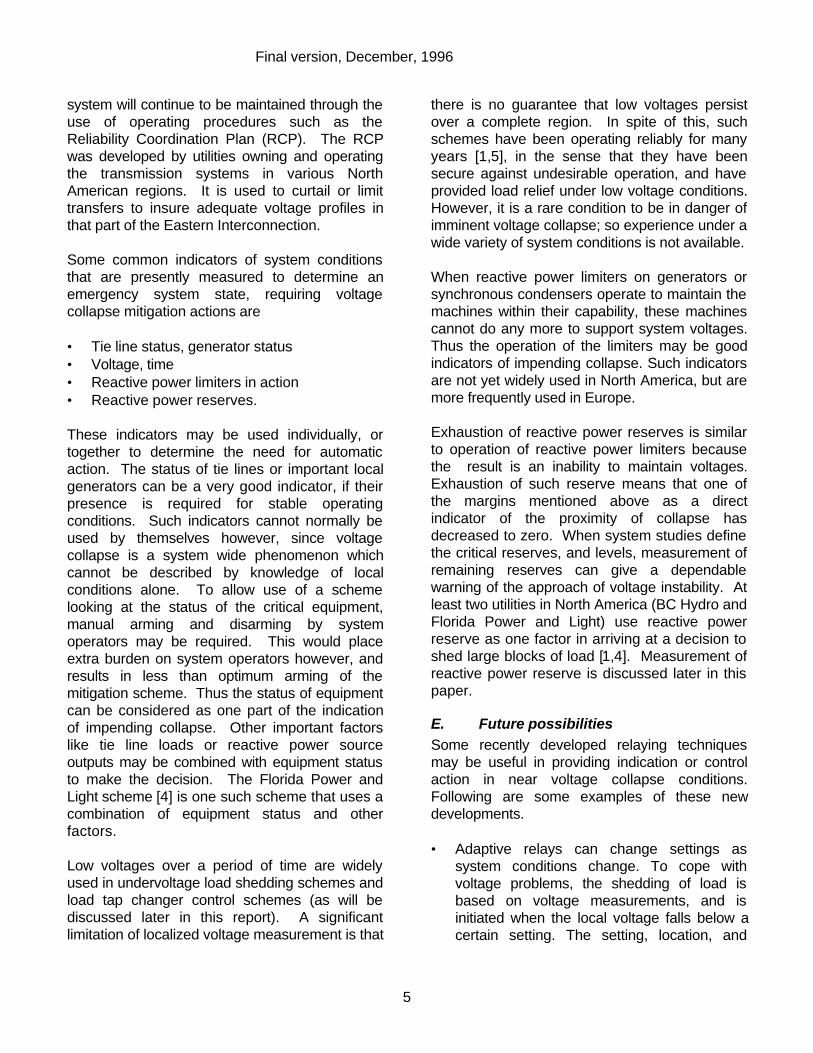
Low voltages over a period of time are widelyused in undervoltage load shedding schemes andload tap changer control schemes (as will bediscussed later in this report). A significantlimitation of localized voltage measurement is that
there is no guarantee that low voltages persistover a complete region. In spite of this, suchschemes have been operating reliably for manyyears [1,5], in the sense that they have beensecure against undesirable operation, and haveprovided load relief under low voltage conditions.However, it is a rare condition to be in danger ofimminent voltage collapse; so experience under awide variety of system conditions is not available.
When reactive power limiters on generators orsynchronous condensers operate to maintain themachines within their capability, these machinescannot do any more to support system voltages.Thus the operation of the limiters may be goodindicators of impending collapse. Such indicatorsare not yet widely used in North America, but aremore frequently used in Europe.
Exhaustion of reactive power reserves is similarto operation of reactive power limiters becausethe result is an inability to maintain voltages.Exhaustion of such reserve means that one ofthe margins mentioned above as a directindicator of the proximity of collapse hasdecreased to zero. When system studies definethe critical reserves, and levels, measurement ofremaining reserves can give a dependablewarning of the approach of voltage instability. Atleast two utilities in North America (BC Hydro andFlorida Power and Light) use reactive powerreserve as one factor in arriving at a decision toshed large blocks of load [1,4]. Measurement ofreactive power reserve is discussed later in thispaper.
E. Future possibilitiesSome recently developed relaying techniquesmay be useful in providing indication or controlaction in near voltage collapse conditions.Following are some examples of these newdevelopments.
• Adaptive relays can change settings assystem conditions change. To cope withvoltage problems, the shedding of load isbased on voltage measurements, and isinitiated when the local voltage falls below acertain setting. The setting, location, and
Final version, December, 1996
6
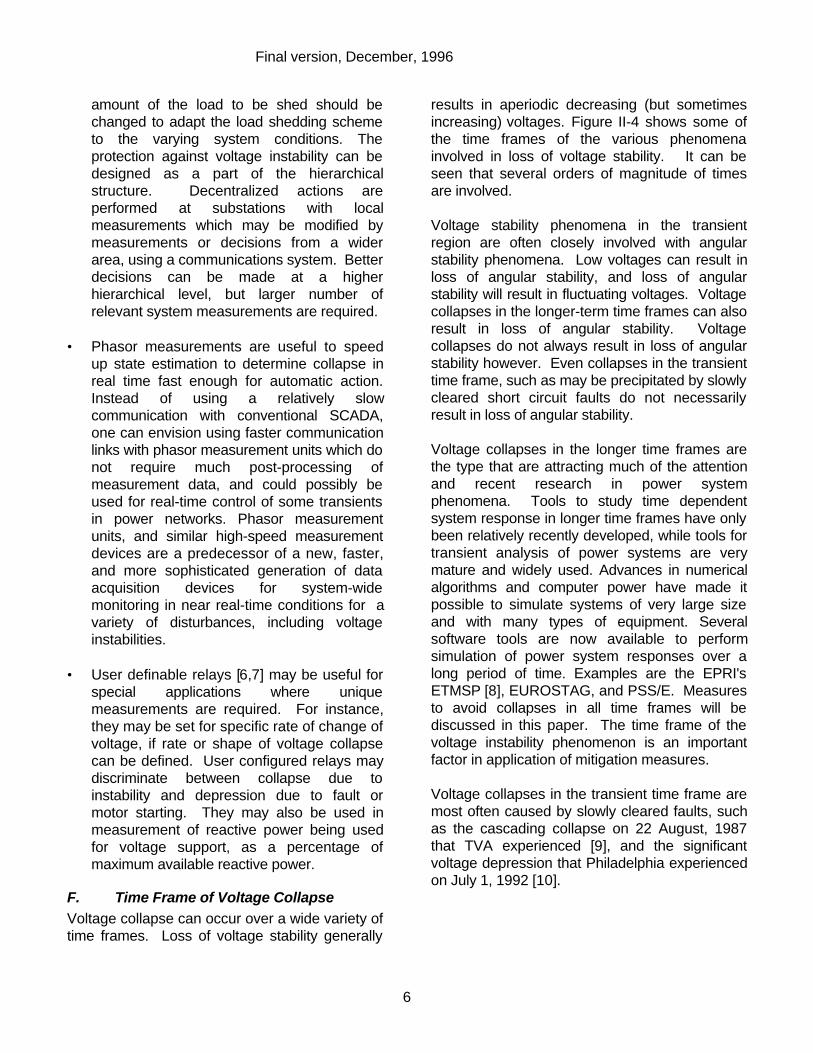
amount of the load to be shed should bechanged to adapt the load shedding schemeto the varying system conditions. Theprotection against voltage instability can bedesigned as a part of the hierarchicalstructure. Decentralized actions areperformed at substations with localmeasurements which may be modified bymeasurements or decisions from a widerarea, using a communications system. Betterdecisions can be made at a higherhierarchical level, but larger number ofrelevant system measurements are required.
• Phasor measurements are useful to speed
up state estimation to determine collapse inreal time fast enough for automatic action.Instead of using a relatively slowcommunication with conventional SCADA,one can envision using faster communicationlinks with phasor measurement units which donot require much post-processing ofmeasurement data, and could possibly beused for real-time control of some transientsin power networks. Phasor measurementunits, and similar high-speed measurementdevices are a predecessor of a new, faster,and more sophisticated generation of dataacquisition devices for system-widemonitoring in near real-time conditions for avariety of disturbances, including voltageinstabilities.
• User definable relays [6,7] may be useful for
special applications where uniquemeasurements are required. For instance,they may be set for specific rate of change ofvoltage, if rate or shape of voltage collapsecan be defined. User configured relays maydiscriminate between collapse due toinstability and depression due to fault ormotor starting. They may also be used inmeasurement of reactive power being usedfor voltage support, as a percentage ofmaximum available reactive power.
F. Time Frame of Voltage CollapseVoltage collapse can occur over a wide variety oftime frames. Loss of voltage stability generally
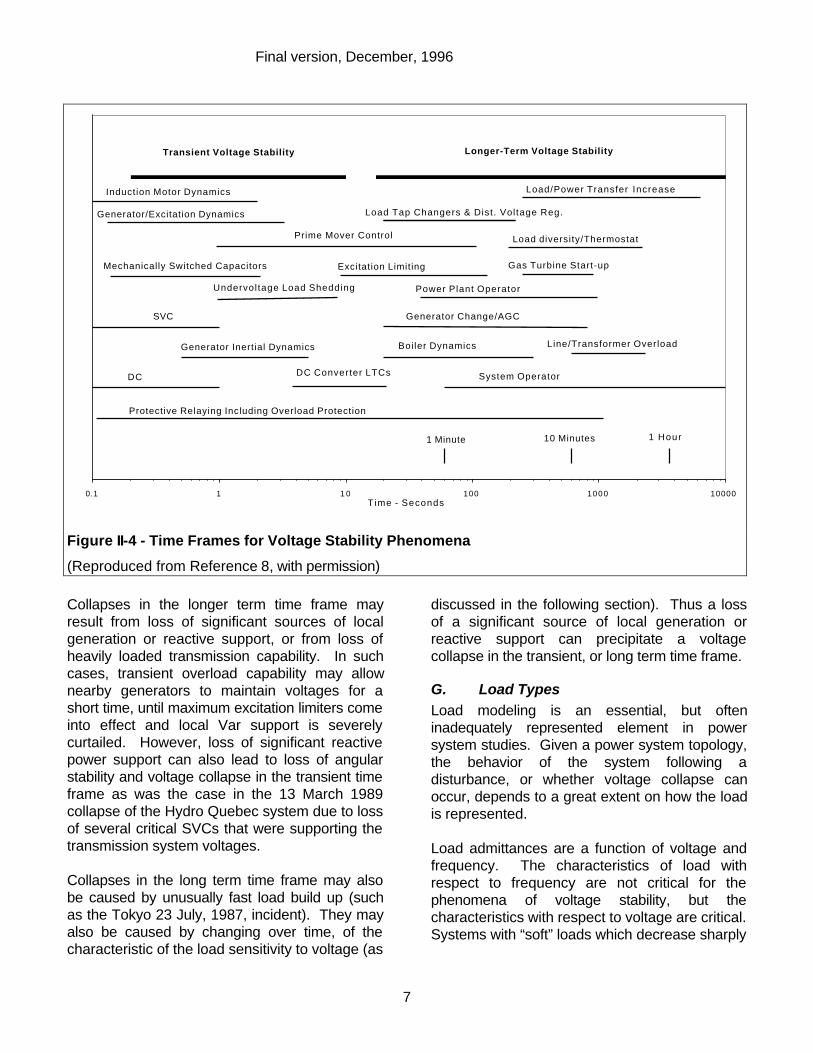
results in aperiodic decreasing (but sometimesincreasing) voltages. Figure II-4 shows some ofthe time frames of the various phenomenainvolved in loss of voltage stability. It can beseen that several orders of magnitude of timesare involved.
Voltage stability phenomena in the transientregion are often closely involved with angularstability phenomena. Low voltages can result inloss of angular stability, and loss of angularstability will result in fluctuating voltages. Voltagecollapses in the longer-term time frames can alsoresult in loss of angular stability. Voltagecollapses do not always result in loss of angularstability however. Even collapses in the transienttime frame, such as may be precipitated by slowlycleared short circuit faults do not necessarilyresult in loss of angular stability.
Voltage collapses in the longer time frames arethe type that are attracting much of the attentionand recent research in power systemphenomena. Tools to study time dependentsystem response in longer time frames have onlybeen relatively recently developed, while tools fortransient analysis of power systems are verymature and widely used. Advances in numericalalgorithms and computer power have made itpossible to simulate systems of very large sizeand with many types of equipment. Severalsoftware tools are now available to performsimulation of power system responses over along period of time. Examples are the EPRI'sETMSP [8], EUROSTAG, and PSS/E. Measuresto avoid collapses in all time frames will bediscussed in this paper. The time frame of thevoltage instability phenomenon is an importantfactor in application of mitigation measures.
Voltage collapses in the transient time frame aremost often caused by slowly cleared faults, suchas the cascading collapse on 22 August, 1987that TVA experienced [9], and the significantvoltage depression that Philadelphia experiencedon July 1, 1992 [10].
Final version, December, 1996
7
Collapses in the longer term time frame mayresult from loss of significant sources of localgeneration or reactive support, or from loss ofheavily loaded transmission capability. In suchcases, transient overload capability may allownearby generators to maintain voltages for ashort time, until maximum excitation limiters comeinto effect and local Var support is severelycurtailed. However, loss of significant reactivepower support can also lead to loss of angularstability and voltage collapse in the transient timeframe as was the case in the 13 March 1989collapse of the Hydro Quebec system due to lossof several critical SVCs that were supporting thetransmission system voltages.
Collapses in the long term time frame may alsobe caused by unusually fast load build up (suchas the Tokyo 23 July, 1987, incident). They mayalso be caused by changing over time, of thecharacteristic of the load sensitivity to voltage (as
discussed in the following section). Thus a lossof a significant source of local generation orreactive support can precipitate a voltagecollapse in the transient, or long term time frame.
G. Load TypesLoad modeling is an essential, but ofteninadequately represented element in powersystem studies. Given a power system topology,the behavior of the system following adisturbance, or whether voltage collapse canoccur, depends to a great extent on how the loadis represented.
Load admittances are a function of voltage andfrequency. The characteristics of load withrespect to frequency are not critical for thephenomena of voltage stability, but thecharacteristics with respect to voltage are critical.Systems with “soft” loads which decrease sharply
0.1 1 1 0 100 1000 10000Time - Seconds
Transient Voltage Stability Longer-Term Voltage Stability
Generator/Excitation Dynamics Load Tap Changers & Dist. Voltage Reg.
Prime Mover Control Load diversity/Thermostat
Induction Motor Dynamics
Excitation Limiting
Line/Transformer Overload
SVC Generator Change/AGC
Mechanically Switched Capacitors
Power Plant Operator
Generator Inertial Dynamics Boiler Dynamics
DC
Gas Turbine Start-up
System OperatorDC Converter LTCs
1 Minute 1 Hour10 Minutes
Load/Power Transfer Increase
Undervol tage Load Shedding
Protective Relaying Including Overload Protection
Figure II-4 - Time Frames for Voltage Stability Phenomena
(Reproduced from Reference 8, with permission)
Final version, December, 1996
8
with voltage are much more likely to be voltagestable than systems with “hard” loads that arerelatively independent of voltage. Therelationship of power to voltage may beexpressed as P = KpVα where P is the powerdelivered to the load, Kp is a constant, V is themagnitude of the supply voltage and the exponentα, determines the sensitivity of the load tovoltage. “Hard” loads would have values of αnear 0, and “soft” loads would have values nearer2.
Not only is the characteristic of the real powercomponent of load (with respect to voltage)important, but also the reactive power componentcharacteristic is important. Voltage magnitude ismuch more sensitive to reactive power flow thanto real power flow. Similar to the case of realpower, the reactive power sensitivity may beexpressed as Q = KqVβ, where Q is the reactivepower supplied, Kq is a constant, V is the voltagemagnitude and the exponent β determines thesensitivity to voltage. Investigations into thesensitivity of load with respect to voltage mustaddress both the real and reactive components(they must attempt to determine the values of αand β).
The values of α and β are not necessarilyconstant with time. Since voltage collapse is adynamic event, the dependence of α and β withrespect to time is also important. A commonmethod of investigating load characteristics is tomeasure the response of load to small voltagechanges. The studies often show that thecharacteristics of α and β with respect to timeare different from each other.
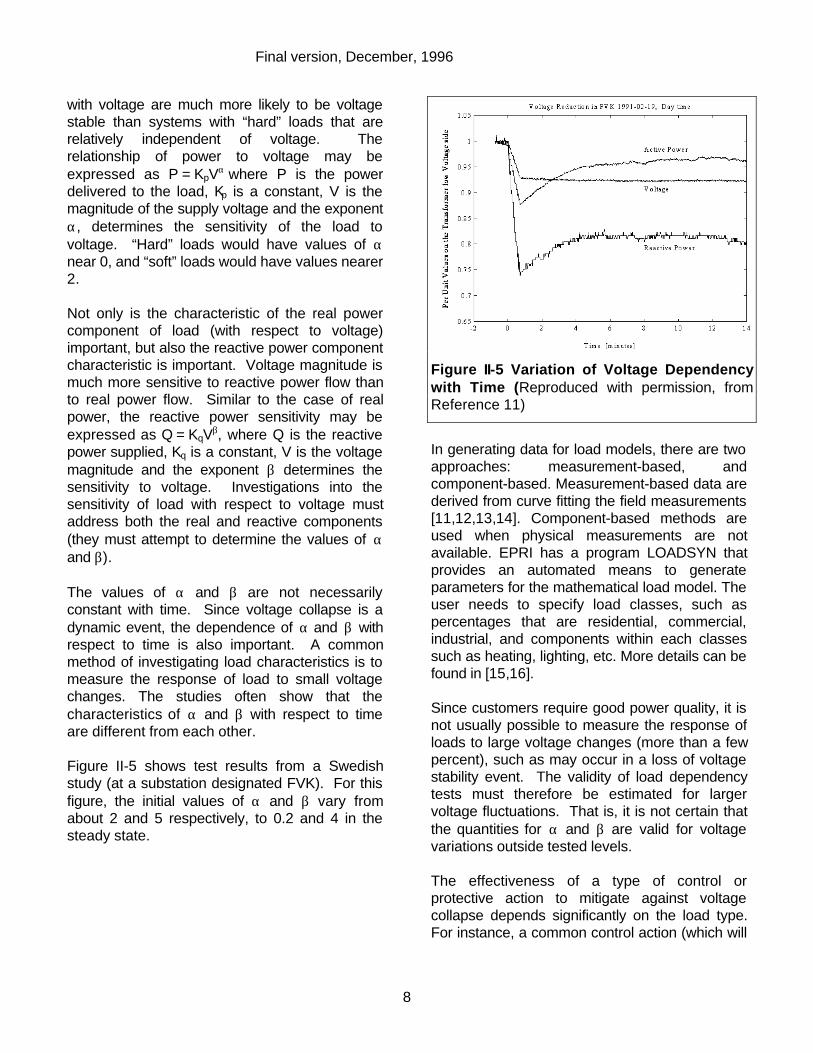
Figure II-5 shows test results from a Swedishstudy (at a substation designated FVK). For thisfigure, the initial values of α and β vary fromabout 2 and 5 respectively, to 0.2 and 4 in thesteady state.
In generating data for load models, there are twoapproaches: measurement-based, andcomponent-based. Measurement-based data arederived from curve fitting the field measurements[11,12,13,14]. Component-based methods areused when physical measurements are notavailable. EPRI has a program LOADSYN thatprovides an automated means to generateparameters for the mathematical load model. Theuser needs to specify load classes, such aspercentages that are residential, commercial,industrial, and components within each classessuch as heating, lighting, etc. More details can befound in [15,16].
Since customers require good power quality, it isnot usually possible to measure the response ofloads to large voltage changes (more than a fewpercent), such as may occur in a loss of voltagestability event. The validity of load dependencytests must therefore be estimated for largervoltage fluctuations. That is, it is not certain thatthe quantities for α and β are valid for voltagevariations outside tested levels.
The effectiveness of a type of control orprotective action to mitigate against voltagecollapse depends significantly on the load type.For instance, a common control action (which will
Figure II-5 Variation of Voltage Dependencywith Time (Reproduced with permission, fromReference 11)
Final version, December, 1996
9
be discussed later in this paper) is voltagereduction by load tap changer blocking or set-point change. Such a control action will be muchless effective for hard loads than soft loads. Theperiod of effectiveness will also depend to a largeextent on the variation of the exponents α and βwith respect to time.
III. Dynamic Sources of ReactivePower
A. Static SourcesAdequate Var support is critical to maintaininghealthy system voltage and avoiding voltagecollapse. Within limits, static reactive sourcessuch as shunt capacitors, can assist in voltagesupport. However, unless they are converted topseudo dynamic sources by being mechanicallyswitched, they are not able to help supportvoltages during emergencies, when morereactive power support is required. In fact, shuntcapacitors suffer a serious drawback of providingless reactive support at the very time that moresupport is needed, during a voltage depression(Var output being proportional to the square ofthe applied voltage).
Capacitors can be switched infrequently at highspeed to provide dynamic voltage support, asdiscussed in Section [IV]. However, the controlschemes can become rather complex, and largeblocks of capacitance must be switched at eachstage in a control scheme. More smoothlycontrolled, and faster reactive support than
mechanically switched capacitors can beprovided by true dynamic sources of reactivepower such as static Var compensators (SVCs),static condensers (STATCONs), synchronouscondensers, and generators.
The application of SVCs and STATCONs in thecontext of voltage stability is discussed in recentliterature[2]. The main differences betweenthese two devices is that the SVC becomes ashunt capacitor when it reaches the limit of itscontrol and all capacitance is fully switched in. Itsreactive power output decreases as the squareof the voltage when the maximum range of controlis reached. The STATCON output is limited byits current carrying capability. Therefore, itsreactive power output decreases linearly with theterminal voltage when the maximum range ofcontrol is reached. Figure III-1 compares theoperating characteristics of the SVC andSTATCON.
In respect to its capability to deliver more reactivepower output than an SVC at lower voltages, theSTATCON behaves more like a synchronouscondenser than an SVC. Short time overloadcapacity of the STATCON is much lower, and ofshorter duration than that of a synchronouscondenser however.
It can be seen from this figure that in the case ofthe SVC, after the voltage drops to a level wheremaximum reactive capability of the equipment isreached, any further decrease in voltage results
Vterminal
Supplying vars Absorbing vars
Current
Controllingrange
Controllingrange
SVC Operating Characteristic
Vterminal
Supplying vars Absorbing vars
Current
STATCON Operating Characteristic
Figure III-1 Comparison of SVC and STATCON operating characteristics
Final version, December, 1996
10
in severe decrease in supplied reactive current.However, the current supplied by the STATCONremains at the maximum value, even in thepresence of continued voltage decline. Theslope of the characteristic in the controlling rangeis caused by deliberate droop in the controlcharacteristic for stability. The SVC will ofcourse be limited by the short time currentcapability of the reactors when the terminalvoltage rises above the controlling range. Inpractice excessively high voltage will not beallowed to persist on the power system for longenough to damage the reactor (or reactorprotection will operate to disconnect the SVC).
SVCs and STATCONS are often operated inconjunction with static sources of reactive powersuch as reactors or capacitors. The SVC orSTATCON control equipment can be designed toswitch the static sources in such a manner as tokeep the dynamic source as close as possible tothe middle of its operating range. By switchingstatic sources in this manner, as much aspossible of the full dynamic capability will beretained. An example of switched capacitorsbeing used to maximize the availability of dynamicpower from a group of synchronous condensersis given in Section IV-A.
Control of SVCs and STATCONs will normally beachieved by use of digital control devices withalmost unlimited flexibility to provide appropriatecontrol of terminal voltage within the capability ofthe primary equipment. Protective devicesapplied to this equipment will of course have tocoordinate with control settings and equipmentcapability. This coordination is normallythoroughly checked at commissioning as therated output of the device is measured as part ofacceptance testing, and at routine maintenanceintervals.
B. Synchronous Machines
1. Capability DiagramA synchronous machine is capable of generatingand supplying reactive power within its capabilitylimits to regulate system voltage. For this reason,it is an extremely valuable part of the solution to
the collapse-mitigation problem. Synchronousmachines considered in this paper may begenerators or synchronous condensers. Interms of reactive output capability, synchronouscondensers are treated similarly to static Varsources during commissioning and maintenancein that rated output power must be demonstratedto be achieved.
Generators however are rated for specific realpower output, usually at a specific power factor.During commissioning and maintenance, realpower output is carefully checked to meetspecified requirements. Reactive power outputmay be checked during commissioning, but maynot be carefully checked after that. The reactivepower capability may be required by the system,but is not considered to be a revenue generator.Due to large impact on the system voltages, itmay be difficult to operate large generators attheir reactive capability limits (for test purposes).Therefore coordination of protection with controldevices is not so frequently checked as withother reactive power sources[17]. Numerousvoltage collapse or near collapse incidents havebeen aggravated by unexpected loss of healthygenerators due to lack of coordination ofprotective equipment with generator capability.
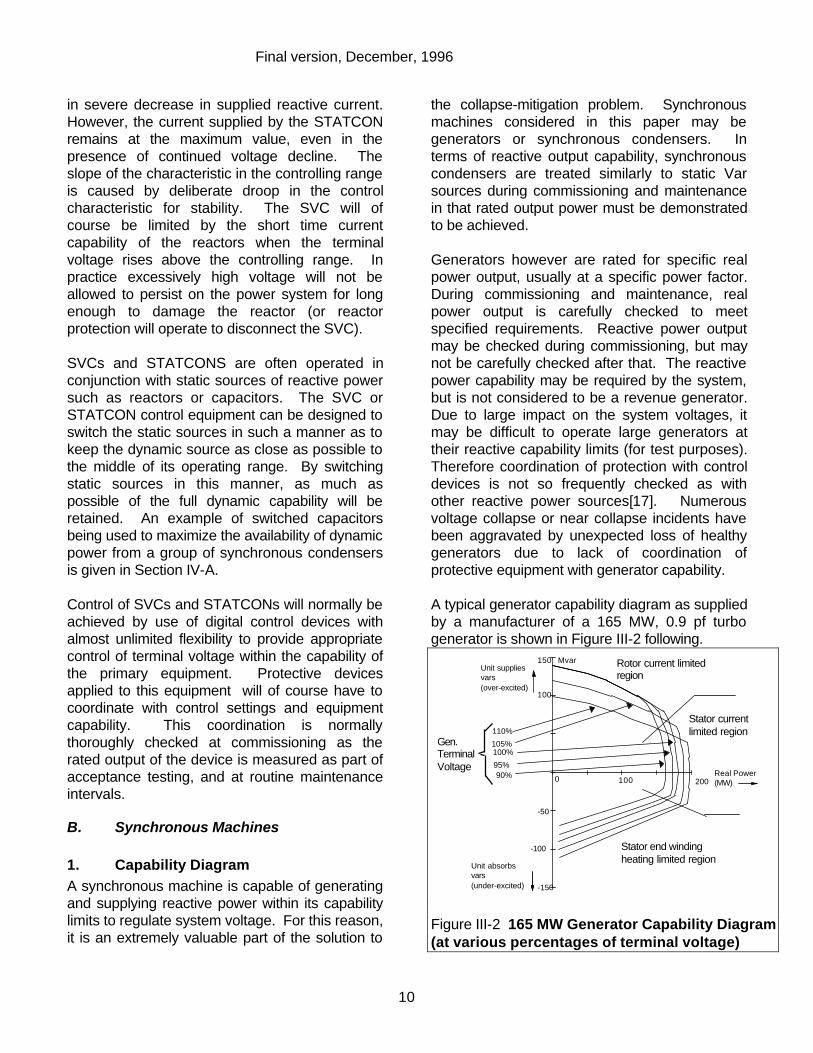
A typical generator capability diagram as suppliedby a manufacturer of a 165 MW, 0.9 pf turbogenerator is shown in Figure III-2 following.
Unit absorbsvars(under-excited)
Unit suppliesvars(over-excited)
0 100 200
-150
-100
-50
100
150
Real Power(MW)
Mvar
90%95%
105%
110%
100%
Stator currentlimited region
Rotor current limitedregion
Stator end windingheating limited region
Gen.TerminalVoltage
Figure III-2 165 MW Generator Capability Diagram(at various percentages of terminal voltage)
Final version, December, 1996
11
Some interesting observations can be made fromFigure III-2. The reactive power capabilityincreases dramatically as real power output islimited. Further, the amount of reactive poweravailable from the generator is very dependent onterminal voltage. In this respect, a generatoroperating at low real power output can supplysignificantly more reactive power at low voltagesthan at high voltages.
The increase in reactive power capability at lowerreal power output means that system plannersand operators may choose to generate less thanrated real power in order to have more reactivepower from generators at critical locations involtage stability threatened systems. The choiceof operating point (Mw versus Mvar) forgenerators at critical locations is predetermined,and not usually subject to automatic control. Itshould be noted that when the generator reachesthe limit of its capability, particularly in the rotorcurrent limited region, it may not be controlling itsterminal voltage. The fact that it is at its limit ofcapability means that it is not able to raise theterminal voltage to the reference setting of thevoltage regulator. Thus the reactive power limitsare to a certain extent, determined by the systemconditions, and independent of the generatorexcitation system.
The value of a generator as a source of reactivepower can be separated from its value as asource of real power, if it can be decoupled fromthe turbine and run as a synchronous condenser.In some plants where fuel or operating costs maymake power generation uneconomic, it may bepossible to convert the generator to asynchronous condenser, and use it to supportvoltages in an area where real power has to beimported from a remote area.
The generator capability diagram as supplied bythe manufacturer is not necessarily the capabilityof a given generator connected at a given point ina system. Many other factors such as auxiliaryequipment voltage limits, stator or transformerwinding voltage limits, cooling medium conditions,or over and under excitation controllers can limita given generator’s capability to significantly lessthan that indicated by the manufacturer’s
diagram. Reference[18] describes in more detailthe various other factors that can limit thegenerator capability.Another significant limiter, which does not alwayscoordinate with the generator capability or controlequipment settings is the generator protection.Rotor overload protection, loss of field protection,and backup protection are all systems that cancause unexpected and undesirable disconnectionof a generator in a voltage stressed system.Later sections in this paper will discuss some ofthose protection aspects in more detail. A majorreason for unexpected operation of protectivedevices is the lack of routine exercising of thegenerator at its capability limits [17].
Excitation power is supplied by one of two typesof exciters, rotating and static. As the termimplies, a rotating exciter is one that mounts onthe machine shaft and rotates with the generatorproducing main field current by induction. Theexciter's field is energized by some independentsource, e.g., a permanent magnet generator(PMG), station battery, etc., controlled by thevoltage regulator. A static exciter is comprised ofa power transformer and power electronicsutilizing generator terminal voltage as the sourceof field power. It would appear that a staticexciter would be limited in its capability likeswitched capacitors or an SVC because it isdependent upon the generator terminal voltagefor power; however, the transformer ratio isselected so that the power electronics can delivera broad range of field current even withdepressed voltage. Generally speaking, staticexciters are quicker in their response to voltagedisturbances than their rotating counterpartsbecause of the latter's additional windings andtheir associated time constants.
2. Effect of Cooling Medium on VarCapability
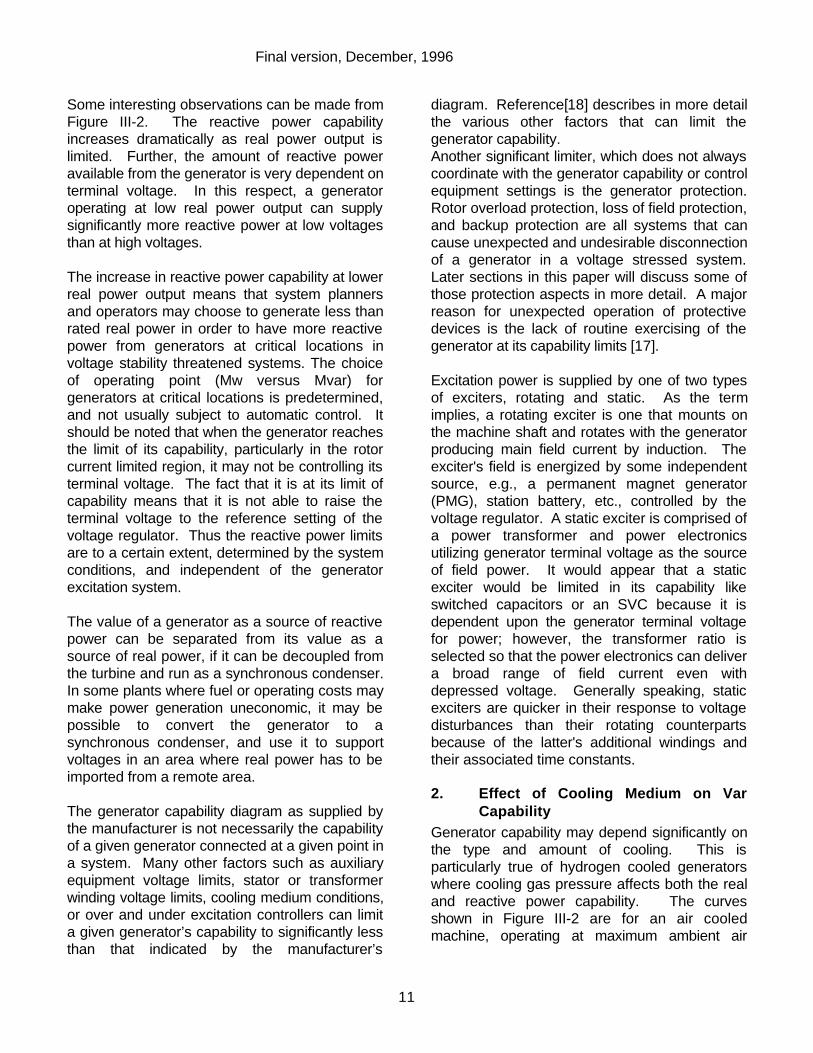
Generator capability may depend significantly onthe type and amount of cooling. This isparticularly true of hydrogen cooled generatorswhere cooling gas pressure affects both the realand reactive power capability. The curvesshown in Figure III-2 are for an air cooledmachine, operating at maximum ambient air
Final version, December, 1996
12
temperature of 40 degrees C. Figure III-3 belowshows the variation in capability of a particular306 MVA hydrogen cooled generator (at 100%terminal voltage). The mechanical power supplycapability is superimposed to show the limitationsof the steam supply system. The way in whichreactive power capability increases withhydrogen pressure is easily seen.
There are some practical issues that warrantserious consideration before increasinghydrogen pressure to increase reactive powersupply capability.
First, it is important to check with the generatormanufacturer to ensure that the capability curvesfurnished with the unit reflect that particular unit'sdesign and are not "generic" for units of that typeand size. Although the generator itself may becapable of the heavier Var duty, the auxiliarysystems supporting the generator and coolingsystem may not be.
Second, higher hydrogen pressure generallymeans increased hydrogen leakage. Dependingupon the integrity of the hydrogen seals, this mayor may not be a problem. However, the risk ofexplosion because of dangerous hydrogenconcentrations increases as leakage increases.The seals, hydrogen pressure regulators, heatexchangers, etc. all need to be able to operate at
the higher pressure. In addition to designdifferences, the age of the unit, maintenancecycles, and relative duty all affect the leakagerate at a given pressure.
Third, it is important that the generator's hot spottemperatures be somehow monitored, eitherdirectly or indirectly. Average temperature, suchas hot gas temperature, average rotor windingtemperature, etc., provide some information, butthese are not hot spot temperatures. Operatingclose to the rated capability curves necessitateshaving this additional information because of thepotential for causing serious damage due to localheating above rated temperature. Section III D b)below discusses some techniques of rotortemperature measurement presently beinginvestigated.
Finally, if a generator has been derated in itsoutput for hydrogen leakage problems, it is likelythat the control and protective devices have beenreset accordingly. Settings of control andprotective devices may have to be suitablyadjusted and tested to ensure coordination witheach other and generator capability before themachine can be depended upon to provideadditional reactive capability.
C. Measurement of Dynamic ReactivePower Reserve
The outputs of dynamic sources of reactivepower such as synchronous condensers andgenerators are sometimes used in voltagecollapse mitigation schemes. As discussedearlier in this paper, when these sources areoperating at, or near, their maximum capability,the risk of voltage collapse is greatest. It maypresent a challenge to the relay engineer tomeasure the output of such sources as apercentage of their maximum capability. Whenmore than one source is involved, it is necessaryto determine that only in-service sources, withautomatic voltage regulation capabilities are usedin the calculation of percentage of dynamicreactive capability.
One scheme described in reference 1 uses theoutput of four strategically located synchronous
0 100 200 300
-200
-100
0
100
200
Real Power (MW)
Unit SuppliesVARS(Over excited)
Unit AbsorbsVARS(under excited)
Mvar 60
4530
H2 Pressure (PSIG)
Rotor Current Limit
Stator Current Limit
Stator end windingheating limit
Mechanical Power Limit
Figure III-3 306 MVA Generator CapabilityDiagram (at various H2 pressures)
Final version, December, 1996
13
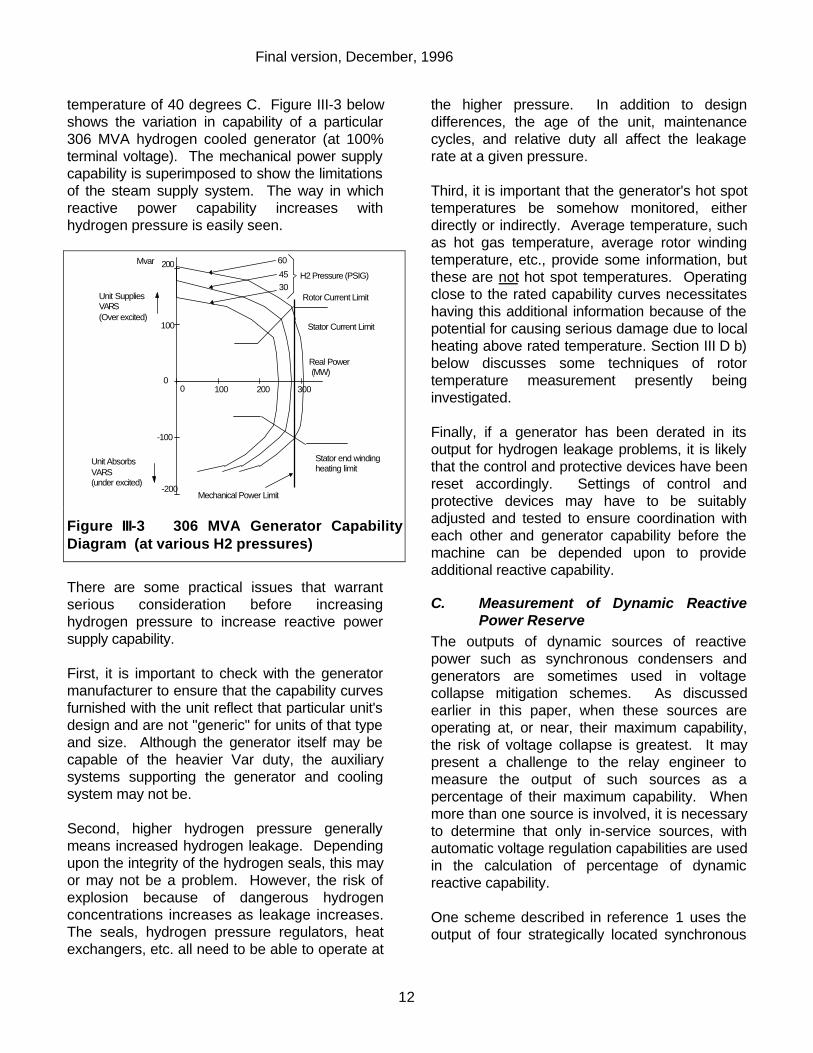
condensers (rated 2x100 Mvar and 2x50 Mvar)in conjunction with low voltages at more than onekey bus to initiate a load shedding scheme. Thesimplified scheme logic diagram is shown inFigure III-4 following. Staged load shedding willbe initiated if the output of the synchronouscondensers at VIT is greater than a certainpercentage of their maximum capability and thevoltage is low at least at two important busses(DMR and either SAT, or VIT) in the region.
Two factors complicate the determination ofpercentage of available capability that is beinggenerated by the synchronous condensers.First, the units have different excitation systemswith different gains, and different speeds ofresponse. They do not necessarily respond totransmission system voltage depressions to thesame degree or in the same time frame as eachother. Secondly, some of the synchronouscondensers may not be in service, or may beoperated in manual excitation mode, and cannotbe considered as dynamic sources of reactivepower during any particular instant. It wasdecided to consider only the output of in-serviceunits, with automatic voltage regulators in service,and to use the average output of those unitsexpressed as a percentage of the maximumcapability of all units being considered.
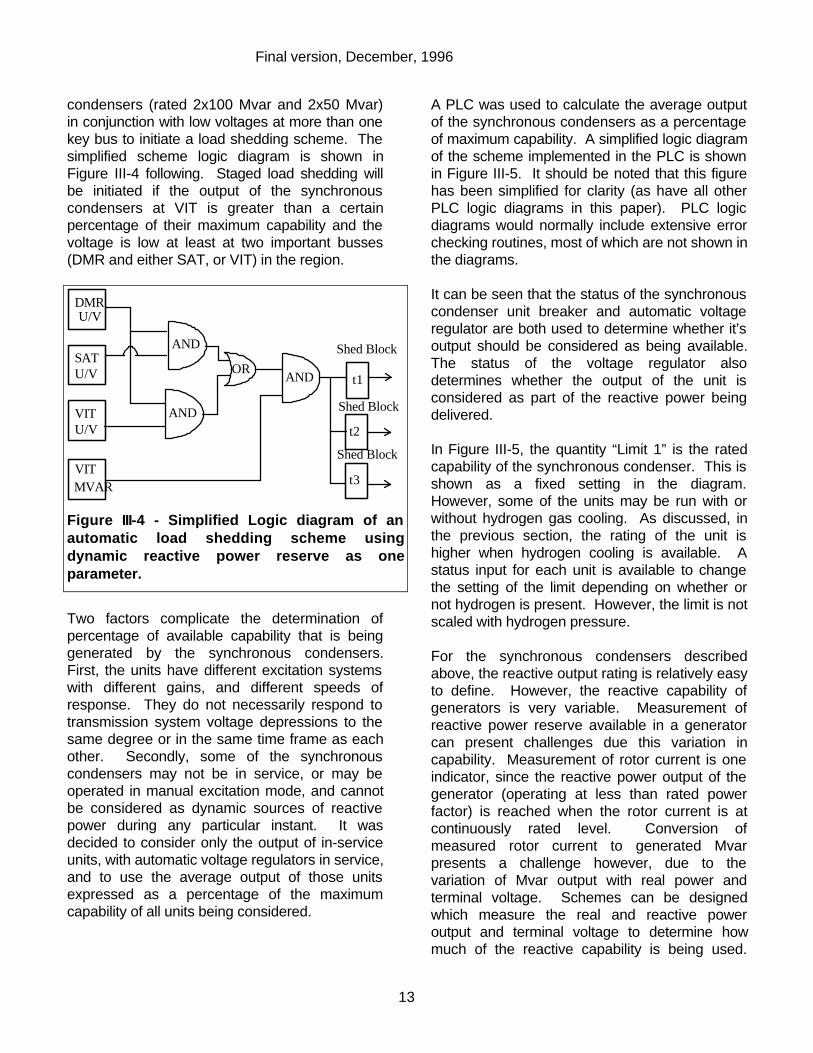
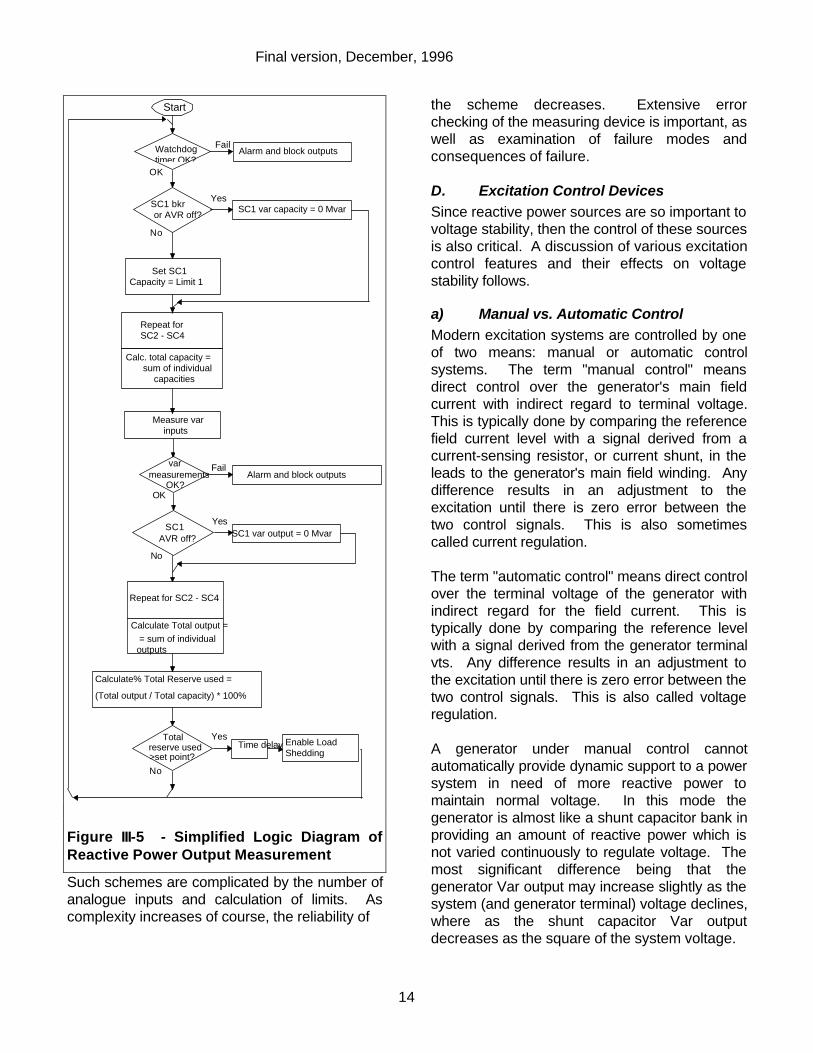
A PLC was used to calculate the average outputof the synchronous condensers as a percentageof maximum capability. A simplified logic diagramof the scheme implemented in the PLC is shownin Figure III-5. It should be noted that this figurehas been simplified for clarity (as have all otherPLC logic diagrams in this paper). PLC logicdiagrams would normally include extensive errorchecking routines, most of which are not shown inthe diagrams.
It can be seen that the status of the synchronouscondenser unit breaker and automatic voltageregulator are both used to determine whether it’soutput should be considered as being available.The status of the voltage regulator alsodetermines whether the output of the unit isconsidered as part of the reactive power beingdelivered.
In Figure III-5, the quantity “Limit 1” is the ratedcapability of the synchronous condenser. This isshown as a fixed setting in the diagram.However, some of the units may be run with orwithout hydrogen gas cooling. As discussed, inthe previous section, the rating of the unit ishigher when hydrogen cooling is available. Astatus input for each unit is available to changethe setting of the limit depending on whether ornot hydrogen is present. However, the limit is notscaled with hydrogen pressure.
For the synchronous condensers describedabove, the reactive output rating is relatively easyto define. However, the reactive capability ofgenerators is very variable. Measurement ofreactive power reserve available in a generatorcan present challenges due this variation incapability. Measurement of rotor current is oneindicator, since the reactive power output of thegenerator (operating at less than rated powerfactor) is reached when the rotor current is atcontinuously rated level. Conversion ofmeasured rotor current to generated Mvarpresents a challenge however, due to thevariation of Mvar output with real power andterminal voltage. Schemes can be designedwhich measure the real and reactive poweroutput and terminal voltage to determine howmuch of the reactive capability is being used.
ORAND
AND
AND
VIT
U/V
SATU/V
VITU/V
DMR
VITMVAR
t1
t2
t3
Shed Block 1
Shed Block 2
Shed Block 3
Figure III-4 - Simplified Logic diagram of anautomatic load shedding scheme usingdynamic reactive power reserve as oneparameter.
Final version, December, 1996
14
Such schemes are complicated by the number ofanalogue inputs and calculation of limits. Ascomplexity increases of course, the reliability of
the scheme decreases. Extensive errorchecking of the measuring device is important, aswell as examination of failure modes andconsequences of failure.
D. Excitation Control DevicesSince reactive power sources are so important tovoltage stability, then the control of these sourcesis also critical. A discussion of various excitationcontrol features and their effects on voltagestability follows.
a) Manual vs. Automatic ControlModern excitation systems are controlled by oneof two means: manual or automatic controlsystems. The term "manual control" meansdirect control over the generator's main fieldcurrent with indirect regard to terminal voltage.This is typically done by comparing the referencefield current level with a signal derived from acurrent-sensing resistor, or current shunt, in theleads to the generator's main field winding. Anydifference results in an adjustment to theexcitation until there is zero error between thetwo control signals. This is also sometimescalled current regulation.
The term "automatic control" means direct controlover the terminal voltage of the generator withindirect regard for the field current. This istypically done by comparing the reference levelwith a signal derived from the generator terminalvts. Any difference results in an adjustment tothe excitation until there is zero error between thetwo control signals. This is also called voltageregulation.
A generator under manual control cannotautomatically provide dynamic support to a powersystem in need of more reactive power tomaintain normal voltage. In this mode thegenerator is almost like a shunt capacitor bank inproviding an amount of reactive power which isnot varied continuously to regulate voltage. Themost significant difference being that thegenerator Var output may increase slightly as thesystem (and generator terminal) voltage declines,where as the shunt capacitor Var outputdecreases as the square of the system voltage.
Start
Set SC1Capacity = Limit 1
Repeat forSC2 - SC4
Calc. total capacity =sum of individual
capacities
Alarm and block outputsFailWatchdog
timer OK?OK
SC1 bkror AVR off?
No
SC1 var capacity = 0 MvarYes
Measure varinputs
Alarm and block outputsFailvar
measurementsOK?
OK
Repeat for SC2 - SC4
Calculate Total output = = sum of individualoutputs
SC1AVR off?
No
SC1 var output = 0 MvarYes
Calculate% Total Reserve used =
(Total output / Total capacity) * 100%
Totalreserve used>set point?
No
Time delayYes
Enable LoadShedding
Figure III-5 - Simplified Logic Diagram ofReactive Power Output Measurement
Final version, December, 1996
15
As for auxiliary control devices and regulators,there are typically only three active in manualmode: the minimum and maximum field currentlimiters and a ceiling voltage limiter. The ceilingvoltage limiter acts to limit the field current to alevel that corresponds to a safe terminal voltagelevel in the event of a sudden load rejection (thisfield current level is typically much less than themaximum field current limit).
In the automatic, or voltage control, mode,minimum and maximum voltage limits are activeand are analogous to the minimum and maximumcurrent limits in current control mode. In addition,there are typically an overexcitation limiter (V/Hzlimiter), a minimum excitation limiter (MEL) orunder excited reactive ampere limiter (URAL),reactive droop control, reactive dropcompensation (also called line drop or loadcompensation or LDC), Var limiter/regulator,power factor limiter/regulator, and a powersystem stabilizer.
b) Overexcitation LimiterAn overexcitation limiter can take two forms: 1) adevice that limits the thermal duty of the rotor fieldcircuit on a continuous current basis and 2) adevice that limits the effects of stator ortransformer core iron saturation due toexcessive generator terminal voltage,underfrequency, or the combination of both.
The overexcitation limiter protecting the rotorfrom thermal overload is an important controller insystem voltage stability. It usually is disabled inthe transient time frame to allow the excitationsystem to force several times the rated voltageacross the rotor winding and more than ratedcontinuous current, to help retain transientstability. After a few seconds, the limiter isactivated in an inverse time function - the higherthe rotor current, the sooner the limiter isactivated. The limiter brings the continuous rotorcurrent down to, or just below, rated level toensure the rotor is not overheated by excessivecurrent. The limiter acts without regard as towhat the actual rotor temperature is. Even if therotor was very cool before the overexcitation
event, the time characteristic of the limiter is notchanged.
Several techniques are available to measure therotor temperature, including:• Calculation of average winding temperature
by measuring the resistance (slip ring voltagedivided by rotor current) This techniquerequires special (low current) brushes tomeasure the rotor voltage without beingaffected by voltage drop across the brushes.As discussed earlier however, the averagerotor temperature is not necessarily a goodindicator of hot spot temperature. Thus useof the average temperature as a controldevice is limited.
• Measurement of winding temperature at
selected locations by resistance temperaturedetectors or thermocouples. This techniquerequires a means of getting the measuredvalue off the rotating equipment to monitoringequipment. Special sliprings and brushes, orradio transmission may be used for thispurpose. If the locations of temperatureprobes are carefully selected, it may bepossible to get a better indication of hot spottemperatures than can be determined fromaverage temperatures. However, closecollaboration with the generator manufactureris required to ensure hottest locations areselected. It is also not usually economic toretrofit temperature probes to existingmachines. Therefore use of such probeswould probably be limited to new machines.
• On salient pole generators where large
portions of the rotor windings are exposed, itis possible to measure the temperature of theends of the windings by infrared scannersmounted on the stator. These measurementswill however give average temperatures ofportions of the winding, and similar concernsover lack of knowledge of hot spottemperatures as for the winding resistancemeasurement arise. The technique doeshowever allow temperatures of individualpoles to be monitored.
Final version, December, 1996
16
Rotor temperature measurement is not yetsufficiently reliable for widespread use inoverexcitation control systems. Reference [2]describes one application. It is possible that asmeasurement techniques mature, supplementarytemperature control may be feasible to extractmore reactive power from a given generator.However, concerns over operating at the limits ofa generator capability (as mentioned in sub-section B.2 above) must always be weighedagainst possible marginal increases in reactivecapability. It is likely that temperature monitoringwill find its optimum application in short termoverload capability.
The V/Hz limiter is a device that protects thegenerator stator and directly connectedtransformers (main power transformer and unitauxiliary transformer) from excessive flux levels(with the high flux levels being indicated by highratio of volts to Hertz). When the windings of agenerator or transformer are exposed to such acondition, the core iron saturates and magneticflux escapes from the intended magnetic path topenetrate the surrounding structural steel whereinduced currents can cause excessive I2Rheating which may result in failure of thegenerator or transformer. The V/Hz limiterensures that dangerously high levels of excitationdo not persist. For instance, it may be requiredto operate to limit generator terminal voltage to asafe level under conditions of depressedtransmission system voltage when the generatoris producing a large amount of reactive power.The probability of overexcitation is more likelywhen load compensation is being applied, as theautomatic voltage regulator is not regulatingterminal voltage under this condition.Coordination of this control device with the V/Hzprotective relay (if installed) is necessary to avoidunit trips for conditions that the limiter will safelyrespond to.
c) Minimum Excitation LimiterThe MEL, or URAL, reduces the probability of agenerator losing synchronism with the powersystem due to too-low a level of excitation. It isalso intended to prevent generator core end irondamage due to stator field fringing resulting from
too-low a level of excitation. The MEL needs tobe carefully set, coordinating with the generator'sreactive capability curve, the system's steadystate stability limit, and the generator's loss offield relay. This control function is most importantunder conditions of high system voltage, when thegenerator is operating at low excitation levels toabsorb the maximum amount of reactive power.
Since the MEL is only functional when the voltagebeing regulated is higher than the referencesetting, it may not be a critical function during avoltage collapse scenario. However, whenvoltage stability is lost, it is possible for systemvoltage to rise above acceptable levels. Such acircumstance might happen if too much load isdisconnected during a voltage depression, or toomuch capacitance is added to try to boost systemvoltage. In such cases, proper operation of theMEL, and its coordination with the loss ofexcitation protection may be critical in restoringvoltage stability.
d) Reactive Droop Control and LoadCompensation (LDC)
These are addressed together here becausethey are closely related, but have oppositeeffects. A control voltage that is proportional tothe reactive power generated by the machine isapplied to the sensed terminal voltage beingsupplied to the voltage regulator. With reactivedroop control, this control voltage is added to thesensed terminal voltage causing the regulator tosense too high a feedback voltage, resulting in adecrease in excitation. With load compensation,this control voltage is subtracted from the sensedterminal voltage causing the regulator to sensetoo low a feedback voltage, resulting in anincrease in excitation.
With reactive droop control, the end result is asharing of the voltage regulation of a bus to whichmultiple generators are connected in parallel.Without droop, the voltage regulators would beunstable as more than one regulator wouldattempt to control the same voltage. Themachines would just circulate large quantities ofVars, and voltage regulation would be poor.Droop is critical for generators bussed together,
Final version, December, 1996
17
but it needs to be set carefully so that adequatevoltage levels are maintained. That is, too muchdroop will result in voltage levels unacceptablybelow nominal.
With load compensation, the end result is betterregulation of a point in the system somewhatremote from the terminals of the machine.Without load compensation, the controlled point isthe point where the terminal voltage is sensed -the point where the generator vts tap into theisolated phase bus. Load compensation movesthe controlled point out closer to the main powertransformer's high voltage terminals bycompensating for a portion of the voltage dropthat occurs across the transformer due to theloading of the generator. This must be setcarefully to avoid wide reactive power swings onthe machine that occur if it attempts to controlvoltage at a point too far away in the system,electrically speaking.
A plant with more than one generator can bemade to control the voltage on the transmissionsystem some distance from the plant by the useof joint Var control (JVC) equipment. JVC allowsseveral generators to control the voltage at asingle point without reactive power swings whichwould result from independent voltage controlaction on each of the generators. Thisequipment ensures that all generators take anequal share of reactive power as they attempt tocontrol the voltage at a common point.
Compensation for at least part of the reactivedrop in a generator step up transformer is oneway of allowing generators to more directlycontrol system voltage. In addition to the stabilityconcerns, the voltage at the generator terminalsmust also be controlled to within acceptable limits.Given the wide variation in generator reactivepower capability, it may be necessary to dependon other controllers such as the volts/Hz limiter orMEL for additional control.
e) Var Limiter/RegulatorThe Var limiter acts to limit the Var loading of agenerator if the output reaches its threshold.Otherwise, the regulator is free to adjust
excitation as necessary to control voltage withoutregard to Var swings.
The Var regulator is different from the limiter.This control feature, rather than controlling thevoltage to a set point, controls the Var output ofthe machine to a set point. Var regulation is well-suited to a system that has a steady, baseloadneed for Var support.
Both of these devices have application withsmaller machines ("small" relative to theconnected system) because of their inability tosignificantly alter the transmission bus voltage,regardless of their Var loading. However, itshould be recognized that when these limiters arein operation, the generator will not act to helpsupport system voltage during emergencies.
f) Power Factor Limiter/RegulatorThe power factor limiter acts to keep the powerfactor of a given machine within specified limitswhile on voltage control. This device is especiallyuseful in situations where economic penalties areimposed for operating with a power factor outsideof a published acceptable range.
The power factor regulator, like the Var regulator,controls to a specific power factor without regardfor the voltage. This can be troublesome for thebus voltage as the excitation will vary, and hencethe voltage will vary, with changes in generatorwatt loading. Again, this is more typically usedwith smaller generators or with large synchronousmotors seeking to operate at or near unity powerfactor (for economic or other reasons).
The increasing penetration of non utilitygenerators in power systems results inincreasing effect of their excitation controlsystems on power system voltage stability. Careis required to ensure their reactive powercapability is not incorrectly assumed to bedynamic, when in fact they may be operatingunder a power factor controller or Var limiter thatrestricts their reactive output to much less thanthe units are capable of producing.
Final version, December, 1996
18
g) Power System StabilizerReference [19] quotes - “Modern generatingunits equipped with high gain voltage regulatorsenhance transient stability (the ability to recoverfrom large disturbances), but tend to detract fromsteady-state stability (the ability to recover fromsmall disturbances about the steady-stateoperating condition). Power System Stabilizers(PSS) improve steady-state stability by providingdamping of power system modes of oscillation viamodulation of generator excitation." Sodescribed, the PSS is a device that reduces low-frequency oscillations of a generator rotor(typically in the range of 0.1 to 2.5 Hz).Regardless of how it measures the speedchanges (electrical frequency or mechanicalspeed), the PSS is tuned to output a controlvoltage that is in phase with the speed changesthat acts to increase excitation if the speedchange is in the positive (speed-increasing)direction and decrease excitation if the speedchange is in the negative (speed-decreasing)direction. The increased excitation tightens therotor's coupling with the power system, providinga retarding torque that tends to slow the rotor,bringing it back to nominal speed. Decreasedexcitation loosens the rotor's coupling with thepower system, providing an accelerating torquethat tends to let the rotor accelerate back up tonominal speed. The purpose of the PSS is tominimize generator "hunting" and the attendantlow frequency power surges, thereby stabilizingsystem voltage and enhancing system stability.As larger machines have far greater impact onthe system and on each other in this regard,PSS's are most effective on such largemachines. PSS’s are presently being fitted onmany existing larger machines, and most newmachines which can significantly impact lowfrequency oscillations.
PSS's must be correctly set with regard to theirgain and phase lead parameters to avoidexacerbating the oscillation problem. There areno protective elements that the PSS mustcoordinate with.
E. Protection Issues
1. Generator Protection RelaysIt is important that generator and auxiliaryprotection relays coordinate with excitationcontrol functions. Lack of such coordination hasoften been a factor in voltage collapse or nearcollapse situations. Some critical protectiverelays are loss-of-field, volts/Hz, rotor overload,excitation system overload, and auxiliaryundervoltage protection.
The loss-of-field relay must coordinate with theMEL on a dynamic basis as well as on a steadystate basis. The time delay in which an MEL canact to limit under excitation may not be stated inexciter application guides. Under transientconditions it is possible for the operating point ofa generator to suddenly enter a region beyondthe MEL or loss of field protectioncharacteristics. If the time delay of the loss offield relay is too short, or the MEL takes too longto operate, miscoordination and unnecessaryloss of the generator can occur. The lack ofcoordination can easily be missed if the excitergain or feedback settings are adjusted aftercommissioning without subsequent check of thespeed of operation of the control function.Regular exercising of the generator to its MELcontrol point will help minimize the risk ofmiscoordination.
Rotor and exciter overload protections mustcoordinate with maximum excitation limiters,again on a dynamic basis as well as on a steadystate basis. Since overload protection timedelays are often somewhat longer than loss-of-field protection delays, the speed of response ofthe maximum excitation control is not of as greata cause of concern as that of the MEL.However, the possibility for miscoordination is stillpresent. Exciter overcurrent protection settingsmay be applied with more concern about shortcircuit sensitivity than with rotor overloadcapability. Further, if such protection is providedby electromechanical relays, their accuracyaround the pickup current level may not be asgood as the accuracy of the overexcitationlimiter. Exercising of the generator at its
Final version, December, 1996
19
maximum excitation limit is the best way toensure coordination is maintained.
Dynamic coordination of the volts/Hz protectionwith the volts/Hz controller is relatively easilyachieved, because their time/flux characteristicsare both well defined. A point of concern canarise when the volts/Hz protection is provided byone or two definite time relays set at specificlevels of volts/Hz. It may be difficult to coordinatethe definite time characteristics with inverse timecharacteristics of the control device. It is ofcourse also important to coordinate the volts/Hzprotection with the maximum voltage regulatorcontrol voltage. The maximum voltage regulatorsetting may be very close to the maximum ratedcontinuous operating voltage, leaving little roomfor the volts/Hz protection pick up point to fitbetween the two limits.
Auxiliary equipment may be protected byundervoltage relays to ensure the generator isshut down safely before any essential auxiliaryequipment stalls or becomes disconnected due tolow voltage. It is possible that low terminalvoltage could impose a limit in the underexcitedregion that the MEL must coordinate with. Sincethe undervoltage protection would normally havea significant time delay, dynamic coordinationwith the MEL may not be as much of a concernas static coordination.
In spite of the difficulties in operating generatorsat reactive power limits, regular testing of thecoordination of protection and control devices atthose limits remains the best way of ensuringimportant reactive power reserves are availablewhen required during system emergencies.Reference [17] gives further details on benefitsand difficulties of testing generators at reactivepower limits.
2. System Backup RelaysSystem backup relays are generally of threetypes: phase distance, phase overcurrent, andground overcurrent. Of these, the groundovercurrent is not affected by excitation levels,so it will not be addressed here. The phase
distance and phase overcurrent relays, however,can be affected by excitation.
In the case of the phase distance relay,depending upon its reach, the combination of lowsystem voltage (due to a collapse) and high load(due to high Var output in response to thecollapsing voltage) could be interpreted as a lowmagnitude three phase fault resulting in anundesirable trip. This is a problem especially ifthe generator is connected to a stiff systembecause of the generator's relative inability tocontrol the system voltage regardless of itsexcitation level.
In the case of the phase overcurrent relays, theyare typically set with a pickup below rated load,relying on healthy voltage as a restraint. With thesame scenario as in the case above, if thevoltage falls below the set-point, the relay couldoperate on load, again causing an undesirabletrip. As with the distance relay, this is more likelyto occur when the generator is connected to astiff system.
It should be noted that undesirable trips couldoccur under low excitation conditions, as well,because low excitation translates to low terminalvoltage, especially when the generator isconnected to a weak system. However, thecombination of low voltage due tounderexcitation, and heavy load is unlikely, so thisis seldom a problem.
The probability of undesirable trips of backupprotection systems is reduced by detailedapplication studies when applying such protectionand when calculating settings. Systemsimulations for multiple or low probabilitycontingencies may be required to ensure thebackup devices are secure under suchconditions. If time delays of backup relays areshort, dynamic system simulations may berequired as well as static simulations.
If reliable backup transmission protection existsat the switching substation, backup phasedistance relays may not be needed.Consideration could be given to either removingsuch relays, or reducing their reach such that
Final version, December, 1996
20
undesirable trippings under low voltage conditionsare highly unlikely.
IV. Switched Capacitance
Switched capacitance is a method of providingreactive power support to maintain voltages withintolerable limits. It is applied in different timeframes. Switching must be automatic to beeffective in the transient time frames described inFigure II-4 but may be manual or automatic forslower collapses. An important factor in theapplication of switched capacitors is that thevoltage does not rise above tolerable limits in thepost disturbance state.
A. Long-term Time Frame.Manual switching, or conventional voltage controldevices are often adequate for switchingcapacitors in the longer time frame. Capacitorsare considered to be static reactive powersources when applied for long term voltagecontrol. Static capacitors may be switchedseasonally, weekly, or daily for this type ofapplication, where the switching devices may becircuit breakers or circuit switchers. The designof the capacitor installation must consider thepossible speed and frequency of switching, aswell as the voltage support requirements. Veryfrequent switching would put a significant amountof wear on the switching device.
When the time frame of the voltage stabilityphenomena approaches the transient region,automatic switching is almost always required.Capacitors are often switched by voltage relayswith time delays. To achieve the higher switchingspeed, additional controls may be required toprevent excessive switching and wear on theswitching device. The voltage relays used forswitching may not be the conventional voltagecontrol relays. They may need higher accuracy,or different techniques, similar to those used forundervoltage load shedding. For instance, therequirement for switching may need the threephase voltages to be inside a certain window, orthe requirement may be controlled by the statusof other dynamic reactive power sources such as
nearby synchronous condensers, or static Varcompensators.
BC Hydro uses a PLC to coordinate themeasurement of the output of synchronouscondensers (rated 2x100 Mvar and 2x50 Mvar)and the switching of 2x50 Mvar capacitor banks.Figure IV-1 shows the simplified logic diagram ofthe PLC used to control the capacitors.
The capacitor banks are switched if the totaloutput exceeds 60% of the rating of units inservice with automatic voltage regulators. ThePLC is used to calculate the output from all units.If the output is high, and system voltage is not toohigh, one capacitor bank will be switched on. Ifthe output is very high, and the voltage is not toohigh, both capacitors will be switched on. Thesame device automatically switches thecapacitors off if the output of the synchronouscondensers goes low, and if the system voltageis not also low. By this means, the utility cancontrol the system such that the synchronouscondenser is available for dynamic supply ofreactive power by keeping the condenser outputlow under normal steady state conditions.
This is an example of using relatively slow speedswitching of a capacitor to increase reactivereserve earlier than required for an emergencysituation. Early switching of static sourcesmeans more dynamic power is available for quicksupport during emergencies.
To minimize wear and tear on the switchingequipment, the automatic control is sometimesunidirectional. The reactive equipment isautomatically switched on or off, to quicklyregulate the voltage excursion, and operatorcontrol is used to restore normal conditions whenthe disturbance is over. This is a majordifference between special schemes and normalvoltage control devices which switch reactiveequipment after very long time delays.
Final version, December, 1996
21
B. Transient Time FrameThe complexity and sophistication of the controldevice usually increases as the time frame ofswitching approaches transient levels. Sincevoltage control is the objective, voltage sensingdevices are the prime tools used. However,additional supervisory devices are required to
prevent unnecessary switching. Some controlschemes are described below, as examples ofschemes used for capacitor switching in thetransient time frame.
WatchdogOK?
Start
CX1 off? Switch CX1 on
Alarm and block outputs
Fail
Mvar>20 &V<141kV?
Yes
No No
Time Delay
Measure varinputs
Measured varsOK?
Measure voltInputs
Find validvoltage
Fail
Fail
Yes
CX2 off? Switch CX2 on
No
Yes
CX1 on? Switch CX1 offMva<-45 &V>135kV?
Yes
No No
Time DelayYes
CX2 on? Switch CX2 off
No
Yes
CX1 off? Switch CX1 onMvar>70 &V<141kV?
Yes
No No
Time DelayYes
CX2 off? Switch CX2 on
No
Yes
CX1 on? Switch CX1 offMvar<-95 &V>135kV?
Yes
No No
Time DelayYes
CX2 on? Switch CX2 off
No
Yes
Figure IV-1 Logic Diagram for medium speed PLC capacitor controldevice.
Final version, December, 1996
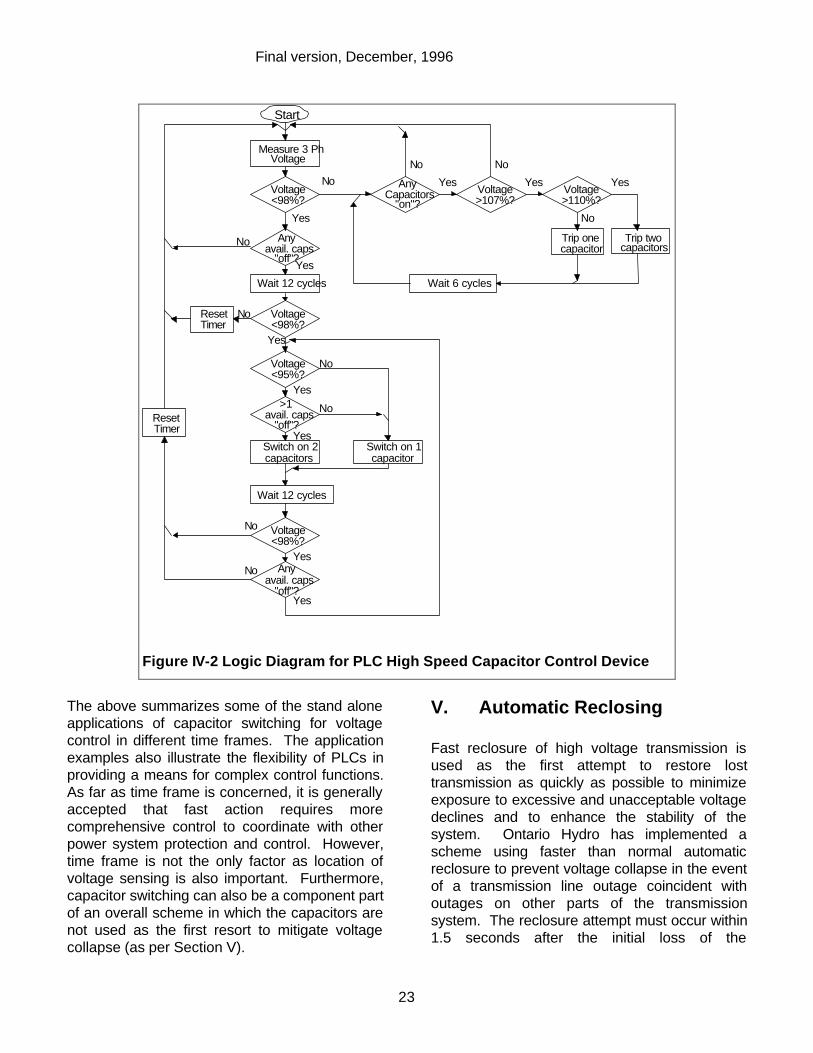
22
1. Capacitor Switching in 0.75 SecondsReference [5] describes an undervoltagecapacitor switching scheme installed by one utilitywhich operates in conjunction with a loadshedding scheme to avoid the possibility ofvoltage collapse. This scheme is intended toinsert a capacitor bank if the voltage drops due toloss of a major system tie transformer.
The bank is connected in 0.75 seconds in anattempt to restore voltages before load has to beshed. The 0.75 second delay is long enough tooverride voltage depressions due to multi-phasefaults on the 161 kV subtransmission systemwhich are normally cleared in less than 0.5seconds. However the time delay is not longenough to override voltage depressions due tosingle line to ground faults on the 161 kV systemor any type of fault on the 46 kV or 13 kVdistribution systems.
Supervision elements are used to block capacitorswitching for faults which might be cleared inlonger than 0.75 seconds. A zero sequenceovervoltage detector is used as a supervisionelement for 161 kV ground faults, andovercurrent fault detectors are used similarly, toblock the switching scheme if the voltage isdepressed due to a distribution system multi-phase or single line to ground fault. All measuringand logic functions are accomplished withdiscrete electromechanical relays in this scheme.
2. Capacitor Switching in 0.2 SecondsOne utility uses fast capacitor switching tomaintain voltages on two 230 kV tie lines whichare overlaid by a 500 kV line. If the 500 kV linetrips out during high load conditions, there is adanger that low voltages on the underlying 230 kVlines will result in loss of angular stability and/ortripping by the line protection systems. Groups ofcapacitors are located at different substations foreach of the two 230 kV lines. One substation has12x40 Mvar capacitor banks, and the other has6x30 Mvar banks. The capacitor banks areswitched by circuit breakers. Switching must beaccomplished very quickly, but not within normal230 kV multiphase fault clearing times (less than12 cycles). Switching is not initiated unless all
three phase voltages are below the threshold.This reduces the probability of switching forunbalanced faults such as resistive single line toground faults which might be cleared in longerthan 12 cycles. A programmable logic controller(PLC) was selected to perform the measuringand logical functions as shown in Figure IV-2following.
3. Capacitor Switching in 0.15 SecondsMechanically switched capacitors can sometimesbe applied for very fast voltage support. In suchcases, the control scheme increases incomplexity. For instance, in some cases whereDC transmission is an important source ofpower, adequate reactive power is required tosupport voltages at the receiving terminal aftertransient voltage depressions due to abnormallycleared faults.
In one case, a very fast capacitor switchingscheme is applied to support the voltage at areceiving terminal if the 345 kV (ac) systemsuffers a fault with associated failure of a singlepole of the clearing breaker (with three phasebreaker failure not being considered a crediblecontingency). In this case switching of thecapacitor bank is required if the fault is notcleared within 9 cycles. Since the probablesituation is a single line to ground fault, thecapacitors must be switched for unbalancedvoltages. In this case, a directional negativesequence overcurrent relay looking away fromthe 345 kV system is used to block switching ifthe unbalanced fault is not on that system.Switching is also initiated for three phase faultsanywhere on the system (if clearing is notachieved within 14 cycles.
Final version, December, 1996
23
The above summarizes some of the stand aloneapplications of capacitor switching for voltagecontrol in different time frames. The applicationexamples also illustrate the flexibility of PLCs inproviding a means for complex control functions.As far as time frame is concerned, it is generallyaccepted that fast action requires morecomprehensive control to coordinate with otherpower system protection and control. However,time frame is not the only factor as location ofvoltage sensing is also important. Furthermore,capacitor switching can also be a component partof an overall scheme in which the capacitors arenot used as the first resort to mitigate voltagecollapse (as per Section V).
V. Automatic Reclosing
Fast reclosure of high voltage transmission isused as the first attempt to restore losttransmission as quickly as possible to minimizeexposure to excessive and unacceptable voltagedeclines and to enhance the stability of thesystem. Ontario Hydro has implemented ascheme using faster than normal automaticreclosure to prevent voltage collapse in the eventof a transmission line outage coincident withoutages on other parts of the transmissionsystem. The reclosure attempt must occur within1.5 seconds after the initial loss of the
Voltage<98%?
Anyavail. caps
"off"?
Voltage<98%?
Measure 3 PhVoltage
Start
Yes
AnyCapacitors
"on"?Voltage>107%?
Voltage>110%?
Trip twocapacitors
Trip onecapacitor
Wait 6 cycles
Yes YesYes
No
NoNo
Wait 12 cycles
Voltage<95%?
Yes
Yes
No
ResetTimer
No
>1avail. caps
"off"?
Yes
Switch on 2capacitors
Switch on 1capacitor
Yes
No
No
Wait 12 cycles
Voltage<98%?
Anyavail. caps
"off"?Yes
Yes
No
No
ResetTimer
No
Figure IV-2 Logic Diagram for PLC High Speed Capacitor Control Device
Final version, December, 1996
24
transmission line. This time frame is dictated bythe effectiveness of subsequent load sheddingshould the reclosure not be successful. Areclosure time of 1.175 seconds can beachieved with the slowest breakers in the region(closing time 0.225 s). The total reclosure timeincludes 0.5 s dead time before reclosing theenergizing breaker (lead terminal) and 0.1 s delayfor closing the follow terminal on restoration ofpotential from the lead terminal.
If reclosure is unsuccessful, and the load is high,load shedding is required to ensure anacceptable voltage profile. Load shedding mustbe initiated as soon as possible afterunsuccessful reclose attempt if the voltage islower than 85% of normal levels. A total of 504MW distributed at nine different stations isavailable for shedding. Each block of load can bearmed by operator action and will be tripped whenthe local station voltage drops below a presetvalue for a preset time period. The scheme isbased on monitoring the transmission voltagewith undervoltage relays on either side of themain or backup potential sources (automatictransfer for loss of the main source). Theundervoltage relays are duplicated, and bothrelays, set to 85% of the normal operatingvoltage, must operate to shed load. The load isshed if the undervoltage condition persists formore than 1.5 seconds. Load shedding isblocked if both the main and alternate sourcesare lost (as detected by another undervoltagerelay).
A total of 36 capacitor banks (both transmissionand distribution banks) in 17 transformer stationsin the region are equipped with automaticswitching features that are voltage and timedependent. The capacitors maintain the voltagelevels at or above the minimum acceptable levelof about 90% of nominal. A predeterminedsequence of capacitor switching can occur up to8 seconds after the initial loss of transmission.The effect of capacitor switching following loadshedding is that of fine tuning the voltage levels towithin the normal band.
VI. Load Shedding
Load shedding is an option that is becoming morewidely used as a final means of avoiding systemwide voltage collapse. This option is onlyconsidered when all other effective means ofavoiding collapse are exhausted. This optionmay be the only effective option for variouscontingencies especially if the collapse is in thetransient time frame, and if load characteristicsresult in no effective load relief by transformerload tap changer control. Load shedding resultsin high costs to electricity suppliers andconsumers, therefore, power systems should bedesigned to require such actions only under veryrare circumstances. Load may be shed eithermanually or automatically depending on the rateof voltage drop.
A. Manual Load SheddingIf the time frame of collapse is long-term, manualload shedding can be implemented to stabilize thevoltage. This mode of operation, normally appliedunder inadequate generation conditions orinsufficient Var reserve, should have preplannedguidelines and procedures for the systemdispatchers to implement load shedding manually.System studies can provide load sensitivityanalyses from which the critical voltage can bedetermined to start load shedding. Anotheroption to assist system operators for fast actionis to preprogram blocks of loads on thedispatcher control console of the SCADAsystem. Dispatchers can select a particularblock of load in a specific area requiring loadshedding to control the voltage drop. The blocksof load can also be divided into severalsubgroups depending on sensitivity of the load,so that execution of the manual load sheddingcan be carried out in steps or in rolling sequence.
A major disadvantage of relying on manual loadshedding is that it places a severe burden onsystem operators to recognize an approachingvoltage stability problem and to act quicklyenough to avoid a major collapse. Even with themost comprehensive preplanned guidelines,there is a danger that the particular condition thatarises may not fall within the guidelines clearly
Final version, December, 1996
25
enough for prompt action. However, when shortterm operational planning studies (time frameless than a week) show the possibility of collapsedue to expected load and actual contingencies,manual shedding can be applied with goodresults.
B. Load Shedding as Part of EnergyManagement Systems (EMS)
Some utilities have installed remote controlleddevices to control the residential air conditioners,water heaters, and other loads as a part ofenergy conservation effort to reduce systempeak demand. During the system peak loadcondition, a signal will be broadcasted to selectedareas to cycle the interruptible loads off for 15-minute intervals. This short interruption will notdrastically change the room or water temperatureto cause significant discomfort or inconvenienceto customers.
This program is normally initiated by systemdispatchers or by EMS based on the need of thesystem. This same program can be used forload shedding either manually by dispatchercontrol or automatically from EMS if proper logiccan be programmed to detect a voltage instability.
To be effective, load shedding from this programrequires participation of large groups ofcustomers. Such participation is unlikely tomaterialize unless there is some sort of financialincentive (such as reduced rates) forparticipation. This type of action is most likely tobe considered when utilities can defer largeamounts of capital expenditure to reinforcetransmission if the program is implemented. Inorder to get a reasonable return on the loss ofrevenue from financial incentives, operation ofthis type of load shedding scheme would beexpected much more often than the alternative ofdisconnecting large blocks of load under extremeemergency conditions.
C. Automatic Load SheddingWhen the voltage instability is caused by suddenloss of critical transmission equipment or Vargenerating equipment, the lead-time prior to avoltage collapse will be very short. Therefore,
manual load shedding would be too slow toprevent a voltage collapse. Automatic loadshedding must be used to quickly arrest a fastvoltage drop and allow the voltage to recover toan acceptable level before voltage collapse canoccur.
Undervoltage detectors are often used to initiateautomatic load shedding. For low voltage eventswhich do not lead to collapse (such as during anormally cleared system fault), these detectorsmust not operate in order to prevent nuisancetripping of customer load. Security of theundervoltage detectors can be increased byapplying multiple phase detection, proper timecoordination between fault clearing and timedelay for load shedding, and use of fault detectionrelays to inhibit load shedding. Reliability of loadshedding to prevent voltage collapse can beenhanced by use of other indicators than voltagemagnitude such as voltage and power sensitivityfactors or other forms of voltage stability indices.
Developing appropriate settings for theundervoltage detectors and time delays arechallenging problems. It might require intensivenetwork analysis to find the desired values toprovide optimum coordination between loadshedding and voltage collapse. Generally, thesettings are in the range of 85 to 95 percent ofthe operating voltages, with time delays rangingfrom tens of cycles to minutes [1,5,20]. Thesensitivity of the load to the voltage level has agreat impact on the settings.
For example, air-conditioning load is sensitive tolow voltage and can aggravate the systemvoltage once the voltage drops below a levelcausing the air conditioners to stall [21]. Theaggregated locked rotor currents from stalled air-conditioners, which are almost entirely inductive,could drag the system voltage down if theyremain connected to the system. Therefore, thetime delay for this type of load shedding mayneed to be much shorter than others.
On the other hand, if the system is capable ofoperating in the low voltage condition for longenough, stalled motor load will disconnect itself byit’s overload protection. Such disconnection was
Final version, December, 1996
26
observed in the Philadelphia Electric Companylow voltage incident [10]. The concern wasexpressed in analysis of that incident that ifautomatic load shedding had been applied, toomuch load might have been disconnected, andovervoltages could have resulted.
Automatic load shedding to arrest frequencydeclines leading to possible blackout is widelyaccepted and required in many interconnectedsystems. This type of protection system hasproven to be very reliable in not shedding loadunnecessarily, and in shedding load whenrequired. Its success is due in part to the closetolerances at which system frequency is normallymaintained, and the reliability of deviation outsidethose tolerances as an indicator of seriousgeneration/load mismatch.
The comparison of settings of relays forunderfrequency load shedding with those ofrelays for undervoltage load shedding isinteresting. In order for each member companyof a coordinated council to shed the appropriateload, given the same frequency conditions, thesettings for the underfrequency relays and theirassociated timers are generally programmed totrip essentially at the same time. Stagedshedding of load is achieved by programming thesettings of various relays into different steps offrequencies. However, undervoltage detectorsfor automatic load shedding may be set at voltagelevels close to each other, but spread into stepswith different time delays (considerably longerthan underfrequency relay trip time).Underfrequency relays are often inhibited duringundervoltage conditions to ensure response onlyto system wide frequency excursions.
Frequency decline due to generation/loadmismatch is uniform over a wide area.Underfrequency detectors with similar or identicalsettings can be applied throughout a system.Voltage magnitude during a voltage instabilityincident is much more variable in the area underconsideration. Undervoltage detectors usuallyhave to be installed in specific areas andlocations within a system, depending on systemstudies to identify the areas with a high probabilityof voltage collapse. Since undervoltage
detectors are set very close to normal operatingvoltages, it is sometimes necessary to ensureundervoltage relays sense voltages at very stiffbusses. Stiff busses will be better regulated andsubject to less disturbance (due to local transientconditions such as faults), than weaker busses.
Use of multiple sensing relays can greatlyincrease reliability of underfrequency andundervoltage load shedding schemes. In somecases, system studies may show that smallfrequency changes are a necessary condition fordisturbances leading to voltage collapse. In suchcases, supervision of load shedding byunderfrequency detectors can enhance securityof the load shedding scheme. For example,Florida Power and Light supervise a loadshedding scheme by underfrequency relays setat 59.9 Hz. These relays trigger a latched relaythat stays latched for up to a minute after thefrequency excursion. Load shedding is allowed ifthe latched relay is operated at the same timethat the reactive power deficiency decision istransmitted to the load supply point [4].
Some relaying considerations associated withload shedding schemes:
• Undervoltage detectors operate very close tonormal operating voltages. Caution isrequired in setting and application to ensurereliability. Relays must be very accurate, andmust be connected to accurate voltagetransformers. The relay dropout ratio anddropout time are important factors. If thevoltage is depressed and restored due to atransient event, the relays must reset beforeload shedding is initiated. To minimize theresponse of relays to voltage depressionsdue to unbalanced faults, three phasemeasurement (all three phases must operate)or positive sequence voltage measurementmay be employed. To avoid load sheddingfor loss of potential supply, a windowmeasuring principle may be employed. If thevoltage is depressed to a very low level,(such as might occur for loss of potentialsupply), no amount of load shedding is goingto restore voltage to near normal, therefore
Final version, December, 1996
27
the voltage detector may be set to ignoresuch voltages.
• Steady state phase voltage unbalance due to
heavy loading on untransposed lines is also afactor in voltage measurement. Sinceundervoltage relay settings are very close tonormal operating levels, phase voltageunbalance of only a few percent can besignificant. Measurement of all three phasevoltages or use of positive sequence voltageare techniques used to minimize the effectsof steady state phase voltage unbalance.
• Interaction between manual and automatic
load shedding schemes could be a problem.It is preferable that there be no interactionbetween the two schemes. Suchindependence can be assured by setting timedelays of automatic schemes so short thatmanual actions might not reasonably beexpected to overlap. Figure II-4 showssystem operator intervention may beexpected after 1 minute; so automaticschemes should have completed their actionby this time.
• A combination of manual and automatic load
shedding is achieved by manually armingautomatic schemes when off-line studies oron line indicators show that the possibility ofvoltage collapse is increasing. Manualcontrol of automatic load shedding schemesis usually achieved by use of SCADAsystems. The advantage of manualarming/disarming is that the security of thescheme is increased by blocking it duringnormal conditions. The disadvantage is thatdependability is decreased under fastcollapse scenarios by having the need foroperator action before the scheme canfunction.
• Proper selection of blocks of load and
duration of shedding for the manual loadshedding schemes is important. If manualload shedding is applied to remedyinadequate generation conditions, it shouldhave somewhat different objectives under
near voltage collapse conditions. Systemsimulations can produce sensitivity analysesfrom which the critical blocks of load may bedetermined.
• Unexpected loss of load (such as tripping of
motor starters) in addition to intentionaldisconnection of load, may result inexcessive loss of load. This excessive lossof load, in addition to mitigation measuressuch as switching on of shunt capacitors,may result in unacceptably high voltagesduring loss of voltage stability incidents.
• Automatic load restoration may be
considered as a means of minimizingexcessively high voltages after load shedding.Load should be restored in stages, to preventsubsequent secondary collapses. Automaticload shedding and restoration was helpful instabilizing voltages in an incident in theArizona Public Service and Salt River Project(SRP) areas on 29 July, 1995. In thisincident, an unusually slowly cleared fault ledto air conditioner motor load stalling. Asevere and sustained region wide voltagedrop was arrested in part by undervoltageinitiated load shedding of 1400 MW of SRPload. When voltages started to rise after loadshedding, much of the load was automaticallyrestored within 20 seconds. Automatic loadrestoration schemes must be carefullyapplied to avoid causing widely fluctuatingvoltages during voltage instability.
• Future implementation of automatic load
shedding schemes may involve more detailedresults of network analysis in line with recentunderstanding of the voltage collapsephenomenon. it may be coupled with fastermonitoring systems, and setting points maybe calculated on sensitivity analysis ofreactive powers and voltages rather thanisolated measurements of voltage, orfrequency. The choice of loads to be shed insuch schemes may be dictated by the natureof active/reactive power imbalance in thesystem, and should not interact with existingschemes or priority loads.
Final version, December, 1996
28
VII. Distribution Voltage Control
A. GeneralElectric utilities utilize load tapchangers (LTC) tomaintain customer voltage levels as the systemconditions change. Typically, as load increases,the LTC will act to raise the tap position in orderto maintain the voltage level. The LTC controlrelay will be set to operate in one of two modes -bus voltage regulation or load center voltageregulation using the line drop compensator.
Load Center voltage regulation requires a linedrop compensator to regulate the voltage at theload center. Transformers at distributionsubstations are more likely to use load centervoltage regulation than those at transmissionsubstations. Therefore, it is important to knowthe mode of LTC control operation whenmodeling the effect of the tapchangingtransformer operation during voltage collapse.
During a period of voltage collapse, the LTCcontrol relays will detect a low voltage and begintiming to raise the tap position of the transformer.When the voltage collapse occurs slowly, thecontrols will time out and begin to raise thetransformer tap position. Assuming no change inthe load on the transformer during this period, theLTC can often be considered a constant powerload (i.e., α and β are near zero) as long as thetapchanger can maintain a constant load voltage.Since the primary voltage level drops, the currentflow in the transmission system is increased tomaintain the load power. This increasing currentflow will further reduce the transmission systemvoltage, making the voltage collapse moresevere.
In some cases, tap changers can also have abeneficial effect. Consider for instance, a casewhere a transformer is supplying predominantlymotor load with power factor correctioncapacitors. The LTC keeps the supply voltagehigh and hence does not affect the real powerconsumption (which is relatively independent ofvoltage), and also maximizes the reactive supportfrom the power factor correction capacitors. Due
to this regulating effect, the LTC is an importantpart of the overall voltage collapse scenario.
For the more frequent case, where the realpower loads have some voltage dependency, theLTC can be utilized to reduce the severity of thevoltage collapse if appropriate control operationcan be obtained. Blocking operation of the LTChas been widely offered as a method to reducethe negative effect on the system. Load voltagereduction can be used to reduce the loading onthe system. This is similar to the peak shavingsystems widely used at many utilities. Thereforethe load tapchanger may be both a cause and apartial solution to the problem of voltage collapse.
B. LTC Blocking SchemesThe simplest method to eliminate the LTC as acontributor to voltage collapse is to block thecontrol’s automatic raise operation during anyperiod where voltage collapse appears to be aconcern. The decision to temporarily block thetapchanger can be made using locally derivedinformation or can be made at a central locationand the supervisory system can then send ablocking signal to the unit. This action may resultin a period of low voltage on the affected loads.The effect of the reduced supply voltages onpower quality to customers in the whole servicearea must be weighed against the possiblealternative of complete disconnection of somecustomers in a smaller area. Tap changerblocking will be more effective for voltage decaysslower than the transient time frame. It will alsobe more effective on loads that have a relativelyhigh voltage dependency (i.e., α approaches 2and β is considerably higher). In cases wherethe steady state value of β is high (such as thevalue of 4 as seen in Figure II-5), the reduction ofreactive power demand due to reduceddistribution voltage will be very significant inhelping keep transmission voltages up.
Local blocking schemes are implemented usingvoltage relays and timers to sense the voltagelevel on the high voltage bus at the substation.The setpoint voltage is usually chosen to be alevel that is less than that which occurs duringmaximum acceptable overload conditions.
Final version, December, 1996
29
Blocking is initiated if the abnormal undervoltagecondition exists longer than a predeterminedtime. The time period may vary from 1 to severalseconds. The LTC is unblocked when thevoltage has recovered to an acceptable level fora predetermined period of time, typically 5seconds. Since the blocking action will beremoved if the voltage recovers, usually a singlephase-phase voltage measurement is adequatefor this scheme.
A coordinated blocking scheme can be utilized toblock operation of LTC’s in an area wherevoltage instability is imminent. The coordinatedscheme can be accomplished with undervoltageschemes acting independently (as describedabove) in a coordinated fashion at variousstations within a region, or it can be a centralizedscheme that recognizes a pattern of low voltagesat key locations. In a centralized scheme, theLTC blocking can be implemented in substationsthroughout the affected region, even if the voltageat all locations is not yet below a specificthreshold. The key to operation of a centralizedsystem is the reliability of the communicationssystem. The data needed for decision makingmust be collected at the central location foranalysis. Control decisions must then be sent toeach affected transformer location.
The effectiveness of an LTC blocking scheme atthe transmission level will largely depend onwhether distribution transformers are LTC-type.If the distribution transformers are LTC-type,additional measures are required to prevent theiraction from negating the effect of the LTCblocking scheme at the transmission level.
The blocking schemes described above requirean accurate measurement of the high voltagelevel at each substation. When high sidepotential devices exist at the substation, thisvoltage measurement can be made directly. Insubstations that do not have potential devices onthe high voltage, an estimation of the high voltagelevel can be made from a voltage measurementmade on the low voltage side of the LTCtransformer. In order for this estimate to beaccurate, several data items must be consideredin the estimation. The tap position of the
transformer must be accurately estimated so thatthe voltage calculation will be accurate. Thisinformation can be derived via several methodsand must be then utilized by the measuring relay.The transformer load current, series reactance,and series resistance are also required toestimate the voltage drop due to load current. Ifload current is near unity power factor, the seriesresistance of the transformer will be the mostimportant factor in its impedance. If there issignificant reactive power flow through thetransformer, the voltage drop across the seriesreactance will also be important. By combiningthe effects of the variable tap position of thetransformer and the voltage drop caused by loadcurrent, a reasonably accurate estimation of thehigh voltage level can be made.
C. Distribution Voltage ReductionMany utilities have implemented systems toreduce distribution voltages during peak loadperiods. The reduction in voltage is used toreduce the system peak demand. In a similarfashion the voltage reduction concept can beused during periods where voltage stabilitymargins are insufficient.
An example of voltage reductions for peakshaving follows:
Voltage reductions represent an operating toolthat may be included in load managementprograms. The Pennsylvania-New Jersey-Maryland Interconnection (PJM) utilizes 3%and 5% voltage reductions to aid in curtailingpeak load when required to provide sufficientreserves to maintain tie flow schedules andpreserve limited energy sources. Voltagereductions are initiated for both capacityshortages and when reactive limits arereached or exceeded. Experience hasindicated that implementing a 5% voltagereduction on the PJM system will result in aninitial load reduction of approximately 2%.
The mechanics for implementing voltagereductions varies among the PJM membercompanies since voltage control methods and
Final version, December, 1996
30
facilities differ. In general, if load tap changingfacilities are available at distributionsubstations, tap changes or voltage schedulechanges are initiated remotely by supervisoryor radio control. If remote control facilities donot exist, such action must be taken manuallyat the station. Some companies utilize loadtap changing facilities at the subtransmissionlevel rather than at the distribution level. Insuch cases, the subtransmission voltage isreduced in order to lower the underlyingdistribution voltages. In cases whereautomatic load tap changing is employed,control systems are used in which the tapchanger controller is fooled into thinking thatthe controlled voltage is 3% or 5% high. Thecontroller action subsequently automaticallyprovides the action to implement the desiredvoltage reduction.
Voltage reductions during reactiveemergencies can provide the additionalbenefit of increasing the connected reactivesupport by forcing on capacitors which mayhave not been switched into service by theirassociated voltage controllers. Localizedproblems may occur during voltagereductions due to the existence of voltagesensitive customers in an area. In suchcases, member companies are given theflexibility to deviate from the voltage reductiondirective in the specific problem areas.
Voltage reduction schemes involve changing thesetpoint of the systems distribution transformerLTC controls so that a lower distribution voltageis achieved. Several types of systems havebeen developed to implement voltage reduction.Voltage fooler circuits are used to increase thesensing voltage input to the LTC control relays.These circuits typically consist of a step-uptransformer, with one or more taps, in series withthe potential input to the control. Using SCADAcontacts the LTC control is fed a voltage that ishigher than the actual voltage, causing the controlto act to lower the voltage. In some cases thecontrols preset time delay is bypassed,
eliminating the delay typically present in theautomatic control. In transformers, with static ordigital controls, voltage reduction inputs areavailable that provide equivalent operation withoutthe necessity of adding the fooler circuit. Ineither case, the voltage reduction schemestypically have one to three discrete stepsavailable to the user. Typically steps of 2.5%,5%,and 7.5% of voltage reduction can be selected bythe system operator or SCADA system.
During a period of potential voltage instability thevoltage reduction scheme could be utilized toreduce the system voltage to its minimum level soas to reduce the load as much as possible. Thisstep could be instituted prior to any load sheddingand could reduce the need for load shedding andthe corresponding load disruption. The voltagereduction scheme could be implemented using adistributed or by a centralized measuring systemsimilar to the systems described above.
D. Comparison of Voltage Reduction andBlocking Schemes
These schemes are similar to each other in tryingto minimize the chance of completedisconnection of some customers by providingslightly reduced voltage to most customers. Theireffectiveness are both similarly dependent ofload characteristics and the time frame of voltagedecay.
The load characteristics are important indetermining the amount of load relief that may beexpected for a given voltage depression. Forloads that are predominantly motor loads, the realpower loss is minimal for a small voltagedepression. Thus load mix (ratio of residential,commercial and industrial loads) is important aswell as seasonal characteristics (air conditioningloads for summer peaks). The time frame isimportant because LTCs are effectively blockedin the transient time frame. As shown in Figure II-4, LTCs do not start to move until after thetransient time frame.
The voltage reduction scheme has an advantageover the blocking scheme in that the quality ofpower supplied to customers remains defined by
Final version, December, 1996
31
the new (reduced) set point. It has a potentialdisadvantage however, of providing less loadrelief than the blocking scheme which allowsdistribution supply voltages to drift down towhatever levels the transmission voltage goes to.
A major point of concern in application of theblocking scheme using local voltage detectors isthat the LTC may have already moved to near it’sfull boost position by the time the primary voltagehas reduced to a level below the normalmaximum. Thus blocking the LTC may be toolate. Use of a centralized decision which couldbe taken at an earlier time (since moreinformation may be available to determine thepossible onset of collapse), may allow blockingthe LTC when it is in a near normal position. Thisconcern is not as important in a voltage reductionscheme which retains control of the LTC.
With both schemes, the characteristics of thedistribution system is important. To minimizeunacceptable power quality to some customers,the voltage profile along the distribution feedershould be fairly flat. If the profile is too steep, itwill not be possible to reduce voltage levels atcustomers near the substation without reducingvoltage levels at distant customers tounacceptable levels.
VIII. Conclusion
A. The fundamental principles ofmitigation actions
Anticipate the problem by using load flow andstability studies to identify system conditions thatmay lead to voltage instability. Conditions thatlead to voltage collapse may be caused oraggravated by heavy power transfer betweenregions; so coordination among the affectedregions is essential to develop the appropriatemitigative action. Results of these studies can beused to develop special operating procedures tominimize the probability of collapse. Wherestudies show that operating procedures alone arenot sufficient to ensure voltage stability, specialcontrol and protection schemes can be applied tomitigate the conditions leading to collapse.
Use appropriate diagnostic techniques toprovide early warning of the onset of voltagestability problems. Since voltage collapse is awide area problem, these techniques often needcommunications assistance. Thecommunications are not necessarily high speed,but must be reliable. The techniques involvemeasurement of relevant factors such as voltagemagnitude, status and output of sources ofreactive power, rate of change of reactive powergeneration with respect to load, and magnitudesof real and reactive power flows.
Provide temporary reactive support untiloperator action can stabilize system. This mayrequire taking advantage of temporary overloadcapabilities of generators and synchronouscondensers in the affected area. To ensure fullcapability of all sources are available, they shouldbe operated from time to time at maximum andminimum reactive outputs to ensure all protectivedevices coordinate properly with control devices.
Provide permanent reactive support. Since itis deficiency of reactive power sources thatcauses voltage to drop, provision of thesesources are an effective means of maintainingvoltages. Switched capacitors are a popularmeans of providing such support, but care mustbe taken to avoid depending entirely on fixedsupport such as is provided by capacitors. Fixedsources do not provide the control of systemvoltage which is critical in near collapsesituations.
Provide an appropriate mix of static anddynamic sources of reactive support.Although dynamic sources of reactive power aremuch more expensive than fixed sources, theydo have the advantage of being able to controlvoltages. Some relatively economical means ofproviding dynamic support include use of LDC sothat generators regulate voltages some distancefrom their terminals. Conversion of uneconomicgenerators to synchronous condensers, and fastswitching of capacitors are sometimes optionsfor increasing the availability of sources ofdynamic reactive support. Where possible,dynamic sources of reactive power may be
Final version, December, 1996
32
operated as near to mid output as possible tomaximize dynamic reactive reserve. Manual orautomatic switching of static sources (or sinks)of reactive power is a better means of keepingdynamic sources near the middle of theiroperating range than adjusting their referencevoltage.
Provide temporary load relief by blocking tapchangers or reducing distribution supplyvoltage. The amount of load relief provided bythese means is determined entirely by the staticand dynamic characteristics of the real andreactive components of the load with respect tovoltage level. These characteristics vary widely,and may need to be determined by test. Thereduction in reactive power demand with voltageis often larger than the reduction in real powerdemand. It must be ensured that voltage qualityis not degraded so much that the alternative ofload shedding would not have been preferable tothe customer.
Shed load. This alternative is the ultimate shortterm mitigation action. Since the cause ofvoltage collapse is an excess of load for thegiven transmission system, load shedding is aclearly effective action. This action is likely tofind increasing application as utilities balance thealternative of power supply reliability with powersupply cost.
B. Choice of action(s) depends to a largeextent on dynamics
The speed of collapse can vary widely from a fewseconds to tens of minutes. Since many of themitigation actions offer temporary benefits, theireffectiveness will vary widely with the dynamiccharacteristics of the collapse. Therefore, thereare no actions that are generally preferable for alltypes of power systems.
Protection and control actions must becoordinated with each other. As it becomesmore difficult to provide new transmission andgeneration, utilities rely more on complex, anddiverse protection and control systems. Toensure coordination is achieved, two itemsbecome important - communications and test.
Communications are required to ensurecoordination between different geographiclocations. Test of coordination by regularexercising of control actions while the powersystem is not stressed is the best way to ensurethey will operate properly and coordinate witheach other and with protection systems understressed conditions.
System dynamics in the voltage collapse timeframes depend on three factors, temporaryoverload capability of dynamic sources ofreactive power, timing of control devices such astransformer load tap changers, and dynamicresponse of loads to voltage changes. Of thesefactors, it is usually the load characteristics thatare most difficult to determine. Even if loadcharacteristics are determined by test, mitigationactions based on these characteristics should beinitiated in the region where the characteristicsare valid. For instance, if tests have determinedthe characteristics within the range 0.95 to 1.05p.u., the same characteristics cannot beexpected if the voltage drops to 0.85 p.u. Atvoltages less than 0.9 p.u., system response tomitigation actions is very uncertain.
Operator training and response is very important.Operators must be able to recognize voltageinstability conditions and must be able to actpromptly and effectively to arrest collapse. Thetime frame of collapse is often longer thanoperator response time. All automatic actionswhich are intended to provide temporary reliefmust be accompanied by clear indication of theiraction; so that operators can recognize theconditions. Further, operator training mustinclude clear direction as to actions they arerequired to take when voltage collapse isimminent.
The study of voltage stability phenomena anddefinition of alternatives is the system planner’sresponsibility. Protection engineers can help inensuring reliability of mitigation actions by properdesign, and by coordination with other protectionand control actions affecting system stability.
Final version, December, 1996
33
IX. AcknowledgmentsThe contributions and helpful comments duringreviews of drafts of this document by CarsonTaylor, Daniel Karlsson, and Stefan Arnborg, aregratefully acknowledged.
X. References
1 IEEE Committee paper, "Summary ofSystem Protection and Voltage Stability", IEEEWG on Voltage Stability, IEEE Transactions onPower Delivery Vol. 10 No. 2, April, 1995 p.p.631-638
2 CIGRE Task Force 38.02.12, “Criteriaand Countermeasures for Voltage Collapse”,Brochure No. 101, October, 1995 (summary inElectra, October, 1995).
3 IEEE PES Publication 93TH0620-5PWR"Suggested Techniques for Voltage StabilityAnalysis"
4 S.A. Nirenberg, D.S. McInnis, and K.D.Sparks, “Fast Acting Load Shedding”, IEEETransactions on Power Systems, Vol. 7 No. 2,May 1992, p.p. 873-877.
5 H. M. Shuh and J. R. Cowan,“Undervoltage Load Shedding-An UltimateApplication for the Voltage Collapse,”Proceedings Georgia Tech Protective RelayConference, April 29 - May. 1, 1992
6 P.G. McLaren, et. al., “”Open” SystemsRelaying”, IEEE Transactions on Power Delivery,Vol. 9, No. 3, July 1994, p.p. 1316-1324.
7 T. Newton, E. Lee, D. Rogers, “A NewUniversal Protective Relay Architecture, itsPhilosophies, and Implementations”,Proceedings, Western Protective RelayConference, 1994, Spokane, Washington
8 C. W. Taylor, “Power System VoltageStability”, McGraw-Hill, 1994.
9 G. C. Bullock, “Cascading VoltageCollapse in West Tennessee”, Proceedings,Western Protective Relay Conference, 1990,Spokane, Washington
10 North American Electric ReliabilityCouncil (NERC), “1992 System Disturbances -Review of Selected Electric SystemDisturbances in North America”, North AmericanElectric Reliability Council, October, 1993 p.p.18-32
11 D. Karlsson, et al., “Temporary Load-Voltage Characteristics for Voltage StabilityStudies - Field and Laboratory Measurements”,CIGRE Paper No. 38-204, 30 August - 5September, 1992.
12 G. J. Berg, "System and Load behaviorFollowing Loss of Generation", Proc. IEE, Vol.199, No. 10, Oct. 1972, pp. 1483-1486.
13 S.A. Kalinowsy and M. M. Forte, "SteadyState Load-Voltage Characteristic Field Tests atArea Substations and Fluorescent LightingComponent Characteristics", IEEE Trans. onPAS, June 1981, pp.3087-3094.
14 T. Frantz et al., "Load Behavior Observedin LILCO and RG & E Systems", IEEE Trans. onPAS, April 1984, pp. 819-831.
15 IEEE Task Force, "Load representationfor Dynamic Performance Analysis", IEEETransactions on Power Systems, Vol. 8, No. 2,May 1993, p.p. 472-482.
16 IEEE Load Representation for DynamicPerformance Task Force, "Standard LoadModels for Power Flow and DynamicPerformance Simulation", IEEE Trans. on PowerSystems, Vol. 10, No. 3, pp. 1302-1313, August,1995
17 N. E. Nilsson, and J. Mercurio,“Synchronous Generator Capability CurveTesting and Evaluation”, IEEE Trans on PowerDelivery, Vol 9, N0. 1, January 1994, p.p.414-424
Final version, December, 1996
34
18 M. M. Adibi and D. P. Milanicz, “ReactiveCapability Limitation of Synchronous Machines”,IEEE Transactions on Power Delivery, Vol. 9 No.1, February 1994, p.p. 29-40
19 Murdoch, Crenshaw, and Wright, "PowerSystem Stabilizer Application Guide", GEPublication 84-EUE-207, 1984, p. II-1
20 C. W. Taylor, “Concepts ofUndervoltage Load Shedding for VoltageStability,” IEEE Transactions on PowerDelivery, Vol. 7, No. 2, p.p. 480-488, April1992.
21 B. R. Williams, W. R. Schmus andD. C. Dawson, “Transmission VoltageRecovery Delayed by Stalled Air ConditionerCompressors,” IEEE Trans. on PowerSystems, Volume 7, No. 3, August, 1992,pp. 1173-1181