20 - 1 VOLTAGE CONTROL FOR DISTRIBUTION NETWORKS and the 230V/400V Standard by Alex Baitch FIEAust, CPEng Manager Network Capability, Integral Energy This paper was presented to the Annual Conference of the Electric Energy Society of Australia held in Canberra 4 – 5 August 2000. SUMMARY: This paper discusses some of the issues associated with quality of supply and the procedures associated with voltage control for distribution networks. This includes consideration of the use of voltage control devices to assist with maintenance of acceptable voltages, determination of feeder regulation, the setting of distribution transformer taps and design of low voltage networks. The impact of the issue of the new Australian Standards AS60038-2000 “Standard Voltages” is considered and conclusions drawn on the actions that need to be taken. 1 INTRODUCTION The issue of the new Australian Standard AS60038-2000 “Standard Voltages” is an opportune time to review the impact of the new standard on electricity distributors and suppliers. It is also an opportune time to review some of the fundamentals that relate to ensuring that the voltage supplied to customers is maintained within acceptable limits. The original paper by L.A. Chappell (Ref 1) is particularly acknowledged and has been used as a basic source in preparing this paper. The Distribution Network Service Provider (DNSP) (the term used in the National Electricity Market) is responsible to ensure that the supply provided to electricity consumers within the area that the DNSP supplies is of an acceptable quality. Providing a definition of what constitutes an “acceptable quality” is not a simple task and indeed not a matter about which there is total consensus. There are conflicting pressures between suppliers and consumers as to what constitutes an economically achievable quality of supply. In essence the consumer seeks to ensure that the power supply is continuous and that the voltage should be within standards acceptable for the electrical equipment connected to the electricity network in terms of voltage, frequency and wave-shape. The objective is to ensure that the electrical equipment and appliances: • Will operate as designed and can be used to full design capability • Are at minimal risk of damage when connected to the electricity supply • Will operate continuously when required, with minimal risk of interruption.
Transcript
20 - 1
VOLTAGE CONTROL FOR DISTRIBUTION NETWORKSand the 230V/400V Standard
by
Alex Baitch FIEAust, CPEngManager Network Capability, Integral Energy
This paper was presented to the Annual Conference of the Electric Energy Society ofAustralia held in Canberra 4 – 5 August 2000.
SUMMARY:
This paper discusses some of the issues associated with quality of supply and the proceduresassociated with voltage control for distribution networks. This includes consideration of the use ofvoltage control devices to assist with maintenance of acceptable voltages, determination of feederregulation, the setting of distribution transformer taps and design of low voltage networks.
The impact of the issue of the new Australian Standards AS60038-2000 “Standard Voltages” isconsidered and conclusions drawn on the actions that need to be taken.
1 INTRODUCTION
The issue of the new Australian Standard AS60038-2000 “Standard Voltages” is an opportune timeto review the impact of the new standard on electricity distributors and suppliers. It is also anopportune time to review some of the fundamentals that relate to ensuring that the voltage suppliedto customers is maintained within acceptable limits. The original paper by L.A. Chappell (Ref 1) isparticularly acknowledged and has been used as a basic source in preparing this paper.
The Distribution Network Service Provider (DNSP) (the term used in the National ElectricityMarket) is responsible to ensure that the supply provided to electricity consumers within the areathat the DNSP supplies is of an acceptable quality. Providing a definition of what constitutes an“acceptable quality” is not a simple task and indeed not a matter about which there is totalconsensus. There are conflicting pressures between suppliers and consumers as to what constitutesan economically achievable quality of supply.
In essence the consumer seeks to ensure that the power supply is continuous and that the voltageshould be within standards acceptable for the electrical equipment connected to the electricitynetwork in terms of voltage, frequency and wave-shape. The objective is to ensure that theelectrical equipment and appliances:
• Will operate as designed and can be used to full design capability• Are at minimal risk of damage when connected to the electricity supply• Will operate continuously when required, with minimal risk of interruption.
20 - 2
The design and operation issues associated with the maintenance of voltage control of the electricitynetwork is fundamental for DNSP’s. The issues, which are generally well known to experienceddistribution engineers, are reviewed and updated.
2 QUALITY OF SUPPLY
2.1 GeneralAlthough the prime focus of this paper is with respect to the specific issue of voltage control withinthe distribution network, it is necessary to consider the overall issue of quality of supply and theterminology that is used to describe some of the issues.
Quality of supply is a matter that is under increasing scrutiny from regulators. Worldwide regulatorsare applying pressure on DNSP’s to reduce operating costs through reduced revenue caps. At thesame they are increasingly focusing on the matter of quality of supply and seeking improvement inperformance indices. These are somewhat conflicting pressures which will ultimately requireadoption of innovative solutions
The DNSP seeks to ensure that the quality of the electricity supply is as continuous as possible fromboth an economic and technical point of view, and the voltage in terms of magnitude, waveshapeand frequency is within acceptable industry standards for the electrical equipment.
Where there is a gap between the quality of power supply that the DNSP can provide and the qualityrequired by a consumer for specific applications (such as supply to critical process equipment,computers or other vital plant) then, in general, the end-user needs to take specific action to addressthe issue. This could include the provision of uninterruptible power supplies (UPS), lineconditioners and/or standby generators.
In Australia, at the low voltage level the ideal voltage level at the customers point of connection hastraditionally been a sinusoidal voltage supply of 415V(phase-to-phase) /240V (phase-to-earth) at50Hz. (The impact of the 230V/400V standard will be discussed later). In practice there are a widerange of disturbances that cause deviations between the ideal sinusoidal wave and the actualwaveform.
Power quality disturbances can be categorised as follows (some examples shown in Figure 1):• Interruptions of supply (short duration, long duration)• Frequency events (rarely occur)• Voltage events (long term, short term, voltage unbalance, random fluctuations,
protection system operation)• Waveform events (harmonics, interharmonics, notching, transients (lightning strikes or
switching), high frequency noise).
Illustrations of examples of various types of voltage disturbances (unrealistically compressed into asingle example) are shown in Figure 1.
20 - 3
Figure 1 Examples of voltage disturbances (Ref 7)
The issue of Quality of Supply is covered by the AS/NZS 61000 “Electromagnetic Compatibility”series of standards . These are based on the IEC 61000 series of standards and amongst otherstandards is replacing the AS 2279 series. They concentrate on all issues associated withharmonics, fluctuating loads, etc.
In addition considerable work is continuing within the electricity industry to develop various PowerQuality Indices that can be used to provide a measure of the performance of the network. Theseinclude indices such as:
CAIDI Customer Average Interruption Duration IndexSAIDI System Average Interruption Duration IndexSAIFI System Average Interruption Frequency IndexMAIFIN Momentary Average Interruption Frequency Index (N%)SARFIX System Average RMS (Variation) Frequency IndexTHD Total Harmonic DistortionSATHDCP95 System Average Harmonic Distortion CP95
This paper concentrates on long term voltage events to ensure that the design of the network resultsin a satisfactory voltage range at the customer terminals in terms of long duration voltage levels.
2.2 Voltage RegulationEnsuring that the long-term voltage events on the network are within a satisfactory range deals withthe issue of “system voltage regulation” of the network. The objective is to ensure that the voltageat the consumer’s terminals is at an acceptable level and within the limits of permissible spread. Inthat regard the two key considerations are:
• The voltage must approximate to some optimum level• The voltage spread must not be greater than certain established limits.
If the selected voltage level is incorrect or voltage limits are too narrow, economic considerationsmay prevent practical implementation. Furthermore, in some cases it is not possible to satisfy therequirements at all times. The best that can be achieved is that is that the majority of consumers areprovided with acceptable supply practically all of the time.
With pressures on DNSP’s to “drive the system harder”, parameters that have traditionally beenused for the design of networks are being reviewed with the result that at times design parameters
20 - 4
that are used attempt to provide an adequate voltage level for the majority of the time rather than atpeak loading conditions.
3 GENERAL ISSUES
3.1 Methods of achieving voltage controlSome of the methods available to achieve system voltage control include:
1) Adjust subtransmission voltage levels at transmission substations2) Utilise zone substation automatic “On Load Tap Changing” (OLTC) transformers3) Vary the bandwidth (dead-band) of voltage regulators4) Add line drop compensation5) Add additional feeders or distributors6) Increase conductor size of existing feeders7) Rearrange the system, transfer loads8) Balance loads between phases9) Convert single phase networks to three-phase10) Close loops11) Add distribution transformer capacity12) Alter tap settings on distribution transformers13) Install voltage regulators14) Increase distribution voltage levels15) Install switched shunt capacitors16) Install series capacitors17) Install Flexible AC Transmission System (FACTS) devices
Usually there are a number of alternative strategies that can be used to deal with a particularsituation. The challenge is to select the most appropriate option taking into account future loadgrowth issues and economic factors. The situation is usually complicated by the fact that one isusually dealing with incremental load growth and future requirements are not necessarily known.
3.2 Records and Data requiredAn essential requirement in undertaking an investigation is to have complete and accurate records inorder that network characteristics, network configuration and loading details are well known.
The collection and maintenance of accurate and complete records associated with a large distributednetwork is vital for successful analysis. The use of computer systems and relational databases forcollection and storage of large volumes of data is becoming increasingly vital for efficient operationand control of a distribution network. Integration of this data with geographic information systems(GIS) associated with the physical location of assets as well as the network connectivity allows thedata to be input into computer based analysis engines for the computation of voltage conditions.
Data, while vital for carrying out analysis, is nevertheless expensive to both collect and maintain.Accordingly, it is vital that any data that is collected is useful for other purposes, such as formonitoring of the loading of distribution transformers to establish if capacity is exceeded,operational purposes and system development. Typically records that are used include:
a) Routine recordings of MDI readings on distribution transformers. Whereas in pastyears these readings were taken routinely at least twice per year and thus provided an
20 - 5
accurate source of data for summer and winter loading of substations, cost pressuresfacing the industry have resulted in the regular readings being suspended. The loss ofthis information has been found to be a major problem in managing the distributionnetwork. As a result action is being taken to restore this process, at least in part.
b) Detailed geographic information system (GIS) showing the geographic representationof the transmission, subtransmission, 22kV, 11kV network and low voltage network.The GIS record details the network connectivity, the length of each section ofconductor, the conductor sizes, location of zone and distribution substations, locationof high voltage switches and links, reclosers and regulators.
c) Network feeder load currents as monitored through the SCADA system, together withloading on the zone substation transformer loading.
d) Load cycle curves for zone substations monitoring the energy, demand and powerfactor for transmission and zone substations.
e) Records of tap settings for all distribution transformers.
f) Voltage levels, bandwidths and line drop compensation settings for transmission andzone substation transformers.
g) Voltage recordings on busbars at transmission, substransmission substations on thehigh and low voltage sides.
h) Load cycle data associated with major customer substation loads as obtained frommetering data. Access to this data is being coming increasingly more difficult as aresult of retail contestability where the information is considered confidential to thecustomer and retailer.
3.3 Characteristics of a Typical Network
Typical voltage levels, float voltages, band widths, tapping ranges and voltage drops for the IntegralEnergy system are shown in Table 1:
The values shown in Table 1 are only typical values. Due to the range of equipment that is installedon the network, there is large variety of combinations of tap change voltage ranges, transformervoltage steps, impedance values and settings of bandwidths and LDC’s.
Table 1 Typical characteristicsSingle Line Diagram Equipment Voltage Ranges or Regulation
Transgrid Supply Points330kV/132kV(20x1.00%)
132.0kV ± 0.75%
132kV Network Voltage range dictated by power flowand reactive power requirements± 5% typical
Transmission Substations 66.0kV or 33kV ± 1.5%
66kV or 33kV Network Rural: 10% regulationUrban: 3%
O.L.T.C Zone Transformers66kV or 33kV (+7x1.5%)(-14x1.5%) / 22kV or 11kV
66kV or 33kV+(7x1.25%)(-14x1.25%)/22kV or 11kV
72930V - 52140V / 22kV or 11kV36465V - 26070V / 22kV or 11kV
71775V - 54450V / 22kV or 11kV35888V - 27225V / 22kV or 11kV
22kV or 11kV Busbar22kV: 22kV ± 1.4%BW 2.0%LDC
11kV: 10.9kV ± 1.4%BW 2.0%LDC
21700V - 22750V
10750V - 11275V22kV or 11kV Feeders
Urban:Semi-Rural:Rural:
2.5% (3.5% max) (<2.0% if mostlyunderground)3.5% (4.5% max)6.0% (10% max where no LV network)
Distribution Transformers22kV: 20kV-22kV/433-250V 0.5kVsteps11kV: 10kV-11kV/433-250V 0.25kVsteps
4.1 GeneralThe key parameters that determine the nature of the voltage levels on various parts of the electricitynetwork, from its source at the generation level, through the transmission voltage level down to thedistribution voltage level are as follows:
a) Voltage ratio of the transformers at each part of the network from the generationsource, the transmission voltage level, subtransmission and distribution networks
b) Voltage taps available on the transformer for adjustment of voltage, either on loadtap changing or off-load tap changers
c) Float voltage which determines the mid-range voltage set for the regulating relayd) Bandwidth (dead-band)of the voltage regulating relay which is the range in which
the voltage regulating relay will not initiate the timing circuit for initiation of a tap-change operation
e) Line-drop compensation is used to bias the mid-range voltage set for the regulatingrelay in proportion to the load on the transformer, such that the output voltage isincreased as a function of load on the transformer.
f) Voltage drop associated with the power flow through the impedance of the networkconductors and through the impedances associated with transformers, reactors orregulators.
The following considers aspects of the above parameters at various parts of the network.
4.2 Transmission Network
Integral Energy’s supply is obtained from Transgrid’s network generally at 132kV from Transgrid’sBulk Supply Points although from two of the BSP’s supply is at 66kV. Within the Integral Energyarea there are ten (10) BSP’s.
The tap change steps at the BSP’s are typically 1% with a short time-out period between taps(typically 20 seconds on fine control and 1 second on coarse control). Similarly, the bandwidth onthe voltage regulator is typically set at 0.75%. Accordingly, output voltage from the BSP’s ismaintained within a narrow band.
Additionally, some of the BSP’s supplying Integral Energy have LDC facilities installed (SydneyWest and Regentville) which results in voltage boost as a function of load.
4.3 Subtransmission NetworkSupply to the subtransmission network is obtained at either 132kV, 66kV, or 33kV levels. In thecase of 132kV and some 66kV, supply is taken from Transgrid’s BSP’s , while in the case of therest of the 66kV supply and all of the 33kV subtransmission network, supply is from TransmissionSubstations which are owned by Integral Energy (following the transfer of 132kV assets).
The float voltage at Transmission Substations is set at a level that suits the particular part of thenetwork, taking into account the available tapping ranges of the transformers in the various zonesubstations.
The bandwidth (dead-band) of the voltage regulation relay is typically set at ± 1.5% and a time outperiod greater than the BSP (typically 45 seconds), thus ensuring that the transmission substation
20 - 8
regulates the voltage at the local level and does not respond to area wide voltage levels experiencedby the BSP.
Normally in the urban areas, heavy conductors are used in the subtransmission network to achieverequired capacity. Accordingly, the incoming voltage into the zone substation has only a limitedspread and the transformer tap changer can readily accommodate this.
In rural areas, where the voltage regulation on the transmission and subtransmission network islarge as a result of reduced conductor ratings and the long lengths of subtransmission, care needs tobe taken with selection of the tapping range of the transformer. This is necessary to ensure that thetapping range is adequate to cope with the potential voltage regulation on the transmission andsubtransmission system both under full load conditions, lightly loaded conditions and as a result ofvoltage rise due to capacitive currents.
The utilisation of bundled conductor construction provides both a larger conductor capacity and aswell reduces the reactance of the line. With utilisation of standoff insulators, bundled conductorconstruction is not possible, and thus the advantage of reduced reactance of bundled conductorconstruction is lost.
4.4 Zone Transformers
Zone transformers have tap-changers installed in order to regulate the voltage on the 11kV or 22kVoutput busbar. Typically, the bandwidth of the voltage regulating relay is set at ± 2% with the tapsteps of the transformer at 1.5% or 1.25%. As a result, bandwidth (dead band) is typically 4%.
In recent years Integral Energy has reduced the bandwidth of many of its zone substations to±1.36% in order to tighten the voltage band of the output from the zone substations. The timedelay for tapchanger action is typically set at 60 seconds, and is slower than the TransmissionSubstation tapchanger. Nevertheless, the impact of reducing the bandwidth on the zone substationtransformer is to increase the frequency of tapchange operations.
LDC on zone substations is typically set at 2% at full load, depending on the load mix from the zonesubstation. As the LDC affects the voltage on the complete busbar, where there is large mixture offeeders having residential, industrial and commercial loads characteristics, LDC needs to bereduced to prevent the output voltage being too high on feeders that are lightly loaded at the time ofmaximum demand on the zone substation.
A detailed analysis of determining the combined effect of subtransmission voltage regulation,bandwidth, LDC, and transformer impedance is included in Ref 6.
The methodology developed in Reference 6 allows for a visualisation of the effect of supply pointbandwidth, subtransmission voltage regulation, line drop compensation and transformer voltageregulation.
Under no-load conditions the transformer primary and secondary voltages are governed by the turnsratio shown in the following equation:
VP = N(T) VS (1)where N is the turns ration as a function of the tap position number “T”
Referring to Ref 6 this relationship is plotted by expressing the turns ratio (VP / VS) on the verticalaxis and the secondary voltage (VS) on the horizontal axis.
FigurUtilising the section otransformer will opevariation as a result impedance and bandw
Referring to Figure 3into the graphical ana8%. The tapping rang
In Figure 4 the effectvoltage as a function tap beyond the presen
It will be noted from range of transformerConversely, as the bincreases and the outp
20 - 9
e 2 No-load transformer characteristic showing turns ratiof the curve that relates to the normal operating range, the tapping range that a
rate within can be determined. This takes into account the input voltageof supply point bandwidth and feeder regulation, the effect of transformeridth and the effect of LDC.
the effect of variation of subtransmission voltage regulation is incorporatedlysis. In the example in Figure 3, the subtransmission voltage regulation ise required is Tap 5 to Tap 12.
of line drop compensation on the transformer is shown by shifting the outputof load current. In this example the tapping range is shown to Tap 5 down tot range.
this that by widening the bandwidth of the voltage regulator, the number and taps required reduces, and the range of output voltage range increases.andwidth is reduced, the number and range of transformer taps requiredut voltage range decreases.
20 - 10
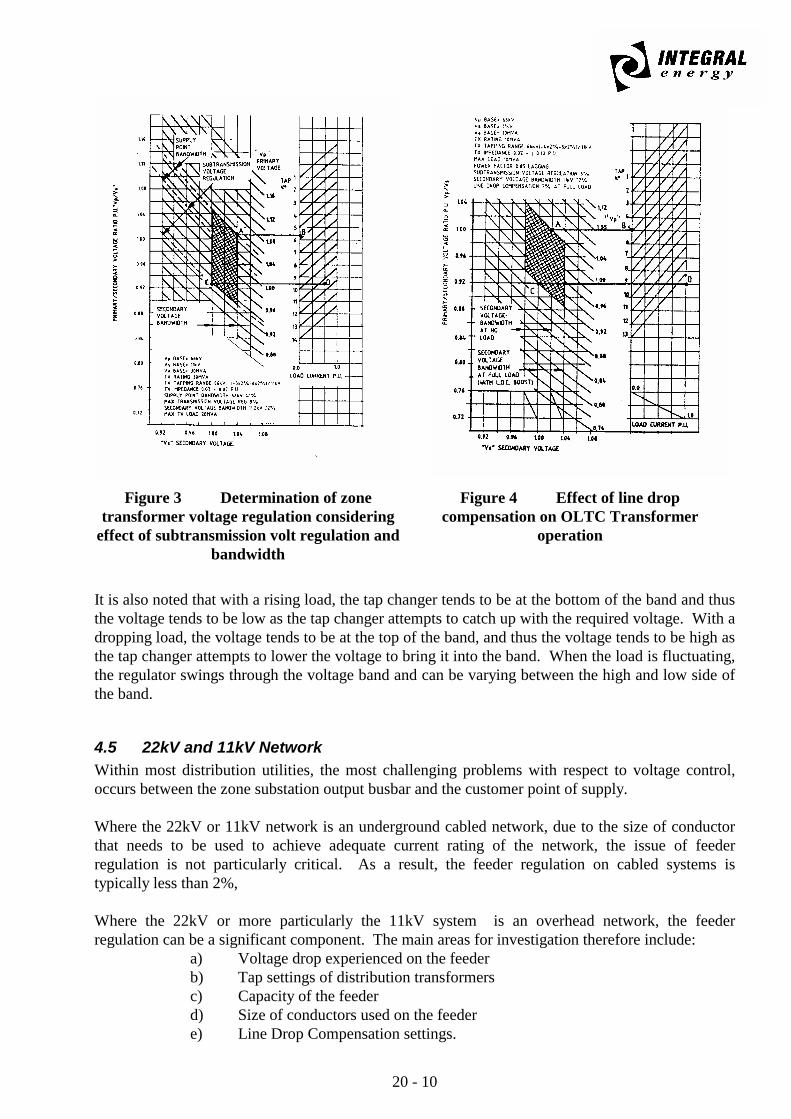
Figure 3 Determination of zonetransformer voltage regulation considering
effect of subtransmission volt regulation andbandwidth
Figure 4 Effect of line dropcompensation on OLTC Transformer
operation
It is also noted that with a rising load, the tap changer tends to be at the bottom of the band and thusthe voltage tends to be low as the tap changer attempts to catch up with the required voltage. With adropping load, the voltage tends to be at the top of the band, and thus the voltage tends to be high asthe tap changer attempts to lower the voltage to bring it into the band. When the load is fluctuating,the regulator swings through the voltage band and can be varying between the high and low side ofthe band.
4.5 22kV and 11kV NetworkWithin most distribution utilities, the most challenging problems with respect to voltage control,occurs between the zone substation output busbar and the customer point of supply.
Where the 22kV or 11kV network is an underground cabled network, due to the size of conductorthat needs to be used to achieve adequate current rating of the network, the issue of feederregulation is not particularly critical. As a result, the feeder regulation on cabled systems istypically less than 2%,
Where the 22kV or more particularly the 11kV system is an overhead network, the feederregulation can be a significant component. The main areas for investigation therefore include:
a) Voltage drop experienced on the feederb) Tap settings of distribution transformersc) Capacity of the feederd) Size of conductors used on the feedere) Line Drop Compensation settings.
20 - 11
An illustration of the voltage profile for a typical medium voltage feeder up to the customer point ofsupply is illustrated in
Figure 5 Feeder regulation profile (Ref 7)
4.6 Feeder RegulationThe equivalent circuit for a transmission line and its vector diagram are shown in the diagrambelow:
Figure 6 Equivalent Circuit
VS = Sending end voltageVR = Receiving end voltageI = Load Currentθ = Power Factor Angle of Load
Figure 7 Vector Diagram
Feeder regulation is determined by the formula shown in the following equations:
% Regulation =VR
)V - (V RS x 100 (2)
VS = √ (VR + IR cos θ + IX sin θ )2 +(IX cos θ - IR Sin θ )2 (3)
Accordingly, to determine the regulation of feeder it is necessary to know the following:
20 - 12
a) Configuration and impedance of the feederb) Load current for each sectionc) Power factor
The configuration and impedance of the network is established by reference to the GIS system andto the single line diagram.
a) ImpedanceThe impedance of each section of the network is established by determining the length ofeach section and the construction type for each section of network. The construction typeneeds to identify the conductor size, the conductor configuration (for overhead networks it isnecessary to establish the geometric mean diameter (GMD) of the construction) andconductor type. Typically, a database is usually established and the construction type islinked for each element to a table in the database.
Figure 8 Voltage regulation (at 0.9 PF)b) LoadTo establish the load current for each section of feeder, it is necessary to establish theloading on each of the substations along the feeder length and estimate the load cycle that isrelevant for the particular substation. In this regard, regular reading of MDIs mounted onthe substation and storing this data into a database provides an important source ofinformation. In the absence of MDI readings, an estimate of the load as a percentage of thesubstation rating is often used.
c) Load CycleIdentifying the nature of the substation by the type of load that is necessary in order toestimate the load for various times of the day. Substations are usually categorised as beingResidential, Commercial, Industrial or other load types. A typical load cycle is thenapportioned for each category. This load cycle could be extended to be able to simulate theload for the various seasons of the year, with particular emphasis on summer and winter asillustrated Figure 9 and Figure 10. The shift from winter peaks to summer peaks on thenetwork is resulting in the need for carrying out analysis in summer as well as winter.
0
1000
2000
3000
4000
5000
6000
7000
8000
9000
10000
0 1 2 3 4 5 6 7 8 9 10
PERCENT REGULATION
20 - 13
Figure 9 Typical Residential Winter Load Cycle
Figure 10 Typical Residential Summer Load Cycled) Feeder LoadAccumulation of the estimate of load for each substation along the feeder (taking intoaccount the estimate of load cycle) produces an estimate of the undiversified maximumdemand for the feeder. As the maximum demand on each of the substations is likely tooccur at a slightly different time, the undiversified total will be higher than the actualmaximum feeder load. Accordingly, an estimate must be carried out of the coincidencefactor for the feeder load.
Coincidence Factor (CF) =)(
1DFFactorDiversity
(4)
CF =DF1 =
cycle) load * reading (MDI totaliedUndiversifday of for time Substation Zoneat loadFeeder (5)
Typically, the coincidence factor for residential loads is in the range of 0.85 – 0.95.
e) Power FactorThe power factor for the network has a significant effect in terms of the computation ofvoltage regulation. For industrial and commercial loads, where a significant proportion ofthe load consists of some form of motor load, the power factor tends to be in the low range
TYPICAL RESIDENTIAL WINTER LOAD CURVE
0
10
20
30
40
50
60
70
80
90
100
0:00 3:00 6:00 9:00 12:00 15:00 18:00 21:00
EASTERN STANDARD TIME (HOURS)
PEAK LOAD
LIGHT LOAD 3.0=LOADPEAKLOADLIGHT
TYPICAL RESIDENTIAL SUMMER LOAD CURVE
0
10
20
30
40
50
60
70
80
90
100
0:00 3:00 6:00 9:00 12:00 15:00 18:00 21:00
EASTERN SUMMER TIME (HOURS)
PEAK LOAD
LIGHT LOAD3.0=
LOADPEAKLOADLIGHT
20 - 14
of 0.85 to 0.9. For residential load in winter, the power factor at the time of systemmaximum demand tends to be high in the range of 0.95 to 0.98. This trend is, however,being affected by the increase in proportion of air-conditioning load on the system As aresult, for networks where the maximum demand occurs in summer, the power factor is low
For the purpose of computation of voltage regulation, the typical power factor that is used is0.9. For winter, this tends to be a conservative figure and provides a “worst case” result,while for summer, it can be considered to be a realistic value.
The effect of power factor on voltage regulation is illustrated in Figure 11. For a given valueof real power (kW), the voltage regulation is affected by the actual power factor.
Figure 11 Correction of voltage regulation for Power Factor
To determine the appropriate regulation, divide the calculated regulation by the CorrectionFactor established from Figure 11.
4.7 Tap Setting of Distribution TransformersHaving established the actual regulation value for the feeder, it is necessary to establish the floatvoltage of the supply equipment and establish the tap setting for the distribution transformers on thefeeder.
As referred to above, at Integral Energy, the float voltages selected for the zone substationstransformers are typically as follows:
For the purpose of establishing the appropriate tap setting of the distribution transformer,consideration must be given to the regulation of the feeder under full load conditions and under lightload conditions. Typically, the light load condition is computed utilising a load of 25% of themaximum load.
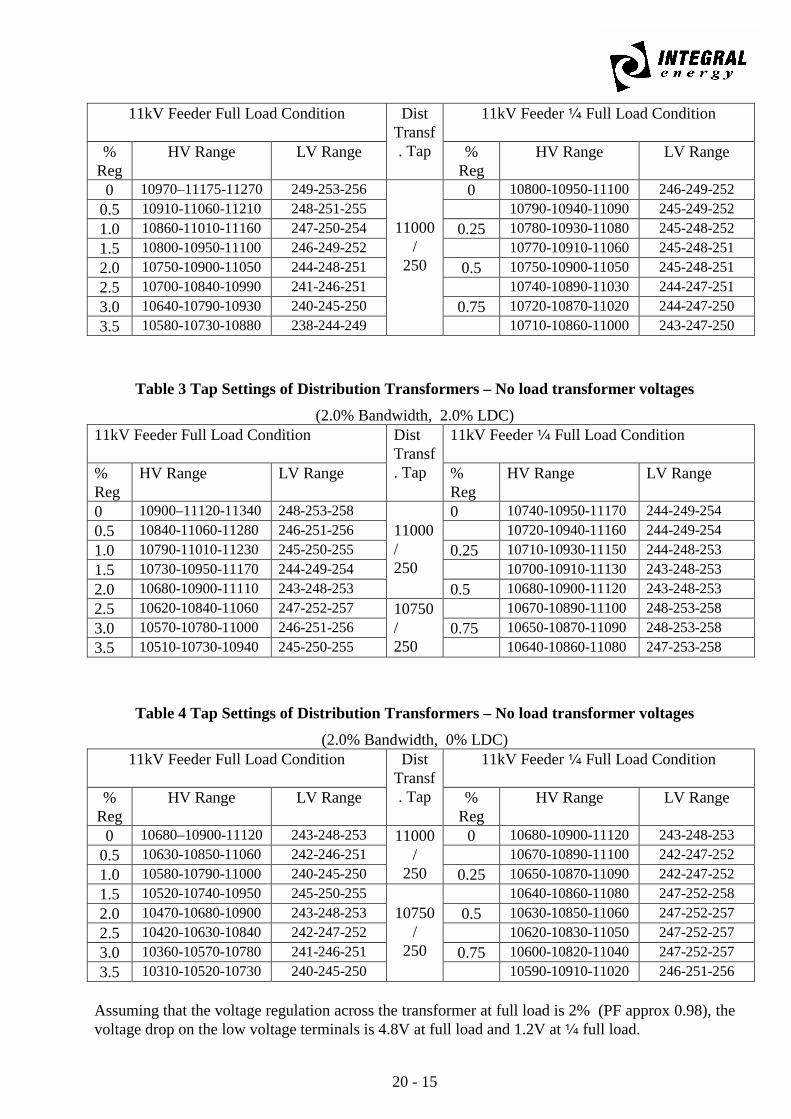
Table 2 Tap Settings of Distribution Transformers – No load transformer voltages(1.36% Bandwidth, 2.0% LDC)
0.5
0.6
0.7
0.8
0.9
1
1.1
1.2
1.3
1.4
1.5
0.5 0.55 0.6 0.65 0.7 0.75 0.8 0.85 0.9 0.95 1
POWER FACTOR
20 - 15
11kV Feeder Full Load Condition 11kV Feeder � Full Load Condition
Assuming that the voltage regulation across the transformer at full load is 2% (PF approx 0.98), thevoltage drop on the low voltage terminals is 4.8V at full load and 1.2V at � full load.
20 - 16
To select the appropriate tap setting of the distribution transformer, it is necessary to ensure that theoutput voltage under full-load and light load conditions results in an acceptable range of voltage atthe output terminals.
It will be noted that in Table 2, as the bandwidth is more than compensated by the LDC, thenominal 11000V/433V/250V tap would be selected for feeder regulations up to 3.5%. InTable 3, where the bandwidth and LDC are both at 2%, the 10750V/433V/250V tap is selectedwhen the feeder regulation is 2.5% or greater. In Table 4, where no LDC is available, the10750V/433V/250V transformer tap can be selected when the feeder regulation is only 1.0%
4.8 Low Voltage NetworkConsideration of the voltage drop associated with the low voltage network is a vital factor indetermining the voltage at the customer point of supply. It is a complete subject in itself.Accordingly, it is beyond the scope of this paper to give detailed consideration to all of the relevantissues. Reference 5 is a valuable document setting out details of the factors to consider. Thefollowing presents a summary of the key issues.
a) Voltage Drop in Low Voltage MainsThe voltage drop that occurs in low voltage mains supplying a number of customers in aparticular section is given by:
V = K x ADMD x 3N x FLD x FU x L (6)
Where K = A constant related to the impedance of the cable and PFADMD= After Diversity Maximum DemandN = Total number of customers in the section of cable considered
(total number across all 3 phases)FLD = Loss of Diversity Factor correction factorFU = Unbalance correction factorL = Length of cable section
i) ADMDThe After Diversity Maximum Demand (ADMD) is a vital parameter that determinesthe anticipated maximum demand on the substation and the loading on the lowvoltage circuit in residential areas. The ADMD is determined by computing themaximum demand of a number of substations by the number of customerconnections.
ADMD =CustomersofNumber
DemandMaximumTotal (kVA) (7)
By selection of an ADMD that is too low, voltage drops calculated will be muchsmaller than actual voltage drops and the loading both on the substation and thecable circuit can exceed design rating. By selection of and ADMD that is too high,the low voltage cable system will be over-designed and have excess capacity.
Traditionally, an ADMD of 5kVA has been used for all-electric areas and 3kVA ingas reticulated areas. Recent studies have revealed that as a result of the extensiveinstallation of air-conditioners, the nature of the residential load has changedsignificantly.
20 - 17
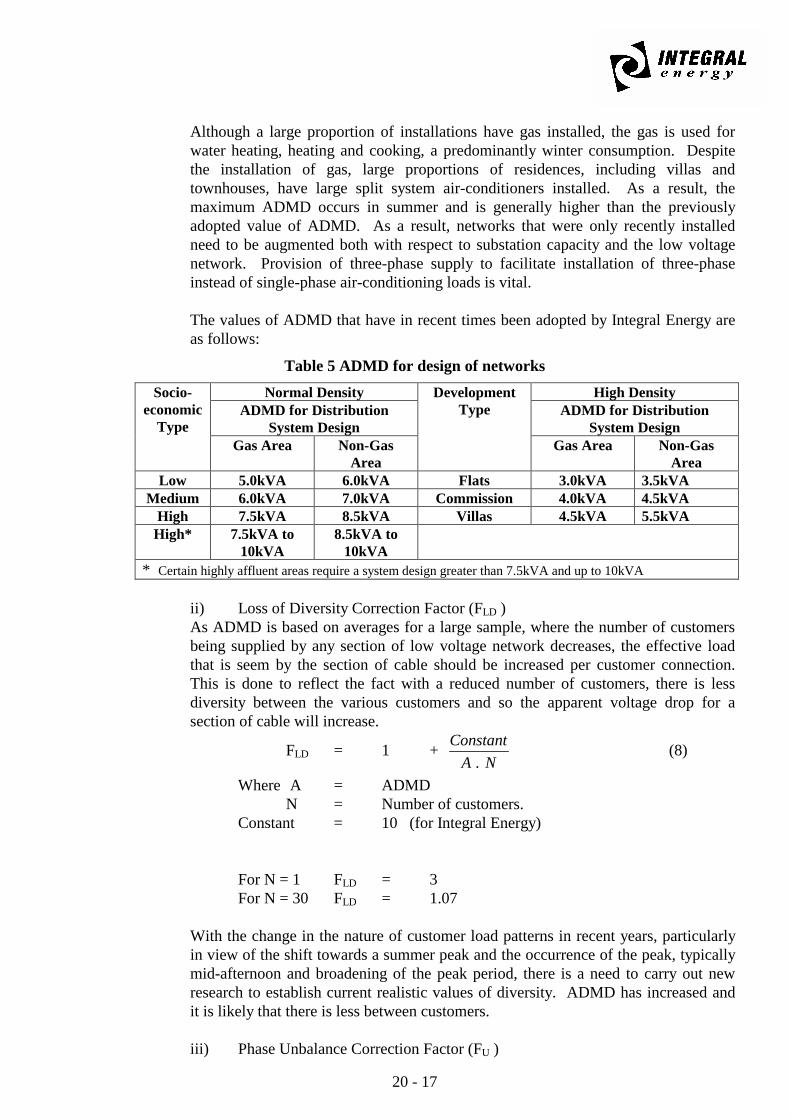
Although a large proportion of installations have gas installed, the gas is used forwater heating, heating and cooking, a predominantly winter consumption. Despitethe installation of gas, large proportions of residences, including villas andtownhouses, have large split system air-conditioners installed. As a result, themaximum ADMD occurs in summer and is generally higher than the previouslyadopted value of ADMD. As a result, networks that were only recently installedneed to be augmented both with respect to substation capacity and the low voltagenetwork. Provision of three-phase supply to facilitate installation of three-phaseinstead of single-phase air-conditioning loads is vital.
The values of ADMD that have in recent times been adopted by Integral Energy areas follows:
Table 5 ADMD for design of networksNormal Density High Density
High 7.5kVA 8.5kVA Villas 4.5kVA 5.5kVAHigh* 7.5kVA to
10kVA8.5kVA to
10kVA* Certain highly affluent areas require a system design greater than 7.5kVA and up to 10kVA
ii) Loss of Diversity Correction Factor (FLD )As ADMD is based on averages for a large sample, where the number of customersbeing supplied by any section of low voltage network decreases, the effective loadthat is seem by the section of cable should be increased per customer connection.This is done to reflect the fact with a reduced number of customers, there is lessdiversity between the various customers and so the apparent voltage drop for asection of cable will increase.
FLD = 1 + NA
tstanCon.
(8)
Where A = ADMDN = Number of customers.
Constant = 10 (for Integral Energy)
For N = 1 FLD = 3For N = 30 FLD = 1.07
With the change in the nature of customer load patterns in recent years, particularlyin view of the shift towards a summer peak and the occurrence of the peak, typicallymid-afternoon and broadening of the peak period, there is a need to carry out newresearch to establish current realistic values of diversity. ADMD has increased andit is likely that there is less between customers.
iii) Phase Unbalance Correction Factor (FU )
20 - 18
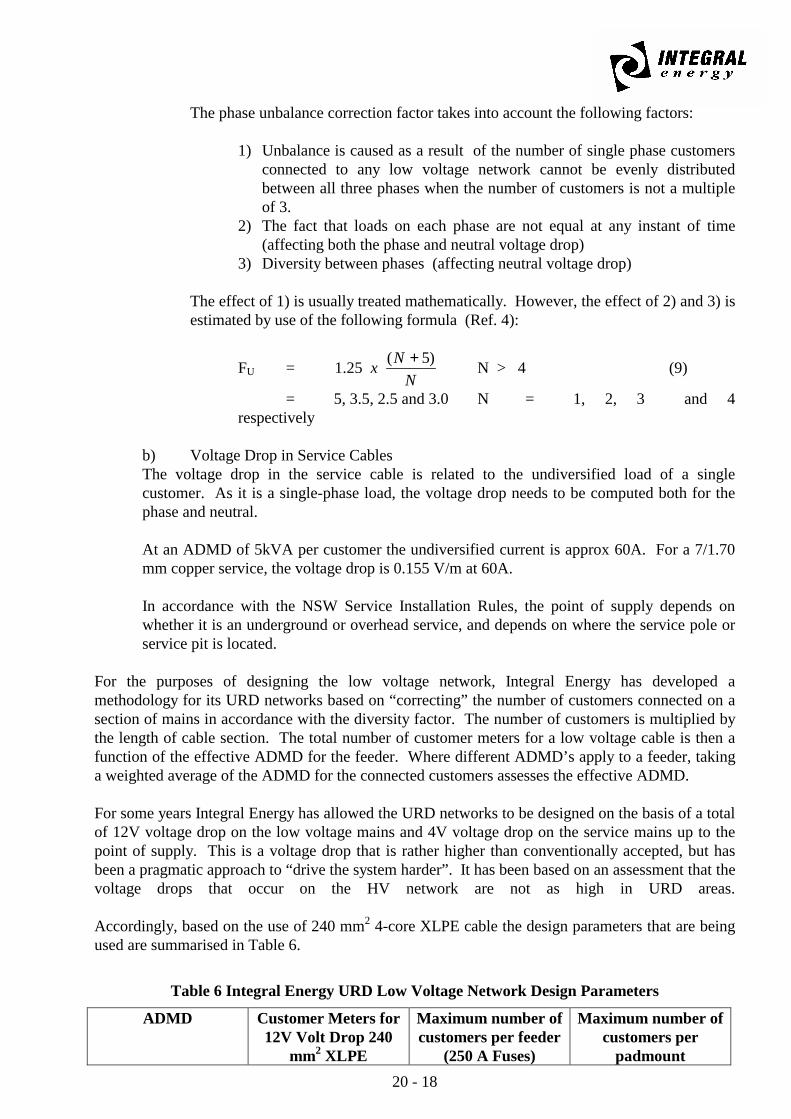
The phase unbalance correction factor takes into account the following factors:
1) Unbalance is caused as a result of the number of single phase customersconnected to any low voltage network cannot be evenly distributedbetween all three phases when the number of customers is not a multipleof 3.
2) The fact that loads on each phase are not equal at any instant of time(affecting both the phase and neutral voltage drop)
3) Diversity between phases (affecting neutral voltage drop)
The effect of 1) is usually treated mathematically. However, the effect of 2) and 3) isestimated by use of the following formula (Ref. 4):
FU =N
Nx )5(25.1 + N > 4 (9)
= 5, 3.5, 2.5 and 3.0 N = 1, 2, 3 and 4respectively
b) Voltage Drop in Service CablesThe voltage drop in the service cable is related to the undiversified load of a singlecustomer. As it is a single-phase load, the voltage drop needs to be computed both for thephase and neutral.
At an ADMD of 5kVA per customer the undiversified current is approx 60A. For a 7/1.70mm copper service, the voltage drop is 0.155 V/m at 60A.
In accordance with the NSW Service Installation Rules, the point of supply depends onwhether it is an underground or overhead service, and depends on where the service pole orservice pit is located.
For the purposes of designing the low voltage network, Integral Energy has developed amethodology for its URD networks based on “correcting” the number of customers connected on asection of mains in accordance with the diversity factor. The number of customers is multiplied bythe length of cable section. The total number of customer meters for a low voltage cable is then afunction of the effective ADMD for the feeder. Where different ADMD’s apply to a feeder, takinga weighted average of the ADMD for the connected customers assesses the effective ADMD.
For some years Integral Energy has allowed the URD networks to be designed on the basis of a totalof 12V voltage drop on the low voltage mains and 4V voltage drop on the service mains up to thepoint of supply. This is a voltage drop that is rather higher than conventionally accepted, but hasbeen a pragmatic approach to “drive the system harder”. It has been based on an assessment that thevoltage drops that occur on the HV network are not as high in URD areas.
Accordingly, based on the use of 240 mm2 4-core XLPE cable the design parameters that are beingused are summarised in Table 6.
Table 6 Integral Energy URD Low Voltage Network Design Parameters
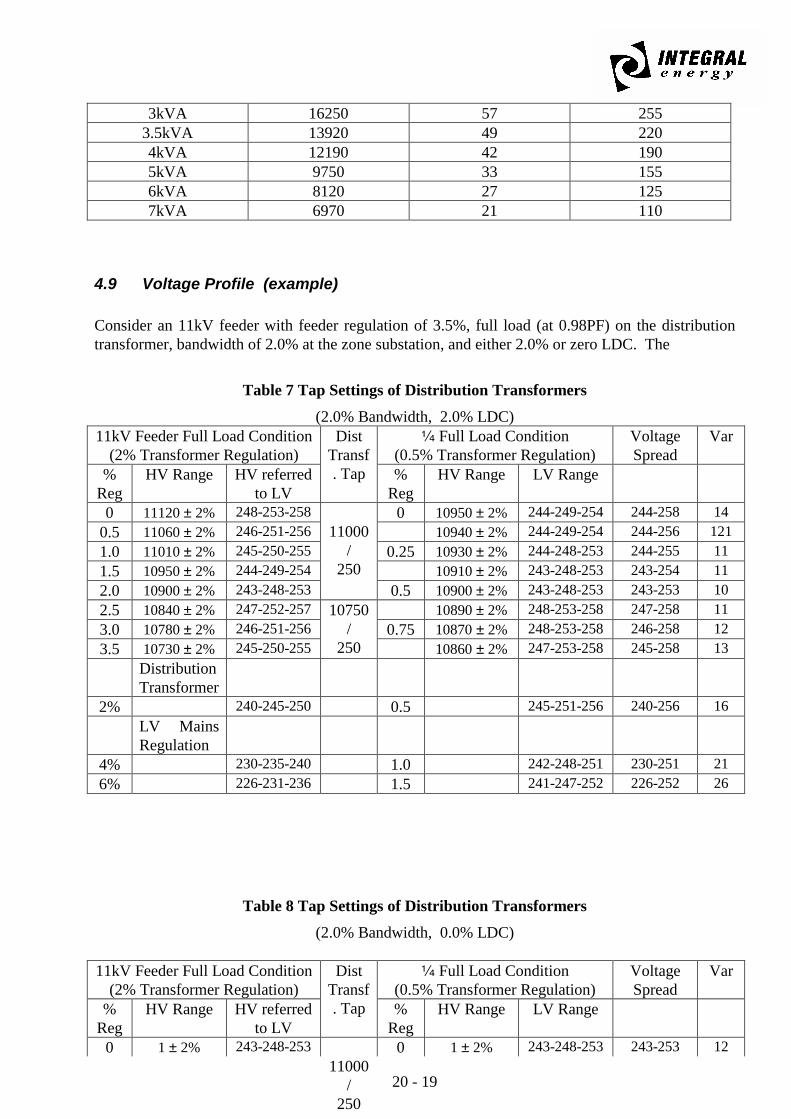
Consider an 11kV feeder with feeder regulation of 3.5%, full load (at 0.98PF) on the distributiontransformer, bandwidth of 2.0% at the zone substation, and either 2.0% or zero LDC. The
Table 7 Tap Settings of Distribution Transformers(2.0% Bandwidth, 2.0% LDC)
11kV Feeder Full Load Condition(2% Transformer Regulation)
� Full Load Condition(0.5% Transformer Regulation)
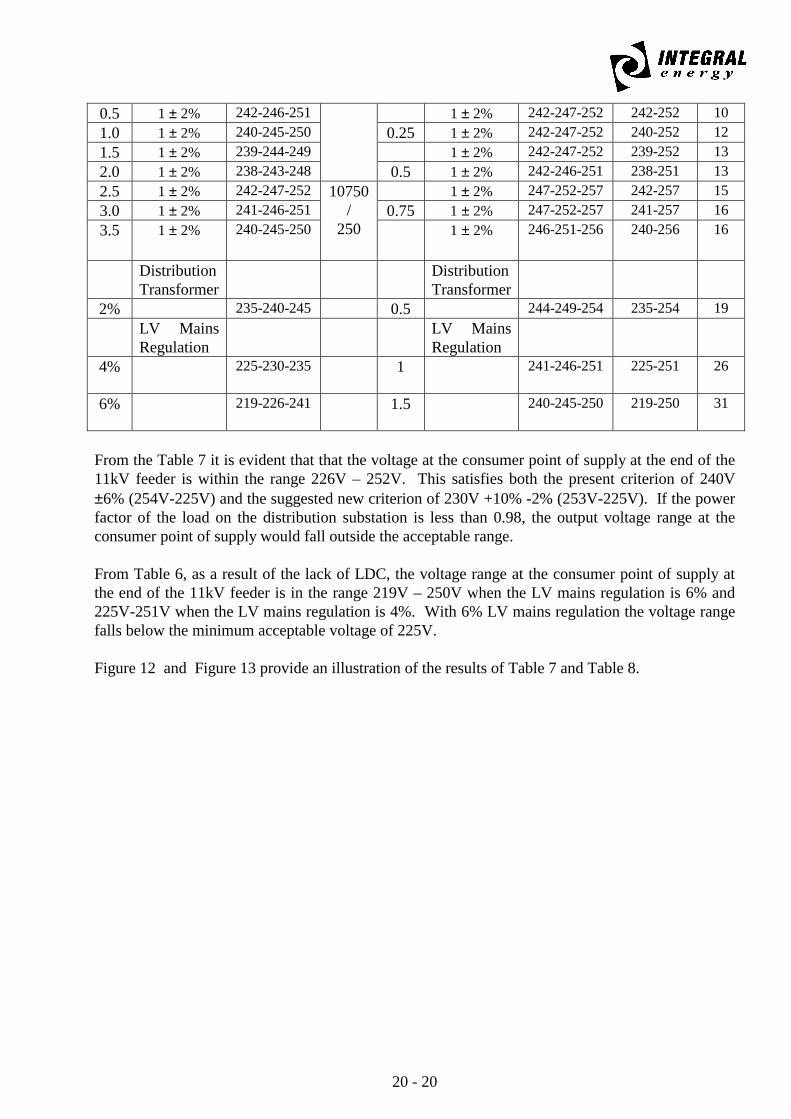
From the Table 7 it is evident that that the voltage at the consumer point of supply at the end of the11kV feeder is within the range 226V – 252V. This satisfies both the present criterion of 240V±6% (254V-225V) and the suggested new criterion of 230V +10% -2% (253V-225V). If the powerfactor of the load on the distribution substation is less than 0.98, the output voltage range at theconsumer point of supply would fall outside the acceptable range.
From Table 6, as a result of the lack of LDC, the voltage range at the consumer point of supply atthe end of the 11kV feeder is in the range 219V – 250V when the LV mains regulation is 6% and225V-251V when the LV mains regulation is 4%. With 6% LV mains regulation the voltage rangefalls below the minimum acceptable voltage of 225V.
Figure 12 and Figure 13 provide an illustration of the results of Table 7 and Table 8.
20 - 21
Figure 12 Voltage Profile without LDC
Figure 13 Voltage Profile with LDC
5 AS 60038 – 2000 Standard Voltages
Consideration of the impact of the introduction of the new Australian Standard on StandardVoltages is required by the electricity industry. The area of significance is with respect to the lowvoltage standard of 230V/400V. Adoption of this standard now brings Australia into line withIEC60038:1983 by utilising the guidance within the IEC standard that countries that have240V/415V systems should bring the voltage within the range 230V/400V +10%, -6%.
Australia’s standard has, however, deviated from the IEC standard with respect to the utilisationvoltage range by staying with the long-standing requirements of AS3000 that the voltage drop
VOLTAGE PROFILE (referred to LV mains voltage)10.9kV Fload, 2% Bandwidth, 0% LDC
218
223
228
233
238
243
248
253
258
263
DISTANCE ALONG FEEDER
225V = 230V- 2%
253V = 230V + 10%
10V
19V
16V15V
13V
31V
HV Feeder RegulationDist Tx Tap
Change
DistributionTransformer
Low VoltageMains
VOLTAGE PROFILE (referred to LV mains voltage) 10.9kV Float, 2% Bandwidth, 2% LDC
218
223
228
233
238
243
248
253
258
263
DISTANCE ALONG FEEDER
253 V = 230 + 10%
225V = 230 - 2%
14V
16V
13V11V
10V
23V
DistributionTransformer
Low Voltage Mains
HV Feeder Regulation Dist Tx Tap
20 - 22
within the consumer’s installations is limited to 5% rather than 4% as required by IEC 60038:1983.In reality, until such time that there is any move to reduce the acceptable voltage band from ±10% to±6% this is not an issue with respect to products designed to comply with the 230V±10% standard.This, is unlikely to be an issue for the medium term.
The biggest issue is for product manufacturers. Requiring equipment to comply with productspecifications through the full range of 230V ±10%, less a further (according to IEC) 4% for theconsumer’s installation, means that product specifications need to recognise that the utilisationvoltage for equipment covers a very wide range. This is both technically difficult to achieve andresults in higher costs. The benefit, however, is that the same product can be used almostuniversally internationally. Manufacturers will continue to press to seek to narrow the voltagerange. However, the trend will be that the optimum performance of the equipment will tendtowards the nominal voltage (230V).
Australia has been slow in adopting the IEC standard as there are clearly technical and financialdisadvantages in reducing the voltage of the low voltage network. However, the reality is that allnew product developments worldwide utilise the now internationally accepted 230V standard andadoption of the standard within Australia is timely.
As evidenced from the description above, Australia can continue to utilise in effect its existingstandard voltage range of 240 ±6% by renaming the standard voltage range supplied to 230V +10%,-2%. The maximum voltage is in essence the only change through a reduction from 254V to 253V.
Should at any stage in the future there be a move to try to narrow the voltage band from ±10% to±6%, there would be major implications for the electricity industry. It would then be necessary totake some action to lower the nominal voltage from 240V to 230V. It is unlikely that this will occuras it would have an impact on the full range of existing equipment manufactured in accordance with240V criteria.
The “simplest” way to implement a reduction in the voltage would be to reduce the float voltage onthe 11kV / 22kV network. However, this has the potential for a large economic loss due theincreased losses both on the low voltage and the 11kV/22kV networks.
An alternative approach is to have “buck” voltage taps on the distribution transformers in additionto the normal “boost” voltage ratios. This would facilitate any future reduction in the low voltagenetwork without the need for a corresponding reduction on the distribution network.
6 CONCLUSIONAn overview has been provided of the issues associated with voltage control on the electricitydistribution network. These are basic in determining the performance of the network and representwell understood practices by the experienced distribution engineer. Nevertheless, it is timely toreflect on the issues, particular in view of the issue of the new Australian Standards AS 60038 –2000 which defines the standard voltage as 230V/400V.
The paper demonstrates that adopting a standard low voltage network voltage of 230V/400V +10%,-2%, the change in the standard voltage can be accommodated without any real change in practices.
20 - 23
7 REFERENCES
1. L A Chappell “The Basis for Control of Distribution Voltages in The Prospect CountyCouncil” Prospect County Council 2nd edition, 1974
2. Australian Standard AS 60038 – 2000 “Standard Voltages”
3. EN 50160 – 1994 European Standard “Voltage characteristics of electricity supplied by thedistribution systems” published by the European Committee for ElectrotechnicalStandardization (CENELEC).
4. Prospect County Council URD Review Committee “URD Review April 1989”
5. M A Vinicombe “Notes on the Design of Residential Distribution Network”, ESEA ofNSW Annual Conference 1972
6. A. Baitch and R.A. Barr “A Tapping Range and Voltage Level Analysis Chart for TapChanging Transformers” IEEE Transactions on Power Apparatus and Systems, Vol PAS-104 No 11 Nov 1985 pp 3269 – 3277
7 E. Lakervi and E.J.Holmes “Electricity Distribution Network Design” 2nd Edition1995 IEEPower Engineering Series 21 ISBN 0 86341 209 9
8 R. Dugan, M. McGranaghan H. Beaty “Electrical Power Systems Quality” McGraw Hill1996 ISBN 0-07-018031-8


![Coordinated voltage control of a decoupled three-phase on-load … · methods include: 1) voltage control using reactive power generation from PV inverters [7,8]; 2) voltage control](https://static.documents.pub/doc/80x56/5f8a4881c6b2883c7c2e37e3/coordinated-voltage-control-of-a-decoupled-three-phase-on-load-methods-include.jpg)


