Voltage Smoothing: Characterizing and Mitigating Voltage Noise in Production Processors via Software-Guided Thread Scheduling Vijay Janapa Reddi †‡ , Svilen Kanev, Wonyoung Kim, Simone Campanoni, Michael D. Smith, Gu-Yeon Wei, David Brooks Advanced Micro Devices (AMD) Research Labs † , Harvard University [email protected], {skanev, wonyoung, xan, smith, guyeon, dbrooks}@eecs.harvard.edu Abstract—Parameter variations have become a dominant chal- lenge in microprocessor design. Voltage variation is especially daunting because it happens so rapidly. We measure and char- acterize voltage variation in a running Intel R Core TM 2 Duo processor. By sensing on-die voltage as the processor runs single- threaded, multi-threaded, and multi-program workloads, we determine the average supply voltage swing of the processor to be only 4%, far from the processor’s 14% worst-case operating voltage margin. While such large margins guarantee correctness, they penalize performance and power efficiency. We investigate and quantify the benefits of designing a processor for typical-case (rather than worst-case) voltage swings, assuming that a fail-safe mechanism protects it from infrequently occurring large voltage fluctuations. With today’s processors, such resilient designs could yield 15% to 20% performance improvements. But we also show that in future systems, these gains could be lost as increasing voltage swings intensify the frequency of fail-safe recoveries. After characterizing microarchitectural activity that leads to voltage swings within multi-core systems, we show that a voltage- noise-aware thread scheduler in software can co-schedule phases of different programs to mitigate error recovery overheads in future resilient processor designs. Keywords-dI/dt, inductive noise, error resiliency, voltage droop, hw/sw co-design, thread scheduling, hardware reliability I. I NTRODUCTION As device feature sizes scale, microprocessor operation under strict power and performance constraints is becoming challenging in the presence of parameter variations. Process, thermal, and voltage variations require the processor to operate with large operating margins (or guardbands) to guarantee correctness under corner-case conditions that rarely occur. This level of robustness comes at the cost of lower processor perfor- mance and power efficiency. In the era of power-constrained processor design, supply voltage variation is emerging as a dominant problem as designers aggressively use clock gating techniques to reduce energy consumption. Non-zero impedance in the power delivery network combined with sudden current fluctuations due to clock gating, along with workload activity changes, lead to large and hard-to-predict changes in supply voltage at run time. Voltage fluctuations beyond the operating margin can lead to timing violations. If the processor must always avoid such voltage emergencies, its operating margin must be large enough to tolerate the absolute worst-case voltage swing. Today’s production processors use operating voltage mar- gins that are nearly 20% of nominal supply voltage [1], but ‡ This work was done while V. J. Reddi was a student at Harvard. Fig. 1: Voltage noise is increasing in future generations. 50 40 30 20 10 0 40 50 60 70 80 90 100 Margin (%) Peak Frequency (%) 45nm (Vdd=1.0V) 32nm (Vdd=0.9V) 22nm (Vdd=0.8V) 16nm (Vdd=0.7V) Fig. 2: Worst-case margins needed for noise are inefficient. trends indicate that margins will need to grow in order to accommodate worsening peak-to-peak voltage swings. Both processor performance and power efficiency will suffer to an even greater extent than in today’s systems. Fig. 1 shows the worst-case peak-to-peak swing in future generations relative to today’s 45nm process technology. 1 Voltage swing doubles by the 16nm technology node. Fig. 2 summarizes the performance degradation associated with margins, showing that a 20% volt- age margin in today’s 45nm node translates to ∼25% loss in peak clock frequency. 2 A doubling in voltage swing by 16nm implies more than 50% loss in peak clock frequency, owing to increasing circuit sensitivity at lower voltages. Therefore, worst-case operating voltage margins are not sustainable in the long run. Industry recognizes these trends and is moving towards resilient processor designs. Rather than setting the operating voltage margin according to the extreme activity of a power virus, designers relax the operating voltage margin to a more typical level of voltage swing. emergency, error-detection and error-recovery circuits dynamically detect and correct timing violations. In this way, designers use aggressive margins to maximize processor performance and power efficiency. Bowman et al. show that removing a 10% operating voltage margin leads to a 15% improvement in clock frequency [5]. Abundant recent work in architecture [6]–[10] and more recent circuit prototyping efforts [5], [11], [12] reflect this impending paradigm shift in architecture design. As resilient processor architecture designs are still in their infancy, this paper focuses on understanding the benefits 1 Based on simulations of a Pentium 4 power delivery package [2], assuming Vdd gradually scales according to ITRS projections from 1V in 45nm to 0.6V in 11nm [3]. To study package response, current stimulus goes from 50A-100A in 45nm. Subsequent stimuli in newer generations is inversely proportional to Vdd for the same power budget. 2 Based on detailed circuit-level simulations of an 11-stage ring oscillator that consists of fanout-of-4 inverters from PTM [4] technology nodes.
Transcript
Voltage Smoothing: Characterizing and Mitigating Voltage Noise inProduction Processors via Software-Guided Thread Scheduling
Vijay Janapa Reddi†‡, Svilen Kanev, Wonyoung Kim, Simone Campanoni, Michael D. Smith, Gu-Yeon Wei, David BrooksAdvanced Micro Devices (AMD) Research Labs†, Harvard University
[email protected], {skanev, wonyoung, xan, smith, guyeon, dbrooks}@eecs.harvard.edu
As device feature sizes scale, microprocessor operationunder strict power and performance constraints is becomingchallenging in the presence of parameter variations. Process,thermal, and voltage variations require the processor to operatewith large operating margins (or guardbands) to guaranteecorrectness under corner-case conditions that rarely occur. Thislevel of robustness comes at the cost of lower processor perfor-mance and power efficiency. In the era of power-constrainedprocessor design, supply voltage variation is emerging asa dominant problem as designers aggressively use clockgating techniques to reduce energy consumption. Non-zeroimpedance in the power delivery network combined withsudden current fluctuations due to clock gating, along withworkload activity changes, lead to large and hard-to-predictchanges in supply voltage at run time. Voltage fluctuationsbeyond the operating margin can lead to timing violations. Ifthe processor must always avoid such voltage emergencies, itsoperating margin must be large enough to tolerate the absoluteworst-case voltage swing.
Today’s production processors use operating voltage mar-gins that are nearly 20% of nominal supply voltage [1], but
‡ This work was done while V. J. Reddi was a student at Harvard.
3.0
2.5
2.0
1.5
1.0
Pro
jecte
d V
olt
age S
win
gs
Rela
tive t
o 1
V S
upply
Volt
age
45nm 32nm 22nm 16nm 11nm
Process Technology Nodes
Fig. 1: Voltage noise is increasingin future generations.
5040302010040
50
60
70
80
90
100
Margin (%)
Pe
ak F
req
ue
ncy (
%)
45nm (Vdd=1.0V)
32nm (Vdd=0.9V)
22nm (Vdd=0.8V)
16nm (Vdd=0.7V)
Fig. 2: Worst-case marginsneeded for noise are inefficient.
trends indicate that margins will need to grow in order toaccommodate worsening peak-to-peak voltage swings. Bothprocessor performance and power efficiency will suffer to aneven greater extent than in today’s systems. Fig. 1 shows theworst-case peak-to-peak swing in future generations relative totoday’s 45nm process technology.1 Voltage swing doubles bythe 16nm technology node. Fig. 2 summarizes the performancedegradation associated with margins, showing that a 20% volt-age margin in today’s 45nm node translates to ∼25% loss inpeak clock frequency.2 A doubling in voltage swing by 16nmimplies more than 50% loss in peak clock frequency, owingto increasing circuit sensitivity at lower voltages. Therefore,worst-case operating voltage margins are not sustainable in thelong run.
Industry recognizes these trends and is moving towardsresilient processor designs. Rather than setting the operatingvoltage margin according to the extreme activity of a powervirus, designers relax the operating voltage margin to a moretypical level of voltage swing. emergency, error-detection anderror-recovery circuits dynamically detect and correct timingviolations. In this way, designers use aggressive marginsto maximize processor performance and power efficiency.Bowman et al. show that removing a 10% operating voltagemargin leads to a 15% improvement in clock frequency [5].Abundant recent work in architecture [6]–[10] and more recentcircuit prototyping efforts [5], [11], [12] reflect this impendingparadigm shift in architecture design.
As resilient processor architecture designs are still in theirinfancy, this paper focuses on understanding the benefits
1Based on simulations of a Pentium 4 power delivery package [2], assumingVdd gradually scales according to ITRS projections from 1V in 45nm to0.6V in 11nm [3]. To study package response, current stimulus goes from50A-100A in 45nm. Subsequent stimuli in newer generations is inverselyproportional to Vdd for the same power budget.
2Based on detailed circuit-level simulations of an 11-stage ring oscillator thatconsists of fanout-of-4 inverters from PTM [4] technology nodes.
and caveats of typical-case design. Using only off-the-shelfcomponents to sense on-die silicon voltage fluctuations of anCoreTM2 Duo processor, we perform full-length programanalysis, characterizing voltage noise in this production pro-cessor. Our findings indicate that aggressive margins couldenable performance gains from 15% up to 20%. However,these gains are sensitive to three critical factors: the costof error-recovery, aggressive margin settings, and programworkload characteristics. Improperly setting the first two ma-chine parameters leads to degraded workload performance,sometimes even beyond the baseline conservative worst-casedesign. We characterize the design space to illuminate thetradeoffs.
Future resilient processor microarchitectures will need veryfine-grained error-recovery logic to maintain the benefits ofresiliency. Building such recovery schemes will require intru-sive changes to traditional architectural structures that add on-chip die area and cost overheads, in addition to complicatingdesign, testing or validation. In order to alleviate this com-plexity, we propose voltage-noise-aware thread scheduling atthe software layer, which allows designers to leverage morecoarse-grained, cost-effective recovery schemes. The softwareenables this by reducing error-recovery rates, while assumingthe hardware provides a fail-stop. To study the efficacy ofthread scheduling in the anticipation of large voltage swings,we project future voltage noise trends by reducing decouplingcapacitance of an existing processor.
Developing a software solution for mitigating voltage noisebegins with understanding activity within the processor thatleads to voltage swings. Studying voltage noise in a realprocessor enables some observations not revealed by publishedsimulation efforts. Using microbenchmarks that stimulate theprocessor with highly specific events such as TLB misses andbranch mispredictions, we examine and quantify the effect ofvarious stall events on voltage noise. For instance, the pipelineflush caused by a single branch misprediction causes a voltageswing 1.7 times larger than that of an idling machine.
Multi-core execution leads to voltage noise interference.The same processor experiences a 42% increase in peak-to-peak swings when both of its cores are active and runningthe same microbenchmark. Therefore, either margins will needto be greater in multi-core systems when multiple cores areactive simultaneously, or the system will need to tolerate morefrequent error recoveries. However, effectively co-schedulingnoise compatible events (or threads) together across cores candampen peak-to-peak swings. Based on our understandingof the relationship between stall events and voltage swings,we construct a metric called stall ratio that enables thesoftware layer to infer noise activity using existing hardwareperformance counters. It also explains the existence of voltagenoise phases that are like program execution phases. They arerecurring patterns of voltage droop and overshoot activity inresponse to changing microarchitectural behavior.
In summary, this paper (1) characterizes single-core andmulti-core noise activity on a real chip, (2) presents a rigorousstudy that identifies the benefits of a resilient microarchitecture
design for voltage noise, and (3) provides a mechanism bywhich to dampen voltage noise in future processor generations.The underlying mechanisms that enable these contributions arethe following:• Measurement and Extrapolation. By tapping into two
unused package pins that sense on-die silicon voltage,we demonstrate and validate the ability to study processorvoltage noise activity under real execution scenarios unin-trusively. Moreover, by breaking off package capacitors,we amplify the magnitude of voltage swings in theproduction processor to extrapolate and study voltagenoise in future systems.
• Characterization of Voltage Noise. Combining the noisemeasurement setup with hand-crafted microbenchmarksand hardware performance counters, we study microar-chitectural activity within the processor that leads to largevoltage swings.
• Mitigating Voltage Noise via Software-Guided ThreadScheduling. Taking advantage of voltage noise phases,we propose, investigate, and demonstrate the benefits ofa noise-aware thread scheduler for smoothing out voltagenoise in multi-core chips. Oracle-based simulation resultsof thread scheduling reveal that software alleviates errorrecovery penalties in future resilient architecture designs.
Sec. II explains how we sense on-die voltage in a productionprocessor in as it is operating in a regular environment. Weuse this setup to study resilient architecture design undertypical-case conditions in Sec. III. The challenges we identifylead us towards an understanding of how activity withinthe microprocessor causes voltage to fluctuate. That in turnmotivates us to evaluate thread scheduling in Sec. IV as ameans of dampening voltage noise in multi-core systems.Finally, we conclude the paper with our remarks in Sec. V.
II. MEASUREMENT AND EXTRAPOLATION
We introduce a new methodology to measure voltage fluc-tuations in a production processor unintrusively. We explainhow we sense the voltage using only off-the-shelf components,rather than relying on specialized equipment. We validate ourexperimental setup by re-constructing the impedance profile ofthe system and comparing it with data from Intel [13], [14],as well as past literature. Using the same setup, we describea new means of extrapolating voltage noise in future systemsby removing package capacitors from a working chip. Finally,we show how to determine the worst-case operating marginby undervolting the processor.
A. Using Off-the-Shelf Components
Previous descriptions of voltage swings have been doneprimarily by using either custom voltage transient test (VTT)tool kits [13], [15] or simulation [2], [8], [16]–[18]. Theseapproaches have severe limitations that prevent us from ob-serving the voltage noise characteristics of a real processoras it is running full programs and operating under productionsettings. VTT tools replace both the processor and its encom-passing package for platform validation purposes. Such test
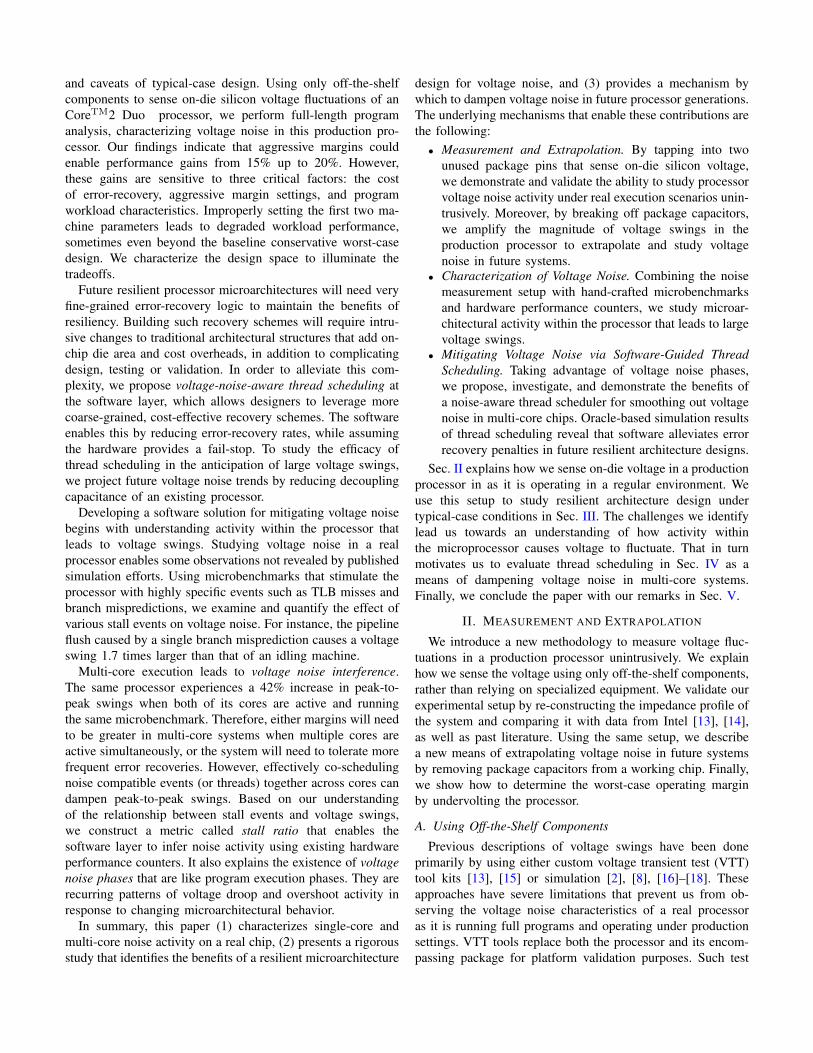
(a) Connecting to on-die voltagepins via a low impedance path us-ing V CCsense and V SSsense.
(b) Sensing voltage using an Infini-iMax 1.5GHz 1130A differentialprobe that has ultra low loading.
(c) Measuring sensed voltageusing an Agilent DSA91304AInfiniium oscilloscope.
(d) Gathering oscilloscope datausing an external system thatconnects over the network.
Fig. 3: Measurement setup to sense and measure voltage fluctuations within the processor at execution time.
harnesses enable only limited characterization of voltage noisephenomena, like resonance, under manual external currentstimuli. They require custom hardware that is not publiclyavailable. Since the tools replace the processor, it is impossibleto correlate program execution activity to voltage noise onthe system. Simulation efforts overcome this limitation byintegrating processor package models [19]–[21] with microar-chitecture and power consumption models. Simulation hasbeen the primary vehicle for voltage noise research over thepast several years. However, analysis via simulation suffersfrom constraints like the length of program execution one canstudy, or the extent to which the models are representative ofreal processors. Moreover, integrated simulation efforts haveonly focused on single core execution models. In today’smulti-core era, it is important to characterize the effect ofinteractions across cores that lead to voltage noise.
Methodology. We unintrusively sense voltage near thesilicon through isolated low impedance processor pin connec-tions. The processor package exposes two pins for processorpower and ground, as V CCsense and V SSsense, respectively.These pins typically exist for validation reasons, allowingdesigners to sense and test on-die voltage during controlledvoltage transitions, such as dynamic voltage and frequencyscaling for thermal and power management [22].
Fig. 3 illustrates how we connect, sense, measure and gatherdata from these pins, going from (a) through (d) in that order.To ensure minimal or no measurement error and to maintainhigh signal fidelity, we use a InfiniiMax 1.5GHz 1130A
50
40
30
20
10
0
Impedance (
Rela
tive t
o 1
MH
z)
12 4 6
102 4 6
1002 4 6
Frequency (MHz)
10
5
0
1 10
Scaled to compare with
Core2Duo impedance data
(a) Measured impedance. (b) Intel impedance data [14].
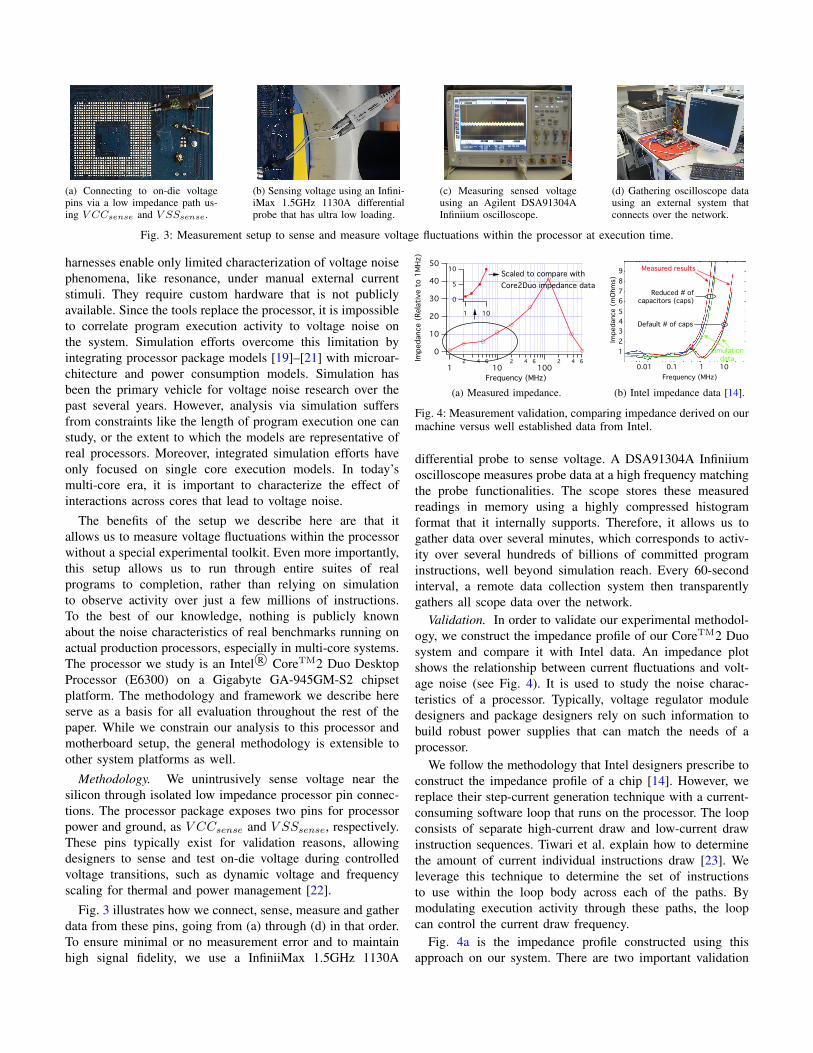
Fig. 4: Measurement validation, comparing impedance derived on ourmachine versus well established data from Intel.
differential probe to sense voltage. A DSA91304A Infiniiumoscilloscope measures probe data at a high frequency matchingthe probe functionalities. The scope stores these measuredreadings in memory using a highly compressed histogramformat that it internally supports. Therefore, it allows us togather data over several minutes, which corresponds to activ-ity over several hundreds of billions of committed programinstructions, well beyond simulation reach. Every 60-secondinterval, a remote data collection system then transparentlygathers all scope data over the network.
Validation. In order to validate our experimental methodol-ogy, we construct the impedance profile of our CoreTM2 Duosystem and compare it with Intel data. An impedance plotshows the relationship between current fluctuations and volt-age noise (see Fig. 4). It is used to study the noise charac-teristics of a processor. Typically, voltage regulator moduledesigners and package designers rely on such information tobuild robust power supplies that can match the needs of aprocessor.
We follow the methodology that Intel designers prescribe toconstruct the impedance profile of a chip [14]. However, wereplace their step-current generation technique with a current-consuming software loop that runs on the processor. The loopconsists of separate high-current draw and low-current drawinstruction sequences. Tiwari et al. explain how to determinethe amount of current individual instructions draw [23]. Weleverage this technique to determine the set of instructionsto use within the loop body across each of the paths. Bymodulating execution activity through these paths, the loopcan control the current draw frequency.
Fig. 4a is the impedance profile constructed using thisapproach on our system. There are two important validation
Fig. 5: (a)-(f) Land side of a Core2DuoTM processor, showing its package capacitors as we incrementally remove them to extrapolate voltagenoise. (g)-(l) Capacitor values and the manner in which each chip is altered; white boxes with a cross correspond to removed capacitors.(m)-(r) Voltage droop response to the reset signal.
points to observe. First, impedance peaks at around the res-onance frequency of 100MHz to 200MHz, which matches alarge body of prior work describing typical power delivery net-work characteristics [1], [2], [8], [24], [25]. Second, the smallgraph embedded within Fig. 4a corresponds appropriately topreviously published Intel data [13], [14]. Between 1MHzand 10MHz, Measured results for the Default # of caps in Fig. 4bclosely correspond to our results within the scaled graph. Withthis we conclude the validation of our experimental setup andutilize it for all other measurements.
B. Studying Future Systems
Voltage swings are growing in future processor generations.To extrapolate and study this effect on resilient architecturedesigns, we amplify voltage noise in the production processorby reducing package capacitance. As a cautionary note to thereader, the manner in which we remove package capacitancedoes not translate to an absolute representation of what voltagenoise will look like in future nodes. It is a gross estimate.There may be non-linear effects to consider. Nevertheless, thistechnique suffices as a heuristic that resembles the simulation-based trend line in Fig. 1. This method suffices to approx-imately study the effects of voltage noise in future systemsacross a diverse range of workloads and observe full programcharacteristics using a real processor.
Basis. Designers ship processors with on-chip and off-chip decoupling capacitance to dampen peak-to-peak voltageswings by reducing impedance of the power delivery network.Off-chip decoupling capacitors are externally visible on the
land side of a packaged processor (see Fig. 5a). Since voltageis the product of current and impedance, for a given currentstimulus at a particular frequency, the magnitude of voltageswings will be smaller with smaller overall impedance. Aspackage capacitance decreases, impedance increases, causingmuch larger peak-to-peak voltage swings within the processorfor the same magnitude of activity fluctuations.
Fig. 4b quantifies this relationship between package capac-itance and impedance. The system experiences much largerimpedance across the frequency range with fewer capacitors.See the lines corresponding to Reduced # of capacitors (caps) inthe figure. The same system has much smaller impedancewith more capacitors (see Default # of caps). At 1MHz, thepeak impedance is only 0.5mOhms in a system thatis well damped, whereas it is 5 times as much underReduced # of capacitors (caps).
Decap Removal. By removing decoupling capacitors (or“decaps”), we create a range of five new processors (shown inFigs. 5b-5f) with decreasing package capacitance. We identifythe successive processors using a subscript following the word“Proc” that describes the amount of package capacitance leftbehind after decap removal. For instance, Proc100 retainsall its original capacitors, while Proc3 retains only 3% ofits original package capacitance. After decap removal, weverify the operational stability of the processors by subjectingeach one to an aggressive run-time test using CPUBurn [26].This program stresses the processor’s execution units whilecontinuously monitoring execution for errors.
The processor package contains different capacitive ele-
ments. After decap removal, we determined their individualvalues, which are shown in Fig. 5g. Identical values share acolor. White boxes in Figs. 5h-5l illustrate the manner in whichwe altered the processor to lower capacitance. For instance, toeliminate 50% of all capacitors, we remove half of each kindof capacitor.
Effect. To determine the impact of decap removal onvoltage swings, we stimulate the processor with a reset signal.Resetting, or turning off and on, the processor, causes a verysharp, large and sudden change in current activity. We resetthe processor as it is idling, or running the idle loop of theoperating system. Since impedance across Proc100 throughProc0 varies because of their differing levels of packagecapacitance, their magnitude of voltage swings also varies inresponse to this stimulus.
Oscilloscope screen shots in Figs. 5m-5r correspond tothe different processors’ core supply voltages at the momentof the reset signal, measured using our experimental setupfrom the previous section. Proc100 in Fig. 5m experiencesa sharp 150mV voltage droop for a very brief amount oftime, but voltage quickly recovers. As package capacitanceprogressively decreases going from Proc100 to no packagecapacitance altogether in Proc0, voltage swings not only getincrementally larger, but also extend over a longer amount oftime. Proc0 experiences a 350mV drop over several cyclesin Fig. 5r. This leads to timing violations that prevent theprocessor from even booting up. However, it is the onlyprocessor that fails stability testing.
Fig. 6 summarizes the peak-to-peak voltage swings acrossall processors relative to Proc100. We can safely normalizethis data because differences in the peak-to-peak swing of anidling machine across the processors is negligible. However,their noise characteristics diverge when activity occurs. Fig. 6shows one instance of such divergence, in response to resettingthe processors. The trend in this figure is roughly the same asin Fig. 1. The knee of the curve is around Proc25 and Proc3,so from here on we rely on them as our future nodes, whileProc100 is representative of today’s systems.
C. Worst-Case Margin
The worst-case margin is the voltage guardband that toler-ates transient voltage swings. It is (Vnominal-Vmin)/Vnominal,where Vmin is the minimum voltage before an execution errorcan occur. This work discusses performance improvementsas a result of utilizing aggressive voltage margins, ratherthan utilizing worst-case margins. Therefore, we needed todetermine the worst-case lower margin.
In the CoreTM2 Duo processor, the worst-case margin isapproximately 14% below the nominal supply voltage. Inorder to determine this value, we progressively undervoltthe processor while maintaining its clock frequency. Thisultimately forces the processor into a functional error, whichwe detect when the processor fails stress-testing under multiplecopies of the power virus.
Fig. 6: Voltage swings inFigs. 5m-5r across processorsshown in Figs. 5a-5f.
1.0
0.8
0.6
0.4
0.2
0.0Dis
trib
ution o
f S
am
ple
s
-10 0 10
% of Voltage Swing
Core2Duo voltage margin: -14%
Max. overshoot
Min. droopTypical-case
Fig. 7: Cumulative distribution ofvoltage samples across 881 pro-gram executions.
III. NOISE IN PRODUCTION PROCESSORS
In this section, we discuss the voltage noise characteris-tics of real-world programs as they are run to completion,using our experimental measurement setup from Section II.We summarize the noise profiles of single-threaded, multi-threaded and multi-program executions prior to providingmore in-depth analysis in later sections. This section coversthe extent to which worst-case operating voltage margins areabsolutely necessary, followed by motivating and evaluatingaggressive voltage margins for typical-case design. Our anal-ysis includes Proc100, Proc25 and Proc3. Therefore, wecharacterize typical-case design not only in the context oftoday’s systems, but we also project into the future.
A. Typical-Case Operation
The worst-case operating voltage margin is overly conser-vative. We determine this from 881 benchmarking runs. Theexperiments include a spectrum of workload characteristics:29 single-threaded SPEC CPU2006 workloads, 11 Parsec [27]programs and 29×29 multi-program workload combinationsfrom CPU2006. Consequently, we believe that the conclusionsdrawn from this comprehensive investigation are representativeof production systems and not biased towards a favorableoutcome.
Fig. 7 shows a cumulative histogram distribution of voltagesamples for Proc100. We plot the deviation of each samplerelative to the nominal supply voltage. Each line within thegraph corresponds to a run. Run-time voltage droops are aslarge as 9.6% (see Min. droop marker). Therefore, the 14%worst-case margin is necessary. However, they occur veryinfrequently. Most of the voltage samples are within 4% ofthe nominal voltage. The Typical-case marker in Fig. 7 identifiesthis range. Only a small fraction of samples (0.06%) lie beyondthis typical-case region. Although the magnitude of overshootscan also be large (see Max. overshoot), they are significantlyless frequent, especially in future nodes. Therefore, we willprimarily focus on droops.
B. Designing for Typical-Case Operation
When a microarchitecture is optimized for typical-case con-ditions and relies on an error-recovery mechanism to handleemergencies, three critical factors determine its performance:(1) workload characteristics, (2) the operating voltage marginsetting, and (3) the cost of rolling back execution. In this
25
20
15
10
5
0
-5
Perf
orm
ance Im
porv
em
ent (%
)
-14 -12 -10 -8 -6 -4 -2
Voltage Margin (%)
Optimal m
argins
Dead zone
Recovery Costs 1 10 100 1000 10000 100000
Fig. 8: Typical case improvement across a range of recovery costson Proc100, showing substantial room for tighter voltage margins.
section, we evaluate how these factors influence peak perfor-mance.
Performance Model. In order to study the relationshipbetween these critical parameters, we inspect performancegains from allowing voltage emergencies at runtime. Sinceour analysis is based off of a current generation processorthat does not support aggressive margins, we have to modelthe performance under a resilient system. For a given voltagemargin, every emergency triggers a recovery, which has somepenalty in processor clock cycles. During execution, we recordthe number of emergencies, which we determine from gatheredscope histogram data. After execution, we compute the totalnumber of cycles spent in recovery mode. These cycles arethen added to the actual number of program runtime cycles.We gather runtime cycle counts with the aid of hardware per-formance counters using VTune [28]. The combined numberis the performance lost due to emergencies.
While allowing emergencies penalizes performance to someextent, utilizing an aggressive voltage margin boosts processorclock frequency. Therefore, there can be a net gain. Bowman etal. show that an improvement in operating voltage margin by10% of the nominal voltage translates to a 15% improvementin clock frequency [5]. We assume this 1.5× scaling factorfor the performance model as we tighten the voltage marginfrom 14%. Alternatively, margins could be used to improve(or lower) dynamic power consumption.
Recovery Costs. Fig. 8 shows performance improvementover a range of voltage margins, assuming specific recoverycosts. These recovery costs reflect prior work: Razor [7],a very fine-grained pipeline stage-level error detection andrecovery mechanism, has a recovery penalty of only a fewclock cycles. DeCoR [8] leverages existing load-store queuesand reorder buffers in modern out-of-order processors to delayinstruction commit just long enough to verify whether an emer-gency has occurred. Typical delay is around tens of cycles.Reddi et al. [29] propose a scheme that predicts emergen-cies using program and microarchitectural activity, relying onan optimistic 100-cycle hardware-based checkpoint-recoverymechanism that guarantees correctness. Current productionsystems typically take thousands of clock cycles to completerecovery [30]. Alternatively, recovery cost-free computing isalso emerging where it is possible to exploit the inherentlystatistical and error-resilient nature of workloads to tolerate
1.0
0.8
0.6
0.4
0.2
0.0Dis
trib
utio
n o
f S
am
ple
s
-4 -2 0 2 4
% of Voltage Swing
(a) Proc25
1.0
0.8
0.6
0.4
0.2
0.0Dis
trib
utio
n o
f S
am
ple
s
-4 -2 0 2 4
% of Voltage Swing
Larger spread
(b) Proc3
Fig. 9: Typical-case swings in future processors are increasingly moreslanted compared to Proc100 (see Fig. 7) as voltage noise grow.
errors without a hardware fail-safe [31]. Our workloads donot fall into this criteria, therefore we target the more generalcase where hardware robustness is a must.
Optimal Margins. In order for a resilient architecture designto operate successfully under any aggressive margin, an opti-mal margin must exist. Such a margin is necessary to designthe processor towards a specific design point in the presence ofworkload diversity. Fig. 8 data is an average of all 881 programruns. These include single-threaded, multi-threaded workloads,and an exhaustive multi-program combination sweep that pairsevery CPU2006 benchmark with every other benchmark inthe suite. Despite this heterogeneous set of execution profiles,we find that it is possible to pick a single static optimalmargin. There is only one performance peak per recovery cost.Otherwise, we would see multiple maxima or some other morecomplicated trend.
Note that each benchmark can have a unique optimal voltagemargin. However, we found that the range of optimal marginsis small across all executions. So although it is possibleto achieve even better results on a per benchmark basis,improvements over our one-design-fits-all methodology arelikely to be negligible, at least relative to our gains.
In Fig. 8, every recovery mechanism has its own optimalmargin. Depending on the cost of the recovery mechanism,gains vary between 13% and ∼21%. Coarser-grained recoverymechanisms have more relaxed optimal margins while finer-grained schemes have more aggressive margins and as aconsequence are able to experience better performance im-provements. However, being overly aggressive and setting theoperating voltage margin beyond the optimal causes rapidperformance degradation. At such settings, recoveries occurtoo frequently and penalize performance, thus the benefitsbegin to diminish. Recovery penalties can be so high that theycan even push losses beyond the original conservative design(i.e., 14% margin on CoreTM2 Duo ). This corresponds tobelow 0% improvement, which we refer to as the Dead zone.
Diminishing Gains. As we extrapolate the benefits ofresilient microarchitecture designs into future nodes usingProc25 and Proc3, we can anticipate an alarming decreasein the corresponding performance gains. These diminishinggains are due to worsening voltage swings. Processors in thefuture will experience many more emergencies compared toProc100 at identical margins. Fig. 9 shows the distribution of
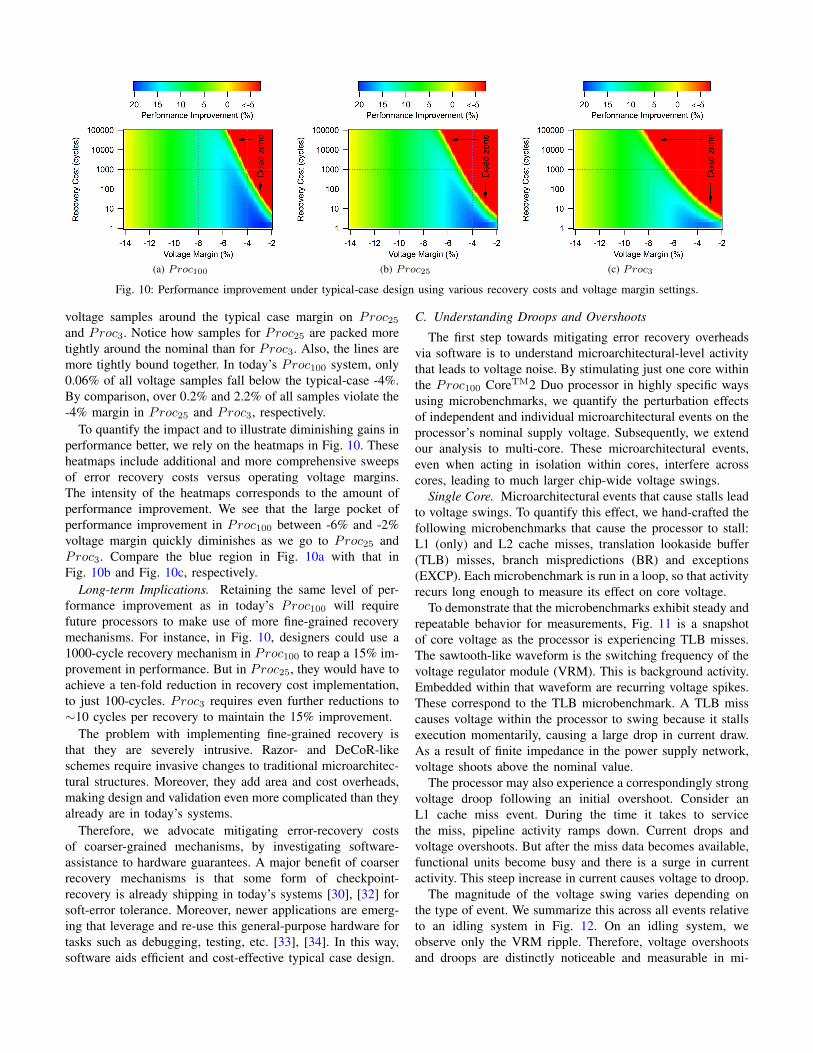
(a) Proc100 (b) Proc25 (c) Proc3
Fig. 10: Performance improvement under typical-case design using various recovery costs and voltage margin settings.
voltage samples around the typical case margin on Proc25and Proc3. Notice how samples for Proc25 are packed moretightly around the nominal than for Proc3. Also, the lines aremore tightly bound together. In today’s Proc100 system, only0.06% of all voltage samples fall below the typical-case -4%.By comparison, over 0.2% and 2.2% of all samples violate the-4% margin in Proc25 and Proc3, respectively.
To quantify the impact and to illustrate diminishing gains inperformance better, we rely on the heatmaps in Fig. 10. Theseheatmaps include additional and more comprehensive sweepsof error recovery costs versus operating voltage margins.The intensity of the heatmaps corresponds to the amount ofperformance improvement. We see that the large pocket ofperformance improvement in Proc100 between -6% and -2%voltage margin quickly diminishes as we go to Proc25 andProc3. Compare the blue region in Fig. 10a with that inFig. 10b and Fig. 10c, respectively.
Long-term Implications. Retaining the same level of per-formance improvement as in today’s Proc100 will requirefuture processors to make use of more fine-grained recoverymechanisms. For instance, in Fig. 10, designers could use a1000-cycle recovery mechanism in Proc100 to reap a 15% im-provement in performance. But in Proc25, they would have toachieve a ten-fold reduction in recovery cost implementation,to just 100-cycles. Proc3 requires even further reductions to∼10 cycles per recovery to maintain the 15% improvement.
The problem with implementing fine-grained recovery isthat they are severely intrusive. Razor- and DeCoR-likeschemes require invasive changes to traditional microarchitec-tural structures. Moreover, they add area and cost overheads,making design and validation even more complicated than theyalready are in today’s systems.
Therefore, we advocate mitigating error-recovery costsof coarser-grained mechanisms, by investigating software-assistance to hardware guarantees. A major benefit of coarserrecovery mechanisms is that some form of checkpoint-recovery is already shipping in today’s systems [30], [32] forsoft-error tolerance. Moreover, newer applications are emerg-ing that leverage and re-use this general-purpose hardware fortasks such as debugging, testing, etc. [33], [34]. In this way,software aids efficient and cost-effective typical case design.
C. Understanding Droops and Overshoots
The first step towards mitigating error recovery overheadsvia software is to understand microarchitectural-level activitythat leads to voltage noise. By stimulating just one core withinthe Proc100 CoreTM2 Duo processor in highly specific waysusing microbenchmarks, we quantify the perturbation effectsof independent and individual microarchitectural events on theprocessor’s nominal supply voltage. Subsequently, we extendour analysis to multi-core. These microarchitectural events,even when acting in isolation within cores, interfere acrosscores, leading to much larger chip-wide voltage swings.
Single Core. Microarchitectural events that cause stalls leadto voltage swings. To quantify this effect, we hand-crafted thefollowing microbenchmarks that cause the processor to stall:L1 (only) and L2 cache misses, translation lookaside buffer(TLB) misses, branch mispredictions (BR) and exceptions(EXCP). Each microbenchmark is run in a loop, so that activityrecurs long enough to measure its effect on core voltage.
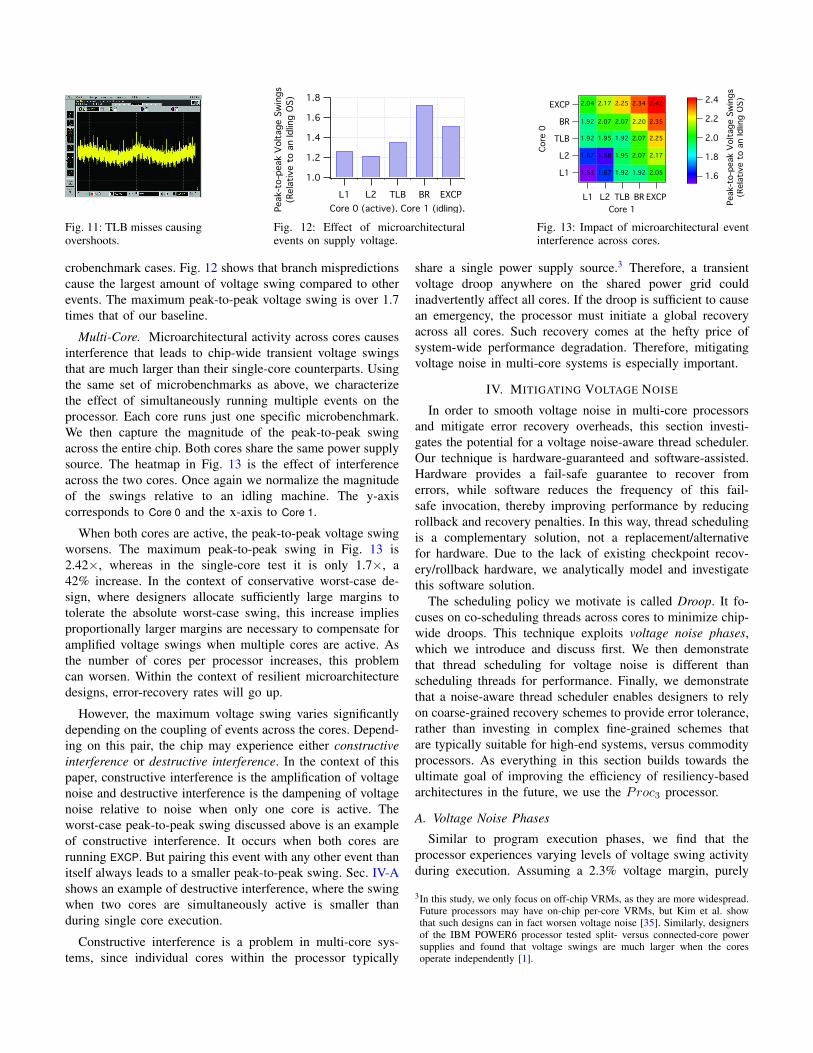
To demonstrate that the microbenchmarks exhibit steady andrepeatable behavior for measurements, Fig. 11 is a snapshotof core voltage as the processor is experiencing TLB misses.The sawtooth-like waveform is the switching frequency of thevoltage regulator module (VRM). This is background activity.Embedded within that waveform are recurring voltage spikes.These correspond to the TLB microbenchmark. A TLB misscauses voltage within the processor to swing because it stallsexecution momentarily, causing a large drop in current draw.As a result of finite impedance in the power supply network,voltage shoots above the nominal value.
The processor may also experience a correspondingly strongvoltage droop following an initial overshoot. Consider anL1 cache miss event. During the time it takes to servicethe miss, pipeline activity ramps down. Current drops andvoltage overshoots. But after the miss data becomes available,functional units become busy and there is a surge in currentactivity. This steep increase in current causes voltage to droop.
The magnitude of the voltage swing varies depending onthe type of event. We summarize this across all events relativeto an idling system in Fig. 12. On an idling system, weobserve only the VRM ripple. Therefore, voltage overshootsand droops are distinctly noticeable and measurable in mi-
Fig. 11: TLB misses causingovershoots.
Fig. 12: Effect of microarchitecturalevents on supply voltage.
L1
L2
TLB
BR
EXCP
Core
0
L1 L2 TLB BR EXCP
Core 1
2.04 2.17 2.25 2.34 2.42
1.92 2.07 2.07 2.20 2.35
1.92 1.95 1.92 2.07 2.25
1.67 1.58 1.95 2.07 2.17
1.53 1.67 1.92 1.92 2.05
(Rela
tive t
o a
n Idlin
g O
S)2.4
2.2
2.0
1.8
1.6
Peak-t
o-p
eak V
olt
age S
win
gs
Fig. 13: Impact of microarchitectural eventinterference across cores.
crobenchmark cases. Fig. 12 shows that branch mispredictionscause the largest amount of voltage swing compared to otherevents. The maximum peak-to-peak voltage swing is over 1.7times that of our baseline.
Multi-Core. Microarchitectural activity across cores causesinterference that leads to chip-wide transient voltage swingsthat are much larger than their single-core counterparts. Usingthe same set of microbenchmarks as above, we characterizethe effect of simultaneously running multiple events on theprocessor. Each core runs just one specific microbenchmark.We then capture the magnitude of the peak-to-peak swingacross the entire chip. Both cores share the same power supplysource. The heatmap in Fig. 13 is the effect of interferenceacross the two cores. Once again we normalize the magnitudeof the swings relative to an idling machine. The y-axiscorresponds to Core 0 and the x-axis to Core 1.
When both cores are active, the peak-to-peak voltage swingworsens. The maximum peak-to-peak swing in Fig. 13 is2.42×, whereas in the single-core test it is only 1.7×, a42% increase. In the context of conservative worst-case de-sign, where designers allocate sufficiently large margins totolerate the absolute worst-case swing, this increase impliesproportionally larger margins are necessary to compensate foramplified voltage swings when multiple cores are active. Asthe number of cores per processor increases, this problemcan worsen. Within the context of resilient microarchitecturedesigns, error-recovery rates will go up.
However, the maximum voltage swing varies significantlydepending on the coupling of events across the cores. Depend-ing on this pair, the chip may experience either constructiveinterference or destructive interference. In the context of thispaper, constructive interference is the amplification of voltagenoise and destructive interference is the dampening of voltagenoise relative to noise when only one core is active. Theworst-case peak-to-peak swing discussed above is an exampleof constructive interference. It occurs when both cores arerunning EXCP. But pairing this event with any other event thanitself always leads to a smaller peak-to-peak swing. Sec. IV-Ashows an example of destructive interference, where the swingwhen two cores are simultaneously active is smaller thanduring single core execution.
Constructive interference is a problem in multi-core sys-tems, since individual cores within the processor typically
share a single power supply source.3 Therefore, a transientvoltage droop anywhere on the shared power grid couldinadvertently affect all cores. If the droop is sufficient to causean emergency, the processor must initiate a global recoveryacross all cores. Such recovery comes at the hefty price ofsystem-wide performance degradation. Therefore, mitigatingvoltage noise in multi-core systems is especially important.
IV. MITIGATING VOLTAGE NOISE
In order to smooth voltage noise in multi-core processorsand mitigate error recovery overheads, this section investi-gates the potential for a voltage noise-aware thread scheduler.Our technique is hardware-guaranteed and software-assisted.Hardware provides a fail-safe guarantee to recover fromerrors, while software reduces the frequency of this fail-safe invocation, thereby improving performance by reducingrollback and recovery penalties. In this way, thread schedulingis a complementary solution, not a replacement/alternativefor hardware. Due to the lack of existing checkpoint recov-ery/rollback hardware, we analytically model and investigatethis software solution.
The scheduling policy we motivate is called Droop. It fo-cuses on co-scheduling threads across cores to minimize chip-wide droops. This technique exploits voltage noise phases,which we introduce and discuss first. We then demonstratethat thread scheduling for voltage noise is different thanscheduling threads for performance. Finally, we demonstratethat a noise-aware thread scheduler enables designers to relyon coarse-grained recovery schemes to provide error tolerance,rather than investing in complex fine-grained schemes thatare typically suitable for high-end systems, versus commodityprocessors. As everything in this section builds towards theultimate goal of improving the efficiency of resiliency-basedarchitectures in the future, we use the Proc3 processor.
A. Voltage Noise Phases
Similar to program execution phases, we find that theprocessor experiences varying levels of voltage swing activityduring execution. Assuming a 2.3% voltage margin, purely
3In this study, we only focus on off-chip VRMs, as they are more widespread.Future processors may have on-chip per-core VRMs, but Kim et al. showthat such designs can in fact worsen voltage noise [35]. Similarly, designersof the IBM POWER6 processor tested split- versus connected-core powersupplies and found that voltage swings are much larger when the coresoperate independently [1].
120
80
40
0Dro
ops
per
1K C
ycle
s
160012008004000
Time (s)
(a) 482.sphinx
120
80
40
0Dro
ops
per1
K C
ycle
s
5002500
Time (s)
(b) 416.gamess
120
80
40
0Dro
ops
per
1K C
ycle
s
2000160012008004000
Time (s)
(c) 465.tonto
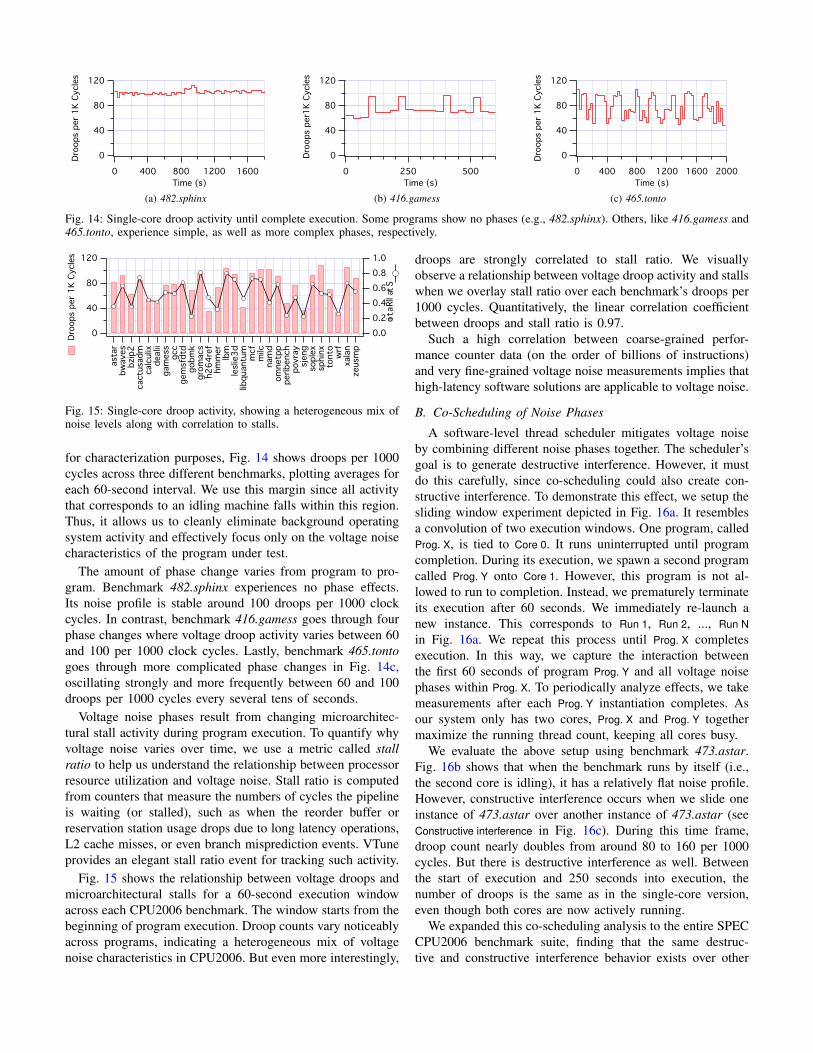
Fig. 14: Single-core droop activity until complete execution. Some programs show no phases (e.g., 482.sphinx). Others, like 416.gamess and465.tonto, experience simple, as well as more complex phases, respectively.
120
80
40
0
Dro
ops
per
1K C
ycle
s
asta
rbw
aves
bzip
2cactu
sadm
calc
ulix
dealii
gam
ess
gcc
gem
sfdtd
gobm
kgro
macs
h264re
fhm
mer
lbm
leslie
3d
libquantu
mm
cf
milc
nam
dom
netp
pperlbench
povra
ysje
ng
sople
xsp
hin
xto
nto wrf
xala
nzeusm
p
1.0
0.8
0.6
0.4
0.2
0.0
Sta
ll Ratio
Fig. 15: Single-core droop activity, showing a heterogeneous mix ofnoise levels along with correlation to stalls.
for characterization purposes, Fig. 14 shows droops per 1000cycles across three different benchmarks, plotting averages foreach 60-second interval. We use this margin since all activitythat corresponds to an idling machine falls within this region.Thus, it allows us to cleanly eliminate background operatingsystem activity and effectively focus only on the voltage noisecharacteristics of the program under test.
The amount of phase change varies from program to pro-gram. Benchmark 482.sphinx experiences no phase effects.Its noise profile is stable around 100 droops per 1000 clockcycles. In contrast, benchmark 416.gamess goes through fourphase changes where voltage droop activity varies between 60and 100 per 1000 clock cycles. Lastly, benchmark 465.tontogoes through more complicated phase changes in Fig. 14c,oscillating strongly and more frequently between 60 and 100droops per 1000 cycles every several tens of seconds.
Voltage noise phases result from changing microarchitec-tural stall activity during program execution. To quantify whyvoltage noise varies over time, we use a metric called stallratio to help us understand the relationship between processorresource utilization and voltage noise. Stall ratio is computedfrom counters that measure the numbers of cycles the pipelineis waiting (or stalled), such as when the reorder buffer orreservation station usage drops due to long latency operations,L2 cache misses, or even branch misprediction events. VTuneprovides an elegant stall ratio event for tracking such activity.
Fig. 15 shows the relationship between voltage droops andmicroarchitectural stalls for a 60-second execution windowacross each CPU2006 benchmark. The window starts from thebeginning of program execution. Droop counts vary noticeablyacross programs, indicating a heterogeneous mix of voltagenoise characteristics in CPU2006. But even more interestingly,
droops are strongly correlated to stall ratio. We visuallyobserve a relationship between voltage droop activity and stallswhen we overlay stall ratio over each benchmark’s droops per1000 cycles. Quantitatively, the linear correlation coefficientbetween droops and stall ratio is 0.97.
Such a high correlation between coarse-grained perfor-mance counter data (on the order of billions of instructions)and very fine-grained voltage noise measurements implies thathigh-latency software solutions are applicable to voltage noise.
B. Co-Scheduling of Noise Phases
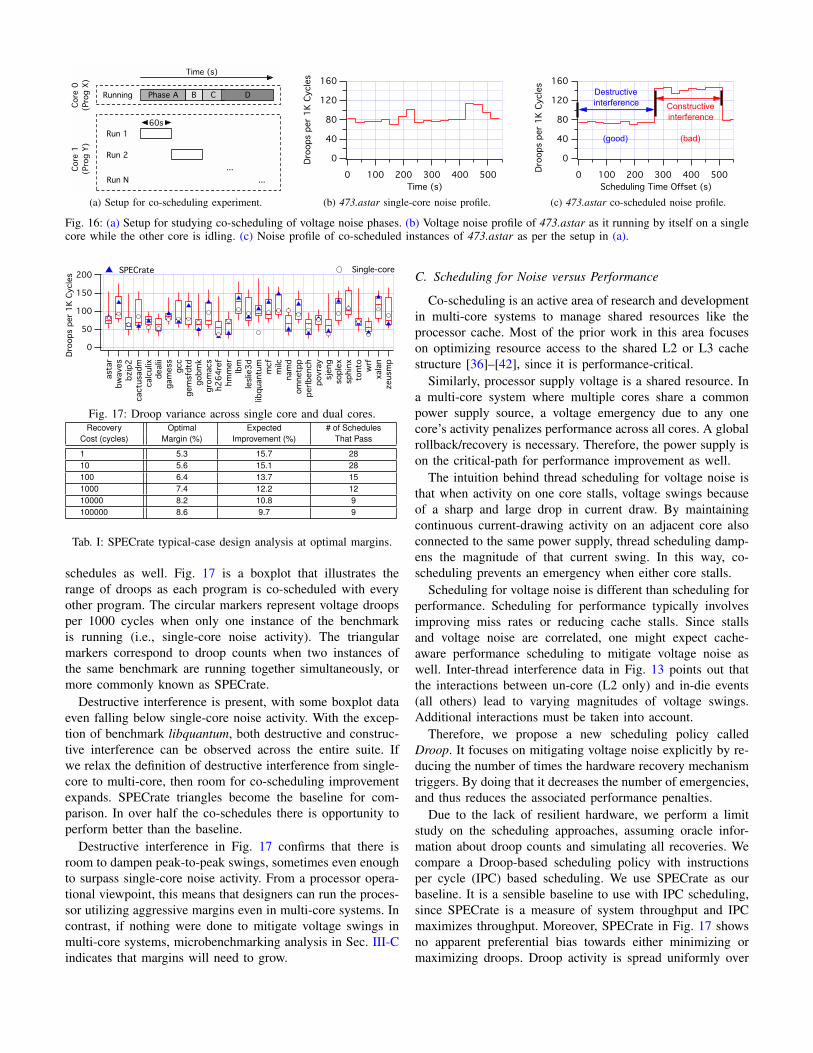
A software-level thread scheduler mitigates voltage noiseby combining different noise phases together. The scheduler’sgoal is to generate destructive interference. However, it mustdo this carefully, since co-scheduling could also create con-structive interference. To demonstrate this effect, we setup thesliding window experiment depicted in Fig. 16a. It resemblesa convolution of two execution windows. One program, calledProg. X, is tied to Core 0. It runs uninterrupted until programcompletion. During its execution, we spawn a second programcalled Prog. Y onto Core 1. However, this program is not al-lowed to run to completion. Instead, we prematurely terminateits execution after 60 seconds. We immediately re-launch anew instance. This corresponds to Run 1, Run 2, ..., Run Nin Fig. 16a. We repeat this process until Prog. X completesexecution. In this way, we capture the interaction betweenthe first 60 seconds of program Prog. Y and all voltage noisephases within Prog. X. To periodically analyze effects, we takemeasurements after each Prog. Y instantiation completes. Asour system only has two cores, Prog. X and Prog. Y togethermaximize the running thread count, keeping all cores busy.
We evaluate the above setup using benchmark 473.astar.Fig. 16b shows that when the benchmark runs by itself (i.e.,the second core is idling), it has a relatively flat noise profile.However, constructive interference occurs when we slide oneinstance of 473.astar over another instance of 473.astar (seeConstructive interference in Fig. 16c). During this time frame,droop count nearly doubles from around 80 to 160 per 1000cycles. But there is destructive interference as well. Betweenthe start of execution and 250 seconds into execution, thenumber of droops is the same as in the single-core version,even though both cores are now actively running.
We expanded this co-scheduling analysis to the entire SPECCPU2006 benchmark suite, finding that the same destruc-tive and constructive interference behavior exists over other
Run 1
Time (s)
60s
Run 2
Phase A C D
Core 0
(Prog X)
Core 1
(Prog Y)
Running B
...
...
Run N
(a) Setup for co-scheduling experiment.
160
120
80
40
0Dro
ops
per
1K C
ycle
s
5004003002001000
Time (s)
(b) 473.astar single-core noise profile.
160
120
80
40
0
Dro
ops
per
1K C
ycle
s
5004003002001000
Scheduling Time Offset (s)
interference
Constructive
Destructive
interference
(good) (bad)
(c) 473.astar co-scheduled noise profile.
Fig. 16: (a) Setup for studying co-scheduling of voltage noise phases. (b) Voltage noise profile of 473.astar as it running by itself on a singlecore while the other core is idling. (c) Noise profile of co-scheduled instances of 473.astar as per the setup in (a).
200
150
100
50
0
Dro
ops
per
1K C
ycle
s
asta
rbw
aves
bzip
2cactu
sadm
calc
ulix
dealii
gam
ess
gcc
gem
sfdtd
gobm
kgro
macs
h264re
fhm
mer
lbm
leslie
3d
libquantu
mm
cf
milc
nam
dom
netp
pperlbench
povra
ysje
ng
sople
xsp
hin
xto
nto wrf
xala
nzeusm
p
SPECrate Single-core
Fig. 17: Droop variance across single core and dual cores.Recovery Optimal Expected # of Schedules
Cost (cycles) Margin (%) Improvement (%) That Pass
Tab. I: SPECrate typical-case design analysis at optimal margins.
schedules as well. Fig. 17 is a boxplot that illustrates therange of droops as each program is co-scheduled with everyother program. The circular markers represent voltage droopsper 1000 cycles when only one instance of the benchmarkis running (i.e., single-core noise activity). The triangularmarkers correspond to droop counts when two instances ofthe same benchmark are running together simultaneously, ormore commonly known as SPECrate.
Destructive interference is present, with some boxplot dataeven falling below single-core noise activity. With the excep-tion of benchmark libquantum, both destructive and construc-tive interference can be observed across the entire suite. Ifwe relax the definition of destructive interference from single-core to multi-core, then room for co-scheduling improvementexpands. SPECrate triangles become the baseline for com-parison. In over half the co-schedules there is opportunity toperform better than the baseline.
Destructive interference in Fig. 17 confirms that there isroom to dampen peak-to-peak swings, sometimes even enoughto surpass single-core noise activity. From a processor opera-tional viewpoint, this means that designers can run the proces-sor utilizing aggressive margins even in multi-core systems. Incontrast, if nothing were done to mitigate voltage swings inmulti-core systems, microbenchmarking analysis in Sec. III-Cindicates that margins will need to grow.
C. Scheduling for Noise versus Performance
Co-scheduling is an active area of research and developmentin multi-core systems to manage shared resources like theprocessor cache. Most of the prior work in this area focuseson optimizing resource access to the shared L2 or L3 cachestructure [36]–[42], since it is performance-critical.
Similarly, processor supply voltage is a shared resource. Ina multi-core system where multiple cores share a commonpower supply source, a voltage emergency due to any onecore’s activity penalizes performance across all cores. A globalrollback/recovery is necessary. Therefore, the power supply ison the critical-path for performance improvement as well.
The intuition behind thread scheduling for voltage noise isthat when activity on one core stalls, voltage swings becauseof a sharp and large drop in current draw. By maintainingcontinuous current-drawing activity on an adjacent core alsoconnected to the same power supply, thread scheduling damp-ens the magnitude of that current swing. In this way, co-scheduling prevents an emergency when either core stalls.
Scheduling for voltage noise is different than scheduling forperformance. Scheduling for performance typically involvesimproving miss rates or reducing cache stalls. Since stallsand voltage noise are correlated, one might expect cache-aware performance scheduling to mitigate voltage noise aswell. Inter-thread interference data in Fig. 13 points out thatthe interactions between un-core (L2 only) and in-die events(all others) lead to varying magnitudes of voltage swings.Additional interactions must be taken into account.
Therefore, we propose a new scheduling policy calledDroop. It focuses on mitigating voltage noise explicitly by re-ducing the number of times the hardware recovery mechanismtriggers. By doing that it decreases the number of emergencies,and thus reduces the associated performance penalties.
Due to the lack of resilient hardware, we perform a limitstudy on the scheduling approaches, assuming oracle infor-mation about droop counts and simulating all recoveries. Wecompare a Droop-based scheduling policy with instructionsper cycle (IPC) based scheduling. We use SPECrate as ourbaseline. It is a sensible baseline to use with IPC scheduling,since SPECrate is a measure of system throughput and IPCmaximizes throughput. Moreover, SPECrate in Fig. 17 showsno apparent preferential bias towards either minimizing ormaximizing droops. Droop activity is spread uniformly over
2.0
0.0
Dro
op
s
2.00.0
Perf.
Q2Q3
Q4 Q1
Random
IPC
IPC/Droopn
Droop
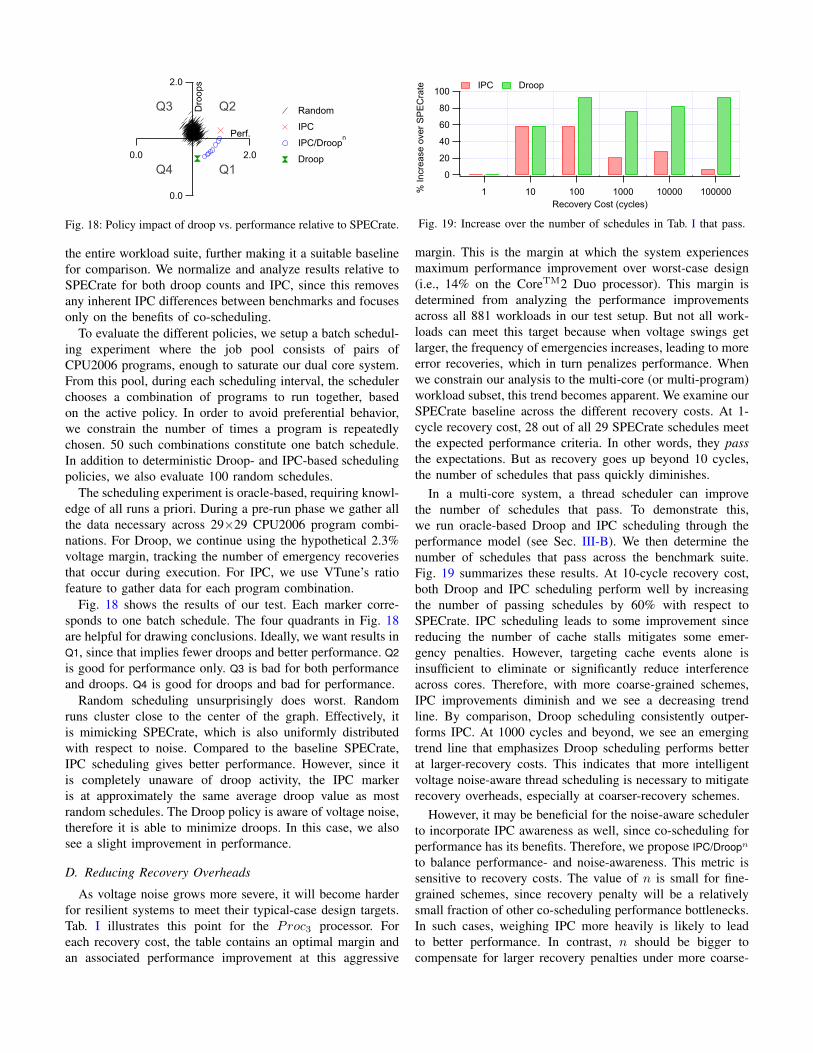
Fig. 18: Policy impact of droop vs. performance relative to SPECrate.
the entire workload suite, further making it a suitable baselinefor comparison. We normalize and analyze results relative toSPECrate for both droop counts and IPC, since this removesany inherent IPC differences between benchmarks and focusesonly on the benefits of co-scheduling.
To evaluate the different policies, we setup a batch schedul-ing experiment where the job pool consists of pairs ofCPU2006 programs, enough to saturate our dual core system.From this pool, during each scheduling interval, the schedulerchooses a combination of programs to run together, basedon the active policy. In order to avoid preferential behavior,we constrain the number of times a program is repeatedlychosen. 50 such combinations constitute one batch schedule.In addition to deterministic Droop- and IPC-based schedulingpolicies, we also evaluate 100 random schedules.
The scheduling experiment is oracle-based, requiring knowl-edge of all runs a priori. During a pre-run phase we gather allthe data necessary across 29×29 CPU2006 program combi-nations. For Droop, we continue using the hypothetical 2.3%voltage margin, tracking the number of emergency recoveriesthat occur during execution. For IPC, we use VTune’s ratiofeature to gather data for each program combination.
Fig. 18 shows the results of our test. Each marker corre-sponds to one batch schedule. The four quadrants in Fig. 18are helpful for drawing conclusions. Ideally, we want results inQ1, since that implies fewer droops and better performance. Q2is good for performance only. Q3 is bad for both performanceand droops. Q4 is good for droops and bad for performance.
Random scheduling unsurprisingly does worst. Randomruns cluster close to the center of the graph. Effectively, itis mimicking SPECrate, which is also uniformly distributedwith respect to noise. Compared to the baseline SPECrate,IPC scheduling gives better performance. However, since itis completely unaware of droop activity, the IPC markeris at approximately the same average droop value as mostrandom schedules. The Droop policy is aware of voltage noise,therefore it is able to minimize droops. In this case, we alsosee a slight improvement in performance.
D. Reducing Recovery Overheads
As voltage noise grows more severe, it will become harderfor resilient systems to meet their typical-case design targets.Tab. I illustrates this point for the Proc3 processor. Foreach recovery cost, the table contains an optimal margin andan associated performance improvement at this aggressive
100
80
60
40
20
0
% Incre
ase
ove
r S
PE
Cra
te
1 10 100 1000 10000 100000
Recovery Cost (cycles)
IPC Droop
Fig. 19: Increase over the number of schedules in Tab. I that pass.
margin. This is the margin at which the system experiencesmaximum performance improvement over worst-case design(i.e., 14% on the CoreTM2 Duo processor). This margin isdetermined from analyzing the performance improvementsacross all 881 workloads in our test setup. But not all work-loads can meet this target because when voltage swings getlarger, the frequency of emergencies increases, leading to moreerror recoveries, which in turn penalizes performance. Whenwe constrain our analysis to the multi-core (or multi-program)workload subset, this trend becomes apparent. We examine ourSPECrate baseline across the different recovery costs. At 1-cycle recovery cost, 28 out of all 29 SPECrate schedules meetthe expected performance criteria. In other words, they passthe expectations. But as recovery goes up beyond 10 cycles,the number of schedules that pass quickly diminishes.
In a multi-core system, a thread scheduler can improvethe number of schedules that pass. To demonstrate this,we run oracle-based Droop and IPC scheduling through theperformance model (see Sec. III-B). We then determine thenumber of schedules that pass across the benchmark suite.Fig. 19 summarizes these results. At 10-cycle recovery cost,both Droop and IPC scheduling perform well by increasingthe number of passing schedules by 60% with respect toSPECrate. IPC scheduling leads to some improvement sincereducing the number of cache stalls mitigates some emer-gency penalties. However, targeting cache events alone isinsufficient to eliminate or significantly reduce interferenceacross cores. Therefore, with more coarse-grained schemes,IPC improvements diminish and we see a decreasing trendline. By comparison, Droop scheduling consistently outper-forms IPC. At 1000 cycles and beyond, we see an emergingtrend line that emphasizes Droop scheduling performs betterat larger-recovery costs. This indicates that more intelligentvoltage noise-aware thread scheduling is necessary to mitigaterecovery overheads, especially at coarser-recovery schemes.
However, it may be beneficial for the noise-aware schedulerto incorporate IPC awareness as well, since co-scheduling forperformance has its benefits. Therefore, we propose IPC/Droopn
to balance performance- and noise-awareness. This metric issensitive to recovery costs. The value of n is small for fine-grained schemes, since recovery penalty will be a relativelysmall fraction of other co-scheduling performance bottlenecks.In such cases, weighing IPC more heavily is likely to leadto better performance. In contrast, n should be bigger tocompensate for larger recovery penalties under more coarse-
grained schemes. In this way, the scheduler can attempt tomaximize performance even in the presence of emergencies.The pareto frontier in the lower quadrant of Q1 in Fig. 18illustrates this range of improvement. A case where this metricis useful is when designers implement different grades ofrecovery schemes based on the class of a processor. Server-class or high-performance systems will typically use finer-grained recovery schemes despite implementation overheads.Therefore, they will have smaller recovery penalty. Cheaper,more cost-effective commodity systems, like workstations anddesktop processors, are likely to rely on more coarse-grainedsolutions. The metric allows the scheduler to dynamicallyadapt itself to platform-specific recovery costs.
V. CONCLUSION
Measurements on a CoreTM2 Duo processor show thatvoltage noise will be a dominant issue in the future because de-signing processors for worst-case conditions will increasinglycompromise performance and/or power efficiency. Resilientmicroarchitecture designs, optimized for typical-case, ratherthan worst-case, operation, and backed by error-recovery hard-ware, will become essential. But while these emerging designshold great promise in the short term, their long-term outlookis doubtful. Because growing voltage swings lead to frequentvoltage emergencies in such architectures, their error-recoveryoverhead will become a major performance bottleneck. Andwe show that increasing the number of cores per processorcan make voltage noise worse. But not all noise interferenceamong cores is constructive, and voltage noise is not altogetherirregular. Destructive interference can smooth supply voltage,and recurring microarchitectural stall behavior can produceperiodic voltage noise phases. Based on these observations,we demonstrate via simulation a software thread scheduler formulti-core processors that mitigates error-recovery overheadsby co-scheduling threads known to interfere destructively.
ACKNOWLEDGMENTS
We thank our colleagues in industry and academia, specif-ically Glenn Holloway, for the many discussions that havecontributed to this work. We are grateful to the anonymousreviewers for their suggestions. This work is funded by giftsfrom Intel and National Science Foundation grants CCF-0429782 and CSR-0720566. Opinions, findings, conclusions,or recommendations expressed in this material are those of theauthors and do not necessarily reflect the views of the NSF.
REFERENCES
[1] N. James et al., “Comparison of split-versus connected-core supplies inthe POWER6 microprocessor,” in ISSCC, February 2007.
[2] M. S. Gupta et al., “Understanding voltage variations in chip multipro-cessors using a distributed power-delivery network,” in DATE, 2007.
[3] International Technology Roadmap for Semiconductors, “Process inte-gration, devices and structures,” 2007.
[4] W. Zhao et al., “Predictive technology model for sub-45nm early designexploration,” ACM JETC, 2006.
[5] K. A. Bowman et al., “Energy-efficient and metastability-immunetiming-error detection and instruction replay-based recovery circuits fordynamic variation tolerance,” in ISSCC, 2008.
[6] M. de Kruijf et al., “Relax: An architectural framework for softwarerecovery of hardware faults,” in ISCA, 2010.
[7] D. Ernst et al., “Razor: A low-power pipeline based on circuit-leveltiming speculation,” in MICRO, 2003.
[8] M. S. Gupta et al., “DeCoR: A Delayed Commit and Rollback Mecha-nism for Handling Inductive Noise in Processors,” in HPCA, 2008.
[9] B. Greskamp et al., “Blueshift: Designing processors for timing specu-lation from the ground up.” in HPCA, 2009.
[10] M. D. Powell et al., “Architectural core salvaging in a multi-coreprocessor for hard-error tolerance,” in ISCA, 2009.
[11] D. Bull et al., “A power-efficient 32b ARM ISA processor usingtiming-error detection and correction for transient- error tolerance andadaptation to PVT variation,” in ISSCC, 2009.
[12] J. Tschanz et al., “A 45nm resilient and adaptive microprocessor corefor dynamic variation tolerance,” in ISSCC, 2009.
[13] “Voltage Regulator-Down (VRD) 11.0,” Processor Power Delivery De-sign Guidelines For Desktop LGA775 Socket, 2006.
[14] S. Chickamenahalli et al., “Microprocessor platform impedance charac-terization using VTT tools,” in APEC, 2005.
[15] “http://www.cascadesystems.net/lga775.htm.”[16] M. S. Gupta et al., “An event-guided approach to handling inductive
noise in processors.” in DATE, 2009.[17] M. Powell et al., “Pipeline muffling and a priori current ramp-
ing:architectural techniques to reduce high-frequency inductive noise,”in ISLPED, 2003.
[18] ——, “Exploiting resonant behavior to reduce inductive noise,” in ISCA,2004.
[19] T. Rahal-Arabi et al., “Design and validation of the Pentium 3 andPentium 4 processors power delivery,” in VLSI Circuits Digest ofTechnical Papers, 2002. Symposium on, 2002.
[20] K. Aygun et al., “Power delivery for high-performance microprocessors,”Intel Technology Journal, 2005.
[21] R. Joseph et al., “Control techniques to eliminate voltage emergenciesin high performance processors,” in HPCA, 2003.
[22] “Intel Core Extreme Processor X6800 and Intel Core2 Duo DesktopProcessor E6000 and E4000 Series,” Datasheet, 2008.
[23] V. Tiwari et al., “Instruction level power analysis and optimization ofsoftware,” VLSI Signal Processing, 1996.
[24] K. Aygun et al., “Measurement-to-modeling correlation of the powerdelivery network impedance of a microprocessor system,” in EPEPS,2004.
[25] A. Waizman, “CPU power supply impedance profile measurement usingfft and clock gating,” in EPEPS, 2003.
[26] M. Mienik, “http://users.bigpond.net.au/cpuburn.”[27] C. Bienia et al., “The PARSEC benchmark suite: Characterization and
architectural implications,” in PACT, 2008.[28] “http://software.intel.com/en-us/intel-vtune/.”[29] V. J. Reddi et al., “Voltage emergency prediction: A signature-based
approach to reducing voltage emergencies,” in HPCA, 2009.[30] Slegel et al., “IBM’s S/390 G5 microprocessor design,” Micro, IEEE,
1999.[31] N. R. Shanbhag et al., “Stochastic computation,” in DAC, 2010.[32] H. Ando et al., “A 1.3 GHz fifth-generation SPARC64 microprocessor,”
in DAC, 2003.[33] N. J. Wang et al., “ReStore: Symptom-Based Soft Error Detection in
Microprocessors,” IEEE Trans. Dependable Secur. Comput., 2006.[34] S. Narayanasamy et al., “BugNet: Continuously Recording Program
Execution for Deterministic Replay Debugging,” in ISCA, 2005.[35] W. Kim et al., “System level analysis of fast, per-core DVFS using
on-chip switching regulators,” in HPCA, 2007.[36] A. Snavely et al., “Symbiotic job scheduling for a simultaneous mut-
lithreading processor,” SIGPLAN Not., 2000.[37] A. Fedorova, “Operating system scheduling for chip multithreaded
processors,” Ph.D. dissertation, 2006, adviser-Seltzer, Margo I.[38] J. Mars et al., “Contention aware execution: Online contention detection
and response,” in CGO, 2010.[39] R. Knauerhase et al., “Using OS observations to improve performance
in multicore systems,” IEEE Micro, 2008.[40] S. Zhuravlev et al., “Addressing shared resource contention in multicore
processors via scheduling,” in ASPLOS, 2010.[41] D. Chandra et al., “Predicting inter-thread cache contention on a chip
multi-processor architecture,” in HPCA, 2005.[42] F. J. Cazorla et al., “Predictable performance in SMT processors:
Synergy between the OS and SMTs,” IEEE Trans. Comput., 2006.