20
Monthly Connect December 31, 2007 Volume 1 Issue No. 3
| Date post: | 13-Apr-2018 |
| Category: |
Documents |
| Upload: | trannguyet |
| View: | 215 times |
| Download: | 2 times |

MonthlyConnect
December 31, 2007Volume 1 Issue No. 3

Equity market review
Sensex, the market barometer moved up by 923.80 points or 4.77% during the month of December. The undertone of the market remained bullish coupled with volatility. Robust Index of Industrial Production (IIP) numbers and a 25 basis points rate cut by US Federal Reserve boosted the market sentiment.
During the month, broad based indices have outperformed Sensex. S & P CNX Nifty moved up by 6.52%. BSE 100 and BSE 200 registered gains of 7.41% and 8.24% respectively. Mid-cap and Small cap scrips witnessed high level of activity, which reflected in BSE Mid-Cap and BSE Small Cap indices moving up sharply by 14.41% and 26.81% respectively.
Foreign Institutional Investors (FIIs) and Domestic Institutions, both were net buyers in the equity market. FIIs have bought shares worth Rs.5579.10 crs. Net purchases by Domestic Institutions were to the extent of Rs.16520.50 crs.
The future course of the market depends upon FII flows. In the short term market activity will be stock specific. Also, expectations regarding Q3 results will influence the stock prices.
Debt market review
The month under review saw the yields at the short end remaining firm owing to tight liquidity due to advance tax outflow to an extent of Rs. 30000 crores and Government securities auction of Rs. 7000 crore , while due to institutional demand, there was easing trend shown in yields towards longer end. US fed cut the fed rate by 25 bps to 4.25% on11th December2007, failed to stir up the market since the market was expecting 50 bps cut.
Globally interest rates are moving southward in the developed countries to reduce the impact of credit market tightness. The 10 year benchmark yield eased to two month lows from 7.90% to 7.79% during the month on the hopes of improved liquidity due to redemption of bonds and interest payments on special deposit schemes and government spending.
Domestically the sentiment of bond market is expected to be bullish following macro economic indicators like, inflation/credit growth remaining benign. However, hike in domestic oil prices, edible goods and agro commodities if any could put upward pressure on inflation.
Scheme Objective : To generate income / capital appreciation by investing in equities
and equity related instruments of companies in the infrastructure sector.
Name of the Instrument Industry Classification Quantity Mkt Value % to(Rs. in lac) NAV
Open Ended Equity Scheme
Portfolio Statement as on 31.12.2007
Equities
Canara Robeco Infrastructure
Money Market Instruments
91 Days Treasury Bills (04/01/2008) 7,42,000 737.49 3.6191 Days Treasury Bills (25/01/2008) 69,3750 689.97 3.38CBLO 1.95 0.01Total 1,429.41 7.00Others (Current Liabilities) -114.79 -0.56Grand Total (Equities + MMI + Others ) 20,416.06 100.00Portfolio Turnover Ratio : 0.15 times
Reliance Industries Ltd Petroleum Products 44,000 1,267.66 6.21Larsen & Toubro Ltd. Construction 25,000 1,042.96 5.11Bharat Heavy Electricals Ltd Industrial Capital Goods 33,000 852.80 4.18Jaiprakash Associates Ltd Construction 2,00,000 852.10 4.17National Thermal Power Corporation Ltd Power 3,00,000 750.15 3.67Reliance Energy Ltd Power 35,000 747.11 3.66Walchandnagar Industries Ltd. Construction 8,035 660.56 3.24Punj Lloyd Ltd Construction 1,15,000 637.91 3.12Reliance Communication Ltd. Telecom - Services 80,000 597.20 2.93GMR Infrastructure Ltd. Construction 2,35,000 581.51 2.85Sesa Goa Ltd. Ferrous Metals 15,000 572.66 2.80Siemens Ltd. Industrial Capital Goods 30,000 568.02 2.78Tata Steel Ltd. Ferrous Metals 60,000 560.88 2.75Grasim Industries Ltd. Cement 15,000 547.74 2.68J S W Steel Ltd. Ferrous Metals 40,000 527.38 2.58Century Textiles & Industries Ltd. Cement 45,000 526.70 2.58Tata Power Co. Ltd. Power 30,000 441.29 2.16Monnet Ispat & Energy Ltd Ferrous Metals 70,000 419.90 2.06Gujarat State Petronet Ltd Gas 3,99,850 386.85 1.89Mcnally Bharat Engg Co Ltd Industrial Capital Goods 1,20,000 366.54 1.80Alstom Projects India Ltd Industrial Capital Goods 35,000 352.96 1.73Hindustan Construction Co Ltd Construction 1,50,000 349.43 1.71Infrastructure Development Finance Co. Ltd. Finance 1,50,000 342.67 1.68Thermax Ltd. Industrial Capital Goods 40,000 327.28 1.60Oil & Natural Gas Corporation Ltd. Oil 25,000 309.12 1.51Associated Cement Companies Ltd. Cement 30,000 307.35 1.51Bharati Airtel Ltd Telecom - Services 29,599 294.38 1.44Power Grid Corporation Of India Ltd. Power 2,00,000 287.60 1.41Crompton Greaves Ltd. Industrial Capital Goods 70,000 276.60 1.35Sterlite Industries (I) Ltd Non - Ferrous Metals 25,000 258.70 1.27Mundra Port Special Economic Zone Ltd. Travel & Transportation 19,790 251.06 1.23I C I C I Bank Ltd. Banks 20,000 246.48 1.21Esab (India) Ltd. Industrial Products 50,395 231.97 1.14Aditya Birla Nuvo Ltd Textile Products 11,303 228.01 1.12Ultra Tech Cement Ltd Cement 21,427 217.38 1.06Hindalco Industries Ltd Non - Ferrous Metals 1,00,000 214.85 1.05D L F Ltd Construction 20,000 214.76 1.05Brigade Enterprises Ltd Construction 43,981 166.49 0.82Consolidated Construction Consortium Ltd. Construction 14,987 161.25 0.79GVK Power & Infrastructure Ltd. Power 18,436 147.72 0.72Ambuja Cements Ltd Cement 1,00,000 146.90 0.72Transformers And Rectifiers (India) Ltd Power 16,036 140.09 0.69GAIL (India) Ltd Gas 25,000 135.51 0.66Gujarat NRE Coke Ltd Minerals/Mining 1,00,000 132.55 0.65Cairn India Ltd. Oil 50,000 128.85 0.63I V R C L Infra & Proj Ltd Construction 20,146 111.70 0.55Unitech Ltd. Construction 20,000 97.65 0.48Elecon Engg. Co. Ltd. Engineering 25,000 80.90 0.40B E M L Ltd Industrial Capital Goods 1,958 33.31 0.16Total 19,101.44 93.56
Fund Information
Category Open Ended Equity Scheme.
Date of Allotment 02.12.2005
Asset Allocation Equity and Equity related Instruments of companies in the Infrastructure - Upto 100%
Debt and Money Market
Instruments - Upto 25%
Minimum Investment Rs. 5,000.00
Option Dividend Option
Growth Option
Entry Load 2.25% for investments less than Rs. 200 Lacs
Nill for investments of Rs. 200 Lacs and above
Exit Load NIL
Nomination Facility Available to sole / joint individual unit holder/s.
Scheme ideally suited for investors seeking long term growth capital appreciation.
Scheme & Last SinceBenchmark (%) 1 Year Inception* *
Canara Robeco Infrastructure 90.89 60.56
BSE 100 59.74 50.88
CAGR has been computed by compounding the NAV annually and reinvesting the pay outs. Date of inception : 02.12.2005
NAV as on 31.12.2007 Income : Rs. 22.88Growth : Rs. 26.77
* Past performance may or may not be sustained in future. All performance figures are shown net of fees.
Date of Income distribution NAV as on the date declaration per unit (F.V. Rs. 10) of declaration
22.11.2006 2.00 13.68
Income Distribution (In Rupees)*
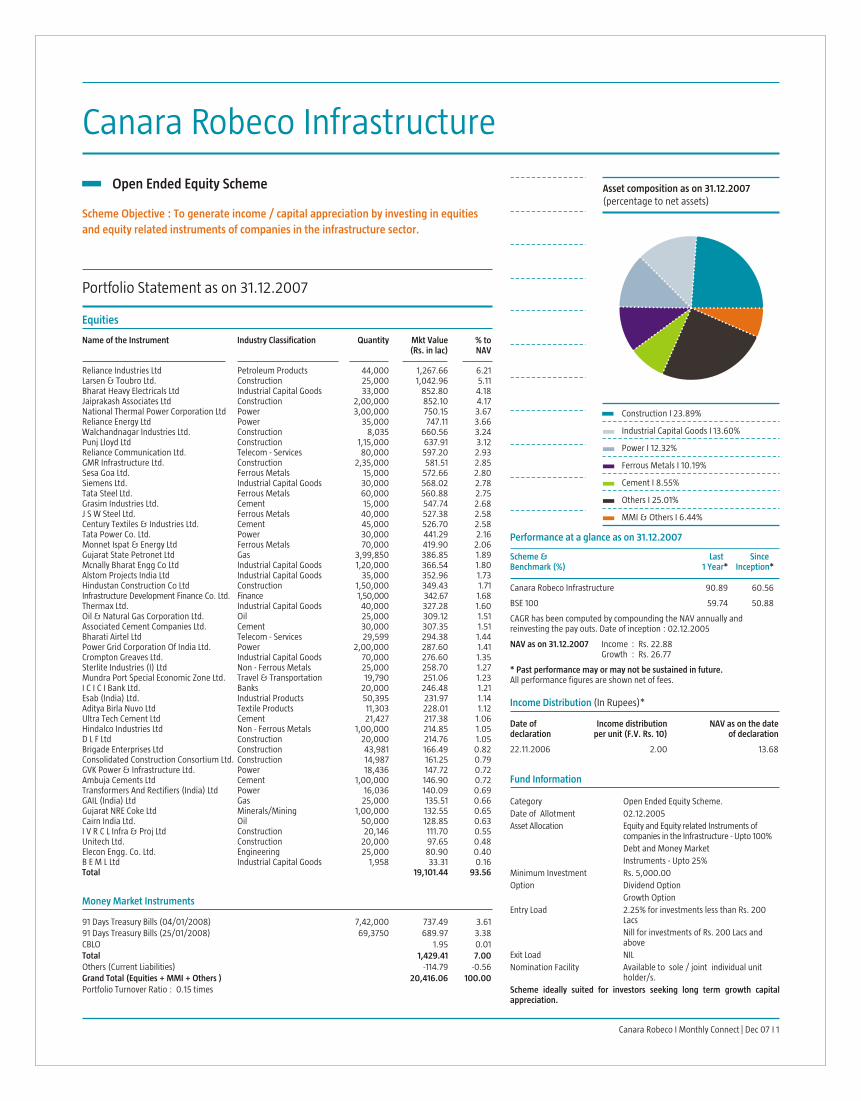
Asset composition as on 31.12.2007(percentage to net assets)
Construction I 23.89%
Industrial Capital Goods I 13.60%
Power I 12.32%
Ferrous Metals I 10.19%
Cement I 8.55%
Others I 25.01%
MMI & Others I 6.44%
Canara Robeco I Monthly Connect | Dec 07 I 1
Performance at a glance as on 31.12.2007

Portfolio Statement as on 31.12.2007
Name of the Instrument Industry Classification Quantity Mkt Value % to(Rs. in lac) NAV
Canara Robeco Emerging Equities
Scheme Objective : To generate capital appreciation by primarily investing in diversified
mid-cap stocks.
Open Ended Equity Scheme
Equities
Income Distribution (In Rupees)*
Money Market Instruments
Fund Information
Asset composition as on 31.12.2007(percentage to net assets)
2 I Canara Robeco I Monthly Connect | Dec 07
91 Days Trasury Bills (04/01/2008) 20,000 19.94 0.98
CBLO 58.89 2.88
Total 78.83 3.86
Others (Current Assets) 30.03 1.46
Grand Total (Equities + MMI + Others) 2,044.76 100.00
Portfolio Turnover Ratio : 0.08 times
Thermax Ltd. Industrial Capital Goods 20,000 163.64 8.00
Mcnally Bharat Engg Co Ltd Industrial Capital Goods 50,000 152.73 7.47
Reliance Industries Ltd Petroleum Products 5,000 144.05 7.04
Punj Lloyd Ltd Construction 20,000 110.94 5.43
Religare Enterprises Ltd. Finance 16,523 100.88 4.93
Alstom Projects India Ltd Industrial Capital Goods 10,000 100.85 4.93
E I H Ltd. Hotels 50,000 92.28 4.51
Nicholas Piramal India Ltd. Pharmaceuticals 25,000 89.31 4.37
K S B Pumps Ltd. Industrial Products 18,578 86.44 4.23
I C I C I Bank Ltd. Banks 7,000 86.27 4.22
Larsen & Toubro Ltd. Construction 2,000 83.44 4.08
Zylog Systems Ltd. Software 20,000 83.43 4.08
Oil & Natural Gas Corporation Ltd. Oil 5,500 68.01 3.33
Bayer India Ltd Pesticides 15,000 67.53 3.30
National Thermal Power Corporation Ltd Power 25,000 62.51 3.06
Astral Poly Technik Ltd. Industrial Products 28,953 61.81 3.02
Everonn Systems India Ltd Software 4,953 54.65 2.67
Mphasis Ltd Software 15,000 45.99 2.25
Zuari Industries Ltd Fertilizers 10,000 43.80 2.14
Hindalco Industries Ltd Non - Ferrous Metals 20,000 42.97 2.10
Indian Hotels Ltd. Hotels 25,000 39.89 1.95
SKF India Ltd. Industrial Products 8,038 36.79 1.80
Century Textiles & Industries Ltd. Cement 3,000 35.11 1.72
Elecon Engg. Co. Ltd. Engineering 10,000 32.36 1.58
Fairfield Atlas Ltd. Auto Ancillaries 30,000 29.35 1.44
B E M L Ltd Industrial Capital Goods 606 10.31 0.50
Allied Digital Services Ltd. Hardware 846 6.90 0.34
Nitin Fire Protection Industries Ltd. Industrial Capital Goods 585 3.66 0.18
Total 1,935.90 94.68
Canara Robeco Emerging Equities (Growth) 58.69 40.00
BSE 200 60.44 45.77
CAGR has been computed by compounding the NAV annually and reinvesting the pay outs. Date of inception : 11.03.2005
NAVs as on 31.12.2007 Income Option : Rs. 17.73
Growth Option : Rs. 25.72
Bonus Option : Rs. 21.53
* Past performance may or may not be sustained in future. All performance figures are shown net of fees.
Scheme & Last SinceBenchmark (%) 1 Year Inception* *
Date of Income distribution NAV as on the date declaration per unit (F.V. Rs. 10) of declaration
20.12.2005 2.00 12.91
22.06.2007 3.00 15.39
Category Open Ended Equity Scheme.
Date of Allotment 11 March, 2005.
Asset Allocation Equities - Min : 65%, Max : up to 100%
Minimum Investment Rs. 5,000.00
Entry Load 2.25% for investment less than Rs. 200 lac.
Rs. 200 lacs and above NIL
Exit Load Nil
Option 1) Growth Option
Growth Option with Automatic Repurchase
2) Income Option
3) Bonus Option
Nomination Facility Available to sole / joint individual unit holder/s.
Ideal investment option for investors seeking long term growth capital appreciation.
Performance at a glance as on 31.12.2007
Industrial Capital Goods l 21.09%
Construction l 9.51%
Industrial Products l 9.05%
Software l 9.00%
Petroleum Products l 7.04%
Others l 38.99%
MMI & Others l 5.32%

Scheme Objective : To generate capital appreciation by investing in equity and equity
related securities.
Name of the Instrument Industry Classification Quantity Mkt Value % to(Rs. in lac) NAV
Scheme & Last Last SinceBenchmark (%) 1 Year 3 Years Inception* * *
Open Ended Equity Scheme
Portfolio Statement as on 31.12.2007
Equities
Canara Robeco Equity Diversified
Income Distribution (In Rupees)*
Reliance Industries Ltd Petroleum Products 45,000 1,296.47 10.41
Reliance Communication Ltd. Telecom - Services 1,10,000 821.15 6.59
Thermax Ltd. Industrial Capital Goods 95,000 777.29 6.24
National Thermal Power Corporation Ltd Power 2,50,000 625.13 5.02
Tata Power Co. Ltd. Power 40,000 588.38 4.72
Larsen & Toubro Ltd. Construction 13,000 542.34 4.35
Bharat Heavy Electricals Ltd Industrial Capital Goods 20,000 516.85 4.15
Aditya Birla Nuvo Ltd Textile Products 25,000 504.31 4.05
Reliance Petroleum Ltd. Petroleum Products 2,25,000 502.20 4.03
Punj Lloyd Ltd Construction 90,000 499.23 4.01
Tata Steel Ltd. Ferrous Metals 40,000 373.92 3.00
State Bank Of India Banks 15,000 355.65 2.85
J S W Steel Ltd. Ferrous Metals 25,000 329.61 2.65
I C I C I Bank Ltd. Banks 25,000 308.10 2.47
Mphasis Ltd Software 95,000 291.27 2.34
Reliance Energy Ltd Power 12,000 256.15 2.06
Lupin Laboratories Ltd Pharmaceuticals 40,000 253.48 2.03
Oil & Natural Gas Corporation Ltd. Oil 20,000 247.30 1.98
Asian Paints (India) Ltd. Consumer Non Durables 20,000 220.51 1.77
Mahindra & Mahindra Ltd. Auto 25,000 215.20 1.73
Tata Motors Ltd. Auto 28,783 213.60 1.71
Ranbaxy Laboratories Ltd. Pharmaceuticals 50,000 212.98 1.71
Dish T V India Ltd Media & Entertainment 2,00,000 204.80 1.64
Sesa Goa Ltd. Ferrous Metals 5,000 190.89 1.53
Siemens Ltd. Industrial Capital Goods 10,000 189.34 1.52
Indian Hotels Ltd. Hotels 1,00,000 159.55 1.28
Infosys Technologies Ltd Software 9,000 159.16 1.28
Esab (India) Ltd. Industrial Products 30,293 139.44 1.12
Zee Entertainment Enterprises Ltd Media & Entertainment 40,000 131.32 1.05
Reliance Capital Ltd. Finance 5,000 129.47 1.04
Century Textiles & Industries Ltd. Cement 10,000 117.05 0.94
Tech Mahindra Ltd. Software 10,000 113.20 0.91
H D F C Bank Ltd. Banks 5,000 86.39 0.69
Tata Consultancy Services Ltd. Software 7,000 75.83 0.61
Empee Distilleries Ltd. Consumer Non Durables 18,122 64.30 0.52
Sun Pharmaceutical Ind Ltd. Pharmaceuticals 5,000 61.10 0.49
Sundaram Fasteners Ltd. Auto Ancillaries 75,000 48.67 0.39
Total 11,821.63 94.88
Money Market Instruments
91 Days Treasury Bills (04/01/2008) 1,40,000 138.65 1.11
91 Days Treasury Bills (margin) (11/01/2008) 40,000 39.90 0.32
CBLO 220.72 1.77
Total 399.27 3.20
Others (Current Assets) 238.58 1.92
Grand Total (Equities + MMI + Others) 12,459.48 100.00
Portfolio Turnover Ratio : 0.05 times
Canara Robeco Equity Diversified 63.42 43.87 45.56(Growth Plan)BSE 200 60.44 44.39 44.13CAGR has been computed by compounding the NAV annually and reinvesting the pay outs. Date of inception : 16.09.2003NAV as on 31.12.2007 Income Plan : Rs. 27.12
Growth Plan : Rs. 50.12Bonus Plan : Rs. 27.12
* Past performance may or may not be sustained in future. All performance figures are shown net of fees.
Date of Income distribution NAV as on the date declaration per unit (F.V. Rs. 10) of declaration18.12.2003 2.50 13.3808.11.2004 2.00 12.5628.04.2006 2.50 22.0331.08.2007 3.00 22.13
Fund Information
Category Open Ended Equity Scheme.Date of Allotment 16th September, 2003Asset Allocation Equities and Equity Related Instrument -
upto 100%MMI - upto 15%
Plans Offered a) Growth PlanGrowth Plan with Automatic Repurchase option
b) Income Planc) Bonus option
Minimum Investment Rs. 5,000.00 under each plan Entry Load 2.25% for investment less than Rs. 200 Lac
Nil for investment of Rs. 200 Lac & above Exit Load NilNomination Facility Available to sole / joint individual unit
holder/s.Ideal investment option for investors seeking long term growth and capital appreciation.
Asset composition as on 31.12.2007(percentage to net assets)
Canara Robeco I Monthly Connect | Dec 07 I 3
Performance at a glance as on 31.12.2007
Petroleum Products I 14.44%
Industrial Capital Goods I 11.91%
Power I 11.80%
Construction I 8.36%
Ferrous Metals I 7.18%
Others I 41.19%
MMI & Others I 5.12%

Scheme Objective : To generate income / capital appreciation by investing in equities
and equity related instruments of companies spanning the entire market capitalization
spectrum.
Portfolio Statement as on 31.12.2007
Name of the Instrument Industry Classification Quantity Mkt Value % to(Rs. in lac) NAV
Canara Robeco Multicap
Close Ended Equity Scheme
Equities
Reliance Industries Ltd Petroleum Products 80,000 2,304.84 10.15Larsen & Toubro Ltd. Construction 50,000 2,085.93 9.19Bharat Heavy Electricals Ltd Industrial Capital Goods 50,000 1,292.13 5.69National Thermal Power Corporation Ltd Power 3,50,000 875.18 3.86Reliance Energy Ltd Power 40,000 853.84 3.76Punj Lloyd Ltd Construction 1,40,000 776.58 3.42Siemens Ltd. Industrial Capital Goods 40,000 757.36 3.34State Bank Of India Banks 30,000 711.30 3.13Reliance Communication Ltd. Telecom - Services 95,000 709.18 3.12Mahindra & Mahindra Ltd. Auto 70,000 602.56 2.65Steel Authority Of India Ltd Ferrous Metals 2,00,000 568.70 2.51Grasim Industries Ltd. Cement 15,000 547.74 2.41Century Textiles & Industries Ltd. Cement 45,000 526.70 2.32Cairn India Ltd. Oil 2,00,000 515.40 2.27Aditya Birla Nuvo Ltd Textile Products 25,000 504.31 2.22Bharati Airtel Ltd Telecom - Services 50,000 497.27 2.19Reliance Petroleum Ltd. Petroleum Products 2,00,000 446.40 1.97Infosys Technologies Ltd Software 25,200 445.64 1.96I C I C I Bank Ltd. Banks 35,000 431.34 1.90Hindalco Industries Ltd Non - Ferrous Metals 2,00,000 429.70 1.89Monnet Ispat & Energy Ltd Ferrous Metals 60,000 359.91 1.59Tech Mahindra Ltd. Software 31,000 350.94 1.55I T C Ltd. Consumer Non Durables 1,50,000 315.45 1.39Oil & Natural Gas Corporation Ltd. Oil 25,000 309.12 1.36Associated Cement Companies Ltd. Cement 30,000 307.35 1.35Tata Steel Ltd. Ferrous Metals 30,000 280.44 1.24Ranbaxy Laboratories Ltd. Pharmaceuticals 60,000 255.57 1.13Lupin Laboratories Ltd Pharmaceuticals 40,000 253.48 1.12Industrial Development Bank Of India Banks 1,50,000 247.95 1.09Petronet LNG Ltd Gas 2,25,000 241.42 1.06Ambuja Cements Ltd Cement 1,50,000 220.35 0.97D L F Ltd Construction 20,000 214.76 0.95Maruti Udyog Ltd Auto 20,000 198.01 0.87Axis Bank Banks 20,000 193.42 0.85Tata Consultancy Services Ltd. Software 15,000 162.50 0.72Mcnally Bharat Engg Co Ltd Industrial Capital Goods 50,000 152.72 0.67Ultra Tech Cement Ltd Cement 15,000 152.17 0.67Tata Motors Ltd. Auto 20,000 148.42 0.65H D F C Bank Ltd. Banks 8,000 138.22 0.61Power Finance Corporation Ltd. Finance 50,050 131.38 0.58Tata Teleservices (Mah) Ltd. Telecom - Services 2,00,000 124.50 0.55GVK Power & Infrastructure Ltd. Power 15,000 120.19 0.53U C O Bank Ltd Banks 2,00,000 118.50 0.52Autoline Industries Ltd. Auto Ancillaries 50,000 117.30 0.52Dish T V India Ltd Media & Entertainment 1,10,000 112.64 0.50Brigade Enterprises Ltd Construction 26,183 99.12 0.44B E M L Ltd Industrial Capital Goods 4,556 77.52 0.34Power Grid Corporation Of India Ltd. Power 50,661 72.85 0.32Empee Distilleries Ltd. Consumer Non Durables 18,122 64.3 0.28Religare Enterprises Ltd. Finance 9,042 55.21 0.24Sundaram Fasteners Ltd. Auto Ancillaries 75,000 48.67 0.21Total 21,526.48 94.84
Money Market Instruments
91 Days Treasury Bills (04/01/2008) 2,87,750 286.19 1.2691 Days Treasury Bills (margin) (11/01/2008) 43,500 43.37 0.19CBLO 232.38 1.02Total 561.94 2.47Others (Current Assets) 608.29 2.69Grand Total (Equities + MMI + Others) 22,696.71 100.00Portfolio Turnover Ratio : 0.05 times
Canara Robeco Multicap 6.61 22.46 43.84 56.50BSE 200 8.24 25.37 47.19 53.76Absolute Return based on NAV of Rs. 15.65 as on 31.12.2007Date of inception : 02.02.2007* Past performance may or may not be sustained in future. All performance figures are shown net of fees.
Fund Information
Type / Category Close ended Equity Scheme. Scheme Duration Five Years from the date of allotmentDate of allotment 2nd February, 2007Asset Allocation Equity and Equity Related Instruments upto
100%Debt and Money Market Instruments upto 25%
Options 1) Dividend Option 2) Growth Option
Minimum Rs. 1000.00 and in multiples of Re.1.00Redemption Amount thereafter Applicable NAV for Repurchase facility under the Scheme shallRepurchase of Units / commence after expiry of 90 days from theSwitch Out date of allotment of the units under New
Fund Offer. Such repurchase facility is provided on the first and third Wednesday of every calendar month (notified repurchase days).a. For applications/ redemption requests
received upto 3.00 p. m. (cut off time) of any notified Wednesday, the closing NAV of the day shall be applicable.
b. For applications received after 3.00 p.m.(cut-off time) of any notified Wednesday, the closing NAV of the following notified Wednesday shall be applicable.(In the event the notified repurchase day happens to be a holiday/ non business day, repurchase will be effected at the next business day at the applicable NAV)
Asset composition as on 31.12.2007(percentage to net assets)
4 I Canara Robeco I Monthly Connect | Dec 07
Performance at a glance as on 31.12.2007
Construction I 13.99%
Petroleum Products I 12.12%
Industrial Capital Goods I 10.04%
Power I 8.47%
Banks I 8.11%
MMI & Others I 5.16%
Others I 42.10%
Scheme & Last Last Last SinceBenchmark (%) 1 Month 3 Months 6 Months Inception* * * *

Income Distribution (In Rupees)*
Scheme Objective : To generate Income by investing in Debt instruments, MMI and
small portion in equity.
Name of the Instrument Industry Classification Quantity Mkt Value % to(Rs. in lac) NAV
Open Ended Debt Scheme
Portfolio Statement as on 31.12.2007
Equities
Canara Robeco CIGO
Century Textiles & Industries Ltd. Cement 6,000 70.23 6.00
Thermax Ltd. Industrial Capital Goods 5,000 40.91 3.49
Alstom Projects India Ltd Industrial Capital Goods 4,000 40.34 3.45
GVK Power & Infrastructure Ltd. Power 4,000 32.05 2.74
Tata Motors Ltd. Auto 3,000 22.26 1.90
Aditya Birla Nuvo Ltd Textile Products 1,000 20.17 1.72
Indian Hotels Ltd. Hotels 10,000 15.96 1.36
I C I C I Bank Ltd. Banks 1,075 13.25 1.13
Lupin Laboratories Ltd Pharmaceuticals 2,000 12.67 1.08
National Thermal Power Corporation Ltd Power 5,000 12.50 1.07
Tech Mahindra Ltd. Software 1,000 11.32 0.97
Total 291.66 24.91
Money Market Instruments
91 Days Treasury Bills (25/01/2008) 6,38,000.00 629.13 53.73
91 Days Treasury Bills (margin) (11/01/2008) 2,25,000.00 224.41 19.17
91 Days Treasury Bills (04/01/2008) 20,000.00 19.83 1.69
Mutual Fund Units 4,40,946.80 52.21 4.46
CBLO 39.12 3.34
Total 964.70 82.39
Others (Current Liabilities) -85.45 -7.30
Grand Total (Equtiies +Debt+ MMI +Others) 1,170.91 100.00
Portfolio Turnover Ratio : 0.06 times
Fund Information
Category Open Ended Debt Scheme.
Date of Allotment 4th April , 1988
Asset Allocation Debt Instruments with MMI-Upto 90%Equities - Upto 25%
Plans Offered a) Income Plan
b) Growth Plan
Minimum Investment Rs. 5,000.00
Entry Load Nil
Exit Load Upto Rs. 5.00 lakh : 0.50% for exit before 6 months Nil above Rs. 5 lac
Nomination Facility Available to sole / joint individual unit holder/s.
Ideal Scheme for investors looking for regular income with low to medium risk.
Scheme & Last Last Last Last Since Benchmark (%) 1 Year 3 Years 5 Years 10 Years Inception* * * * *
Canara Robeco CIGO (Growth Plan) 21.46 19.40 15.28 13.34 13.53
CRISIL MIPBlended Index 13.51 10.63 9.90 -- --
Index Data available from 31.03.02
CAGR has been computed by compounding the NAV annually and reinvesting the pay outs.
Date of inception : 01.04.1988
NAV as on 31.12.2007 Growth Plan : Rs. 23.72
Income Plan : Rs. 12.81
* Past performance may or may not be sustained in future. All performance figures are shown net of fees.
Asset composition as on 31.12.2007(percentage to net assets)
Date of Income distribution NAV as on the date declaration per unit (F.V. Rs. 10) of declaration05.10.2001 0.60 10.8614.03.2002 0.90 11.4811.10.2002 0.625 11.0006.05.2003 0.625 11.1106.10.2003 0.625 11.5714.03.2004 0.625 11.0219.11.2004 0.30 10.5628.03.2005 0.40 10.5918.11.2005 0.57171 (Others) 11.44
0.61390 (Ind. & HUF) 11.4428.04.2006 0.4900 (Others) 12.16
0.5262 (Ind. & HUF)23.10.2006 0.57171 (Others) 11.79
0.61390 (Ind. & HUF)26.04.2007 0.5707 (Others) 11.82
0.6132 (Ind. & HUF)28.11.2007 0.5707 (Others) 13.28
0.6132 (Ind. & HUF)
Canara Robeco I Monthly Connect | Dec 07 I 5
Performance at a glance as on 31.12.2007
Industrial Capital Goods I 6.94%
Cement I 6.00%
Power I 3.80%
Auto I 1.90%
Textile Products I 1.72%
Others I 4.54%
MMI & Others I 75.09%
Scheme Objective : ELSS seeking to provide long term Capital appreciation by
predominantly investing in equities.
Portfolio Statement as on 31.12.2007
Name of the Instrument Industry Classification Quantity Mkt Value % to(Rs. in lac) NAV
Canara Robeco Equity Tax Saver
Open Ended Equity Linked Tax Saving Scheme
Equities
Punj Lloyd Ltd Construction 50,000 277.35 7.80
Reliance Communication Ltd. Telecom - Services 30,000 223.95 6.30
Reliance Petroleum Ltd. Petroleum Products 1,00,000 223.20 6.28
National Thermal Power Corporation Ltd Power 75,000 187.54 5.28
Larsen & Toubro Ltd. Construction 4,000 166.87 4.69
Reliance Industries Ltd Petroleum Products 5,000 144.05 4.05
Alstom Projects India Ltd Industrial Capital Goods 14,000 141.18 3.97
J S W Steel Ltd. Ferrous Metals 10,000 131.85 3.71
Bharat Heavy Electricals Ltd Industrial Capital Goods 5,000 129.21 3.63
Cairn India Ltd. Oil 50,000 128.85 3.62
GVK Power & Infrastructure Ltd. Power 15,000 120.19 3.38
Sesa Goa Ltd. Ferrous Metals 3,000 114.53 3.22
Aditya Birla Nuvo Ltd Textile Products 5,000 100.86 2.84
Axis Bank Banks 10,000 96.71 2.72
Tata Steel Ltd. Ferrous Metals 10,000 93.48 2.63
Madhucon Projects Ltd Construction 15,000 92.03 2.59
Mahindra & Mahindra Ltd. Auto 10,000 86.08 2.42
Hindalco Industries Ltd Non - Ferrous Metals 40,000 85.94 2.42
Tata Motors Ltd. Auto 10,000 74.21 2.09
Jyoti Structures Ltd. Power 25,000 69.78 1.96
I T C Ltd. Consumer Non Durables 30,000 63.09 1.77
Oil & Natural Gas Corporation Ltd. Oil 5,000 61.82 1.74
I C I C I Bank Ltd. Banks 5,000 61.62 1.73
Tech Mahindra Ltd. Software 5,000 56.60 1.59
Sterlite Industries (I) Ltd Non - Ferrous Metals 5,000 51.74 1.46
Lupin Laboratories Ltd Pharmaceuticals 8,000 50.70 1.43
Bharati Airtel Ltd Telecom - Services 5,000 49.73 1.40
Mphasis Ltd Software 15,000 45.99 1.29
Cipla Ltd. Pharmaceuticals 20,000 42.52 1.20
Sun Pharmaceutical Ind Ltd. Pharmaceuticals 3,000 36.66 1.03
Infosys Technologies Ltd Software 2,000 35.37 0.99
United Phosphorus Ltd. Pesticides 10,000 34.88 0.98
Empee Distilleries Ltd. Consumer Non Durables 9,061 32.15 0.90
Aurobindo Pharma Ltd. Pharmaceuticals 5,000 27.14 0.76
Total 3,337.87 93.90
Money Market Instruments
91 Days Treasury Bills (04/01/2008) 48,000 47.59 1.34
91 Days Treasury Bills (margin) (11/01/2008) 10,000 9.98 0.28
CBLO 133.02 3.74
Total 190.59 5.36
Others (Current Assets) 26.33 0.74
Grand Total (Equities + MMI + Others) 3,554.79 100.00
Portfolio Turnover Ratio : 0.09 times
Fund Information
Category Open Ended Equity Linked Tax Saving Scheme.
Date of Allotment March 31, 1993.Asset Allocation Equities - Min 80% upto 100% /
MMI - Upto 20% Minimum Investment Rs. 500.00 Entry Load 2.25%for investment of less than Rs. 20Lac
Nil for investment of Rs. 200 Lac and above Exit Load NilNomination Facility Available to sole / joint individual unit
Holder/s.Ideal investment option for investors seeking capital appreciation, growth and tax benefit under section 80C of IT Act, 1961.
Scheme & Last Last Last Last SinceBenchmark (%) 1 Year 3 Years 5 Years 10 Years Inception* * * * *
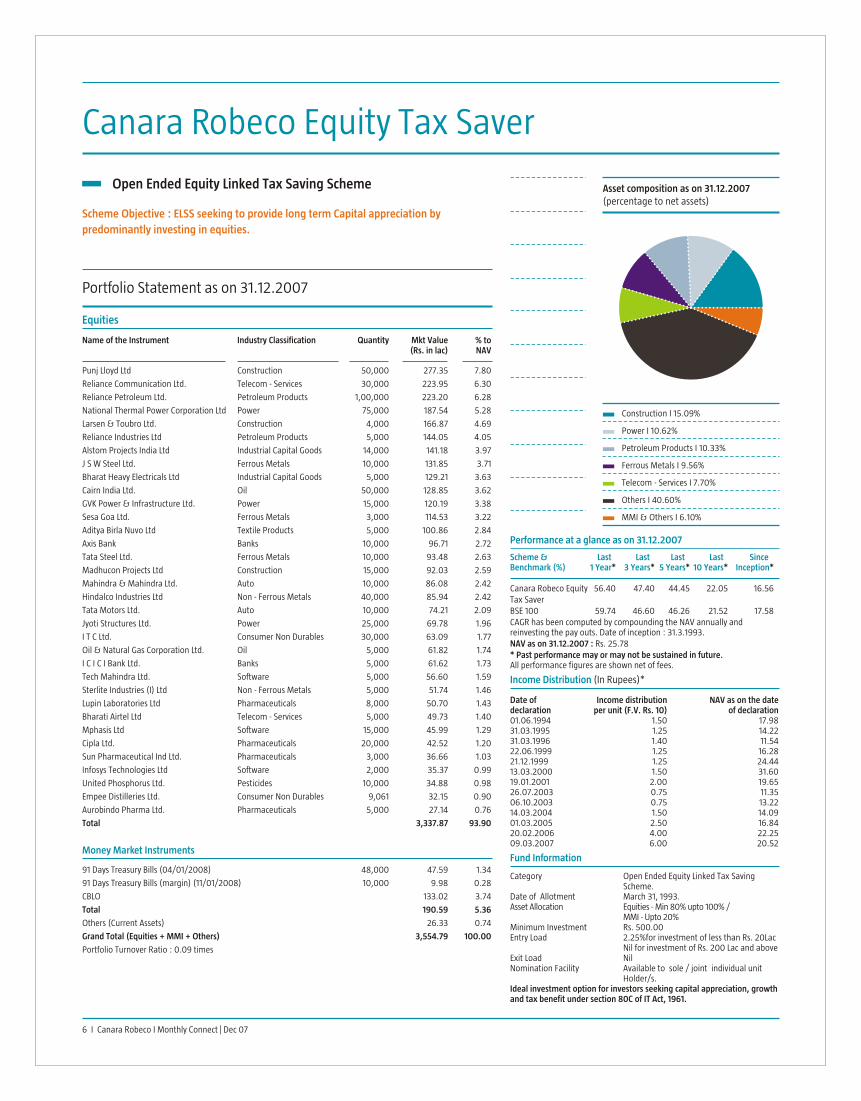
Asset composition as on 31.12.2007(percentage to net assets)
Income Distribution (In Rupees)*
Date of Income distribution NAV as on the date declaration per unit (F.V. Rs. 10) of declaration01.06.1994 1.50 17.9831.03.1995 1.25 14.2231.03.1996 1.40 11.5422.06.1999 1.25 16.2821.12.1999 1.25 24.4413.03.2000 1.50 31.6019.01.2001 2.00 19.6526.07.2003 0.75 11.3506.10.2003 0.75 13.2214.03.2004 1.50 14.0901.03.2005 2.50 16.8420.02.2006 4.00 22.2509.03.2007 6.00 20.52
6 I Canara Robeco I Monthly Connect | Dec 07
Performance at a glance as on 31.12.2007
Construction I 15.09%
Power I 10.62%
Petroleum Products I 10.33%
Ferrous Metals I 9.56%
Telecom - Services I 7.70%
Others I 40.60%
MMI & Others I 6.10%
Canara Robeco Equity 56.40 47.40 44.45 22.05 16.56Tax SaverBSE 100 59.74 46.60 46.26 21.52 17.58CAGR has been computed by compounding the NAV annually and reinvesting the pay outs. Date of inception : 31.3.1993. NAV as on 31.12.2007 : Rs. 25.78* Past performance may or may not be sustained in future. All performance figures are shown net of fees.
Scheme Objective : To achieve capital appreciation by predominantly investing in
equities of companies with substantial FOREX earnings.
Name of the Instrument Industry Classification Quantity Mkt Value % to(Rs. in lac) NAV
Open Ended Equity Oriented Sectoral Scheme
Portfolio Statement as on 31.12.2007
Equities
Canara Robeco Expo
Money Market Instruments
Reliance Industries Ltd Petroleum Products 15,000 432.16 12.45
Reliance Communication Ltd. Telecom - Services 45,000 335.93 9.68
Larsen & Toubro Ltd. Construction 6,000 250.31 7.21
Mcnally Bharat Engg Co Ltd Industrial Capital Goods 60,000 183.27 5.28
Reliance Petroleum Ltd. Petroleum Products 75,000 167.40 4.82
Ranbaxy Laboratories Ltd. Pharmaceuticals 35,000 149.08 4.29
National Thermal Power Corporation Ltd Power 55,000 137.53 3.96
Cipla Ltd. Pharmaceuticals 60,000 127.56 3.67
Lupin Laboratories Ltd Pharmaceuticals 20,000 126.74 3.65
Infosys Technologies Ltd Software 7,000 123.79 3.57
Thermax Ltd. Industrial Capital Goods 15,000 122.73 3.54
Sun Pharmaceutical Ind Ltd. Pharmaceuticals 10,000 122.21 3.52
Tech Mahindra Ltd. Software 10,000 113.20 3.26
Maruti Udyog Ltd Auto 10,000 99.00 2.85
Cadila Healthcare Ltd Pharmaceuticals 30,000 94.41 2.72
Mahindra & Mahindra Ltd. Auto 10,000 86.08 2.48
Tata Motors Ltd. Auto 10,000 74.21 2.14
Zylog Systems Ltd. Software 17,108 71.37 2.06
I T C Ltd. Consumer Non Durables 30,000 63.09 1.82
I C I C I Bank Ltd. Banks 5,000 61.62 1.78
E I H Ltd. Hotels 30,000 55.36 1.59
Hindalco Industries Ltd Non - Ferrous Metals 25,000 53.71 1.55
Indian Hotels Ltd. Hotels 30,000 47.86 1.38
Aurobindo Pharma Ltd. Pharmaceuticals 7,000 38.00 1.09
Tata Consultancy Services Ltd. Software 3,000 32.50 0.94
Total 3,169.12 91.29
91 Days Treasury Bills (04/01/2008) 1,37,000 135.89 3.91
CBLO 102.69 2.96
Total 238.58 6.87
Others (Current Assets) 63.73 1.84
Grand Total (Equities + MMI + Others) 3,471.43 100.00
Portfolio Turnover Ratio : 0.07 times
Fund Information
Category Open Ended Growth Scheme.
Date of Allotment May 14, 1994
Asset Allocation Equities and Equity Related Instrument-Min 65% Upto 100%
MMI - Upto 35%
Plans Offered a) Income Plan
b) Growth Plan
Growth Option with Automatic
Repurchase option
Minimum Investment Rs. 5,000.00
Entry Load 2.25% for investment less than Rs 200 LacNil for investment of Rs. 200 Lac & above
Exit Load Nil
Nomination Facility Available to sole / joint individual unit holder/s.
Ideal investment option for investors seeking capital appreciation and growth.
Scheme & Last Last Last Last Since Benchmark (%) 1 Year 3 Years 5 Years 10 Years Inception* * * * *
Canara Robeco Expo Growth Plan 27.03 29.87 42.37 28.45 16.00
BSE 100 59.74 46.60 46.26 21.52 14.07
CAGR has been computed by compounding the NAV annually and reinvesting the pay outs.
Date of inception : 14.5.1994.
NAV as on 31.12.2007 Growth Plan : Rs. 68.19
Income Plan : Rs. 19.70
* Past performance may or may not be sustained in future. All performance figures are shown net of fees.
Date of Income distribution NAV as on the date declaration per unit (F.V. Rs. 10) of declaration
26.10.1999 1.00 19.14
30.05.2000 1.25 19.23
26.07.2003 2.00 14.20
06.10.2003 2.00 16.85
18.03.2004 3.50 17.28
28.12.2004 3.00 19.18
08.07.2005 2.50 17.25
18.08.2006 2.50 19.94
23.05.2007 5.00 20.50
Income Distribution (In Rupees)*
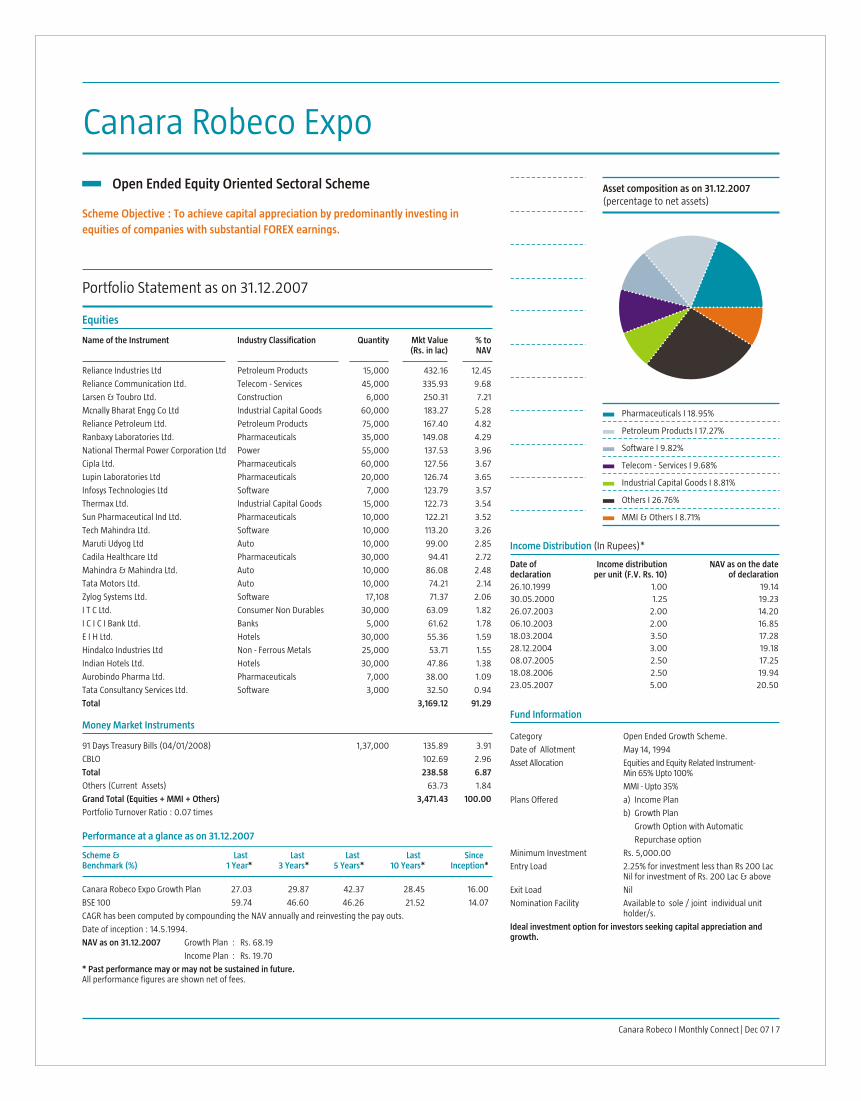
Asset composition as on 31.12.2007(percentage to net assets)
Canara Robeco I Monthly Connect | Dec 07 I 7
Performance at a glance as on 31.12.2007
Pharmaceuticals I 18.95%
Petroleum Products I 17.27%
Software I 9.82%
Telecom - Services I 9.68%
Industrial Capital Goods I 8.81%
Others I 26.76%
MMI & Others I 8.71%

Scheme Objective : To seek to generate long term capital appreciation and / or income
from a portfolio constituted of equity and equity related securities as well as fixed
income securities (debt and money market securities)
Portfolio Statement as on 31.12.2007
Name of the Instrument Industry Classification Quantity Mkt Value % to(Rs. in lac) NAV
Canara Robeco Balance II
Open Ended Balanced Scheme
Equities
Money Market Instruments
91 Days Treasury Bills (04/01/2008) 4,45,000 442.90 4.58
91 Days Treasury Bills (margin) (11/01/2008) 1,00,000 99.74 1.03
CBLO 206.18 2.13
Total 748.82 7.74
Others (Current Assets) 177.25 1.83
Grand Total (Equities +Debt+ MMI +others) 9,676.82 100.00
Portfolio Turnover Ratio : 0.05 times
Larsen & Toubro Ltd. Construction 20,000 834.37 8.62
Reliance Industries Ltd Petroleum Products 24,000 691.45 7.15
Reliance Energy Ltd Power 30,000 640.38 6.62
Reliance Communication Ltd. Telecom - Services 80,000 597.20 6.17
Siemens Ltd. Industrial Capital Goods 30,000 568.02 5.87
Bharat Heavy Electricals Ltd Industrial Capital Goods 20,000 516.85 5.34
Infosys Technologies Ltd Software 20,000 353.68 3.65
Reliance Petroleum Ltd. Petroleum Products 1,50,000 334.80 3.46
I T C Ltd. Consumer Non Durables 1,50,000 315.45 3.26
Oil & Natural Gas Corporation Ltd. Oil 22,500 278.21 2.88
State Bank of India Banks 10,000 237.10 2.45
Tata Steel Ltd. Ferrous Metals 25,000 233.70 2.42
Maruti Udyog Ltd Auto 20,000 198.01 2.05
Hindalco Industries Ltd Non - Ferrous Metals 90,000 193.37 2.00
National Thermal Power Corporation Ltd Power 75,000 187.54 1.94
Tata Motors Ltd. Auto 25,000 185.53 1.92
Hindustan Unilever Ltd Consumer Non Durables 75,000 160.43 1.66
I C I C I Bank Ltd. Banks 10,646 131.20 1.36
Lupin Laboratories Ltd Pharmaceuticals 20,000 126.74 1.31
Century Textiles & Industries Ltd. Cement 10,000 117.05 1.21
Zee Entertainment Enterprises Ltd Media & Entertainment 35,000 114.91 1.19
Tech Mahindra Ltd. Software 10,000 113.21 1.17
Tata Consultancy Services Ltd. Software 10,000 108.33 1.12
Petronet LNG Ltd. Gas 1,00,000 107.30 1.11
Cummins India Ltd [Kirloskar Cummins] Industrial Products 25,000 103.86 1.07
Bharati Airtel Ltd Telecom - Services 10,000 99.45 1.03
Mahindra & Mahindra Ltd. Auto 10,000 86.08 0.89
Ranbaxy Laboratories Ltd. Pharmaceuticals 20,000 85.19 0.88
Dish T V India Ltd Media & Entertainment 73,000 74.75 0.77
Associated Cement Companies Ltd. Cement 5,000 51.22 0.53
B E M L Ltd Industrial Capital Goods 2,340 39.81 0.41
Total 7,885.19 81.49
Power Finance Corporation - 07.00% Bond 30 289.20 2.99
Food Corporation of India - 07.10% BON (28/02/2010) 30 288.76 2.98
Indian Oil Corporation - 7.15% Bond (10/06/2012) 30 287.60 2.97
Total 865.56 8.94
Debt Instruments
Fund Information
Category Open Ended Balance Scheme.Date of Allotment 01.02.1993Asset Allocation Equity and Equity related Instruments -
Upto 75%Debt securities including securitized debt having rating above AA or equivalent, Money Market Instruments, Govt. Securities. 60%
Plans Offered GrowthDividend payout & Divi. Reinvestment
Minimum InvestmentPurchase Domestic Investors : Rs. 5000.00
NRI/FIIs/OCBs :Rs. 50000.00 and in Multiples of Rs. 1000.00Corporates/Trusts and Institutional Investors : Rs. 500000.00 and in multiples Of Rs. 10000.00
Additional Purchase Rs.: 3000.00Repurchase Minimum of 300 units or units with a
minimum repurchase value of Rs. 3000.00 Entry Load 2.25% for investment less than Rs. 200 lac
Nil - for investment and aboveExit Load NilNomination Facility Available to sole / joint individual unit
Holder/s.Scheme ideally suited for investors seeking capital appreciation and regular income.
Scheme & Last Last Last Last SinceBenchmark (%) 1 Year 3 Years 5 Years 10 Years Inception* * * * *
Canara Robeco 46.18 41.24 39.92 18.70 14.44Balance IICRISIL Balanced 36.79 28.46 26.77 -- --Fund IndexCAGR has been computed by compounding the NAV annually and reinvesting the pay outs. Date of inception :01.2.1993NAV as on 31.12.2007 : Rs. 53.69* Past performance may or may not be sustained in future. All performance figures are shown net of fees.
Asset composition as on 31.12.2007(percentage to net assets)
8 I Canara Robeco I Monthly Connect | Dec 07
Performance at a glance as on 31.12.2007
Industrial Capital Goods I 11.62%
Petroleum Products I 10.61%
Construction I 8.62%
Power I 8.56%
Telecom - Services I 7.20%
Others I 34.89%
Debt Instruments I 8.94%
MMI & Others I 9.57%

Scheme Objective : To provide medium to long term capital appreciation and distribute
income
Name of the Instrument Industry Classification Quantity Mkt Value % to(Rs. in lac) NAV
Open Ended Balanced Scheme
Portfolio Statement as on 31.12.2007
Equities
Canara Robeco Balance
Income Distribution (In Rupees)*
Reliance Energy Ltd Power 30,000 640.38 8.19Punj Lloyd Ltd Construction 1,10,000 610.17 7.80Reliance Industries Ltd Petroleum Products 16,000 460.97 5.89Tata Power Co. Ltd. Power 30,000 441.29 5.64Thermax Ltd. Industrial Capital Goods 40,000 327.28 4.18I T C Ltd. Consumer Non Durables 1,25,000 262.88 3.36Bharat Heavy Electricals Ltd Industrial Capital Goods 10,000 258.43 3.30I C I C I Bank Ltd. Banks 20,000 246.48 3.15Tata Steel Ltd. Ferrous Metals 25,000 233.70 2.99Hindustan Unilever Ltd Consumer Non Durables 75,000 160.42 2.05Reliance Communication Ltd. Telecom - Services 20,000 149.30 1.91Zee Entertainment Enterprises Ltd Media & Entertainment 40,000 131.32 1.68Cadila Healthcare Ltd Pharmaceuticals 40,000 125.88 1.61Cummins India Ltd [Kirloskar Cummins] Industrial Products 28,090 116.70 1.49I V R C L Infra & Proj Ltd Construction 20,000 110.89 1.42Lupin Laboratories Ltd Pharmaceuticals 15,000 95.05 1.22Siemens Ltd. Industrial Capital Goods 5,000 94.67 1.21Esab (India) Ltd. Industrial Products 20,000 92.06 1.18H D F C Bank Ltd. Banks 5,000 86.39 1.10Hindalco Industries Ltd Non - Ferrous Metals 40,000 85.94 1.10Century Textiles & Industries Ltd. Cement 6,000 70.23 0.90Tech Mahindra Ltd. Software 5,000 56.60 0.72Ashok Leyland Ltd. Auto 1,00,000 52.00 0.66B E M L Ltd Industrial Capital Goods 1423 24.21 0.31Dish T V India Ltd Media & Entertainment 23,000 23.55 0.30Total 4,956.79 63.37
Money Market Instruments
91 Days Treasury Bills (04/01/2008) 12,08,800 1,201.70 15.36
91 Days Treasury Bills (25/01/2008) 6,12,000 603.03 7.71
91 Days Treasury Bills (margin) (18/01/2008) 4,60,000 458.17 5.86
91 Days Treasury Bills (margin) (11/01/2008) 1,65,000 164.57 2.10
91 Days Treasury Bills (18/01/2008) 28,000 27.63 0.35
CBLO 243.10 3.11
Total 2,698.20 34.49
Others (Current Assets) 167.30 2.14
Grand Total (Equities +Debt+ MMI + Others) 7,822.29 100.00
Portfolio Turnover Ratio : 0.05 times
Fund Information
Category Open Ended Debt Oriented Balanced Scheme.
Date of Allotment February 01, 1998.
Asset Allocation Debt with MMI - Min 0% upto 60% Equities - Min 0% upto 60%
Minimum Investment Rs. 5,000.00
Plan Offered a) Income Plan
b) Growth Plan
Entry Load 2.25% less than Rs. 200 lac
Nil - Rs. 200 lac and above
Exit Load Nil
Nomination Facility Available to sole / joint individual unit holder/s.
Scheme ideally suited for investors seeking capital appreciation and regular income.
Asset composition as on 31.12.2007(percentage to net assets)
Scheme & Last Last Last Since Benchmark (%) 1 Year 3 Years 5 Years Inception* * * *
Canara Robeco Balance (Growth Plan) 44.35 24.38 23.49 20.02
CRISIL Balanced Fund Index 36.79 28.46 26.77 --
Index data available from 31.03.2002
CAGR has been computed by compounding the NAV annually and reinvesting the pay outs.
Date of inception : 01.02.1998.
NAV as on 31.12.2007 Growth Plan : Rs. 40.44
Income Plan : Rs. 25.17
* Past performance may or may not be sustained in future.
All performance figures are shown net of fees.
Date of Income distribution NAV as on the date declaration per unit (F.V. Rs. 10) of declaration
14.11.1998 0.65 10.22
22.06.1999 0.60 11.76
21.12.1999 0.90 12.71
23.09.2000 1.00 12.66
24.02.2001 0.50 12.02
20.11.2001 1.00 13.46
14.03.2002 0.75 13.27
11.10.2002 0.75 13.33
06.05.2003 0.75 12.88
06.10.2003 0.75 15.72
14.03.2004 1.00 16.26
08.10.2004 0.75 15.34
28.03.2005 1.00 15.10
18.08.2006 1.3155 (Ind. & HUF) 17.25
1.2250 (Others)
Canara Robeco I Monthly Connect | Dec 07 I 9
Performance at a glance as on 31.12.2007
Power I 13.83%
Construction I 9.22%
Industrial Capital Goods I 9.01%
Petroleum Products I 5.89%
Consumer Non Durables I 5.41%
Others I 20.01%
MMI & Others I 36.63%

Scheme Objective : To generate income/capital appreciation by investing in companies
whose securities are included in the S & P CNX Nifty.
Portfolio Statement as on 31.12.2007
Name of the Instrument Industry Classification Quantity Mkt Value % to(Rs. in lac) NAV
Canara Robeco Nifty Index
Open Ended Nifty Linked Equity Scheme
Equities
Reliance Industries Ltd Petroleum Products 3,021 87.09 11.42Oil & Natural Gas Corporation Ltd. Oil 4,445 54.98 7.21National Thermal Power Corporation Ltd Power 17,138 43.00 5.64Bharati Airtel Ltd Telecom - Services 3,942 39.28 5.15Reliance Communication Ltd. Telecom - Services 4,282 31.96 4.19I C I C I Bank Ltd. Banks 2,275 28.18 3.69Bharat Heavy Electricals Ltd Industrial Capital Goods 1,019 26.39 3.46State Bank Of India Banks 1,093 25.92 3.40Larsen & Toubro Ltd. Construction 606 25.25 3.31Steel Authority Of India Ltd Ferrous Metals 8,593 24.45 3.21Tata Consultancy Services Ltd. Software 2,037 21.95 2.88Infosys Technologies Ltd Software 1,187 21.01 2.75Reliance Petroleum Ltd. Petroleum Products 9,364 20.92 2.74H D F C Ltd. Finance 581 16.72 2.19Unitech Ltd. Construction 3,368 16.48 2.16I T C Ltd. Consumer Non Durables 7,828 16.39 2.15Wipro Ltd. Software 3,030 15.93 2.09Sterlite Industries (I) Ltd Non - Ferrous Metals 1,475 15.26 2.00Tata Steel Ltd. Ferrous Metals 1,520 14.22 1.86H D F C Bank Ltd. Banks 736 12.73 1.67Suzlon Energy Ltd. Industrial Capital Goods 597 11.56 1.52Reliance Energy Ltd Power 490 10.46 1.37Hindustan Unilever Ltd Consumer Non Durables 4,581 9.79 1.28GAIL (India) Ltd Gas 1,760 9.57 1.25Cairn India Ltd. Oil 3,701 9.52 1.25Idea Cellular Ltd Telecom - Services 5,466 7.60 1.00Grasim Industries Ltd. Cement 191 6.99 0.92A B B Ltd. Industrial Capital Goods 440 6.65 0.87Tata Power Co. Ltd. Power 449 6.60 0.87Siemens Ltd. Industrial Capital Goods 349 6.60 0.87National Aluminium Co Ltd. Non - Ferrous Metals 1,346 6.53 0.86Satyam Computer Services Ltd. Software 1,383 6.25 0.82Maruti Udyog Ltd Auto 602 5.99 0.79Tata Motors Ltd. Auto 803 5.96 0.78Bajaj Auto Ltd. Auto 211 5.54 0.73Hindalco Industries Ltd Non - Ferrous Metals 2,535 5.45 0.71Sun Pharmaceutical Ind Ltd. Pharmaceuticals 417 5.02 0.66Ambuja Cements Ltd Cement 3,181 4.68 0.61H C L Technologies Ltd Software 1,381 4.55 0.60Videsh Sanchar Nigam Ltd. Telecom - Services 587 4.49 0.59Mahindra & Mahindra Ltd. Auto 510 4.39 0.58Punjab National Bank Banks 657 4.37 0.57Associated Cement Companies Ltd. Cement 393 4.03 0.53Bharat Petroleum Corporation Ltd Petroleum Products 757 3.96 0.52Cipla Ltd. Pharmaceuticals 1,619 3.44 0.45Ranbaxy Laboratories Ltd. Pharmaceuticals 783 3.33 0.44Zee Entertainment Enterprises Ltd Media & Entertainment 904 2.96 0.39Hero Honda Ltd Auto 413 2.87 0.38Dr.Reddy's Laboratories Ltd Pharmaceuticals 348 2.55 0.33Glaxosmithkline Pharma Ltd. Pharmaceuticals 179 1.84 0.24Total 731.65 95.92
Money Market Instruments
CBLO 5.96 0.78Others (Current Assets) 25.18 3.30Grand Total (Equities + MMI +Others) 762.79 100.00Portfolio Turnover Ratio : 0.12 times
Fund Information
Category Open Ended Nifty Linked equity scheme
Date of Allotment 8th October, 2004
Asset Allocation Equities included in S & P CNX Nify 90% to 100% MMI 10%
Plans Offered a) Growth Plan
b) Dividend Plan
Minimum Investment Rs. 5,000.00
Entry Load 1.00 % for investment less than Rs. 10 Lakhs
Rs. 10 Lakhs and above - Nil
Exit Load Nil
Nomination Facility Available to sole / joint individual unit holder/s.
Expenses Ratio 1% of daily average net assets
Ideal for investors seeking returns linked to index.
Scheme & Last Last SinceBenchmark (%) 1 Year 3 Years Inception* * *
Income Distribution (In Rupees)*
Date of Income distribution NAV as on the date declaration per unit (F.V. Rs. 10) of declaration
15.12.2006 7.50 21.16
Asset composition as on 31.12.2007(percentage to net assets)
10 I Canara Robeco I Monthly Connect | Dec 07
Performance at a glance as on 31.12.2007
Petroleum Products I 14.68%
Telecom - Services I 10.92%
Banks I 9.33%
Software I 9.14%
Oil I 8.46%
Others I 43.39%
MMI & Others I 4.08%
Canara Robeco Nifty Index (Growth) 54.80 42.81 44.67
CNX Nifty 57.86 43.86 45.70
CAGR has been computed by compounding the NAV annually and reinvesting the pay outs. Date of inception : 08.10.2004
NAV as on 31.12.2007 Income Plan : Rs. 21.26
Growth Plan : Rs. 32.97
* Past performance may or may not be sustained in future. All performance figures are shown net of fees.

Scheme Objective : To provide long-term capital appreciation with periodic dividend
distribution, if any.
Name of the Instrument Industry Classification Quantity Mkt Value % to(Rs. in lac) NAV
Open Ended Equity Scheme
Portfolio Statement as on 31.12.2007
Equities
Canara Robeco Fortune’94
Money Market Instruments
Larsen & Toubro Ltd. Construction 23,000 959.53 10.64
Reliance Industries Ltd Petroleum Products 30,000 864.32 9.58
Reliance Communication Ltd. Telecom - Services 1,00,000 746.50 8.27
Siemens Ltd. Industrial Capital Goods 30,000 568.02 6.30
National Thermal Power Corporation Ltd Power 2,00,000 500.10 5.54
Kansai Nerolac Paints Ltd. Consumer Non Durables 50,000 431.75 4.79
I T C Ltd. Consumer Non Durables 2,00,000 420.60 4.66
Engineers India Ltd Industrial Capital Goods 40,000 382.74 4.24
Bharat Heavy Electricals Ltd Industrial Capital Goods 13,000 335.95 3.72
J S W Steel Ltd. Ferrous Metals 25,000 329.61 3.65
Automotive Axles Ltd. Auto Ancillaries 49,185 312.32 3.46
Reliance Petroleum Ltd. Petroleum Products 1,00,000 223.20 2.47
Mahindra & Mahindra Ltd. Auto 25,000 215.20 2.39
Hindustan Unilever Ltd Consumer Non Durables 1,00,000 213.90 2.37
Punj Lloyd Ltd Construction 35,000 194.15 2.15
Indian Hotels Ltd. Hotels 1,00,000 159.55 1.77
Tech Mahindra Ltd. Software 10,000 113.21 1.25
I C I C I Bank Ltd. Banks 9,033 111.32 1.23
Ranbaxy Laboratories Ltd. Pharmaceuticals 25,000 106.49 1.18
Sundaram Brake Linings Auto Ancillaries 27,725 103.58 1.15
Sun Pharmaceutical Ind Ltd. Pharmaceuticals 8,000 97.76 1.08
Infosys Technologies Ltd Software 5,000 88.42 0.98
Mphasis Ltd Software 20,000 61.32 0.68
Glaxosmithkline Pharma Ltd. Pharmaceuticals 5,000 51.50 0.57
J B M Auto Ltd. Auto Ancillaries 40,403 28.14 0.31
Total 7,619.18 84.45
Unlisted
Kudremukh Iron Ore Ltd Ferrous Metals 5,95,000 85.26 0.95
Total 7,704.44 85.40
91 Days Treasury Bills (04/01/2008) 2,77,000 274.34 3.04
91 Days Treasury Bills (margin) (11/01/2008) 1,50,000 149.60 1.66
CBLO 271.85 3.01
Total 1,210.43 13.41
Others (Current Assets) 106.83 1.19
Grand Total (Equtiies + Debt + MMI ) 9,021.70 100.00
Portfolio Turnover Ratio : 0.06 times
Scheme & Last Last Last Last SinceBenchmark (%) 1 Year 3 Years 5 Years 10 Years Inception* * * * *
Fund Information
Category Open Ended Equity Scheme.
Date of Allotment 10.01.1995
Asset Allocation Equity and Equity Linked Instruments-Upto 85%
Debt Instruments - Upto 15%
Money Market Instruments - Upto 15%
Minimum Investment Rs. 1000.00
Additional Purchase Rs. 500.00
Repurchase Any Amount
Entry Load 2.25% for Investment of less than Rs. 200 lac
Nil - for investment of Rs. 200 lac and above
Exit Load NIL
Nomination Facility Available to sole / joint individual unit Holder/s.
Ideal Scheme for investors seeking long term capital appreciation
Canara Robeco 46.10 37.56 45.82 19.91 12.64
Fortune’94
BSE 100 59.74 46.60 46.26 21.52 15.38
CAGR has been computed by compounding the NAV annually and reinvesting the pay outs. Date of inception : 10.01.1995
NAV as on 31.12.2007 : Rs. 46.86
* Past performance may or may not be sustained in future. All performance figures are shown net of fees.
Asset composition as on 31.12.2007(percentage to net assets)
Canara Robeco I Monthly Connect | Dec 07 I 11
Performance at a glance as on 31.12.2007
Industrial Capital Goods I 14.26%
Construction I 12.79%
Petroleum Products I 12.05%
Consumer Non Durables I 11.82%
Telecom - Services I 8.27%
Others I 26.21%
MMI & Others I 14.60%
Mutual Fund Units 39,57,762 514.64 5.70

Scheme Objective : To provide risk free return (except interest rate risk) and long term
capital appreciation by investing only in Govt. Securities.
Portfolio Statement as on 31.12.2007
Canara Robeco Gilt PGS
Open Ended Gilt Scheme
Name of the Instrument Mkt Value % to(Rs. in lac) NAV
91 Days Treasury Bills 109.68 99.56Others
CBLO 0.82 0.74
Other Current Assets -0.33 -0.30
Grand Total 110.17 100.00
Average Maturity of Portfolio : 0.03 Years
12 I Canara Robeco I Monthly Connect | Dec 07
Money Market Instruments
Income Distribution (In Rupees)*
Fund Information
Category Open Ended Gilt Scheme.
Date of Allotment December 29, 1999
Asset Allocation Govt. Securities MMI/Call Money -Upto 100%
Plans Offered a) Income Plan
b) Growth Plan
c) Growth Plan with Automatic
Repurchase option
Minimum Investment Rs. 10,000.00
Entry Load Nil
Exit Load Nil
Nomination Facility Available to sole / joint individual unit Holder/s.
Expenses Ratio 2.25% of daily average net assets
Ideal for investments by Provident Funds, Superannuation Funds, Gratuity Funds. Investments can also be made by all class of investors including Individuals, Banks, Corporates, Financial Institutions, Partnership etc. The Scheme does not carry any credit risk as investments are made in Govt. Securities.
Scheme & Last Last Last SinceBenchmark (%) 1 Year 3 Years 5 Years Inception* * * *
Canara Robeco Gilt PGS 7.88 5.33 4.24 8.86
(Growth Plan)
I Sec Li-Bex@ 6.60 6.63 6.07 8.05
Index Data available from 31.03.2002, CAGR has been computed by compounding the NAV annually and reinvesting the pay outs.,
Date of inception : 29.12.1999.
NAV as on 31.12.2007 Growth Plan : Rs. 19.74
Income Plan : Rs. 10.55
* Past performance may or may not be sustained in future. All performance figures are shown net of fees.
Date of Income distribution NAV as on the date declaration per unit (F.V. Rs. 10) of declaration
31.03.2000 0.25 10.0491*
14.07.2000 0.25 10.4033
23.10.2000 0.125 10.1771
19.01.2001 0.25 10.4182
16.03.2001 0.25 10.4138
23.06.2001 0.40 10.6261
05.10.2001 0.40 10.6551
10.12.2001 0.40 10.8531
11.02.2002 0.40 10.9733
14.03.2002 0.20 10.4098
10.07.2002 0.30 10.4242
11.10.2002 0.30 10.4541
30.12.2002 0.50 10.9752
06.05.2003 0.35 10.5312
07.07.2003 0.30 10.3960
06.10.2003 0.30 10.5211
27.04.2004 0.125 10.2549
12.12.2005 0.1973 (Ind. & HUF) 10.3190
0.1838 (Others)
31.08.2007 0.61316 (Ind. & HUF) 10.9393
0.5707 (Others)
* Ex - Dividend
Performance at a glance as on 31.12.2007

Scheme Objective : To generate income as well as capital appreciation by mitigating
interest rate risk by investing in Floating and fixed rate debt Instruments.
Open Ended Debt Scheme
Portfolio Statement as on 31.12.2007
Canara Robeco Floating Rate
Reliance Capital Ltd. ICRA A1+ 48 4,800.00 7.88
Unitech Limited FITCH F1+(IND) 800 3,651.97 6.00
Collateralised Debt Trust Ser.21 A1 CRISIL P1+(SO) 25 2,434.40 4.00
Federal Bank CRISIL P1+ 3285 3,139.03 5.15
Kotak Mahindra Investments Ltd ICRA A1+ 300 3,000.00 4.92
Kotak Mahindra Prime Ltd CRISIL P1+ 280 2,800.00 4.60
Mutual Units 25,00,000 2,727.83 4.48
KEC International Ltd * # ICRA A1+(SO) 540 2,686.61 4.41
L & T Infrastructure Finance Ltd CARE Pr1+ 25 2,500.00 4.10
Ramasarup Industries Ltd CARE Pr1 25 2,500.00 4.10
ICICI Bank ICRA A1+ 2,500 2,401.22 3.94
Graphite India Ltd ICRA A1+ 20 2,000.00 3.28
ULS Trust - Series I FITCH F1+ (IND) (SO) 20 2,061.30 3.38
TIL Ltd CARE Pr1+ 20 2,000.00 3.28
Sterlite Optical Technologies Ltd CRISIL P1 20 2,000.00 3.28
Subros Limited ICRA A1+ 400 1,962.50 3.22
Mukand Ltd. CARE Pr1 15 1,519.19 2.49
Berger Paints India Ltd CRISIL P1+ 15 1,500.00 2.46
Manaksia Ltd CARE Pr1+ 15 1,500.00 2.46
Omaxe Ltd. CARE Pr1 150 1,500.00 2.46
Adani Enterprises Ltd CARE Pr1 150 1,500.00 2.46
Federal Moghul Goetze (India) Ltd CARE Pr1+ 255 1,258.01 2.07
Ramco Systems Ltd ICRA A1+(SO) 10 1,200.00 1.97
Bajaj Hindusthan Ltd. FITCH F1 10 1,000.00 1.64
Shyam Telelink Ltd $ FITCH F1+(SO) 200 988.66 1.62
Collateralised Debt Trust Ser.20 A1 CRISIL P1+(SO) 8 845.13 1.39
Elder Pharmaceuticals Ltd CARE Pr1+ 99 486.89 0.80
Indian Corp. Loan Sec. Trust-Series XL (Ser.A1) ICRA A1+(SO) 5 477.28 0.78
State Bank Of Hyderabad ICRA A1+ 490 457.58 0.75
Axis Bank ICRA A1+ 211 200.08 0.33
Corporate Loan Sec. Series Trust XXXX 06 (Ser A1) CRISIL AAA(SO) 2 105.82 0.17
Indian Corp. Loan Sec. Trust-Series XL (Ser.A2) ICRA A1+(SO) 15 81.12 0.13
91 Days Treasury Bills 3,204.44 5.26
CBLO 27.18 0.04
Total 60,516.24 99.34
Others 398.46 0.66
Grand Total 60,914.70 100.00
Average Portfolio Maturity : 0.29 Years
$ : Standby facility by ICICI Bank, * : Standby facility by ICICI Bank, # : Standby facility by Allahabad Bank
Name of the Instrument Rating Quantity Mkt Value % to(Rs. in lac) NAV
Money Market Instruments
Canara Robeco I Monthly Connect | Dec 07 I 13
Income Distribution (In Rupees)*
Scheme & Last SinceBenchmark (%) 1 Year Inception* *
Canara Robeco Floating Rate 8.34 7.20
Crisil Liquid Fund Index 7.61 --
Date of inception : 04.03.2005
NAV as on 31.12.2007
Short Term Plan : Dividend Option : Rs. 11.6987
Growth Option : Rs. 12.1665
Weekly Dividend Reinvestment Option : Rs. 10.2701
Daily Dividend Reinvestment Option : Rs. 10.2600
* Past performance may or may not be sustained in future. All performance figures are shown net of fees.
Date of Income distribution NAV as on the date declaration per unit (F.V. Rs. 10) of declaration
09.12.2005 0.3267(Others) 10.4499
0.3508 (Ind. & HUF) 10.4499
Fund Information
Category Open Ended Debt Scheme.
Date of Allotment 4th March, 2005.
Asset Allocation Floating Rate Debt Instruments and
Derivative 0 - 35%
Fixed Rate Debt and Derivatives
Instruments 0 - 65%
Minimum Investment Rs. 5000.00
Entry Load Nil
Exit Load Nil
Option 1) Short Term Plan
a) Growth Option
b) Dividend Option
c) Weekly Dividend Reinvestment Option
d) Daily Dividend Reinvestment Option
2) Long Term Plan
a) Growth Option
b) Dividend Option
Nomination Facility Available to sole / joint individual unit holder/s.
Expenses Ratio Short Term Plan
0.40% of daily average net assets
Long Term Plan
0.75% of daily average net assets
Ideal investment option for investors seeking income through a low risk investment strategy.
Performance at a glance as on 31.12.2007
Rated mfA1+ by ICRA*
Credit Risk Rating mfA1+ by ICRA*
* Indicates that the lowest credit risk in the short term and are similar to that of fixed income obligations of highest-credit-quality category with maturity upto one year. This rating should however, not be construed as an indication of the performance of the Mutual Fund scheme or of volatility in its returns. The rating should not be treated as a recommendation to buy, sell or hold the units issues under the Scheme.

Scheme Objective : To generate income through investment in Debt and Money Market
securities of different maturity and issuers of different risk profiles.
Portfolio Statement as on 31.12.2007
14 I Canara Robeco I Monthly Connect | Dec 07
Canara Robeco Income
Open Ended Debt Scheme
Name of the Instrument Mkt Value % to(Rs. in lac) NAV
Money Market Instruments
91 Days Treasury Bills 109.68 99.56Others
CBLO 0.82 0.74
Other Current Assets -0.33 -0.30
Grand Total 110.17 100.00
Average Maturity of Portfolio : 0.03 Years
Fund Information
Category Open Ended Debt Scheme.
Date of Allotment 19th September, 2002
Asset Allocation Debt - Upto 100%
MMI/Call - Upto 20%
Plans Offered a) Growth Plan
Automatic Repurchase Option
b) Income Plan
c) Bonus Plan
Minimum Investment a) Growth Plan: 10,000.00
Automatic Repurchase Option: 20,000.00
b) Income Plan:10,000.00
c) Bonus Plan: 20,000.00
Entry Load Nil
Exit Load Up to Rs 5.00 lakh : 0.50% for exit within 6 months
Nomination Facility Available to sole/joint individual unit holder/s.
Insurance Free Personal Accident Insurance cover up to twice the face value of the unit holding subject to maximum cover of Rs.25.00 lakhs provided as an additional feature to Resident Individual Unit Holder / Karta incase of HUF and Principal Partner in Case of Partnership Firm.
Expenses Ratio 1.25% of daily average net assets.
Ideal investment option for investors looking for investment with low to medium risk.
Scheme & Last Last Last SinceBenchmark (%) 1 Year 3 Years 5 Years Inception* * * *
Canara Robeco Income 6.51 6.93 5.82 6.51 (Growth Plan)
Composite Bond Fund Index 6.96 5.20 4.64 5.38
CAGR has been computed by compounding the NAV annually and reinvesting the pay outs. Date of inception : 19.09.2002
NAV as on 31.12.2007 Growth Plan : Rs. 12.69
Income Plan : Rs. 13.95
Bonus Plan : Rs. 12.78
* Past performance may or may not be sustained in future. All performance figures are shown net of fees.
Date of Income distribution NAV as on the date declaration per unit (F.V. Rs. 10) of declaration
30.12.2002 0.30 10.4960
06.05.2003 0.20 10.3246
26.07.2003 0.20 10.3731
06.10.2003 0.20 10.3607
Date of Ratio NAV as on the date declaration of declaration
30.12.2002 0.0293 : 1 10.4960
06.05.2003 0.0197 : 1 10.3246
26.07.2003 0.0196 : 1 10.3731
06.10.2003 0.0197 : 1 10.3607
Income Distribution (In Rupees)*
Bonus History (Bonus Plan)*
Performance at a glance as on 31.12.2007

Scheme Objective : To generate income / capital appreciation through a low risk
strategy by investment in Debt securities and Money Market Instruments.
Open Ended Debt Scheme
Portfolio Statement as on 31.12.2007
Canara Robeco Liquid Plus
Fund Information
Income Distribution (In Rupees)*
Scheme & Last Last SinceBenchmark (%) 1 Year 3 Years Inception* * *
Canara Robeco Canliquid Plus : Growth 9.56 7.04 6.32
Crisil Liquid Fund Index 7.61 6.05 5.44
CAGR has been computed by compounding the NAV annually andreinvesting the pay outs. Date of inception : 16.09.2003
NAV as on 31.12.2007
Retail Plan
Income Option : Rs. 12.7889
Growth Option : Rs. 13.0033
Daily Dividend Option : Rs. 12.4071
Institutional Plan
Growth Option : Rs. 13.0033
Daily Dividend Option : Rs. 12.4071
Weekly Dividend : Rs. 12.4196
* Past performance may or may not be sustained in future. All performance figures are shown net of fees.
Date of Income distribution NAV as on the date declaration per unit (F.V. Rs. 10) of declaration
14.03.2004 0.15 10.2479
Category Open Ended Debt Scheme.
Date of Allotment 16th September, 2003
Asset Allocation MMI/Call - Upto 100% Debt Upto 80%
Plans Offered Retail Plan
a) Income Option
b) Growth Option
c) Daily Dividend Reinvestment Option
Institutional Plan
a) Daily Dividend Reinvestment Option
b) Weekly Dividend Reinvestment Option
c) Weekly Dividend Payout Option
d) Growth Option
Minimum Investment Retail Plan :
Rs 5000/- under each option and in multiples of Re. 1/- thereafter.
Institutional Plan :
Rs 50 Lakhs under each option and in multiples of Re. 1/-, thereafter.
Entry Load Nil
Exit Load Nil
Nomination Facility Available to sole/joint individual unit holder/s.
Expenses Ratio 0.40% of daily average net assets
Ideal investment option for investors seeking income through a low risk investment strategy.
Money Market Instruments
Canara Robeco I Monthly Connect | Dec 07 I 15
Performance at a glance as on 31.12.2007
Name of the Instrument Rating Quantity Mkt Value % to (Rs. in lac) NAV
Unitech Limited FITCH F1+(IND) 1,473 6,739.49 11.09
Standard Chartered Bank CRISIL P1+ 5,000 4,912.39 8.08
ICICI Bank ICRA A1+ 5,000 4,605.60 7.58
HDFC Ltd. ICRA A1+ 597 2,764.16 4.55
Adani Enterprises Ltd. CARE Pr1 250 2,500.00 4.11
Collateralised Dbt. Trust Series 21 CRISIL P1+(SO) 25 2,434.40 4.00
Kotak Mahindra Bank CRISIL P1+ 2,500 2,354.95 3.87
Punjab National Bank FITCH F1+ 2,500 2,323.54 3.82
IDBI Home Finance Ltd. ICRA A1+ 500 2,306.18 3.79
Infrastructure Leasing & Finance Serv. Ltd. FITCH F1+ 500 2,305.07 3.79
Indian Corp. Loan Secu. Trust Ser XL A1 ICRA A1+(SO) 20 1,909.13 3.14
State Bank of Hyderabad CRISIL P1+ 2,010 1,880.88 3.09
Shyam Telelink Ltd. * FITCH F1+(IND) 340 1,678.03 2.76
Magma Shrachi Finance Ltd CARE Pr1+ 10 1,000.00 1.65
Corp. Loan Sec. Trust Ser A2 Ser.XXXX 06 CRISIL AAA(SO) 10 964.25 1.59
India Loan Securitisation Ser. VI Trust 06 CRISIL AAA(SO) 25 946.44 1.56
Reliance Capital Ltd. ICRA A1+ 9 900.00 1.48
Collateralised Dbt. Trust Series 20 A1 ICRA A1+(SO) 8 845.13 1.39
Federal Mogul Goetze (I) Ltd CARE Pr1+ 145 714.94 1.18
Mukand Ltd CARE Pr1 5 506.40 0.83
AXIS Bank ICRA A1+ 519 489.09 0.80
Elder Pharmaceuticals Ltd. CARE Pr1+ 66 324.21 0.53
Federal Bank CRISIL P1+ 331 315.41 0.52
Collateralised Dbt. Trust Series 20 A2 ICRA A1+(SO) 3 227.53 0.37
Indian Corp. Loan Secu. Trust Ser XL A2 ICRA A1+(SO) 10 54.08 0.09
91 Days Treasury Bills 12,748.14 20.97
CBLO 14.44 0.02
Total 58,763.88 96.66
Others 2,024.66 3.34
Grand Total 60,788.54 100.00
Average Portfolio Maturity : 0.46 Years
* Standby facility by ICICI Bank
Rated mfAAA+ by ICRA*
Credit Risk Rating mfAAA by ICRA*
*Indicates that the rated debt fund carries the lowest credit risk, similar to that associated with long-term debt obligations rated in the highest credit quality category. This rating should however, not be construed as an indication of the performance of the Mutual Fund scheme or of volatility in its returns. The rating should not be treated as a recommendation to buy, sell or hold the units issues under the Scheme.

Open Ended Cash Management Scheme
Scheme Objective : Enhancement of Income, while maintaining a level of liquidity
through, investment in a mix of MMI & Debt securities.
Portfolio Statement as on 31.12.2007
Debt Investments
Money Market Instruments
Canara Robeco Liquid
Privately Placed / Unlisted
LIC Housing Finance Ltd CRISIL AAA 50 500.00 1.26
Total 500.00 1.26
Shyam Teleink Ltd ** FITCH F1+(SO) 610 2,991.60 7.56
Reliance Capital Ltd ICRA A1+ 25 2,500.00 6.32
India Infoline Investments Services Ltd ICRA A1 25 2,500.00 6.32
Magma Shrachi Finance Ltd CARE Pr1+ 25 2,500.00 6.32
Indian Bank FITCH F1+ 2500 2,419.19 6.11
Export Import Bank of India CRISIL P1+ 500 2,377.72 6.01
Unitech Ltd FITCH F1+(Ind) 500 2,286.26 5.78
Elder Pharmaceuticals Ltd CARE Pr1+ 435 2,139.37 5.41
Sterlite Optical Technologies Ltd CRISIL P1 20 2,000.00 5.05
Berger Paints India Ltd CRISIL P1+ 20 2,000.00 5.05
Shoppers Stop Ltd CRISIL P1+ 400 1,962.17 4.96
Omaxe Ltd CARE Pr1 150 1,500.00 3.79
Federal Bank CRISIL P1+ 1384 1,327.68 3.36
ULS Trust Series 1 FITCH F1+(Ind)(SO) 22 1,236.78 3.13
Collaterilised debt Trust Series 21 CRISIL P1+(SO) 18 1,181.07 2.99
Ace Glass Containers Ltd CARE PR1+(SO) 10 1,000.00 2.53
Adani Enterprises Ltd CARE Pr1 100 1,000.00 2.53
HCL Infosystems Ltd ICRA A1+ 200 993.71 2.51
United Shippers Ltd @ CRISIL P1+(SO) 200 987.21 2.50
Federal Moghul Goetze(I) Ltd CARE Pr1+ 200 984.61 2.49
Collaterilised Debt Trust Series 20 CRISIL P1+(SO) 6 633.85 1.60
Mukand Ltd CARE Pr1 5 506.40 1.28
Axis Bank ICRA A1+ 270 256.03 0.65
91 Days Treasury Bills 1,462.37 3.70
CBLO 0.59 0.00
Total 38,746.61 97.93
Others 318.46 0.81
Grand Total 39,565.07 100.00
Average Portfolio Maturity : 0.31 Years
** Standby facility by ICICI Bank Ltd, @ Standby facility by Canara Bank
Fund Information
Category Open Ended Liquid Scheme.Date of Allotment 15th January, 2002 (Retail)
31st May, 2004 (Institutional)Asset Allocation MMI/Call - Upto 100% Debt - Upto 35%Plans Offered a) Retail Plan
Daily Div. Reinvestment OptionGrowth Option
b) Institutional PlanDaily Div. Reinvestment OptionWeekly Dividend Reinvestment OptionWeekly Dividend Payout OptionGrowth Option
Minimum Investment Rs. 25,000.00 (Retail)Rs. 50,00,000.00 (Institutional)
Entry Load NilExit Load NilNomination Facility Available to sole / joint individual unit
holder/s.Expenses Ratio 0.40% of daily average net assetsIdeal Scheme for Individuals / HNIs / Banks / Institutions and Corporates to park their short term cash surpluses and earn reasonable returns.
Scheme & Last Last Last SinceBenchmark (%) 1 Year 3 Years 5 Years Inception* * * *
Canara Robeco Liquid 7.73 6.70 6.09 6.36(Growth Plan) RetailCRISIL Liquid Fund Index 7.61 6.05 -- --Index data available from 31.03.2002 CAGR has been computed by compounding the NAV annually and reinvesting the pay outs. Date of inception : 15.01.2002NAV as on 31.12.2007Growth Option Retail : Rs. 14.4490Daily Dividend Reinvestment Option Retail : Rs. 10.0410Growth Option Institutional : Rs. 14.4595Daily Dividend Reinvestment Option Institutional : Rs. 10.0410Weekly Dividend Reinvestment Option Institutional : Rs. 10.0410* Past performance may or may not be sustained in future. All performance figures are shown net of fees.
Name of the Instrument Rating Quantity Mkt Value % to (Rs. in lac) NAV
Asset composition as on 31.12.2007(percentage to net assets)
MMI & Others I 96.79%MMI & Others I 96.79%
16 I Canara Robeco I Monthly Connect | Dec 07
Debt Instruments l 1.26%
MMI l 97.93%
Others l 0.81%
Performance at a glance as on 31.12.2007
Rated mfA1+ by ICRA*
Credit Risk Rating mfA1+ by ICRA*
* Indicates that the debt funds rated in this category carry the lowest credit risk in the short term and are similar to that of fixed income obligations of highest-credit-quality category with maturity upto one year. This rating should however, not be construed as an indication of the performance of the Mutual Fund scheme or of volatility in its returns. The rating should not be treated as a recommendation to buy, sell or hold the units issues under the Scheme.

Addendum
Notice-cum-addendum 31.12.2007
This addendum dated 31st December 2007
1. Board of Directors of the AMC.
The following new appointments have been made on the Board of Directors.
Mr. Naveen Kumar Kshatriya(Independent Director)
Ms. Maria J .W. KlerkxAlternate to Associate Director, Mr C.T.L. Korthout
Mr. Robert Pavrey (Independent Director) ceased to be a Director.
The above changes are effective from 19th December 2007.
2. Board of Trustees
a) Mr. K.K. Rai (Independent Trustee) Ceased to be a Director in The Andhra Pradesh Paper Mills Ltd. upon withdrawal of nomination by IDBI Bank with effect from 6th November 2007.
b) Mr. Raj Kumar Aggarwal (Independent Trustee) Appointed as Independent Director of BOB Capital Markets Ltd. with effect from 20th December 2007.
3. Key Personnel
The following new addition has been made:
Name & Designation Age Qualification Total experience & assignment during the last ten years
Mr. Sanjay SanthanamHead Sales & Marketing ANZ Grindlays Bank and 7.5 years in Sundaram BNP Paribas Mutual Fund.
4. Fund Management
Mr. Umesh Kamath ceased to be the fund manager of Canara Robeco Balance, Canara Robeco Emerging Equities, Canara Robeco Balance II, Canara Robeco Multicap and Canara Robeco Infrastructure Schemes from 15.12.2007.
Mr. U. Prabhakar Bhat, M Com, LLB, CAIIB appointed as fund manager ofCanara Robeco Balance, Canara Robeco Emerging Equities, Canara Robeco Balance II, Canara Robeco Multicap and Canara Robeco Infrastructure Schemes with effect from 15.12.2007. Mr U. Prabhakar Bhat carries nine years experience in commercial banking and seventeen years of experience in fund management and operations.
This addendum forms an integral part of the offer documents of the Schemes of Canara Robeco Mutual Fund.
51, Hill Park, A.G. Bell Marg, Malabar Hill, Mumbai 400 006.
Robeco Groep N.V, Coolsingel,120, NL 3011AG, Rotterdam.
40 B.Tech, PGDM 16.5 years of which 2 years in Lintas India Ltd. 4 years in Contact Advertising, 3 years in(IIM, Bangalore)
Notice-cum-addendum 03.01.2008
Notice is hereby given to all existing / prospective investors of the Schemes of Canara Robeco Mutual Fund that no entry load shall be charged in case of direct applications received by the AMC and not routed through any distributor / agent / broker i.e applications received through the internet (as and when this facility is made available) or submitted to the AMC collection centre / Sales Offices. These provisions shall be applicable for investments in all the existing schemes directly by the investor under the same folio and switch-in to a scheme from other schemes if such a transaction is done directly by the investor.
All the other terms and conditions of the respective schemes' Offer Documents will remain unchanged.
This addendum forms an integral part of the Offer Documents of the respective Schemes, read with the addenda issued from time to time.
Statutory Details : Canara Robeco Mutual Fund (CRMF) has been set up as a Trust under Indian Trust Act, 1882. Sponsors : Canara Bank, Head Office, 112 J C Road, Bangalore; Robeco Groep N.V., Coolsingel 120, 3011Rotterdam, Netherlands.
Risk Factors : Mutual Funds and securities investments are subject to market risks and there can be no assurance or guarantee that the objectives of the Scheme will be achieved. As with any investment in securities, the NAV of the units issued under the Schemes may go up or down depending on the various factors and forces affecting capital markets and money markets. Past performance of the sponsors / Investment Manager / Mutual fund does not indicate the future performance of the Scheme and may not necessarily provide a basis of comparison with other investments. The Sponsors of the Fund are not responsible or liable for any loss or shortfall resulting from the operations of the Schemes of CRMF, beyond the initial contribution of a sum of Rs. 10 lacs towards setting up of CRMF. Investors should read the Offer Document for Scheme specific risk factors and other details before investing.
Canara Robeco I Monthly Connect | Dec 07 I 17

This document is issued for information purposes only and not be considered as an offer to sell or solicitation of an offer to buy any security. You are advised to make your own independent judgement with respect to to any matter contained herein. Published by Shri V. Ramesh Nayak, SVP on behalf of Canara Robeco Mutual Fund through the Investment Manager at Construction House, 4th Floor, 5, Walchand Hirachand Marg, Ballard Estate, Mumbai - 400 001. and Printed at Leo Press , 408 A, Byculla Service Industries, Byculla E, Mumbai 400 027.
Ahmedabad:tel: (079) 66610423 Bangalore : Tel.: (080) 25594730, 25594731 Bhopal : Tel.: (0755) 3013648 Chandigarh : Tel: (0172) 2648007 Chennai : Tel.: (044) 28492598 Coimbatore :
Tel: (0422) 2546453 Delhi : Tel.: (011) 23326417 Goa : Tel.: (0832) 2422415, 6450631 Hyderabad : Tel.: (040) 23261481/1482 Kochi : Tel.: (0484) 2364846 Kolkata : Tel.: (033) 30288275,
30283275 Kottayam : Tel: (0481) 2583122 Ludhiana : Tel.: (0161)2421333 Mangalore : Tel: (0824) 2448804 Mumbai : Tel.: (022) 22621371/66585000-5010 Nagpur : Tel.: (0712) 6615364
Patna : Tel.: (0612) 2227950 Pune : Tel.: (020) 65240556 Surat : Tel.: (0261) 6554243 Trichy : Tel.: (0431) 2750130 Vadodara : Tel: (0265) 2326483 Visakhapatnam : Tel.: (0891) 6556645
Registrar & Transfer Agents for Canara Robeco Equity DiversifiedCanara Robeco ExpoCanara Robeco TaxSaver Canara Robeco Nifty IndexCanara Robeco IncomeCanara Robeco BalanceCanara Robeco CIGO
M/s. Canbank Computer Services Ltd. IV, Naveen Complex, 14, M. G. RoadBangalore 560 001.Tel : (080) 2532 0541/42/43Fax : (080) 2532 0544E-mail : [email protected]
Registrar & Transfer Agents for Canara Robeco Emerging EquitiesCanara Robeco Infrastructure Canara Robeco Floating RateCanara Robeco Liquid PlusCanara Robeco Liquid
Computer Age Management Services Pvt. Ltd.178/10 K.H. Road, Opp. Palmgroove Hotel Nungambakkam Chennai 600 034.Tel No.: (044) 39115574, 39115583Email : [email protected]
Registrar & Transfer Agents for Canara Robeco Gilt PGS
Canara Robeco Asset Management Company Ltd.Construction House, 4th Floor5, Walchand Hirachand Marg Ballard Estate, Mumbai 400 001.Tel. No. (022) 22621371, 66585000 -10Email : [email protected]
Registrar and transfer agents
Branch offices
Notes : The disclosures relating to portfolio Turn over Ratio (for equity segment) is based on the aggregate market value of equity as on 31.12.2007 The disclosures of average maturity period relates to the debt component of the portfolio as on 31.12.2007
Unclaimed Dividends : Those Investors who have not received/encashed the Dividends distributed by the Schemes, may write to respective registrar, duly furnishing the Name of the Scheme, Folio No. and Details of the Dividends not received.
Statutory Details : Canara Robeco Mutual Fund (CRMF) has been set up as a Trust under Indian Trust Act, 1882. Sponsors : Canara Bank, Head Office, 112 J C Road, Bangalore; Robeco Groep N.V., Coolsingel 120, 3011 Rotterdam, Netherlands. Investment Manager : Canara Robeco Asset Management Co. Ltd. (CR AMC) Risk Factors : Mutual Funds and securities investments are subject to market risks and there can be no assurance or guarantee that the objectives of the Schemes will be achieved. As with any investment in securities, the NAV of the units issued under the Schemes may go up or down depending on the factors and forces affecting the securities market. Past performance of the Sponsors/AMC/Mutual Fund do not guarantee future performance of the Schemes. The Sponsors of the Fund are not responsible or liable for any loss or shortfall resulting from the operations of the Schemes of CRMF, beyond the initial contribution of a sum of Rs. 10 lac towards the setting up of CRMF. Investors should read the Offer Document for Scheme specific risk factors and other details before investing.
Registrar & Transfer Agents for Canara Robeco Balance IICanara Robeco Fortune '94 Canara Robeco Multicap
M/s. Karvy Computershare Pvt. Limited“Karvy Plaza” H. No. 8-2-596 Avenue 4Street No. 1 Banjara HillsHyderabad - 500 034.Tel No.: (040) 23394436, 23397901,23312454, 23320751/752Fax No.: (040) 23311968Email : [email protected]


