BioProcessingTrends & Developments in BioProcess Technology
J O U R N A L
A Production of BioProcess Technology Network
Fall 2012 BioProcessing Journal • • www.bioprocessingjournal.com4
TRENDS & DEVELOPMENTS IN BIOPROCESS TECHNOLOGY
Cell-Based Potency Assays: Expectations and Realities
By ROBERT D. SCHROCK
IntroductionPotency is typically thought of as “the capacity of a
product to produce an expected biological activity.” In more formal language, the International Conference on Harmonization (ICH) (section Q6B, Guidance for Industry: Specifications: Test Procedures and Acceptance Criteria for Biotechnological/Biological Products)[1] defines potency as “…the quantitative measure of biological
activity based on the attribute of the product that is linked to the relevant biological properties...” A potency assay should be designed to:
Potency assays should be intended for use in lot release, to demonstrate lot-to-lot consistency, and indicate stability. Finally, the assay should be robust enough that it can be validated.
The demonstration of potency can range from animal models to cell-based assay systems that incorporate direct measurement of a biological activity. In vivo animal models that measure, for example, weight gain/loss or antibody titer, can be a direct measure of biological activity in a dose-dependent response. However, this type of assay is very difficult to validate. Ex vivo assays utilize cultures of primary cells from a specific tissue upon which the product has activity. Examples of this approach are signaling pathways and activities of growth factors or hormones. Due to a lack of a consistent and well-characterized cell bank, these assays can have considerable variability. In vitro cell-based assays include well-characterized cell banks and often incorporate biochemical methods such as protein kinase activation, transgene expression, or reporter gene expression. Based on considerations of variability, reproducibility, and cost, the goal should be to develop a cell-based potency assay with a measurable, quantitative endpoint.
ABOUT THE AUTHOR
Robert D. Schrock, PhD ([email protected]), Head of Quality Control Lonza Viral-Based Therapeutics, 8066 El Rio St., Houston, Texas USA | Phone: 713-568-6190
Fall 2012 BioProcessing Journal • • www.bioprocessingjournal.com5
The primary regulatory guidances are listed in Table1.TheUnitedStatesPharmacopeialConvention(USP)<111>[2] is applicable primarily toward the use of in vivo potency assays —typically animal models or microbiologicalassays.Recentpublications,USP<1032>[3], <1033>[4],and<1034>[5] have much more information applicable to cell-based potency assays. These guidances expand on expected attributes of potency assays and describe various types of assays and parameters that are to be included during validation.
Lifecycle of Potency Assay Development Development of the potency assay should be initiated
early in the product lifecycle, during pre-clinical stages. Potency assays are typically the most challenging to implement as the molecular mechanisms of therapy need to be understood to some extent. The basic requirements of the assay should be demonstrated: (a) quantitative; (b) specific to the product; and (c) stability-indicating. By Phase 1 stage, important parameters (i.e., temperatures, range, incubation limits, curve fit reliability) should be defined (as part of the general qualification assay). It may be acceptable for the assay specification to be “report results” at this stage until enough data points are collected to determine an acceptable range. Once these parameters are known, pre-validation (planning of validation strategy) activities should be underway by the time the product is in Phase 2 trials. Full validation work should be underway by late Phase 2 and early Phase 3 stages. At
this point, the assay method should be pretty well locked down, although refinements that improve efficiency, repeatability, and robustness can be implemented. It is important that no fundamental changes to the assay are made at this point unless the intent is to perform comparison studies to demonstrate clear advantages in the method. By the time the product enters Phase 2 trials, specifications should be set. The specification range can be wide, perhaps stating a minimum value, with the intention of narrowing this range based on data from multiple production lots (Table 2).
In Vitro Cell-Based Potency Assay ApproachesAs mentioned earlier, the overarching premise behind
cell-based potency assays is to demonstrate that a product has the expected biological activity. This is typically customized based on the product. For example, infection of a tumor cell line with an adenoviral product that delivers an important tumor suppressor gene would cause growth inhibition and cell death. When compared to an “ad-empty” vector that does not contain the tumor suppressor, the therapeutic vector concentration that inhibits cell growth (IC50) for this cell line is much lower than for the control vector.[10] Another example is an enzyme delivered by a recombinant virus that activates an inert pro-drug given in trans. The activated drug then inhibits growth in a specific cell line.[11] In all cases, the activity measured is calculated and statistical analysis can be applied to the data. It is advantageous to identify a
TABLE 1. Regulatory publications.
TABLE 2. Lifecycle of potency assay development and validation.
Fall 2012 BioProcessing Journal • • www.bioprocessingjournal.com6
RS(intheseexamples,awell-characterizedviruslot)tobe used to show assay comparability, determine system suitability parameters, and to follow assay trending.
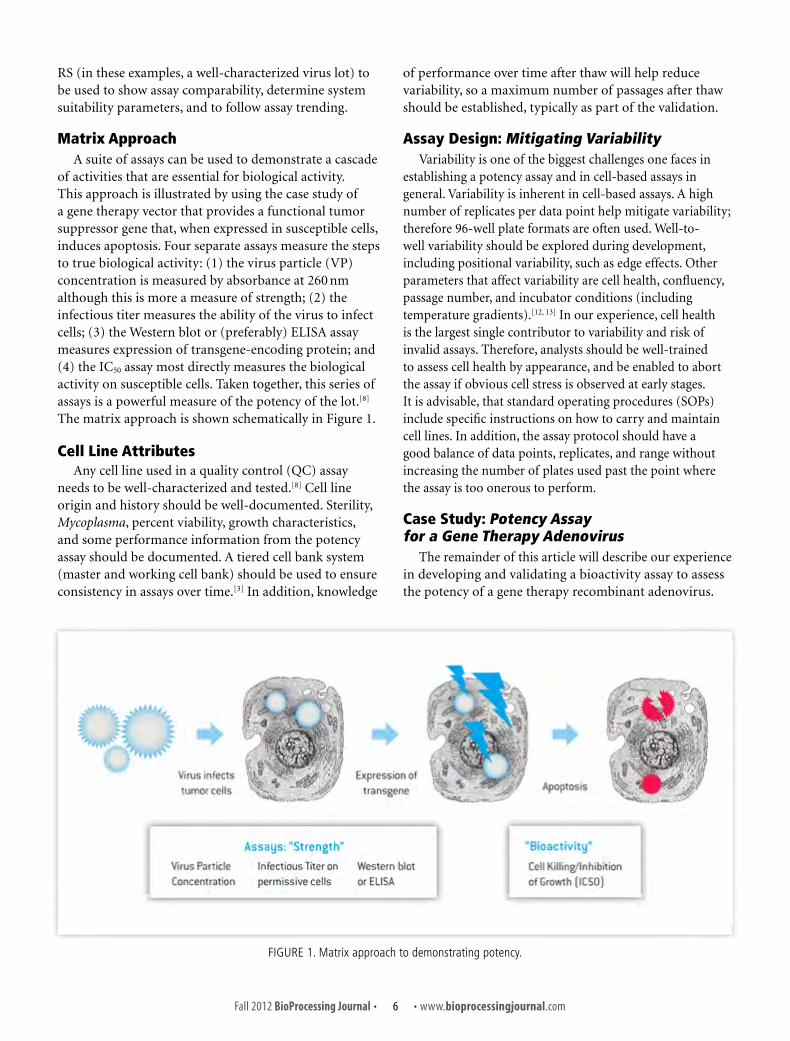
Matrix ApproachA suite of assays can be used to demonstrate a cascade
of activities that are essential for biological activity. This approach is illustrated by using the case study of a gene therapy vector that provides a functional tumor suppressor gene that, when expressed in susceptible cells, induces apoptosis. Four separate assays measure the steps to true biological activity: (1) the virus particle (VP) concentration is measured by absorbance at 260 nm although this is more a measure of strength; (2) the infectious titer measures the ability of the virus to infect cells;(3)theWesternblotor(preferably)ELISAassaymeasures expression of transgene-encoding protein; and (4) the IC50 assay most directly measures the biological activity on susceptible cells. Taken together, this series of assays is a powerful measure of the potency of the lot.[8] The matrix approach is shown schematically in Figure 1.
Cell Line Attributes Any cell line used in a quality control (QC) assay
needs to be well-characterized and tested.[8] Cell line originandhistoryshouldbewell-documented.Sterility,Mycoplasma, percent viability, growth characteristics, and some performance information from the potency assay should be documented. A tiered cell bank system (master and working cell bank) should be used to ensure consistency in assays over time.[3] In addition, knowledge
of performance over time after thaw will help reduce variability, so a maximum number of passages after thaw should be established, typically as part of the validation.
Assay Design: Mitigating VariabilityVariability is one of the biggest challenges one faces in
establishing a potency assay and in cell-based assays in general. Variability is inherent in cell-based assays. A high number of replicates per data point help mitigate variability; therefore 96-well plate formats are often used. Well-to-well variability should be explored during development, including positional variability, such as edge effects. Other parameters that affect variability are cell health, confluency, passage number, and incubator conditions (including temperature gradients).[12, 13] In our experience, cell health is the largest single contributor to variability and risk of invalid assays. Therefore, analysts should be well-trained to assess cell health by appearance, and be enabled to abort the assay if obvious cell stress is observed at early stages. Itisadvisable,thatstandardoperatingprocedures(SOPs)include specific instructions on how to carry and maintain cell lines. In addition, the assay protocol should have a good balance of data points, replicates, and range without increasing the number of plates used past the point where the assay is too onerous to perform.
Case Study: Potency Assay for a Gene Therapy Adenovirus
The remainder of this article will describe our experience in developing and validating a bioactivity assay to assess the potency of a gene therapy recombinant adenovirus.
FIGURE 1. Matrix approach to demonstrating potency.
Fall 2012 BioProcessing Journal • • www.bioprocessingjournal.com7
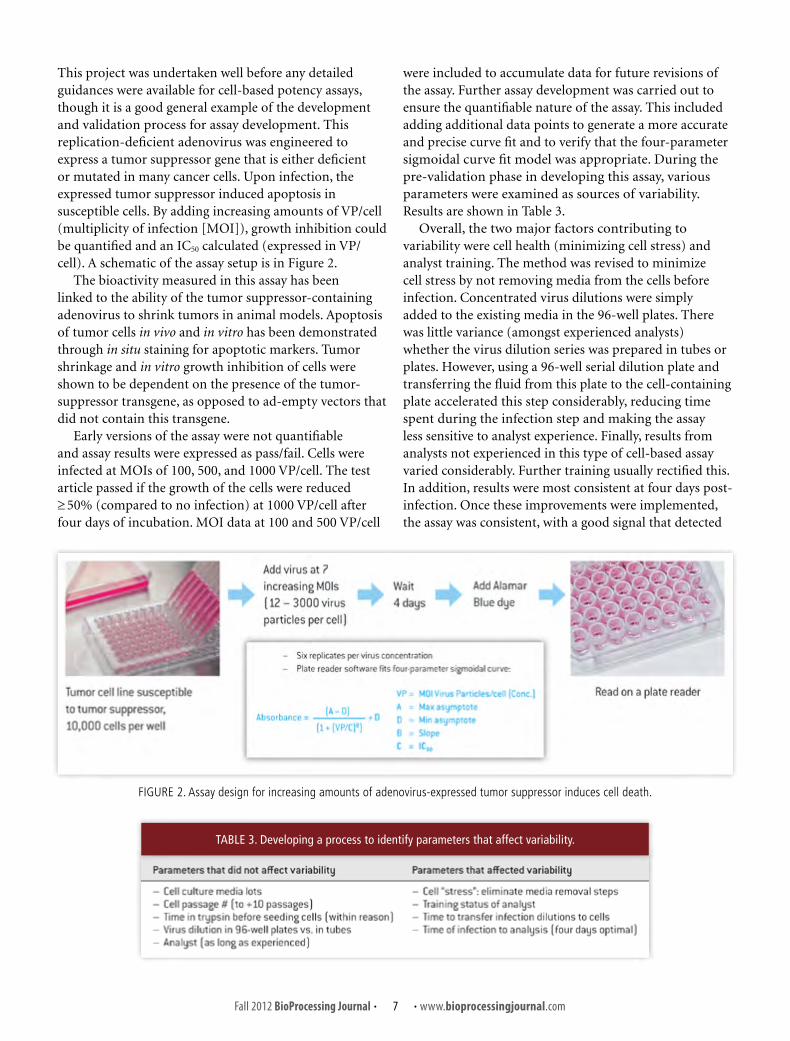
This project was undertaken well before any detailed guidances were available for cell-based potency assays, though it is a good general example of the development and validation process for assay development. This replication-deficient adenovirus was engineered to express a tumor suppressor gene that is either deficient or mutated in many cancer cells. Upon infection, the expressed tumor suppressor induced apoptosis in susceptible cells. By adding increasing amounts of VP/cell (multiplicityofinfection[MOI]),growthinhibitioncouldbe quantified and an IC50 calculated (expressed in VP/cell). A schematic of the assay setup is in Figure 2.
The bioactivity measured in this assay has been linked to the ability of the tumor suppressor-containing adenovirus to shrink tumors in animal models. Apoptosis of tumor cells in vivo and in vitro has been demonstrated through in situ staining for apoptotic markers. Tumor shrinkage and in vitro growth inhibition of cells were shown to be dependent on the presence of the tumor-suppressor transgene, as opposed to ad-empty vectors that did not contain this transgene.
Early versions of the assay were not quantifiable and assay results were expressed as pass/fail. Cells were infectedatMOIsof100,500,and1000VP/cell.Thetestarticle passed if the growth of the cells were reduced ≥ 50% (compared to no infection) at 1000 VP/cell after fourdaysofincubation.MOIdataat100and500VP/cell
were included to accumulate data for future revisions of the assay. Further assay development was carried out to ensure the quantifiable nature of the assay. This included adding additional data points to generate a more accurate and precise curve fit and to verify that the four-parameter sigmoidal curve fit model was appropriate. During the pre-validation phase in developing this assay, various parameters were examined as sources of variability. ResultsareshowninTable 3.
Overall, the two major factors contributing to variability were cell health (minimizing cell stress) and analyst training. The method was revised to minimize cell stress by not removing media from the cells before infection. Concentrated virus dilutions were simply added to the existing media in the 96-well plates. There was little variance (amongst experienced analysts) whether the virus dilution series was prepared in tubes or plates. However, using a 96-well serial dilution plate and transferring the fluid from this plate to the cell-containing plate accelerated this step considerably, reducing time spent during the infection step and making the assay less sensitive to analyst experience. Finally, results from analysts not experienced in this type of cell-based assay varied considerably. Further training usually rectified this. In addition, results were most consistent at four days post-infection. Once these improvements were implemented, the assay was consistent, with a good signal that detected
TABLE 3. Developing a process to identify parameters that affect variability.
FIGURE 2. Assay design for increasing amounts of adenovirus-expressed tumor suppressor induces cell death.
Fall 2012 BioProcessing Journal • • www.bioprocessingjournal.com8
to cell-based potency assay validation. Detailed statistical analyses that can be applied to this type of assay will not be covered in this article. Discussions of statistical analysis as it applies to biological assays canbefoundinUSP35-NF30chapters<1032>[3], <1033>[4],<1034>[5] and in EP chapter 5.3.[9]
AccordingtoUSP<1033>[4], the validation parameters that should be addressed in a cell-based potency assay are: linearity, relative accuracy, and intermediate precision (IP) which includes repeatability,
range, and specificity. Linearity is used to verify the relative accuracy and effective range of the dilutional linearity method. Each potency assay typically measures a unique activity. Therefore, the term “relative accuracy” applies as there is often no way to confirm absolute accuracy using an accepted alternative method. The range is defined by the user and needs to be optimized to cover values that are to be expected from the product. IP is performed by evaluating intra-laboratory (different analysts/days within a laboratory) and inter-laboratory
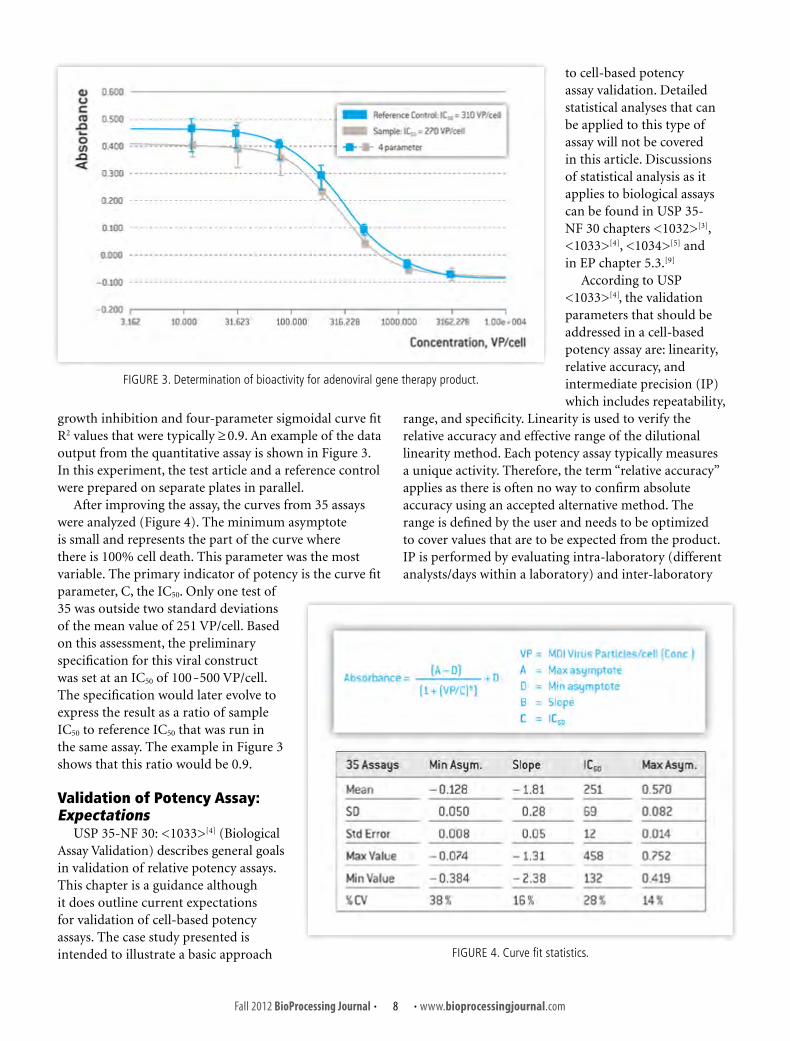
growth inhibition and four-parameter sigmoidal curve fit R2 values that were typically ≥ 0.9. An example of the data output from the quantitative assay is shown in Figure 3. In this experiment, the test article and a reference control were prepared on separate plates in parallel.
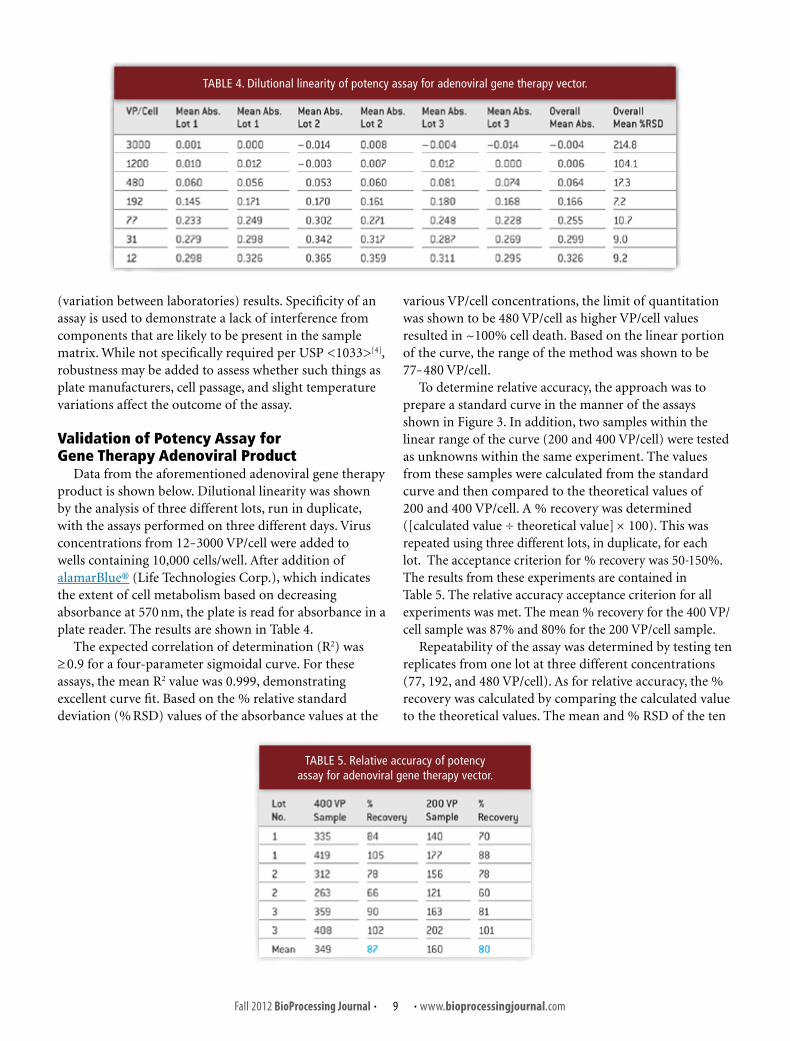
After improving the assay, the curves from 35 assays were analyzed (Figure 4). The minimum asymptote is small and represents the part of the curve where there is 100% cell death. This parameter was the most variable. The primary indicator of potency is the curve fit parameter, C, the IC50. Only one test of 35 was outside two standard deviations of the mean value of 251 VP/cell. Based on this assessment, the preliminary specification for this viral construct was set at an IC50 of 100-500 VP/cell. The specification would later evolve to express the result as a ratio of sample IC50 to reference IC50 that was run in the same assay. The example in Figure 3 shows that this ratio would be 0.9.
Validation of Potency Assay: Expectations
USP35-NF30:<1033>[4] (Biological Assay Validation) describes general goals in validation of relative potency assays. This chapter is a guidance although it does outline current expectations for validation of cell-based potency assays. The case study presented is intended to illustrate a basic approach FIGURE 4. Curve fit statistics.
FIGURE 3. Determination of bioactivity for adenoviral gene therapy product.
Fall 2012 BioProcessing Journal • • www.bioprocessingjournal.com9
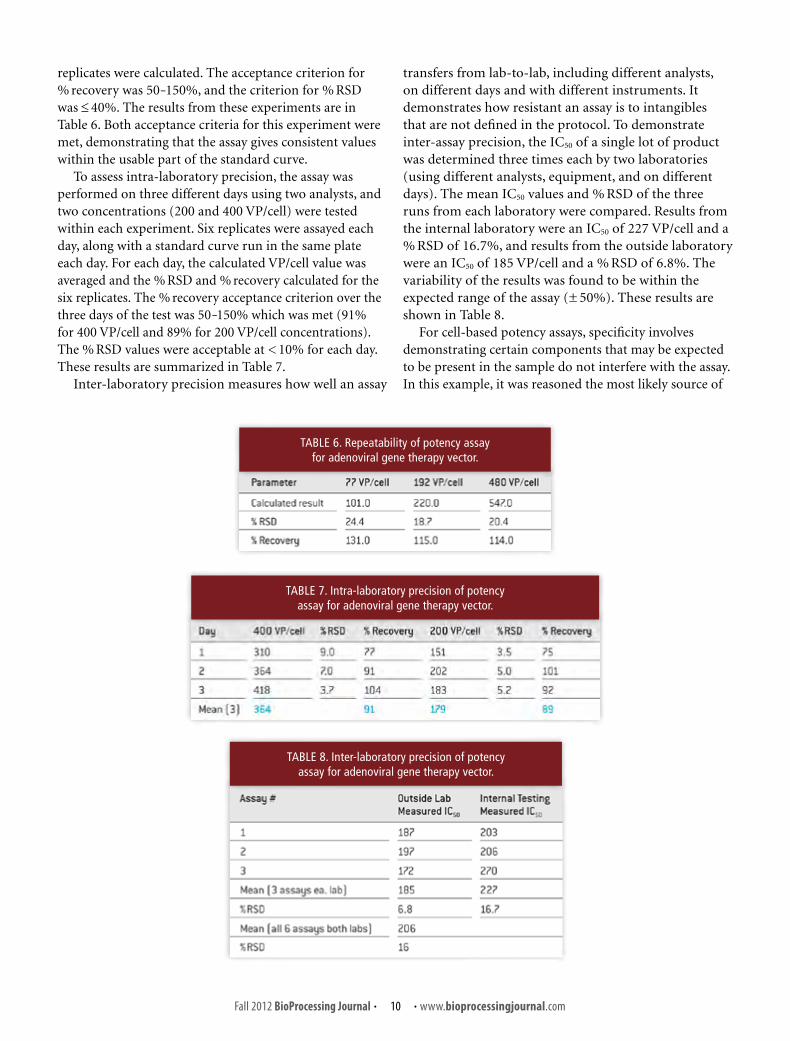
TABLE 4. Dilutional linearity of potency assay for adenoviral gene therapy vector.
TABLE 5. Relative accuracy of potency assay for adenoviral gene therapy vector.
(variationbetweenlaboratories)results.Specificityofanassay is used to demonstrate a lack of interference from components that are likely to be present in the sample matrix.WhilenotspecificallyrequiredperUSP<1033>[4], robustness may be added to assess whether such things as plate manufacturers, cell passage, and slight temperature variations affect the outcome of the assay.
Validation of Potency Assay for Gene Therapy Adenoviral Product
Data from the aforementioned adenoviral gene therapy product is shown below. Dilutional linearity was shown by the analysis of three different lots, run in duplicate, with the assays performed on three different days. Virus concentrations from 12-3000 VP/cell were added to wells containing 10,000 cells/well. After addition of alamarBlue® (Life Technologies Corp.), which indicates the extent of cell metabolism based on decreasing absorbance at 570 nm, the plate is read for absorbance in a plate reader. The results are shown in Table 4.
Theexpectedcorrelationofdetermination(R2) was ≥ 0.9 for a four-parameter sigmoidal curve. For these assays,themeanR2 value was 0.999, demonstrating excellent curve fit. Based on the % relative standard deviation(%RSD)valuesoftheabsorbancevaluesatthe
various VP/cell concentrations, the limit of quantitation was shown to be 480 VP/cell as higher VP/cell values resulted in ~100% cell death. Based on the linear portion of the curve, the range of the method was shown to be 77-480 VP/cell.
To determine relative accuracy, the approach was to prepare a standard curve in the manner of the assays shown in Figure 3. In addition, two samples within the linear range of the curve (200 and 400 VP/cell) were tested as unknowns within the same experiment. The values from these samples were calculated from the standard curve and then compared to the theoretical values of 200 and 400 VP/cell. A % recovery was determined ([calculated value ÷ theoretical value] × 100). This was repeated using three different lots, in duplicate, for each lot. The acceptance criterion for % recovery was 50-150%. The results from these experiments are contained in Table 5. The relative accuracy acceptance criterion for all experiments was met. The mean % recovery for the 400 VP/cell sample was 87% and 80% for the 200 VP/cell sample.
Repeatabilityoftheassaywasdeterminedbytestingtenreplicates from one lot at three different concentrations (77, 192, and 480 VP/cell). As for relative accuracy, the % recovery was calculated by comparing the calculated value tothetheoreticalvalues.Themeanand%RSDoftheten
Fall 2012 BioProcessing Journal • • www.bioprocessingjournal.com10
TABLE 6. Repeatability of potency assay for adenoviral gene therapy vector.
TABLE 7. Intra-laboratory precision of potency assay for adenoviral gene therapy vector.
TABLE 8. Inter-laboratory precision of potency assay for adenoviral gene therapy vector.
replicates were calculated. The acceptance criterion for % recovery was 50-150%,andthecriterionfor%RSDwas ≤ 40%. The results from these experiments are in Table 6. Both acceptance criteria for this experiment were met, demonstrating that the assay gives consistent values within the usable part of the standard curve.
To assess intra-laboratory precision, the assay was performed on three different days using two analysts, and two concentrations (200 and 400 VP/cell) were tested withineachexperiment.Sixreplicateswereassayedeachday, along with a standard curve run in the same plate each day. For each day, the calculated VP/cell value was averagedandthe%RSDand%recoverycalculatedforthesix replicates. The % recovery acceptance criterion over the three days of the test was 50-150% which was met (91% for 400 VP/cell and 89% for 200 VP/cell concentrations). The %RSDvalueswereacceptableat<10%foreachday.These results are summarized in Table 7.
Inter-laboratory precision measures how well an assay
transfers from lab-to-lab, including different analysts, on different days and with different instruments. It demonstrates how resistant an assay is to intangibles that are not defined in the protocol. To demonstrate inter-assay precision, the IC50 of a single lot of product was determined three times each by two laboratories (using different analysts, equipment, and on different days). The mean IC50valuesand%RSDofthethreerunsfromeachlaboratorywerecompared.Resultsfromthe internal laboratory were an IC50 of 227 VP/cell and a %RSDof16.7%,andresultsfromtheoutsidelaboratorywere an IC50of185VP/cellanda%RSDof6.8%.Thevariability of the results was found to be within the expected range of the assay (± 50%). These results are shown in Table 8.
For cell-based potency assays, specificity involves demonstrating certain components that may be expected to be present in the sample do not interfere with the assay. In this example, it was reasoned the most likely source of
Fall 2012 BioProcessing Journal • • www.bioprocessingjournal.com11
TABLE 10. Robustness of potency assay for adenoviral gene therapy vector.
TABLE 9. Specificity of potency assay for adenoviral gene therapy vector.
interference would be inactive virus. Empty adenoviral capsids could also contribute to specificity loss, but the presence of unstable inactive virus was thought to be the most probable and abundant source of interference, especially during forced degradation stability studies. The inactivated virus could then be used to spike active virus and the IC50 values compared ± the spike. To produce inactive virus, purified final product was heat-inactivated (56 °C for one hour) and used as the challenge compound. As shown in Table 9, inactivation was complete. Heat inactivation resulted in an IC50valueof>3000VP/cellfor the inactivated virus alone. In a preparation of equal parts active and inactive virus, the measured activity of the active virus was essentially the same as when measured alone (IC50 values of 205 and 180 VP/cell, respectively). These results demonstrated that the assay could effectively measure potency in the presence of inactive product, thus the assay had acceptable specificity.
In addition to the assay specificity experiment, the specificity of the system was explored by comparing IC50 values obtained from the cells typically used in the assay compared to non-susceptible cells. The IC50 values indicated that the non-susceptible cells required over three times more virus to achieve an equivalent reduction in cell metabolism than when compared to the cells used in the assay (data not shown).
It is advantageous to demonstrate the robustness of the potency assay. In this case, robustness was tested by assessing different cell culture plate suppliers, media source, cell passage number, as well as the effects of a lower incubator temperature (it is known that higher incubator temperatures severely reduce infectivity). The
IC50 values were variable between assays for some of these variances. However, the relative accuracy within each assay was more consistent. When two concentrations of sample (200 VP/cell and 400 VP/cell) were compared to a standard curve within the same assay (as in Table 5), % recovery ranged from 73-117%, well within the acceptance criterion of 50-150% for relative accuracy. These results (Table 10) indicated that, although absolute IC50 values might change in some cases, relative accuracy wasnotmeaningfullycompromisednorwastheR2 correlation coefficient for the four-parameter sigmoidal curvefit.Inotherwords,aproducttestedrelativetoaRSwould be expected to yield the same IC50 ratio as long as the test article and reference were tested under the same conditions.
TheuseofaRSisimportantthroughoutdevelopment,validation, and trending of assay performance. During development, a standard may be a process development lot or Phase 1 material and can be used for early system suitability testing. As long as it is (approximately) representative of the manufacturing process for future goodmanufacturingpractices(GMP)lots,thisapproachcan help elucidate the true variability of the assay. Once the product is in late-phase clinical development, an officialRSshouldbewell-characterized(e.g., from part of aGMPclinicaltriallot).Aspartofthischaracterization,anexternalRS(ifavailable)shouldbetestedside-by-sideaspartofinternalRSrelease.ThisprovidesagoodreferencepointbetweeninternalRSlots.Forexample,even if the adenoviral reference material cannot be tested for transgene bioactivity, the comparisons from other tests such as infectious titer and virus particle
Fall 2012 BioProcessing Journal • • www.bioprocessingjournal.com12
[1] International Conference on Harmonization. ICH Topics Q6B- Guidance for Industry: Specifications: Test Procedures and Acceptance Criteria for Biotechnological/Biological Products. 18 August 1999, vol 64, p 44928, http://www.ich.org/products/guidelines/quality/article/quality-guidelines.html.
[2] USP <111> Design and Analysis of Biological Assays. USP 35–NF 30:106, http://www.usp.org/meetings-courses/workshops/past-usp-workshops/usp-bioassay-guidance-chapters.
[3] USP <1032> Development and Design of Biological Assays.USP 35–NF 30: 162, http://www.usp.org/sites/default/files/usp_pdf/EN/2010-03-25_1032_PF36(4)_w_line_numbers.pdf.
[8] Center for Biologics Evaluation and Research (CBER). Guidance for Industry: Potency Tests for Cellular and Gene Therapy Products. Rockville (MD): CBER. Jan 2011, http://www.fda.gov/downloads/BiologicsBloodVaccines/GuidanceComplianceRegulatoryInformation/Guidances/CellularandGeneTherapy/UCM243392.pdf.
[9] Statistical Analysis of Results of Biological Assays and Tests: European Pharmacopoeia 7th Edition. July 2012, http://online6.edqm.eu/ep705/.
[10] Peng Z. Current Status of Gendicine in China: Recombinant Human Ad-p53 Agent for Treatment of Cancers. Human Gene Therapy, 2005; 16 (9): 1016-1027.
[11] Trask TW, Trask RP, Aguilar-Cordova E, Shine HD, Wyde PR, Goodman JC, Hamilton WJ, Rojas-Martinez A, Chen SH, Woo SLC, Grossman RG. Phase I Study of Adenoviral Delivery of the HSV-tk Gene and Ganciclovir Administration in Patients with Recurrent Malignant Brain Tumors. Molecular Therapy, 2000; 1 (2): 196-203.
[12] Rieder N, Gazzano-Santoro H, Schenerman M, Strause R, Fuchs C, Mire-Sluis A, McLeod LD. The Roles of Bioactivity Assays in Lot Release and Stability Testing. BioProcess International, 2010; 8 (6): 33-42.
[13] Joelsson D. A Practical Guide to Design of Experiments (DOE) for Assay Developers, 2010, http://www.potencyassay.com/wp-content/uploads/2010/06/DOE_for_assay_developers_Chp1_Rev-1.0.pdf.
REFERENCES
enumeration give more confidence that the internal RSisrepresentativeoftheproductthatwillbetested.InternalRSshouldbestoredinstableconditions.TrendanalysisofRSistheidealwaytoassessassaydrift, QC cell bank comparability, analyst to analyst comparability, and changes in assay variability.
ConclusionThe cell-based potency assay is usually the most
customized assay on a biological product’s COA, and it typically requires a higher commitment of time and resources to develop. It is, therefore, wise to start
potency assay development early in a product’s lifecycle. It is essential to understand some of the molecular mechanisms of the product’s therapeutic effect and narrow down the assay to a single, measurable biological activity. The capabilities and limits of the assay should be understood before validation begins, with plans to validate the assay once the product is in Phase 3 clinical trials.
ACKNOWLEDGEMENT
The author would like to thank Ricardo Jimenez, Dr. Jessica Carmen, and Kim Yang for assistance and critical review of this manuscript.
Winter 2009/2010ISSN 1538-8786
Vol. 8/No. 4
www.bioprocessingjournal.com
BioProcessingTrends and Developments in BioProcess Technology
J O U R N A L
A Call For ARTICLES
editor@ bioprocessing journal.com
call-for-articles-J83.indd 1 10/16/2012 11:01:32 AM


![CHURCH REGISTERS LIST [Word Document] · Web viewB 1574 - 1969 Buckminster +C 1538 - 1575; 1585 - 1916 +M 1538 - 1575; 1585 - 1837 (1921) +B 1538 - 1575; 1585 - 1881 Burbage C 1562](https://static.documents.pub/doc/80x56/6073cc757abcf338163220ae/church-registers-list-word-document-web-view-b-1574-1969-buckminster-c-1538.jpg)


