12
Soft Matter www.softmatter.org ISSN 1744-683X PAPER Pawan Nandakishore and Lucas Goehring Crack patterns over uneven substrates Volume 12 Number 8 28 February 2016 Pages 2233–2492
Soft Matterwww.softmatter.org
ISSN 1744-683X
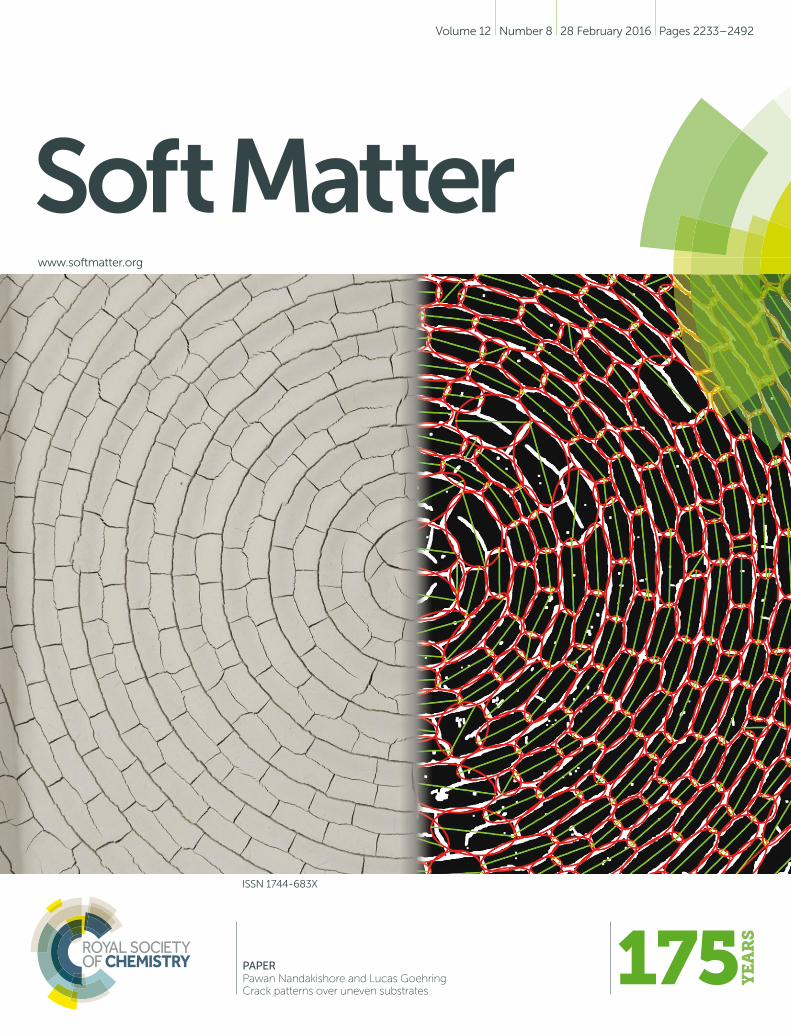
PAPERPawan Nandakishore and Lucas GoehringCrack patterns over uneven substrates
Volume 12 Number 8 28 February 2016 Pages 2233–2492

This journal is©The Royal Society of Chemistry 2016 Soft Matter, 2016, 12, 2253--2263 | 2253
Cite this: SoftMatter, 2016,
12, 2253
Crack patterns over uneven substrates†
Pawan Nandakishore and Lucas Goehring*
Cracks in thin layers are influenced by what lies beneath them. From buried craters to crocodile skin,
crack patterns are found over an enormous range of length scales. Regardless of absolute size, their
substrates can dramatically influence how cracks form, guiding them in some cases, or shielding regions
from them in others. Here we investigate how a substrate’s shape affects the appearance of cracks
above it, by preparing mud cracks over sinusoidally varying surfaces. We find that as the thickness of the
cracking layer increases, the observed crack patterns change from wavy to ladder-like to isotropic. Two
order parameters are introduced to measure the relative alignment of these crack networks, and, along
with Fourier methods, are used to characterise the transitions between crack pattern types. Finally, we
explain these results with a model, based on the Griffith criteria of fracture, that identifies the conditions
for which straight or wavy cracks will be seen, and predicts how well-ordered the cracks will be. Our
metrics and results can be applied to any situation where connected networks of cracks are expected,
or found.
1 Introduction
From networks of cracks across the surfaces of planets1–4
to artistic craquelure in pottery glazes and paintings,5–7 orbespoke fracture textures in thin films,8,9 crack patterns naturallyoccur on a wide variety of lengths. They are even implicated in theformation of scales on crocodiles.10 All these structures representthe outcome of failure processes that occur in a brittle mediumsupported by an uneven substrate. Here we show how the shapeof the substrate plays an important role in determining thegeometry of the resulting cracks. We will demonstrate how touse the substrate to template fractures, explore the conditionsnecessary to generate a variety of patterns, and introducegeneral metrics to quantify the orientational ordering of anyset of connected cracks.
To introduce the concerns of our work we will first brieflypresent three examples of cracks on the scales of kilometres,centimetres, and micrometres. These motivational examples,and those shown additionally in Fig. 1, also aim to highlightthe need for quantitative approaches to the analysis of fracturepatterns.
On large length scales, radial graben are associated withburied craters on Mercury3,4 and Mars.1,2 These features aredue to the repeated filling and cooling of lava in impact craters.
The uneven stresses caused by the edge of a crater are believedto lead to wrinkle ridges above the crater rim.4 Contractioncracks also form within the interior of the crater, leading to amixture of polygonal and circular graben patterns.3,4 The radial
Fig. 1 Examples of crack networks, oriented by different effects. (a) Cracksin lava over a buried crater in Goethe Basin, Mercury.11 (b) Craquelurepattern of traditional oil-on-wood technique. (c) Paint cracks on a beam,reflecting the growth rings of the underlying wood. (d) Cracks in dried blooddroplets, in a range of humidities, are affected by the way the droplets dry(courtesy of D. Brutin, adapted from ref. 12, Fig. 6). (e) Skin cracks onembryonic crocodiles are the result of differential growth of the skin layers,and form tiles that mature into scales (courtesy of M. Milinkovitch, adaptedfrom ref. 10, Fig. 1b). (f) Desiccation cracks in pastes are influenced by anyvibration or flow prior to drying (courtesy of A. Nakahara, adapted fromref. 13, Fig. 3b).
Max Planck Institute for Dynamics and Self-Organization (MPIDS),
37077 Gottingen, Germany. E-mail: [email protected];
Fax: +49-551-5176-202; Tel: +49-551-5176-507
† Electronic supplementary information (ESI) available: Time-lapse movies offracture patterns. See DOI: 10.1039/c5sm02389k
Received 23rd September 2015,Accepted 4th January 2016
DOI: 10.1039/c5sm02389k
www.rsc.org/softmatter
Soft Matter
PAPER
Ope
n A
cces
s A
rtic
le. P
ublis
hed
on 0
6 Ja
nuar
y 20
16. D
ownl
oade
d on
12/
1/20
21 1
:35:
17 P
M.
Thi
s ar
ticle
is li
cens
ed u
nder
a C
reat
ive
Com
mon
s A
ttrib
utio
n 3.
0 U
npor
ted
Lic
ence
.
View Article OnlineView Journal | View Issue
2254 | Soft Matter, 2016, 12, 2253--2263 This journal is©The Royal Society of Chemistry 2016
symmetry of the substrate imposes a characteristic structure tothe such cracks, as in Fig. 1(a).
On a more intermediate length scale, craquelure (Fig. 1(b and c))is the result of differential strains between a coating and itssubstrate.5–7,14 This may be due to tension in the framing of apainted canvas,5 for example, or changes in the relative humidityat which a painting has been stored.14 Alternatively, it may resultfrom an artist’s choice of a pottery glaze with a higher coefficientof thermal contraction than the clay it covers. Such craquelurepatterns are extremely hard to forge, and can thus aid in theattribution of paintings.6 They have been shown to be influencedby local painting style and choice of substrate, including, forpaint on wood, even the species of wood used.6,15 The analysis ofsimilar patterns, in dried blood (Fig. 1(d)), is also being developedas a forensic tool, for example to help determine the relativehumidity when the blood was spilt.12,16
On the micrometre scale, recent attention has focussed oncontrolling cracks. For example, Nam et al.8 showed how toselectively initiate, refract, and stop both straight and wavycracks in silicon nitride thin films, vapour-deposited on siliconwafers, by adding notches, cutting stairs, or introducing inter-facial layers between the wafer and film. Kim et al.9 insteadlooked at soft substrates, with crack formation guided bystrategically placed notches along grooves; their work aims tocontrol failure in situations, such as flexible electronics, whereit must be expected. They find the most regular results whenthey design for crack spacings that are near the natural crackspacing of the brittle film.
A common feature of all these situations is that the crackinglayer is thin, compared to its lateral extent. Nonetheless, thelayer thickness imposes the natural length-scale of such pro-blems, and the spacing of the cracks in each case reflects thisthickness.9,17–19 Here we study the model problem of contrac-tion cracks in ‘thin’ elastic layers adhered to rigid substratesand show how the shape of the substrate also plays an impor-tant role in determining the geometry of the crack pattern.
For this end we choose the system of desiccation cracks indrying clays as a simple, yet representative, experiment. As claysdry they tend to shrink, uniformly. So-called channel cracksopen in the film, to relieve its growing strain energy (see e.g. inref. 20–22). The appropriate physical model for stress in a wetclay, poroelasticity, has an exact mathematical analogy with thethermoelastic model of how most solids shrink as they cool.23–25
In biology, comparable conditions can also result from thedifferential growth of layered tissues.26–28 This is known to leadto the formation of scales on the heads of Nile crocodiles10
(Fig. 1(e)), for example, while a similar mechanism has beenproposed to account for leaf venation patterns.26,27
2 Materials and methods
Briefly, bentonite clay was dried over rigid patterned substrates,where it cracked; a schematic summary of the experiment isgiven in Fig. 2(a). Compared to the wet clay, the substrate isundeformable and unbreakable.
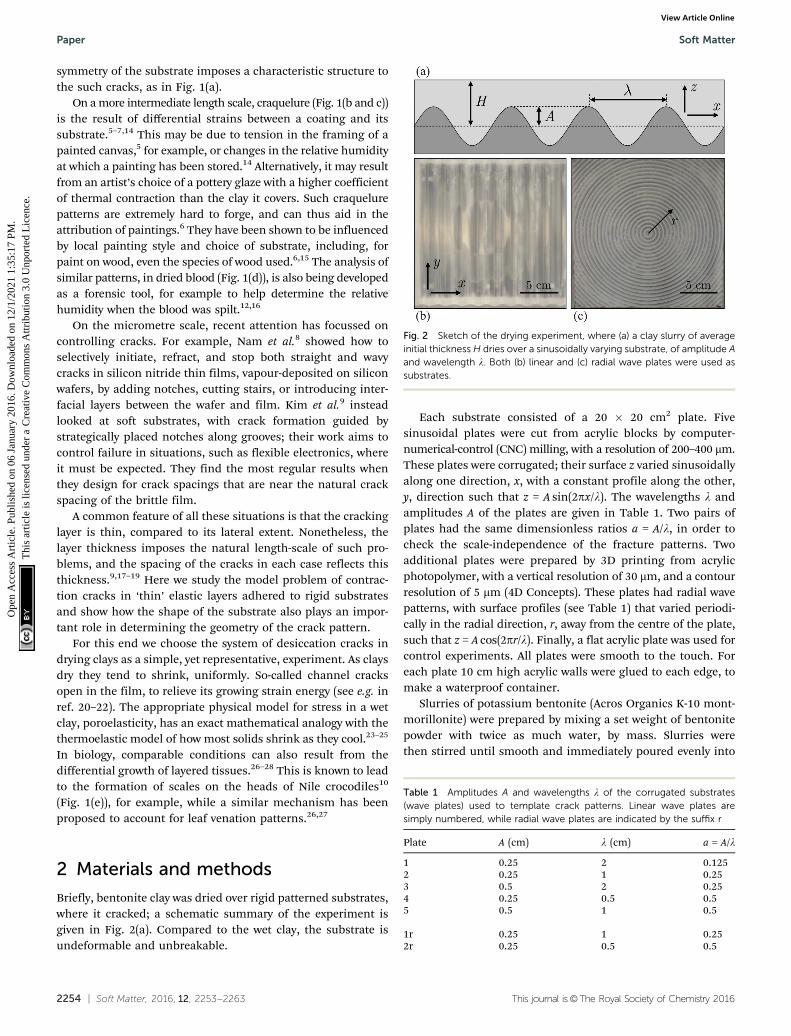
Each substrate consisted of a 20 � 20 cm2 plate. Fivesinusoidal plates were cut from acrylic blocks by computer-numerical-control (CNC) milling, with a resolution of 200–400 mm.These plates were corrugated; their surface z varied sinusoidallyalong one direction, x, with a constant profile along the other,y, direction such that z = A sin(2px/l). The wavelengths l andamplitudes A of the plates are given in Table 1. Two pairs ofplates had the same dimensionless ratios a = A/l, in order tocheck the scale-independence of the fracture patterns. Twoadditional plates were prepared by 3D printing from acrylicphotopolymer, with a vertical resolution of 30 mm, and a contourresolution of 5 mm (4D Concepts). These plates had radial wavepatterns, with surface profiles (see Table 1) that varied periodi-cally in the radial direction, r, away from the centre of the plate,such that z = A cos(2pr/l). Finally, a flat acrylic plate was used forcontrol experiments. All plates were smooth to the touch. Foreach plate 10 cm high acrylic walls were glued to each edge, tomake a waterproof container.
Slurries of potassium bentonite (Acros Organics K-10 mont-morillonite) were prepared by mixing a set weight of bentonitepowder with twice as much water, by mass. Slurries werethen stirred until smooth and immediately poured evenly into
Fig. 2 Sketch of the drying experiment, where (a) a clay slurry of averageinitial thickness H dries over a sinusoidally varying substrate, of amplitude Aand wavelength l. Both (b) linear and (c) radial wave plates were used assubstrates.
Table 1 Amplitudes A and wavelengths l of the corrugated substrates(wave plates) used to template crack patterns. Linear wave plates aresimply numbered, while radial wave plates are indicated by the suffix r
Plate A (cm) l (cm) a = A/l
1 0.25 2 0.1252 0.25 1 0.253 0.5 2 0.254 0.25 0.5 0.55 0.5 1 0.5
1r 0.25 1 0.252r 0.25 0.5 0.5
Paper Soft Matter
Ope
n A
cces
s A
rtic
le. P
ublis
hed
on 0
6 Ja
nuar
y 20
16. D
ownl
oade
d on
12/
1/20
21 1
:35:
17 P
M.
Thi
s ar
ticle
is li
cens
ed u
nder
a C
reat
ive
Com
mon
s A
ttrib
utio
n 3.
0 U
npor
ted
Lic
ence
.View Article Online
This journal is©The Royal Society of Chemistry 2016 Soft Matter, 2016, 12, 2253--2263 | 2255
a container, over a substrate. At this concentration the slurriesbehaved as fluids, rather than pastes. These conditions avoidthe memory effect,29,30 whereby the flow or vibration of a yield-stress paste can affect the way it cracks (see Fig. 1(f)). Wechecked that this effect was absent by drying slurries over flatsubstrates, and finding isotropic crack patterns.
After pouring, the bentonite settled slightly, separating intoa dense clay covered by a thin water layer. We measured thethicknesses of these submerged clay layers in flat-bottomedcontainers after 6 hours of settling, without significant evapora-tion, and found that the consolidated wet clay consistentlycontained 0.49 grams of bentonite per cubic centimetre. Forslurries poured over the sinusoidal substrates we thereforeused the total mass of the bentonite as a proxy for the averagelayer thickness H of the wet clay layer. All experiments wereperformed in the range of H from 3 to 15 mm.
Once a slurry had been poured, it was left to dry in a quiet,warm environment for 6–48 hours, depending on the amountof clay used. When drying is complete, the bentonite becomeslighter in colour; no further cracks appear after this time. Forthe linear wave plates, drying was accelerated by halogen heatlamps, which raised the surface temperature of the clay toB50 1C. As elevated temperatures would melt the printed plates,drying over the radial plates was enhanced by raising the roomtemperature to about 30 1C. During drying, the appearance andevolution of the cracks were imaged every 5 minutes using adigital SLR camera (Nikon D5000 series), mounted above thedrying container. By comparing the initial wet height H to thedry height of various layers, we estimate a total vertical strain of0.27, during drying.
2.1 Image processing
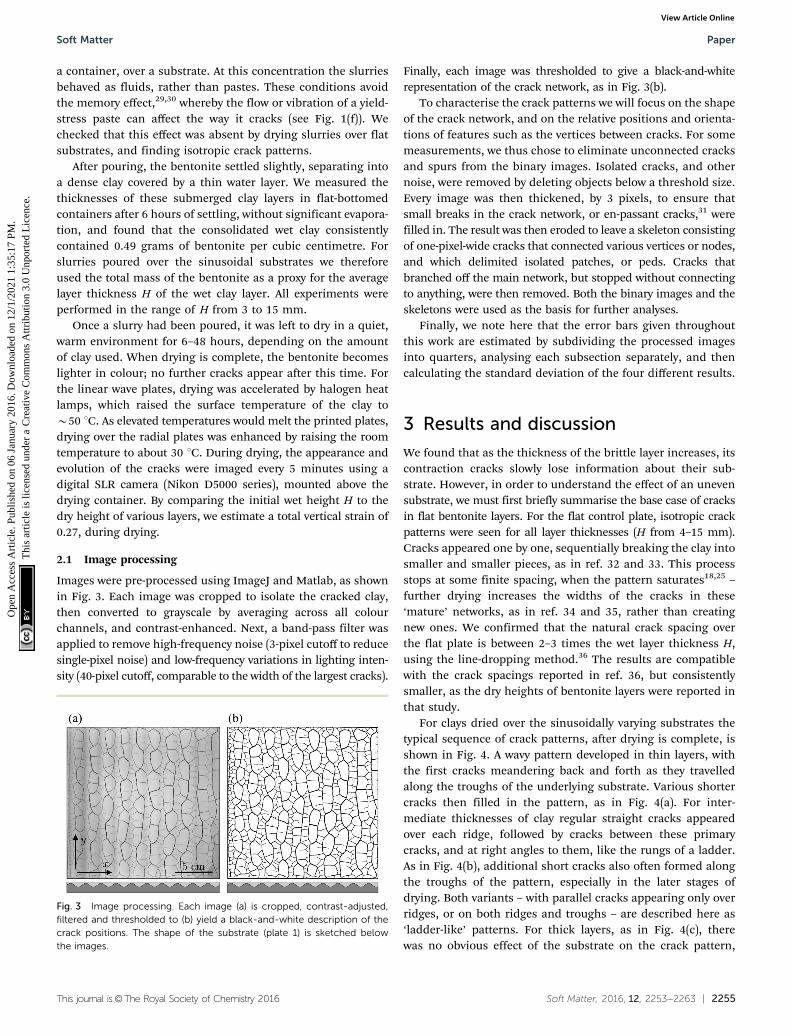
Images were pre-processed using ImageJ and Matlab, as shownin Fig. 3. Each image was cropped to isolate the cracked clay,then converted to grayscale by averaging across all colourchannels, and contrast-enhanced. Next, a band-pass filter wasapplied to remove high-frequency noise (3-pixel cutoff to reducesingle-pixel noise) and low-frequency variations in lighting inten-sity (40-pixel cutoff, comparable to the width of the largest cracks).
Finally, each image was thresholded to give a black-and-whiterepresentation of the crack network, as in Fig. 3(b).
To characterise the crack patterns we will focus on the shapeof the crack network, and on the relative positions and orienta-tions of features such as the vertices between cracks. For somemeasurements, we thus chose to eliminate unconnected cracksand spurs from the binary images. Isolated cracks, and othernoise, were removed by deleting objects below a threshold size.Every image was then thickened, by 3 pixels, to ensure thatsmall breaks in the crack network, or en-passant cracks,31 werefilled in. The result was then eroded to leave a skeleton consistingof one-pixel-wide cracks that connected various vertices or nodes,and which delimited isolated patches, or peds. Cracks thatbranched off the main network, but stopped without connectingto anything, were then removed. Both the binary images and theskeletons were used as the basis for further analyses.
Finally, we note here that the error bars given throughoutthis work are estimated by subdividing the processed imagesinto quarters, analysing each subsection separately, and thencalculating the standard deviation of the four different results.
3 Results and discussion
We found that as the thickness of the brittle layer increases, itscontraction cracks slowly lose information about their sub-strate. However, in order to understand the effect of an unevensubstrate, we must first briefly summarise the base case of cracksin flat bentonite layers. For the flat control plate, isotropic crackpatterns were seen for all layer thicknesses (H from 4–15 mm).Cracks appeared one by one, sequentially breaking the clay intosmaller and smaller pieces, as in ref. 32 and 33. This processstops at some finite spacing, when the pattern saturates18,25 –further drying increases the widths of the cracks in these‘mature’ networks, as in ref. 34 and 35, rather than creatingnew ones. We confirmed that the natural crack spacing overthe flat plate is between 2–3 times the wet layer thickness H,using the line-dropping method.36 The results are compatiblewith the crack spacings reported in ref. 36, but consistentlysmaller, as the dry heights of bentonite layers were reported inthat study.
For clays dried over the sinusoidally varying substrates thetypical sequence of crack patterns, after drying is complete, isshown in Fig. 4. A wavy pattern developed in thin layers, withthe first cracks meandering back and forth as they travelledalong the troughs of the underlying substrate. Various shortercracks then filled in the pattern, as in Fig. 4(a). For inter-mediate thicknesses of clay regular straight cracks appearedover each ridge, followed by cracks between these primarycracks, and at right angles to them, like the rungs of a ladder.As in Fig. 4(b), additional short cracks also often formed alongthe troughs of the pattern, especially in the later stages ofdrying. Both variants – with parallel cracks appearing only overridges, or on both ridges and troughs – are described here as‘ladder-like’ patterns. For thick layers, as in Fig. 4(c), therewas no obvious effect of the substrate on the crack pattern,
Fig. 3 Image processing. Each image (a) is cropped, contrast-adjusted,filtered and thresholded to (b) yield a black-and-white description of thecrack positions. The shape of the substrate (plate 1) is sketched belowthe images.
Soft Matter Paper
Ope
n A
cces
s A
rtic
le. P
ublis
hed
on 0
6 Ja
nuar
y 20
16. D
ownl
oade
d on
12/
1/20
21 1
:35:
17 P
M.
Thi
s ar
ticle
is li
cens
ed u
nder
a C
reat
ive
Com
mon
s A
ttrib
utio
n 3.
0 U
npor
ted
Lic
ence
.View Article Online

2256 | Soft Matter, 2016, 12, 2253--2263 This journal is©The Royal Society of Chemistry 2016
which was essentially isotropic. Time-lapse movies showing thedevelopment of representative cases of wavy, ladder-like andisotropic cracks are provided as online ESI.†
Linear elastic fracture mechanics has no inherent length-scales, other than those set by the geometry of the system understudy. If this assumption holds, then the dependence of thefracture pattern on the shape of our substrates can be entirelycaptured by considering two dimensionless parameters, suchas a dimensionless layer thickness, h = H/l, and a dimension-less amplitude, a = A/l, of the substrate’s relief. Since in manysituations, including ours, the spacing of thin-film cracksscales with the thickness of the cracking layer,9,17–19 the para-meter h should describe the relative match between the naturalspacing of any cracks and the wavelength of the perturbationsaffecting their pattern. The dimensionless amplitude a describesthe sharpness of the peaks on the substrate.
For the linear wave plates we categorised each fully-driedcrack pattern by visual inspection as either wavy, straight orisotropic. As summarised in Fig. 5, the different patterns divideup the expected dimensionless phase space into well-definedregions. At the boundaries between the different patterns weresmall areas of coexistence, for example between wavy and straightcracks. This coexistence represents two scenarios – either bothpatterns were observed within different regions of a singleexperiment, or were seen for the same h, but on different plates.
For dimensionless layer heights in excess of about h = 1, onlyisotropic patterns were ever seen.
Although there are clear visual differences between thepatterns shown in Fig. 4, there are no well-established methodsby which they can be characterised. In order to analyse ourpatterns quantitatively we therefore need to develop new orderparameters similar to, for example, the orientational orderparameter of liquid crystals.37 We present three such measure-ments next, based on Fourier methods, the relative orientationof the regions outlined by the crack network and the positionsof neighbouring crack vertices.
3.1 Fourier analysis of crack patterns
The presence of evenly spaced cracks that are well-aligned withthe substrate’s features suggests the use of Fourier methods toquantify our crack patterns. Although a two-dimensional trans-form could be used to measure crack spacings, we focus hereon a one-dimensional approach, which allows us to measurethe relative alignment and periodicity of the cracks with respectto the linear substrates. To this end, we first collapse each binaryimage to find the average density of cracks at each position alongthe x-direction. This is done by summing over the y-direction ofthe images, where cracks are represented by ones and uncrackedmaterial by zeros. We then find the power spectrum of the crackdensity as the absolute value of the square of its Fourier trans-form, normalised to have an integrated power of one.
In cases where cracks are aligned with the substrate there aresharp peaks in the power spectrum of the crack density when thewavenumber xx is an integer multiple of the wavelength l of thesubstrate, as in Fig. 6. In other words, the substrate prefers thereto be an integer number of cracks, per wavelength. The responsesof all five linear wave plates were very similar: typically, mostpower was found in the first or the second mode, i.e. when xxl = 1or 2, and higher order peaks were consistent with harmonics ofthis main peak. Furthermore, there was a change in the domi-nant mode of the power spectra around h = 0.5–0.75. Below this,most power was in the xxl = 2 peak, while above this the xxl = 1peak was also strong. Visually, the point where these intensities
Fig. 4 Evolution of crack patterns: (a) for thin layers, wavy cracks areseen; (b) as the layer height increases straight cracks are observed, withladdering cracks between them; and (c) for thick layers the cracks areisotropic. The substrate (plate 3) and clay thicknesses are sketched beloweach panel.
Fig. 5 A phase diagram showing where wavy, ladder-like and isotropiccrack patterns were seen, for the linear wave plates.
Fig. 6 Example power spectra of ladder-like crack networks, with (a) cracksover each ridge of the substrate and (b) cracks over the ridges and troughs.Insets show representative sub-sections, 6 cm wide, of the original imagesthat were summed, vertically, to give average crack densities along the x-axis,for Fourier processing.
Paper Soft Matter
Ope
n A
cces
s A
rtic
le. P
ublis
hed
on 0
6 Ja
nuar
y 20
16. D
ownl
oade
d on
12/
1/20
21 1
:35:
17 P
M.
Thi
s ar
ticle
is li
cens
ed u
nder
a C
reat
ive
Com
mon
s A
ttrib
utio
n 3.
0 U
npor
ted
Lic
ence
.View Article Online
This journal is©The Royal Society of Chemistry 2016 Soft Matter, 2016, 12, 2253--2263 | 2257
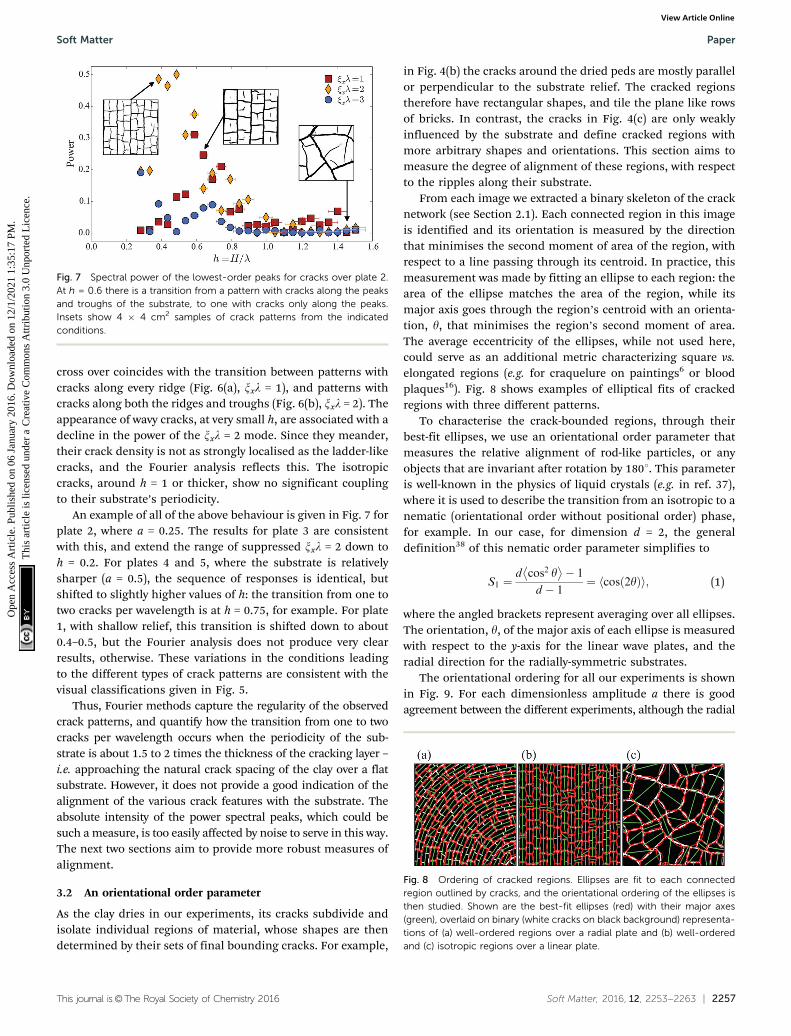
cross over coincides with the transition between patterns withcracks along every ridge (Fig. 6(a), xxl = 1), and patterns withcracks along both the ridges and troughs (Fig. 6(b), xxl = 2). Theappearance of wavy cracks, at very small h, are associated with adecline in the power of the xxl = 2 mode. Since they meander,their crack density is not as strongly localised as the ladder-likecracks, and the Fourier analysis reflects this. The isotropiccracks, around h = 1 or thicker, show no significant couplingto their substrate’s periodicity.
An example of all of the above behaviour is given in Fig. 7 forplate 2, where a = 0.25. The results for plate 3 are consistentwith this, and extend the range of suppressed xxl = 2 down toh = 0.2. For plates 4 and 5, where the substrate is relativelysharper (a = 0.5), the sequence of responses is identical, butshifted to slightly higher values of h: the transition from one totwo cracks per wavelength is at h = 0.75, for example. For plate1, with shallow relief, this transition is shifted down to about0.4–0.5, but the Fourier analysis does not produce very clearresults, otherwise. These variations in the conditions leadingto the different types of crack patterns are consistent with thevisual classifications given in Fig. 5.
Thus, Fourier methods capture the regularity of the observedcrack patterns, and quantify how the transition from one to twocracks per wavelength occurs when the periodicity of the sub-strate is about 1.5 to 2 times the thickness of the cracking layer –i.e. approaching the natural crack spacing of the clay over a flatsubstrate. However, it does not provide a good indication of thealignment of the various crack features with the substrate. Theabsolute intensity of the power spectral peaks, which could besuch a measure, is too easily affected by noise to serve in this way.The next two sections aim to provide more robust measures ofalignment.
3.2 An orientational order parameter
As the clay dries in our experiments, its cracks subdivide andisolate individual regions of material, whose shapes are thendetermined by their sets of final bounding cracks. For example,
in Fig. 4(b) the cracks around the dried peds are mostly parallelor perpendicular to the substrate relief. The cracked regionstherefore have rectangular shapes, and tile the plane like rowsof bricks. In contrast, the cracks in Fig. 4(c) are only weaklyinfluenced by the substrate and define cracked regions withmore arbitrary shapes and orientations. This section aims tomeasure the degree of alignment of these regions, with respectto the ripples along their substrate.
From each image we extracted a binary skeleton of the cracknetwork (see Section 2.1). Each connected region in this imageis identified and its orientation is measured by the directionthat minimises the second moment of area of the region, withrespect to a line passing through its centroid. In practice, thismeasurement was made by fitting an ellipse to each region: thearea of the ellipse matches the area of the region, while itsmajor axis goes through the region’s centroid with an orienta-tion, y, that minimises the region’s second moment of area.The average eccentricity of the ellipses, while not used here,could serve as an additional metric characterizing square vs.elongated regions (e.g. for craquelure on paintings6 or bloodplaques16). Fig. 8 shows examples of elliptical fits of crackedregions with three different patterns.
To characterise the crack-bounded regions, through theirbest-fit ellipses, we use an orientational order parameter thatmeasures the relative alignment of rod-like particles, or anyobjects that are invariant after rotation by 1801. This parameteris well-known in the physics of liquid crystals (e.g. in ref. 37),where it is used to describe the transition from an isotropic to anematic (orientational order without positional order) phase,for example. In our case, for dimension d = 2, the generaldefinition38 of this nematic order parameter simplifies to
S1 ¼d cos2 y� �
� 1
d � 1¼ cosð2yÞh i; (1)
where the angled brackets represent averaging over all ellipses.The orientation, y, of the major axis of each ellipse is measuredwith respect to the y-axis for the linear wave plates, and theradial direction for the radially-symmetric substrates.
The orientational ordering for all our experiments is shownin Fig. 9. For each dimensionless amplitude a there is goodagreement between the different experiments, although the radial
Fig. 7 Spectral power of the lowest-order peaks for cracks over plate 2.At h = 0.6 there is a transition from a pattern with cracks along the peaksand troughs of the substrate, to one with cracks only along the peaks.Insets show 4 � 4 cm2 samples of crack patterns from the indicatedconditions.
Fig. 8 Ordering of cracked regions. Ellipses are fit to each connectedregion outlined by cracks, and the orientational ordering of the ellipses isthen studied. Shown are the best-fit ellipses (red) with their major axes(green), overlaid on binary (white cracks on black background) representa-tions of (a) well-ordered regions over a radial plate and (b) well-orderedand (c) isotropic regions over a linear plate.
Soft Matter Paper
Ope
n A
cces
s A
rtic
le. P
ublis
hed
on 0
6 Ja
nuar
y 20
16. D
ownl
oade
d on
12/
1/20
21 1
:35:
17 P
M.
Thi
s ar
ticle
is li
cens
ed u
nder
a C
reat
ive
Com
mon
s A
ttrib
utio
n 3.
0 U
npor
ted
Lic
ence
.View Article Online
2258 | Soft Matter, 2016, 12, 2253--2263 This journal is©The Royal Society of Chemistry 2016
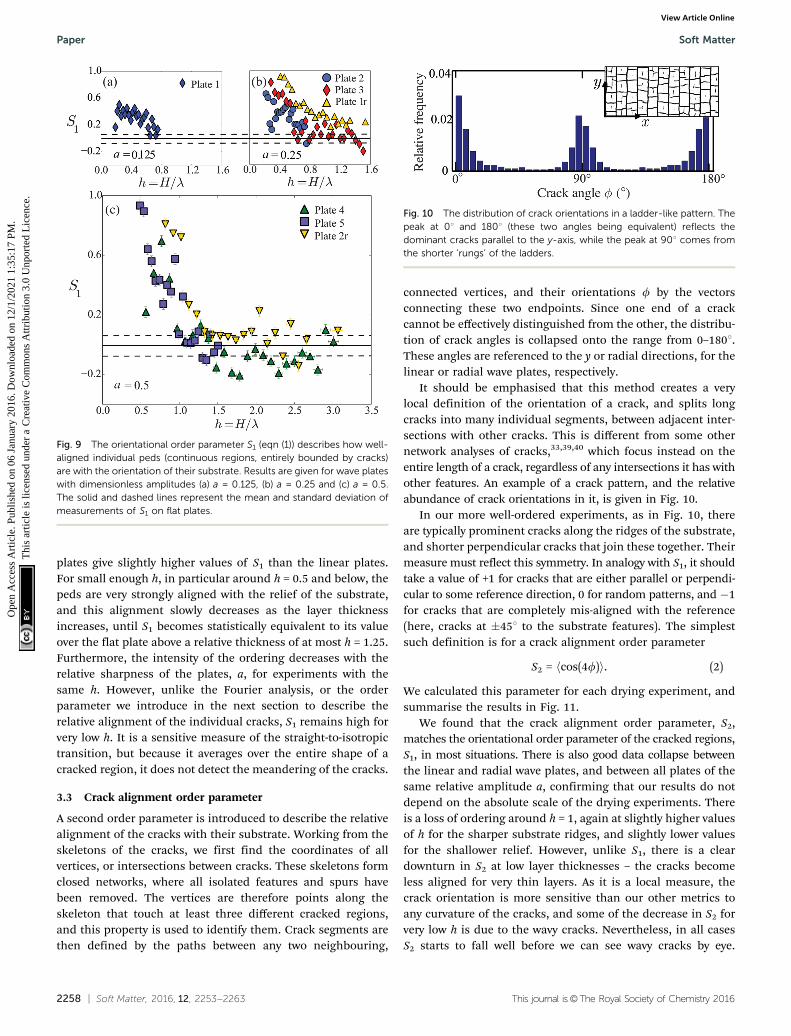
plates give slightly higher values of S1 than the linear plates.For small enough h, in particular around h = 0.5 and below, thepeds are very strongly aligned with the relief of the substrate,and this alignment slowly decreases as the layer thicknessincreases, until S1 becomes statistically equivalent to its valueover the flat plate above a relative thickness of at most h = 1.25.Furthermore, the intensity of the ordering decreases with therelative sharpness of the plates, a, for experiments with thesame h. However, unlike the Fourier analysis, or the orderparameter we introduce in the next section to describe therelative alignment of the individual cracks, S1 remains high forvery low h. It is a sensitive measure of the straight-to-isotropictransition, but because it averages over the entire shape of acracked region, it does not detect the meandering of the cracks.
3.3 Crack alignment order parameter
A second order parameter is introduced to describe the relativealignment of the cracks with their substrate. Working from theskeletons of the cracks, we first find the coordinates of allvertices, or intersections between cracks. These skeletons formclosed networks, where all isolated features and spurs havebeen removed. The vertices are therefore points along theskeleton that touch at least three different cracked regions,and this property is used to identify them. Crack segments arethen defined by the paths between any two neighbouring,
connected vertices, and their orientations f by the vectorsconnecting these two endpoints. Since one end of a crackcannot be effectively distinguished from the other, the distribu-tion of crack angles is collapsed onto the range from 0–1801.These angles are referenced to the y or radial directions, for thelinear or radial wave plates, respectively.
It should be emphasised that this method creates a verylocal definition of the orientation of a crack, and splits longcracks into many individual segments, between adjacent inter-sections with other cracks. This is different from some othernetwork analyses of cracks,33,39,40 which focus instead on theentire length of a crack, regardless of any intersections it has withother features. An example of a crack pattern, and the relativeabundance of crack orientations in it, is given in Fig. 10.
In our more well-ordered experiments, as in Fig. 10, thereare typically prominent cracks along the ridges of the substrate,and shorter perpendicular cracks that join these together. Theirmeasure must reflect this symmetry. In analogy with S1, it shouldtake a value of +1 for cracks that are either parallel or perpendi-cular to some reference direction, 0 for random patterns, and �1for cracks that are completely mis-aligned with the reference(here, cracks at �451 to the substrate features). The simplestsuch definition is for a crack alignment order parameter
S2 = hcos(4f)i. (2)
We calculated this parameter for each drying experiment, andsummarise the results in Fig. 11.
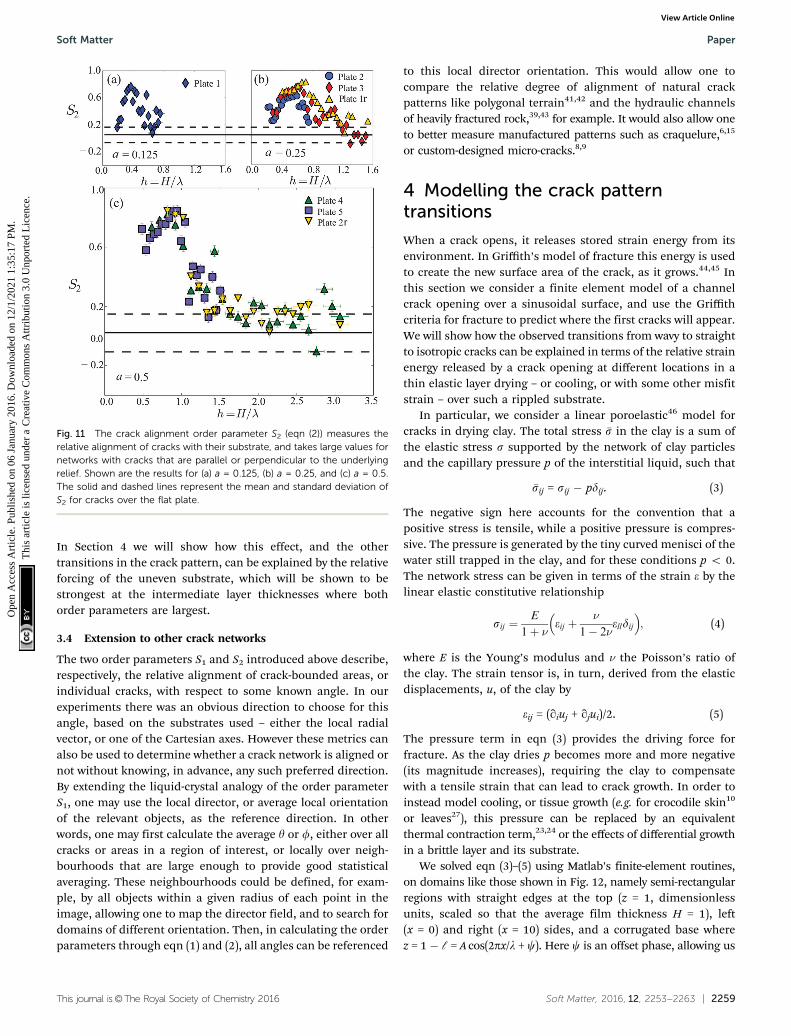
We found that the crack alignment order parameter, S2,matches the orientational order parameter of the cracked regions,S1, in most situations. There is also good data collapse betweenthe linear and radial wave plates, and between all plates of thesame relative amplitude a, confirming that our results do notdepend on the absolute scale of the drying experiments. Thereis a loss of ordering around h = 1, again at slightly higher valuesof h for the sharper substrate ridges, and slightly lower valuesfor the shallower relief. However, unlike S1, there is a cleardownturn in S2 at low layer thicknesses – the cracks becomeless aligned for very thin layers. As it is a local measure, thecrack orientation is more sensitive than our other metrics toany curvature of the cracks, and some of the decrease in S2 forvery low h is due to the wavy cracks. Nevertheless, in all casesS2 starts to fall well before we can see wavy cracks by eye.
Fig. 9 The orientational order parameter S1 (eqn (1)) describes how well-aligned individual peds (continuous regions, entirely bounded by cracks)are with the orientation of their substrate. Results are given for wave plateswith dimensionless amplitudes (a) a = 0.125, (b) a = 0.25 and (c) a = 0.5.The solid and dashed lines represent the mean and standard deviation ofmeasurements of S1 on flat plates.
Fig. 10 The distribution of crack orientations in a ladder-like pattern. Thepeak at 01 and 1801 (these two angles being equivalent) reflects thedominant cracks parallel to the y-axis, while the peak at 901 comes fromthe shorter ‘rungs’ of the ladders.
Paper Soft Matter
Ope
n A
cces
s A
rtic
le. P
ublis
hed
on 0
6 Ja
nuar
y 20
16. D
ownl
oade
d on
12/
1/20
21 1
:35:
17 P
M.
Thi
s ar
ticle
is li
cens
ed u
nder
a C
reat
ive
Com
mon
s A
ttrib
utio
n 3.
0 U
npor
ted
Lic
ence
.View Article Online
This journal is©The Royal Society of Chemistry 2016 Soft Matter, 2016, 12, 2253--2263 | 2259
In Section 4 we will show how this effect, and the othertransitions in the crack pattern, can be explained by the relativeforcing of the uneven substrate, which will be shown to bestrongest at the intermediate layer thicknesses where bothorder parameters are largest.
3.4 Extension to other crack networks
The two order parameters S1 and S2 introduced above describe,respectively, the relative alignment of crack-bounded areas, orindividual cracks, with respect to some known angle. In ourexperiments there was an obvious direction to choose for thisangle, based on the substrates used – either the local radialvector, or one of the Cartesian axes. However these metrics canalso be used to determine whether a crack network is aligned ornot without knowing, in advance, any such preferred direction.By extending the liquid-crystal analogy of the order parameterS1, one may use the local director, or average local orientationof the relevant objects, as the reference direction. In otherwords, one may first calculate the average y or f, either over allcracks or areas in a region of interest, or locally over neigh-bourhoods that are large enough to provide good statisticalaveraging. These neighbourhoods could be defined, for exam-ple, by all objects within a given radius of each point in theimage, allowing one to map the director field, and to search fordomains of different orientation. Then, in calculating the orderparameters through eqn (1) and (2), all angles can be referenced
to this local director orientation. This would allow one tocompare the relative degree of alignment of natural crackpatterns like polygonal terrain41,42 and the hydraulic channelsof heavily fractured rock,39,43 for example. It would also allow oneto better measure manufactured patterns such as craquelure,6,15
or custom-designed micro-cracks.8,9
4 Modelling the crack patterntransitions
When a crack opens, it releases stored strain energy from itsenvironment. In Griffith’s model of fracture this energy is usedto create the new surface area of the crack, as it grows.44,45 Inthis section we consider a finite element model of a channelcrack opening over a sinusoidal surface, and use the Griffithcriteria for fracture to predict where the first cracks will appear.We will show how the observed transitions from wavy to straightto isotropic cracks can be explained in terms of the relative strainenergy released by a crack opening at different locations in athin elastic layer drying – or cooling, or with some other misfitstrain – over such a rippled substrate.
In particular, we consider a linear poroelastic46 model forcracks in drying clay. The total stress �s in the clay is a sum ofthe elastic stress s supported by the network of clay particlesand the capillary pressure p of the interstitial liquid, such that
�sij = sij � pdij. (3)
The negative sign here accounts for the convention that apositive stress is tensile, while a positive pressure is compres-sive. The pressure is generated by the tiny curved menisci of thewater still trapped in the clay, and for these conditions p o 0.The network stress can be given in terms of the strain e by thelinear elastic constitutive relationship
sij ¼E
1þ n eij þn
1� 2nelldij
� �; (4)
where E is the Young’s modulus and n the Poisson’s ratio ofthe clay. The strain tensor is, in turn, derived from the elasticdisplacements, u, of the clay by
eij = (qiuj + qjui)/2. (5)
The pressure term in eqn (3) provides the driving force forfracture. As the clay dries p becomes more and more negative(its magnitude increases), requiring the clay to compensatewith a tensile strain that can lead to crack growth. In order toinstead model cooling, or tissue growth (e.g. for crocodile skin10
or leaves27), this pressure can be replaced by an equivalentthermal contraction term,23,24 or the effects of differential growthin a brittle layer and its substrate.
We solved eqn (3)–(5) using Matlab’s finite-element routines,on domains like those shown in Fig. 12, namely semi-rectangularregions with straight edges at the top (z = 1, dimensionlessunits, scaled so that the average film thickness H = 1), left(x = 0) and right (x = 10) sides, and a corrugated base wherez = 1 � l = A cos(2px/l + c). Here c is an offset phase, allowing us
Fig. 11 The crack alignment order parameter S2 (eqn (2)) measures therelative alignment of cracks with their substrate, and takes large values fornetworks with cracks that are parallel or perpendicular to the underlyingrelief. Shown are the results for (a) a = 0.125, (b) a = 0.25, and (c) a = 0.5.The solid and dashed lines represent the mean and standard deviation ofS2 for cracks over the flat plate.
Soft Matter Paper
Ope
n A
cces
s A
rtic
le. P
ublis
hed
on 0
6 Ja
nuar
y 20
16. D
ownl
oade
d on
12/
1/20
21 1
:35:
17 P
M.
Thi
s ar
ticle
is li
cens
ed u
nder
a C
reat
ive
Com
mon
s A
ttrib
utio
n 3.
0 U
npor
ted
Lic
ence
.View Article Online
2260 | Soft Matter, 2016, 12, 2253--2263 This journal is©The Royal Society of Chemistry 2016
to examine the strain energy released by fracture at variouspositions along the substrate, and l is the local film thick-ness. Plane strain conditions, with no displacements allowed inthe y-direction, were used to model a channel crack advancingwith a constant profile along the sinusoidal plate. The uppersurface was taken to be traction free (sxz = szz = 0 on z = 1), whilethe lower surface was treated as no-slip, such that u = 0 there,and only vertical displacements were allowed (ux = 0) along theright boundary. The left-face boundary was either treated likethe right one, for an intact film, or as a traction-free boundary, fora cracked film. Finally, the pressure p was taken to be constanteverywhere, as appropriate for quasi-static fracture.
The work done by the growth of the channeling crack can bemeasured by integrating the product of the pre-crack stress, s*,and the opening displacements of the crack, d, as in ref. 21 and 45.This is, essentially, the sum of the forces on the incipient cracksurfaces, acting over the distance they travel as the crack opens.The strain energy released, per unit area of new crack, is thus
G ¼ 1
2‘
ð11�‘
dxsxx� þ dzsxz�dz: (6)
For a simulation with a specific A and l we calculated the pre-crackstress field once, using c = 0, and used this solution to find s* atdifferent positions along the substrate. We then calculated theopening displacements of a crack at different c. Accounting for theopening displacement to either side of a crack can be done byletting dx = ux(c) + ux(�c), and dy = uy(c) � uy(�c). This gives usthe values of G for cracks growing along the substrate atdifferent c, ranging from the crest of the sine wave, to its trough.
For a flat substrate, this problem has been studied in detailby Beuth,21 Xia and Hutchinson22 and Yin et al.47,48 Theyshowed that G scales as
G ¼ ps02‘2 �E
g; (7)
where g is a dimensionless parameter that only depends on theelastic mismatch between the cracking film and its substrate,and where E = E/(1 � n2) and s0 = �p(1 � 2n)/(1 � n). Forexample,21 for n = 1/3, g = 0.71. We confirmed their solutionswith respect to the exponential decay of the height-averagedstress away from the crack22 and the dependence of g on n21
and the depth of fracture,21,47 and checked that g was indepen-dent of the average film thickness, the film’s elastic modulusE and the capillary pressure p. The mesh used, and the horizontaldomain length, were found to be sufficient to agree with theseknown solutions to within 1%.
For an uneven substrate G depends on location, measuredhere by the offset c. As the clay dries the relative shape of G(c)will not change, but rather its magnitude will simply increasealong with the capillary pressure. The Griffith criteria predictthat fractures can only grow once G reaches some critical value,Gc, which is a material parameter (see e.g. in ref. 45). The firstcracks in the brittle drying layer should therefore form at thepositions where the strain energy released by these cracks,i.e. G, would be a maximum, as these are the first places whereG = Gc. For a Poisson ratio of n = 1/3, we calculated how G varieswith position for a wide range of experimental conditions, fromA = 0.01–0.90 and l = 0.5–8.0. To focus only on geometric effectswe used eqn (7) to rescale G by the relative stiffness 2E/ps0
2,so that %G = lg. The results are summarised in Fig. 13(a), whichshows the values of c that maximise G for various A and l.Depending on the shape of the substrate and the thickness of
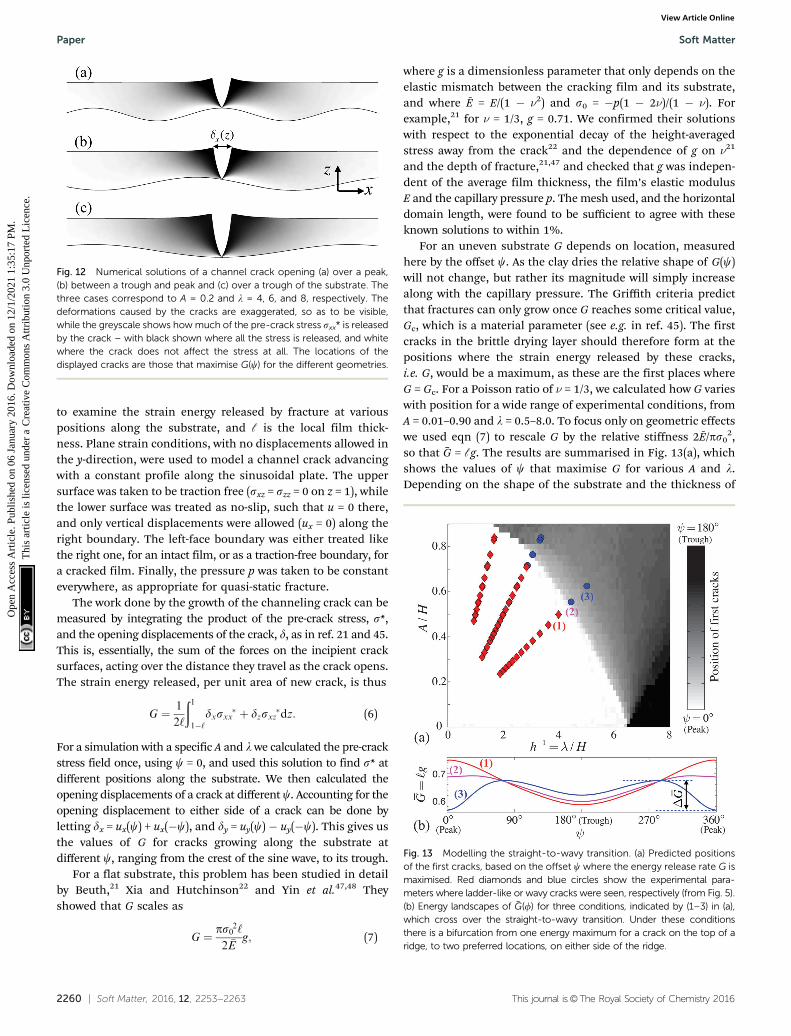
Fig. 12 Numerical solutions of a channel crack opening (a) over a peak,(b) between a trough and peak and (c) over a trough of the substrate. Thethree cases correspond to A = 0.2 and l = 4, 6, and 8, respectively. Thedeformations caused by the cracks are exaggerated, so as to be visible,while the greyscale shows how much of the pre-crack stress sxx* is releasedby the crack – with black shown where all the stress is released, and whitewhere the crack does not affect the stress at all. The locations of thedisplayed cracks are those that maximise G(c) for the different geometries.
Fig. 13 Modelling the straight-to-wavy transition. (a) Predicted positionsof the first cracks, based on the offset c where the energy release rate G ismaximised. Red diamonds and blue circles show the experimental para-meters where ladder-like or wavy cracks were seen, respectively (from Fig. 5).(b) Energy landscapes of %G(f) for three conditions, indicated by (1–3) in (a),which cross over the straight-to-wavy transition. Under these conditionsthere is a bifurcation from one energy maximum for a crack on the top of aridge, to two preferred locations, on either side of the ridge.
Paper Soft Matter
Ope
n A
cces
s A
rtic
le. P
ublis
hed
on 0
6 Ja
nuar
y 20
16. D
ownl
oade
d on
12/
1/20
21 1
:35:
17 P
M.
Thi
s ar
ticle
is li
cens
ed u
nder
a C
reat
ive
Com
mon
s A
ttrib
utio
n 3.
0 U
npor
ted
Lic
ence
.View Article Online
This journal is©The Royal Society of Chemistry 2016 Soft Matter, 2016, 12, 2253--2263 | 2261
the clay, the preferred positions of the earliest cracks can beeither (i) over the peaks of the substrate, (ii) over the troughs or(iii) at pairs of points displaced to either side of each peak.Examples of the displacement field and energy release rate ofall three cases are shown in Fig. 12.
Fig. 13(a) also replots the observations from Fig. 5, corres-ponding to the conditions where wavy and ladder-like cracks arefound; the new axes here highlight the low-h region of interest.For all experiments where straight cracks were seen the modelcorrectly predicts that the first cracks should appear over theridges of the substrate. Where wavy cracks are seen, the modelinstead generally predicts two stable positions for cracks, alongthe sides of the ridges. Although our model has no dynamiccomponent, this empirical agreement of the division of phase-space suggests that the wavy cracks result from cracks movingback and forth between their two bistable positions. The boundarybetween the straight and wavy cases corresponds to a forwardpitchfork bifurcation, as sketched in Fig. 13(b).
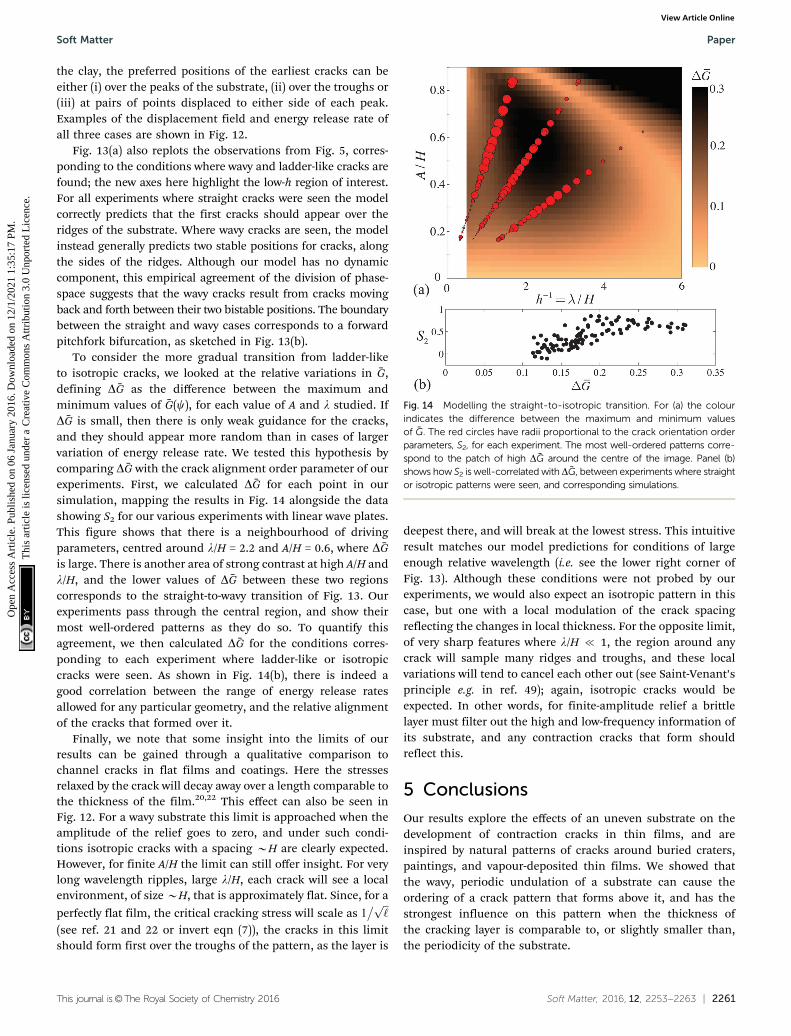
To consider the more gradual transition from ladder-liketo isotropic cracks, we looked at the relative variations in %G,defining D %G as the difference between the maximum andminimum values of %G(c), for each value of A and l studied. IfD %G is small, then there is only weak guidance for the cracks,and they should appear more random than in cases of largervariation of energy release rate. We tested this hypothesis bycomparing D %G with the crack alignment order parameter of ourexperiments. First, we calculated D %G for each point in oursimulation, mapping the results in Fig. 14 alongside the datashowing S2 for our various experiments with linear wave plates.This figure shows that there is a neighbourhood of drivingparameters, centred around l/H = 2.2 and A/H = 0.6, where D %Gis large. There is another area of strong contrast at high A/H andl/H, and the lower values of D %G between these two regionscorresponds to the straight-to-wavy transition of Fig. 13. Ourexperiments pass through the central region, and show theirmost well-ordered patterns as they do so. To quantify thisagreement, we then calculated D %G for the conditions corres-ponding to each experiment where ladder-like or isotropiccracks were seen. As shown in Fig. 14(b), there is indeed agood correlation between the range of energy release ratesallowed for any particular geometry, and the relative alignmentof the cracks that formed over it.
Finally, we note that some insight into the limits of ourresults can be gained through a qualitative comparison tochannel cracks in flat films and coatings. Here the stressesrelaxed by the crack will decay away over a length comparable tothe thickness of the film.20,22 This effect can also be seen inFig. 12. For a wavy substrate this limit is approached when theamplitude of the relief goes to zero, and under such condi-tions isotropic cracks with a spacing BH are clearly expected.However, for finite A/H the limit can still offer insight. For verylong wavelength ripples, large l/H, each crack will see a localenvironment, of size BH, that is approximately flat. Since, for a
perfectly flat film, the critical cracking stress will scale as 1� ffiffi
‘p
(see ref. 21 and 22 or invert eqn (7)), the cracks in this limitshould form first over the troughs of the pattern, as the layer is
deepest there, and will break at the lowest stress. This intuitiveresult matches our model predictions for conditions of largeenough relative wavelength (i.e. see the lower right corner ofFig. 13). Although these conditions were not probed by ourexperiments, we would also expect an isotropic pattern in thiscase, but one with a local modulation of the crack spacingreflecting the changes in local thickness. For the opposite limit,of very sharp features where l/H { 1, the region around anycrack will sample many ridges and troughs, and these localvariations will tend to cancel each other out (see Saint-Venant’sprinciple e.g. in ref. 49); again, isotropic cracks would beexpected. In other words, for finite-amplitude relief a brittlelayer must filter out the high and low-frequency information ofits substrate, and any contraction cracks that form shouldreflect this.
5 Conclusions
Our results explore the effects of an uneven substrate on thedevelopment of contraction cracks in thin films, and areinspired by natural patterns of cracks around buried craters,paintings, and vapour-deposited thin films. We showed thatthe wavy, periodic undulation of a substrate can cause theordering of a crack pattern that forms above it, and has thestrongest influence on this pattern when the thickness ofthe cracking layer is comparable to, or slightly smaller than,the periodicity of the substrate.
Fig. 14 Modelling the straight-to-isotropic transition. For (a) the colourindicates the difference between the maximum and minimum valuesof %G. The red circles have radii proportional to the crack orientation orderparameters, S2, for each experiment. The most well-ordered patterns corre-spond to the patch of high D %G around the centre of the image. Panel (b)shows how S2 is well-correlated with D %G, between experiments where straightor isotropic patterns were seen, and corresponding simulations.
Soft Matter Paper
Ope
n A
cces
s A
rtic
le. P
ublis
hed
on 0
6 Ja
nuar
y 20
16. D
ownl
oade
d on
12/
1/20
21 1
:35:
17 P
M.
Thi
s ar
ticle
is li
cens
ed u
nder
a C
reat
ive
Com
mon
s A
ttrib
utio
n 3.
0 U
npor
ted
Lic
ence
.View Article Online
2262 | Soft Matter, 2016, 12, 2253--2263 This journal is©The Royal Society of Chemistry 2016
Generally we found that for increasing layer thickness thecrack pattern changed from one with wavy cracks runningalong the troughs of the substrate, to straight cracks appearingover each peak and trough of the substrate, to straight crackson only the peaks of the substrate, and finally to a disorderedor isotropic pattern. The wavy-to-straight transition was themost abrupt change, as evidenced by examples of singleexperiments that were wavy on one side of the plate, andstraight on the other. All these patterns were quantified byFourier methods and orientational order parameters, similarto the nematic order parameter of liquid crystals, which areeasily adaptable to other types of crack networks. Finally, weshowed how the transitions between pattern type could beexplained by a simple finite-element model of channelingcracks advancing over uneven relief, regardless of whetherthose cracks were driven by drying, cooling or the differentialgrowth of crocodilian skin.
Acknowledgements
We thank U. Schminke and M. Wolff for assistance with thedesign and manufacture of our plates; LG thanks P. Keen andA. Chetwood for their contributions to an early version of thisexperiment; PN thanks A. Fourriere for helpful discussions.
References
1 G. E. McGill and L. S. Hills, J. Geophys. Res., 1992, 97,2633–2647.
2 M. Cooke, F. Islam and G. McGill, J. Geophys. Res., 2011,116, E09003.
3 A. M. Freed, D. M. Blair, T. R. Watters, C. Klimczak,P. K. Byrne, S. C. Solomon, M. T. Zuber and H. Melosh,J. Geophys. Res., 2012, 117, E00L06.
4 D. M. Blair, A. M. Freed, P. K. Byrne, C. Klimczak,L. M. Prockter, C. M. Ernst, S. C. Solomon, H. J. Meloshand M. T. Zuber, J. Geophys. Res., 2013, 118, 47–58.
5 A. Karpowicz, J. Am. Inst. Conserv., 1990, 29, 169–180.6 S. L. Bucklow, Comput. Hum., 1998, 31, 503–521.7 L. Pauchard, V. Lazarus, B. Abou, K. Sekimoto, G. Aitken
and C. Lahanier, Reflets Phys., 2007, 3, 5–9.8 K. H. Nam, I. H. Park and S. H. Ko, Nature, 2012, 485,
221–224.9 B. C. Kim, T. Matsuoka, C. Moraes, J. Huang, M. Thouless
and S. Takayama, Sci. Rep., 2013, 3, 221–224.10 M. C. Milinkovitch, L. Manukyan, A. Debry, N. Di-Poı,
S. Martin, D. Singh, D. Lambert and M. Zwicker, Science,2013, 339, 78–81.
11 MESSENGER, Goethe Basin, 2012, NASA/Johns HopkinsUniversity Applied Physics Laboratory/Carnegie Institutionof Washington.
12 W. B. Zeid and D. Brutin, Colloids Surf., A, 2013, 430, 1–7.13 H. Nakayama, Y. Matsuo, O. Takeshi and A. Nakahara,
Eur. Phys. J. E: Soft Matter Biol. Phys., 2013, 36, 13001–13008.
14 G. A. Berger and W. H. Russell, J. Am. Inst. Conserv., 1990,29, 45–76.
15 I. Crisologo, C. Monterola and M. Soriano, Int. J. Mod.Phys. C, 2011, 22, 1191–1209.
16 W. B. Zeid, J. Vicente and D. Brutin, Colloids Surf., A, 2013,432, 139–146.
17 C. Allain and L. Limat, Phys. Rev. Lett., 1995, 74, 2981–2984.18 T. Bai, D. D. Pollard and H. Gao, Nature, 2000, 403, 753–756.19 K. A. Shorlin, J. R. de Bruyn, M. Graham and S. W. Morris,
Phys. Rev. E: Stat. Phys., Plasmas, Fluids, Relat. Interdiscip.Top., 2000, 61, 6950.
20 J. W. Hutchinson and Z. Suo, Adv. Appl. Mech., 1992, 29,63–191.
21 J. L. Beuth Jr, Int. J. Solids Struct., 1992, 29, 1657–1675.22 Z. C. Xia and J. W. Hutchinson, J. Mech. Phys. Solids, 2000,
48, 1107–1131.23 M. A. Biot, J. Appl. Phys., 1956, 27, 240–253.24 A. Norris, J. Appl. Phys., 1992, 71, 1138–1141.25 L. Goehring, A. Nakahara, T. Dutta, S. Kitsunezaki and
S. Tarafdar, Desiccation cracks and their patterns: Formationand Modelling in Science and Nature, Wiley-VCH, Singapore,2015, p. 349.
26 Y. Couder, L. Pauchard, C. Allain and S. Douady, Eur. Phys.J. B, 2002, 28, 135–138.
27 M. F. Laguna, S. Bohn and E. A. Jagla, PLoS Comput. Biol.,2008, 4, e1000055.
28 A. Boudaoud, Trends Plant Sci., 2010, 15, 353–360.29 A. Nakahara and Y. Matsuo, J. Phys. Soc. Jpn., 2005, 74,
1362–1365.30 Y. Matsuo and A. Nakahara, J. Phys. Soc. Jpn., 2012,
81, 024801.31 M. Fender, F. Lechenault and K. Daniels, Phys. Rev. Lett.,
2010, 105, 125505.32 S. Bohn, L. Pauchard and Y. Couder, Phys. Rev. E: Stat.,
Nonlinear, Soft Matter Phys., 2005, 71, 046214.33 S. Bohn, J. Platkiewicz, B. Andreotti, M. Addabedia and
Y. Couder, Phys. Rev. E: Stat., Nonlinear, Soft Matter Phys.,2005, 71, 046215.
34 D. Mal, S. Sinha, S. Mitra and S. Tarafdar, Physica A, 2005,346, 110–115.
35 D. Mal, S. Sinha, T. Dutta, S. Mitra and S. Tarafdar, J. Phys.Soc. Jpn., 2007, 76, 014801.
36 L. Goehring, R. Conroy, A. Akhter, W. J. Clegg andA. F. Routh, Soft Matter, 2010, 6, 3562–3567.
37 P.-G. de Gennes and J. Prost, The Physics of Liquid Crystals,Oxford University Press, Oxford, 1993, 2nd edn, p. 597.
38 A. A. Mercurieva and T. M. Birshtein, Makromol. Chem.,Theory Simul., 1992, 1, 205–214.
39 C. Andresen, A. Hansen, R. Goc, P. Davy and S. Hope, Front.Phys., 2013, 1, 1–5.
40 A. Hafver, E. Jettestuen, M. Kobchenko, D. K. Dysthe,P. Meakin and A. Malthe-Sørenssen, EPL, 2014, 105, 56004.
41 R. S. Sletten, B. Hallet and R. C. Fletcher, J. Geophys. Res.,2003, 108, 8044.
42 P. Pina, J. Saraiva, L. Bandeira and J. Antunes, Planet. SpaceSci., 2008, 56, 1919–1924.
Paper Soft Matter
Ope
n A
cces
s A
rtic
le. P
ublis
hed
on 0
6 Ja
nuar
y 20
16. D
ownl
oade
d on
12/
1/20
21 1
:35:
17 P
M.
Thi
s ar
ticle
is li
cens
ed u
nder
a C
reat
ive
Com
mon
s A
ttrib
utio
n 3.
0 U
npor
ted
Lic
ence
.View Article Online
This journal is©The Royal Society of Chemistry 2016 Soft Matter, 2016, 12, 2253--2263 | 2263
43 L. Valentini, D. Perugini and G. Polil, Physica A, 2007, 377,323–328.
44 A. A. Griffith, Philos. Trans. R. Soc. London, Ser. A, 1921, 221,163–198.
45 B. R. Lawn, Fracture of Brittle Solids, Cambridge UniversityPress, Cambridge, UK, 1993, 2nd edn, p. 378.
46 M. A. Biot, J. Appl. Phys., 1941, 12, 155–164.47 H. M. Yin, G. H. Paulino and W. G. Buttlar, Int. J. Fract.,
2008, 153, 39–52.48 H. M. Yin, Int. J. Solids Struct., 2010, 47, 1007–1015.49 M. H. Sadd, Elasticity theory, applications, and numerics,
Elsevier, 2005, p. 461.
Soft Matter Paper
Ope
n A
cces
s A
rtic
le. P
ublis
hed
on 0
6 Ja
nuar
y 20
16. D
ownl
oade
d on
12/
1/20
21 1
:35:
17 P
M.
Thi
s ar
ticle
is li
cens
ed u
nder
a C
reat
ive
Com
mon
s A
ttrib
utio
n 3.
0 U
npor
ted
Lic
ence
.View Article Online


