130
Volume 3, Issue 2, Spring 2016

Volume 3, Issue 2, Spring 2016


International
Journal of African
Development
Vol. 3 Issue 2, Spring 2016
Western Michigan University College of Arts & Sciences
Department of Economics and Center for African Development Policy Research (CADPR)

Editorial Management Team 2016
Chief Editor, Sisay Asefa, PhD, Distinguished Service Professor of Economics and Director of
the Center for African Development Policy Research, Western Michigan University
Managing Editor, Fredah Mainah, MBA, MA, PhD in Organizational Leadership and Instructor
at Interdisciplinary Health Services and Women and Gender Studies Departments, Western
Michigan University
Copy Editor, Garyle Voss, Instructor in the Center for English Language and Culture for
International Students, Western Michigan University
Associate Editors
Amos Aduroja, PhD, MPH, FASHA, Associate Professor of Health Education Evaluation and
Research, Western Michigan University
Minerva Cruz, PhD, Assistant Professor of Public Administration, Western Michigan University
Mariam Konate, PhD, Associate Professor of Gender and Women Studies, Western Michigan
University
Menelik Geremew, PhD, Assistant Professor of Business and Economics, Kalamazoo College
PhD Graduate Assistant Editors
Bezawit Teshome Agiro, PhD student in Applied Economics, Western Michigan University
Daniel Abraham Mengistu, PhD student in Applied Economics, Western Michigan University
Nardos Moges Beyene, PhD student in Applied Economics, Western Michigan University
ScholarWorks Consultant
Maira Bundza, MLS, Associate Professor, University Libraries, Western Michigan University

International Journal of African Development
Volume 3, Issue 2, Spring 2016
Contents
Editorial Note 4
Sisay Asefa
Reducing Marginalization of Fishermen through Participatory Action Research in the 5
Zambezi Valley, Zimbabwe
Bernard Manyena, Andrew E. Collins, Frank Mudimba, Danisa Mudimba
Current Situation of Agricultural Trade: What Effects does it have on Food Security 23
in Africa?
Ismaelline Eba Nguema
Collapsing Microfinance Institutions in Ghana: An Account of How Four Expanded 37
and Imploded in the Ashanti Region
Festival Godwin Boateng, Stephen Nortey, Jonas Asamanin Barnie, Peter Dwumah,
Eunice Ackom-Sampene, Martin Acheampong
International Trade Effects of Regional Economic Integration in Africa: The Case of the 63
Southern African Development Community (SADC)
Mengesha Yayo, Sisay Asefa
Why Regional Integrations Succeeds or Fail in Africa 86
Martin Namasaka
The Effect of Maternal Employment on Child Obesity 113
Bezawit T. Agiro
Editorial Note
I am pleased to introduce the second issue of volume 3 of IJAD for spring 2016. I am
pleased to inform readers that our articles have been downloaded over 11,000 times from all parts
of world, thus becoming an outlet for global research beyond the African continent. This volume
contains six papers that span various topics and dimensions of sustainable development.
The analysis of each research paper has policy implications on how to improve the human
condition: The first paper concludes that enhancing community agencies through participatory
research leads to just and equitable outcomes by reducing marginalization and absolute poverty
which requires good governance at local and community level. The second paper based on data
from Morocco concludes its analysis and recommends a more just and equitable global multilateral
trade agreements toward agricultural trade and food security. The third paper, based on data from
Ashanti Region of Ghana exposes the unethical and illegal practice and mismanagement that led
to microfinance institution collapse, and how that crisis related to the global financial crisis even
though internal factors are more significant. The fourth paper explores why regional integration
efforts have failed and succeeded in Africa comparing the historic experiences of the East African
Community (EAC) and the Southern African Development Community (SADC). The analysis of
these two regional experiences suggests legitimacy for each government to incentivize regional
integration and willingness to sacrifice political autonomy for regional integration which has great
potential to redress the unequal effect of global international trade on Africa. The implication of
this paper is that each member state of regional governance must be democratic with leadership
that can see beyond itself for current and future generations. Effective regional integration is a pre-
condition for an economic and political union of the 54 African states.
The final paper is based on US data which is a major public health concern. The study is
based on National Longitudinal Survey of Youth of young adults from 1986-2010 cohort obtained
from the US Bureau of Labor Statistics. The study shows maternal employment is significantly
and positively correlated with child obesity, where US Government must improve its maternal
policy for employed mothers and fathers by providing necessary leave of absence for child care as
well child care facilities for children in US. In this regard US finds itself behind European states
such as Sweden, France, Norway and the UK.
Finally, with above brief introduction of each paper, the Editor invites readers to read the
detailed analysis in each of the papers and wishes all happy reading!
Sisay Asefa, PhD
Chief Founding Editor, International Journal of African Development
Professor of Economics, College of Arts and Sciences
Director, Center for African Development Policy Research, Western Michigan University
Spring 2016, Kalamazoo, Michigan, USA

International Journal of African Development v.3 n.2 Spring 2016 5
Reducing Marginalization of Fishermen through Participatory Action Research
in the Zambezi Valley, Zimbabwe
Bernard Manyena, University of Manchester, Manchester, UK
Andrew E. Collins, Northumbria University, Newcastle upon Tyne, UK
Frank Mudimba and Danisa Mudimba, Basilwizi Trust, Bulawayo, Zimbabwe
Abstract
Equitable sharing of fishing resources has been the major source of tension between
Zambezi Valley communities and the Zimbabwe government authorities since the
1950s following the Kariba Dam-induced resettlement. Using participatory action
research, it was found that the fishing license system and criminalization of
fishermen were the major sources of tension between fishermen and government
authorities. Engaging with government authorities to address these tensions,
fishermen were recognized as partners in the fishing industry. The conclusion was
that enhancing community agencies through participatory action research would be
fundamental towards creating socially just and equitable arrangements that could
emancipate marginalized communities from abject poverty.
Keywords: marginalization, fishing resources, participatory action research, Zambezi
Valley, Zimbabwe.
This paper examines the extent to which marginalized fishermen along the Kariba Dam
used participatory action research to demand increased access and benefit-sharing of fishing
resources from government authorities. Over the past five decades, the mid-Zambezi Valley
communities, mainly the Tonga minority ethnic group residing on the Zimbabwean side of the
Zambezi River, have experienced a sustained conflict between authorities to regain entitlement to
fishing resources. Yet, fishing continues to be an inherent, if not an indispensable, aspect of the
lives of the Zambezi Valley people, both on the Zambian and Zimbabwean side of the mid-
Zambezi River. On the Zimbabwean side, these communities are spread across the Binga, Hwange,
Nyaminyami and Gokwe districts in the north-western part of Zimbabwe (Figure 1).
The Tonga lost entitlement to fishing following their ‘forced uprooting’ (Colson, 2003)
due to the inundation of their homes in 1957-8 by the Kariba Dam (Colson, 1971). However, it
was not until late 2007 that the debate on access and benefit sharing of fish resources gained
momentum. The origins of motivation for the Tonga to provoke the debate could be attributed to
what McGregor (2009) terms ‘politics of recognition’ to address their marginalization. Further,
Conyers and Cumanzala (2004) assert that the combination of the Tonga’s perceived identity,
minority ethnic status, unique history and lack of basic infrastructure and services encouraged
them to strive to demystify the media portrayal of them while at the same time improving their
social and economic status.

6 http://scholarworks.wmich.edu/ijad/
Figure 1: Location of the Zambezi Valley, Source: Authors.
Since the Kariba Dam-induced resettlement in 1957-8, fishing has been considered a risky
business, not only from crocodiles and hippos but also from state authorities. The fishermen have
been risking their lives and surviving at the end of the margins due to the conflict between them
and state institutions: the Department of National Parks and Wildlife Management (National
Parks); Zimbabwe Republic Police (Police); and the Binga, Hwange and Nyaminyami Rural
District Councils (Councils). Previous studies of the conflict between state authorities and kapenta
(Limnothrissa miodon) fishermen on one hand and gillnet fishermen on the other have tended to
explore the dispute as distinct industries warranting different approaches (McGregor, 2009;
Nyikahadzoi, 2009; Nyikahadzoi and Raakjaer, 2009). This allowed for an in-depth understanding
of the nature and dynamics of each of the industries. The downside of studying kapenta and gillnet
fishing as separate entities could be its failure to reveal a holistic view of the challenges the Kariba
Dam fishing industry faces. This paper addresses this gap by examining the struggle of kapenta
and gillnet fishermen in developing transformative actions to improve access and benefit-sharing
arrangements of fishing resources in the Kariba Dam district. This paper will not only contribute
to the access and benefit-sharing literature on fishing resources, but will also resonate with the
marginalized people’s struggles towards socially accessing and benefit-sharing of resources that
address poverty.
This paper examines contextualizing the conflict within the marginalization conceptual
framework. Limited access to fishing resources tends to be largely underpinned by the
marginalization of communities displaced by the Lake Kariba construction in the 1950s. It then
moves to outline the participatory action research methodology that was employed as a means of

International Journal of African Development v.3 n.2 Spring 2016 7
empowering fishermen to seek increased access and fair benefit-sharing arrangements for fishing
resources. The paper then presents and discusses two major sources of tensions, namely, the fishing
license system and the harassment of fishermen. And finally, the paper discusses results of the
actions taken by fishermen in addressing the access and benefit-sharing imbalances. The
conclusion is that enhancing of community agencies through participatory action research is
fundamental towards creating socially just access and benefit-sharing arrangements that can
emancipate marginalized communities from abject poverty.
Conceptualizing Marginalization
This study used a marginalization framework to contextualize the conflict between the
fishermen and the state in accessing and sharing fishing resources in the Zambezi Valley. Yet,
marginalization, like most social science concepts, is a contested concept. Hall et al. (1994) define
marginalization as the peripheralisation of individuals and groups from a dominant, central
majority. They view marginalization as a socio-political process, producing both vulnerabilities
(risks) and strengths (resilience) as summarized in Table 1.
Table 1:
Properties of Marginalization
Property Description
Intermediacy Having boundaries that separate and protect, such as the skin, but also referring to risk of
personal or territorial invasion and the dangers inherent in living in contested or border
environments.
Differentiation The strength of cultural and personal uniqueness and the risk of becoming a scapegoat and
being stigmatized.
Power Access to resources, individual and collective awareness and organization, and risks
associated with enforced conformity.
Secrecy Access to, and control of information to protect one’s self and group, and the risks resulting
from the dominating group’s use of insider knowledge to their advantage.
Reflectiveness Survival skills gained from leading an examined life, and the risks involved in the
exhaustive processes of constant vigilance, and analysis of each new social encounter
necessary for safety.
Voice Expression of one’s experiences as valid and different from the dominant myths, and the
risks of being silenced.
Liminality Having experiences not shared by others; severe trauma, stigmatization, and illnesses can
foster abilities to empathize with others, but carry risks of alienation, altered perceptions,
and heavy psychic strain.
Note: Adapted from Hall, et al (1994)
Burman and McKay (2007, p. 317) define marginalization as ‘the process by which persons
are peripheralized, or pushed to the periphery to varying degrees from the socio-political center,
because of their identities, associations, experiences, or environments.’ They further contend that
marginalized persons are viewed as relatively different from the norm, and marginalization can
involve gender, racial, political, cultural and economic oppression. According to Still (2001),

8 http://scholarworks.wmich.edu/ijad/
marginalization involves a relative lack of power and influence. Thus, marginalization is most
often used to illustrate differences, hierarchies and dependent relationships between regions,
sectors, groups and individuals. It illustrates the scarcity of human or physical endowments, or
both, as well as a lack of political or economic competitiveness between social groups or
geographical areas. Marginalized regions, sectors, groups and individuals ‘lack something.’ They
may lack such things as power, education, access to resources, capital, and democratic institutions.
Conflicts arise between the center and the periphery when the marginalized group attempts to
remove or reduce the ‘lacking something.’
Table 1 reveals that marginalized people have less power and influence than the dominant
social group. For example, marginalized people often live in contested environments, their access
to resources has to contend with enforced conformity, and they have limited access to information.
Marginalized people fit Foucault’s description that they are most prone to be incarcerated or
otherwise punished.
Although the origins of the marginalization discourse are mostly associated with feminist
theories (Hooks, 1984; Hall et al., 1992; Stevens, 1993), it has gradually found expression in other
social science disciplines such as nursing and developmental studies. The properties of
marginalization in Table 1 resonate with critical theories; thus, marginalization is inclusive of
oppression, and also a consequence of oppression (Hall, et al., 1999). Thus, the concept of
marginalization can be useful in illuminating the subjective experience of the Zambezi Valley
fishermen, including how they interpret the power-equation, the language, and their desires
towards equitable access and the sharing of fishing resources. To this end, this paper adopts the
constructionist epistemology through participation towards equitable access and sharing of Lake
Kariba’s fishing resources. Constructionism is an ontological condition of social being, social
consciousness, social action, institutions, structures, even society itself; it is not a form imposed
on social life, but social life and human lives are themselves socially constructed (Somers, 1992).
If marginalization can be understood through social construction, social action is also guided by
construction, thus social processes and interactions, both institutional and interpersonal, are
mediated through social construction.
Marginalization of the Kariba Dam Fishermen: Evidence from the Literature
The marginalization of the Zambezi Valley fishermen cannot be understood in isolation of
the broader peripheralisation or exclusion of the Tonga. As a way of simplifying our understanding
the marginalization of the Tonga, we briefly explore the events using Mhlanga’s (2009) three
phases: the pre-impoundment phase (before 1958), the post-impoundment colonial phase (1958-
1980) and post-impoundment independence phase. Life during the pre-impoundment phase for the
Zambezi River Tonga can be traced from the Iron Age, half a million ages ago (Reynolds and
Cousins, 1991), and was primarily based around riverbank farming, fishing and hunting. Known
in various terms as ‘basimulonga’ (Colson, 1971) ‘basilwizi’ (Tremmel, 1994), and ‘bamudonga’
(Ncube 2004), the Tonga’s crop cultivation was based on recession agriculture, which depended
on the flood regimen of the river. Fishing, kuzuba nswi, was one of the major sources of livelihood

International Journal of African Development v.3 n.2 Spring 2016 9
for the Zambezi Valley Tonga. Agriculture was combined with fishing, where for instance, bream
and tiger fish were caught with nets and buckets in small inlets when the flood receded from the
Zambezi River and its tributaries, (Weinrech, 1977) without any restrictions. They supplemented
their diet with fish, a source of protein required by the body for growth and maintenance of tissue.
The beginning of the post-impoundment phase began with the loss of entitlement to fishing
resources which came to an abrupt end between 1956 and 1958 following the forcible uprooting
or removal of the Tonga whose homes and lands were flooded by the building of the Kariba Dam.
Approximately 57,000 people were ‘moved’ by the Federation of Rhodesia and Nyasaland to areas
outside the reservoir on both sides of the Zambezi River in what today is known as Zambia and
Zimbabwe (Colson, 1971). With a capacity of 180.6 km3, surface area of 5577 km2 and length of
280 km, the Kariba Dam was then the largest man-made lake in the world (WCD, 2000). The lake
was primarily constructed to generate hydro-electricity.
On the Zimbabwean side, 22 chiefdoms were forcibly moved to make way for the dam,
including Simunchembu, Sinamagonde and Musambakaruma chiefdoms that were relocated to
areas far from the river, where there was inadequate water (WCD, 2000). The Tonga have become
what can be termed ‘development refugees’ (Weist, 1995) or development-induced internally
displaced persons who still need to be rehabilitated. With more than five decades since the Kariba
Dam construction, the great dam, which deprived the Tonga of their homes, has not benefited them
(Lessing, 1993; Tremmel, 1994). In addition to loss of agricultural lands, clean drinking water and
hunting, access to fishing was one of the major sources of livelihood the Tonga people lost. Since
the construction of the Kariba Dam, the marginalization of the fishermen continued to grow. To
appreciate the extent of marginalization of the Zimbabwean fishermen by the successive
governments, Table 2 compares the Zambian and Zimbabwean fishermen since the resettlement
in the 1950s. Hall et al.’s (1994) five of seven properties of marginalization - intermediacy,
differentiation, power, secrecy and voice - were considered sufficient to reveal the extent of
injustices suffered by the Zimbabwean fishermen.
On the Zambian side, the interest of the local population was paramount. There was no
racially based segmentation. The whole Zambian shoreline was designated as “Native Trust Land”
and could not be utilized without consent of the local people. In contrast, in Zimbabwe, the then
Rhodesian authorities divided the shorelines along racial lines into 14 areas, which later changed
to eight and then to the present seven in 1972 and 1976 respectively. The native areas were shared
with white-owned concessionaires who, in addition to their own fishing concession areas, would
also purchase the fish from the black fishermen (Karenge and Games, 1995). Also, any kind of
economic investment in onshore fishing in Zimbabwe had been virtually absent (Marshall, et al.,
1982; Bourdillon, et al., 1985; Kolding et al., 2003), in contrast to a relatively strong management
regime and enforcement capacity which had not changed since Zimbabwe’s independence from
Britain in 1980. In the 1990s, the National Parks devolved appropriate authority status to the Binga
and Nyaminyami RDCs where the RDCs subleased the Exclusive Fishing Zones (EFZ) to
fishermen and created a co-management structure. To this end, the National Parks created a

10 http://scholarworks.wmich.edu/ijad/
Table 2:
Comparison between Zambia and Zimbabwean Fishermen Marginalization
Property of
marginalization
Zambia Zimbabwe
Before independence After independence
Intermediacy Shoreline not divided
into fishing zones with
fishermen having
freedom of choice of
where to fish
Lake designated Kariba
Recreational Park;
Shoreline divided into
14 zones, reduced to 8
and then 7 zones in 1972
and 1976 respectively.
No freedom of choice of
movement on where to
fish
Lake designated Kariba
Recreational Park and 7 fishing
zones have remained unchanged;
No freedom of choice of movement
on where to fish
Differentiation Shoreline not divided
according to race, color,
etc.
Shoreline divided along
racial lines with ‘native’
reserves and concessions
for whites. White-owned
companies dominate
both kapenta and
inshore/artisanal
commercial fishing.
No discrimination on shoreline but
is opened to wider community with
no preference to the resettled
people. White-owned companies
continue to dominate both kapenta
and inshore/artisanal commercial
fishing.
Power Access to fishing
generally unregulated;
no limits on net sizes
Access to fishing
regulated by Department
of National Parks such
as net sizes, number of
nets to prevent
overfishing, and
settlements prohibited.
Offenders are punished;
survival of the fittest;
low income
Conservationist and tourist
interests grew stronger than pre-
independence. Access to fishing
regulated by Department of
National Parks such as net sizes,
number of nets and settlements
prohibited. Offenders are punished;
survival of the fittest; low income
Secrecy Information was
available to fishermen;
capacity building for
fishermen, e.g. Fishery
Training Centre at
Sinazongwe in 1961
Information restricted to
officials and not
available to fishermen;
no capacity building for
fishermen; fishermen
avoid punishment
Cooperatives created and capacity
building related to conformity to
regulations rather than rights of
fishermen
Voice Fishermen have freedom
to express themselves
No freedom to express
their exteriorized life of
survival or hope for the
future
Freedom to express their
exteriorized life of survival or hope
for the future is determined by
political affiliation
Note: Source: Authors
hierarchical Sub-Area Fishermen Association structure to co-manage each of the eight EFZs.
However, Sub-Area Fishermen Associations were ineffective because of the flawed nature of their
creation; they were created for the wrong and mundane reasons. The Sub-Area Fishermen

International Journal of African Development v.3 n.2 Spring 2016 11
Associations were established to provide such things as keeping statistics and monitoring poachers
because the state could not sustain the regulatory operations due to inadequate resources. Thus,
the Sub-Area Fishermen Associations were meant to serve and also ensure their conformity to the
regulatory infrastructure that marginalized the fishermen in the first place. McGregor (2009)
argues that the co-management structure of Sub-Area Fishermen Associations had little impact on
fishermen’s access to resources due to, among others, limited participation of fishermen in the
delimitation of the Exclusive Fishing Zones (EFZ) and the persistence of criminalization of
fishermen.
In contrast in Zambia, there is freedom of fishing and fishermen can fish anywhere. The
Zambian inshore fishing, with virtually no enforcement of regulations, experienced a much higher
fishing intensity and a changed fishing pattern towards increasingly smaller mesh sizes resulting
in a higher exploitation level (Kolding et al., 2003). From Zambia’s independence in 1964 to
1986, no mesh restrictions for gillnets existed and beach seines were allowed. After 1986, the
minimum mesh size for gillnets was set at three inches (76 mm), beach seining and kutumpula
(fish driving) were prohibited. In practice, however, there was little enforcement due to a lack of
resources (Musando, 1996 as cited by Kolding, 2003). Notwithstanding, the overall fishing effort,
in terms of number of nets, was about seven times higher in Zambia than in Zimbabwe, there were
no indications of biological overexploitation in the Zambian inshore fishing in terms of reduced
total yields or changed fishing communities. Thus, the assumption that there was over-fishing in
Lake Kariba was a myth as inshore fishing stocks are only moderately exploited and severely
underutilized in Zimbabwe. Besides, the water has power to restock fish even under intensive
exploitation as Lake Kariba is a naturally fluctuating and resilient system with its source of
biomass and productivity being located in the hydrological regime, and annual pulse of fertilizing
nutrients washed in by the rains (Kolding et al., 2003).
Kolding, et al. (2003) list a litany of restrictions, which exclude and criminalize the
Zimbabwean fishermen, which include the following:
Fishing is not permitted using nets with less than a four-inch (102 mm stretched) mesh size.
Explosives, chemicals, poisons, intoxicating substances, scoop nets, jigging and fish
driving may not be used to catch fish.
Fishing is not permitted along parts of the shoreline belonging to the DNPWM, notably all
the Chete Safari Area, most of the Matusadona National Park, and parts of the Charara Safari Area.
Other restrictions are in place for mouths of rivers, large population centers, harbors, and river
estuaries.
Fish net manufacturing is not permitted for persons who do not hold a valid manufacturer
and dealer license, and fishing nets can only be sold to holders of valid fishing permits.
Approach to Collecting Field Evidence
The extent to which the Zambezi Valley fishermen were marginalized and excluded from
fair access and equitable sharing of benefits of fishing resources required a methodology that was
grounded in social transformation and human rights activism. Participatory action research was

12 http://scholarworks.wmich.edu/ijad/
Advocacy cycle
Problem identification and analysis
objectives
Identify target group,
stakeholders and allies
Resource mobilizationAction plan
implementation
Monitoring and evaluation
considered appropriate as it lends itself to be associated with social change, where its results can
be translated into political action (Sarantakos, 2006; Gibson, 2004).
Mainly accredited to Kurt Lewin’s action research in the 1940s in USA, participatory
action research has been associated with the critical theory and philosophy of liberation where
research is grounded in people’s struggles (Kindon et al., 2007). Paulo Freire’s work in Brazil,
Mahatma Ghandi’s work in India, and Julius Nyerere’s work in Tanzania are among the most cited
examples of the effectiveness of participatory action research, and how it can empower the
oppressed to transform society and assert their rights (Savin-Baden and Wimpenny, 2007). In
participatory action research, Reason and Bradbury (2001) stated that researchers and participants
work together to construct knowledge from their experiences and realities where a single
phenomenon can have multiple interpretations. They further stated that researchers and
participants identify the problem and formulate actions together to change the situation for the
better. In many ways, participatory action research is in sharp contrast with the positivist
epistemologies of knowledge construction where knowledge is seen as a free-standing unit
independent of the researcher (McNoff and Whitehead, 2002). Notwithstanding the argument that
participatory action research can lead to social change, participatory action research can be
difficult to organize as it requires financial, material and human resources as well as time.
Participatory action research for this project was supported by the advocacy cycle tool (Figure 2).
Figure 2: The Advocacy Cycle
The kapenta and gillnet fishermen who participated in this project were from the Binga,
Hwange and Nyaminyami district fishing cooperatives. Although the researchers and fishermen
used the advocacy cycle as a guide, discussions on problem identification and analysis, setting
objectives, and identifying stakeholders were messy, emotional, and full of contestation (Cahil,
2007), swinging back and forth from time to time. Nonetheless, as soon as stakeholders were
identified, they were engaged in the participatory action research project, where the problem,

International Journal of African Development v.3 n.2 Spring 2016 13
objectives, stakeholders and resources were reviewed. This was important to ensure commitment
of participants to ‘actioning’ the findings. The stakeholders were drawn from the National Parks,
Rural District Councils, Traditional Chiefs and non-governmental organizations, Basilwizi Trust,
and Save the Children. Involving government structures was important and did not only provide
legitimacy and ownership of the findings, but also reduced suspicion from politicians since the
project was implemented in 2007 and 2010 at the height of political tensions in Zimbabwe.
The second aspect involved capacity building of fishermen and stakeholders. This was at
two levels. Firstly, fishermen were trained on advocacy skills as a way of empowering them to
demand access and control to fishing resources. This included social problem analysis, research,
conflict resolution, negotiating strategies and lobbying. As a result of the training, the fishermen
formed the Kujatana Kwesu Fisheries Union comprised of nine executive committee members,
including one female. The Kujatana Kwesu Fisheries Union enabled fishermen to present and
represent themselves in demanding increased access and benefits to fishing resources as well as
issues around conservation. Secondly, awareness workshops were facilitated by officials from the
National Parks and Rural District Councils. This included a review of the Parks and Wildlife Act
and related instruments and guidelines. The research team played a facilitatory role, mainly in
providing technical and logistical support. Following the training, fishermen and stakeholders
developed an action plan which included gathering evidence on the extent of marginalization of
fishermen, meetings, seminars and conferences with duty-bearers in government authorities. The
Zambezi Valley stakeholders’ conference that was held in Harare from 1-3 December 2010 was
one of a series of dialogue meetings between fishermen and government authorities. At the Harare
conference, high-level decision-makers, involving three government ministers including the
Minister of Natural Resources, participated in the discussions.
Field Evidence of Fishermen’s Marginalization
This section presents the problems fishermen were facing which limited their access and
control of fishing resources. The problems were mainly in two categories, namely, the fishing
license system, and criminalization and punishment of fishermen.
Fishing License System
To regulate fishing activities, a fishing license system, managed by the National Parks, was
put in place for both Kapenta and gillnet fishermen. Kapenta and gillnet fishermen, both
individuals and co-operatives, applied for licenses to both the National Parks and Rural District
Councils. The National Parks is the licensing agency for permits to use water resources in Lake
Kariba, and the Rural District Councils issue fishing permits for fishing zones located in their
jurisdictions. Both gillnet and kapenta fishermen were aware of the National Parks’ eligibility
requirements for them to be allowed to fish.
For me or a cooperative to obtain a [gillnet fishing] license, I need to convince authorities
[Rural District Council] that I own a boat and life jackets. I have also to identify the fishing
camp I will be operating from.

14 http://scholarworks.wmich.edu/ijad/
Similarly, to register for kapenta fishing, fishermen need to provide evidence of ownership
of a fishing rig (boat), life jackets and operational area. There were additional requirements for
both gillnet and kapenta fishing cooperatives to be eligible to fish. A certificate of registration,
constitution and membership list were needed by the licensing authorities. For gillnet fishermen,
the National Parks issues the fishing licenses to three riparian Rural District Councils - Binga,
Nyaminyami and Hwange.
There is a small difference between the Nyaminyami and Binga Rural District Councils’
allocation of licenses considering that they have a large shoreline compared with the Hwange Rural
District Council which has one fishing camp at Musuna. The Rural District Councils then issue
the fishing licenses to the individual fisherman or fishing cooperative. The distribution of licenses
per individual fisherman can differ according to the Rural District Councils. Forty-six percent of
licenses are issued to cooperatives. Fishing licenses or permits for gillnet fishermen operation on
state lands are issued directly by the National Parks. Applications for kapenta fishing were made
at the National Parks District Office in Binga for onward processing in Harare. Table 4 shows the
distribution of kapenta fishing permits in the three riparian districts of Binga, Hwange and
Nyaminyami.
That the National Parks’ licensing system lacked accountability and transparency was a
concern for both kapenta and gillnet fishermen. They claimed there was a shortfall in the number
of fishing licenses that were issued in Harare, and those distributed by the National Parks Sub-
office in Binga. In any case, the official license limit had never been reviewed and the actual
recorded number of nets and fishermen, although fluctuating most of the time, had been below the
values. Fishermen also expressed concern over additional license fees they were charged by
authorities. For example, in Deka in the Hwange Rural District Council, the National Parks
required the gillnet fishermen to pay daily fees for fishing, yet they would have already paid for
fishing licenses at the Rural District Council.
We’re not benefiting much from fishing. The National Parks charged us daily fees when
we would have paid for a license to the Rural District Council.
In the Malala Fishing Camp in the Binga Rural District Council, the gillnet fisherfolk had
raised concerns over the renewal of licenses which changed from annual, to six months and then
to monthly. They were required to renew their licences monthly, and this was burdening them
financially to the extent that it was unmanageable.
They [authorities] are insensitive. How can they charge us on a monthly basis? Where do
they think we can get the money, when at the same time they restrict us to fish as much as
we would? At the end, we’re only working for the authorities instead of feeding our
families.
In the Nyaminyami District, the gillnet fisherfolk have complained over the number of
permits they were supposed to apply for.

International Journal of African Development v.3 n.2 Spring 2016 15
We’re being ripped off by the three-in-one payment system. We pay for three permits to
sell the same fish. First, we apply for a permit to fish, another one to sell [fish] [to traders]
at the [fishing] camps, and then the third one is a hawker’s license that enables us to sell
the fish outside the fishing camp. Our colleagues in kapenta fishing only require one permit
to fish and sell the kapenta.
The fishermen, through the Kujatana Kwesu Fisheries Union as Section 6 illustrates, have
continued to engage with government authorities to address the problems in the fishing license
system. This is despite the participatory action research project that ended in 2010.
Criminalization and Punishment of Fishermen
The accounts by the fishermen about criminalization and punishment were not new; they
were consistent with the literature (McGregor, 2009; Nyikahadzoi, 2009). What was new was the
degree of abuse of fishermen by the National Parks officials. One gillnetter had this to say:
When the National Parks officials impound our nets, they don’t return them to us even after
paying the fines. They sell them to Zambian fishermen or fishermen at our neighboring
camps. When they arrest us – they loot; they take everything. The National Parks officials
share the fish so they can feed their families. We remain here with nothing.
During one of the meetings which involved fishermen, the National Parks, Rural District
Councils, Lake Navigation, Police, and the Ministry of Youth, Empowerment and Development,
fishermen highlighted alleged corrupt activities taking place within the National Parks, especially
in passing information to Zambian fishing boats over their patrol schedules and raiding times. The
fishermen also lamented at the fines that were too low to deter any illegal fishing activities by the
Zambian fishermen. They recommended stiffer penalties for illegal Zambian fishermen such as
heavy fines and confiscation of their boats.
The National Parks officials come here to us without any reason. They don’t explain what
they want. One day they came here [fishing camp name supplied] and started firing bullets
in the air, searched our huts and forced us to roll on the ground and stand on our heads.
One official asked my wife ‘why are you not pregnant?’ Then they started accusing us of
hosting Zambian poachers. But, we never host any [Zambian] poachers; instead the
National Parks are letting the Zambians fish on our side without repercussions. With bribes
from the Zambians, the National Parks officials give them [Zambian fish poachers] their
patrolling timetable so they don’t clash with them.
The following shows that fishermen were aware of the need to conserve fishing resources,
and their participation would contribute to the management and sustainability of the resources.
Also, the National Parks were allegedly working with white concessionaires to harass the
fishermen.

16 http://scholarworks.wmich.edu/ijad/
National Parks officials also work together with white concessionaires to harass us. For
example, there is an arrogant agent of a wildlife safari operator [name supplied] who gets
into the Lake [Kariba] and starts pulling our nets and beating us up if he finds us in areas
he claims to be prohibited [from fishing]. But fishing has nothing to do with him … his job
about hunting wild animals.
This was contrary to Nyikahadzoi and Songore’s (1999) study whose findings show that
about 89 percent of the fishermen indicated that the relationship between them and law
enforcement agents was either ‘friendly’ or ‘very friendly.’ A further study could be quite
revealing as to the reasons for the change. However, the lawlessness and socio-economic decline
which characterised Zimbabwe during the 2000s could have contributed to the change of relations
between fishermen and law enforcement agents.
Police were also a problem. Sometimes, they forced us to lower fish prices. It’s very unfair.
We are not free at all in this country. Rural District Councils lack transparency on tariffs.
They don’t give enough days to lodge our objections to the tariffs. For example, our Rural
District Council [name supplied] gave us three days to object to the rates they were
proposing instead of 30 days [stipulated by the law].
Gillnet and kapenta fishermen caught breaking the rules remained subject to draconian
punishment, which ranged from confiscation of boats and nets (McGregor, 2009) to physical abuse
by the National Park officials.
Implementing Research Findings
A participatory action research which does not result in action can be, arguably, regarded
as a failure. On the basis of the problems fishermen identified through the participatory action
research, an action plan was drawn to engage authorities. The results of the engagement were a
testimony of the power of action research as a tool for social change. There are at least four
indicators of the impact of the project processes and outcomes. They include improved
organization of fishermen, influencing the fishing license system, and protecting the rights of
fishermen.
Firstly, as already outlined in earlier sections of this paper, the devolution of appropriate
authority to the Binga and Nyaminyami Rural District Councils, created through section 95(1) of
the National Parks Act of 1991 and Statutory Instruments 12/91 and 40/94, led to the establishment
of the Sub-Area Fishermen Association. To some extent, the devolution created an ‘invited space’
for the fishermen to participate in fishery management. Fishermen were able to at least attend
meetings where they were invited, and receive travel allowances and other perks as a reward of
their participation (McGregor, 2009). However, at the time this study was conducted, the Sub-
Area Fishermen Association only existed in theory as there were barely any activities in practice.
Nonetheless, the space provided by the Sub-Area Fishermen Association still exists today and can

International Journal of African Development v.3 n.2 Spring 2016 17
be used by fishermen at the invitation of government authorities, mainly to fulfil government
agendas.
However, by creating the Kujatana Kwesu Fisheries Cooperative Union, the fishermen
invented an additional space to be heard by government authorities. Fishermen had become more
organized by presenting and representing themselves in the management of fishing resources. They
were able to organize their own meetings where they invited government authorities such as the
National Parks and Rural District Councils. Also, government authorities had recognized
fishermen as a body. In the Binga Rural District Council, fishermen became a recognized body in
council meetings, particularly meetings where fishing licenses and permit fees were discussed.
Fishermen had also become more organized in resource mobilization. For example, they had
managed to construct a fish warehouse that was funded by the British Embassy in Zimbabwe. The
warehouse was commissioned by the Minister of Environment and Natural Resources on 7 March
2013.
Secondly, using advocacy skills obtained from the participatory action research, since
2009, fishermen have been challenging the fishing license and permit system through the Kujatana
Kwesu Fisheries Union. On 7 March 2013, the Minister of Environment and Natural Resources
acknowledged engagement with fishermen on the fishing license system.
I have received reports from the fishermen that our policies and legislation are either in
competition or in duplication which has confused and inconvenienced our people by having
a multi-level licensing system … This arrangement has been acknowledged as an anomaly
by my ministry, and we have agreed to explore ways of addressing it so that fishermen are
not overburdened. (Minister of Environment and Natural Resources, 7 March 2013)
Also, in 2009, fishermen successfully negotiated with the National Parks to have the
kapenta permit fees reduced from US $500 to US $250 per rig per quarter. Similarly, the Binga
RDC reduced the quarterly permit fees for gillnets from US $50 to US $30. Likewise, the quarterly
permit fees for gillnets in the Nyaminyami District were reduced from US $50 to US $40. The
reduction in permit fees means that the fisherman’s income increased, which would enable them
to improve the welfare of their families. Thirdly, the criminalization and punishment of fishermen
remain top on the fishermen’s agenda. They have engaged with government officials from local to
national levels. Some efforts at the local level are supported by the following quote:
We invited the National Parks officials, the District Administrator, representatives of the
Binga RDC and Zimbabwe Republic Police to ‘talk with them’ about the issue of
harassment and abuse of fishermen and their wives by the National Parks officials. The
[National Parks] officer who was perpetrating violence was present, but they hid him for
they feared we were going to assault him. The National Parks Area Manager apologized to
us on behalf of errant staff members. Since then we haven’t experienced any harassment.
(Member of Kujatana Kwesu Fisheries Union, name withheld)
18 http://scholarworks.wmich.edu/ijad/
As a result of the fishermen’s advocacy, the Minister of Environment and Natural
Resources was also looking for ways to reduce the harassment of fishermen by law enforcement
agents from the National Parks and the police.
Law enforcement is one of the key result areas of my ministry. While my ministry
continues to perform well on this front, despite resource constraints, of greater concern are
the alleged harassment, mistreatment and abuse of fishermen by our law enforcement
agents along the lake. We are aware of this disturbing trend and my directors have been
sent out to the communities on a fact finding mission. (Minister of Environment and
Natural Resources, 7 March 2013)
As a result of these advocacy efforts by fishermen, meetings involving fishermen, police,
the National Parks, rural district councils, and the Ministry of the Local Government resulted in
the reorganization of the National Parks Binga Office. It was reported that one of its officials was
charged for misconduct linked to the harassment of the fishermen. It was also reported that the
National Parks officials had since undergone some training in working with fishermen.
Reflecting on Both the Process and Product of Participatory Action Research
This paper has outlined the extent to which fishermen along the Kariba Dam used
participatory action research to organize themselves to tilt access and benefit sharing arrangements
towards a socially just system. To ensure that participatory action research becomes a means
towards social change rather an end in itself, as this paper demonstrates, there are fundamental
issues which need consideration. This suggests that the participatory action research process
deserves as much attention as the product itself. This study illustrates that the participatory action
research process, although it can be a messy and emotional (Cahill, 2007), effort should build
consensus on the nature, extent and effects of the problem using tools such as a problem tree
analysis, stakeholder analysis and planning matrices for developing action plans to address the
problem. The issues that were addressed by this study appear to be manifestations of tensions in
the natural resources management literature which has had an influence on the legal, policy and
institutional frameworks. Also, there are issues which are manifest in the geopolitical construction
of the Zambezi Valley, where the Tonga people are portrayed as backward and primitive people
(Manyena, 2013), which could have had implications in the way the fishermen were treated by
government officials, particularly those who hailed from outside the Zambezi Valley. A wide view
of issues sets in motion the strategies of solving problems, although that may not necessarily
guarantee the success of participatory action research in bringing about social change.
The Participatory Action Research Process
The marginalization of the Kariba Dam fishermen should be viewed as a symptom of
tensions in the natural resources management debate, particularly around Hardin’s (1968)
‘Tragedy of the Commons’ theory. Since the creation of Lake Kariba, both colonial and post-
colonial governments on the Zimbabwean side of the Zambezi River have restricted access to

International Journal of African Development v.3 n.2 Spring 2016 19
fishing resources over concerns of overexploitation of fish stocks. However, Kolding (2003)
disputes that there is overexploitation of fish stocks as inshore fishery stocks are said to be only
moderately exploited and underutilized in Zimbabwe. The Zimbabwean government has justified
the use of strict regulatory mechanisms on the basis of Hardin’s (1968) ‘Tragedy of the Commons’
theory where it is argued that in the absence of any control mechanism, common or open access
to a productive resource, like fish, leads to its overexploitation. This is despite some empirical
evidence suggesting that some forests, rangelands and fishing areas which are neither state
property nor private property have persisted for decades and even centuries (Gilles and Jamtgaard,
1982; Sandford, 1983; Ostrom, 1990; Moxnes, 2000; Rogers, 2010). As a result of adopting a
conservation and bio-centric ‘fish first-fisher last’ rather than ‘fisher-first fish last’ resource
management regimen, the fishermen have been presented by government authorities as criminals,
irresponsible, unreasonable and irrational beings who deserve punishment should they fail to
conform to and comply with the rules. Yet, the opposite might be true: it is the state that has
displayed some irrationality and arrogance towards its people; it has transformed a previously
complex integrated knowledge system of resource management that supported the livelihoods of
the Tonga people to the existing dysfunctional assemblage of fragmented systems (Mhlanga,
2009). This perhaps calls for more research that involves fishermen as co-researchers so they can
challenge some of the assumptions of the studies.
Notwithstanding, the argument that the natural resources management is riddled with
contestations, which can misinform policy and practice in certain situations, can provide a solid
foundation for a sustainable resource management regimen. Here the marginalization of fishermen,
as this study demonstrates, may be a failure by technocrats to interpret the natural resource
management regulations. In some ways, the conflict between fishermen and state authorities, for
example, on the fishing licensing system and unjustified criminalization and abuse of fishermen
by law enforcement agents, could point to limited understanding of the fishery regulations by both
the technocrats and the fishermen themselves. In this study, dialogue during meetings such as the
participatory review of the National Parks and Wildlife Act involving stakeholders together with
fishermen, provided an opportunity for them to build consensus on key barriers towards improved
access and benefit-sharing of fishing resources along the Kariba Dam. This was important for
another reason. The review of the legal instruments helped the stakeholders refine the issues that
needed to be changed. Equipping fishermen and their stakeholders with knowledge and legal
information on the natural resource management system fostered some level of confidence in a
manner where they would advocate for socially just access and benefit-sharing arrangements of
fishing resources.
Moreover, considering the geopolitical implication that the Tonga people are backward and
primitive built grassroots political work that would be durable and result in a sustainable and
democratic fishermen’s organization, which was critical. Advocacy training provided the
fishermen with skills for building political power to change society. Building a grassroots
organization, social problem analysis, conflict management, social transformation,
communication, dialogue, and lobbying were some of the skills that fishermen and stakeholders

20 http://scholarworks.wmich.edu/ijad/
received from the technical support team. These skills, it can be argued, could have reduced the
inferiority complex and ‘fear of officials’ during the fishermen’s advocacy work, because the
Tonga people tend to consider themselves inferior to other ethnic groups such as the Shona and
Ndebele (Manyena, 2013).
The Product of the Participatory Action Research Process
Participatory action research that does not result in positive political change, particularly
for those who have been systematically excluded, oppressed or denied by unjust social
arrangements, could be considered a failure (Pain et al., 2007; Kindon et al., 2007). This paper
demonstrates practical benefits of participatory action research. The implementation of the
research findings by the fishermen and stakeholders brought positive change in the licensing
system, suggesting that the access and benefit-sharing arrangement was leaning in favor of the
fishermen. The government officials acknowledged the anomaly in the licensing system, and
promised to rectify the situation.
Also, the concerns regarding mistreatment and abuse of fishermen received attention from
government officials, which had negative and unintended impacts that led to the reorganization of
the National Parks offices. As a result, some government officials either lost their jobs or were
transferred to locations outside the Zambezi Valley. Nonetheless, the results could be a
demonstration that the fishermen’s concerns were taken seriously by government officials.
However, underlying the actions taken by the fishermen to resolve issues around the fishing
licensing and criminalization of fishermen appears to be that the political power of the fishermen
was gradually being recognized by stakeholders. The formation of the Kujatana Kwesu Fisheries
Union provided the fishermen with some leverage of political power and agency to present and
represent themselves in ensuring a socially just system of accessing and benefit-sharing.
Conclusion
This paper demonstrates that tensions over improved access and benefit-sharing of fishing
resources along the Kariba Dam are underpinned by the politics of marginalization of the Tonga.
Thus, this study has shown the practical benefits of both the process and the product of
participatory action research. Although the participatory action research process can be ‘messy,’
the findings appear to demonstrate that building consensus on issues that need resolving, as well
as having the capacity to move key stakeholders into action, is critical. Importantly, this study also
demonstrates the benefits of researchers and research-users to have collaborative power and
agency to challenge the status quo while also widening the access and benefit-sharing arrangement
options for the marginalized fishermen. The results of this study may resonate not only with
challenges facing marginalized fishermen elsewhere, but they may be applicable to access and
benefit-sharing issues more widely.

International Journal of African Development v.3 n.2 Spring 2016 21
References
Bourdillon, M.F.C., Cheater, A.P, & Murphree, M.W. (1985). Studies of fishing on Lake Kariba.
Mambo Occasional Papers - Socio-Economic Series No. 20. Harare: Mambo Press.
Burman, M.E. & McKay, S. (2007) ‘Marginalization of girl mothers during reintegration from
armed groups in Sierra Leone’, International Nursing Review 54: 316–323.
Cahill, C. (2007). Participatory data analysis. In S. Kindon, R. Pain, & M. Kesby (Eds.),
Participatory action research approaches and methods: Connecting people, participation
and place, (pp. 181–187). London: Routledge.
Colson, E. (1971). The social consequences of resettlement: The impact of Kariba resettlement
upon Gwembe Tonga. Manchester: Manchester University Press.
Colson, E. (2003). Forced migration and anthropological response. Journal of Refugee Studies,
16(1), 1-18.
Gibson, N. (2004). Action research. In M.S. Lewis-Beck, A. Bryman, & T. Liao (Eds.) The Sage
Encyclopaedia of Social Science Research Methods. 1, 4–6. Thousand Oaks: Sage.
Gilles, J. & Jamtgaard, C. (1982). Overgrazing in pastoral areas: The commons reconsidered.
Sociologia Ruralis, 21(2), 129–41.
Hall, J.M., Stevens, P.A, & Meleis, A.I. (1994). Marginalization: A guiding concept for valuing
diversity in nursing knowledge development. Advances in Nursing Science, 16(4), 23–41.
Hall, J.M., Stevens, P.E, & Meleis, A.I. (1992). Developing the construct of role integration: A
narrative analysis of women clerical workers’ daily lives. Researching Nursing Health,
15(6), 447–457.
Hardin, G. (1968). The tragedy of the commons. Science. 168, 1243–8.
Hooks, B. (1984). Feminist theory: From margin to center. Boston, MA: South End Press.
Karenge, L. & Games, I. (1995). A boundary review of the inshore fishing zones of Lake Kariba
(Zimbabwe). Zambia-Zimbabwe SADC Fisheries Project. Project, Project Report 39.
Kindon, S., Pain, R., & Kesby, M. (2007). Participatory action research: Origins, approaches and
methods. In S. Kindon, R. Pain, & M. Kesby (Eds.), Participatory action research
approaches and methods: Connecting people, participation and place, (p. 9–18). London:
Routledge.
Kolding, J., Musando, B., & N. Songore, N. (2003). Inshore fisheries and fish population changes
in Lake Kariba. In: E. Jul Larsen, J. Kolding, R. Overa, J. R. Nielsen, P. Van Zwieten
(eds.), Management, co-management or no management? Major dilemmas in Southern
African freshwater fisheries. FAO Fisheries Technical Papers 426/2, FAO Rome.
http://www.fao.org/docrep/006/y5056e/y5056e0l.htm#TopOfPage (accessed 10 June
2010).
Lessing, D. (1983). African laughter: Four visits to Zimbabwe. London, UK: Flamingo.
Marshall, B.E., Junor, F.J.R., & Langerman, J.D. (1982). Fisheries and fish production on the
Zimbabwean side of Lake Kariba. Kariba studies, 10,175-271.
McGregor, J. (2009). Crossing the Zambezi: The politics of landscape on a Central African
frontier. Oxford, UK: James Currey.

22 http://scholarworks.wmich.edu/ijad/
McNiff, J., & Whitehead, J. (2002) Action Research: Principles and Practice. London: Routledge.
Mhlanga, L. (2009). Fragmentation of resource governance along the shoreline of Lake Kariba,
Zimbabwe. Development Southern Africa, 26(4), 585-596.
Moxnes, E. (2000). Not only the tragedy of the commons: Misperceptions of feedback and policies
for sustainable development. System Dynamics Review, 16 (4), 325-348.
Ncube, G.T. (2004). A history of North Western Zimbabwe, 1850 – 1960. Kadoma: Mond Books.
Nyikahadzoi, K. (2009). Challenges to collective action in the management of the Kapenta fishery
in Lake Kariba. Lakes and Reservoirs: Research and Management, 14, 337-351.
Nyikahadzoi, K. & Raakjaer, J. (2009). Policy evolution and dynamics of governance at the Lake
Kariba kapenta fishery. Development Southern Africa, 26(4), 639-648.
Nyikahadzoi, K. and Songore, N. (1999). Introducing co-management arrangements in Lake
Kariba In-shore Fishery: Progress, opportunities and constraints. Paper presented at an
International Workshop on Fisheries Co-management, Penang Malaysia 23 – 28 August
1999. http://www.co-management.org/download/kefasi.pdf. (accessed 5 June 2010).
Ostrom, E. (1990). Governing the Commons: the evolution of institutions for collective action.
Cambridge: Cambridge University Press.
Reynolds, P. & Cousins, C.C. (1991). Lwaano Lwanyika: Tonga book of the earth. London: Panos
Publications.
Rogers, C. (2010). Reversing the tragedy of the commons? Sustainable management and the
Commons Act 2006. The Modern Law Review, 73(3), 461- 486.
Sandford, S. (1983). Management of pastoral development in the Third World. London: John
Wiley.
Sarantakos, S. (2006). Social Research. Hampshire: Palgrave.
Savin-Baden, M. & Wimpenny, K. (2007). Exploring and implementing participatory action
research. Journal of Geography in Higher Education, 31(2), 331–343.
Somers, M.R. (1992). Narrativity, narrative identity, and social action: Rethinking English
working-class formation. Social Science History. 16, 591 - 630.
Stevens, P.E. (1993). Marginalized women’s access to health care: A feminist narrative analysis.
Advances in Nursing Science, 16(2), 39–56.
Still, A. (2001). Marginalisation is not unbearable. Is it even undesirable? Journal of Rational-
Emotive and Cognitive-Behavior Therapy 19 (1), 55-66.
Tremmel, M. (1994). The People of the great river: The Tonga hoped the water would follow them.
Gweru: Mambo Press.
Weinrech, A.K. H. (1977). The Tonga people on the Southern shore of Lake Kariba. Gweru:
Mambo Press.
Weist, K.M. (1995). Development refugees: Africans, Indians and the big dams. Journal of
Refugee Studies, 8(2), 163-184.

International Journal of African Development v.3 n.2 Spring 2016 23
Current Situation of Agricultural Trade:
What Effects Does It Have on Food Security in Africa?
Ismaelline Eba Nguema, Mohammed V University, Rabat, Morocco
Abstract
The history of food policy in Africa started with the beginning of independence
with the adoption of the strategy based on the planned development model.
However, the financial and administrative planning requirements were felt quickly.
By the early 80s, the debt crisis led African economies to abandon the policy of
self-sufficiency and to adopt a so-called liberal agro-food strategy. In this context,
food security based on external trade and its requirements became integral parts of
structural adjustment programs. Thus, Africa took a stand before the rest of the
world in the controlling of extraversion. Despite mixed results, in January 1995,
Africa strengthened its accession to a liberal system by adopting the agreement on
agriculture (AoA). Again, the promises would not match up to the results. In fact,
the sector remains far from the liberal recommendations advocated by the World
Trade Organization (WTO). Between protectionism and bilateralism, the
liberalization of agricultural products was certainly imperfect, but full of future
promise for Africa. A more just and multilateral agreement based on development
issues is one of the cornerstones of trade that connects to food security.
Keywords: trade openness, food security, Africa, agreement on agriculture,
JEL Classification: F13
In the early 1980s, Africa adopted a food strategy based on external trade. Thus, the
continent was opened before the rest of the world. In 1995, the other members of the new World
Trade Organization (WTO) came to join the continent by adhering to the Multilateral Agreement
on Agriculture (AoA). This commitment should have ensured Africa’s food autonomy, distributed
the cards of the game between different countries, and erased substantially the distortions of
agricultural trade.
Many studies predicted the significant gains to Africa in the long-term, despite some
imbalances in food security in the short-term. Nearly eighteen years after the adoption of the
Sasakawa Africa Association (SAA), the WTO members have not liberalized agricultural
products. The distortion measures persist and have spread to all actors of international trade, and
access to markets remains relatively difficult. Yet in the meantime, in 2008, there had been an
unprecedented reversal of agro-food markets. In a few days, the price of food products experienced
an unprecedented increase. Many populations of the developing world, especially in Africa,
demonstrated and demanded "the right to eat." This was the beginning of the revolts for the hungry.
Despite this fact and a willingness to stop the extension of the Doha Round, the WTO is
struggling to find an agreement on the issue of agriculture. December 7, 2013 marked the

24 http://scholarworks.wmich.edu/ijad/
conclusion of the Doha agreement, or at least its rescue. The date would mark the conclusion of a
new agreement on agriculture that is still struggling to be defined. In this context, the objective of
this article is to give a brief assessment of the current state of trade liberalization of agricultural
products, and its potential effects on food security in African countries while showing that
international trade is likely to improve the situation of food security in African countries, but under
what conditions? This is the question that I intend to address in this paper.
The African countries are dependent on food imports so the objective of the study is to
analyze the effects of trade liberalization on food security based on the capacity of the countries
to finance food imports through their export revenues. In order to do this study, we used a
methodology based on descriptive analysis of the data that comes from the following main bases:
OECD (Organization for Economic Co-operation and Development), WTO, UNCTAD (United
Nations Conference on Trade and Development), and the Center of International Trade.
Persistence of Protectionist Agricultural Policies
Agriculture is one area in which the liberalization of business collides with the protectionist
trade policies of some WTO members. The sector's situation is characterized by an impeded access
to the market and a standardization of anti-competitive practices that seem to have become a
customary strategy more or less tolerated, despite objections.
Hindered Access to the Market
For a long period, agriculture has been regarded as a specific sector. Thus, it does not meet
the same requirements as other sectors (Wongkaew, 2010). Its openness should be done gradually
while taking into account the reservations of the WTO members and without undermining the food
security of their populations. It is in this light that the AoA improved the market access for its
different members (Carreau and Juillard, 2005). Its revenues, although controversial, cannot be
denied. Even if it turns out that the tariffs applied to agricultural products remain relatively higher
than those of industrial products (Graph 1), that is not the problem. It probably resides in the
methodology of the taxation, and its impact on the structure of small economies like the African
economies (FAO, 2003).
Figure 1: Average of Duties / Tariffs in the World. Source: Data WTO.

International Journal of African Development v.3 n.2 Spring 2016 25
Furthermore, the fixation of the tariffs based on the value of the product seems to be
common sense: the products are sold at different prices depending on their nature and their level
of processing on the market. Progressivity has therefore emerged as a more or less equitable
method. However, behind a goal may hide another, less transparent and protectionist, whose
effects can be damaging to the other members that participate in international trade.
As part of the comparative advantages theory, it appears that the revenues in trade come
from the nature of the specialization of an economy. In other words, a specialization is
advantageous depending on the nature of the goods produced by a given economy. In practice, the
more a product is processed, the greater its value. However, although initially an economy is
specialized in the production of commodities with low value added, it must participate in
international trade because specialization is not a static process. The rise in the value chains is
always possible. However, the progressivity of tariffs produces an opposite effect and reinforces,
to some extent, the specialization of African countries in the production of commodities that
remain highly subject to market fluctuations (ECA, 2013). In 2011, the agricultural commodities
represented 10% of the total merchandise exported by Africa while the share of finished products
represented 3.5% (WTO, 2012).
While the AoA called to facilitate market access of tropical products (the main source of
income for African countries), it seems that the response differed depending on the degree of
transformation of the product (Table 1). Take the example of cocoa, the raw material was taxed
respectively by the United States, the European Union, Japan and Canada to 0%. When it came to
chocolate, the tariffs tended to increase considerably depending on the strategy of the preceding
importing country (Table 1). In countries like Ivory Coast, Cameroon, Nigeria and Ghana, parts of
chocolate products have tended to regress since 1970. The case of Nigeria provides a good
illustration of the negative effect that the progressivity of the tariffs can have on the structure of
African exports. Nigeria is the fourth largest producer of cocoa in the world. Cocoa has been the
second most exported product after oil in this country since 2007. The cocoa exports increased by
47% between 2006 and 2010 reaching 822.8 million dollars. Again, only about 20% of Nigeria's
cocoa production is processed locally. The rest is exported non-transformed. The paradox is more
striking when one considers that Nigeria imports a large share of chocolate from Europe and the
United States. Nigeria would profit if it produced chocolate not only to meet domestic demand,
but also to conquer new markets and to develop a whole range of products derived from the raw
material: cosmetics, food (like confectionery, biscuits, etc.). In this example, one can easily infer
the potential impact of “progressive tariffs [...] on the process of transformation of the agricultural
products; that is to say the various stages of transformation of a commodity like cocoa into finished
products like chocolate” (ECA, 2013).

26 http://scholarworks.wmich.edu/ijad/
Table 1
MFN Bound Average Tariffs in Major Importing Developed Countries, Selected Products
Product Primary / Degree
of Processing
MFN Bound Average Tariffs
EU UE Japan Canada
Cocoa Beans 0 0 0 0
Chocolate 6,9 21,1 21,3 59,0
Coffee Unripe 0 0 0 0
Roasted 0 9,0 12,0 0,4
Oranges Fresh 3,5 16,7 24,0 0
Juice 11,0 34,9 31,0 1,0
Ananas Fresh 1,2 5,8 12,1 0
Juice 4,1 11,6 24,3 0
Hides and Skins Raw 0 0 0 0
Tanned 3,0 5,4 23,5 6,3
Sugar Raw 32,8 134,7 224,9 8,5
Refined 42,5 161,1 328,1 107,0
Source: Calculations of the FAO services.
Besides the progressivity of tariffs, one can observe that the levels of tariffs are abnormally
high on certain products (Abdelmaliki and Sandretto, 2011). Tariff peaks do not concern only
tropical products, but almost all agro food products (Table 2). This situation can reinforce the
specialization of African countries in the production of basic agricultural commodities and not
those more intensive in capital, and thus with higher added value. The opening of international
markets could contribute to encouraging African countries to produce more sophisticated goods in
order to conquer new markets and to improve their ability to export while meeting domestic
demand. It is difficult to consider that market access of the Sub-Saharan Africa (SSA) members
has been improved because the essential tariff protection was not dismantled (Ben Hammouda et
al. 2005). For example, Switzerland applies the maximum most favored nation (MFN) tariffs that
are lower than or equal to 1000 on a number of products like dairy, animal origin, fruits, and
vegetables, and greater than 100 on other products like tea, coffee, beverages, tobacco, sugar and
sweets. Table 2 provides more information about the persistence and pervasiveness of these tariffs
to "alpine silhouettes" (FAO, 2004). Therefore, market access is not the only aspect of the AoA
that is disputable or controversial.

International Journal of African Development v.3 n.2 Spring 2016 27
Table 2
MFN Tariffs Imposed and Maximum Average of Some Developed Countries
Source: World Tariff Profiles, WTO, ITC (International Trade Center) and CNUCDE, 2012.
The Anticompetitive Practices: Use Strategy
Market access is not the only point of the ASA that is controversial today and must be
renegotiated. The AoA has some positive points, but those will not be in question in this study.
One of its merits is that it has the ability to distinguish between the "good and bad" subsidies in
order to limit trade distortion, and to make as clear as possible international trade (Zouré, 2011).
Subsidies have often been the point of contention in international negotiations, particularly because
of their damaging effects on the prices of food products and ultimately on the economies of the
countries that export those products (Ben Hammouda et al., 2005).
However, even though the AoA have gradually reduced the support for distortion, they
remain in use. Between the period of 1986-1988 and 2009, the subventions accorded to OECD
producers increased by 4.75% (Table 3). Over the same period, the share of support for market
prices fell by 38 (82%) (Table 3) in favor of support to inputs and revenues which, according to
current indicators, have the largest distortion effect on trade (Rainelli, 2007). Those measures
counteract the market forces and divert the flow of north south trade to the chagrin of African
countries (Baldin, 2011). In fact, regardless of their nature, when the subsidies distort the market,
Product
MFN tariffs means (1) / and maximum (2)
Canada United
States
European
Union
Japan Norway Swiss
Products of
Animal Origin 30.5 621 2.4 26 23.0 140 15.7 472 174.6 741 156.4 <1000
Dairy products 246,8 314 19.1 92 55.2 205 178.5 687 69.4 213 163.4 <1000
Fruits,
vegetables,
plants
3.5 19 4.9 132 11.5 170 12.3 378 30.6 520 22.6 <1000
Coffee, tea 10,4 213 3.2 23 6.2 25 16.3 182 8.5 115 5.2 191
Cereals and
other
preparations
20.3 277 3.5 54 16.3 167 68.3 827 75.3 640 21.7 293
Oilseeds, fats
and oils 4.8 218 4.5 164 7.1 171 11.0 587 35.1 357 28.6 180
Sugars and
sweets 5.0 27 16.6 123 29.1 131 28.4 124 25.7 134 12.8 207
Beverages and
tobacco 4.2 256 15.4 350 19.2 162 15.4 57 26.7 496 42.7 600
Cottons 0.0 0,0 4,6 19 0.0 0,0 0.0 0 0.0 0 0.0 0
Other
agricultural
products
9.0 606 4.6 67 4.8 131 4.2 441 30.0 <10
00 8.5 778

28 http://scholarworks.wmich.edu/ijad/
they generate a surplus of production, and thus lead to lower world prices for the products
concerned, and this practice compounds the detriment to African countries because their revenues
from exports decline. Thus, a significant proportion of the rural population turns from this activity
and moves to big cities in search of a better life. In most cases, this simply contributes to increase
the degree of insecurity and poverty in African cities (Raman, 2005).
Table 3
Producer Support Estimate (PSE) and Market Price Support (MPS) Million
Years 1986-88 1995-97 2008-2010 2008 2009 2010p
Estimation of
Support to Producers
(PSE)
239,160 254,048 246,287 261,074 250,523 227,265
Supporters at market
prices (1) (MPS) 183,756 171,573 108,516 111,623 112,411 101,515
WHOSE part of MPS
(in %) 76,83 67,53 44,06 42,75 44,83 44,66
Support to inputs (2) 20,171 24,041 32,797 34,182 31,640 32,569
WHOSE in % of
MPS 8,43 9,46 13,31 13,09 12,62 14,33
Income support and
area (3) 18,735 41,778 35,663 38,237 35,437 33,315
WHOSE in % of
MPS 7,83 16,44 14,48 14,64 14,14 14,65
Source: OECD, Database PSE and CSE, 2011. P = Provisional calculation, MPS = market price support.
The numbers (1), (2), (3) and (4) indicate the level of the trade distortion by measurements.
To avoid the scenario depicted and maintain the export revenues at a suitable level, one
possible solution is to subsidize domestic producers. This is a solution that has the disadvantage
of increasing market instability while decreasing the foreign exchange reserves. In other words,
the subsidies create a vicious circle that encloses the African countries in the ruts of pauperization.
Subsidizing domestic producers is more detrimental when it is known that the most
subsidized products continue to be food products (Table 5). For example, it is estimated that the
wheat received in 2008-2010 garnered 2,815 million USD in all of the OECD countries. Yet, this
product is by far one of the least subsidized foods. For comparison, rice received 17,657 million
USD during the same period, which is more than six times the amount for wheat (Table 4).

International Journal of African Development v.3 n.2 Spring 2016 29
Table 4
The Transfers to Producers of a Single Product (TSP) Million USD
Products 1986-88 1995-97 2008-10
Wheat 16,020 3,673 2,815
TSP to producers
TSP in percentage 43,2 8,8 5
Corn 11,012 2,724 2,849
TSP to producers
TSP in percentage 36,2 7,4 3,9
Rice 25,346 31,241 17,657
TSP to producers
TSP in percentage 79.8 75.4 54.3
Colza 1,833 52 140
TSP to producers
TSP in percentage 47.5 1.2 1
Sunflower 1,161 75 153
TSP to producers
TSP in percentage 47.3 4.5 5.4
Soy 1,101 354 1,646
TSP to producers
TSP in percentage 8.7 2 4.6
Sugar 4,988 5,727 2,659
TSP to producers
TSP in percentage 50.8 41.2 22
Milk 45,217 42,226 12,760
TSP to producers
TSP in percentage 59.2 44.7 10.6
Bovine meat 18,034 19,805 13,882
TSP to producers
TSP in percentage 27.8 25.1 13.7
Sheep meat 4,284 4,085 1,522
TSP to producers
TSP in percentage 51.7 39.8 14.7
Poultry meat 3,224 5,019 8,662
TSP to producers
TSP in percentage 13.3 13.7 14.1
Eggs 3,379 2,374 1,545
TSP to producers
TSP in percentage 21.6 12.3 5.3
Source: OECD, Database PSE and CSE, 2011.

30 http://scholarworks.wmich.edu/ijad/
Table 4 does not present an exhaustive list of the subsidized products. There are others like
cotton that are supported by direct aid. Direct payments are to ensure a minimum income to farmers
regardless of the quantity of production (decoupling). These products were introduced within the
Common Agricultural Policy of the European Union in 1993, and are an integral part of the US
Farm Bill (American agricultural policy) (Desriers et al., 2009). They are also increasingly used
by emerging countries like China, India, and Brazil. This practice has been strongly criticized
because of the negative impact that it has had on the African cotton producers.
Since 2002, the US Farm Bill has increased the level of aid to US producers. This increase
has resulted in an overproduction of cotton that has led to a decrease in world prices. In 2001, the
US cotton farmers received $311 billion of support. This decision had a strong detrimental impact
on the economy of some African countries, like Burkina Faso, Benin, Chad, and Mali, for whom
the export revenues for cotton accounted 5-10 % of GDP and 30-40% on average of the total export
revenues in 2001. On June 10, 2003, the President of Burkina Faso, Blaise Compaore, said in the
committee meeting of WTO trade negotiations, “By this, Burkina Faso lost in 2001, 1% of its GDP
and 12% of its export revenues, Mali 1.7% and 8%, and Benin 1.4% and 9%. The very high levels
of the subsidies accorded to the cotton producers in certain member countries of the WTO are one
of the direct causes and major problems encountered by the world cotton market. These subsidies
artificially increase the offer on international markets and depress export revenues” (Stiglitz and
Charlton, 2005). The union of these countries into the multilateral trade negotiations of the Doha
Round (named the group C4) resulted, in late 2005 at the Hong Kong Conference, in the decision
to suspend all forms of the subsidies on cotton. However, this decision was not implemented
because of China's opposition. In March 2011, the cotton prices had reached a record level in the
markets, which was $2.27 USD on the pound, and declined under the pressure of an abundant
supply to 70 cents USD. Volatility is one of the problems created by trade distortion, and another
problem that undermines trade and development of much of the developing world. The case of
cotton provides a good illustration of what distortion to trade is, and why it seems necessary to
guard against this anti-competitive practice. Beyond this, it recalls how, it is not always easier to
choose between "good and bad subsidies." A subsidy may hide one problem from another with a
pernicious effect on international trade.
Food Security and Trade Negotiations: The Cleaving Other Aspects of the SAA
The way the AoA was envisaged has undermined food insecurity. Indeed, food security
appears to have been compromised in African countries, the big loser in globalization. The current
impasse of the Doha Round has not facilitate the situation, and has contributed to its deterioration.
An Agreement that Undermines Food Security
The period before the beginning of the SAA had sparked hope for the long-term
improvement of food security in African countries. Aware that in the short term, the increase in
prices due to the reduction of the subsidies to farmers and the decrease of the customs tax would
have a potentially detrimental effect on food security of developing countries that are net food

International Journal of African Development v.3 n.2 Spring 2016 31
importers, some provisions were adapted under special and differential treatment (SDT) to absorb
these effects.
In the long-term, the remediation of agricultural trade should open new market
opportunities for African countries. The conquest of the new markets on a more equitable basis
might have encouraged countries to develop the agro-food sector in order to go up in the value
chain of agricultural products. That is to say to leverage effects that increase the export revenues
of these countries (Eba Nguema & Assoumou, 2014).
However, almost eighteen years after the beginning of the implementation of the
Marrakesh Agreement, the protectionist agricultural policies of various members have been
partially dismantled. On the tariff level, in accordance with what was mentioned in the preceding
paragraphs, the core of the protection persists. Progressivity, escalation and tariff peaks remain
relevant and contribute to diminishing the efforts to promote access to member markets. All these
measures have had a negative effect on trade diversification of African countries and, to some
extent, on their export revenues. The purchasing power of these countries has also been affected
by the proliferation of the subsidies beyond the regulatory mechanisms of the WTO. The
proliferation of the subsidies has distorted the effect and incited the subsidization that ultimately
increases volatility and market instability. On March 23, 2012, 44 African countries were
designated as net food importers by the Agriculture Committee of the WTO. These included 34
LDCs that are highly dependent on revenue from the export of the agricultural commodities. How
can the import of food be financed when the prices of the products that one exports are increasingly
unstable? How can the peasantry be maintained when the purchase price of farm products
decreases? The blockage of the Doha Round and the current economic crisis have continued to
reinforce the concerns that the different participants and observers have faced since they are related
to higher costs of anticompetitive practices, and are impacting the economic and food situation of
African countries.
Impasse in the Doha Round
On November 14, 2001, representatives of world trade met in Doha under the auspice of
the WTO, and began the first round of negotiations of the young organization. Its main objective
was to correct the mistakes of the past by giving more prominence to developing countries in
international trade. According to Article 2 of the Doha Declaration, the members agreed that
"international trade [can] play a major role in promoting economic development and poverty
reduction. [They also recognize] the need for all [people] to take advantage of the opportunities
and welfare gains that the multilateral trading system generates. [Going from the observation that
the majority of WTO members are developing countries, they agree to integrate] their needs and
interests at the heart of the Work Program adopted in this Declaration." It was an ambitious day
that opened the Doha Development Agenda considering that only a few years earlier, in 1999, the
Seattle ministerial conference ended in an acrimonious climate marred by anti-globalization
protests and opposition from developing countries to the Singapore issues (Madeley, 2006). No
doubt, the enthusiasm of a new round promising "growth, development and prosperity" declared

32 http://scholarworks.wmich.edu/ijad/
by the US Trade Representative Robert Zoellick had momentarily cleared the Seattle divisions.
However, the participants were not counting on the interest, the game of alliances, the oppositions,
and north-south antagonism. It seemed that the WTO had become what UNCTAD was in the 60s
- a place of confrontation between north and south, although in practice the reality was more
diverse. There was one reason for this situation. While the Doha Round should have been
completed by 2003 in Cancun, Mexico, this end was constantly programmed to a later date. Why
this extension? The reason was tied to the obstinacy of the developing countries to focus their
voices on issues that reflected their interests and not on engagement in trade negotiations that
might affect them, and more generally to obstruct trade development (Stiglitz, 2005). This is
probably why agriculture remains one of the points that blocks trade negotiations. In fact,
agriculture was the area on which the developing countries were ready to focus their efforts
provided that the most developed countries agreed to do the same. If not, the negotiations would
follow a path of anticompetitive practices to the detriment of the smaller economies. Beyond the
nature of the sector and its financial and strategic importance, the main difficulty blocking the
progress of the current negotiations came from the fact that the sector had remained too far out of
the reach of International trade rules (Dufourt, 2012). This situation created the winners and the
losers. Whereas the negotiations were to equitably redistribute the cards of the trade game between
the different members, it became evident that the winners were less inclined to apply the liberal
orthodoxy advocated by the WTO (Voituriez, 2009).
Nevertheless, recent years seem to bring good omens and portend a favorable outcome to
the Doha Round. In 2011, in Geneva, members apparently found the convergence points in almost
all discussions on agriculture despite some misgivings from Japan and Canada on proposals
affecting sensitive and special products. Members must resolve differences between China, India
and the United States concerning the threshold for special safeguard measures and corrective
action. The question remains whether the rate could exceed the previous bound rate in the Doha
Round. Until a consensus can be found, agriculture will continue to obstruct the smooth
functioning of the multilateral system and make a game for bilateralism (Lamy, 2006).
Although December 17, 2013 in Bali, the closure of the Doha Development Round was
initiated, the agricultural issue remains unresolved and impaired by antagonism and by the
emerging countries who are against the traditional agricultural powers. Yet the current situation of
the international agro-food market argues for an efficient reform of the sector. It only makes good
sense that the different members should find a solution that can satisfy the different positions
involved.
Fairer Multilateral Trade
This section will discuss some suggestions that can ensure a better fit for African
economies as to affect the opening of the agriculture sector for food security. This will be done by
analyzing market access and subsidies.

International Journal of African Development v.3 n.2 Spring 2016 33
Promoting Market Access
The food security objectives often differ from those of opening trade, but "for fairer trade"
based on development, it is important to pay special attention to the aspects that can have a positive
and not a destabilizing effect on the developing economies. Knowing that the link between
development, agriculture, poverty and food is important, the current negotiations should take into
account the agro-food situation that is particularly delicate in the African countries that are
promoting products for which they have a comparative advantage by gradually opening the sectors
that are most sensitive to international competition.
As part of the future "Bali Package" in the agricultural section, it would be desirable to
give primacy to tropical products that are the main sources of foreign currency for African
countries. These countries should have easier access to the external markets. The tariffs should
therefore be lower than those applied to other agricultural products. The goal is to facilitate their
marketing. Similarly, in accordance with what was mentioned in the previous sections, a sensible
approach in this area would be that the sanitary and phytosanitary standards should be reduced at
the international protection threshold. In this context, any other form of redundant protection must
be removed.
Beyond the measures for increasing export revenues, the whole point of this agreement
relies, in the long term, on its ability to encourage the African countries that import food products
to stimulate and promote food production. To do this, the new measures of the SAA should allow
these countries to maintain a level of efficient protection. In fact, the tariff thresholds granted to
emerging countries such as China, India, Taiwan, and Brazil should not be similar to those granted
to the African countries that are net food importers. This is similar concerning the adjustment
period. Moreover, the concept of special products should be redefined in order to extend the scope
in a larger portion of developing countries. When does a product present a particular interest for a
country or a population? Beyond the economic aspect, the food security aspect seems to be a
determining factor in the concept of product sensitivity. Those products considered as sensitive
would be any cereal product that is used for the alimentation of the population or the animals in
the poor and net food importing countries.
Also, contrary to the ideas received, all were not addressed in the tariff plan. While NTBs
represent the most pernicious forms of protectionism in comparison to the preceding forms, it
seems that the members have not attacked the core of tariff protection. The tariff peaks and
progressivity as a method of fixing tariffs lead to tariff escalation. In other words, significant
differences exist in the different levels of agro-food processing. In the previous sections, we took
the example of the FAO Aid. Gaps existed between beans, powder and cocoa paste. The conclusion
arrived at was that these abnormally high rates spoiled any hope of diversification and progression
in the value chains in the countries that are major exporters. At this time of the agribusiness, it
would be important that the SAA eliminate such practices. Tariff escalation often indicates the
existence of the peaks applied to certain products like dairy, cereal and others. A rebalancing of
the applied tariffs must be conducted to remove the peaks, and allow tariffs to lose their Alpine

34 http://scholarworks.wmich.edu/ijad/
aspects. But all these measures can have meaning only if they are accompanied by the elimination,
or substantial reduction, of the subsidies.
Overcoming the Grants
The subsidies given to production or exports have contrasting effects on the prices of the
agricultural products. They increase the variability and the depreciation of prices. Agriculture
remains, despite the existence of the SAA, "a lawless zone" in which, within a few years, the
developed economies can become commercial powers because of subsidies. At the time of writing
this work, the new farm bill has not been passed, but it has already raised many concerns about the
amount of aid accorded to the American farmers. One of the consequences of the subsidies is that
they create a diversion of the trade flow to countries that produce greater quantities at low prices.
In other words, they distort competition. The recent episode of African cotton gave a good
illustration of the possible effects of subsidies on smaller economies. To redistribute the cards of
the game, it would be important to proceed to the total elimination of all forms of export subsidies
on products that compose a major part of the export revenues of developing countries, except the
measures that have a neutral effect on trade.
Furthermore, the implementation of such measures would require a certain transition
period to cushion the potential damaging impact of the increase of prices resulting from a
substantial reduction of the subsidies on the net importer countries. But, the fairness is that the
countries that have been adversely impacted by the lower prices of commodities must be
"compensated." To do this, one solution concerns the ability of the WTO to authorize an
exceptional use of production subsidies in order to boost food production of the small net food
importing economies. This subjection is not for seeing the developing economies distort the
competition. The goal is to repair, at least in part, the injustice suffered.
Conclusion
The multilateral agreement on agriculture appears today, in many ways, unsuited to trade
of agricultural products because of its nature to know and lay the bases for long-term fair trade.
This is probably why it was, in the first years of its existence, called upon to be supplemented by
a series of trade negotiations. However, almost fourteen years after the launch of the Doha Round,
no agreement has been reached on this question. Nevertheless, its rescue comes from a willingness
of the WTO, and its members, to end commercial antagonism and find "common ground" to reach
a new agreement on agriculture that promises to be more complete and less flexible in regulating
exchanges. However, to satisfy all members, the food security of countries most exposed to the
situation of the breaking of the policies must be taken into account, at least on behalf of fairer
multilateral trade. Beyond the fairness, the solution must lead to the reparation of the commercial
security of African countries with a commercial, and not just financial compensation, according to
the slogan of the developing countries in 1964 in Geneva, "Trade not aid."
\

International Journal of African Development v.3 n.2 Spring 2016 35
References
Abdelmaliki, L. & Sandretto, R. (2011). Politiques commerciales des grandes puissances: La
tentation néoprotectionniste, Ouvertures Economiques, de boeck, 90.
Araujo Bonjean, C., Calipel, S. & Traoré, F. (2006). Impact des aides américaines et européennes
sur le marché international du coton. CERDI.
Baldin, C. (2011). L’impact des subventions agricoles et des technologies de l’agriculture de
précision sur les pays de l’Afrique subsaharienne. Séminaire doctoral, Université de Nice
Sophia-Antipolis, 8-11. Retrived from: http://www.gredeg.cnrs.fr/Seminaire-
doctoral/Fichiers/Sem_Doct_Baldin.pdf
Ben Hammouda, H., Karingi, S., Oulmane, N., Lang, R. & Sadni Jallab, M. (2005). Centre africain
pour les politiques commerciales, L’Acces aux marches peut-il aider l’agriculture
africaine? Travaux n°26, Commission Economique pour l’Afrique, p. 6-8.
http://www.uneca.org/sites/default/files/publications/atpc26.pdf
Carreau, D. & Juillard, P. (2005). Droit international économique, Dalloz, 2ème édition.
Commission Economique pour l’Afrique & Union Africaine (2013). Tirer le plus grand profit des
produits de bases africains : l’industrialisation au service de la croissance, de l’emploi et
de la transformation économique. Rapport Economique sur l’Afrique, p. 139.
Décision sur les mesures concernant les effets négatifs possibles du programme de réforme sur les
pays les moins avancés et les pays en développement importateurs nets de produits
alimentaires. Retrived from: http://www.wto.org/french/docs_f/legal_f/35-dag.pdf
Dufourt, G. (2012). Philippe Vincent, L’omc et les pays en développement, Bruxelles, Larcier,
2010. Revue québécoise de droit international, 25(1).
Eba Nguema, I. & G. Assoumou Ella. (2014). Trade liberalization and food security: For a new
green revolution in Africa. Journal of Food Security, (2)2, 42-50.
http://pubs.sciepub.com/jfs/2/2/1
FAO. (2003). Appui de la FAO aux négociations de l’OMC : Principaux obstacles au commerce
de produits agricoles transformés auxquels doivent faire face les pays en développement.
Note d’information n°2, p.1-2. ftp://ftp.fao.org/docrep/fao/005/y4852f/y4852f01.pdf
FAO. (2004). La situation des marchés de produits de produits agricoles, p. 25.
G/AG/Rev.10, OMC, (22 Mars 2012). Déclaration de Doha, WT/MIN(01)/DEC/1, 20 novembre
2001
Konandeas. (2001). Les négociations commerciales multilatérales sur l'agriculture, Module 10 in
Manuel de Référence - II - L'Accord sur l'Agriculture, FAO.
Madeley. (2006). Le commerce de la faim: La sécurité alimentaire sacrifiée à l’autel du libre-
échange. Enjeux planète.
Note de synthèse, secteur du coton, agritrade, mise à jour. (Octobre 2012). disponible sur Retrived
from: http://agritrade.cta.int/
OCDE et FAO. (2010). Perspectives agricoles de l’OCDE et de la FAO 2010-2019.
OMC. (2003). Les textes juridiques, Résultats des négociations commerciales multilatérales du
cycle de l’Uruguay. Accord sur l’agriculture.

36 http://scholarworks.wmich.edu/ijad/
Oxfam International. (2002). Cultiver la pauvreté: l’impact des subventions américaines au coton
sur l’Afrique. Document de Briefing n°30.
Passerelles (2014). L’Accord sur la facilitation des échanges dans l’impasse. Compte rendu de
l’ICTSD, 5 Aout 2014. http://www.ictsd.org/bridges-
news/passerelles/news/l%E2%80%99accord-sur-la-facilitation-des-%C3%A9changes-
dans-l%E2%80%99impasse
Rainelli, P. (2007). L’agriculture de demain: Gagnants et perdants de la mondialisation. Éditions
du Félin, 140-142.
Raman, M. (2005). OMC et agriculture: Conséquences sur les paysans et les producteurs ruraux
du Sud. Les amis de la terre, 2-12
Stiglitz, J. & Charlton, A. (2005). Pour un commerce mondial plus juste: Comment le commerce
peut promouvoir le développement, Fayard, WT/MIN (05)/DEC, 2005, 121.
Voituriez, T. (2009). Agriculture et développement: impasse à l’OMC. Politique étrangère, p. 288.
Wongkaew, T. (2011). L’accord sur l’agriculture et la sécurité alimentaire durable. Thèse de
doctorat, Université Panthéon Assas, p 18-31.
Zoure, T. (2011). Le régime juridique du commerce des produits agricoles dans le droit de L'OMC.
Thèse de doctorat: Univ. Genève, no. D. 826.

International Journal of African Development v.3 n.2 Spring 2016 37
Collapsing Microfinance Institutions in Ghana:
An Account of How Four Expanded and Imploded in the Ashanti Region
Festival Godwin Boateng, Roskilde University, Denmark
Stephen Nortey, Bank of Ghana
Jonas Asamanin Barnie, Kwame Nkrumah University of Science & Technology, Ghana
Peter Dwumah, Kwame Nkrumah University of Science & Technology, Ghana
Martin Acheampong, University of Duisburg-Essen, Germany
Eunice Ackom-Sampene, Copenhagen Business School, Denmark
Abstract
The study inquired into why microfinance institutions (MFIs) collapsed in the
Ashanti Region of Ghana. The authors found that the problem related primarily to
unduly risky, unethical and illegal practices, mismanagement and disregard of due
diligence, which when convoluted by external factors like macroeconomic
instabilities and panic withdrawals, pushed the risk levels of MFIs beyond the point
of containment. We argue that the 2013 macroeconomic crisis in Ghana only
contributed to the huge number MFIs involved and the pervasiveness of the
collapse – the crisis was not a root cause.
Keywords: microfinance, collapse, Ghana, bankruptcy, MFIs.
In response to rampant collapse and disappearance of MFIs or Susu 1 companies and
financial service providers (as they were then called), the Bank of Ghana moved in to close down
a number of such financial institutions countrywide in 2008 (Belnye, 2011). But the problem will
not go away only to rear its head since 2013 in a continual and more devastating manner. In the
first quarter of 2013, about thirty MFIs collapsed in Ghana due to an alleged inability to “sustain
their operations.”2 Later in the year, additional twenty also became insolvent3. The number keeps
on adding up. Recently, one MFI became bankrupt and swindled over 5000 clients4. Many of the
customers had saved up colossal sums with the MFI.
There is no deposit insurance in Ghana, therefore, when MFIs collapse, customers
irretrievably lose their working capital, savings and their sources of livelihood – their businesses
are likely to collapse, which further predisposes them to indebtedness and consequentially,
1 Susu is a local language which means deposits or savings. 2 MICROCAPITAL BRIEF: Thirty Microfinance Institutions (MFIs) Close in Ghana: http://www.microcapital.org/:
The customers, most of whom had huge deposits with those institutions could not get a refund for the owners could
either not be traced, or where they were traced, they failed to raise the requisite funds to pay the customers 3 http://thebftonline.com/content/bank-ghana-asked-toughen-microfinance-regulation 4Lord Winners Microfinance swindles over 5,000 customers
http://www.ghanaweb.com/GhanaHomePage/NewsArchive/artikel.php?ID=299140

38 http://scholarworks.wmich.edu/ijad/
impoverishment. In this way, instead of reducing poverty, microfinance could create additional
cohort of poor population. Further, the public needs to have confidence in financial institutions to
patronize their services; the collapse of MFIs is therefore a bad press for Ghana’s finance sector.
In a country whose microfinance penetration to the low-income population is as low as 9 percent5,
it is also detrimental for existing MFIs. Therefore, the urgency of the need to investigate why
commercial MFIs collapse in Ghana is extremely important in order to minimize the possibility of
repeating the same errors in the future.
This review also contributes to academic literature on MFIs collapse. Four collapsed MFIs
in the Ashanti Region were selected and studied. Additional information was gathered from the
Other Financial Institutions Supervision Department (OFISD) of the Bank of Ghana and the Ghana
Microfinance Institutions Network (GHAMFIN). The information gathered from the six
institutions through interviews and other medium and from the public, constituted the primary data
for the study. To enhance the comparability potential of the findings, secondary sources of
information on MFIs in Ghana and elsewhere were incorporated in the study. The study is
structured as follows: The next section presents the methodology of the study where we discuss
the tools, techniques and procedures employed in gathering the data for the study as well as the
challenges the study encountered and the limitations of the study. We present the findings in the
third section. In the final section, we discuss the implications of the findings for policy and
conclude the study afterwards.
Primary Data Collection
Initial interviews with Bank of Ghana (BoG) and the GHAMFIN staff
In Ghana, among other functions, the BoG has overall supervisory and regulatory authority
in all matters relating to banking and non-banking financial business including awarding license
of operation to all financial institutions6. In response to its widening supervision and monitoring
duties, in August 2013, the Bank established the Other Financial Institutions Supervision
Department (OFISD) to oversee rural banks, forex bureaus and MFIs. The OFISD was contacted
for the study obviously because of its role in the microfinance sector of Ghana as the regulator. In
the course of discussing the study with two researchers and field officers of the Department, some
others took interest in the subject and joined the discussion. Therefore, it eventually became a
spontaneous focus-group discussion with five staff of the Department. Some days later, the officer
of the Bank assigned to our study emailed us a written response to the questions in an interview
guide we sent them. The researchers later contacted them by phone to clarify grey issues7 that
emerged in our interviews with the former employees of the collapsed MFIs.
5 Of Ghana’s working-age population below the poverty line, only 9 percent have microloans (See
Schicks, 2011) 6 http://www.bog.gov.gh/ 7 For instance, it emerged in the course of the interviews with the former employees of the defunct MFIs that the BoG
has introduced a biometric software, which helps to track and verify the borrowing history of clients to prevent

International Journal of African Development v.3 n.2 Spring 2016 39
In addition to the Bank of Ghana, the Ghana Microfinance Institutions Network
(GHAMFIN) was also contacted. The GHAMFIN is the umbrella network body for MFIs
operating in Ghana. It was formed in 1998 as a company limited by guarantee with the support of
the World Bank because of concerns of some Ghanaian MFIs for the development of best practices
in the delivery of microfinance services (GHAMFIN, 2014). The GHAMFIN seeks to promote the
growth and development of the microfinance industry in Ghana and present a common platform
for the Rural & Community Banks, Savings & Loans Companies, Credit Unions, Financial NGOs,
Microfinance Companies and Microinsurance companies and Susu Collectors. Like the OFISD,
we contacted GHAMFIN because they are also heavily involved in the microfinance sector of
Ghana. At the GHAMFIN, we interviewed Mr. Emmanuel Asante, the Finance & Accounts
Officer. Before coming to GHAMFIN, he was a manager of a MFI in Kumasi, the capital of
Ashanti Region and has been in the sector for more than 3 years, so he was very familiar with the
problem we were examining. We bought some of their published reports, which contained helpful
information but were not available anywhere online. Based on the information gathered from the
Bank of Ghana and the GHAMFIN, we adjusted the interview guide we had prepared for the
employees of the collapsed MFIs.
The accounts of the Bank of Ghana, the regulator and that of the GHAMFIN, the umbrella
network body for MFIs in Ghana, pointed to the Ashanti Region of Ghana, Kumasi (the capital)
in particular, as the hotbed of the problem of collapsing MFIs in Ghana. According to them, even
MFIs that collapse in other regions usually have their headquarters (mother branches) in the
Ashanti Region. The prevalence of the phenomena in the Region and the fact that most collapsed
MFIs in other Regions of Ghana usually have their mother branches in the Ashanti Region, may
mean that, information on collapsed institutions in the Region could offer a useful perspective for
understanding why MFIs collapse in other parts of the country. We therefore decided to
concentrate on the Ashanti Region in selecting collapsed MFIs for the study.
Selection of collapsed MFIs
Identifying the collapsed MFIs was as difficult as getting the former employees themselves
for the interviews. If there were official list of collapsed MFIs in Ghana, this task would have been
easier. It was part of our request to the Bank of Ghana and they agreed to email it with the response
to the interview questions. However, the mail we received did not contain that information so we
contacted them again to find out. The explanation given was that when the MFIs collapse, they do
not take steps to officially file for bankruptcy with the Bank, so there was not any such list. This
placed limitation on knowing the exact number and names of collapsed MFIs in the Region. For
example, all but one of the institutions studied in this work collapsed in 2014 but there is only one
reported case in the media of a collapsed MFI in 20148 and that MFI is not part of those studied
“double-dip” – clients interborrowing from MFIs. But the Bank of Ghana said that the software though helpful, did
not come from them. 8 Ghanaweb – 29 January 2014: Lord Winners Microfinance swindles over 5,000 customers
http://www.ghanaweb.com/GhanaHomePage/NewsArchive/artikel.php?ID=299140

40 http://scholarworks.wmich.edu/ijad/
herein. This means that many MFIs, just like the ones studied in this work, have collapsed
unreported. Even when they are reported, except the case of Lord Winners Microfinance Company
and Westbanc Capital Group9, the names of the specific MFIs involved are not mentioned. For
instance, none of the several media reports on the fifty MFIs that collapsed in 2013 mentioned the
names of the specific MFIs involved.
As a result, we had to rely on the public to identify the collapsed MFIs. In our interaction
with the public, even though several MFIs have collapsed in the Region, seven names kept
recurring. After the collapse of the MFIs, customers who had their deposits with them had been
chasing the former staff for refund of their money. Therefore, the former employees of the
collapsed MFIs had become unwilling to open up to anybody on their former institutions,
suspecting that such people could be disguised customers searching for their whereabouts to
disgrace them. Getting access to them for interviews therefore was very difficult. The larger our
target respondents, the more energy and resources we had to spend in seeking to have access to
them. However, the possibility of losing them altogether was also becoming increasingly real. This
made the researchers to narrow the search to the ‘prominent’ seven. To win their trust, we
contacted people in their networks – close friends and relatives to lead us to them. After a long
period of bonding and persistent calls, out of the seven, we were able to access the four (4) profiled
below10. This means that the study did not cover all collapsed MFIs in the Ashanti Region – indeed,
9 Google Search of collapsed MFIs in Ghana returns the names of only Lord Winners Microfinance Company and
Westbanc Capital Group. The other reports are general and do not mention the specific names of the MFIs
involved.http://www.ghanaweb.com/GhanaHomePage/NewsArchive/artikel.php?ID=299140
http://www.ghanaweb.com/GhanaHomePage/NewsArchive/artikel.php?ID=291198 10 Double Up Microfinance Company Limited began operation in 2009 with four customers and four staff. The
company grew phenomenally in a spate of 5 years. Before folding up in 2014, it had 15 branches, all located in the
Ashanti and Brong Ahafo Regions. Double Up’s crisis started in October\ November 2013. The representative of
Double Up interviewed for the study was a young HND in Accountancy holder from Sunyani Polytechnic who entered
microfinance in 2011 around October/November until 2014 when Double Up collapsed. He is now into hire purchase.
The interviewee started working with Double Up as Operations Manager, later as Credit Officer. He was then
promoted to a Branch Manager and later as Head of Operations and Internal Auditor.
Work Up Microfinance Company Limited also started operation in 2011 with four branches at Agona, Wiamoase,
Mankranso and Fade. In a matter of 4 years (2011-2014), the company grew from four to twenty-six branches. The
products of Work Up included Current Account, Savings Account, Susu Accounts (Anidaso Susu and Normal Susu)
and Investment Accounts (Work Up Trust and Work Up Gold) . It was a sole proprietorship company with limited
liabilities. The interviewee from Work Up as at the time the institution collapsed was a Branch Manager. He started
as a Marketing Officer in 2012, and later became a Marketing Manager at the Branch and Loans Recovery Manager
and promoted to an Accountant and later Operations Manager before becoming a Branch Manager.
Grow Rich Microfinance Company Limited was incorporated as a private limited liability company on July 21,
2010 under the Ghana Companies Code, 1963 (Act 179). Full operations started on 13th September, 2010 at Obuasi,
the head office with four (4) staff – the Manager, Operations Manager and two Client Relationship Officers. Grow
Rich collapsed in the year 2013. As at that time, the company had three (3) branches. The interviewee for this study
was working with the institution as a marketer. In their credit operations, Grow Rich focused on lending to very small
and medium-sized enterprises with the conviction that these businesses create the largest number of jobs and make
vital contributions to the economies in which they operate. The interviewee from Grow Rich is currently working with
a Susu and loans company and he interlaced his submissions with his new experiences – comparing his new place to
his former institution in explaining why it collapsed. However, he asked that his current institution’s name not be
disclosed because he did not have his superiors’ permission to divulge information about the institution.

International Journal of African Development v.3 n.2 Spring 2016 41
officially, the total number of collapsed MFIs in the Region is unknown. The four collapsed MFIs
were the only ones selected and studied because they were the only ones that granted access.
Interview with the former employees of the collapsed MFIs
The use of interviews was appropriate for the study for its nature demanded it to be situated
in the practical experiences of the stakeholders. As noted by Kvale et al, interview helps
researchers to elicit insights into the subjects lived world (Kvale et al, 2009). Thus, interviews help
to gather rich, deep and original information on the subject under investigation. During
interviewing, the interviewer could probe responses and this helps to elicit further information.
The interviews were one-to-one. Although there was a guide to help us focus on the relevant
questions, the exchange was conversational. The interviewees requested that their identities and
that of their institutions be kept confidential11. The names given to the collapsed MFIs are therefore
pseudonyms. The tape-recorded interviews were later transcribed with the aid of Express Scribe
Transcription Software. The transcripts of the five interviews, the focus group discussion with the
staff of the Bank of Ghana and the Bank’s written response to the interview guide we sent them
constituted the main primary data for the study. When the interview transcripts are quoted in the
analysis of the findings or anywhere as GHAMFIN (2015); BoG (2015); Dream Well (2015);
Grow Rich (2015); Work Up (2015) and Double Up (2015), the referred page numbers are the
ones in the transcripts.
Data collection problems and limitations of the study
Aside the challenges faced in accessing the respondents, there were other practical
challenges and limitations that are worth acknowledging. First, the study was such that it was
difficult to communicate its object to the former employees of the collapsed MFIs. It is naturally
uneasy to be seated and ‘drilled’ (so to speak) on how an enterprise you were part of demised. We
had to communicate the study to them in a more polite manner. However, this task worsened in
the course of the interviews when critically incisive and seemingly personal questions had to be
asked. We therefore felt smooth– talking them to be part of the study. The task of balancing our
quest for knowledge with our ethical need to be open, transparent and honest with the interviewees
was very uneasy.
Another challenge to this study is what constitutes a collapsed or bankrupt MFI. Whilst the
news about collapsed MFIs is public knowledge, there is no official document or record on them.
The reason as discussed elsewhere is that when the MFIs collapse, they do not take the legal steps
Dream Well Microfinance Company Limited – The Company was licensed by the Bank of Ghana and started to
operate on 2nd January, 2013 with 19 staff and one branch at Atonsu with a capital of hundred and twenty thousand
Ghana Cedis (GH 120, 000.00). The shareholders were the CEO and his wife. The man had 80% and the wife 20%
shares. Dream Well collapsed barely a year in business. Within 8 months of operation, the company established four
branches. The respondent from Dream Well interviewed for this study was the Human Resource Manager who doubled
as the Operations Manager. He holds a Bachelor of Arts degree in Publishing Studies. 11 As indicated elsewhere, after the collapse of their institutions, customers who had their deposits with them have
been chasing them for refund of their money. Hence, their unwillingness to open up to anybody on their former
institutions and the reason for their request that, their identities and that of their institutions not be disclosed.

42 http://scholarworks.wmich.edu/ijad/
to file for bankruptcy with the Bank of Ghana. Therefore, the term collapsed or bankrupt MFI is
used in this study to loosely imply that the MFI is not operating anymore.
Finally, the findings of this study is consistent with the general causal factors of the collapse
of MFIs in Ghana noted by institutions like the Bank of Ghana, GHAMFIN, Ghana Association
of Microfinance Companies (GAMC) and other scholarly studies. While some level of
comparability cannot be denied, a small sample size of four collapsed MFIs in one region may
limit efforts at generalization. A larger sample may be needed for such purpose. The above
notwithstanding, the study offers an exploratory reference or benchmark for examining what drives
commercial MFIs into bankruptcy in Ghana.
Findings: Causes of MFIs collapse in the Ashanti Region
This section analyses the information gathered on the drivers of MFIs into bankruptcy in
the Ashanti Region of Ghana. The factors that caused the demise of the four MFIs studied were
similar. Therefore, instead of case-by-case analysis, we did a composite analysis of the four cases.
However, strikingly dissimilar factors and events are highlighted. The factors are grouped into
internal and external factors. The analysis was done by reflecting on the primary data in the light
of the literature on MFIs operations in Ghana as well as the broader literature on the collapse of
Table of Findings
Causes of MFIs collapse in the Ashanti Region
Source: Authors’ fieldwork.
Cause of Collapse Microfinance Institutions (MFIs)
Internal Factors
Unsustainable Returns
Disregard of due diligence
Mismanagement
Violation of Bank of
Ghana Rules & Guidelines
External Factors
Macroeconomic
Instability
Collapse Rumour
Grow
Rich
Work Up Double
Up
Dream
Well

International Journal of African Development v.3 n.2 Spring 2016 43
MFIs worldwide. In this way, whilst contextualizing the Ashanti case, we are still able to
understand it in reference to the larger discourse in Ghana and elsewhere. The section is sub-
divided into three sections: In the first sub-section, we present our table of findings depicting the
causes of the collapse of the MFIs studied and analyze them as internal and external causes
(factors) of the collapse in the second sub-section. In the final sub-section, we condense all the
factors (internal and external) into an explanatory framework of drivers of commercial MFIs into
bankruptcy in the Ashanti Region of Ghana.
As depicted in the table, similar factors accounted for the collapse of the four MFIs studied.
But while the causal factors were similar, the narratives on how they manifested varied from one
institution to the other. In the subsequent sub-section where we do a detailed analysis of them, we
refer to the interview transcripts for the rich details on how different events culminated into these
factors to cause the collapse of the MFIs.
Analysis of Findings
Internal factors
The internal factors relate to the operation strategies and managerial problems of the MFIs
that contributed to their collapse. We in seriatim analyze them under these headings: Indiscriminate
branching, offering of unsustainable returns/products to customers, disregard of due diligence,
mismanagement and violation of the Bank of Ghana’s rules and guidelines.
Internal factor 1: Indiscriminate branching. Microfinance supporters justify the
flogging of high interest rates by MFIs on grounds that they are more prone to risk – they do not
only have high operational cost, they also deal with the part of the population known to be highly
risky12. The problem however is that in spite of the already risky profile and high cost of operation
associated with microfinance, most MFIs rather pursue activities, which further increase cost
instead of keeping it under control. The most common of such practices in Ghana is branching.
As noted by Ayeh (2015), some MFIs have adopted physical branch establishment to expand
outreach and increase their share of the market. However, “unknown to them, opening branches
mean[s] more expenses on utility, salaries and other overhead expenses” (Owusu-Nuamah, 2014).
They wrongly perceive “visibility as viability” (BoG, 2015: 3).
Our findings collaborate the view that the phenomenon of branching is common among
MFIs in Ghana. Except Grow Rich, which maintained three branches for three years (2010 – 2013),
the branch expansion of the other collapsed MFIs was stratospheric. Within a short period of five
years (2009 – 2014), Double Up opened 15 branches, whilst Work Up grew from four (4) branches
to twenty-six branches in a matter of 4 years (2011-2014).
Dream Well survived for only eight months but managed to open four branches. The
interviewees confirmed that unbridled branching crucially contributed to the collapse of their
12 They contend that they deal with clients with low level of education; involved in enterprises that are risky; live in areas that are known to have poor sanitation and therefore have high incidence of diseases; have no or little access to health care facilities and do not have reliable income (see Rhyne, 2010; Rosenberg, Gonzalez & Narain, 2009). 6 The 2013 revised-Bank of Ghana rules say that MFIs with 1 – 5 branches shall attract an additional paid-up capital of GH200, 000 for each branch

44 http://scholarworks.wmich.edu/ijad/
former institutions. Of course, once MFIs are in competition with one another, proximity to
customers and visibility could be a competitive step to increasing outreach and market share.
However, unrestrained branching could have a toll on the company. First, opening additional
branches means additional cost and here not only in terms of among other things, new office
furnishes and staff, but also additional paid-up capital6. Second, it takes time for an MFI to become
financially viable so new branches certainly will in the short term experience loses – having too
many new branches will therefore translate into incurring even more additional cost and this was
true of the collapsed MFIs studied.
For instance, in the case of Dream Well, while their Atonsu head office was making
expenditure around seven thousand six hundred Ghana Cedis (GH7, 600) a month, the income was
only two to three thousand. The other branches too were making expenditures around GH 5000
and income around GH 1500 and GH 2000 (Dream Well, 2015). The benefits in opening new
branches, which includes geographical diversification of portfolios, and widening of deposits
therefore lost on them.
As observed by Ayeh (2015), the new capital investments in branching do not only add to
the cost profile but also compete with available funds for on-lending purposes. And since loans
and advances are the main sources of income for MFIs, growing more loses or not having the
needed funds to grow quality loans will mean that the company cannot generate enough income to
support its operations. How Dream well collapsed aptly reflects this: “Our main income was the
interest we charged on loans. It got to a time; we had no money to give out as loans because we
had invested them in creating branches” (Dream Well, 2015: 2).
Internal factor 2: Unsustainable returns to customers. This problem relates directly to
the increased number of MFIs sequel to the financial liberalization and commercialization of
microfinance in Ghana (Serrano & Sackey, 2015; Gallardo, 2001). Certainly, once many players
are in competition for a given market share, they are bound to work at outpacing one another. And
here, the eagerness to attract more customers and carve lion shares of an already saturated market
on the part of each MFI tended them to collectively roll-out products that will endear more clients
to them. However, the downside was that most of the products were unsustainable. As noted by
Owusu-Nuamah (2014), some of these products were too costly to the companies; their income
streams could not cover the expenses they were incurring in the form of interest paid to clients.
Whilst some MFIs were paying 30 to 35% interests on deposits (far in excess of the 24%
interest even the Government pays on treasury bills), others were tripling three months-deposits as
loans for customers. Some MFIs were also charging zero fees on deposits, while others shared
cloths and cement to customers for opening accounts with them. All the interviewees
independently confirmed that their institutions did one or more of those things to win customers.
The challenge they subsequently came to face was sustainability. The only investments known to
them13 were treasury bills, real estate and buying fixed assets like lands, cars and of course,
13 Some of them did not even invest the money; they were lying idle. For instance the interviewee from Dream Well
said that they just sent their money to their mother bank, Fidelity Bank without investing it and were surviving on

International Journal of African Development v.3 n.2 Spring 2016 45
creating branches and since these kinds of investments were illiquid, they could not fall on them
when they became pressed. Moreover, the returns on the investments were not high enough for
them to be able to sustain the huge interests they were paying to customers. As the Work Up
interviewee admitted, “in the long run it became a virus because you will pay more interest” (Work
Up, 2015: 2).
The MFIs inability to continually triple deposits as loans and pay the huge interests
promised on deposits infuriated most customers who in turn in their numbers closed their accounts
with them. This together with other factors accounted for the collapse of Work Up and Dream
Well. However, as noted by Dupont (2005), financial institutions misfortunes could be contagious.
The repercussions of offering unsustainable packages do not run down only the vogue MFIs
offering them but could even transcend to others who may be giving reasonable interests. The
point here is that the different customers of the competing MFIs compare and share their
experiences with one another – they are friends, family members, they operate similar businesses,
so this is expected. Some customers upon hearing the gargantuan interests and mouth-watering
packages their friends were receiving felt short-changed, and therefore beseeched their MFIs for
similar packages with threats of moving their accounts from them. Double Up suffered this fate:
“You will see a MFI operating at high interest rates just to attract customers while charging low
interest on loans. In our case, our customers were complaining that other MFIs were giving high
interest so they moved their accounts from us to them the moment they heard, if I go there I will
get better packages. This really affected us” (Double Up, 2015: 3).
However, those MFIs whose customer base phenomenally increased because of this could
also not sustain the packages, so all the MFIs together lost the trust of the customers who were
already battered by economic hardships. This led to deposit losses and increment in withdrawals.
Internal factor 3: Disregard of due diligence. Commercialization has brought increased
competition for the business of low-income clients (Robinson, 2001) evidenced by the slew of
MFIs established worldwide. This has make abundant availability of ‘cheap’ credit to clients.
Increased competition among MFIs and clients’ unbridled access to a multitude of microfinance
providers as noted by Andersen (2009), remove the deterrence of strategic default that a
monopolistic MFI enjoys and cause decline in portfolio qualities. Insisting on due diligence which
generally is a bit time consuming then becomes disadvantageous to ethical MFIs for clients
disturbed or delayed by due diligent procedures could easily access loans from competitors without
or with little hassle. Borrowers could thus resort to “double-dip” and consequently become inter-
indebted (over-indebted) to almost all operating MFIs by borrowing from one MFI to settle loans
contracted from the other and vice versa.
This phenomenon treaded through the interviews with the former employees of the
collapsed MFIs confirming an earlier finding of Grammling, (2009) and Kappel et al., (2010)
studies that over-indebtedness and “double dip” is common among microfinance clients in Ghana.
This is what the customers do as aptly described by the interviewee from Double Up:
only interest on loans and some other minor charges on book purchases like new passbooks and also minimum
balances.

46 http://scholarworks.wmich.edu/ijad/
What happened is, ours, as we say, you will deposit and we will base on your
deposit give a loan. Since the customer wants the loan, he would be working with
a different MFI, and will be doing small small Susu [deposits] there, get about
five hundred over there, take a loan of thousand from there, come and deposit
that thousand with you, get about three thousand loan from you, go and deposit
it in a different bank and take about ten thousand loan from them (Double Up,
2015: 7).
Similar practices in Nicaragua led a kite-maker in Jalapa to accumulate a record debt of
$600,000 to 19 MFIs14. How this is able to happen is not magical. The competing MFIs have no
means of verifying the debt profiles of prospective clients from competitors and do not control the
loan disbursements of their competitors. Therefore, the clients are able to play them against one
another as noted in Andersen (2009).
Most MFIs in Ghana lost significant share of their operating capital through this. While the
problem reflects customers playing the competing MFIs against one another, materially, the root
cause is the MFIs own methods of recruiting clients. In Ghana, as noted in Owusu-Nuamah (2014),
the popular method of recruiting clients is this: The MFIs ask clients to contribute for a month or
two for them to double or triple their balances for them as loans. This downplays the significance
of proper assessment and monitoring of loans. Loan officer to client ratio surely would widen for
the package as it did was certainly going to endear more customers to the MFIs. The MFIs therefore
could not have enough time to look at loans that were defaulting because of the huge number of
clients involved and also because they were always busily serving incoming clients until the loans
hit the expiry region – by then, it becomes extremely difficult to recover. The clients identified
this loophole and played the companies by robbing Peter to pay Paul.
Internal factor 4: Mismanagement. Effective risk management is crucial to achieving
institutional self-sustainability in the microfinance sector9. However, among microfinance
practitioners, reckless expenditure, poor risk management and mitigation have been widely noted
(CSFI, 2008; 2009; 2010; 2012; 2014). The literature on the operations of MFIs have noted bad
managerial practices as one major cause of MFIs failures globally (Sinclair, 2012; Bateman, 2013;
2010; CSFI, 2008) and this is also true of the case in Ghana.
For instance, Grow Rich was disbursing loans to customers about whom they had measly
information and there was no requirement for a guarantor. Therefore, a significant number of their
14 The “no pago” (we won’t pay) crisis happened 2009/2010 in Nicaragua. The MFIs lent at high interest rates indiscriminately to borrowers who also inter-borrowed. Borrowers were taking money from MFIs to settle loans contracted from their competitors. This continued until the borrowers became incapable of paying back the loans. So the borrowers collectively defaulted on their debts and the MFIs suffered a profound crisis. (See a detailed account in Sinclair (2012) and also: https://nacla.org/news/no-pago-confrontsmicrofinance-nicaragua ) 9 The commercialization of microfinance came along with competition for both funding and clients. To successfully operate a MFI, inter alia, effective management of cost structures to ensure sufficient returns to pay for the more expensive commercial funds is a prerequisite. MFIs operators must effectively manage risks and do cost control before they could achieve institutional financial viability and self-sustainability. The rapidly expanding loan portfolios and increased scope of operation of MFIs also substantially increase the risks in providing microfinance services. This requires MFIs operators to be cautious and undertake economically sound ventures (see Andersen, 2009).

International Journal of African Development v.3 n.2 Spring 2016 47
customers bolted away with their money while some used loans from them to pay other loans
contracted from their competitors. The case of Work Up was terribly bad. Astonishingly, the
company was virtually dishing out money to any person who cared to apply for loan. The
interviewee from the institution thus submitted: “When you come to us, we were having money,
so we were not thinking about may be your guarantor, knowing your capacity that you can pay”
(Work Up, 2015: 1) and they shockingly had a “Credit Committee” superintending over this
practice! How do you give money out without thinking of the person’s capacity to repay? Clearly,
as noted in the industry’s 2012 report, “the flood of money pouring into the microfinance sector is
stirring up irrational exuberance and undermining discipline” (CSFI, 2012: 28).
Other profoundly bad managerial practices the study uncovered are poor risk management
and reckless expenditure, so by the time operationally relevant software like the one for clients’
debt history verification15 came, they (Dream Well and Double Up) were broke and could not
procure them. Instead of investing in current assets, they rather focused on fixed assets – buying
and furnishing big buildings for offices, buying cars, and other landed properties, forgetting that
the monies necessarily were not theirs but people’s deposits. A study conducted by the Ghana
Association of Microfinance Companies (GAMC) found that most MFIs operators fail to apply
financial intermediation principles.16
The other factors relate to blatantly poor clients’ recruitment strategies. One of the
interviewees submitted: “if we come to market ourselves to you and you say, oh go and come
tomorrow when you come tomorrow I will pay, we will make sure that we come tomorrow. We
were not thinking about how costly you are to us. We were thinking we like your money, your
GH2 Cedis. If we spend GH10 Cedis today on you, tomorrow we will get more than that” (Work
Up, 2015: 1). As if fortiori, spending huge resources to recruit clients’ flourishes their businesses
so they could pay off the investments sank into recruiting them.
Ludicrously, the MFIs owners’ were nonchalant to clearly imminent risks. As stated by the
interviewee from Work Up: “at the top management, sometimes you being on the ground, you will
see something and you would recommend something and they would say nothing will happen. But
you are on the ground. You will just report to them but they will sit there and watch it.” (Work Up,
2015: 2). We inquired further: “Is it not incredible that someone would put money in such a big
business, those on the field will raise issues and report to them and they will disregard it. What
was the motivation?” His response: “what they were very much interested [in] was the deposits –
the money [that was] coming in. They were so bold enough [to say] that nothing will happen. They
are too big to fail.” This finding collaborates that of Owusu-Nuamah (2014) that, one reason for
the collapse of MFIs in Ghana is that the owners do not heed to technical warnings and advice
from professionals.
15 The enormity of the problem of client inter/over borrowing from the MFIs has led to the introduction of a biometric
software, which reveals the debt history when the fingerprints of potential loan applicants are taken. 16 Ghana: Storm in Ghana’s microfinance industry not over - http://microfinanceafrica.net/news/ghana-storm-in-
ghanasmicrofinance-industry-not-over/

48 http://scholarworks.wmich.edu/ijad/
Dream Well Microfinance Company deserves a special mention here for it had all the
trappings of a badly managed company. That, the company could collapse just eight months of
commencing business is enough testament to show how badly it was managed. Bemoaning on why
they collapsed, the former Human Resource and Operations Manager who himself holds a degree
in Publishing Studies stated that, from the top hierarchy to the last man at the bottom of
management, none of them had well-grounded experience in banking nor microfinance. They were
only receiving summary lectures from some consultants “once in a while”. He thus submitted:
In our case, you can’t find anyone who had worked with microfinance for long,
say 3 or 4 years nor any experienced banker manning the institution. We were
meeting these people once in a while and they gave us summary lectures for two
or three hours on how to operate an MFI. We only had 2 or 3 weeks training
which in my view was not enough. We had educated workers with HND as
minimum qualification but we all had no stint with banking nor microfinance
before coming to Dream Well (Dream Well, 2015: 2).
No wonder they could uncover the fraudulent deals some workers perpetrated against the
company only after collapsing. Related to this is what the interviewee from Double Up said that
in their case, they found a lot of endorsed withdrawals and loans authorized by some of their
managers who would not have endorsed them, had they the needed technical competence. As it
turned out, Double Up recruitment was not merit based but on familial relations, giving credence
to the Bank of Ghana’s claim that most MFIs do not employ qualified personnel to manage their
operations (BoG, 2015).
Generally, MFIs unlike established banks, the argument goes, are not manned by qualified
staff (CSFI, 2008; 2009; 2012). The observation is that this problem is however acute in Africa
and Sub Saharan Africa in particular, (CGAP & MIX, 2009) but also in other parts of the world –
where well-educated staff at middle management level is difficult to come by and vulnerable to
poaching from commercial banks (CSFI, 2009). As stated by one investment officer with the IFC
in South Africa, there are “not enough good managers in [the microfinance] market” (CSFI, 2008:
15). The case of Ghana is not different. The Bank of Ghana has consistently complained about the
competence of managers of MFIs in Ghana17. It is however profoundly ironic that after all the huge
financial resources trickling into microfinance, the sector would keep on having difficulties in
attracting and retaining talents.
17 Dr Yaw Gyima-Larbi, head of microfinance at the Bank of Ghana stated the pervasiveness of “liquidity crisesis in Ghana is as a result of among other factors “incompetent staff” managing MFIs: http://www.microcapital.org/microcapital-brief-bank-of-ghanabog-to-raise-minimum-capital-requirements-for-microfinance-institutions-mfis-to-240k/ . This was reiterated in their written response to me. The GHAMFIN representative also bemoaned on this in my interview with him. Employees of MFIs are mostly HND Holders and Senior Secondary School leavers. It is costly for MFIs to hire degree holders but he noted also that increasing level of unemployment has led to the entering of microfinance by degree holders, he said.

International Journal of African Development v.3 n.2 Spring 2016 49
Internal factor 5: Violation of Bank of Ghana rules and guidelines. In 2011, the Bank
of Ghana (BoG) undertook to bring MFIs under a uniform regulatory framework (revised in
2013) 18 by establishing a four-tier classification of MFIs and their respective registration
requirements as well as permissible activities. The guidelines also contain unambiguous rules, and
procedures for establishing a MFI, opening new branches, loan disbursement and deposit taking.
It clearly emerges that the collapse of MFIs in Ghana is also chiefly associated with violations of
the BoG rules. As argued by one of the BoG’s field officers, almost 85% of the collapsed MFIs
violated the law. This was collaborated by the interviewee from Double Up: “We the MFIs were
not following the regulations. That brought the collapse” (Double Up, 2015: 6). Here, we
demonstrate how the causes of the MFIs collapse were primarily violations of the BoG guidelines
by examining some of the causes of the collapse that were also violations of the Bank of Ghana’s
guidelines or rules and regulations.
First, in the case of Work Up, their major problem was unrestrained branching. As one of
their competitors stated in a conversation with us, it was imaginably impossible for Work Up to
do the kind of branch expansions they did without eating into the customers’ deposits. The former
Branch Manager of the institution would eventually confirm this when we interviewed him. We
inquired whether they also had problem with using depositors’ funds to establish branches and he
responded: “Yes, considering 26 branches in 4 years” (Work Up, 2015: 3). The company in
contravention of the BoG’s requirement of them to raise additional paid-up capital of GH 200, 000
for each new branch, rather used customers’ deposits to buy magnificent buildings as branch
offices. They instead of using their own capital used their liabilities. So when the panic about
collapsing MFIs in Kumasi engulfed the public, as the interviewee said himself, although they
were strong, once the depositors’ funds were not readily available for them to withdraw (because
they had been invested in creating branches), further weight was added to the speculation that they
were in fact crumbling. The company was certainly not going to survive when the customers
rushed to their different branches for their monies. Work Up was also giving huge loans which
were not only in excess of the margin their being a MFI allowed them to give, but also which in
the words of the former Branch Manager, were huge enough for even established commercial
banks like the Ghana Commercial Bank, United Bank of Africa and even Barclays to give to single
borrowers.
In respect of Grow Rich, among other factors, the company collapsed because they
disbursed loans to customers who owed other MFIs. In our conversation, the former Marketer of
the company said that Grow Rich was sandwiched by more than four MFIs. (Those MFIs were
operating before their Suame Branch –the name of the branch he was stationed was opened). At
the beginning of their operations, they poached some customers, registered them and took deposits
from them who also later came to them for loans. Apparently, most of these customers were already
doing business with their competitors and had taken loans, which were due for repayment.
18 2011 Regulation is Appendix 2, Revision in 2013 is
Appendix 3. See: ttp://rudar.ruc.dk/handle/1800/23859

50 http://scholarworks.wmich.edu/ijad/
Therefore, Grow Rich’s proposal to give them loans when they deposit money with them was a
timely blessing.
The only way Grow Rich could have known this was if it had the biometric software that
helps to check potential loan applicants’ debt history with their competitors. But the software could
be used by only MFIs duly licensed to operate by the Bank of Ghana. However, as it turned out,
the company was operating illegally without license so they ended up giving other people’s
deposits (because that branch was opened with mainly depositors’ funds) to customers who owed
other MFIs only for some to default, others to delay repayment until a long time. They had
problems servicing the withdrawal demands of the customers of their earlier established branches
and collapsed eventually. Schicks prophecy that “if [clients] over-indebtedness were left to spread
[in Ghana], it would represent a serious risk on …. the financial sustainability of MFIs” (Schicks,
2011:1) could not have been fulfilled in any way better.
The case of Dream Well was not different from Work Up. They in contravention of the
BoG rules and guidelines used depositors’ funds to establish four branches in eight months.
Although the BoG rules state that “not more than 25% of initial paid-up or additional capital for
branches shall be spent on property, plant and equipment (capital expenditure)”19, Dream Well
was establishing branches at a cost equivalent to their total paid-up capital of hundred and twenty
thousand Ghana Cedis. Rather than sticking to the rule of not giving unsecured loans exceeding
5% of their paid-up capital, the company was giving colossal sums to the tune of twenty and thirty
thousand Ghana Cedis as loans, which were 24% and 36% of their stated capital, far in excess of
the allowed 5%. As the interviewee from the company cried albeit belatedly, “we thought that
would give us huge returns but repayment became problematic” (Dream Well, 2015: 2).
Finally, Double Up Microfinance Company just like the others, also honoured the BoG’s
rules mainly in the breach. The interviewee would thus yield when we pushed him on violating
the Bank’s rules and regulations:
Okay some of them [the problems] were managerial issues. We should have
known that our stated capital is this and do not give loans in excess of our stated
capital. And we were not following the BoG [Bank of Ghana] rules. They have
stated that we should not give a single customer more than 5% of our stated
capital. But we did. Our company did. Most of the companies too. Our stated
capital was hundred thousand that is one billion old Ghana Cedis but we were
giving a single client about GH10, 000, which is 10% of our stated capital
(Double Up, 2015: 3).
He would later complain that “as at now we have a customer who owes us about fifty
thousand [Ghana Cedis]. It could have taken care of about three branches. If during the crisis, we
had just 50% of that single customer’s loan, we could have been able to solve our problem”. So
we asked, “alternatively, had you not advanced that loan, you could have had the money to settle
19 See Appendix 3

International Journal of African Development v.3 n.2 Spring 2016 51
your problems” to which he responded “yes, but we overlooked the policy, the BoG rules and
regulations” (Double Up, 2015: 4).
Another major challenge Double Up had which relates to violation of the guidelines
pertained to deposits. The BoG rules explicitly state: “the amount of a deposit transaction,
including the balance on a deposit account at any time shall not exceed 5% of the institution’s
paid-up capital”. Stated differently, the MFIs shall not take deposits that are 5% in excess of their
stated capital. Yet, the company overlooked the guidelines and took deposits to the tune of eight,
twelve and fifteen thousand Ghana Cedis respectively, which were 10%, 14% and 18% of their
stated capital of one hundred and twenty thousand Ghana Cedis.
The reason the Bank of Ghana proscribes MFIs from taking huge deposits which are 5%
in excess of MFIs’ stated capital is to prevent a situation where they would not readily have money
to timely serve customers because a huge depositor made a big withdrawal. That was precisely
how the collapse of Double Up began. They experienced huge impromptu withdrawals by their
big depositors at some of their branches, which made them delay unduly, the withdrawal requests
of some of their customers since they had to call for cash from their mother bank, which also
delayed. Some customers who became frustrated after waiting for a long time left for their houses,
only for them to go and speculate to their friends that the company was collapsing for most people
could not get their money, as others had to wait for a very long time. So the next day, fueled by
some falsehood that the company was collapsing which was peddled by two bitter employees
dismissed for fraud, more than a double of the previous day’s number of customers beseeched the
MFI, demanding to withdraw their monies. And as the interviewee explained “because you have
made provisions not for the doubled number, you can’t satisfy the new batch, so they also [did]
spread the news, then the speculations continued and the panic too continued” (Double Up, 2015:
1). The radio stations picked it up, heightening the speculation, so people rushed to their different
branches to cash their monies. As the GHAMFIN interviewee submitted, “even [for] commercial
banks, Barclays or Stanbic Bank, if 50% of its customers jump into the bank and withdraw their
money, the bank would collapse” (GHAMFIN, 2015: 3). So, Double Up eventually collapsed.
The additional challenge to this problem of violation of the rules and guidelines on
microfinance is that the huge number of microfinance institutions affects the ability of the
oversight body– the Bank of Ghana– to efficiently regulate the sector.20 This explains why the
MFIs could break so many of the rules and operation guidelines in respect of for instance,
branching and operating without license, and why Ponzi schemes could survive for a long time
until customers are defrauded. The MFIs umbrella associations could have been useful in this
regard. However, as noted by the GHAMFIN interviewee, the absence of legal backing for the
umbrella associations to sanction limits their ability to effectively peer-regulate their members
alongside the Bank of Ghana.
20 Microfinance companies back licence-freeze:
http://www.ghanaweb.com/GhanaHomePage/business/artikel.php?ID=327983

52 http://scholarworks.wmich.edu/ijad/
External factors
External factor 1: Macroeconomic instability. The aftermath of the global economic
crisis has led to the revision of the hitherto claim that MFIs operate in a market that depends more
on microeconomic conditions than macro fluctuations. MFIs as the narratives were, inhabit their
own business world21 . Observers as well as practitioners have been rudely awakened to the
realization that after all, MFIs are not insulated from the shocks in the ‘real economy’ – there are
too many links through financial markets, credit conditions and the fortunes of their customers
(CGAP & MIX, 2009; CSFI, 2009; 2010). The “experience of 2009-10 has shown microfinance
to be a lot more susceptible to macro-economic shifts than previously thought” (CSFI, 2012: 38).
The operations of MFIs are thus subject to broader macroeconomic trends.
Collapsing MFIs or Susu companies and financial service providers, (as they were then
called), is not a recent development in Ghana. Belnye (2011) catalogues some instances of MFIs
collapse, which occurred as far back as 2008. That of 2013 became headline news because they
were not only widespread but also continual and the development is even yet to abate. The
widespread collapse of MFIs in Ghana since 2013 contemporaneously happened with a serious
economic crisis in Ghana for it to be sheer coincidence. It therefore was not surprising that
macroeconomic factors prominently featured among the interviewees as a major cause of the
collapse of their MFIs.
Ghana in 2013 tumbled – all the macroeconomic fundamentals plummeted. With an
election to win in the year before, the government commissioned a budget deficit of GH¢8.7 billion
($2billion) amounting to 12.0% of GDP and this would further cripple all the sectors of the
economy. Growth decelerated to 4.4%, considerably lower than the growth of 7.9% achieved in
2012 (AfDB, OECD, UNDP, 2014). The country’s currency, the Cedi depreciated throughout
2013, becoming West Africa’s worst performing currency according to Bloomberg22. Lending rate
hovered around 30%. In trying to reign in the fiscal deficit, the government imposed new taxes,
increased the thresholds of existing ones and increased utility tariffs, and petroleum prices. The
combined effect of all these were heightened economic hardship and increased cost of doing
business and borrowing which was further convoluted by energy crisis. The MFIs received their
fair share of the economic miasma.
Acknowledging the paths by which macroeconomic trends affect MFIs, the Microfinance
Banana Skins publications noted that it could be directly through interest rates, and general
business conditions and indirectly, through clients who have been hit by economic difficulty or
retreat from buying financial services (see CGAP & MIX, 2009; CSFI, 2009; 2010; 2014). Both
21 Marcelino San Miguel, president of Fundacion San Miguel Arcangel in the Dominican Republic, is quoted at page
30 of the 2008 Banana Skins Publication as saying: “In the medium and long terms, MFIs operate in a market that
depends more on microeconomic conditions than macro fluctuations, though macro trends affect everything ... But I
do not believe that this determines the survival and operational management of a successful MFI.” 22 Ghana’s Cedi Falls to 8-Month Low as Budget Gap Concerns Mount:
http://www.bloomberg.com/news/articles/2015-05-07/ghanas-cedi-falls-to-8-month-low-as-budget-gap-concerns-
mount

International Journal of African Development v.3 n.2 Spring 2016 53
situations occurred simultaneously and contributed to the collapse of MFIs in Ghana. As submitted
by the GHAMFIN interviewee,
The economy did not help in the first place. The Cedi-Dollar issue. The whole
idea of investments - when Government was borrowing from the banks and the
MFIs were also borrowing from the banks. The Banks will give the money to the
government. Because the Treasury bill went up, the banks were not giving the
money to the MFIs again. The last 2013\2014, it was a huge issue. Microfinance
really suffered. Genuine people had their business collapsed. Not because they
were rogues. Some of them did not embezzle the money. Some have gone to
people as loans, some into real estates and it takes time to mature and the people
[customers], they need their money, they do not have time to wait. Had the MFIs
have support from the banks; they could have waited for the investments to
mature (GHAMFIN, 2015: 4).
Thus, not only did the continuous depreciation of the Cedi and high cost of lending crippled
the MFIs, but also the Government crowded them out of the lending market. Except the Grow Rich
interviewee, all the former employees of the collapsed MFIs said that their banks failed them when
they turned to them for help. The interviewee from Work Up lamented: “They failed us. We were
having a mother bank but they failed us. If they had supported us, but they failed us” (Work Up,
2015: 3). The former employee of Double Up shared similar sentiments: “In our case we did not
even wait for the crisis, we saw it coming, so we applied to one of our banks. They approved to
grant us the loan. We gave them the needed collateral and everything they wanted and even paid
the commitment fee. They later wrote to us that they are not ready to give us the loan” (Double
Up, 2015: 2).
Of course, lending to Government through lucrative treasury bills with ever skyrocketing
interest is more rewarding and less risky than to MFIs who are on the verge of collapse. In the heat
of the economic crisis, one surest way the MFIs could have sustained their operations was, they
like the commercial banks could have also invested the depositors’ money in the then lucrative
treasury bills. However, the little they had in their coffers after investing in creating branches did
not stay with them for long. The customers who were being battered by the economic hardships
were not making deposits again, they rather were withdrawing their savings to support family life.
The former Human Resource and Operations Manager of Dream Well thus stated: “People had
saved with us. But because of economic hardship, they were just making withdrawals” (Dream
Well, 2015: 3).
External factor 2: ‘Collapse rumours’ leading to panic withdrawals. When people
become concerned about risk to their savings, their first reaction generally is to withdraw their
money23. Panic withdrawal poignantly featured among the reasons stated by the interviewees as
the causes of the collapse of their former institutions. Sequence of events heightened rumours and
public speculation about the MFIs looming collapse, which then incited depositors to not only rush
23 See Carlson, (2005) and Calomiris & Gorton, (1991) for a review of theories on bank panics.

54 http://scholarworks.wmich.edu/ijad/
to withdraw their funds but also, discontinue making deposits. Whilst this experience was
commonly experienced by the collapsed MFIs, the underpinnings were different.
It is trite learning in banking that if individual depositors or investors become worried about
the health of financial institutions entrusted with their money, their attempts to protect their savings
by withdrawing them can force otherwise healthy institutions into liquidation, and so can spread
the impact of a shock to other institutions (Pettis, 2003; Dupont, 2005). Such cases lead to scramble
among investors and depositors to withdraw their money not only from the institutions at the center
of the crisis, but also from any institution caught up in the rumours. As argued by Dupont
“contagion can occur as bank depositors reassess the viability of other banks when they observe
either suspension or bank runs at a nearby bank. One failure, or the possibility of failure at one
institution, may be thought to reveal information about other potential failures even if no actual
link exists between the two institutions (Dupont, 2005: 416).
The manner in which Work Up Microfinance Company Limited collapsed falls on all fours
with the above explanation for how financial institutions or banks could collapse. The people of
Kumasi, the capital of the Ashanti Region considered Work Up and another MFI as the two biggest
and most ‘credible’ MFIs in the Region. One of their competitors said the two were seen as the
“mother MFIs in Kumasi”. Unfortunately, that MFI (name withheld) collapsed and this generated
rumours that, then Work Up also should be having solvency challenges. The former Branch
Manager thus submitted: “One thing is, last year for instance, a lot of MFIs faced crisis. We were
still standing but one MFI called [name withheld] collapsed. So when people got to know that [that
MFI] had been in crisis, people began to come out with a lot comments that our company too is
collapsing. Meanwhile it was strong…. they were just spreading it. Work Up is collapsing so if
you have money at Work Up, just go and withdraw your money” (Work Up, 2015: 2). Some
employees of the institution, seeing the increasing rate of withdrawals alerted their families and
friends who had deposits with the company to also rush and withdraw their money and this fast-
tracked the run on the institution.
In the case of Double Up, some bitter employees dismissed for fraud began peddling
falsehood that the company was collapsing. So the customers of that branch beseeched the
company to withdraw their deposits. Apparently as noted earlier, the company had experienced
huge impromptu withdrawals at a different branch that made them unable to timely honour the
withdrawal requests of some customers, so they told them to come the next day. This, the
interviewee said, gave credence to the dismissed employees’ false claim that the company was
collapsing in fact and occasioned panic withdrawals when some radio stations too picked up the
rumour. He thus submitted:
There were some staff among us who were caught manipulating the system and
causing fraud…. When they were arrested and granted bail, they started
spreading bad news about the company in the nearby villages that they were
working with the company and it’s collapsing so they should come and withdraw
their monies and that is when the panic withdrawals began. The radio stations

International Journal of African Development v.3 n.2 Spring 2016 55
picked it up and people thought we were collapsing and they all came for their
money (Double Up, 2015: 1).
The case of Grow Rich was also related to fraud. The company had some iterant bankers
(popularly called mobile bankers in Ghana) who went out to mobilize deposits from the customers.
But some of them under-reported the deposits on the mobilization forms they returned to the office,
even though they had correctly recorded them in the customers’ passbooks. For instance, a mobile
banker will take GH1, 000 from a customer and record the same in the customers’ passbook but
on the mobilization sheet that he is to send to the bank (office), he would underrecord it as GH500.
And the company was not doing regular internal auditing which could have helped them to detect
this in advance. Therefore, balance reconciliation disputations usually arose anytime the customers
went to the institution to do withdrawals or check their account balance. Grow Rich then paid for
this with its reputation for the customers went about telling others that “the institution is not
credible, they do not record properly when you make deposits” (Grow Rich, 2015: 4). Not only
did this lead to some customers closing their accounts with them, deposits too flaked.
In respect of Dream Well, upon seeing rampant withdrawals, the company decided to
control it by insisting that, for certain amounts, customers shall give them prior notice before they
come to withdraw. However, most customers neglected this, and when the company dishonoured
their cheques for failing to give them prior notice, they with fury ran to speculate that the MFI was
having liquidity crisis. This led to “panic withdrawal and it really caused us a lot”, the former HR
and Operations Manager stated (Dream Well, 2015: 3).
Pettis (2003) contends that in the world of finance, a collapse in institutional credibility is
highly disturbing for it can quickly lead to liquidity crisis. As noted earlier, when panic occasions,
it mostly begins to contagiously infect otherwise healthy institutions in a spreading and self-
reinforcing wave of panic. Banking panics are self-perpetuating, and once public trust disappears,
it takes extraordinary and costly measures to defend the financial system. Pettis may not be far
from right for as the interviewee from Double Up stated,
For now, people in Ghana do not like microfinance especially in the Northern sector,
Ashanti and Brong Ahafo. Even up to now those [MFIs] operating in the northern sector,
here in the Ashanti region are suffering; they are still facing the panic withdrawal because
the people here have the negative impression that for MFIs, they will run away with your
money. So right now the deposits have reduced, they are only coming for withdrawals. I
have met a lot of my colleagues working in other companies, they are complaining. Still
they are sinking. They do not receive as much deposits as they used to (Double Up, 2015:
4 &6).
We did an anecdotal random sampling of people’s views on MFIs operations in Ghana and
the result was not different from what the interviewee stated. Some Ghanaians are of the view that
the MFIs are there for short-term purposes – to make money and diversify into other areas.
Therefore, once they mobilize enough funds from people, then they lock up their offices. Though

56 http://scholarworks.wmich.edu/ijad/
quite cynical, this perception reflects the high public distrust and the fast ebbing public confidence
in MFIs, which has even been noted by the microfinance companies themselves24. This reinforces
Boateng & Boateng (2014) recent study finding that only few Ghanaians trust and have confidence
in MFIs, most do not. This rather unfortunate development bears watching!
Drivers of Commercial MFIs into bankruptcy in the Ashanti Region of Ghana
Below is a diagrammatic representation of the drivers of commercial MFIs into
bankruptcy teased out from our analysis of the findings of the study.
Figure 1: Drivers of Commercial MFIs into bankruptcy in the Ashanti Region of Ghana.
Source: Authors’ fieldwork.
As shown in the diagram, upon commercialization, many MFIs have entered Ghana’s
microfinance sector to compete for profit and ‘serve’ poor people. However, the desire to expand
outreach and increase market shares lead them to undertake suboptimal practices such as
indiscriminate branching, offering unsustainable returns to customers and disregard of due
diligence. Because of the increased number of MFIs, the BoG is not able to monitor, identify and
prevent in advance, illegal operations and unethical practices. Some MFIs are also badly managed
– the managers engage in unreasonably risky and improvident investments. Additionally, there is
a growing distrust for/waning public confidence in MFIs in Ghana (not just in the Ashanti Region
– see Boateng & Boateng (2014)). Ghanaians are increasingly becoming distrustful of MFIs so
they rush to withdraw their savings and discontinue transactions with them at the slightest hint of
solvency challenges – whether founded or unfounded. All these practices and factors coupled with
24 MFIs seek to restore shaken confidence:
http://www.ghanaweb.com/GhanaHomePage/business/artikel.php?ID=331368

International Journal of African Development v.3 n.2 Spring 2016 57
macroeconomic factors (such as increased cost of living and doing business, Cedi depreciation,
spiralled inflation, decelerated growth, high lending rates) compositely heighten the already risky
profiles of the MFIs business of providing microfinance services, causing them to collapse.
Discussion and implications of findings for policy
First, the issue of MFIs managers breaking laws, disregarding due diligence, taking bad,
unethical and unduly risky decisions just to expand outreach and increase market shares fits into
the larger problem of “overtrading” identified among MFIs in Ghana. “Overtrading in MFIs occur
when they expand their operations too quickly or aggressively by opening up new branches in
hopes of increasing profits by expanding customer base and attracting more deposits” (Addo,
2014:4). Thus, confusing visibility with viability. The incidental problem is that the MFIs tend to
misapply capital when they open up new branches by diverting working (and mostly depositors’)
capital to complete. They as noted by Owusu-Nuamah (2014) therefore end up unable to meet
depositors’ withdrawal requirements timely, and on-demand because of insolvency. Such
situations create the attendant problems of panic withdrawals that may cause MFIs failure, as was
the case of the collapsed MFIs studied. Some studies (e.g., Nair & Fissha, 2010; Hayder, 2002;
Ghartey, 2007; Addo, 2014) have observed that a high percentage of MFIs in Ghana fail in the
first five years of operation, often as a result of overtrading and financial strain. This study firmly
collaborates that finding for none of the MFIs in this study survived beyond five years.
Related here are questionable managerial decisions including huge investments in
uneconomical ventures. Such practices mostly do not only beg due diligence, but also violate the
rules and guidelines of operations set by the BoG. What flows from this is that the MFIs depart
from their lanes, terms, and conditions of their license by giving loans and taking huge deposits in
excess of what the law allows them. At issue here are not just economically improvident decisions,
disregard of due diligence and/or violation of laws, but the MFIs essentially push into business
areas that they do not have the right skills and management tools for. But as Addo (2014) noted,
“the size of the sheep can never be equal to the size of the elephant even if it aims at multiplying
its size through overeating” (p.6). MFIs are never designed as commercial financial intermediaries,
so once they started behaving like commercial banks, it was only a matter of time for them to
collapse. As the interviewee from Work Up admitted, it was “like having bitten more than you
could chew, your jaws will pain” (Work Up, 2015: 2).
In the study, one thing was consistent and true of the collapse of all the MFIs – something
facilitated the collapse. The common factor was ‘collapse rumours’ leading to panic withdrawals.
One surest way by which any financial institution could collapse is if the agents collectively decide
to redeem their claims, all of a sudden, called panic withdrawal. However, people do not just panic-
withdraw, something activates it.
As confirmed in this and other studies, there is growing public mistrust for MFIs in Ghana.
Therefore, the slightest suspicion lead customers to protect their savings by seeking to withdraw
them. And since the MFIs had used their deposits imprudently to create branches and buy illiquid
assets, they certainly were not going to be able to timely honour the numerous withdrawal requests,

58 http://scholarworks.wmich.edu/ijad/
thereby leading to the fulfilment of the depositors’ belief that the MFIs were in fact collapsing.
Against this backdrop, whilst acknowledging the instrumental role the 2013 macroeconomic
instability played in the collapse of MFIs in Ghana, it appears to us and we contend accordingly
that, it only contributed to the huge number and the pervasiveness of the collapse – the
macroeconomic problems were necessarily not part of the root causes.
What then are the overall causal findings or answers to why MFIs collapse in the Ashanti
Region and probably Ghana? We take seriously the view that any attempt to explain organizational
failure will not be complete unless the interplay between contextual forces and organizational
dynamics are taken into account (Mellahi & Wilkinson, 2010). However, sometimes, as noted by
Gillespie & Dietz (2009) and this is true of the findings of this study, the “locus of control for the
failure could be internal to the organization, even though the context for the failure may involve
external influences” (p.129). The key argument here is that failure is primarily caused by internal
factors even though, external threats may exacerbate it.
The MFIs against basic principles of financial intermediation, improvidently invested
depositors’ funds in creating branches, illiquid and other assets which were irrelevant to their
operations; they offered costly and unsustainable products; broke the rules and disregarded due
diligence practices, all in the name of increasing outreach and market shares. Certainly, they were
sowing the seeds of their own destruction by increasing the risk profiles of their already risky
business of providing microfinance services. This is in line with Gillespie & Dietz (2009)
observation that organization failure could result from “a single major incident, or cumulative
series of incidents, resulting from the action (or inaction) of organizational agent” (p. 128). Clearly,
the MFIs “shot themselves in the foot” as contended by Owusu-Nuamah (2014).
Nevertheless, as rigorously argued by Thomas Hobbes in his time-honoured theory of
Leviathan, if people on their own would do the right thing, then there will be no need for
institutions and laws. This issue even becomes more serious when raised in tandem with the critical
question of what happens to the depositors’ funds after the collapse of the MFIs25. The cost of the
collapse is disproportionally borne by the poor clients. Thus, the actual harm arising from the
25 Microfinance customers generally lose their savings when the MFIs collapse. The interviewees from Double Up, Grow Rich and Dream Well said that they could not refund the customers monies to them. Even the few who were fortunate could not get full refund because the companies did not have enough funds. In the case of Work Up, the interviewee said some of the clients who had huge deposits took them to court and the court froze a few of their movable assets but the value of the assets could not even defray the monies they owed them. So I asked, “What about the petty traders who saved with you”? He answered: “They were all silent. They could not do anything”. What was monumentally outrageous is that the owners of the MFIs went home with their assets unscathed, virtually – after losing outrageous number of poor clients, their life savings. They still kept the assets – the buildings and premises used as offices, the furniture, plants, cars, landed properties and most of the illiquid assets into which they invested the customers’ funds. None of the former employees of the supposedly ‘bankrupt’ MFIs said their assets were liquidated. E.g. The interview from Dream Well is now into hire purchase and he operates from one of the defunct company’s offices in Adum, the central business district. Not only the assets, but also crucially, except Grow Rich, which was operating illegally, all the other collapsed MFIs still have their operation licenses intact. As they stated, the Bank of Ghana has not issued them “red card” yet. Therefore, when the dust settles, they are unhindered – they could easily jump back into business again. The interviewee from Grow Rich even hinted that the directors of the defunct company are now back in business with a different brand name. This raises a serious concern about the manner the Bank of Ghana handles the issue of collapsed MFIs. Why must MFIs operators who could not refund poor clients savings that they recklessly misapplied still retain their licenses and the assets of the companies deemed to have gone bankrupt?

International Journal of African Development v.3 n.2 Spring 2016 59
collapse is not borne by the operators of the MFIs rather, by the customers – the poor people and
the wider (microfinance) community. It seems the MFIs operators would not take their
responsibility to be prudent with people’s money seriously and would need to be whipped to
comply as urged by Hobbes.
The imposed duty is on the Bank of Ghana to regulate and protect the public from Ponzi
schemes, unscrupulous people and financial institutions as well as protect consumers and investors
funds from being (mis)applied by MFIs operators. However, as found in this study, the Bank has
an oversight challenge to constantly monitor and prevent illegal and unethical activities timely and
in advance. The question then is: What are the implications of the findings of this study for policy,
in dealing with the problem of collapsing MFIs and its attendant problems in Ghana, taken into
consideration the Bank of Ghana’s oversight challenges?
One thing we learnt from the former Marketer of the defunct Grow Rich Microfinance
Company who now works with a savings and loans company is that, knowing that, the Bank of
Ghana field monitors could come and check them impromptu, they are always careful to organize
their affairs. The Bank of Ghana may therefore consider creating in the other regions of Ghana,
subsidiaries of the OFISD, which is now centralised in only Accra to enhance nationwide
monitoring. Relatedly, devolution of sanction powers to the (umbrella) associations of the MFIs
who generally have offices and personnel scattered around the country compared to the Bank of
Ghana may be helpful. With such powers, the MFIs associations could peer-regulate alongside the
Bank and this would further enhance knowledge sharing and (peer) learning of best practices.
Second, the Bank and the Ministry of Finance financial literacy campaign must be
intensified and not only in the urban towns but also the rural areas where the people who generally
because of their level of literacy and location, easily become targets of unscrupulous people and
Ponzi schemes.
Third, the current (inverse burden) state of affairs where poor customers irretrievably lose
their savings but owners of MFIs deemed collapsed still retain the assets of the defunct companies
is grossly inequitable. Why should customers who had no hands in the collapse of the MFIs lose
their savings only for the owners to go home with booties? Of course, the public has to be as
vigilante as poor customers could come together for mass action against MFIs. Nevertheless, the
imposed duty is on the Bank of Ghana to follow every report and rumour on collapsed MFIs –
whether licensed or unlicensed, audit them and liquidate their assets to pay off depositors just as
they have announced to do in the recent case of DKM Microfinance Company26.
Fourth, criminal prosecution of MFI operators who recklessly play with poor people’s
money must begin in earnest to serve as deterrence. There is also an urgent need for deposit
insurance. This would not only protect clients when the MFIs collapse but also the strict conditions
attached to insurance would make MFIs’ operators become provident in their operations since
insurance companies are unlikely to pay for their unconsidered recklessness.
26 BoG turns down appeal of DKM microfinance customers: http://citifmonline.com/2015/06/02/bog-turns-down-
appeal-of-dkmmicrofinance-customers/#sthash.gN43e8PI.dpuf

60 http://scholarworks.wmich.edu/ijad/
Conclusion
The study was instigated by the 2013 mammoth collapse of profit – accumulating
commercial MFIs in Ghana. The causal factors were grouped into internal and external factors.
Even though the context of the collapse involved external influences like collapse rumuors and
macroeconomic factors, the loci of the collapse were internal to the MFIs and manifested as
indiscriminate branching, offering of unsustainable packages, disregard of due diligence,
mismanagement and violation of the BoG’s rules and guidelines.
The unduly risky manner in which operators of MFIs (mis)apply investors and customers’
funds brings into question their moral responsibility to be cautious with poor people’s money and
this explains the growing public distrust for MFIs in Ghana. The MFIs themselves have recognized
the aversion of the public to their operations. However, going forward, to trust that, that in itself
or alone would bring providence in their operations would be a very expensive optimism. The
monitoring challenges of the Bank of Ghana is seriously noted but the evidence points to more
compliance and ethical operations when MFIs tails are tightly held to do so.
Accordingly, we recommend a two-pronged strategy to tackle the issue of collapsing MFIs
and its attendant problems in Ghana. The first strategy is risk-averting/reduction oriented and
includes progressive decentralization of the Other Financial Institution Supervision Department
(OFISD) of the Bank of Ghana and legal empowerment of the MFIs associations to peer-regulate
alongside the BoG. This would help to timely and in advance identify and prevent unethical and
illegal operations everywhere in Ghana as well as promote peer learning and knowledge sharing.
The second strategy is oriented towards protecting MFIs clients and the public from unscrupulous
people and financial institutions. This includes introduction of deposit insurance; intensification
of financial literacy campaign; tracking reports and rumuors on MFIs collapse–whether licensed
or unlicensed, to audit them and liquidate their assets to pay off depositors as well as criminal
prosecution of unscrupulous people who recklessly apply microfinance clients and investors funds
on unduly risky ventures.
Authors’ note: This is a shortened version of a thesis report. See the full version, appendices and
other related documents here: http://rudar.ruc.dk/handle/1800/23859

International Journal of African Development v.3 n.2 Spring 2016 61
References
Addo, C.K. (2014). Overtrading versus lack of qualified staff as cause of failure of microfinance
institutions in Ghana: A conceptual investigation. Research Journal of Finance. 2(11).
AfDB, OECD, UNDP (2014). African economic outlook: Ghana. Retrieved from
www.africaneconomicoutlook.org.
Andersen, J. B. (2009). Commercialization of microfinance portfolio aspects of turning banker to
the poor. Aarhus: Denmark, School of Business, University of Aarhus.
Ayeh R. (2015). Will my microfinance company collapse? Retrieved from
https://www.linkedin.com/pulse/mymicrofinance-company-collapse-roderick-ayeh.
Bateman, M. (2010). Why doesn’t microfinance work? The destructive rise of local neoliberalism.
London: UK, Zed Books Ltd.
Bateman, M. (2013). The age of microfinance: Destroying Latin American economies from the
bottom up. (Working paper #39.) Pula, Croatia: Department of Economics and Tourism,
Juraj Dobrila Pula University.
Boateng, A.A. & Boateng G.O. (2014). Assessment of the effectiveness of Ghanaian micro-
finance institutions in promoting entrepreneurs in Accra Metropolis. Research Journal of
Finance and Accounting. 5(6), 15 – 22.
Belnye, F. (2011). Achieving financial inclusion through appropriate regulatory policy: The case
of Ghana’s informal and semiformal financial institutions.
CGAP & MIX. (2009). Sub-Saharan Africa microfinance analysis and benchmarking report.
Centre for the Study of Financial Innovation (CSFI). (2008). Risk in a booming country: An
industry in turmoil. CSFI, Microfinance banana skins, www.csfi.org.
Ibid. (2009). Insurance banana skins. CSFI, Microfinance banana skins.
Ibid. (2010). After the quake. CSFI, Microfinance banana skins.
Ibid. (2012). Staying relevant. CSFI, Microfinance banana skins.
Ibid. (2014). Facing reality. CSFI, Microfinance banana skins.
Gallardo, J. (2001) A Framework for regulating microfinance institutions: The experience in
Ghana and the Philippines. The World Bank financial sector development department.
GHAMFIN. (2014). Performance monitoring and benchmarking of microfinance institutions in
Ghana: Trends in the Industry during the 2000s (2006 – 2012).
Ghartey, G. (2007). Sustaining microfinance in Ghana: Implications of both prudential and non-
prudential regulations for the sub-sector. The annual Microfinance Conference, University
of Cape Coast, Ghana.
Gillespie, N., & Dietz, G. (2009). Trust repair after organization-level failure. Academy of
Management Review, 34(1), 127-145.
Grammling, M. (2009). Cross-borrowing and over indebtedness in Ghana: Empirical evidence
from microfinance clientele and small enterprises. Technical draft for discussion.
ProCredit Holding Frankfurtam Main.

62 http://scholarworks.wmich.edu/ijad/
Kappel, V., Krauss, A. & Lontzek, L. (2010). Over-indebtedness and microfinance—Constructing
an early warning index. Center for Microfinance, University of Zurich, Responsibility
Council of Microfinance Equity Funds, Triodos Investment Management Zurich.
Kvale, S. & Brinkmann, S. (2009). Thematizing and designing an interview study. Chapter 6, in
InterViews: Learning the craft of qualitative research interviewing. Sage Journal
Publications, 99 – 121.
Mellahi, K & Wilkinson, A. (2010). Managing and coping with organizational failure: Introduction
to the special issue. Group and Organization Management, 35 (5) 531-541.
Nair, A. & Fissha, A. (2010). Rural banking: The case of rural and community banks in Ghana,
agriculture and rural discussion Paper 48, The International Bank for Reconstruction and
Development/The World Bank, Washington D.C. Retrieved from
http://wwwwds.worldbank.org/external/default/WDSContentServer/WDSP/IB/2010/09/1
6/000356161_20100916014752/Rendered/PDF/565910NWP0ARD01UBLIC10GhanaR
CBs1web.pdf.
Owusu-Nuamah, P. (February 14, 2014). Ghana: Collapse of microfinance companies –
Companies shot themselves in the foot. Retrieved from Ghana Web
http://www.ghanaweb.com/GhanaHomePage/NewsArchive/Collapse-of-microfinance-
companies-Companies-shot-themselves-in-the-foot-300701.
Pettis, M. (2003). What the SARS panic can teach us about financial crises. Instituto de Estudos
Avancados da Universidade de Sao Paulo.
Rhyne, E. (May 25, 2011). Why are microfinance interest rates so high? Retrieved from
http://www.huffingtonpost.com/elisabeth-rhyne/why-are-microfinance-
inte_b_593359.html.
Robinson, M. (2001). The microfinance revolution: Sustainable finance for the poor. Washington
D.C. World Bank.
Serrano, S.D. & Sackey, F.G. (2015). Microfinance and credit rationing in Ghana: Does the
microfinance type matter? Centre de Recerca En Economia Industrial I Economia Publica.
Schicks, J. (2011) Over-indebtedness of microborrowers in Ghana: An empirical study from a
customer protection perspective. CERMi Solvay Brussels School of Economics and
Management (SBS-EM) Université Libre de Bruxelles (ULB).
Sinclair, H. (2012). Confessions of a microfinance heretic: How micro lending lost its way and
betrayed the poor. San Francisco: CA, Berrett-Koehler Publishers.

International Journal of African Development v.3 n.2 Spring 2016 63
International Trade Effects of Regional Economic Integration in Africa:
The Case of the Southern African Development Community (SADC)
Mengesha Yayo, Addis Ababa Science and Technology University
Sisay Asefa, Western Michigan University
Abstract
Empirical studies on regional economic integration process in Africa exhibit
sluggish progress, and there by limited level of intra-trade. The existing literature
in Africa, particularly in the Southern African regional integration bloc, has
neglected the effects of regional economic integration dealing with disaggregated
data. This study analyzes trade creation and diversion effects of the Southern
African Development Community (SADC) using disaggregated data. The
investigation estimates an augmented gravity model using panel data and random
effect estimator methods applying instrumental variables where needed. The results
show that intra-SADC trade is growing in the fuel and minerals and the heavy
manufacturing sectors while it displays a declining trend in the agricultural and
light manufacturing sectors. This implies that SADC has displaced trade with the
rest of the world in both fuel and minerals and the heavy manufacturing sectors.
SADC has served to boost trade significantly among its members rather than with
the rest of the world. Countries participating in SADC have moved toward a lower
degree of relative openness with the rest of the world in these sectors of trade.
However, the increasing trend of extra-SADC trade bias over the sample period in
both the agricultural commodities and light manufacturing sectors means that there
has been a negative trade diversion effect which implies that the value of trade
between members and non-members has been increasing (and not falling as would
be the case with trade diversion) for the two sectors. These results seem to suggest
that SADC countries retained their openness and outward orientation despite
signing the trade protocol for enhancing intra-SADC trade.
Keywords: agricultural sector, fuel and minerals, heavy and light manufacturing
sectors, Southern African Development Community (SADC), regional economic
integration effect, trade creation and trade diversion effects.
Empirical studies on regional economic integration process in Africa exhibit sluggish
progress and there by limited level of intra trade. The existing literatures in Africa, particularly in
Southern African regional integration bloc, SADC have neglected effects of regional economic
integration dealing with disaggregated data. This study analyzes trade creation and diversion
effects of the Southern African Development Community (SADC) using disaggregated data. The
investigation estimates an augmented gravity model using panel data and random effect estimator
methods applying instrumental variables where needed. The results show that the intra -SADC

64 http://scholarworks.wmich.edu/ijad/
trade is growing in fuel and minerals, and heavy manufacturing sectors while it displays a declining
trend in agricultural and light manufacturing sectors. This implies that SADC has displaced trade
with the rest of the world in both fuel and minerals, and heavy manufacturing sectors. SADC has
served to boost trade significantly among its members rather than with the rest of the world.
Countries participating in SADC have moved toward a lower degree of relative openness in these
sectors trade with the rest of the world. However, the increasing trend of extra-SADC trade bias
over the sample period in both agricultural commodities and light manufacturing sectors means
that there has been a negative trade diversion effect which implies the value of trade between
members and non-members has been increasing (and not falling as would be the case with trade
diversion) for the two sectors. These results seem to suggest that SADC countries retained their
openness and outward orientation despite they signed the trade protocol for enhancing intra-SADC
trade.
The relevance of regional integration is a very persistent issue in Africa, specifically in
view of political and economic backwardness. Africa is confronted with a deep-rooted level of
poverty, a minimal share of world trade, and a low pace of development in human capital and
infrastructure as well as being faced with an excess of challenges from external pressures. Ensuring
that regional economic integration succeeds in Africa is vital not only because of the prospective
and challenges mentioned above, but also because the polices that are required to ensure its
fruitfulness are the same as those needed if Africa is to benefit from the process of globalization
and integration into the world economy. However, in practice, the effectiveness of regional
integration in Africa is an empirical issue specifically related to the progress of trade that flows
among members of any trading bloc on the continent.
There are plenty of empirical studies regarding the effects of regional economic integration
on trade flows. Various researchers have employed different methodology to analyze the effects
of regional economic integration, and the results from these studies are mixed. Although early
empirical studies used cross-sectional data to estimate gravity models (Aitkin, 1973; Berstrand,
1985), most researchers nowadays use panel data (Matyas, 1997; Wall, 2000; Glick and Rose,
2001). One reason is that the extra time series observations result in more accurate estimates.
However, these studies fail to employ disaggregated data for analyzing the effects of regional
economic integration on trade. This indicates a limitation of a model’s dependence upon
aggregated data as opposed to disaggregated data, which can help in analyzing the effects of trade
agreements on specific tradable commodities, and helps member countries identify sectors, which
are advantageous in joining the trading bloc. In addition, aggregate data masks commodity, or
level heterogeneity, which may also bias the estimate.
Specifically, to the best of our knowledge, the possibility of doing an examination using a
panel data approach at the sectoral level is rarely practiced in Africa. As elaborated earlier, this
leads to a biased estimation and hence incorrect inferences. Clausing (2001) and Romalis (2005)
eliminated some of these problems by using commodity level data to analyze the effects of the
Canada–United States Free Trade Agreement (CUSFTA) and the North America Free Trade
Agreements (NAFTA), respectively.

International Journal of African Development v.3 n.2 Spring 2016 65
Despite a number of empirical contributions in recent years, the effects of regional
economic integration on trade in the region under study at the disaggregated data level have not
been investigated rigorously. This void motivates this study uses disaggregated data to focus on
the Southern African Development Community (SADC) and its effects on trade. To assess the
effects of SADC on trade flows of member nations, this study relies on a gravity model and
disaggregated data. The study analyzes the effects of SADC on trade in four sectors, namely,
agricultural commodities, fuel and minerals, heavy manufacturing and light manufacturing
products. An augmented gravity model of panel data approach is used to determine the extent of
intra-regional trade bias and potential trade diversion effects for each sector.
Review of the Literature
Effects of Regional Economic Integration
This section analyzes the theory on the effects of regional economic integration. It further
reviews the existing empirical findings of this topic so as to grasp some practical insights in this
regard.
Theoretical Framework on the Effects of Regional Economic Integration. Entry into
a regional integration scheme can have both static effects, which are a result of resource
allocation in response to changing relative prices, and dynamic effects, which come from
changes in efficiency, ability to exploit economies of scale, and in the level of investment and
growth.
Static Effects. The static impact refers to changes that occurred in the equilibrium market
price and quantity before and after the creation of the economic bloc. This can be a trade creation
or a trade diversion. For a given product, a trade creation appears when high cost production is
substituted by low cost production because of regional integration while economic diversion
occurs when low cost production is substituted by high cost production. Nevertheless, besides the
trade creation and trade diversion effects, the static effects of regional integration can involve other
impacts. Thus, this study is going to look at these static effects by classifying them into traditional
(trade creation and diversion) and non-traditional static effects in a broader sense. On top of these
traditional static effects, Cline (1978) provided additional non-traditional static effects from
regional trade integration, which are as follows: the labor opportunity effect,27 the economies of
scale effect,28 and the foreign exchange saving effect.29
Further studies also discovered more static gains from regional trade integration depending
on the models used. Following the classification of Baldwin and Venables (1995) and that of Lloyd
and Maclaren (2004), the models assumed perfect competition and constant returns to scale, and
27 This occurs when an increase of output, made possible by regional trade integration, allows for the employment of extra labor
at a wage below the minimum wage rate. 28 This occurs when firms become able to produce at their capacity as a result of the increase of the market size
made possible by more demand of the product. 29 This occurs when a group of countries forms a regional trade agreement (RTA), and they increase imports from
within the union and reduce the level of imports from outside the union, thus saving foreign exchange.

66 http://scholarworks.wmich.edu/ijad/
identified that trade volume, trade cost and terms of trade as beneficial effects of regional trade
integration. However, models assuming imperfect competition and increasing returns to scale
identified benefits from regional trade integration in the form of output, scale and variety effects.
Dynamic Effects. The effects considered in the above subsection are purely static
responses of producers and consumers in more general models to changes in relative prices
owing to changing patterns of tariffs.30 Besides these effects, however, there are also a variety of
potential dynamic effects. These may be felt more gradually, but will be longer lasting and, in
some cases, continued. These are competition effect, investment effect, economies of scale,
capital formation effect and structural effect. In contrast to the static effect of regional trade
integration, the dynamic effects are presumed to continue to generate annual benefits, even after
the withdrawal of a country from the union. For instance, a rising in the growth rate made
possible by integration will have continued effects provided that it is sustained.31 They likely
constitute stronger arguments for regional integration than the static arguments based on resource
allocation arguments addressed above. More precisely, dynamic effects, if present, are likely to
dominate static effects.
Welfare Effects. Across the globe, there is a fierce debate about the merits of regional
trading agreements (RTA). While some herald such agreements as stepping stones towards
worldwide free trade, others fear that these initiatives will be stumbling blocks, acting primarily
to divert trade from other countries to those countries receiving preferential treatment. Although
these issues are essential for the future of the world's trading relationships, a number of obstacles
prevent economists from reaching any consensus on the effects of preferential trading
agreements. In addition, the empirical works fail to provide firm conclusions on even the most
basic issues regarding preferential trading agreements: whether trade creation outweighs trade
diversion (Clausing, 2001).
Empirical Findings on Regional Economic Integration. For analytic purposes, it is
useful to classify the researchers’ findings on the topic according to the type of methodology
they employ to examine the impacts of forming regional economic integration on trade flows,
viz. descriptive approach, simulation approach (Computable General Equilibrium), or
econometric approach (gravity model and others) as well as the nature of data they employ,
namely cross section, time series panel based on the aggregate or sectoral level.
CGE Model. There are a large number of ex-ante Computable General Equilibrium
(CGE) studies of trade agreements that examine what effects can be expected from preferential
trading arrangements (for instance, Brown et al., 1992; Brown and Stern, 1989a; Haaland and
Norman, 1992). More recently, Hertel et al. (2006) applied CGE analysis in order to better
evaluate the likely outcome of a Free Trade Area of the Americas (FTAA) agreement, and they
30 The associated welfare changes are once and for all effects which in principle have their impact shortly after the
integration scheme is introduced. They constitute a once-off, outward shift in the production possibility frontier
attainable by the country given its resources (Cline, 1978). 31 Every dynamic effect is a consequence of the increase in effective size following integration, and will have
potentially positive effects on growth.

International Journal of African Development v.3 n.2 Spring 2016 67
found that that imports increased in all regions of the world as a result of the FTAA. This
outcome was robust to variation in the trade elasticities.
One weakness or imperfection of CGE studies is that their results are very sensitive to the
assumptions, parameters, and data used in the model, and have to be interpreted accordingly.
Besides, they do not allow an investigation of the questions this study is concerned with here.32
Krueger (1999) also mentioned that CGE studies have been prospective rather than retrospective.
In a CGE model, the sectoral aggregation also does not permit analysis of specific markets. As
with McKitrick (1998), policy information is usually outdated, and baseline scenarios are far from
facts and based on the older data. CGE methods are also very data demanding and tend not to be
applied with high levels of data disaggregation (Milner and Sledziewska, 2005). Therefore, the
validity of the results of CGE studies is questionable in some cases. While CGE models are useful
for speculating what the effects of a particular agreement might be, they are without firm evidence.
Descriptive Approach. A descriptive approach is also another methodology pursued in
the literature to examine the effects of regional economic integration on trade patterns, for
example, Anderson and Norheim, 1993; Yeats, 1998; Dell’Aquila et al., 1999). These studies
used different indicators to measure the regional concentration of trade. A descriptive approach
implicitly assumes that the share of trade happens with the partner nation that would not have
changed in the absence of the agreement. This method depends on a static framework, and the
results are dependent on the level of aggregation.33 Furthermore, a descriptive approach misses
the ability to analyze trade creation and trade diversion effects and, hence, the welfare
implications of RTAs (Jayasinghe & Sarker, 2004).
Gravity Model. Developing an accurate counterfactual of ex-post studies of how much
trade would have increased in the absence of a given free trade agreement or customs union has
proved difficult. For instance, Balassa (1967, 1975) constructed a counterfactual of how trade
would have changed in the absence of European integration by calculating pre-integration
income elasticities that were assumed to continue post-integration. Some, including Frankel and
Wei, 1995; Frankel and Kahler, 1993; Frankel, 1997; Krueger, 1999; Aitkin, 1973; Aitkin and
Obutelewicz, 1976; and Willmore, 1976, applied the gravity model to assess the impact of
preferential arrangements on trade flows.34 Schwanen (1997) found that trade growth with the
United States was much faster in liberalized sectors.
Helliwell et al. (1998) used two types of evidence in their approach to assess the impact of
the FTA on inter-provincial trade. First, they developed a gravity model to explain inter-provincial
and province-state trade flows. Then, they analyzed new industry-level data to estimate the extent
to which tariff changes in Canada, and the United States helped explain inter-industry differences
in the growth of inter-provincial trade. The disaggregated results of Helliwell et al. (1998)
32 Analyzing trade creation and trade diversion effects of regional trading arrangements on trade patterns at sectoral level 33 As a result, changes in terms of trade as a result of changes in the relative trade importance of members and
outsiders as well as declines in the volume of trade for a particular commodity comprised in the broader class,
cannot be detected. 34 This model has the advantage of including several variables that are affecting trade flows, such as income changes
and exchange rate variables.

68 http://scholarworks.wmich.edu/ijad/
suggested that the FTA-related reduction in Canadian tariffs led to increases in imports from the
United States and to reductions in inter-provincial trade.
Regional dummy variables, inter and extra, have been used in gravity models using ex-post
approaches to try to capture separate trade creations and diversion effects. It was also the case that
gravity modeling was invariably used to model total trade flows or at least broad aggregates of
trade.35
Clausing (2001) employed data at the commodity level, and the results indicated that
CUSFTA had substantial trade creation effects with little evidence of trade diversion. Further, he
argued that unlike the approaches of many previous studies of preferential trading agreements that
have relied on aggregate data, disaggregate data was used to analyze how actual tariff changes
affect trade flows. Without utilizing the variation in the extent of liberalization across goods, it
would be far more difficult to distinguish the effects of an agreement from other influences
affecting trade flows. Here, the current study agrees with the above notions.36
Similarly, Jayasinghe and Sarker (2004) estimated an extended gravity model using pooled
cross–sectional, time–series regression, and generalized least squares methods. As a result, they
found that a share of intra-regional trade is growing within NAFTA, and that NAFTA has displaced
trade with the rest of world. Using panel data econometric model analysis applied to highly
disaggregated trade data, Milner and Sledziewska (2005) came out with the results that showed
the European Agreement had transitory, but significant, trade diverting effects for Poland’s
imports. The trade diversion substantially dominated the trade creation.
Empirical Findings on Regional Economic Integration in Africa
Alemayehu and Haile (2002), in their study for COMESA, showed that bilateral trade flows
among the regional groupings could be explained by standard variables as demonstrated by the
results of the conventional gravity model, while regional groupings had insignificant effects on the
flow of bilateral trade. Khorana et al. (2007), using a partial equilibrium model, assessed the
implications of the transitional measures for products sensitive from the Ugandan perspective.
They discussed whether the regional trading arrangements conferred any real benefits on the
stakeholders, and suggested alternative approaches that may increase the benefits for Uganda from
trade liberalization within the customs union.
Specifically, Maasdorp (1999), in his study of regional trade and food security in SADC,
concluded that trade in the region can contribute substantially to provide improved food security.
Besides, he noted that there was a considerable scope for greater intra-regional trade in grains and
other food products, and for a greater cross-border investment in agriculture and the agro-industry.
By modeling South Africa and the rest of southern Africa, Lewis et al. (1999) also concluded that:
(i) trade creation dominates trade diversion for the region under all FTA arrangements; (ii) the rest
35 In which case, it does not allow the investigator to comment on trade creation and diversion effects at the disaggregate level.
(Milner and Sledziewska, 2005). 36 Because assessing the impacts of forming regional trading blocs on trade flows based on aggregate data level may
bias the estimation and results in incorrect inference.

International Journal of African Development v.3 n.2 Spring 2016 69
of southern Africa benefits from an FTA between the EU and South Africa; (iii) the rest of southern
Africa gains more from zero-tariff access to EU markets than from a partial (50 percent) reduction
in global tariffs. To address the potential of increasing intra-SADC trade, Chauvin and Gaulier
(2002) used three complementary approaches.37 Keck and Piermartini (2005) applied the general
equilibrium model with 15 regions and 9 sectors to simulate the impact of EPAs for countries of
SADC. Their simulation results showed that EPAs with the EU were welfare-enhancing for SADC
overall, which led also to substantive increases in real GDP.
Brief Overview of SADC’s Economic Structure and Characteristics
Economic Indicators of SADC Member Nations
From the beginning, the southern African region was comprised of heterogeneous countries
both in terms of economic and political dimensions. Put differently, there were significant gaps of
development. In 2007, this included six countries with a GDP per capita below or equal to US
$660 (DRC, Lesotho, Malawi, Mozambique, Tanzania, and Zimbabwe), and eight other countries
with an income per capita of US $900 to $8,600 (Botswana, Swaziland, Namibia, Mauritius,
Seychelles, Zambia, South Africa, and Angola). If one excludes South Africa from the region, the
average per capita income in 2007 was US $2,735 in SADC.
SADC Trade Level
Despite impressive growth in total exports between 2000 and 2007, intra-SADC trade
remained weaker.38 An examination of trade between countries also revealed that more than two
thirds of the total trade was with South Africa. However, SADC‘s growth of extra-regional trade
was more than with fellow members. Since SADC had commenced its implementation of the trade
protocol, it experienced huge increases in exports. However, most of these exports were destined
to markets outside the region itself and Africa on the whole. European countries were the major
trading partners of the SADC members. Following European countries, Asia and the USA served
as second and third, respectively, as significant export destinations of SADC members.
37 The first two refer to trade indices: export diversification indices revealed comparative advantages and trade
complementarily indices and the last one is based on gravity model. 38 A comparison of SADC with other regional blocs shows that intra-regional trade provides the necessary impetus
for deeper integration and regional progress. However, SADC is relatively lagging behind most regions outside
Africa.

70 http://scholarworks.wmich.edu/ijad/
Figure 1: Export Share Trends of SADC by Destination in 2000 and 2007.
Source: Own Computation from COMTRADE DATA CD-ROM
Share of Exports by SADC Member States
As Figure 2 displays, in both years, South Africa contributed the highest share in total intra-
SADC trade. Zimbabwe and Namibia held the second and third positions in total trade that took
place within the region in 2007.
Figure2: Share of Intra- Export value in SADC Trade by Members (in US dollar)
Source: Own Computation from COMTRADE DATA CD-ROM
It was also evident that intra-trade among SADC members had declined in the agricultural
and light manufacturing sectors in 2007 as compared to the base year 2000. However, trade shares
increased in fuel and minerals and the heavy manufacturing sectors for the same period.
2000
39%
9% 14%
16.20%
22%
2007
37%
10% 25%
15.75%
12%
EU USA Asia intra -SADC others
intra trade share of SADCmember(2007)
6.44
2.17
10.83
44.41
2.59
7.57
15.53
0.01
5.983.81
0.65
Botsw ana
Malaw i
Mauritius
Nambia
South Africa
Tanzania
Zambia
Zimbabw e
Sychelles
Sw aziland
Mozambique
inra trade share of SADC member (2000)
5.13
51.39
0.51
4.28
9.18
13.96
0.61
11.06
2.14
0.73
0.441.13
Botsw ana
Malaw i
Mauritius
Nambia
South Africa
Tanzania
Zambia
Zimbabw e
Lesotho
Sychelles
Sw aziland
Mozambique
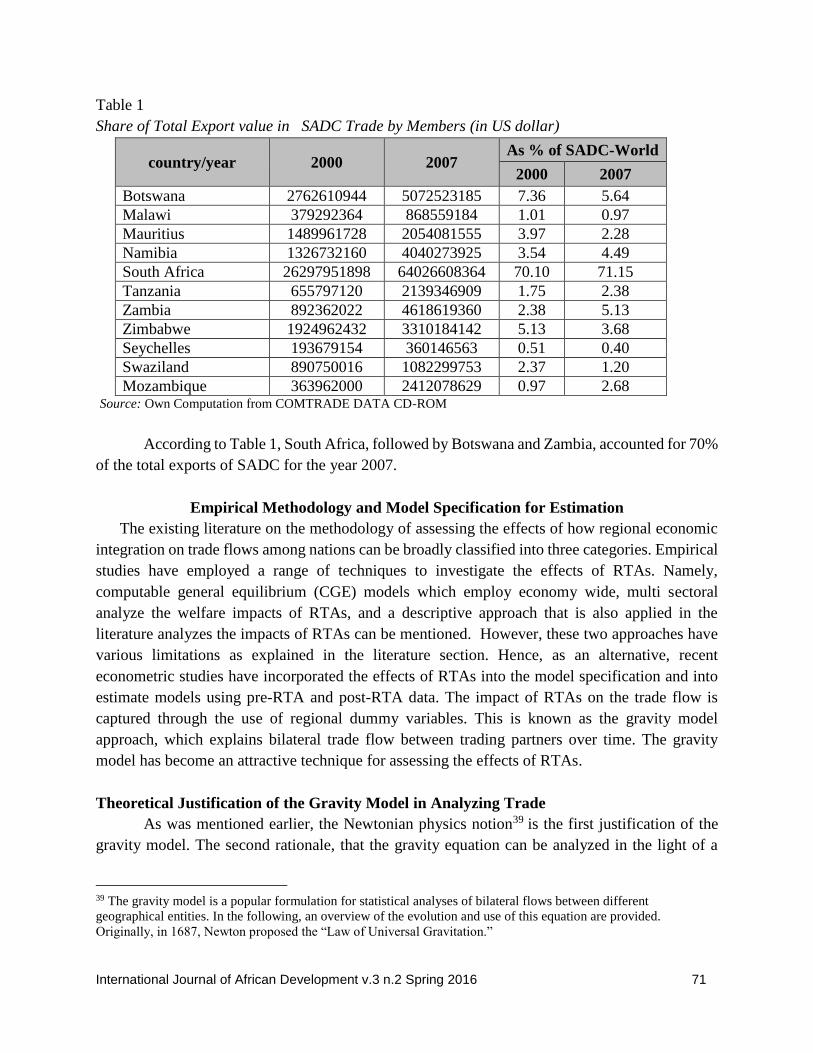
International Journal of African Development v.3 n.2 Spring 2016 71
Table 1
Share of Total Export value in SADC Trade by Members (in US dollar)
country/year 2000 2007 As % of SADC-World
2000 2007
Botswana 2762610944 5072523185 7.36 5.64
Malawi 379292364 868559184 1.01 0.97
Mauritius 1489961728 2054081555 3.97 2.28
Namibia 1326732160 4040273925 3.54 4.49
South Africa 26297951898 64026608364 70.10 71.15
Tanzania 655797120 2139346909 1.75 2.38
Zambia 892362022 4618619360 2.38 5.13
Zimbabwe 1924962432 3310184142 5.13 3.68
Seychelles 193679154 360146563 0.51 0.40
Swaziland 890750016 1082299753 2.37 1.20
Mozambique 363962000 2412078629 0.97 2.68 Source: Own Computation from COMTRADE DATA CD-ROM
According to Table 1, South Africa, followed by Botswana and Zambia, accounted for 70%
of the total exports of SADC for the year 2007.
Empirical Methodology and Model Specification for Estimation
The existing literature on the methodology of assessing the effects of how regional economic
integration on trade flows among nations can be broadly classified into three categories. Empirical
studies have employed a range of techniques to investigate the effects of RTAs. Namely,
computable general equilibrium (CGE) models which employ economy wide, multi sectoral
analyze the welfare impacts of RTAs, and a descriptive approach that is also applied in the
literature analyzes the impacts of RTAs can be mentioned. However, these two approaches have
various limitations as explained in the literature section. Hence, as an alternative, recent
econometric studies have incorporated the effects of RTAs into the model specification and into
estimate models using pre-RTA and post-RTA data. The impact of RTAs on the trade flow is
captured through the use of regional dummy variables. This is known as the gravity model
approach, which explains bilateral trade flow between trading partners over time. The gravity
model has become an attractive technique for assessing the effects of RTAs.
Theoretical Justification of the Gravity Model in Analyzing Trade
As was mentioned earlier, the Newtonian physics notion39 is the first justification of the
gravity model. The second rationale, that the gravity equation can be analyzed in the light of a
39 The gravity model is a popular formulation for statistical analyses of bilateral flows between different
geographical entities. In the following, an overview of the evolution and use of this equation are provided.
Originally, in 1687, Newton proposed the “Law of Universal Gravitation.”

72 http://scholarworks.wmich.edu/ijad/
partial equilibrium model of export supply and import demand, was provided by Linneman (1966).
Relying on some simplifying assumptions, the gravity equation proves to be a reduced form of this
model.40 Nonetheless, Bergstrand (1985) and others indicated that this partial equilibrium model
cannot explain the multiplicative form of the equation, and also leaves some of its parameters
unidentified mainly because of the exclusion of the price variable. With the simplest form of the
equation, of course, Linneman’s justification for exclusion of prices is consistent.
Anderson (1979) provided the first theoretical explanation for the gravity equation based
upon the properties of the expenditure systems.41 Since Anderson’s synthesis, Bergstrand (1985,
1989), Helpman and Krugman (1985), and Deardorff (1998) have also contributed to
improvements of the theoretical foundation of the gravity model. In these studies, the gravity
equation was derived theoretically as a reduced form from a general equilibrium model of
international trade of final goods. The micro-foundation approach also claimed that the crucial
assumption of perfect product substitutability of the ‘conventional’ gravity model is unrealistic as
evidenced in recent times has shown that trade flows are differentiated by place of origin.
Exclusion of price variables leads to misspecification of the gravity model. Anderson (1979),
Bergstrand (1985, 1989), Helpman and Krugman (1985), and others agreed with this view. Hence,
this new legitimacy, or theoretical foundation in applying the gravity model for assessing
international trade flows, motivated this study’s reliance on an extended gravity model for the
purpose of analyzing the trade effects of SADC.
Gravity Model for the Present Study
The gravity model of bilateral trade hypothesizes that the flows of trade between two
countries is proportional to their gross domestic product (GDP) and negatively related to trade
barriers between them. Empirical works have provided a number of alternative specifications for
the gravity model.
In the context of international trade, the basic formulation of the gravity model equation is as
follows:
3 51 2 4
0ijt it jt it jt ij ijtX Y Y N N D U ………………………… (4)
For estimation purposes, the basic gravity model is most often used in its log-linear form.
Hence, this is equivalently written using natural logarithms as:
0 1 2 3 4 5ln ln ln ln ln ln ln lnijt it jt it jt ij ijtX Y Y N N D U …….……… (5)
where notation is defined as follows:
40 The Trade Flow Model: The potential supply of any country to the world market is linked systematically to (i) the
size of a country’s national or domestic product (simply as a scale factor), and (ii) the size of a country’s population. 41 Both the Pure Expenditure System Model (The simplest possible gravity-type model stems from a rearrangement of a Cobb-
Douglas expenditure system implying that identical expenditure shares and gravity equation income elasticities of unity), and the
Trade-Share-Expenditure System Model (While a gravity equation is produced by such a framework, the real variables of
interest are the non-income-dependent expenditure shares).

International Journal of African Development v.3 n.2 Spring 2016 73
ijtX = total bilateral trade between country
i to country j in year t;
jtN = population of country j in year t;
itY = GDP of country i in year t; ijtD = distance between two country i and j;
jtY = GDP of country j in year t; ijtU =log normal error term
itN = population of country i in year t; ln = the natural logarithm operator
Trade theories based upon imperfect competition and the Hecksher-Ohlin models justify
the inclusion of the core variables: basically, income and distance. However, most researchers
incorporate additional variables to control differences in geographic factors, historical ties,
exchange rate risk, and even overall trade policy for the fact that trade that flows between nations
can be affected by factors besides the core variables (GDP, population, distance). Hence, it is
common to expand the basic gravity model by adding other variables, which are thought to explain
the impact of various policy issues on trade flows.
In the case of gravity equations used to estimate the impact of regional trade arrangements,
dummy variables were added for each RTA under critical examination. Furthermore, in order to
avoid capture by these dummy variables and the impact of other influences on trade, other dummy
variables were added to control the common language and common border. Thus, the augmented
gravity model incorporated other variables, and thus, by introducing these variables in to equation
(21), the basic formulation of the model could be extended as follows:
0 1 2 3 4 5 6 7ln ln ln ln ln ln ln ln lnijt it jt it jt ijt ij itX Y Y GDPPC GDPPC GDPPCDIFF D IF
8 9 10 11 12 13 14ln ln ln lnjt it jt ij ij ij ij ijtIF TR TR CL Border SADCT SADCX U ….. (6)
Where,
IFi (j) = infrastructural level of trading nations at time t
CL = common language between country i and j;
itIM = import to GDP ratio of country i at time t which measures openness
jtIM = import to GDP ratio of country j at time t which measures openness
GDPPCit = GDP per capita income of exporting countries at time t.
GDPPCjt = GDP per capita income of importing countries at time t
GDPCDIFFijt = the per capita GDP difference between countris i and j at time t
Border = common border between countries i and j
SADC = regional dummy, takes the value one when a certain condition is satisfied,
otherwise zero.
The GDP per capita income was incorporated rather than population in equation (6).42
42 Because population is appropriate when aggregate export data is used for specific export product, GDP per capita income is
preferable. Although not exhaustive, our list includes most other variables used in the literature. Nonetheless, there is no agreement
on which variables beyond the core factors are included in the gravity model. Second, there are mixed results on the estimated
impact of each variable on bilateral trade.

74 http://scholarworks.wmich.edu/ijad/
Introducing regional dummy variables helped to estimate the trade effects of the SADC
regional bloc using equation (6), which is the interest of this study. Therefore, following Coulibaly
(2004), two dummy variables SADCTij and SADCXij, were introduced to capture intra-bloc and
extra-export effects of the SADC as a whole in the following way:
SADCT = 1 if both partner belongs to SADC, [other wise 0] (capturing intra-bloc trade)
SADCX = 1 if the exporting country i is a member of SADC and the importing country j belongs
to the ROW [zero otherwise] (capturing bloc exports to the ROW).
In the researchers’ estimates, SADCTIJ captured the total intra-regional trade bias. The
dummy SADCXIJ captured the extra-regional export bias where a negative and significant
coefficient indicated that member countries had switched to export to members rather than non-
members.43
Table 2
Data description and Hypotheses for Gravity Model Variables
Name of
variable
Expecte
d sign Measurement Source Remarks
GDP +ve In US dollars WDI-CD-
R0M (2008)
Growth in economic capacity boosts
trade flows
GDP per
Capita income +ve/-ve In US dollars
WDI-CD-
R0M (2008)
Because of economies of scale effect
and absorption effect
GDP per
Capita income
difference
+ve/-ve In US dollar WDI-CD-
R0M(2008)
Because of HO –Theory and Linder
hypothesis
Distance -ve In kilometers Indo.com/di
stance
seen as a restriction or friction to
trade
Infrastructure
index
+ve WDI-CD-
R0M(2008)
This index is computed using 4
variables from WDI database (2008).
Trade –GDP
ratio
+ve In US dollar WDI-CD-
R0M(2008)
Proxy indicator of openness
Common
language and
border
+ve World Fact
Book(2008)
sharing common language and
border is assumed to facilitate trade
activities among nations
Regional
dummy
SADCXIJ
SADCTIJ
+ve/-ve
+ve/-ve
capture the influence of regional
trading agreements on trade flows
among nations
43 This can be trade diversion which results in a member country preferring to export to members rather than non-
members.

International Journal of African Development v.3 n.2 Spring 2016 75
Data Description and Sampling Procedure
The majority of empirical literature on the gravity model used total bilateral trade flows as
dependent variable. However, Cernat (2001) suggested that the use of bilateral export flows for a
given pair of countries with total bilateral trade cannot distinguish between the impacts of RTA
formation on exports from non-members to RTA members and impacts on exports from the RTA
member to the non-members. For the present study, bilateral export flow (proxy for total bilateral
trade) was used as the dependent variable. This study covers a total of 30 countries. The countries
were chosen on the basis of importance of trading partnerships with SADC members and
availability of the required data. Eight countries of SADC (out of fourteen countries): Botswana,
Malawi, Mauritius, Namibia, South Africa, Tanzania, Zambia and Zimbabwe were incorporated
in the sample as reporter countries. However, all members of SADC were included as the partner
countries in the sample taken for this study to examine the level of intra-regional trade.44
Estimation Results and Analysis
Before proceeding to the discussion of empirical results, it should be noted that the current
empirical analysis differs in some important respects from many gravity models found in the
literature. The first stems from the way bilateral trade data was constructed.45
Tests
Different tests have been conducted to choose the appropriate estimation method for the
specified panel gravity model of equation (6) and for detecting endogeneity problems among the
explanatory variables. See details for random versus fixed effect tests in Appendix B, Table B2,
endogeneity of explanatory variables in Appendix B, Table B1, and Random Effect Estimator Vs
Instrumental Variables in Appendix B, Table B3. All estimates have also been checked for
heteroscedasticity.
Analysis of Results
Our workhorse gravity model equation (6) has been estimated using a random effect
estimation technique and by applying instrumental variables where it is justifiable with panel data
for the aforementioned reasons. It has been estimated by taking all variables separately for every
sector considered in this study. As Table 3 exhibits, when the agricultural commodities export
value was the dependent variable, except for common language, all variables were found to be
significant.46 Similarly, in regression results with fuel and mineral export value as the dependent
44 From the EU, ten countries were taken because they serve as major trading partners of SADC. These are UK,
Germany, France, Italy, Netherlands, Austria, Portugal, Belgium, Luxembourg and Spain. Next to the EU, Asian
countries are the second most important trading partner for the region. As a result, five countries were chosen from
Asian countries: India, China, Japan, Hong Kong and Indonesia. The USA is also included in the sample since it
takes the third position of SADC’s export destinations. 45 This study uses export values as the dependent variable for the aforementioned reasons. Furthermore, total export
value was disaggregated in four sectors. 46 While GDP per capita income coefficient for both trading partners was negative and significant, implying that increasing per
capita income in the exporting country results in the rise of the absorption capacity of the domestic market while increasing per
capita income in the importing country’s contribute to the economies of scale of the domestic industry.

76 http://scholarworks.wmich.edu/ijad/
variable, we found that all variables included in the regression were significant, but GDP and the
GDP per capita income for importing countries were only slightly significant.
Table 3
Regression Results of All Four Sectors Together
(Log of export value of each sector as dependent variable.)
Variable/Coefficients agri Fuel& min Hmanu Lmanu
logYIT .98*
(12.83)
1.23*
(8.01)
1.27*
(12.82)
.80*
(10.16)
logYJT .70*
(8.75)
.23***
(1.82)
1.08*
(12.91)
.87*
(10.31)
logGDPPCIT -.52*
(-5.99)
.78*
(3.76)
.14
(1.14)
.67*
(7.64)
logGDPPCJT -.37*
(-3.59)
.34***
(1.73)
-.11
(-0.89)
-.04
(-0.35)
logGDPPCDI .24*
(3.18)
-.32**
(-2.24)
-.09
(-0.95)
.15**
(1.99)
logDIJ -2.38*
(-9.96)
-.67**
(-2.23)
-1.38*
(-6.71)
-2.33*
(-10.19)
logIFIT 1.01*
(11.36)
1.23 *
(5.79)
1.25*
(11.53)
2.09*
(23.05)
logIFJT .21***
( 1.79)
.36**
(2.07)
.59*
(5.0 )
-.09
(-0.69)
logTRIT .21*
(4.45)
-.96*
(-4.67)
-.06*
(-6.10)
.42
(-7.62)
logTRJT -1.15
(1.24)
-2.57*
(-3.16)
-2.02
(-0.30)
-2.10**
(2.38)
CLIJ .13
(0.72)
-.83**
(-2.51)
.56*
(2.84)
.86*
(4.52)
BORDERIJ 1.80*
(7.07)
2.10*
(5.53)
2.35*
(8.54)
2.11*
(8.10)
cons 3.57
(1.03)
-3.65*
(-0.60)
-18.35
(-4.72)
-1.70
( -0.42)
Number of obs
Over all R2
1594
0.39
610
0.51
1542
0.44
1568
0.52
Note: agri = agricultural commodities export value, fuel & min = fuel and mineral export value, Hmanu = heavy
manufacturing export value, and Lmanu = light manufacturing export value. The numbers in Parentheses are t-values
and *, **and *** show at the 1%, 5% and 10 % significance level respectively. All variables except dummy variables
are in logs.
Unlike the regression results table of agricultural commodities export value sector model,
the GDP per capita income difference was found to be negative and significant endorsing Linder’s

International Journal of African Development v.3 n.2 Spring 2016 77
(1961) hypothesis that similar countries trade more with each other than dissimilar countries do.47
Again, when heavy manufacturing export value is on the left side of the regression equation (6),
all core variables of the gravity model, the GDP for exporting, as well as importing and distance
are consecutively significant with the anticipated positive and negative sign. Furthermore, with the
light manufacturing export value as the dependent variable, it is shown that the GDP of exporting
and importing countries, the GDP per capita income, and the infrastructural level index of
exporting countries and distance were found to be significant with the expected sign.48
Analysis for Regional Dummy Variables Results in All Sectors. When we come to the
variable interest of this study, the results in Table (7) below display that the regional dummies
effects vary from sector to sector. Referring to this regression result table, the intra-trade dummy
coefficient for the fuel and minerals sector as well as the heavy manufacturing sector model fits
with the expected positive sign and was found significant. The results suggest that the positive
sign of the intra–SADC dummy is associated with intra-bloc export creation for the two sectors
mentioned above. If two countries are members of SADC, an export flow between them is
8812% [exp{(4.49)-1} = 88.12] and 811% [exp{( 2.21)-1}=8.11] more than two otherwise
similar countries for the fuel and minerals and the heavy manufacturing sectors, respectively (see
Table 5). Nevertheless, the extra–SADC dummy coefficient for these sectors demonstrates a
negative sign implying that extra–SADC trade diversion in the fuel and minerals and heavy
manufacturing sectors is registered for the given sample year of study. One possible justification
for extra-trade diversion effects in the fuel and minerals and heavy manufacturing sectors might
be the exclusion of Angola from the sample of this study, which represents a significant share
and destining its market in fuels and minerals outside Africa. This may underestimate the trade
flow of fuel and minerals to nonmember partners.
For the positive intra- and negative extra–SADC trade in the heavy manufacturing sector,
one possible reason might be that manufactured goods from the SADC countries not only faced
high import barriers in the developed countries, but also were not competitive. This is equivalent
to saying that the SADC countries prefer to trade within the region because they realize their lack
of competitiveness in trading heavy manufacturing products in the global market. On top of this,
as incomes rise in southern African countries, consumers demand a greater choice in the variety
of products and increasingly sophisticated products. In the absence of capacity for local
production, increased demand for imports of such products provides an opportunity for South
African exporters of processed and highly valued products to take advantage of opportunities in
such markets which are exhibited in SADC’s fuel and minerals, and heavy manufacturing sectors.
47 This Linder hypothesis emphasis shows income similarity as the driver of trade instead of income differences. 48
Like in the agricultural commodities export value regression result, per capita GDP differential was shown to be significant and
had a positive sign, which again supports the H – O hypothesis in the light manufacturing export value model.

78 http://scholarworks.wmich.edu/ijad/
Table 4
Regression Results of Regional Trade Agreement Dummy Variables (2000-2007)
Variable/coefficients agri Fuel& min Hmanu Lmanu
SADCTIJ -3.51*(3.61) 4.49 *(5.13) 2.21* (-4.15) -1.95***(-1.94)
SADCXIJ 3.51*(3.61) -4.49*(5.13) -2.21*(4.15) 1.95***( 1.94)
Note: SADCTIJ takes the value unity when both countries are current members of the bloc. A positive coefficient
indicates trade creation. The regional dummy, SADCXIJ takes a value of unity only if the exporting country is a
current member of the bloc, and the importing countries are part of the ROW. A positive coefficient indicates an
open bloc, while a negative coefficient suggests trade diversion. The numbers in Parentheses are t-value and *,
**and *** show at 1%, 5% and 10 % significance levels, respectively.
However, the intra-regional dummy for the agricultural commodities exported and light
manufacturing sectors is unexpectedly negative which implies that countries located within these
regions do trade less with each other over and above the levels predicted by the basic explanatory
variables for the given sample years of this study. Put differently, there was intra-SADC export
trade diversion in the agricultural and light manufacturing sectors. With regard to the extra trade
dummy, Table 4 reveals a positive sign for the two sectors indicating that SADC‘s trade outside
of the region has grown at the expense of declining trade within the region itself, which is
interpreted as SADC’s openness (extra-SADC export trade creation) in agricultural commodities
and light manufacturing exports.
Table 5
Calculated percentage change equivalents in the respective estimated intra and extra dummy
coefficients of SADC (2000-2007)
Variable/coefficients agri Fuel& min Hmanu Lmanu
SADCTIJ -95 8812 811 -86
SADCXIJ 3244 -98 -89 603
Note: As the dependent variable is in logarithm form, the percentage effect of the dummy variables is calculated by
subtracting one from the exponent of the regression dummy coefficient shown in table 4 and then multiplying the
result by 100.i.e. [{exp (coefficient)}-1]*100.
One possible reason for the negative intra-SADC trade exhibited in the agricultural sector
might be the importance of the agricultural sector in SADC economies. The agricultural sector
plays a vital role in the economies of southern African countries, not only as a producer of food
but also as the largest employer of its population. Naturally, member states seek to protect their
sensitive sectors. International experience has indicated that the agricultural sector is the most
likely to give rise to major negotiating difficulties. Moreover, the absence of extra trade diversion
might be owing to the fact that many of the SADC members examined have not been able to fully
implement the intra-RTA tariff elimination schedules proposed in 1996. Additionally, most of the
members of SADC are small economies and rely on similar comparative advantages such as an

International Journal of African Development v.3 n.2 Spring 2016 79
agricultural dominant economy. Hence, it is not surprising to see the negative of intra–SADC trade
in this sector.
It was interesting to observe that the export value in agricultural commodities and light
manufacturing between two countries would increase by 3244% [exp{(3.51)-1} = 32.44] and
603% [exp{(1.95)-1} = 6.03] consecutively if there was not a bilateral trade agreement between
the countries, compared to the country pairs with bilateral trade ties. The estimates in Table 5
suggest that during the 2000-2007 periods, members of SADC traded with the rest of the world in
the agricultural and light manufacturing sectors by 32.44 and 6.03 more than they traded within
the region, respectively. The extent of intra-bloc export creation in SADC member countries was
much higher in fuel and minerals than in that of heavy manufacturing products. With regard to the
extent of extra–SADC export trade creation, it was larger in agricultural commodities and lesser
in light manufacturing products. The lowest level of intra–SADC trade was exhibited in the
agricultural sector while the highest level was recorded in the fuel and minerals sector. The reverse
was registered for the extra-SADC trade level.
Conclusion and Policy Implication
Conclusion
This paper has attempted to investigate the effects of a regional trade agreement for the
case of SADC’s trade with its major trading partners using an augmented gravity model when
disaggregated data is employed.
The results for other than the regional dummy factors in the gravity model of this study
paint a familiar picture of the findings in the gravity model literatures except that they vary from
sector to sector. Turning to the variable interest of this study, the regression results for the regional
dummy display a different sign and magnitude on SADC‘s export trade across the sectors
considered under the study. This implies that this study’s results for some sectors deviate from the
previous empirical findings for the same region. In general, the formation of the SADC regional
scheme enhances intra-regional trade in the fuel and minerals and heavy manufacturing sectors,
where as it reduces trade within the region in the agricultural commodities and light manufacturing
sectors. SADC’s trade with the ROW has increased in the agricultural commodities and light
manufacturing sectors, but has failed to increase extra trade in the fuel and minerals and heavy
manufacturing sectors owing to a regional integration effect. In a nutshell, intra-SADC export
trade creation has occurred in the fuel and minerals and the heavy manufacturing sectors where as
SADC maintains openness in agricultural commodities and light manufacturing product exports
which exhibits extra-SADC export trade creation in these sectors. In conclusion, as the study’s
findings confirm effects of regional economic integration using disaggregated data does really
matter as expected.
Policy Implication
An increase of trade among SADC countries will imply either an openness of the southern
African market, a changing of specialization of SADC countries, or a reduction of protection on

80 http://scholarworks.wmich.edu/ijad/
sensitive goods like agricultural commodities. The quality and strength of effective institutions in
SADC is also essential in overcoming obstacles for promoting greater trade. This helps facilitate
the implementation of trade protocol, and achievement of its final goals at the scheduled time.
It is also anticipated that with a reduction in tariff barriers and non-tariff barriers within the
region, there will be a rise in intra-regional trade in the SADC region. Elimination of trade barriers
and structural rigidities originating from adverse political relationships could also lead to a
substantial increase in intra-SADC trade. Regional national policy makers can also approach the
boosting of intra-trade in Africa by designing sectoral trade related agreement policies, which
again fasten regional economic integration to the highest level on the continent.
References
Aitkin, N.D. (1973). The effects of the EEC and EFTA on European trade: A temporal cross-
section analysis. American Economic Review, 63(5).
Anderson, J. (1979). A theoretical foundation of the gravity model. American Economic Review,
69(1).
Anderson, J., & Van Wincoop, E. (2003). Gravity with gravitas: A solution to the border puzzle.
American Economic Review, 93(1), 170-192.
Balassa, B. (1967). Trade creation and trade diversion in the European common market, in B.
Balassa (ed.), Comparative Advantage Trade Policy and Economic Development. New
York, NY: University Press.
Baldwin, R. (1997). Review of theoretical developments on regional integration. In A. Oyejide, I.
Elbadawi, & P. Collier, Regional Integration and trade liberalization in Sub-Saharan
Africa, Vol. I: Framework, Issues and Methodological Perspectives. New York, NY: St.
Martin’s Press.
Baldwin, R. E. & Venables, A. J. (1995). Regional Economic Integration. In G. Grossman & K.
Rogoff (eds.), Hand Book of International Economics, Vol. 3. 1597-1644. North Holland,
Amsterdam: North-Holland Publishing Company.
Bergstrand, J. (1985). The gravity equation in international trade: Some microeconomic
foundations and empirical evidence. The Review of Economics and Statistics, 67(3), 474-
481. DOI:1.
Bun, M. J. G. & Klaassen, F. J. G. M. (2002). The Importance of dynamics in panel gravity models
of trade. (Discussion Paper: 2002/18). Department of Quantitative Economics, Faculty of
Economics and Econometrics, University of van Amsterdam, Roetersstraat 11.
Carbaugh, R. J. (2004). International economics, 9th edition. Australia: South-Western.
Cernat, L. (2001). Assessing Regional Trade Arrangements: Are South –South RTAs More Trade
Diversion? Policy Issues in International Trade and Commodities Study Series No. 16.
Retrieved from http://ssrn.com/abstract=289123.
Chauvin, S & Gaulier, G. (2002). Regional trade integration in Southern Africa. CEPII working
paper No2002-12.

International Journal of African Development v.3 n.2 Spring 2016 81
Cilliers, J. (1995). The evolving security architecture in Southern Africa. Africa Security Review,
4(5).
Clausing, K.A. (2001). Trade creation and trade diversion in the Canada-United States free trade
agreement. Canadian Journal of Economics 34, 677-96.
Cline, W. R. (1978). Benefits and costs of economic integration in CACM. In W. R. Cline, & E.
Delgado (eds.), Economic Integration in Central America. Washington: The Bookings
Institution.
Coulibaly, S. (2004). On the assessment of trade creation and trade diversion effects of developing
RTAs. Paper Presentation at the 2005 Annual Meeting of the Swiss Society of Economics
and Statistics on Resource Economics, Technology, and Sustainable Development.
Frankel, J. A., & Wei, S. (1995). European integration and the regionalization of world trade and
currencies: economics and politics. In B. Eichengreen et al. (eds.). Monetary and Fiscal
Policy in an Integrated Europe. New York: Springer.
Geta, A. (2002). Finance and trade in Africa: Macroeconomic Response in the World Economy
Context. Palgrave: McMillan.
Geta, A. & Kibret, H. (2002). Regional economic integration in Africa: A review of problems and
prospects with a case study of COMESA. (Working Paper). Addis Ababa University,
Department of Economics, Addis Ababa, Ethiopia.
Glick, & Rose. (2002). Does a currency union affect trade? The time-series evidence. European
Economic Review, 46(6), 1125-1151.
Haaland, J., & Norman, V. (1992). Global production effects of European integration. In L. A.
Winters (ed.), Trade Flows and Trade Policy after 1992. Cambridge: Cambridge
University Press.
Hausman, J. (1978). Specification tests in econometrics. Econometrica, 46(6), 1251-1271.
Keck, A. & Piermartini, R. (2005). The Economic Impact of EPAs in SADC Countries. WTO Staff
Working Paper ERSD-2005-04.
Krueger, A. O. (1999). Trade creation and trade diversion under NAFTA. (NBER Working Papers
No. W7429). National Bureau of Economic Research. New York.
Lewis, J. D. 2001. Reform and opportunity: the changing role and patterns of trade in South Africa
and SADC. Africa Region working paper series; no. 14. Washington, D.C.: The World
Bank.
Linder, S. B. (1961). An essay on trade and transformation. New York: John Wiley and Sons.
Linneman, H. (1966). An Econometric Study of International Trade Flows. North Holland,
Amsterdam: North-Holland Publishing Company.
Lloyd, P.J. & MacLaren, D. (2004). Gains and losses from regional trading agreements: a survey.
Economic Record, 80(251), 445–467.
Maasdorp, G. (1999). Regional Trade and Food Security in SADC. Imani-Capricorn Economic
Consultants (Pty). Durban, South Africa.
Matyas, L. (1997). Proper econometric specification of the gravity model. The World Economy,
20(3), 363-368. DOI: 10.1111/1467-9701.00074.

82 http://scholarworks.wmich.edu/ijad/
McCarthy, C. (2004). The new Southern African Customs Union Agreement (SACUA),
Challenges and prospects: A preliminary review in monitoring regional integration. In
Namibian Economic Policy Research Unit (NEPRU). Windhoek , Namibia.
Mckitrick, R. (1998). The econometric critique of computable general equilibrium modeling: The
role of functional forms. Economic Modelling, 15(4), 543-573.
Milner, C. & Sledziewska, K. (2008). Capturing regional integration effects in the presence of
other trade shocks: The impact of the Europe agreement on Poland’s imports. Open
Economies Review,19(1), 43-54.
Romalis, J. (2005). NAFTA’s and CUSFTA’s impact on North America trade. NBER Working
paper 11059. National Bureau of Economics Research.
Schwanen, D. (1997). Trading up: The impact of increased continental integration on trade,
investment and jobs in Canada. Commentary - C.D. Howe Institute, (89), 1-30.
Viner, J. (1950). The customs union issue. Carnegie Endowment for International Peace.

International Journal of African Development v.3 n.2 Spring 2016 83
Appendices
Appendix A: Description and Aggregation of Sectors Based on Keck and Roberta Pier
Martini (2005)
Traded commodities are divided in the following four sectors (Sector Aggregation)
Agricultural
commodities
Animal agriculture, i.e. animal products n.e.c.; raw milk; wool,
silkworm cocoons; cattle etc.; meat; meat products,
Sugar cane and beets, paddy rice; wheat; cereal grains n.e.c.; oil
seeds; crops n.e.c.; vegetables, fruit, nuts, food products, i.e.
vegetable oils and fats; dairy products; processed rice; food
products n.e.c.; sugar; beverages and tobacco products
Fuel and minerals Fuels and minerals, i.e. coal; oil; gas; minerals n.e.c.;
Heavy manufacturing Heavy manufactures and metals, i.e. chemical, rubber and plastic
products; paper products and publishing; wood products;
petroleum, coal products; mineral products n.e.c.; metals; ferrous
metals; metals n.e.c.; metal products
Light manufacturing Light manufactures, i.e. motor vehicles and parts; transport
equipment n.e.c.; electronic equipment; machinery and equipment
n.e.c.; forestry; fishing; manufacture n.e.c.
Source: COMTRADE CD-ROM DATA BASE

84 http://scholarworks.wmich.edu/ijad/
Appendix B: Test Tables
Table B1
Multicollinearity Test
Original R2=0.43 Original R2=0.51 Original R2= 0.44 Original R2=0.55
Dependent
Variable agri Fuel& min Hmanu Lmanu
logYIT 0.61 0.61 0.61 0.61
logYJT 0.89 0.89 0.89 0.89
logGDPPCIT 0.60 0.60 0.60 0.60
logGDPPCJT 0.85 0.85 0.85 0.85
logGDPPCDI 0.77 0.77 0.77 0.77
logDIJ 0.84 0.84 0.84 0.84
logIFIT 0.36 0.36 0.36 0.36
logIFJT 0.75 0.75 0.75 0.75
logTRIT 0.58 0.58 0.58 0.58
logTRJT 0.86 0.86 0.86 0.86
CLIJ 0.33 0.33 0.33 0.33
BORDERIJ 0.46 0.46 0.46 0.46
SADCTIJ 0.90 0.90 0.90 0.90
SADCXIJ 0.90 0.90 0.90 0.90
Note: agri = agricultural commodities export value; fuel&min = fuel and minerals export value; Hmanu = heavy
manufacturing export value; and Lmanu = light manufacturing export value.
* All R2’s are from random effect regression results.
Implication: the above four sectors’ models are not free from multicollinearity problem
Table B2
Model Selection Test- Fixed vs Random Effect Models
Test type agri Fuel& min Hmanu Lmanu
Hausman 2 (13)=-27
(p= -27.87)
2 (13)=-30
(p= -30.55 )
2 (13)=-5.7
(p= -5.70 )
2 (13)=41
(p=0.001)
Significance level At any level At any level At any level At 1%,5%&10%
Decision For H0 For H0 For H0 ForH1(againstH0)
* Where H0: random effect estimator is consistent
H1: fixed effect estimator is consistent
* High (low) Hausman test prefers fixed (random) effect.
Conclusion: except light manufacturing sector, all sectors model justified random effect in both tests.

International Journal of African Development v.3 n.2 Spring 2016 85
Table B3
Hausman Test for Random Effect Estimator Vs Instrumental Variable
Test type agri Fuel& min Hmanu Lmanu
Hausman 2 (14 )= 23.89
(p= 0.0473)
2 (14 )= 0.94
(p= 1.0000)
2 (14)= 16.38
(p= 0.2906)
2 (14)= 28.41
(p= 0.0125)
Significance
level
Significant at
5% and 10%
Insignificant at
any level
Insignificant at
5%and10%
Significant at
5%
Decision For H1 For H0 For H0 For H1
* Where, H0: random effect estimator is consistent
H1: using instrumental variable is appropriate
** Conclusion: using instrumental variable is justified for Model I and Model IV. Models II and III prefer the random
effect estimator.

86 http://scholarworks.wmich.edu/ijad/
Why Regional Integrations Succeed or Fail in Africa
Martin Namasaka, London School of Economics and Political Science Alumnus
Abstract
The question of why some regional integrations succeed and others fail remains
unresolved. This paper goes beyond proximate factors advocated by most studies.
It examines the importance of initial conditions and argues that structural change
in the fundamental sectors of the economy must have taken place in all, or at least
a few, countries seeking closer ties. A comparative case study analysis of the East
African Community (EAC) and the Southern African Development Community
(SADC), guided by the political settlements theoretical framework, confirms the
hypothesis: Structural transformation stimulates the kind of conditions required to
create incentives for countries to demand regional integration and succeed in
achieving it. These findings have important implications for most developing
countries that see regional integration as a panacea for the uneven structure of
global trade and investment.
Keywords: EAC, SADC, COMESA, regional integration, Africa
The importance of the debate on regional integration to global development does not need
much emphasis, due to the increasing number of regional integration experiments over the past
five decades, and the growing concern of uneven development generated by forces of
globalisation. Several arguments have been made citing the significance of regional grouping,
including the potential expansion of market size, maximisation of scale economies, increased
regional trade and investment, and so forth (Brülhart & Torstensson, 1996; Mattli, 1999). While
these arguments are indisputable, particularly in the context and circumstances of developing
countries such as those within the Common Market for Southern Africa (COMESA) with the
intention of catching up with their developed counterparts, one may wonder why there are so few
success stories of functional regional integrations.
The Debate on Regional Integration to Global Development
Extant scholarly literature has attempted to address this question, thus engendering diverse
perspectives. Neofunctionalists attribute success of regional integration to a gradual emergence of
cross-country interests that, in the long term, create an international constituency resulting in the
formation of supranational institutional structures that drive and bring countries closer (Schmitter,
2004; Strøby & Jensen, 2000; Eichengreen, 2006). Others have argued that integration results from
the convergence of interests among heads of government that emanates from bargains reached on
issues of common interest (Moravcsik, 1995; Wiener & Diez, 2004). Economists see regional

International Journal of African Development v.3 n.2 Spring 2016 87
integration as an incentive driven process, mainly motivated by the desire among countries to
remove impediments in cross-border transactions in order to maximise economies of scale from
international trade and investment (Balassa, 2013:4; Rivera-Batiz & Romer, 1990).
However, Mattli (1999), in his seminal work titled, The Logic of Regional Integration, has
criticised the above theoretical claims by arguing that they fail to account for the verisimilitudes
that are typically common among regional integration processes that are, failure, stagnation and
success. He proposes a comprehensive and compelling theoretical framework that utilises a market
approach. He draws on insights from institutional theory to argue that for integration to succeed,
demand and supply side conditions must be satisfied. By demand side, he points out that the
existence of cross-border externalities affecting trade and investment creates the incentive for
market players across various countries to demand ‘common rules, regulations and policies’ with
the view of reducing transaction costs and thus maximising scale economies.
However, Mattli (1999) continues that this is not enough. Supply side conditions must also
be met in the form of formation of commitment or supranational institutions to coordinate the
integration process, and thereby deal with the potential free riding and collective action problems
common among integrations. In addition, an undisputed leader must emerge to coordinate the
integration process as well as serve as a paymaster for the potential losers from the integration.
Hence, only when the demand and supply side conditions are fulfilled, Mattli (1999) asserts, will
the regional integration process succeed.
Despite the contribution made by the current literature on understanding regional
integration dynamics of success or failure, its conclusions remain questionable because of one
main problematic assumption. The analysis and subsequent theory development draw extensively
and exclusively on the analysis of the European Union which is a union involving mainly
developed countries with political and economic characteristics vastly different from those of
developing countries. Therefore, the conclusions emerging from this kind of analysis cannot
cogently be applied to integration experiments involving mainly developing countries.
Particularly, it is unwise to assume away the importance of differences in the contexts (initial
conditions) between developed and developing countries and their influence in shaping regional
integration outcomes differently.
This paper attempts to correct this theoretical mistake by examining the importance of
initial conditions, particularly differences in levels of development of sectors among countries
seeking closer ties in determining the level of success or failure of regional integration.
Specifically, in reference to Mattli’s (1999) arguments, the paper engages directly with the
question of under what conditions does the desire to reduce cross-border transaction costs actually
result in harmonisation of cross-border trade rules, regulations and policies. How does the
undisputable leader emerge? And what distinguishes the leader from the rest of the other partner
states? Why do regional institutions that are created to coordinate the integration process exercise
authority differently in different regional integration experiments?
The argument is that structural change in the fundamental sectors of the economy must
have taken place in all, or at least a few, countries seeking closer ties to stimulate the kind of

88 http://scholarworks.wmich.edu/ijad/
conditions required to create incentives for countries to demand regional integration and succeed
in achieving it. Structural change (SC) or structural transformation (ST), that is to say, the shift in
resource allocation within the economy from low productive sectors like agriculture to high
productive sectors such as industries and services (Rodrik, 2010), unleashes social, political and
economic forces that eventually enhance countries capacity to demand and implement integration.
For example, the organisational breadth and complexity that comes with an industrialising society
tends to expand their production capabilities. This increases product space (Hausmann & Klinger,
2006), consequently, raising the scope and possibility of negotiations, and, thus, compromises the
increased likelihood of specialisation in sectors in which each country exhibits comparative
advantage. In addition, ST also increases the reach of the formal sector which is central to the
institutionalisation of political power (Khan, 2010), a vital element in effective formulation and
implementation of national as well as regional rules, regulations and policies.
Therefore, the argument touted by this paper does not reject Mattli’s (1999) argument, but
rather builds on it. It goes further to incorporate and illuminate the central contribution of insights
from structural transformation and political settlement literature to cement explanations provoked
by Mattli’s (1999) demand and supply side approach. A Comparative Case Study Analysis of the
East African Community (EAC) and the Southern African Development Community (SADC) in
section four demonstrates the existence of inhibitive constraints to cross-border trade and
investment as well as the existence of regional institutions which do not create strong incentives
to demand and sustain regional integration as Mattli (1999) suggests. These constraints must be
considered within the context of initial conditions of countries seeking closer ties.
If the integration is among countries with seemingly similar levels of underdevelopment,
there will be low incentive for harmonising rules, regulations and policies because such countries
are likely to benefit less from each other (Ravenhill, 1979). Moreover, the political challenges of
economically backward societies always lead to deinstitutionalised use of power (Khan, 2010),
which will undermine the exercise of authority by regional institutions. However, if some of the
countries within the integrations arrangement have more developed economies, the incentive for
deeper integration will be stronger, and this often runs symmetrically. That is, the undeveloped
countries see ‘working’ with the developed countries as a quicker way out of their
underdevelopment, and the developed countries similarly see the less developed countries as a
source of inputs and market for their manufactured products. This confluence of interests creates
a very strong incentive for regional integration to succeed.
Before we proceed, a couple of caveats are in order. Regional integration is a lengthy and
broad process that consists of several stages including free trade, customs union, common market,
monetary union and the political union (Balassa, 2013). This paper discusses regional integration
in the context of creating Free Trade Areas (FTA) as well as a common market such as the
Common Market for Eastern and Southern Africa (COMESA). Secondly, due to time and space
constraints, the paper does not delve into the debates on what facilitates or impedes structural
transformation in many developing countries. Those debates are well elaborated elsewhere pitting

International Journal of African Development v.3 n.2 Spring 2016 89
state versus market arguments,49 the role of structural adjustment programmes in developing
countries,50 trade and industrial policies in developing countries,51 and the role of institutions in
development.52
Finally, this paper defines regional integration as the creation of common rules, regulation
and policies across different countries. The rest of the paper is structured as follows: Section Two
undertakes a critical review of the theoretical arguments on why some regional integrations
succeed and others fail. Under this section the paper develops an alternative conceptual framework
that complements and solidifies Mattli’s (1999) demand and supply approach; Section Three
discusses the methodology applied to examine the central question of this paper and highlights
possible limitations; Section Four analyzes two case studies generating insights to illustrate and
validate the analytical framework developed in Section Two; Section Five discusses the key
findings in the context of Late Developing Countries’ (LDCs) underdevelopment characterised by
stagnation, absence or slow progression of structural change, but nonetheless continue to
optimistically see regional integration as a viable route out of their underdevelopment; Section Six
concludes the findings.
Literature Review
The Peace Argument
The peace argument has been made in the context of the European integration. The
claimants of this theory argue that “politicians haunted by the horrors of the Second World War”
were driven by the desire to bring to an end the relentless spiral of conflicts among European states,
and thought that a “novel structure of European governance” would be capable of solving the
problem (Higashino, 2004; Mattli, 1990). Indeed, it is often argued that the creation of the
European Coal and Steel Community under the auspice of the Shuman Act served this purpose
directly (Mattli, 1990:4-5). While the peace argument holds, there are a number questions that
challenge its theoretical underpinnings. For instance, why weren’t all European states involved in
the initial formation of the European integration? Particularly, why did Britain, Denmark and
Ireland join the European Community in 1973, and not earlier on like France and Germany did?
(ibid).
More fundamentally, the peace argument fails to account for why earlier regional
integration attempts in the 1800s in Europe failed to succeed. Wasn’t the fostering of peace as
important as the adherents of this argument says it was in the aftermath of the Second World War?
Due to this theoretical weakness, the peace argument fails to serve as a watertight explanation for
the regional integration because of its clear, logical inconsistencies.
49See Kohli, 2004; Chang, 2003; Rodrik, 2003; Williamson, 2000; Stiglitz, 1998. 50See Lall, 1995; Obrien, 1995; Mkandawire & Soludo, 1999. 51See Soludo et al., 2004; Rodrik, 2004; Evans, 1995; Chang, 1994; Wade, 1990. 52See North, 1980; 1990; Robinson & Acemoglu, 2012.

90 http://scholarworks.wmich.edu/ijad/
Neofunctionalism and inter-governmentalism
In the 1970s, two competing theories on regional integration emerged which were broadly
stated as neofunctionalism and intergovernmentalism. The neofunctionalism school of thought, a
successor and refinement of functionalism, begins with the central assumption that
supranationality is the only way nations manage to maximize welfare (Rosamond, 2000; Hooghe
& Marks, 2009). The theory then goes ahead to explain how the creation of supranational
institutions is an inevitable outcome catalysed by cross-border economic transactions among
nations (Pollack, 2001). The theory attributes regional integration to the role of economic actors
across countries. It is argued that their interaction creates functional pressure for the integration
of related economic sectors (Rosamond, 2000; Streeck & Schmttter, 1991; Mattli, 1990). In the
long run, the theorists add that the desire of different cross-border social interests to maximize
material interests [compels them] to shift loyalty from “the national form of authority to more
meaningful authority at the supranational level” (Rosamond, 2000:52).
Despite the theoretical salience that the neofunctionalist argument received in the 1970s,
its robustness has come under question because of its underlying assumptions. First, its central
assumption that supranationality is the only method by which states secure maximum welfare fails
to provide a theoretical account of the linkage between welfare maximisation and regional
integration (Mattli, 1990). Second, while the theory nicely explains how cross-border economic
actors create the impetus for regional integration, it fails to explain how the cross-border economic
actors emerge in the first place. In addition, experience from various integration experiments
indicates variations of success, stagnation and failure. Therefore, a theory that attributes integration
to the contribution of economic actors should be able to coherently and consistently account for
all these verisimilitudes. Neofunctionalism falters with regard to this intellectual requirement.
Thus, while the neofunctionalist theoretical argument offers us an intuitive way to think about how
different national actors can induce and drive the integration process, it fails to provide a logical,
robust case for why some regional integration experiments succeed and others do not.
Intergovernmentalism emerged as a direct counterargument to neofunctionalism. It departs
from the former by arguing that integration is achieved after reaching a series of bargains between
the heads of governments of the leading states in a region (Hooghe & Marks, 2009; Mattli, 2009;
Moravcsik, 1995; Wiener & Diez, 2004). The theory is predicated on the assumption that political
leaders are often very protective of their national sovereignty, and will tend to sagaciously thwart
any sacrifice of national sovereignty that may become necessary in order to attain common goals
(Mattli, 1999). The theory proceeds to emphasise that, because big states tend to exercise defacto
veto over fundamental changes in the rules of integration, bargaining tends to converge in favour
of the large states’ interests, and small states’ losses are often compensated for with side-payments
offered by the big states. (Moravcsid, 1995).
However, the intergovernmentalism argument also suffers criticism due to its analytical
weaknesses. For instance, its perception of regional integration as a confluence of bargains
achieved by heads of governments overlooks the importance of ongoing socio-political and
economic processes, producing what Paul Pierson calls a “snapshot view of integration that is

International Journal of African Development v.3 n.2 Spring 2016 91
distorted in crucial respects.” (Pierson, 1995:126; cited in Mattli, 1990:29). Defining events that
precede the integration process are either overlooked or discounted, and those that proceed after
bargains are treated as irrelevant. In doing so, the theory assumes that the implementation of
interstate agreements is easy and automatic, which is not entirely true (Mattli, 1990).
But more critically, the theory fails to account for why some heads of government manage
to sustainably and effectively reach bargains and implement them, while others fail. Indeed, the
very nature of the integration process relies on and survives with continuity of negotiations among
member states in reaching bargains that facilitate institutional improvement to ensure sustainability
of the integration process. But why do some countries succeed and others often fail? In view of
these logical weaknesses, the intergovernmentalism argument fails to make a convincing case of
why some integration succeed and others fail.
Demand and Supply Side Conditions Argument
Mattli (1999) attempts to provide a more sophisticated argument regarding why integration
succeeds or fail. His theoretical argument adopts the demand and supply approach to explain
integration of states, thereby addressing the analytical weakness of intergovernmentalism that
overlooks the importance of socio-political and economic processes whilst providing a context that
adjudicates the centrality of supranationality that is emphasized by neofunctionalism. Building on
the literature of institutional theory, Mattli’s (1999) argument takes treaty signing as a given, and
instead dwells on explaining why integrating states often achieve varying degrees of success in
implementation of the integration treaty(ies). He claims that the demand and supply side conditions
must be satisfied.
Drawing on insights from the property rights theory, economic history and new
institutional economics, Mattli (1999) argues that on the demand side “regional institutional
building may be viewed as an attempt to internalise externalities [or reduce transaction costs] that
cross borders” (Mattli, 1990:12-13). Externalities affecting trade and investment within a region
arise from economic and political uncertainty as well as financial risks that market actors face
when transacting business with foreign firms and governments. According to Mattli (1999), the
cost of these externalities increases as new technologies raise the potential for gain from market
exchange, hence increasing the payoff to regional rules, regulations and policies which ameliorate
these costs.
However, demand is not enough. The theory emphasizes that supply side conditions must
be met. These are conditions under which political leaders are willing to accommodate
compromises for deeper integration. Leaders’ willingness, according to the theory, depends on the
expected payoffs from integration. The main assumption here is that leaders value political
autonomy and power, and that “their success in holding on to power depends on economic
management” (Mattli, 1999:14-15). “Therefore, leaders’ managing successful economies have a
lower incentive for regional integration because of the lower expected marginal benefit in the form
of retaining political power from further integration” (Mattli, 1999:41-55). On the other hand,

92 http://scholarworks.wmich.edu/ijad/
economic difficulties are likely to force political leaders to accept demands for regional rules,
policies and regulations from market players.
But, this is seldom a sufficient condition for a successful regional integration, Mattli (1999)
continues, because regional integrations are replete with collective action problems, specifically,
those related to commitment and coordination. This therefore necessitates the creation of
commitment institutions at the regional level to monitor enforcement of the integration rules,
policies and regulations. However, providing commitment institutions, no matter how efficient,
will not produce a successful integration because coordination problems also give rise to
distribution issues of equity and fairness. This, therefore, requires the emergence of what Mattli
(1999) calls an undisputed leader among states seeking closer ties to serve not only as a focal point
of coordinating rules, policies and regulations, but also as a paymaster in order to ease
distributional tensions among member states.
However, a critical examination of this theoretical argument reveals compelling analytical
weaknesses. First, the theory takes the nature of economies of states seeking closer ties as a given,
and renders no effort in analysing the likely implication in the performance of regional commitment
institutions that facilitate regional integration should the political and economic dynamics within
one or more member states change. Second, the assumption that cross-border transaction costs will
necessarily create the incentive for market players to demand regional rules, policies and
regulations is not entirely convincing.
Granted, evidence indeed suggests that most regional integration projects are motivated by
the need to reduce cross-border transaction costs (Viner & Oslington, 2014; Balassa, 2013), but
why is it that only a few regional blocs prioritise and indeed commit and implement measures to
reduce cross-border transaction costs? Perhaps, part of the explanation lies in the fact that the
decision to reduce transaction costs through harmonisation of cross-border rules is informed by
the expected benefits which are determined to a certain degree by the nature, density and
penetration of cross-border business interests among member states. But, what accounts for the
variation in the nature, density and penetration of business interests among member states?
Towards a Robust Conceptual Framework
The theoretical framework proposed below attempts to address the above concerns. It
builds on Mattli’s (1999) argument and applies insights from structural transformation and
political settlement literature to address the theoretical weaknesses within Mattli’s (1999) demand
and supply side approach pointed out above. This approach is important for two main reasons:
first, to account for variations that underpin different incentives among different integration
experiments, and second, to explain why regional institutions among different regional integration
projects exercise authority differently. Literature on political settlement is particularly vital with
respect to the latter.

International Journal of African Development v.3 n.2 Spring 2016 93
Theoretical Insights from Political Settlement Literature
The political settlement (PS) literature evolved to fundamentally challenge the standard
New Institution Economics (NIE) theoretical view on distribution of power and institutionalisation
of authority. The PS literature departs from NIE by drawing emphasis to the fact that given the
difference in the political and economic contexts between developing and developed countries,
institutional change cannot only be a function of enforcement of formal rules as the NIE posits
(Khan, 2010; Di John & Putzel, 2009). Developing countries, the PS theory argues, “have small
formal productive sectors and thus the incomes generated from these sectors do not and cannot
define the broad distribution of power in societies” (Khan, 2010:5).
Therefore, a political settlement argument implies a social order based on “political
compromises between powerful groups in society that set the context for institutional change and
other policies” (Khan, 2010:5; 1995). Thus, a stable and progressive political settlement “is a
combination of power and institutions that are mutually compatible and also sustainable in terms
of economic and political viability” (Khan, 2010:5). According to Khan (2010), if powerful groups
are getting a distribution of benefits that is too low given their relative power, or a new set of
institutions threaten to shrink their relative power and thus distributional benefits, these groups
will strive through different means, including conflict, to change or [thwart] institutions until they
are satisfied or give up” (ibid)
Therefore, different political settlements in various developing countries explain why
informal institutions structurally operate differently in different countries. In fact, informal
institutions are a euphemistical way of describing enormous exercise of informally organised
political power to generate distributions of benefits that could not be sustained by the operation of
formal institutions alone (Khan, 2010; 1995). These informal dynamics of political power
underpinned by the structural features of economies tend to have important implications on the
functionality of regional institutions tasked with the responsibility of rules enforcement agreed
upon by member states. This paper shall explore those implications in detail later, but first, let us
consider insights from the structural transformation literature.
Theoretical Insights from Structural Transformation Literature
Structural transformation involves irreversible shifting of resources from low productive
sectors of the economy such as agriculture to high productive sectors like industries (Cownie,
1974; Elliot, 1998). So why is structural transformation important for regional integration?
Resource allocation from agriculture to industry results in emergence and growth of organisational
complexity because the process involves higher levels of specialisation (Johnston, 1970). The
backward and forward linkages characteristic of an industrial economy further accentuates
organisational growth and development (Amsden & Hikino, 1994) which is central to expansion
of the formal sector and subsequent depersonalisation and institutionalisation of power (Khan,
2010). This is particularly important in the formulation and enforcement of institutions at the
national as well as regional level.

94 http://scholarworks.wmich.edu/ijad/
But, more importantly, as countries undergo structural transformation, industrialisation
increases “product space or the network of relatedness between products” (Hidalgo et al.,
2007:484). The resulting economies of aggregation, or clustering, that support large firms and
plants (Brett, 2015), increase intra-regional linkages that create what, perhaps, Mattli (1999) calls
the demand conditions for regional integration. This is likely to increase the penchant for regional
integration because of the expanded scope of specialisation given each country’s comparative
advantage.
Tying the Threads Together
Theoretical insights from the political settlement and structural transformation literature
equips us with the analytical tools for improving Mattli’s (1990) market oriented demand and
supply approach to integration. The theory proposed here argues that regional integration among
countries with relatively similar levels of underdevelopment (or countries with minimum levels of
structural transformation) is likely to fail because many of these countries are mostly producing
primary commodities (and thus have narrow product space with potentially competing products).
Therefore, the incentive for cross-border transactions among such countries is low because they
are likely to benefit less from each other under an economic union (see Ravenhill, 1979).
In addition, low levels of industrialisation also imply a small size of the formal sector
(Khan, 2010), and thus, low levels of organisational depth and complexity implying that
distribution of power and its use follows largely informal mechanisms described above. This will
tend to undermine the enforcement of a set of supranational rules, policies and regulations as they
must adhere to the delicate balance between informal power and a set of institutions consistent
with minimum levels of economic viability and political stability.
On the other hand, structural transformation resulting from industrialisation increases the
product space (Hidalgo et al., 2007) which fosters cross-border economic transaction among
nations through economies of aggregation, or clustering, that support large firms and plants (Brett,
2015). This also increases scope for specialisation consistent with each country’s comparative
advantage. The combined effect of this process creates the demand conditions for integration by
cross-border economic actors because of the expectedly large benefits from integration. In
addition, industrialisation deepens the organisational density network (Evans et al., 1993) as well
as contributes to the expansion of the formal sector, which in the long run depersonalises the
exercise of political power and instead institutionalises it. This process allows, sustains and
legitimises harmonisation and enforcement of common rules, policies and regulations among
countries seeking closer ties as is nicely illustrated in the conceptual framework developed in
Figure 1.

International Journal of African Development v.3 n.2 Spring 2016 95
Figure 1: Conceptual framework positing the importance of structural transformation to Regional
Integration.
This paper applied this hybrid theoretical framework to the analysis of the variation
between the performance of the East African Community (EAC) and the Southern African
Development Community (SADC) in Section 4, but before it does that, it sheds some light on the
choice of methodology selected for this study as well as considers its potential limitation in the
section below.
Methodology
This study utilised a comparative case study analytical approach to examine and explain
variations between two regional integration experiments, that is, the East African Community
(EAC) and the Southern African Development Community (SADC). The method was considered
useful and indeed appropriately suitable because of the following considerations. First, both
integration project reconfiguration started about the same time (in the early 1990s), albeit they had
had varying trajectories prior to that; second, they both generally constituted countries with almost
similar levels of economic development, with the exception of South Africa under SADC, but had
interestingly produced varying degrees of performance. Thus, accounting for these variations, the
method was conceived as critically central to generating nuances and insights with respect to the
debate of regional integration in general, but also for regional integration particularly in developing
countries.
A comparative case study approach allowed for an analysis of the complexity of the
phenomenon within its context drawing from a variety of sources (Stake, 2013; Hodkinson &
Hodkinson, 2001). This facilitated construction of an in-depth understanding of what was to be
Structural transformation
Reallocation of resources from
agriculture sector to industries
Increased product
space
Strong incentive
for cross border
business interests
Dem
and
co
nd
itio
ns
for
inte
gra
tio
n
Increased
organisational
breadth and
complexity
and expansion
of the formal
sector
Depersonalisation/
institutionalisation
of power
Su
pp
ly
con
dit
ion
s fo
r
inte
gra
tion
Harmonisation of rules, policies and regulations/regional
integration

96 http://scholarworks.wmich.edu/ijad/
studied, subsequently engendering diverse perspectives and hence allowing for conceptual and
theoretical development (Yin 2011). In the context of this study, the method was deemed
appropriate because it was intended to interrogate why some regional integration succeeded while
others failed. Therefore, a theory of success or failure of regional integration demanded that the
underlying explanations of what made it possible for some regionally negotiated cross-border trade
agreements to be effectively implemented while others would fail was questioned.
However, a potential limitation which might somewhat call the analysis and the consequent
conclusions reached into question was the fact that the study compared two regional integrations
with fundamentally different member representation. The EAC for example is a membership
regional organisation with a representation of only five member states53 while SADC comprises
fifteen states.54 These differences in membership might have had some unforeseen influence on
the functionality and performance of the two regional integrations that might not be captured
through the case study consideration. Nonetheless, comparing two cases with potentially similar
initial conditions, but have produced considerably varying performance, was analytically exciting,
promising potentially deductive findings to the debate of regional integration.
East African Community (EAC)
Analytical narratives: The rise, collapse and revival of EAC. The EAC dates back to
the early 1900s with the construction of the Uganda Railway that originally connected Kenya and
Uganda (Deya, 2007). Tanzania later joined the Community after the First World War, when
Germany lost all her colonies and the administration of Tanzania (then Tanganyika) was
transferred to the British government. The construction of the railway extension to Northern
Tanzania from Kenya symbolised the inclusion of Tanzania into the East African integration (ibid).
The institutions of the East African Community (EAC I) mainly included the East African
High Commission (EAHC), and the Governors’ conference that was periodically convened by the
governors of the three East African States to discuss matters of common interest. Indeed,
Hazlewood (1979:42) observed that:
...[Before independence], there had been closer integration among the three
member states symbolised by the creation of a custom union with a common
external tariff and free trade between the countries, common customs and
income tax administration, common transport and communication services
(railways, harbours, posts, telecommunications, airways), common research
services and a common currency.
In fact, even after the three states obtained independence from their British master, efforts
were made by the post-colonial presidents—Obote of Uganda, Kenyatta of Kenya and Nyerere of
Tanzania—to sustain the integration working arrangement (Gingyera-Pinycwa, 2007; Hazlewood,
53 Kenya, Tanzania, Burundi, Uganda and Rwanda. 54 Angola, Bostwana, Congo DRC, Lesotho, Madagascar, Malawi, Mauritius, Mozambique, Namibia, Seychelles,
South Africa, Swaziland, Tanzania, Zambia, and Zimbabwe.

International Journal of African Development v.3 n.2 Spring 2016 97
1979). This was reflected through the creation of the East Africa Common Services Organisation
(EACSO) which replaced the EAHC following the signing of the Treaty of East African
Cooperation that ultimately led to the formation of the first East African Community (Deya, 2007).
The latter was considered salient to redefine the East African integration away from its erstwhile
colonial status.
However, soon problems common to integrations operating under different polities began
to fester. It is worth noting from the outset that the East African integration that had been forged
during the colonial era survived and achieved measurable success mainly because it was
coordinated by a single coercive administration, and therefore, could not be expected to continue
unchanged into the period of independence (Hazlewood, 1979).
Perhaps the striking reflection of challenges common to managing economic unions under
different polities is the fact that by the time the Treaty of East African Cooperation was signed,
the common currency had been abandoned following the “failure of partner states to find an
acceptable system of East Africa-wide central banking and the operation of the customs union was
being seriously inhibited by quantitative restriction” (Hazlewood, 1979:42).
A political coup against President Obote of Uganda in 1971 further exerted stress on the
EAC I, as President Nyerere swore that he would never share “a discussion table with an
illegitimate leader” (Gingyera-Pinycwa, 2007). In 1977, the EAC failed to pass the Community
for the Financial Year 1977/78, after which Kenya opted out by establishing her own independent
airline, and Tanzania closed her borders to Kenya marking the end of EAC I (Mugomba, 1978;
Okello & Kirungi, 2011).
However, with support from the World Bank, attempts were made to save the Community
through the appointment of the Swiss diplomat Umbricht who eventually led a commission that
explored possibilities for saving the Community. The commission’s work climaxed into the
signing of the Division of Assets and Liabilities Agreement in 1984 by Presidents—Obote, Moi
and Nyerere. Article 14 of the agreement proposed that the three East African states explore future
ways of reviving the East African economic cooperation (Deya, 2007).
That time would surely come in 1992 when the three heads of state met and signed the
Agreement for the establishment of a Permanent Tripartite Commission for Cooperation (PTC)
(Okello & Kirungi, 2011). In November 1994, the Protocol on the establishment of a Secretariat
of the PTC was concluded by the three partner states, and in April 1997, a decision was taken by
the three East African governments to upgrade the PTC agreement into a Treaty, and in November
1999, a Treaty for the Establishment of the East African Community II was signed in Arusha; the
same Treaty also elevated the PTC Secretariat into the EAC Secretariat. Other regional institutions
were also created by the same treaty such as the East African Legislative Assembly (EALA) and
the East African Court of Justice (EACJ). The Treaty came into force in July 2000 after the
necessary ratification procedures were completed (Deya, 2007).
The customs union was later signed in 2006, and in 2009, the Common Market Protocol
was signed to harmonise policies, rules and regulations within the EAC II that enabled free
movement of capital, labour, as well as goods and services by 2015 (EAC, 2010). However, almost

98 http://scholarworks.wmich.edu/ijad/
six years after the signing of the common market protocol, little has been implemented by member
states to demonstrate creation of the common market. The most salience question that requires
interrogation is why.
Explaining cause of success and failure of EAC. As earlier mentioned, EAC I succeeded
to a large part because it was administered by a common coercive authority. This implies that
under different polities the game of integration played out differently contingent on the
considerations of benefits and costs for each country within the union. Accordingly, under EAC I,
negotiations and bargains under the EACSO and subsequently, the Treaty of East African
Cooperation faced resistance from Tanzania and Uganda, because it was firmly believed that,
given the initial conditions, the union stood to benefit Kenya. Hazelwood (1979:42) observed that:
The customs union [established during the colonial days] worked to the benefit
of Kenya as the most industrially developed country of the three and the
headquarters of various common services were established in Kenya, the
employment and income creating benefits of services were believed also to
accrue mainly there.
Uganda and Tanzania had a poorly developed residual capitalist class that even when the
independence settlement had established the EACSO to replace the EAHC and provided for
redistribution of revenue in favour of Tanzania and Uganda, this proved an inadequate solution as
restrictions began to be imposed on trade between the countries (Hazlewood, 1979).
Similarly, just like then, today Kenya’s economy maintains dominance (relative to other
countries seeking closer ties) characterised by a strong private sector thanks to a more advanced
human capital base, a diversified economy, and its leadership role in information technology
within the region (Kimenyi, 2014). Some scholars have attributed the strength of Kenya’s economy
mainly to the recent institutional reforms, resulting from the adoption of a new constitution that
provides for devolved governance (Mati, 2013; Kimenyi, 2014).
In contrast, other partner states have followed vastly diverging political trajectories with
serious ramifications to the transformation of their economies. In the case of Tanzania for example,
despite the country’s relative political stability since independence, the radical ideological
orientation to socialism under the Ujamaa policy pursued by President Nyerere sowed the seeds
for undermining the growth and development of the Tanzanian private sector which has
contributed to the country’s atrophied structural transformation (Eyakuze & Gitau, 2007; Kimenyi,
2014).
Uganda has had a major challenge with institutionalisation of power since independence
in 1962. In 1971, Uganda’s first President was ousted by Idi Amin. What followed was a
decimation of Uganda’s economy resulting from “eviction of Asians, nationalisation of private
enterprises, and [irrational] expansion of the public sector” (Brett, 2009:208; Kimenyi, 2014).
Amin was overthrown in 1978 by the Tanzanian invasion which helped to reinstate President
Obote to power. In 1984, Obote was again overthrown by General Tito Okello who ruled for six
months before he was ousted by the current President Yoweri Museveni in 1986. Museveni has

International Journal of African Development v.3 n.2 Spring 2016 99
ruled the country for thirty years as a quasi-military dictator presiding over a regime of fractured
political elites held together by a high level of political patronage and corruption (Green, 2008;
Golooba-Mutebi & Hickey, 2013).
Rwanda, another member of the EAC II, has been marred since independence by civil
conflict mainly between two ethnically polarised groups—the Tutsis and Hutus. The country
remains one of the five poorest countries in the world and has witnessed her growth and
development severely blighted by civil conflict. Rwanda is a geographically small country which
experienced a genocide in 1994 in which nearly half a million people perished. Although it has
since made an impressive economic recovery, its political leadership remains dominated by a
strongman with little or no existence of any kind of political opposition group (Kimenyi, 2014).
Thus, with exception of Kenya, it becomes clearer that the governments of countries
seeking closer ties continue to confront serious legitimacy challenges that point to a large problem
of institutionalisation of power. This, therefore, explains why regional institutions established to
coordinate the integration process wield no real clout to prevail in the affairs of individual states
(Ravenhill, 1979). Therefore, it is no small wonder that just like EAC I, the EAC II integration
process owes its drive and verve to relations between the regional political leaders with little, or
not much, support from the social and economic civil network within the region. This implies that
the process is vulnerable to, and indeed held hostage by, the camaraderie between political leaders;
suggesting that any change in the bonhomie among the leaders would ultimately bring the
negotiations to a grinding halt, perhaps similar to what happened in 1971 when President Nyerere
of Tanzania vowed never to share a discussion table with President Amin following a coup in 1971
against the government of President Obote.
Partly, as a result of these historic political challenges confronting the East African states,
their economies have remained poorly developed characterised by an undeveloped agriculture
sector specialised in production of primary commodities, which is partly reflective of their colonial
heritage (see Mkandawire, 2010). Although the EAC countries are moderately open thanks to the
liberalisation programmes implemented since 1990s, the countries have very low export capacities
(Drummond et al., 2015). A recent study by IMF shows that Kenya, the regional leader in terms
of exports, has an average of 14 percent export-to-GDP ratio, followed by Tanzania with 12
percent, and Uganda with 8 percent. Exports from Burundi and Rwanda have a much smaller
representation of about 4 percent and 6 percent of GDP respectively (Drummond et al., 2015).
The study also shows that EAC countries trade mostly outside the region with the European
Union as the largest export destination, and accounting for about one-third of total exports outside
the region, followed by Africa with 18 percent excluding the EAC, and developing Asia with 15
percent. This suggests that the EAC countries probably compete for the same markets, thus
reducing the incentive for regional integration through creation of a common external tariff.
Official statistics also indicate that trade with the EAC region remains modest and imbalanced (see
Figure 2). In particular, intraregional trade is dominated by large exports from Kenya to the other
countries, and with few imports from other neighbouring countries to Kenya.

100 http://scholarworks.wmich.edu/ijad/
Figure 2: East African Community: Foreign Trade, Percent of GDP, average for 2005-13
Source: IMF, Direction of Trade database; and IMF staff estimates and Drummond et. al (2015)
Although the implementation of the EAC customs union in 2005, and the common market
in mid-2010 somewhat reduced tariffs and nontariff barriers and is lauded for significantly
strengthening trade linkages among EAC countries, Table 1 shows that the time taken to export
and import have remained considerably high across all countries (Drummond et al., 2015). This is
mainly attributed to infrastructure constraints within the region, suggesting harmonisation of rules,
regulations and policies, and while important, might not be the most significant impediment to
cross-border trade within the region.
Table 1
Cost of Doing Business within the EAC
Country
Rank
Document
to Export
(no.)
Time
to
Export
(days)
Cost to Export
(US$/container)
Document
s to Import
(no.)
Time
to
Import
(days)
Cost to Import
(US$/container)
Tanzania 134 6 18 1040 10 31 1565
Kenya 121 8 26 2255 7 26 2350
Rwanda 52 8 29 3245 8 31 4990
Uganda 120 7 33 3050 9 33 3215
Burundi 159 10 32 2965 11 46 5005
Source: World Bank Doing Business Report, 2011 & 2015 cross border trade indicators

International Journal of African Development v.3 n.2 Spring 2016 101
In fact, recent business reports have only ranked Rwanda in 52nd position out of 185
countries, while other member states, that is Uganda, Kenya, Tanzania and Burundi, remain poorly
ranked in 120th, 121st, 134th and 159th, respectively. While several factors, such as resolving
insolvency, trading across borders, and paying taxes, have contributed to the poor performance of
the region relative to the rest of the world, the most critical bottlenecks remain: starting a business,
getting credit, getting electricity and registering property (World Bank, 2013). These all relate to
the frequently cited impediments to transformation in the structure of a country’s economies.
Therefore, this evidence further strengthens the argument that any pursuit of regional
integration with the expectation of success must be preceded by structural transformation. In fact,
the imbalance of intraregional trade in favour of Kenya attests to her superior manufacturing
relative to other countries in the region, which is explained by Kenya having achieved relatively
better levels of structural transformation of her economy. This fact is further strongly illuminated
by the comparative case study of SADC below.
Southern African Development Community (SADC)
Analytical Narratives: Origins and Progress of SADC. The formation of SADC owes
itself to the creation of frontline states during the anti-colonial struggle against white minority rule
that had dominated many states of southern Africa (Amos, 2010). However, as more and more
states won majority rule within the region, the strategy of the southern states had to change as well.
Following a 1979 meeting held in Arusha, Tanzania with nine member states, on 1st April 1980,
the Southern African Development Coordination Conference (SADCC) was founded in Lusaka,
Zambia with the signing of a statement of Strategy for Southern Africa titled: Towards Economic
Liberation with a clear objective of breaking the economic dependence of southern states from
South Africa. Although SADCC managed to access considerable external aid, and embarked on a
number of programmes and projects, it did not succeed in reversing the fundamental economic
dependence of many of its members on South Africa (ibid).
However, when it became clearer in the early 1990s that South Africa was headed for an
irreversible democratic rule, combined with changes in the global economy and regional
challenges such as severe droughts, on 17th August 1992, the heads of state of SADCC agreed to
turn SADCC into the SADC (Gibb, 1998). The SADC Treaty that the ten members signed on that
day entered into force on 5 October 1993 after it had been ratified by these member states. The
main focus was on deepening regional economic integration, which is increasingly being
vindicated by the joining of other member states, like Madagascar in 2004, Mauritius, Seychelles,
Democratic Republic of Congo and a few others, bringing the total membership to fifteen (Amos,
2010).
In accordance with the objective of deeper regional integration, SADC adopted a trade-
oriented approach that was nicely reflected in the formulation of a fifteen-year Regional Indicative
Strategic Development Plan (RISDP) with clear objectives of establishing the SADC Free Trade
Area (FTA) by 2008 with the cardinal aims of: “liberating 85% of the regional trade in goods;
completing negotiations for the establishment of the customs union by 2010; completing the

102 http://scholarworks.wmich.edu/ijad/
establishment of the SADC common market by 2015; establishing the SADC monetary union and
the SADC central bank by 2016; launching the regional currency and establishing an economic
union by 2018” (Peters, 2011). The heads of state that adopted the RISDP in 2003 agreed to a
gradual approach towards creation of the FTA with the aim of eliminating 85% of tariffs of all
intraregional traded goods by January 2008, and the tariffs for the remaining 15% of the sensitive
goods were to be eliminated by all member states until 2012 (Peters, 2011; Amos, 2010).
Taking note of some challenges to creation of SADC. The implementation of the trade
protocol faced challenges in its implementation since not all eleven member states that ratified the
protocol complied with the requirements of phasing down their intraregional tariffs and the training
of the custom officials (Amos, 2010). For example, an audit report on the implementation of the
SADC protocol on trade in 2007 found that four members, that is Malawi, Mozambique,
Zimbabwe and Tanzania, were not on schedule regarding implementation of their tariff reductions.
In 2010, a related audit report revealed similar delays in implementation of tariff reductions.
Malawi was reported to have maintained the same tariff levels as in 2004, while Zimbabwe
“requested for a derogation for the scheduled reductions until 2012-2014 due to economic
difficulties.” Partly as a result of these delays, the negotiations held at the SADC summit in
Windhoek, Namibia decided to postpone the creation of the customs union (Peters, 2011).
Explaining the Dynamics of Implementation of Trade Protocol. Peters pointed out that
the FTA was launched as envisaged in 2008, even though it had a few shortcomings. In fact, he
argued, that as far as the legally binding protocol on trade is concerned, the twelve SADC member
states that eventually acceded the protocol fulfilled their legal obligations, and the postponement
of the customs union in 2010 was necessary to resolve critical issues (Peters, 2011).
An interesting question is why SADC realised considerable success in implementation of
its trade protocol, yet EAC states have repeatedly failed? This paper demonstrates below that
SADC’s success is largely attributed to the leading role played by South Africa which of course
points to Mattli’s (1999) argument of an undisputed leader as necessary for regional integration.
But, this paper goes further to show that South Africa’s leadership might be perceived as inevitable
since it is economically more developed and a relatively stable democracy. More importantly, it
should be seen as incentive-compatible with the business interests of South Africa as well as those
of other member states.
South Africa and her Contribution to the Progress of SADC. As mentioned earlier, the
desire to break the economic dependence on South Africa had been the central motive for the
formulation of SADCC, a forerunner of SADC. South Africa had a well-developed diversified
industrial capacity through adoption of import substitution industrialisation policies, mainly
accelerated by the increasing alienation of SA by the global community during the apartheid era
(Lewis 2001). The growing economic power of South Africa then was perceived by the
neighbouring countries as a threat to their economic liberation (Amos 2010). Having overcome
one critical hurdle (the dominance of the white minority), the frontline southern states regarded
the formation of SADCC as central to attainment of their economic independence from South
Africa. However, again as mentioned earlier, little was achieved by SADCC member countries

International Journal of African Development v.3 n.2 Spring 2016 103
despite receipt of considerable external aid support, and subsequent implementation of several
projects and programmes. (ibid)
As South Africa (SA) overcame the asphyxiating chains of apartheid and moved steadily
to the path of democracy, SADCC was transformed into SADC following the ascension of South
Africa and soon it assumed the leadership of SADC. In view of these facts, an interesting question
would be: why was little achieved under SADCC and considerably a lot under SADC with the
ascension of South Africa? And why did the leadership of SADC suddenly fall to SA, (a
newcomer)?
South Africa had gone through considerable levels of economic structural transformation
characterised by development of diversified and robust economy with comparative advantage
almost in every industrial sub-sector from mining and extraction to manufacturing. The country
became an ‘economic gravitational pull’ for labour, goods and services within not only the
southern African region but also from the rest of the world (ROW). Moreover, the democratic
post-apartheid era did not only create a stable government and subsequently institutionalisation of
power, but it also resulted into a striking expansion of South African export market as many
neighbouring countries increasingly embraced a transforming SA. Specifically, SA’s
internationally uncompetitive products found their way into the markets of SADC member states
with poorly developed manufacturing sectors. In fact Ngepah (2014:495) observes that:
With its geostrategic position and economic size, contributing 71% of the SADC GDP
and 22% of its population, almost all the countries in the sub-region (especially the
landlocked ones) depend on South Africa for trade and transport (using its railways,
airports, seaports, road networks and other transit facilities).
As a result of SA’s ‘economic gravitational pull force’, intra-regional trade grew
significantly since 1980. Estimates suggests that the share of SADC exports to the region more
than tripled to 9.9 percent from 1995 to 1995 and then rose gradually to 12.1 percent in 2008, even
though large asymmetries in trade flows remain.55 (See Table 2)
Behar & Edwards (2011) utilises Knetter & Slaughter (2001) ‘quantity-based measure of
market integration to estimate the degree of export market ‘thickness.’56 Results in Table 2 suggest
that many SADC countries export a more diversified range of products to the SADC region than
to the rest of the world, which is indicative of the regionalisation of the SADC trade. For example,
Malawi exported 1008 distinct HS 6-digit products to the rest of SADC, but only 435 to the rest
of the world. Mauritius, Namibia, Mozambique, South Africa, Zambia and Zimbabwe, similarly
export a more diversified range of products to the rest of SADC. Thus, controlling for income
levels, results indicate that intra-SADC trade was found to be relatively high and diversified.
55 SA mainly dominates SACU trade. For example, roughly around 60-70 percent of SADC exports to the region are
sold to SACU (see Table 2), while 80-90 of SADC (excluding SACU countries) imports from the region are purchased
from SACU (see Table 2). The region is therefore more dependent on South Africa as a source of imports than as a
market for exports. 56 The intuition behind this technique is to measure the share of all possible products that a country actually exports;
generally, the lower the trade barriers between countries the higher the range of products traded.

104 http://scholarworks.wmich.edu/ijad/
Table 2
Share of SADC Trade in SADC Country Exports
SADC
member
states
1980
1985
1990
1995
1999
2003
2008
Proportion
from
SACU
2003
Proportion
from
SACU
2008
Angola 0.03 0 0.01 0.03 0.7 1.8 99.9
DRC 0.05 0.03 0.1 6 0.3 6.7 3.3
Malawi 12.4 15.4 1.6 17.2 16.9 20.1 21.8 74 50.4
Mauritius 1.4 0.1 1.2 1.4 1.4 2.1 11.3 76 32.8
Mozambique 1.1 0.3 0.2 32.1 17.41 24.6 17.2 74 65.4
SACU 0.7 2.8 2.5 10.7 11.5 9.7 10.5
Tanzania 5.2 0.1 0.5 1.4 7.4 9.4 17.2 45 55.7
Zambia 0.9 3.1 0.8 3.8 7.8 40.6 20.0 50 54.1
Zimbabwe 1.3 25 30.7 31.7 28 30.5 64.4 79 81.2
Seychelles 1.2
Madagascar 3.1
Intra-SADC 0.9 3.4 3.1 9.9 10 6.1 68 72.8
Excl. Angola, DRC, Madagascar and Seychelles 10.6 12.1 62.9
Source: Development Network Africa (2007) and Chauvin. S. and G. Gaulier (2002), and Behar, A., &
Edwards, L. (2011) updated to 2008 using HS6-digit data obtained from UNComtrade. Note: intra-SACU
is excluded. 2002 values used for Zimbabwe in 2003.
Therefore, the successful negotiation and implementation of FTA by SADC countries was
underpinned by these structural economic realities characterised mainly by high levels of intra-
regional trade, crucially enabled by South Africa’s economic gravitational force. Therefore any
form of discussion among states seeking closer economic ties reflected through the desire to
harmonise of rules, policies and regulations in order to reduce cross border transaction costs, with
the view to maximise scale economies is likely to succeed, if and only if, it is underpinned by some
form of deep economic integration among states seeking closer ties. As we have seen that depends
crucially on the level of structural development of economic sectors among various countries
which determines the incentive of countries to sacrifice political autonomy and national
sovereignty due to the expected economic benefits they would glean either in form increased
investment spill overs from a more developed country, or increased market for exports for
countries with more superior industrial capabilities. These results have important implications
particularly for developing countries which have perceived regional integration as a counterweight
mechanism for redressing the asymmetric economic relationships that have come to dominate
globalisation of the developed and the developing worlds.

International Journal of African Development v.3 n.2 Spring 2016 105
Table 3
Share of SADC Trade in SADC Country Imports
SADC
member
states
1980
1985
1990
1995
1999
2003
2008
Proportion
from
SACU
2003
Proportion
from
SACU
2008
Angola 0 0.6 0.8 7.1 10 6.5 99.9
DRC 0.4 1.6 1.1 18.1 31.5 42.8 3.3
Malawi 36.7 53 24.8 49.2 64.4 57.5 58.3 65 46.4
Mauritius 14.5 4.2 9.9 11.3 11.2 13.2 9.9 97 84.8
Mozambique 3.7 5 7.6 55.5 58.6 39.5 38.0 97 944.7
SACU 0.1 1.8 1.8 2.1 1.9 2.7 5.6 0.0
Tanzania 0.7 0.7 1.3 13.9 13.3 15 11.5 66 90.4
Zambia 1.2 10.9 7.9 49.1 65.5 65 59.1 95 74.1
Zimbabwe 8.3 31.7 33.1 51.2 51.2 56.1 76.1 94 91.8
Seychelles 10.7 55.6
Madagascar 9.3 72.1
Intra-SADC 1.6 4.7 5.1 9.9 10.2 12.3 90 80.3
Excl.Angola, DRC, Madagascar and Seychelles 10.6 12.3 78.8
Source: Development Network Africa (2007) and Chauvin. S. and G. Gaulier (2002), and Behar, A., &
Edwards, L. (2011) updated to 2008 using HS6-digit data obtained from UNComtrade. Note: intra-SACU
is excluded. 2002 values used for Zimbabwe in 2003.
Table 4
Export Thickness Measures for SADC Countries, 2008
Exporter
Total Products to: Average to each
SADC Country
World
SADC
ROW
Madagascar 1937 (37) 725 (14) 1821 (35) 89 (2)
Malawi 1122 (21) 1008 (19) 435 (8) 171 (3)
Mauritius 2564 (49) 2057 (39) 1831 (35) 216 (4)
Mozambique 1507 (29) 1137 (22) 952 (18) 148 (3)
Namibia 3448 (66) 3272 (63) 1703 (33) 611 (12)
Seychelles 511 (10) 182 (3) 440 (8) 19 (0)
South Africa 4667 (89) 4477 (86) 4286 (82) 2737 (52)
Tanzania 2183 (42) 1404 (27) 1672 (32) 214 (4)
Zambia 2216 (42) 2127 (41) 538 (10) 353 (7)
Zimbabwe 1768 (34) 1545 (30) 760 (15) 290 (6)
SADC Combined 4823 (92) 4704 (90) 4482 (86) 2965 (57)
Source: Behar & Edwards (2011)

106 http://scholarworks.wmich.edu/ijad/
Discussion
The analysis and findings in the preceding section provoke important considerations in the
debate on regional integration and oblige us to revisit the theoretical motivations of regional
integration among developing states. As we have seen, structural transformation or the nature of
the economy(ies) among countries seeking closer ties has serious implications in determining the
kinds of incentives and trade-offs countries confront in deciding whether or not to harmonise cross
border rules, regulations and policies on trade and investment.
But we have also seen that the mere harmonisation of trade and investment rules does not
in itself deliver regional integration. Rather, some form of ‘tacit economic integration’ among
neighbouring economies must have happened prior to considerations for harmonisation of cross
border trade and investment rules, regulations and policies to create the conditions and shape the
incentives for different countries contingent on the likely benefits that each country would glean
from operating under a common trading block. South Africa’s well developed and diversified
economy for example, has created the economic gravitational pull force for other members of
SADC that benefited not only from greater intra-regional trade linkages but also benefited from
using SA’s connecting infrastructure. On the other hand, while Kenya has a more developed and
diversified economy relative to other members of EAC, it is still very much in transition and hence
the weak business interests among the EAC countries.
Therefore, these findings call into question the recent arguments that support regional
integration in developing economies as a means through which they could enhance their capacity
to attract foreign direct investment (Te Velde & Bezemer 2006; Page 2000). The argument is often
premised on the assumption that harmonisation of cross border trade and investment rules, polices
and regulations would increase the prospect on maximising scale economies and thus incentivise
foreign investors to invest in a particular regional economy.
However, although there is indeed evidence to suggest that differences in trade and investment
rules partly constitutes an impediment to cross border trade among African countries, there is also
considerably enormous evidence that equally points to other pervasive structural constraints that
continue to impede not only attraction of foreign investment, but also domestic trade and
investment. These constraints include: infrastructure constraints, regulatory burden and other
micro-level institutional constraints such as those relating to port efficiency and policies affecting
the cost of entry (Johnson et al. 2007; Wilson et al. 2005; Njinkeu et al. 2008; Limão & Venables
2001). In fact, some studies have shown that micro-level institutions are often greater obstacles to
African trade than cross border tariff barriers (Portugal-Perez & Wilson 2009). These very
constraints largely (but not entirely) account for delayed structural transformation or
modernisation of different sectors of the economies of developing states.
The proposition for regional integration that focuses mainly on harmonisation of trade and
investment rules, policies and regulations either seriously discounts, or overlooks the criticality of
above mentioned impediments which continue to undermine the level of trade and investment in
developing countries, as well as the level and magnitude of domestic and cross border transactions.
Perhaps the existence of some form of cross border transactions among developing countries is

International Journal of African Development v.3 n.2 Spring 2016 107
often considered as something that can be catalysed to foster further integration. But as the EAC
and SADC cases have strongly illustrated, rules can further deeper integration but must also be
preceded by some considerable level of economic integration among countries seeking closer ties
characterised by deep business linkages across countries. Moreover, the fact that many of the
developing countries in several regional integration experiments face serious challenges in
reducing trade tariffs is reflective of the miniscule size and poorly developed capacity of several
sectors of their economies to generate direct taxes. As a result, most of these countries rely heavily
on trade taxes, significantly attenuating any likely accommodation of changes in the tax system
that comes with regional integration.
Any meaningful regional integration among developing states with a higher probability of
success must be informed by discussions that go beyond the traditional arguments for regional
integration which are often absolved from consideration of context. For developing countries, the
most immediate concern should be how to address the pervasive cost of doing business which
largely explains delayed structural change in these countries. This therefore suggests that
developing countries with intention to create closer ties should also consider recasting their policy
prioritisation to deal with infrastructure constraints as well as burdensome regulatory environment.
Recent initiatives such as joint negotiation and cooperation on regional infrastructure projects such
as the Standard gauge railway by the EAC countries could be one way to start (the East African
2013). Such initiatives would in the long run reduce the cost of doing business, stimulate economic
growth and transformation of various sectors of their economies and subsequently create
conditions and strong incentives for regional integration.
Conclusion
Existing theoretical literature on the dynamics of regional integration experiments has
drawn heavily from experiences of the European Union. This implies that conclusions cannot be
convincingly applied to reflect experiences of regional integrations among developing countries
with fundamentally different initial conditions. In fact, the emphasis on incentives that countries
confront, and the existence of supranational institutions as the foundation that determines whether
regional integrations will succeed or fail, although intuitively persuasive, it does little to account
for circumstances or conditions that shape incentives differently for different countries as well as
why established supranational institutions perform differently.
This paper has examined how different levels of structural transformation of key sectors of
economies for countries seeking closer ties shape incentives differently for various countries and
has demonstrated how also this determines the variation in the performance of regional institutions
set up to coordinate the integration process. The paper has shown that the inhibitive transaction
costs in form of differences in cross border investment and trade rules will not necessarily stimulate
deeper integration if unaccompanied by commensurate levels of return. This, to a greater degree
depends on the penetration of cross border business interests each country commands or is likely
to command under the integration dispensation which depends on the levels of development of the
sectors of the economies for countries seeking closer ties.

108 http://scholarworks.wmich.edu/ijad/
Regional integration is therefore not just symbolised by states agreeing to harmonise rules,
policies and regulations but actually their ability in enforcing them which depends on the power
and authority that regional institutions wield to impose their decisions on the member states. This
as we have seen depends on the legitimacy of the respect governments of member states but also
the incentive for member states have to sacrifice political autonomy and sovereignty. The
processes that generate the structural underpinnings for these conditions are shaped by the level of
development of different key sectors of the economy. These findings have important implications
for the many developing countries that see regional integration as panacea for the uneven structure
of global trade and investment. The enthusiasm towards regional grouping through harmonisation
of rules if unaccompanied by policy measures to transform their respective local economies, is
highly unlikely to generate any traction in challenging or even redressing the current structure
global trade and investment.
References
Alesina, A., Spolaore, E., & Wacziarg, R. (1997). Economic integration and political disintegration
(No. w6163). National Bureau of Economic Research.
Amos, S. (2010). Role of South Africa in SADC Regional integration: The making or braking of
the organization, The. Journal of International Commerce Law and Technology, 5(3), 124-
131.
Amsden, A. H., & Hikino, T. (1994). Project execution capability, organizational know-how and
conglomerate corporate growth in late industrialization. Industrial and corporate change,
3(1), 111-147.
Bachmann, V., & Sidaway, J. D. (2010). African regional integration and European involvement:
external agents in the East African Community. South African Geographical Journal,
92(1), 1-6.
Balassa, B. (2013). The Theory of Economic Integration. London,UK: Routledge.
Behar, A., & Edwards, L. (2011). How integrated is SADC? Trends in intra-regional and extra-
regional trade flows and policy (Policy Research working paper; no. WPS 5625). World
Bank Policy Research Working Paper Series.
Brett, E.A. (2015). Explaining the capitalist crisis, scale economies, imperfect competition and
uneven development. Retrieved from Angle: http://anglejournal.com/article/2015-06-
explaining-the-capitalist-crisis-scale-economies-imperfect-competition-and-uneven-
development/
Brülhart, M., & Torstensson, J. (1996). Regional integration, scale economies and industry
location in the European Union. Manchester, UK: University of Manchester
Buigut, S. K., & Valev, N. T. (2005). Is the proposed East African monetary union an optimal
currency area? A structural vector autoregression analysis. World Development, 33(12),
2119-2133.

International Journal of African Development v.3 n.2 Spring 2016 109
Busse, M. (2005). Trade effects of the East African community. The Estey Centre Journal of
International Law and Trade Policy, 6(1), 62.
Busse, M., & Shams, R. (2003). Trade Effects of the East African Community: Do We Need a
Transitional Fund? (Paper no. 240). Hamburg, Germany: Hamburg Institute of
International Economics
Chang, H. J. (1994). The political economy of industrial policy. London, UK: Macmillan.
Chang, H. J. (2003). Globalization, economic development and the role of the state. London, UK:
Zed Books.
Cownie, J. (1974). Agriculture, domestic manufacturing, and structural transformation: Assessing
economic development. African Studies Review, 17(01), 123-132.
Davoodi, H. R., Dixit, S., & Pinter, G. (2013). Monetary transmission mechanism in the East
African Community: An empirical investigation. IMF Working Paper No. 13/39
Di John, J., & Putzel, J. (2009). Political settlements: Issues paper. Department for International
Development (DFID) (Discussion Paper). Birmingham, UK: University of Birmingham.
Dresang, D. L., & Sharkansky, I. (1973). Public corporations in single–country and regional
settings: Kenya and the East African Community. International Organization, 27(03), 303-
328.
Drummond, M. P., Wajid, M. S., & Williams, M. O. (2015). The East African community: Quest
for regional integration. Washington DC: International Monetary Fund.
Eichengreen, B. (2006). On the sequencing of regional integration: General considerations and an
application to Asia. The North American Journal of Economics and Finance, 17(3), 329-
334.
Elliott, D. R. (1998). Does growth cause structural transformation? Evidence from Latin America
and the Caribbean. The Journal of Developing Areas, 32(2), 187-198.
Evans, P. B. (1995). Embedded autonomy: States and industrial transformation (Vol. 25).
Princeton, NJ: Princeton University Press.
Evans, P., Haggard, S., & Kaufman, R. (1993). The state as problem and solution: predation,
embedded autonomy, and structural change. In J. Hall (Ed.), The State: Critical Concepts
(pp. 386-423).
Gibb, R. (1998). Southern Africa in transition: prospects and problems facing regional integration.
The Journal of Modern African Studies, 36(02), 287-306.
Golooba-Mutebi, F., & Hickey, S. (2013). Investigating the links between political settlements and
inclusive development in Uganda: towards a research agenda (No. esid-020-13).
Manchester, UK: BWPI, The University of Manchester.
Green, E. (2008). District creation and decentralisation in Uganda (Working Paper 2(24)), Crisis
States Research Centre.
Hausmann, R., & Klinger, B. (2006). Structural transformation and patterns of comparative
advantage in the product space (CID Working Paper No. 128). Center for International
Development at Harvard University.

110 http://scholarworks.wmich.edu/ijad/
Hazlewood, A. (1979). The end of the East African Community: what are the lessons for regional
integration schemes? JCMS: Journal of Common Market Studies, 18(1), 40-58.
Hidalgo, C. A., Klinger, B., Barabási, A. L., & Hausmann, R. (2007). The product space conditions
the development of nations. Science, 317(5837), 482-487.
Higashino, A. (2004). For the sake of ‘peace and security’? The role of security in the European
Union enlargement eastwards. Cooperation and Conflict, 39(4), 347-368.
Hodkinson, P., & Hodkinson, H. (2001, December). The strengths and limitations of case study
research. Learning and Skills Development Agency Conference at Cambridge 1(1), 5-7.
Hooghe, L., & Marks, G. (2009). A postfunctionalist theory of European integration: From
permissive consensus to constraining dissensus. British Journal of Political Science,
39(01), 1-23.
Johnston, B. F. (1970). Agriculture and structural transformation in developing countries: a survey
of research. Journal of Economic Literature, 8(2), 369-404.
Khan, M. (2010). Political settlements and the governance of growth-enhancing institutions.
London: SOAS.
Kohli, A. (2004). State-directed development: political power and industrialization in the global
periphery. Cambridge: Cambridge University Press.
Lall, S. (1995). Structural adjustment and African industry. World development, 23(12), 2019-
2031.
Lewis, J. D. (2001). Reform and opportunity: The changing role and patterns of trade in South
Africa and SADC (Paper no. 22). World Bank.
Mati, J. M. (2013). Antinomies in the struggle for the transformation of the Kenyan constitution:
1990–2010. Journal of Contemporary African Studies, 31(2), 235-254.
Mattli, W. (1999). The logic of regional integration: Europe and beyond. Cambridge: Cambridge
University Press.
McIntyre, M. A. (2005). Trade integration in the East African Community: an assessment for
Kenya. (Working Paper WP/05/143). International Monetary Fund, 2005.
Mkandawire, P. T., & Soludo, C. C. (1999). Our continent, our future: African perspectives on
structural adjustment. Trenton, NJ: Africa World Press.
Mkandawire, T. (2010). On tax efforts and colonial heritage in Africa. The Journal of Development
Studies, 46(10), 1647-1669.
Moravcsik, A. (1995). Liberal intergovernmentalism and integration: a rejoinder. JCMS: Journal
of Common Market Studies, 33(4), 611-628.
Mugomba, A. T. (1978). Regional organisations and African underdevelopment: The collapse of
the East African Community. The Journal of Modern African Studies, 16(02), 261-272.
Ngepah, N. N. (2014). International trade and agricultural production: Evidence from the Southern
African Development Community sub-region. Development Southern Africa, 31(3), 494-
514.
North, D. C. (1986). The new institutional economics. Journal of Institutional and Theoretical
Economics (JITE)/Zeitschrift für die gesamte Staatswissenschaft (pp. 230-237).

International Journal of African Development v.3 n.2 Spring 2016 111
North, D. C. (1990). Institutions, institutional change and economic performance. Cambridge:
Cambridge University Press.
North, D. C. (1995). The new institutional economics and third world development. In J. Harris &
J. Hunter (eds.), The New Institutional Economics and Third World Development (pp. 17-
26). London, UK: Routledge.
North, D. C., Wallis, J. J., & Weingast, B. R. (2009). Violence and social orders: a conceptual
framework for interpreting recorded human history. Cambridge: Cambridge University
Press.
O’Brien, D. P. (1995). Structural adjustment programs in sub-Saharan Africa. Fletcher Forum of
World Affairs, 19, 115.
Page, S. (2000). Regionalism among developing countries. London, UK: Palgrave Macmillan.
Peters, C. (2011). Is SADC losing track. In A. Bösl, A. du Pisani, G. Erasmus, T. Hartzenberg, &
R. Sandrey (Eds.), Monitoring Regional Integration in Southern Africa Yearbook 10 (pp.
143-168).
Pollack, M. A. (2001). International relations theory and European integration. JCMS: Journal of
Common Market Studies, 39(2), 221-244.
Ravenhill, J. (1979). Regional integration and development in Africa: lessons from the East
African Community. Journal of Commonwealth and Comparative Politics, 17(3), 227-246.
Rivera-Batiz, L. A., & Romer, P. M. (1990). Economic integration and endogenous growth
(Working Paper No. w3528). National Bureau of Economic Research.
Robinson, J. A., & Acemoglu, D. (2012). Why nations fail: the origins of power, prosperity and
poverty. New York, NY: Crown Publishers
Rodrik, D. (2004). Industrial policy for the twenty-first century (Working Paper RWP04-047).
John F. Kennedy School of Government at Harvard University.
Rodrik, D. (2006). Goodbye Washington consensus, hello Washington confusion? A review of the
World Bank's economic growth in the 1990s: learning from a decade of reform. Journal of
Economic literature, 44(4), 973-987.
Rodrik, D. (2010). Structural transformation and economic development. Ankara: TEPAV
Rosamond, B. (2000). Theories of European integration. New York, NY: St. Martin’s Press
Schmitter, P. C. (2004). Neo-neofunctionalism (p. 3). In Wiener, Antje and Thomas Diez, eds.
European Integration Theory, Oxford: Oxford University Press
Shi, Y., & Falk, M. L. (2005). Structural transformation and localization during simulated
nanoindentation of a noncrystalline metal film. Applied Physics Letters, 86(1), 011914.
Soludo, C. C., Ogbu, M. O., & Chang, H. J. (2004). The politics of trade and industrial Policy in
Africa: Forced consensus? Trenton, NJ: Africa World Press.
Stake, R. E. (2013). Multiple case study analysis. New York, NY: Guilford Press.
Stein, H. (2003). Rethinking African Development. Rethinking Development Economics, 153, 156.
Stiglitz, J. E. (1998). More instruments and broader goals: Moving toward the post-Washington
consensus (p. 2). Helsinki: UNU/WIDER.

112 http://scholarworks.wmich.edu/ijad/
Streeck, W., & Schmttter, P. C. (1991). From national corporatism to transnational pluralism:
Organized interests in the single European market. Politics and Society, 19(2), 133-164.
doi: 10.1177/003232929101900202.
Strøby Jensen, C. (2000). Neofunctionalist theories and the development of European social and
labour market policy. JCMS: Journal of Common Market Studies, 38(1), 71-92.
Sweet, A. S., & Sandholtz, W. (1997). European integration and supranational governance.
Journal of European Public Policy, 4(3), 297-317.
Te Velde, D. W., & Bezemer, D. (2006). Regional integration and foreign direct investment in
developing countries. Transnational Corporations, 15(2), 41-70.
Viner, J., & Oslington, P. (2014). The customs union issue. Oxford: Oxford University Press.
Wade, R. (1990). Industrial policy in East Asia: Does it lead or follow the market?. In G. Gereffi
& D. L. Wyman (eds.), Manufacturing Miracles: Paths of Industrialization in Latin
America and East Asia (pp. 231-266). Princeton, NJ: Princeton University Press.
Wiener, A., & Diez, T. (2004). European integration theory (pp. 6-10). Oxford: Oxford University
Press.
Williamson, J. (2000). What should the World Bank think about the Washington Consensus? The
World Bank Research Observer, 15(2), 251-264.
Williamson, O. E. (2000). The new institutional economics: taking stock, looking ahead. Journal
of Economic Literature, 595-613.
World Bank. (2013). Doing business in the East African community: Smarter regulations for small
and medium size enterprises, (Working Paper #80645). Washington D.C: World Bank.
Yin, R. K. (2011). Applications of case study research. Los Angeles, CA: Sage.

International Journal of African Development v.3 n.2 Spring 2016 113
The Effect of Maternal Employment on Child Obesity
Bezawit T. Agiro, Western Michigan University
Abstract
Obesity has been a major concern for the United States and most other
industrialized countries over the past few decades. More than one third of children
and adolescents in the United States are obese or overweight. Child obesity is of
particular interest because overweight children are more likely to be overweight as
adults, and such adults are exposed to various diseases. During the same period that
witnessed an increase in child obesity, an important change that occurred was the
increase in maternal employment. This study is an attempt to analyze the
relationship between maternal employment and child obesity. This study used data
from the National Longitudinal Survey of Youth (NLSY)79, child/young adults,
1986-2010 cohorts obtained from the Bureau of Labor Statistics (BLS) website.
The results of this study show that maternal employment is significantly and
positively correlated with child obesity.
Keywords: child obesity, maternal employment, overweight children.
Obesity has been a major concern for the United States and most other industrialized
countries over the past few decades. Research has proven that there are many health concerns
associated with obesity for both children and adults (Araneo, 2008). Overweight children are more
likely to have a high cholesterol level, high blood pleasure, abnormal glucose tolerance, and all of
which lead to a higher risk of cardiovascular disease at a later stage in life (Araneo, 2008). In
addition, there are other health risks associated with obesity like asthma, hepatic steatosis, sleep
apnea, and type-2 diabetes (CDC, 2007). What makes child obesity the center of attention is that
overweight children are also more likely to be overweight as adults (Bouchard, 1997; Guo et al.,
2002) and such adults are more vulnerable to diseases like coronary heart disease, diabetes,
atherosclerosis, colorectal cancer, hypertension, gall bladder disease, breast cancer, endometrial
cancer, colon cancer, and osteoarthritis (Power et al., 1997; Wolf and Colditz, 1998).
The proportion of overweight children between the ages of 6 and 11 in the United States
rose from 7% in 1980 to 18% by 2012 ( Ogden et al., 2014). In 2012, more than one third of
children and adolescents in the United States were overweight or obese ( Ogden et al., 2014). There
are various explanations given to this increase in obesity over the past few decades. Cutler et al.
(2003) and Philipson and Posner (2003) indicated that cheaper, fattening foods and sedentary
lifestyles which are the result of technological advancement are the major contributing factors for
obesity while Chou et al. (2004) pointed out that a decrease in smoking and an increase in fast
food restaurants are the major factors for obesity. Another important change that occurred during
the same period is the increase in female labor force participation. The labor force participation

114 http://scholarworks.wmich.edu/ijad/
rate of mothers with children under the age of 18 increased from 47% in 1975 to 71 % in 2006
(U.S. Department of Labor, Bureau of Labor Statistics, 2007). Since any potential explanation for
the increase in childhood obesity must also involve changes in parental lifestyle (Patrick and
Nicklas 2005; Golan and Crow 2004; Ebbling et al., 2002), it might be worthwhile to focus on the
increase in maternal employment during this period which might possibly be related to the rise in
childhood obesity during the same period.
Economic theory has puts forward different channels through which maternal employment
affects childhood bodyweight. The first one was the positive relationship between maternal
employment and childhood obesity. The explanation to this is that mothers who work have less
time to cook at home and are more inclined to buy meals from fast food restaurants or prepare
more ready to eat meals that have higher fat density than meals cooked at home (Fertig et al.,
2009). In addition, mothers who work may have less time available to supervise their children's
meals and activities which implies that children of working mothers are more likely to spend more
time watching TV and eating junk food then engaging in outside activities (Fertig et al., 2009).
On the other hand, mothers who work earn more income and the findings (Gordon-Larsen et al.,
2003; Zhang and Wang, 2004a, b) revealed a negative relationship between socio-economic status
and obesity. The explanation to this is that mothers who work earn more income which enables
them to provide better quality food for their children and to enroll their children in organized
activities that can help reduce their weight (Fertig et al., 2009).
Child obesity poses a serious concern that needs to be addressed due to its negative health
implications at a later stage in life. One possible explanation for the increase in child obesity
overtime is maternal employment. Accordingly, the purpose of this paper is to analyze the
relationship between maternal employment and child obesity along with the mechanisms through
which maternal employment might influence child obesity. In addition, this investigation will
identify some other factors that contribute to child obesity apart from maternal employment. In
order to achieve this objective, data from the National Longitudinal Survey of Youth’s NLSY79
child/young adults 1986-2010 cohorts were used. Samples of children aged 2 to 15 in the year
2010 were utilized to carry out the analysis. Probit regression was used to predict the probability
that a child will be overweight given that the mother works, or not, along with other explanatory
variables.
Contribution of the Study
There has been much research on the effect of maternal employment on child obesity.
These studies used data from different sources including NLSY which was also used in this paper.
However, there has been a limited attempt in previous studies that used NLSY to make use of the
detailed child and parent specific characteristics that might also contribute to child obesity. In line
with this, data on the physical activities of the child was included, whether the child has been in
constant child care during the first year, and whether the child was living with the father, as these
are also factors that might contribute to child obesity as evidenced by previous research.

International Journal of African Development v.3 n.2 Spring 2016 115
Literature Review - Factors Contributing to Childhood Obesity
Genetic and Environmental Factors
The Center for Disease Control and Prevention has suggested that obesity could be caused
by genetic factors, environmental factors and some diseases or drugs. Of the environmental factors,
quantity and the quality of the food consumed as well as physical activity have been identified as
the major factors contributing to obesity (CDC, 2009). Overweight and obese children usually
have a lower than usual consumption of breast milk combined with premature initiation into
complementary nutrition, skipped breakfasts, increased consumption of simple sugars and neutral
fat rich foods for snack, and higher consumption of energy-dense foods later in the day as well as
insufficient consumption of fruits and vegetables. In addition, the secondary or exogenous causes
of obesity were found to be factors associated with lifestyle including lack of opportunities to
participate in moderate and intense physical activity in schools (Dietz, 1990).
Parental Lifestyle
According to Akil and Ahmed (2011), obesity, which is strongly associated with lifestyle
behaviors, may be characterized by low levels of physical activity or high consumption of energy-
dense foods, or both. They added that even though obesity is caused by many factors, in most
cases, weight gain was the result of excess calorie consumption and inadequate physical activity.
Therefore, in order to maintain healthy weight, there must be a balance between energy
consumption and expenditure.
Patrick and Nicklas (2005) pointed out that change in parental lifestyle like busy and
hurried family meal structure and eating habits are major factors contributing to child obesity. As
evidenced by various studies, family and social environments have played an important role in the
development of children’s eating patterns. Busy families usually rely on ready-to-eat food from
fast food restaurants. Hurried families do not have enough time to sit down and eat meals together
as a family. In addition, there has been an increase in the portion of meals taken, which may have
also contributed to rising obesity trends. Other characteristics of the family, like income level, also
contribute to child obesity with children from low income families having to eat fewer fresh fruit
and vegetables and more of high calorie foods.
Socio-economic profile
Stamatakis et al. (2010) used data from the nationally representative household-based
health survey for England from 1997 to 2007. The data include 15,271 white children (7880 boys)
between the ages of 5 and 10 years. The results of their study showed that there are signs that the
overweight and obesity trend stabilized between the years 2004 to 2007, but social disparities
widened during the same period. Although the obesity trend has stabilized during this period,
children from lower socio-economic strata have not benefited from this trend. That is, there is
higher prevalence of the obesity rate among children from a lower socio-economic background

116 http://scholarworks.wmich.edu/ijad/
(lower income and manual occupation households) as compared to children from a higher socio-
economic background (higher income and non-manual occupation).
In a similar study carried out in Japan by Watanabe et al. (2011), the presence of family
members, mainly grandparents who cared for children in place of the mothers, influenced
children’s obesity rate and lifestyles. The authors’ aim was to see the effects of maternal
employment and the presence of grandparents on children’s obesity. They sampled 2114 children
aged 3 to 6 years old. Their findings suggested that maternal employment was associated
positively with irregular mealtimes, unfixed snacking times, bedtimes after 10 p.m., and night-
time sleep duration of less than 10 hours, which all translate to a higher BMI (Body Mass Index).
However, the presence of three-generation families was associated negatively with irregular
mealtimes which implied lower BMI of children. Therefore, the authors suggest that grandparents
who care for pre-school children in place of mothers are more likely to contribute to childhood
obesity than maternal employment.
Fetig et al. (2009) investigated the relationship between maternal employment and child
obesity and found that results varied according to mothers’ level of education. For less educated
mothers, more hours of working were positively associated with more time spent in school by
children which in turn led to lower BMI. For more educated mothers, however, this relationship
was not significant.
In addition to income and education level, there has been evidence documented by several
studies that child obesity rates also vary by race and marital status. A study conducted by Araneo
(2008) revealed that Hispanic children have a higher probability of becoming obese compared to
white children, and Black children with least educated mothers have a higher probability of
becoming overweight. In a similar research done by Huffman et al. (2010), Black children from
single-parent households had significantly higher BMI compared to white children. This result was
to be consistent with the findings of Caprio et al. (2008) that obesity is more prevalent in the non-
white population of the United States (Caprio et al., 2008).
Akil and Ahmed (2011) claimed that there are significant disparities in the availability of
food stores in neighborhoods that vary in ethnicity, which had an implication on the prevalence of
obesity rates across the different ethnic groups. The availability of supermarkets has been
associated with healthier diets, higher vegetable and fruit consumption, and lower rates of obesity.
In addition, minority population groups have had less access to facilities for physical exercise,
which is linked to lower physical activity and higher BMI. In line with this, African American and
Hispanic neighborhoods have 50% to 70% fewer chain supermarkets than white and non-Hispanic
neighborhoods. The authors claimed that this partly explains the higher obesity rates among
African Americans compared to whites. Their findings suggested that an increase in obesity
prevalence increase with unemployment rates, poverty levels and percentage of people receiving
SNAP benefits. This shows that a higher obesity rate is common among people with lower income
and less education, particularly among women and certain ethnic groups. However, they found
income to not significantly correlate with the obesity rate.

International Journal of African Development v.3 n.2 Spring 2016 117
Huffman et al. (2010) suggested that single parents often experience role strain while trying
to balance their role as a wage earner along with other parental responsibilities. Moreover, poverty
has been associated with single-parent households, especially female-headed households.
Accordingly, the authors attempted to explore if there was significant difference in the prevalence
of obesity between children from single-parent households and those from dual-parent households.
Their findings indicated that children from single-parent households tend to be more overweight
than those from dual-parent households. One of the reasons for this might be the fact that children
from single-parent households tend to consume more calories and fat than those from dual-parent
households. Their research also showed that children of female-headed households consume more
total fat, saturated fat and sweetened beverages, and also spend more than two hours a day
watching TV/video than children of dual family households. The proportion of overweight
children from single-parent households was more than those from dual-parent households, i.e. 41%
Vs 31%. However, household income was not significantly correlated with children’s weight
status in both single-parent and dual-parent households.
Relationship Between Maternal Employment and Child Obesity
Recently, several studies that investigated the possible relationship between maternal
employment and child obesity have been conducted. Fetig et al. (2009) used the data from Child
Development Supplement of the Panel Study of Income Dynamics to analyze the channels through
which maternal employment affects child obesity. The major assumption the authors made was
that maternal employment affects the number and composition of meals taken by a working
mother’s children as well as the nature of their activities, which in turn influence calorie intake
and spending, and thereby affecting the child’s BMI. First, they used the OLS estimation method
using a child's percentile BMI (pBMI) as a dependent variable explained by maternal employment
(MWH).
pBMI=β0+β1ln(MWH)i+β2TVi+β3Xi+µ where TVi is the average number of time spent
on watching TV and Xi is the control variable for the characteristic of child and family.
In addition, they also used two sets of the Probit regression model with the dependent
variables representing whether the child is overweight or at risk of being overweight (BMI
percentile above 85) or simply overweight (BMI percentile above 95). Their findings indicated
that the only three channels which significantly affected a child's percentile BMI are the number
of meals, the time spent reading/talking/listening to music, and the time spent watching TV. The
authors found that first, more hours of working by mothers resulted in higher children's BMI
through the mechanism of fewer meals. That is to say that mothers who work more hours have
children who are more likely to skip meals which increases their BMI. Second, more hours
working is associated with less time spent in reading/talking/listening to music by children which
in turn in associated with higher BMI. Third, more hours working is positively related to more
time spent in watching TV which in turn is positively associated with higher BMI.

118 http://scholarworks.wmich.edu/ijad/
Araneo (2008) used a similar approach to study the relationship between maternal
employment and child obesity using the data from The Fragile Families and Child Wellbeing
Study. This study used a probit regression model of the form:
P(Child Overweight) = α0 + α1 Part-Time+ α2Full-Time + α3X + ε
where P (Child Overweight) is the probability that a child is overweight as a dependent variable.
Part-time and full-time are binary variables that indicate whether the mother is employed part-time
or full-time and ε is the error term. X includes control variables for child and mother characteristics
like mother's race, child's sex, child's age, and so on. The findings indicated that full-time maternal
employment results in a higher probability of a child being overweight, but this effect was
significant only for highly educated mothers. For highly educated mothers who work part-time,
however, this relationship does not hold. For less educated mothers, no such significant effect was
seen whether the mother was employed full-time or part-time.
Using matched mother-child data from the National Longitudinal Survey of Youth
(NLSY), Anderson et al. (2004) found that for mothers with the highest socio-economic status, a
10-hour increase in average hours worked per week increases the likelihood that the child is
overweight by 1.3 percentage points. In addition, children who belonged to highly educated
mothers, white mothers or high-income families are more likely to be overweight if their mothers
work more hours per week. For children from these sub-groups, a 10- hour increase in average
hours worked per week lead to an increase in the likelihood that the child is overweight by 1 to 4
percentage points. The study also found that Black children are significantly more likely to be
overweight than other groups. When the regressions were run separately for the three race groups,
maternal employment significantly predicted higher weight for white children only. Furthermore,
children who were breastfed were less likely to be overweight by about 2.3 percentage points
(Anderson et al., 2004).
Anderson et al. (2003) used the American Time Use Surveys for 2003-2006 data set to
analyze the mechanisms through which maternal employment affects childhood obesity. This
research used a probit model where the dependent variable equalled one if the mother reported that
she spent time in any of the activities like eating with children, grocery shopping, cooking, playing
with children, child care and supervising children. In addition, the OLS estimation technique was
also used in which the dependent variable was the log of the number of minutes spent in those
activities and the regressor was an indicator variable that equalled one if the mother worked for
pay. The findings of this research confirmed that maternal employment is associated with a lower
probability of and a reduction in time spent on grocery shopping and cooking, and a higher
probability of buying ready to eat foods which in turn leads to higher BMI of children. Moreover,
working mothers were less likely to eat and play with their children. In addition, this study also
found that employed mothers spend less time in child care and supervision of their children all of
which contribute to higher BMI (Anderson et al., 2003).
Hawkins et al. (2008) investigated 13,113 children at the age of three who were born in the
UK. They found that 23% of children were overweight and that children were more likely to be
overweight for every 10 hours a mother worked per week. More specifically, the likelihood of

International Journal of African Development v.3 n.2 Spring 2016 119
children being overweight increased with the number of hours the mother worked per week.
However, this relationship was found to be significant only for those children from families with
the highest level of income. Furthermore, the authors found no evidence for a relationship between
the number of hours a partner works or maternal (as well as paternal) duration of employment and
early childhood overweight. Their findings also indicated that the intensity of maternal
employment was associated with childhood obesity only for families from the highest income
groups. One possible explanation for this might be that these children may have had greater access
to convenience foods and/or fewer opportunities for physical activity. The implication of this
finding was that long hours of maternal employment rather than lack of money may hamper
children’s access to healthy food and physical exercise. In addition, an interaction between hours
worked by the mother and the type of day care showed that children in formal arrangements might
be at a higher risk of being overweight if their mothers worked more hours. This study also
revealed that children that were breastfed had a lower risk of being overweight.
Data
The major source of data for this study was the National Longitudinal Survey of Youth,
NLSY79 using the child/young adults 1986-2010 cohort obtained from the Bureau of Labor
Statistics (BLS) website. The NLSY79 is a nationally representative sample of 12,686 men and
women who were born in the years 1957 to 1964 and were surveyed for the first time in the year
1979. The NLSY79 children and young adults is a survey of the children of the women from the
NLSY1979 collected annually through 1994 and interviewed every two years. The reason for using
this data set was because it is nationally representative which means that women and children from
all ethnic backgrounds, education levels and social status are included. In addition, it provides
detailed information regarding parent and child specific characteristics which are useful for
analysis. For the purpose of this study, samples of children from the age of 2 to 15 in the year 2010
were used.
Research Methodology
The econometric model used to analyze the NLSY79 data was probit regression. The
dependent variable in this case is whether the child is overweight or not. The explanatory variables
are various socio-economic as well as parental and child specific characteristics affecting the
probability of the child being overweight. The full model is described below:
P(Overweight)= β0+β1agechildyr +β2breasfed+β3childcare+ β4 fathlive + β5agemoth+
β6grademoth+β7hhmemund+β8chimakbed+β9chiclearm+β10chichores+
β11avhrweek+β12chisex+β13racechi_black+ β14 racechi_hispanic+ β15 logaveearn+µ
Whereby,
agemoth = age of mother
grademoth = highest grade completed by mother
hhmemund = number of household members who are underage
chimakebed = No of times child is expected to make his/her own bed

120 http://scholarworks.wmich.edu/ijad/
chichores = No of times child is expected to do household chores
chiclearm = No of times child is expected to clean his/her own room
avhrweek = average hours per week worked by mother
racechi black = dummy for race if the child is Black
racechi_hispanic = dummy for race if the child is Hispanic
logaveearn = log of average quarterly earnings (4 quarters before birth and 8
quarters after birth)
agechildyr =age of child in year
breasfed = whether the child is breast fed or not
childcare = whether the child has been in childcare
fathlive = whether the child lives with his/her father
chisex = sex of the child
Results
Table 1 presents simple descriptive statistics. The average age of mothers in the sample is
about 48 years old. The average highest educational level accomplished by the mothers in the
sample is 14, indicating that on average, mothers have at least a high school diploma. In addition,
on an average, mothers work 21 hours per week. The number of hours worked by the mothers was
calculated by taking the average number of hours per week the mother worked for four quarters
before the birth of the child and eight quarters after the birth of the child. The standard deviation
for this variable is extremely high (16.91) indicating that there is a lot of variability in the average
number of hours per week worked by the mothers in the sample. On an average, children in the
sample are below 12 years of age.
Table 1:
Descriptive Statistics
Variable N Mean STD
agemoth 1067 47.5 1.89
grademoth 1067 14 2.77
hhmemund 1064 2 1.08
chimakebed 612 3.9 1.52
chichores 614 3.9 1.36
chiclearm 611 4.4 1.13
avhrweek 1067 21 16.91
logaveearn 797 8 1.34
agechildyr 1067 11.5 2.74
Table 2 shows that about 18% of the children in our sample were overweight. There is an
even distribution of male and female children in our sample as 49.95% of the children are males
while the remaining 50.05% are females. About 66% of the children were breastfed. In addition,

International Journal of African Development v.3 n.2 Spring 2016 121
44% of the children had been in regular child care during the first year. In terms of racial
background, about 25 % of the children are Black, 21% are Hispanic, and the remaining 54% are
non-Black and non-Hispanic. About 70% of the children in the sample lived with their father.
Table 2
Frequency Distribution
Variable Frequency (in percentage)
Child sex (male) 49.95
Breastfed 66.51
Childcare 44.4
Overweight 17.81
Black children 24.84
Hispanic Children 21.27
Non-Black and Non-Hispanic 53.89
Father lives with the child 70.22
Table 3 shows that only five variables were significant in explaining the variation in the
probability of a child being overweight. In particular, the age of the child was significant at a 1%
Table 3
Probit Estimates (Coefficients and Robust Standard Errors)
Variables Coef. Robust Std. Err.
agechildyr -0.181*** 0.059
breasfed -0.372** 0.161
childcare -0.249 0.169
fathlive -0.234 0.161
agemoth -0.012 0.037
grademoth -0.115*** 0.032
hhmemund 0.04 0.08
chimakbed 0.009 0.062
chiclearm -0.043 0.075
chichores -0.005 0.059
chisex 0.215 0.151
avhrweek 0.018** 0.008
racechi_black -0.119 0.203
racechi_his~c -0.38* 0.22
logaveearn -0.043 0.081
_cons 3.911 2.036
Note: coefficients are statistically significant at the *10% significance level, **5% significance level, or
***1% significance level.

122 http://scholarworks.wmich.edu/ijad/
significance level, whether the child was breastfed or not was significant at a 5% significance level,
the highest level of education attained by the mother was found to be significant at a 1%
significance level, the race of the child was significant at a 10% significance level while the
average number of hours per week worked by the mother was significant at a 5% significance
level. The coefficients reported above indicate the direction and strength of the association
between the dependent variable and each explanatory variable. For instance, the age of the child
was negatively correlated with the probability of the child being overweight while the average
number of hours per week worked by the mother was positively correlated with the probability of
the child being overweight. However, these coefficients do not represent the actual marginal effect
of the explanatory variables on the dependent variable. Therefore, it was necessary to calculate the
marginal effects to estimate the extent to which each of the independent variables listed above
affect the probability of the child being overweight. Table 4 shows these marginal effects.
From Table 4, if the child is breastfed, the probability of him/her being overweight declines
by 9.4 percentage points. For each year of mother's education, the probability of the child being
overweight goes down by 2.7 percentage points. For each additional hour per week worked by the
mother, the probability of the child being overweight increases by 0.4 percentage points. As the
child grows older by one year, the probability of that child being overweight goes down by 4.2
percentage points.
Table 4
Marginal Effects
Variables dy/dx Robust Std. Err.
agechildyr -0.042 0.014
breasfed -0.094 0.043
childcare -0.059 0.041
fathlive -0.057 0.041
agemoth -0.003 0.009
grademoth -0.027 0.007
hhmemund 0.009 0.019
chimakbed 0.002 0.014
chiclearm -0.01 0.017
chichores -0.001 0.014
chisex 0.05 0.036
avhrweek 0.004 0.002
racechi_black -0.027 0.044
racechi_his~c -0.078 0.039
logaveearn -0.009 0.019

International Journal of African Development v.3 n.2 Spring 2016 123
Discussion
The regression result confirms that maternal employment (as captured by the average
number of hours per week worked by the mother) is associated with a high probability of the child
being overweight. However, the mechanisms through which maternal employment affects child
obesity are not statistically significant. Some of these mechanisms included in the model are: the
number of times the child is expected to clean his/her own room; the number of times the child is
expected to do household chores; and the number of times the child is expected to make his/her
own bed. Maternal employment is assumed to affect child obesity through these channels. The
rationale behind this assumption is that an employed mother has less time to supervise the activities
of her children. and thereby, the children decide what to do, what to eat and how to spend their
time when they are at home or elsewhere, which in turn has a negative implication on their weight.
Children not supervised by their mothers are more likely to eat unhealthy food and spend more
time in activities that do not involve physical exercise like watching TV. However, for the sample
from NLSY79 data used for this study, none of these channels turn out to be significant.
A rather surprising result is that of child care. The result of this study shows that children
who have been in child care during first year are less likely to be overweight than those who were
not in child care although this relationship is not statistically significant. Average quarterly income
is negatively correlated with the probability of the child being overweight, which implies that
children with parents of higher income are less likely to be overweight than those with lower
income holding all other things constant. However, this relationship is not significant either. In
addition, the race of the child turned out to be a significant factor in explaining child obesity for
Hispanic children. The probability of a Hispanic child being overweight is less by 7.8 percentage
points compared to a non-Hispanic and non-Black child. Although some studies like that of
Huffman et al. (2010) showed that children from single-parent households tend to be more
overweight than children from dual-parent households, my findings revealed that whether the
father lives with the mother or not is not a significant factor explaining child obesity. Although
several studies like that of Stamatakis et al. (2010) and Akil and Ahmed (2011) found that children
from lower socio-economic strata (captured by household income level) tended to be more
overweight than children from higher socio-economic strata, my findings show no significant
relationship between income level and child obesity.
Conclusion
The increase in childhood obesity is more likely to be associated with change in parental
lifestyle. One of these changes in parental lifestyle is the increase in a mother’s labor force
participation during the past few decades. Therefore, it is more likely that the increase in maternal
employment is associated with the increase in child obesity. Accordingly, this paper investigates
the possible relationship between child obesity and maternal employment and if this relationship
is indeed significant.
The results of this study confirm that maternal employment is significantly and positively
correlated with child obesity. This is similar to the findings of Fetig et al. (2009) and Anderson et

124 http://scholarworks.wmich.edu/ijad/
al. (2003). The results of this research also suggest that the more educated the mother is, the less
likely her child is to be overweight. In addition, breast feeding reduces the likelihood of the child
to be overweight. Hispanic children are less likely to be overweight than their non-Black and non-
Hispanic counterparts. Moreover, the older the child gets, the less likely it is for him/her to be
overweight.
Although maternal employment was found to be significantly and positively related to
child obesity, none of the channels through which maternal employment affects child obesity like
the number of times the child is expected to clean his/her own room, the number of times the child
is expected to do household chores, and the number of times the child is expected to make his/her
own bed were found to be significant. Thus, further research is needed to find the significant
mechanisms through which maternal employment influences child obesity. Therefore, this study
can further be improved with a larger sample size and more complete information on children's
activities like time spent watching TV, time spent playing outdoors, and the types of meals taken,
as these were found to be significant factors influencing child obesity in previous studies.
Moreover, with a larger sample size and more complete information on each of the variables, cross-
group comparisons might have given a much better understanding of the topic. Grouping the
sample by educational attainment of the mother and by age of the children might have rendered a
better result as the activities of a two-year old child are quite different from that of a 12-year old.
By the same token, the effect of maternal employment on child obesity might be different for more
educated mothers as compared to the less educated ones.
The findings of this research show that for mothers who work more hours, their children
are more likely to be overweight. Therefore, policy makers, companies and institutions should
design policies that would encourage family-friendly work environments that allow working
mothers to attain good work-life balance. In addition, breast feeding is also another significant
factor that helps reduce child obesity. Accordingly, the government as well as companies and
institutions should aim at implementing policies that allow working mothers to breast feed their
babies. One way to achieve this can be through mandating extended maternity leave that allows
mothers to breast feed their babies for a pro-longed period of time. Finally, the result of this study
also shows that more educated mothers are less likely to have obese children. Therefore, more
effort should be exerted by the government and school officials to educate mothers.

International Journal of African Development v.3 n.2 Spring 2016 125
References
Akil, L., & Ahmad, H. A. (2011). Effects of socioeconomic factors on obesity rates in four
southern states and Colorado. Ethnicity and Disease, 21(1), 58.
Anderson, P. M., Butcher, K. F., & Levine, P. B. (2003). Maternal employment and overweight
children. Journal of Health Economics, 22(3), 477-504.
Anderson, P. M., Butcher, K. F., & Levine, P. B. (2004). Maternal employment and childhood
obesity. In The economics of obesity: A Report on the Workshop Held at USDA’s Economic
Research Service. Economic Research Service/USDA (pp. 14-17).
Araneo, J. (2008). The effects of maternal employment on childhood obesity in the United
States. Senior Thesis. Princeton University.
Bouchard, C. (1997). Obesity in adulthood—the importance of childhood and parental
obesity. New England Journal of Medicine, 337(13), 926-927.
Caprio, S., Daniels, S. R., Drewnowski, A., Kaufman, F. R., Palinkas, L. A., Rosenbloom, A. L.,
& Schwimmer, J. B. (2008). Influence of race, ethnicity, and culture on childhood obesity:
Implications for prevention and treatment a consensus statement of shaping America's
health and the obesity society. Diabetes Care, 31(11), 2211-2221.
Chou, S. Y., Rashad, I., & Grossman, M. (2008). Fast-food restaurant advertising on television
and its influence on childhood obesity. Journal of Law and Economics, 51(4), 599-618.
Cutler, D., Glaeser, E., & Shapiro, J. (2003). Why have Americans become more obese? (No.
w9446). National Bureau of Economic Research.
Dietz, W. (1990). Factors associated with childhood obesity. Nutrition (Burbank, Los Angeles
County, California.), 7(4), 290-291.
Ebbeling, C. B., Pawlak, D. B., & Ludwig, D. S. (2002). Childhood obesity: Public-health crisis,
common sense cure. The Lancet, 360(9331), 473-482.
Fertig, A., Glomm, G., & Tchernis, R. (2009). The connection between maternal employment and
childhood obesity: Inspecting the mechanisms. Review of Economics of the
Household, 7(3), 227-255.
Golan, M., & Crow, S. (2004). Parents are key players in the prevention and treatment of weight-
related problems. Nutrition Reviews, 62(1), 39-50.
Gordon-Larsen, P., Adair, L. S., & Popkin, B. M. (2003). The relationship of ethnicity,
socioeconomic factors, and overweight in US adolescents. Obesity Research, 11(1), 121-
129.
Guo, S. S., Wu, W., Chumlea, W. C., & Roche, A. F. (2002). Predicting overweight and obesity
in adulthood from body mass index values in childhood and adolescence. The American
Journal of Clinical Nutrition, 76(3), 653-658.
Hawkins, S. S., Cole, T. J., & Law, C. (2008). Maternal employment and early childhood
overweight: Findings from the UK Millennium Cohort Study. International Journal of
Obesity, 32(1), 30-38.

126 http://scholarworks.wmich.edu/ijad/
Huffman, F. G., Kanikireddy, S., & Patel, M. (2010). Parenthood: A contributing factor to
childhood obesity. International Journal of Environmental Research and Public
Health, 7(7), 2800-2810.
Ogden, C. L., Carroll, M. D., Kit, B. K., & Flegal, K. M. (2014). Prevalence of childhood and adult
obesity in the United States, 2011-2012. Jama, 311(8), 806-814.
Overweight and Obesity (2009, October 3). Centers for Disease Control and Prevention. Retrieved
from www.cdc.gov/obesity.
Centers for Disease Control and Prevention (CDCP). (2007). Overweight and Obesity. Retrieved
from http://www.cdc.gov/nccdphp/dnpa/obesity/index.htm.
Patrick, H., & Nicklas, T. A. (2005). A review of family and social determinants of children’s
eating patterns and diet quality. Journal of the American College of Nutrition, 24(2), 83-
92.
Philipson, T. J., & Posner, R. A. (1999). The long-run growth in obesity as a function of
technological change (No. w7423). National Bureau of Economic Research.
Power, C., Lake, J. K., & Cole, T. J. (1997). Measurement and long-term health risks of child and
adolescent fatness. International Journal of Obesity and Related Metabolic Disorders:
Journal of the International Association for the Study of Obesity, 21(7), 507-526.
Stamatakis, E., Wardle, J., & Cole, T. J. (2010). Childhood obesity and overweight prevalence
trends in England: Evidence for growing socioeconomic disparities. International Journal
of Obesity, 34(1), 41-47.
U.S. Department of Labor. (2007). Women in the Labor Force. Bureau of Labor Statistics.
Watanabe, E., Lee, J. S., & Kawakubo, K. (2011). Associations of maternal employment and three-
generation families with pre-school children's overweight and obesity in
Japan. International Journal of Obesity, 35(7), 945-952.
Wolf, A. M., & Colditz, G. A. (1998). Current estimates of the economic cost of obesity in the
United States. Obesity Research, 6(2), 97-106.
Zhang, Q., & Wang, Y. (2004a). Socioeconomic inequality of obesity in the United States: Do
gender, age, and ethnicity matter?. Social Science and Medicine, 58(6), 1171-1180.
Zhang, Q., & Wang, Y. (2004b). Trends in the association between obesity and socioeconomic
status in US adults: 1971 to 2000. Obesity Research, 12(10), 1622-1632

A Brief Note from Editorial Management Team
International Journal of African Development (IJAD) is an open access interdisciplinary
journal on issues related to sustainable development in Africa that began in 2013. The first issues
featured selected papers from previous international conferences on African development. We
are soliciting manuscripts for future issues throughout the year. Contributing authors are advised
to prepare their final manuscripts using APA format to be considered for review before they are
accepted.
Please submit your contributions online to http://scholarworks.wmich.edu/ijad/ where you will
have to create an account, or send a copy to the Chief Editor Professor Sisay Asefa at


