JAAS Journal of Analytical Atomic Spectrometry www.rsc.org/jaas ISSN 0267-9477 Volume 31 Number 4 April 2016 Pages 823–1050 PAPER S. Maurice et al. ChemCam activities and discoveries during the nominal mission of the Mars Science Laboratory in Gale crater, Mars
Transcript
JAASJournal of Analytical Atomic Spectrometrywww.rsc.org/jaas
ISSN 0267-9477
Volume 31 Number 4 April 2016 Pages 823–1050
PAPERS. Maurice et al.ChemCam activities and discoveries during the nominal mission of the Mars Science Laboratory in Gale crater, Mars
JAAS
PAPER
Publ
ishe
d on
16
Febr
uary
201
6. D
ownl
oade
d by
Cal
ifor
nia
Inst
itute
of
Tec
hnol
ogy
on 0
2/09
/201
6 15
:24:
58.
View Article OnlineView Journal | View Issue
ChemCam activi
Cite this: J. Anal. At. Spectrom., 2016,31, 863
Received 19th October 2015Accepted 16th February 2016
ties and discoveries during thenominal mission of the Mars Science Laboratory inGale crater, Mars
S. Maurice,*a S. M. Clegg,b R. C. Wiens,b O. Gasnault,a W. Rapin,a O. Forni,a A. Cousin,a
V. Sautter,c N. Mangold,d L. Le Deit,d M. Nachon,d R. B. Anderson,e N. L. Lanza,b
C. Fabre,f V. Payre,f J. Lasue,a P.-Y. Meslin,a R. J. Leveille,gh B. L. Barraclough,b P. Beck,i
S. C. Bender,j G. Berger,a J. C. Bridges,k N. T. Bridges,l G. Dromart,m M. D. Dyar,n
R. Francis,op J. Frydenvang,b B. Gondet,q B. L. Ehlmann,p K. E. Herkenhoff,e
J. R. Johnson,l Y. Langevin,q M. B. Madsen,r N. Melikechi,s J.-L. Lacour,t S. Le Mouelic,d
E. Lewin,u H. E. Newsom,v A. M. Ollila,v P. Pinet,a S. Schroder,a J.-B. Sirven,t R. L. Tokar,j
M. J. Toplis,a C. d'Uston,a D. T. Vanimanj and A. R. Vasavadap
At Gale crater, Mars, ChemCam acquired its first laser-induced breakdown spectroscopy (LIBS) target on Sol
13 of the landed portion of the mission (a Sol is a Mars day). Up to Sol 800, more than 188 000 LIBS spectra
were acquired on more than 5800 points distributed over about 650 individual targets. We present
a comprehensive review of ChemCam scientific accomplishments during that period, together with
a focus on the lessons learned from the first use of LIBS in space. For data processing, we describe new
tools that had to be developed to account for the uniqueness of Mars data. With regard to chemistry, we
present a summary of the composition range measured on Mars for major-element oxides (SiO2, TiO2,
Al2O3, FeOT, MgO, CaO, Na2O, K2O) based on various multivariate models, with associated precisions.
ChemCam also observed H, and the non-metallic elements C, O, P, and S, which are usually difficult to
quantify with LIBS. F and Cl are observed through their molecular lines. We discuss the most relevant
LIBS lines for detection of minor and trace elements (Li, Rb, Sr, Ba, Cr, Mn, Ni, and Zn). These results
were obtained thanks to comprehensive ground reference datasets, which are set to mimic the expected
mineralogy and chemistry on Mars. With regard to the first use of LIBS in space, we analyze and quantify,
often for the first time, each of the advantages of using stand-off LIBS in space: no sample preparation,
analysis within its petrological context, dust removal, sub-millimeter scale investigation, multi-point
analysis, the ability to carry out statistical surveys and whole-rock analyses, and rapid data acquisition.
We conclude with a discussion of ChemCam performance to survey the geochemistry of Mars, and its
valuable support of decisions about selecting where and whether to make observations with more time
and resource-intensive tools in the rover's instrument suite. In the end, we present a bird's-eye view of
di-Pyrenees, 9 av. colonel Roche, 31400
ax: +33 5 61 55 67 01; Tel: +33 6 18 78
os, NM, USA
relle, Paris, France
ique, LPG-Nantes, UMR CNRS, 6112,
e Center, Flagstaff, AZ, USA
ndoeuvre les Nancy, France
bec, Canada
McGill University, Montreal, Quebec,
e de Grenoble, Univ. Grenoble Alpes,
A
hysics and Astronomy, University of
lApplied Physics Laboratory, Johns Hopkins University, Laurel, Maryland, USAmLaboratoire de Geologie de Lyon, Universite de Lyon – ENS de Lyon, Lyon, FrancenDepartment of Astronomy, Mount Holyoke College, South Hadley, Massachusetts,
USAoCentre for Planetary Science and Exploration, University of Western Ontario,
London, Ontario, CanadapJet Propulsion Laboratory, California Institute of Technology, Pasadena, CA, USAqInstitut d'Astrophysique Spatiale, Universite Paris Sud – CNRS, Orsay, FrancerNiels Bohr Institute, University of Copenhagen, Copenhagen, DenmarksOptical Science Center for Applied Research, Delaware State University, Dover, DE,
USAtCommissariat a l'Energie Atomique et Energies Alternatives, DEN, Dept of Phys.
Chem., Saclay, FranceuInstitut des Sciences de la Terre, Univ. Grenoble 1 – CNRS, Grenoble, FrancevInstitute of Meteoritics and Dept of Earth and Planetary Sciences, Univ. of New
ChemCam is a suite of two analytical instruments: a stand-offLaser Induced Breakdown Spectroscopy (LIBS) system anda Remote Micro-Imager (RMI). In LIBS analysis, a sample isablated by a pulsed laser; ions, atoms and molecular species areelectronically excited in a high-temperature, short-lived plasma.As the plasma cools down, atoms and molecules decay fromtheir excited levels and release energy in the form of light. Thelight is collected for spectral analysis. The RMI provides contextimages and documents the accurate location for each laser shot.ChemCam is the rst extra-terrestrial use of LIBS, which hasbeen operating on the Mars Science Laboratory (MSL) Curiosityrover since 2012 to determine the composition of Mars rocksand soils at standoff distances.1 This paper provides anassessment of ChemCam use and performance on Mars, anddescribes some lessons learned relative to our expectationsprior to launch,2,3 with the idea of providing general guidancefor future missions.
The ChemCam instrument weighs less than 10 kg. Its laser,telescope, and RMI are located at the top of the remote-sensingmast, while spectrometers and processing unit are in the roverbody.2,3 It utilizes a passively cooled diode-pumped Nd:KGWlaser with two amplier slabs to produce 5 ns pulses of 1067 nmphotons with energies up to 35 mJ. The laser system generatesa beam that is expanded through a 110 mm diameter Schmidt–Cassegrain telescope to produce a focused spot (<550 mm) ontargets 2 to 7 m from the telescope, or occasionally at 1.56 m forthe on-board calibration targets. Plasma is created on the targetwhen the laser energy density is above 10 MWmm�2. The sametelescope is used to collect the plasma emission, launching itinto a 5.75 m long multimode silica optical ber leading fromthe rover's mast to its body. The light is received by a demulti-plexer and three spectrometers covering 240–850 nm, except forgaps from 340 to 385 nm and 469 to 492 nm. The LIBS eld-of-view is 0.67 mrad. The spectrometers, referred to as UV, violet(VIO), and visible and near-infrared (VNIR), have a relativelysimple Czerny–Turner design with resolutions of �0.049 nmper pixel (UV), �0.042 nm per pixel (VIO), and �0.21 nm perpixel (VNIR). They are custom-built spectrometers based on theOcean Optics Incorporated HR2000 ber spectrometer design.3
The detectors are three E2V 42-10 back illuminated 2048 �512 pixel CCDs that are operated in a low-noise mode. Thespectra are collapsed to 1D, typically binning 200 rows to coverthe beam spread. Integration times are approximately 3 ms,longer than the plasma duration, which is on the order of 10 ms.Therefore it captures some background light that is partlyremoved when a dark (¼ no laser) spectrum of the same dura-tion is subtracted. The CCD itself is not gated. Wiens et al.4
describe the in-ight performance of the unit. The ChemCammast-unit also houses the RMI, a high-resolution camera that is
63–889
inherited from the ESA Rosetta project. Its eld-of-view is20 mrad. It can identify a 1 mm feature from a 10 m distance,making it the highest resolution remote sensing imager onCuriosity. Le Mouelic et al.5 provide details of its in-ightperformance.
Mars rovers must operate robotically at all times due to thelong 3–22 light travel times between the Earth and Mars. TheMSL rover, also known as Curiosity, typically receives a set ofcommands at the beginning of its day on Mars, and thesecommands cover the whole day of operations, or several days onthe weekend. Downlinks of data to the Earth are relayedthrough either the Mars Odyssey or Mars Reconnaissance Orbiterspacecra, usually at the end of Curiosity's day. The data arereceived by NASA's Deep Space Network of satellite dishesaround the world. ChemCam is operated, on average, between 1and 2 h every other Sol (Mars day).6
ChemCam was rst turned on right aer landing, and on Sol13 of the landed portion of the mission it acquired its rst LIBSdata on a target named “Coronation”. Between Sol 13 and Sol800, �188 000 LIBS spectra were acquired on �5800 pointsdistributed over �650 individual targets. In addition,�3300 RMI images were acquired (see Table 1 for details).Several months aer the end of the nominal mission (Sol 668),on Sols 799 to 801, ChemCam experienced its rst anomaly. Asthe instrument was acquiring standard data, the emission of itscontinuous wavelength laser, which was used to focus theinstrument telescope, started to fade away rapidly. Le withoutits nominal autofocus capability, the instrument has beenoperated differently thereaer. The period extending from
landing (Sol 0) to Sol 801 is named by the ChemCam team“Season-1”. This paper reports on the use and performance ofChemCam over Season-1 exclusively. Season-2 corresponds toa 6 month period of degraded performance for the focus capa-bility, which was subsequently fully compensated for withcomplex operational modes. Aer a number of sowareupgrades, the initial performance and operational efficiency arerestored as of Sol 983, the start of Season-3.
In this paper, we present an overview of the rst LIBS expe-rience on another planet. The rst section “Analytical capa-bility” summarizes the data processing to provide elementalcompositions and target classication, and provides a compre-hensive description of the limits of detection, accuracy, andprecision that are obtained with ChemCam. The followingsection “Implementation and operations” covers all aspects ofthe operations, discussing relative merits of depth proles,rasters, and other operational tools used to investigate theMartian surface. This is the rst time that such a criticalassessment is given of the LIBS technique as applied to plane-tary exploration. The last section “Key ndings from elementalcomposition” presents a bird's-eye view of the many scienticresults from ChemCam.
Analytical capability
In this section we provide the general concepts of data reduc-tion and the actual state of elemental detection and quanti-cation. The rapid pace of scientic discoveries on Marspresented additional challenges to the development of theanalytical capability and calibration standards because impor-tant discoveries, such as the presence of clays on Mars7–9 weremade aer selection of the instrument by NASA.
Pre-processing and elemental identication
ChemCam pre-processing is described in the study of Wienset al.4 and is summarized here. Raw data from the deep spacenetwork are instantly delivered by the Operational ProductGeneration System of the MSL Ground Data System. ChemCamLIBS spectra are processed as follows, and in the followingorder.
Dark removal. For each burst of laser shots, a non-laserbackground exposure of the same duration is recorded. We callit a “dark” spectrum. It is averaged over several exposures(typically 30) to decrease its intrinsic noise, and is subtractedfrom each laser-induced spectrum. LIBS pits modify the localalbedo. Thus ideally the LIBS spectrum from each laser shotshould have a corresponding distinct dark spectrum. However,this is not practical and instead a single dark spectral average istaken before or aer the laser burst.
Noise removal. Wavelet transform is used to decomposeindividual LIBS spectra.10 At each wavelet, an estimation of thenoise is calculated and a hard thresholding at 3 sigma isapplied. The de-noised spectrum is reconstructed.
Continuum subtraction. The continuum under LIBS emis-sion lines is caused by bremsstrahlung and ion–electronrecombination. It is extracted using the lower frequencies of the
wavelet transform. A t to the local minima is performed inwavelet space. The technique provides a rapid and efficient wayto remove the continuum over the large spectral range of eachspectrometer separately. However, when spectral studies areperformed over very narrow spectral ranges, oen with peaktting, some additional continuum contributions sometimesneed to be removed. The background signal, including thecontinuum, is distance dependent, so its subtraction partiallycorrects for distance biases.
Wavelength calibration. A titanium calibration plate on-board Curiosity is used to establish a channel-to-wavelengthrelationship and to track potential dris. The Ti spectrum isrich with hundreds of lines in the UV, VIO, and VNIR spectralranges. The wavelength calibration varies with the spectrome-ters' temperature, moving by �4 pixels over the observed range(�4 �C to +30 �C). The nal spectra are calibrated to better than0.2 pixels, which corresponds to 0.01 nm in the UV. The Ti plateis regularly targeted to verify the wavelength calibration and totrack potential instrument change with age.
Counts to photons. Finally, the LIBS signal as recorded bythe spectrometers in Digital Numbers (DN) is converted tospectral radiance in phot/shot/mm2/sr/nm at its source. Thisconversion accounts for the optical characteristics of the tele-scope, the analog-to-digital conversion electronics, the spec-trometer response function (all of the above calibrated beforelaunch)4 and the distance to target in 1/R2 (where R is thedistance).
Distance effects. The on-target energy density (in MWmm�2)inuences plasma conditions. As the distance from the mastincreases from 1.56 m to 7 m, the laser spot size increases from300 to 550 mm diameter.2 Therefore, a change in the plasmaenergy as a function of distance from the mast is expected.However, with the continuum subtraction, the response func-tion in 1/R2 above, and a normalization to the total number ofcounts per spectrometer (aer background subtraction),distance effects are removed to rst order. The plasmatemperature is independent of distance within uncertainty asshown by Wiens et al.4 However, there are subtle effects that areemission line specic and need to be taken into considerationas a second order distance correction. These effects affect theintensities of the measured LIBS emission lines and, by andlarge, can be taken into account by carefully selecting LIBSemission lines acquired from the Martian dust.11
Pre-processed spectra yield calibrated atomic/ionic emissionlines, which allow element detection and identication. Typi-cally, neutral and rst ionized atomic lines are observed, andunder the very favorable Martian conditions, occasionally weobserve second ionized lines. Accounting for the Mars-to-vacuum pressure difference, all LIBS lines detected on Mars arefound in the NIST database. The instrument is calibrated tovacuum wavelengths. To facilitate line identication, theChemCam team has developed its own Martian database,12
which is therefore a subset of the NIST library specically foremission lines typically observed with the ChemCam laser u-ence and under Martian ambient pressure. This database anda related visualization tool are accessible with the archived dataon NASA's Planetary Data System (PDS).
Fig. 1 Overview of major elements detection. Thirty shot average spectrum for “Saline_Valley” (Sol 707). Bottom to top: data from the UV, VIO,and VISIR spectrometers. Wavelengths are along the x-axis and count rates along the y-axis. Vertical scales are normalized, per spectrometer, toone for clarity. A few peaks for major elements are highlighted. Blue boxes, labeled (A) to (J), correspond to the range of wavelengths for insets inFig. 2.
JAAS Paper
Publ
ishe
d on
16
Febr
uary
201
6. D
ownl
oade
d by
Cal
ifor
nia
Inst
itute
of
Tec
hnol
ogy
on 0
2/09
/201
6 15
:24:
58.
View Article Online
Fig. 1 is a standard product from a ChemCam automaticprocess. For each burst, an average spectrum is generated withnoise removal, background subtraction, wavelength calibration,and dark subtraction. A few peaks for major elements arehighlighted. Because of their large abundance, a few lines formajor elements have high signal-to-noise ratios (typically >100).Four closely spaced Mg lines around 279 nm are the dominantcharacteristic of the UV range. There are also Ca lines near316 nm and a Si peak at 288.24 nm. Half of the peaks in thisregion are typically from Fe. The series Ca–Al–Al–Ca around395 nm is characteristic of the VIO range. There are approxi-mately half as many VIO peaks as in the UV range. This region isnot so dominated by Fe (only 1/4 of the lines). The oxygen peaksaround 777 nm and 845 nm are characteristic of the VNIRrange, as well as the Na doublet at 589 nm. Fig. 2 shows spectralplots over very narrow wavelength ranges for the detection ofminor and trace elements. Each spectrum is normalized to thetotal number of counts per spectrometer. We use two targets asreferences: “Coronation” (Sol 13), the mac rock that wasChemCam's rst target, and “Ross” (Sol 379), a typicalsandstone.
866 | J. Anal. At. Spectrom., 2016, 31, 863–889
While not expected, in addition to atomic/ionic emissionlines, molecular lines have also shown to be diagnostic ofelemental composition under certain circumstances. Molecularlines form when atoms recombine in the cooling plasma. In theLIBS analytical eld, they are far less studied and used thanionic and atomic transitions. However, recent laboratorystudies13–15 have opened the path for quantitative analysis andlow limits of detection (LoD) from the use of molecular lines.
High-level processing
Several techniques are part of the ChemCam toolbox for high-level processing. They depend on various calibration sets ofwell-known compositions.
The “univariate technique” is straightforward in atomicspectroscopy, and yet provides rapid and useful results. Peaktting and local adjustments of the continuum are necessary toisolate emission lines of interest and to calculate peak areas. Acalibration curve is obtained for the regression between thisvariable (area or line strength) and known elemental abun-dances. The univariate technique is particularly adapted toelements that have very few LIBS lines, oen the case for trace
Fig. 2 Spectral focus for the detection of minor and trace elements. Wavelengths are along the x-axis and count rates along the y-axis. Eachspectrum is normalized to the sum of the counts, per spectrometer. For each panel, the black spectrum corresponds to “Ross” (Sol 379) and/orthe blue one to “Coronation” (Sol 13). Panel A: detection of P. The red spectrum is for “Epworth #5” (point 5, Sol 72). Panel B: detection of Ni. Redis “Mammoth #4” (Sol 758). Panel C: detection of Mn and Sr. Red is “Neil #7” (Sol 619). Panel D: detection of Sr and Cr. Red is “Copper_Queen #4”(Sol 746). Panel E: detection of Ba. Red is “Akaitcho #7” (Sol 50). The zoom in red is “Akaitcho #7” minus “Coronation” to highlight the Ba peak.Panel F: detection of Zn. Red is “Neil #7” (Sol 619). Panel G: detection of S. Red is “Cumberland #3” (Sol 292). Panel H: detection of CaCl and CaF.Red is “Epworth #5” (Sol 72). Green is “Cumberland #3” (Sol 292). The zoom (factor�50 along the y-axis) is for “Cumberland #3” to highlight themolecular line for CaCl. Panel I: detection of H, C, and Li. Red is “Saline_Valley” (Sol 707). Green is “Marquette #3” (Sol 335). Panel J: detection ofRb. Red is “Starck” (Sol 15).
Paper JAAS
Publ
ishe
d on
16
Febr
uary
201
6. D
ownl
oade
d by
Cal
ifor
nia
Inst
itute
of
Tec
hnol
ogy
on 0
2/09
/201
6 15
:24:
58.
View Article Online
and minor elements, to some line ratios such as Al/Si, andoccasionally to major elements.16,17 It does not account for“matrix effects” (factors that cause line intensity to vary inde-pendently of elemental concentration, or possibly from emis-sions by other elements – see the multivariate techniquesdescribed in the next paragraph as a way to overcome thisproblem) as it discards much information in the spectrum.Univariate calibrations use the normalization to total counts toaccount for the overall plasma intensity.
Multivariate techniques use the entire spectrum (or a signif-icant portion of it) to develop a regression model.18–22 They canbe more robust to matrix effects because they use most of theavailable information. Multivariate methods are much morecomputationally intensive than the univariate method. Theyapply very well to major elements, most of which have a largenumber of strong emission lines over a wide spectral range.Besides the selection of the training set (next paragraph),a couple of parameters are adjustable to optimize the t for each
element: the number of components, and spectral normaliza-tion.18 Two multivariate techniques were used by ChemCam:Partial Least Squares (PLS) regresses multiple spectra (thetraining set) against a single element at a time (PLS1) orsimultaneously against multiple elements (PLS2). It is closelyrelated to the Principal Component Analysis (PCA) technique,which projects the data onto the directions of the largest vari-ance of the data. Independent Component Analysis (ICA) isa blind source separation technique that extracts independentspectral components from a large population of spectra. ICAscores are correlation coefficients for each of the independentcomponents. ICA spectral components have been shown toisolate the emission lines from a single (oen major) elementvery well.22 Thus the scores of certain ICA components correlatewith the concentrations of elements of interest. ICA scores arenormally used for classication, but with the benet of a verylarge dataset of spectra from standards of known compositions(next paragraph) we can also derive a correlation between ICAscores and absolute elemental concentrations. Thus ICA is usedin our purpose for quantication. Calibration curves werederived for each element by plotting the relevant ICA scoreagainst the known composition of targets analyzed in thelaboratory. PLS and ICA are not exclusive; there are advantageson both sides. It is even possible to combine the best resultsfrom each approach into a more optimized model that matchesexpected geochemical relationships better.23
The success of these techniques depends on the quality ofthe input database in terms of number of targets and compo-sitional range coverage. There are currently three such data-bases. The rst one consists of spectra collected from ten targetson-board the rover.24,25 These targets are intensively used forverication of instrument health, for wavelength calibration,and to support quantication. However, due to their limitednumber, they do not cover the full range of compositions onMars. Prior to launch, the science team assembled a collectionof 69 geochemical standards,4 and obtained spectra with the
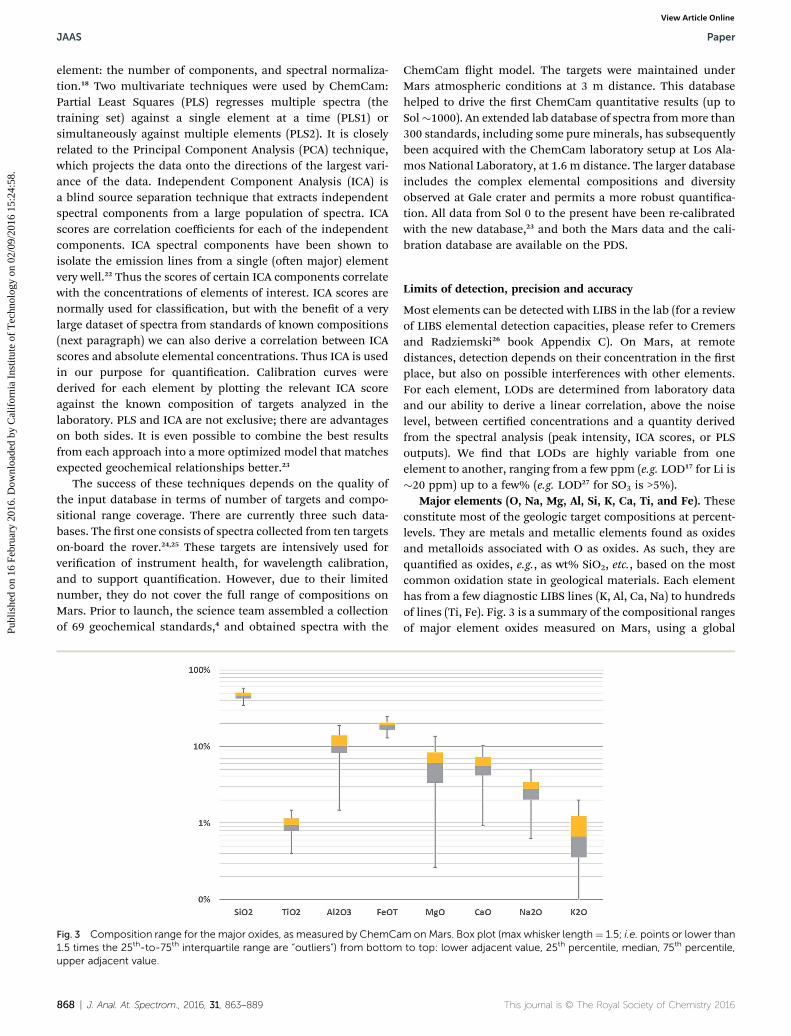
Fig. 3 Composition range for the major oxides, as measured by ChemCa1.5 times the 25th-to-75th interquartile range are “outliers”) from bottomupper adjacent value.
868 | J. Anal. At. Spectrom., 2016, 31, 863–889
ChemCam ight model. The targets were maintained underMars atmospheric conditions at 3 m distance. This databasehelped to drive the rst ChemCam quantitative results (up toSol�1000). An extended lab database of spectra frommore than300 standards, including some pure minerals, has subsequentlybeen acquired with the ChemCam laboratory setup at Los Ala-mos National Laboratory, at 1.6 m distance. The larger databaseincludes the complex elemental compositions and diversityobserved at Gale crater and permits a more robust quantica-tion. All data from Sol 0 to the present have been re-calibratedwith the new database,23 and both the Mars data and the cali-bration database are available on the PDS.
Limits of detection, precision and accuracy
Most elements can be detected with LIBS in the lab (for a reviewof LIBS elemental detection capacities, please refer to Cremersand Radziemski26 book Appendix C). On Mars, at remotedistances, detection depends on their concentration in the rstplace, but also on possible interferences with other elements.For each element, LODs are determined from laboratory dataand our ability to derive a linear correlation, above the noiselevel, between certied concentrations and a quantity derivedfrom the spectral analysis (peak intensity, ICA scores, or PLSoutputs). We nd that LODs are highly variable from oneelement to another, ranging from a few ppm (e.g. LOD17 for Li is�20 ppm) up to a few% (e.g. LOD27 for SO3 is >5%).
Major elements (O, Na, Mg, Al, Si, K, Ca, Ti, and Fe). Theseconstitute most of the geologic target compositions at percent-levels. They are metals and metallic elements found as oxidesand metalloids associated with O as oxides. As such, they arequantied as oxides, e.g., as wt% SiO2, etc., based on the mostcommon oxidation state in geological materials. Each elementhas from a few diagnostic LIBS lines (K, Al, Ca, Na) to hundredsof lines (Ti, Fe). Fig. 3 is a summary of the compositional rangesof major element oxides measured on Mars, using a global
model that combines ICA regression and sub-model PLSresults.23 For each box plot, limits from the bottom to topcorrespond to the lower adjacent value, the 25th-percentile, themedian, the 75th-percentile, and the upper adjacent value. TheWhisker length is 1.5, as it will be for the rest of this publica-tion: points are considered as “outliers” if they are higher orlower than 1.5 times the 25th-to-75th interquartile range. Fora normal distribution, such a limit corresponds to �2.7s. Thischart shows the wide range of compositions for targets withintheir Martian context, the mineralogy being dominated by sili-cates. The sum of all oxides (not shown) has a median of94.5 wt%, a lower value at 82.3 wt% and an upper value at106.7 wt%. Because the sum of all oxides is not constrained to100%, values above this limit correspond to statistical varia-tions around each oxide modelled composition that are prop-agated onto the total, or may reveal a composition very differentfrom our reference database or with differing LIBS behavior.The same applies to values below 100%, but this is generallyexplained by undetectable elements or elements difficult toquantify with LIBS (e.g., SO3).
To estimate the accuracy of the ChemCam predictions, weuse the root mean squared error of prediction (RMSEP) froma test set of laboratory samples of known composition. RMSEPis reported on the basis of leave-one-out cross-validation4 orn-fold cross validation23 using the differences between the pre-dicted and known values of each element. The test set for eachmajor element was selected to have a distribution as similar aspossible to the full training set used to generate the regressionmodels. The accuracy of predicted compositions varies withcomposition. For example, the SiO2 RMSEP is�4.9 wt% for wellpredicted concentrations around 60 wt%. However the tech-nique is less sensitive to low Si concentrations. Hence, we ndan RMSEP of �7.1 wt% for concentration of SiO2 around35 wt%. The reader should refer to Anderson et al.23 and futurepublications for a discussion on the maximum RMSEP valuesthat can be considered for each oxide.
ChemCam precision on homogeneous targets at a constantrange, such as on-board calibration targets, is excellent. Toestimate the precision, we take the standard deviation of cali-bration target observations with high signal-to-noise. We obtaina range of precision values for each of the oxides: SiO2 (0.45–1.91 wt%), TiO2 (0.02–0.11 wt%), Al2O3 (0.24–1.74 wt%), FeOT
(0.61–1.65 wt%), MgO (0.26–0.66 wt%), CaO (0.45–2.12 wt%),Na2O (0.10–0.2 wt%), K2O (0.006–0.28 wt%). Note that theseprecision values are for observations on different sols, differentrover orientations, and different times of the day. Repeatedobservations of the same target under identical conditions mayshow even less variation than the precisions listed here. Theresults described here complement the precision results givenin a more abbreviated form in the study of Blaney et al.28 forprecision within a raster and from day to day. On unknowntargets, the precision is reported as the standard deviation ofthe abundances derived from a shot-to-shot analysis (typicallybursts of 30 shots). As a side note, ChemCam does not appear tohave ever shot a Mars target that was translucent or transparentenough to not produce a spark. This likely occurs because the
ubiquitous global dust interacts with nearly every surface,facilitating sparking even on very Si-rich rocks.
Non-metallic elements (H, C, O, P, S). Oxygen is included inthis list for consistency, but its case cannot be dissociated fromother major elements (see above). The amplitudes of the Oemission lines are not necessarily proportional to the amount ofO in the target, because of coupling of the plasma with CO2 inthe atmosphere. Generally non-metallic elements are difficult todetect and to quantify, with the exception of H,26 in spite of theirimportance for biogenic-related science. Nitrogen is not in thislist: it has been seen in the laboratory for concentrations above5%, but not yet on Mars.
The hydrogen peak at 656.6 nm from the Balmer series is theprime indicator for H detection. It can be deconvolved from thenearby carbon triplet around 658 nm (Fig. 2, panel I), which isdue to the breakdown of the atmospheric carbon dioxide. A lotof care needs to be given to the dark subtraction, because of theFraunhofer absorption line in the sunlight reected back fromthe target.29 H peak intensity varies signicantly with target typeand chemical group. A ubiquitous strong hydrogen signal isfound for dust and soils.30 Rocks display medium to low signalsdepending on their type.
Several carbon lines at 247.9 nm (CI), 658 nm (CII) and833.74 nm (CI) are detected on all targets analyzed by Chem-Cam on Mars. This is primarily due to the contribution of theMartian atmosphere (96% CO2) to the LIBS plasma. Whentargets with higher carbon contents are analyzed, the intensityand number of detected C peaks increase to reach a total of 18 Cpeaks and 21 C2 Swan bandheads in the case of the puregraphite CCCT5 target.31,32 Univariate models for carbondetection were generated based on the intensity of those linesand indicated that the limit of detection for carbon was rela-tively high, around 5 wt%.31 So far in the mission, no ChemCamtarget has demonstrated levels of carbon line intensity statisti-cally above the variations induced by the Martian atmosphere.In the meantime, the carbon line at 657.8 nm (Fig. 2, panel I),which interferes with the hydrogen line at 656.3 nm, is routinelyanalyzed to evaluate a laser coupling proxy in the determinationof target hydration with ChemCam.
Phosphorus at geological concentrations is difficult toobserve with LIBS. The most intense phosphorus lines in theChemCam range are around 253 and 255 nm, where Fe signa-tures dominate (Fig. 2, panel A). There are other lines at919.3 nm at the edge of the VNIR spectrometer. Phosphorus hasbeen identied on Mars with ChemCam;33 the team is stillworking at dening an accurate LoD for P2O5.
Sulfur is difficult too with LIBS, especially with ChemCambecause its ionization energy is relatively high and most of theintense S peaks lie outside the range of the spectrometers.34,35
Weaker lines at 543.3, 545.4, 547.4 nm, and around 564 nm areregularly used (Fig. 2, panel G). A preliminary LoD around 5–10% was obtained for SO3. The detection of S is particularlyimportant for the identication of calcium sulfates.27
Halogens (F and Cl). Fluorine and chlorine are importantbut difficult to detect. Transitions between various excitedstates yield F and Cl atomic/ionic peaks around 685.6 nm and837.6 nm, respectively. Because of low energy levels, only high
LoD values around 5 wt% are usually obtained,26 which is notwell suited for most geological studies. Alternatively, molecularlines form when atoms recombine in the cooling plasma. Mostof the observed LIBS molecular emissions on the Earth areoxides for which the ambient air typically supplies the O atom.36
Thanks to the long integration time of the ChemCam spec-trometers (3 ms), molecular emissions of both CaF at 603.1 nmand CaCl at 593.5 nm were observed at Gale crater,37 which wasthe rst detection of F on Mars (Fig. 2, panel H). Experimentsperformed at Los Alamos National Laboratory (LANL, NewMexico) under Martian conditions yield LoD of 0.2 wt% foruorine. Up to Sol 800, about 100 targets exhibit the CaFmolecular emission, with some concentrations up to 14 wt% forF. At such a level, uorite (CaF2) is the most likely trace mineral;in these cases the F atomic lines are also observed. For chlorine,the molecular emission of CaCl has been only rarely observed(fewer than 10 cases). In contrast to uorine, the atomic chlo-rine line at 837.6 nm seems to bemore frequently observed thanthat of the CaCl molecular emission. The cause of thisdiscrepancy can perhaps be found in the low Ca concentrationof the Cl-bearing samples. Another possible explanation isa preferable recombination of Cl with Mg, which ChemCamcannot observe in the molecular form because the emissionlines are located in the detection gap between the UV and VIOdetectors. The few ChemCam observations of CaCl have beenassociated with excesses of Na, causing the presence of NaCl tobe suspected.
Minor and trace elements (Li, Rb, Sr, Ba, Cr, Mn, Ni, Zn).These concentrations range from a few ppm to 0.1–1 wt%. Sucha large range is reected in the Relative Standard Deviations(RSDs) of the emission peak areas (highest for the lowestamounts, and lowest RSDs for the highest concentrations). Boththe univariate technique and PLS are used to quantify theseelements, based on the on-board calibration targets4,16,24,25 andlaboratory sample suites that are custom-made for thatpurpose.
Lithium is a light lithophile element and is not usuallyincluded in geochemical assays because it is not detected byX-ray uorescence or some other typical assaying techniques.ChemCam provides a rapid quantication of lithium at the ppmlevel as its (unresolved) doublets at 670 (Fig. 2, panel I) and812 nm are very well detected with LIBS.38 Several models usingPLS and univariate techniques have been tested. The LoD for Liis around 20 ppm.17
Rubidium is rather easy to detect above the oxygen at 777 nm(Fig. 2, panel J). It has been modelled using a PLS methodadapted to a restricted set of emission lines.17 The detectionlimit is�10 ppmwith an accuracy of�30 ppm. Rb is expected tobe present above detection limits in feldspar, mica and clayminerals, and is oen detected with ChemCam.
There are several strontium peaks but the one at 421.67 nm(Fig. 2, panel D) provides the best univariate and PLS calibrationcurves with low RSDs.16,17 The accuracy is �200 ppm and LoDsare as low as tens of ppm. Strontium is usually representative ofCa- or K-rich minerals.
Barium is quite difficult to detect. Among several peaks, themain line at 455.5 nm can be detected down to 100 ppm, being
870 | J. Anal. At. Spectrom., 2016, 31, 863–889
careful with interferences with Si III and Ti (Fig. 2, panel E). Thebest models are obtained with the univariate technique. Theaccuracy is �700 ppm.17 The highest values of barium werefound in Martian K-feldspars.39,40
Chromium is quite difficult to quantify in geological mate-rials with LIBS, because its peaks between 424 and 430 nminterfere with Fe. The accuracy is around 710 ppm.16 However,the detection limit is quite low, down to tens of ppm. A newquantication will be developed using lab standards, witha larger range of concentrations to simulate actual Martiancompositions.
Manganese has many LIBS peaks scattered across theChemCam wavelength range. The 403–404 nm range (Fig. 2,panel D) is relatively free of interferences12 and is thereforesuited to use for quantication of MnO. A dedicated set ofstandards (0.43 to 76 wt% MnO) was run at LANL. The LoD wasfound at �0.06 wt% MnO. The accuracy scales with theabundances.41
Nickel is challenging to detect in geological materials withLIBS. The most important lines are at 301.28 nm, around305 nm, and at 309.35, 310.27 and 313.5 nm (Fig. 2, panel B). Nihas so far been observed in only two Mars targets, with detec-tion limits higher than 1000 pm.
There are several lines to identify Zn around 330 and 334 nm.The strong Zn line at 481.2 nm (Fig. 2, panel F) is used toidentify and quantify ZnO, using a dedicated calibration set ofsamples enriched in zinc to generate a univariate quanticationmodel. The ChemCam limit of quantication for ZnO is 3 wt%(at 95% condence level) and 1 wt% (at 68% condence level)and ChemCam's limit of detection is around 0.7 wt%.42
Implementation and operations
Beyond its analytical capability for elemental composition, LIBSas a tool for exploration offers the geochemist several advan-tages that have been widely discussed in the literature:1,43–46 nosample preparation, analysis within its petrological context,dust removal, sub-millimetre scale investigation, multi-pointanalysis, the ability to carry out statistical surveys, and whole-rock analyses, and rapid data acquisition. Aer �800 Sols ofintensive MSL operations at Mars, ChemCam can now be usedto benchmark the advantages of LIBS for in situ geochemistry(and sometimes mineralogy) on another planet.
To aid the following discussion, a few denitions are givenhere. A “burst” is a continuous series of laser shots, withChemCam usually done at 3 Hz, up to 150 shots. A spectrum isregistered for each laser shot. All spectra are returned, whilereturning the average spectrum only is rarely requested. A“point” is a single location on Mars, which is investigated mostoen by one laser burst or by several laser bursts with nomotion of the mast. A “depth prole” is a point analysis usingmore than 50 and up to 1000 laser shots in order to investigatepossible changes of composition with depth. “A raster” isa multi-point investigation following different geometricalarrangements (M � N, with M and N from 1 to 20). A “target” isa unique rock/soil feature onMars, which is duly registered with
Fig. 4 Cumulative number of laser shots during ChemCam Season-1.The linear fit (dot) has a slope of 238 shots per sol. Fig. 5 Histogram of target distances to ChemCam. Two populations
are highlighted: blind targets (red) around 3 m, calibration targets(blue) at �1.56 m.
Paper JAAS
Publ
ishe
d on
16
Febr
uary
201
6. D
ownl
oade
d by
Cal
ifor
nia
Inst
itute
of
Tec
hnol
ogy
on 0
2/09
/201
6 15
:24:
58.
View Article Online
its own name by the MSL science team. The same target can beinvestigated by several rasters or/and individual points.
Table 1 keeps track of the different activities conductedduring Season-1: >5800 individual points have been interro-gated on >650 targets with a total of >180 000 laser shots.Multiple interrogations of the same target are the rule, such aswith a raster. ChemCam was operated approximately everyother day: on 419 of the rst 802 Sols. The imaging capabilitywith the RMI proved to be more useful than expected:5 LIBSpoints are always documented by one or more RMI images,providing high resolution views of the targets both before andaer the laser shots. An additional color Mastcam image is alsousually acquired aer the LIBS for a broader context. Fig. 4displays a cumulative histogram of laser shots during Season-1.Periods with no ChemCam activities can be easily spotted; theseare mostly Christmas vacations and solar conjunction. Othersuch times were due to rover ight soware updates or ananomaly. Aer a learning period of approximately 60 Sols, anaverage rate around 238 shots per sol was reached.
Standoff
A remote capability is clearly an advantage for planetary explo-ration. Prior to its delivery, the instrument was tested and qual-ied to 7 m – hereaer, unless otherwise specied, foroperational purposes, the “distance from ChemCam” is denedfrom the center of ChemCam's outer face along the telescopeoptical axis. Theminimumdistance, excluding calibration targetson the rover deck, is 2.17 m (“Ritchie”, Sol 401). This is essentiallythe distance from ChemCam's telescope to the ground directly infront of the rover. Themaximum distance measured onMars was7.45 m (“Mell”, Sol 530) generating useful qualitative results (lineidentication, classication) but low signal-to-noise for shot-to-shot analysis. As an empirical rule, only spectra for targets below5 m are used for quantitative studies. Fig. 5 displays the histo-gram of target distances as acquired by ChemCam. Most targetsare shot at relatively close proximity to the rover; the distributiondecreases regularly with distance. The primary reason for thistrend is the resolution of imagery that is used by scientists toselect the targets. Navcam cameras are a pair of monochromeimagers mounted on the rover mast, just below ChemCam. This
is the primary tool for target selection; the pixel size at the centerof Navcam's eld-of-view is 0.82 mrad per pixel. At least 3–4 pixelsare generally needed to visualize a feature. Therefore it is difficultto visualize features that are <5 mm, such as veins, porphyriticrocks, laminae, etc. Hence the resolution of images that are usedfor pointing and shooting the laser seems to bias the choice ofChemCam targets. Small targets are also harder to hit furtheraway. The science team also recognized that signal-to-noise isbetter at a close distance, inuencing their choice. Thus, half ofthe targets are below 3 m, and 95% below 5 m. The populationbetween 2.1 and 2.5 m is particularly important because it coin-cides with the arm work zone (a 80 cm diam. cylinder, �1 m infront of the rover), where ChemCam is used to document thecontext of contact and drill science. Targets at 1.56 m correspondto the calibration targets that aremounted at the rear of the rover.There is also a “surplus” of targets around 3 m because ofa ChemCam blind mode: on certain sols, in the absence of Nav-cam context images for target selection following a rover drive,a xed position at �3 m, AZ ¼ 90� (right side of the rover), wasautomatically targeted during Season-1, mostly along traverses,for a statistical survey of the soils and other surface materials.47
Fig. 6 shows the ChemCam targets projected on the ground.Because of the mast position near the front right corner of therover deck and the implicit distance bias described above, mostChemCam targets are located in front of the rover and to itsright. The maximum distance to the intersection of the mastwith the ground is �7 m. Besides, at the end of each drive,a specic mosaic of ChemCam targetable region is taken(Navcam 5 � 1 stereo) in front of the rover, introducing furthera bias in the distribution of ChemCam targets. While Chem-Cam is a quick analysis instrument (see below), only �1 to 5targets are sampled per sol when the instrument is ON, which isnot sufficient to survey the entire surroundings. Thus scientistsneed to make the best use of Navcam images to pick ChemCamtargets to optimize the representativity of their sampling.
Curiosity's mast pointing capability is key to the success ofChemCam investigations. We nd the actual pointing accuracyto be within �2 mrad, as an end-to-end budget that includesuncertainties in azimuth (AZ) and elevation (EL) motors and
Fig. 6 Distribution of LIBS targets around the rover. The origin ofdistance is at the nadir of the Remote Sensing Mast (RSM). Blind targetsare circled in red, the calibration targets are located in blue and thegreen circle represents the arm work zone.
Fig. 7 Pointing capability and ChemCam rasters: (a) MAHLI image of“John Klein” 1.6 cm-diameter drill hole, Sol 270; LIBS markings (redarrows) appear on the hole wall. (b) “McGrath”, 1 � 20 raster, Sol 226;(c) “Takurak”, 3 � 3 raster, Sol 165; (d) “Deep Kill”, 5 � 1 raster, Sol 443.Images (b)–(d) have the same scale, shown in (c). Images: NASA/JPL-Caltech/MSSS, NASA/JPL-Caltech/LANL/CNES/IRAP/IAS/LPGN/CNRS/LGLyon/Planet-Terre.
JAAS Paper
Publ
ishe
d on
16
Febr
uary
201
6. D
ownl
oade
d by
Cal
ifor
nia
Inst
itute
of
Tec
hnol
ogy
on 0
2/09
/201
6 15
:24:
58.
View Article Online
associated coding devices, camera models, projection errors,and registration of the Navcam images. This is �3 times betterthan the stated requirements. This excellent performance hasallowed us to target very small features on Mars, as shown inFig. 7, such as inside a 1.6 cm – diameter hole that was createdby the rover's drill (panel a) or at various sub-mm size structures(panels b–d). To make sure that some features below 1 mradcould be targeted, the ability to perform small AZ/EL incrementsis very important: �0.5 mrad is regularly achieved. Panelb shows a very closely spaced raster performed to investigatea several-mm-wide transition zone. A repeatability of�0.5 mradwas also measured in the best case, allowing the science team totarget very small veins, but sometimes aer repeating differenttypes of rasters over a few sols. Using 2D rasters oen providesthe best opportunity to interrogate a vein, such as that pre-sented in panel c. Because the images available for targeting arenot always high resolution as mentioned above (especially whenthe rover moves every day and the images that can be down-linked for planning are limited), sometimes successful pointingon the smallest geological targets is somewhat fortuitous.
Flexibility and adaptability
ChemCam is a very versatile instrument, with the result that it issomewhat complex to operate. Many different congurations havebeen tested as the team converged toward using a few operationalmodes. With regard to the laser itself, several parameters can beadjusted,2 including its repetition rate, beam intensity, and thenumber of laser shots per burst. The repetition rate ranges from 1to 10 Hz. We found no noticeable relationship between thisrepetition rate and ChemCam analytical performance. Faster isbetter in terms of rover resources (to shorten ChemCam activities)
872 | J. Anal. At. Spectrom., 2016, 31, 863–889
but 3Hz was nally decided on to avoid thermal constraints on thelaser. A burst of 30 shots takes 10 seconds instead of theminimumof 3 seconds, not a noticeable difference when focusing, imaging,and laser warm-up are factored in. The energy output is controlledby the input current delivered to the laser ampliers, with choicesof 40 A (56% of the energy on target that is deposited at 95 A), 60 A(71%), 80 A (87%), and 95 A (100%, nominalmode).More energy isbetter in LIBS, but the drawback is to sometimes saturate emissionlines. Saturation corresponds to 16 300 DN on the spectrometeranalog-to-digital converters. At nominal output power (14 mJ ontarget, driven by 95 A) we found saturation at up to 3 m targetdistances forMg (quadruplet of lines between 279.635 and 280.353nm), O (777.408, 777.630), Ca (393.477 and 396.774), and Na(589.158, 589.756). This situation is troublesome as the maxima ofthose peaks were lost. Lowering the input current to 60 A (�10 mJon target) at target distances below 3 m did indeed allowmeasurements of the full dynamic ranges of the peaks and wasused regularly up to Sol 400. While avoiding saturation, this yiel-ded additional matrix effects as the energy to build up the plasmatemperature was drastically different as a function of distance. So,thereaer, 95 A has been used for all targets, with the under-standing that only the highest portion of the peak is missing andthe peak area is not affected by more than 10% of its full-heightvalue. However, what is true for geological targets is not for cali-bration targets, where too many lines are saturated and wheresaturation accounts for a large fraction of the peak area when shotat this energy level. Thus, calibration targets were shotmostly at 40A as shown in Table 1, and at 95 A. High level processing was thenused to develop dedicated calibration curves at 40 A or to masksaturated lines. All spectra are checked for peak saturation and thedata are culled from the PDS if saturation is observed.
Another important parameter is the number of laser shotsper burst. The relevant question is: what is the number of lasershots that would be necessary to effectively minimize Poisson orshot noise? Shot noise is intrinsic to photon counting experi-ments and can only be reduced by increasing the number ofcollected photons, in contrast to systematic errors that may becorrected by other means (see the section on Pre-processing).ChemCam laser shots per burst can be adjusted from 1 to 150.As a test case, 14 bursts of 30 shots were used on “Jake-M” (Sols45–48) and treated as independent variables; they are randomlymixed as a collection of 420 individual spectra. Counts underthe strong Na line at 819.7 nm are accumulated over 5 pixels.We have explored successively the possibility of acquiring Nspectra with N varying from 1 to 30. For each value of N, 420/Ngroups of N line intensity values were studied, from which totalcounts could be extracted. From the 420/N groups, the meanand Relative Standard Deviation (RSD) of the total counts werecalculated. The RSD decreases as 1 over the square root of thenumber of counts as expected, to even out around 6% RSD aer20 shots. Many other targets, other lines, and other randomarrangements have been tested for the same result: a stable RSDbetween 4% and 8% aer 20 shots (Table 1). Since the rst fewshots (<5) are typically imprinted by the signature of the dust,32
the ChemCam science team has recommended that, whenpossible, all points are to use 30 shots to acquire sufficientstatistics with margin, when building mean spectra.
Beyond the number of laser shots, most of ChemCam'sexibility comes from the geometrical arrangements of laserpoints. Ever since they were validated on Sol 19, rasters havebeen used extensively to target very ne features (veins,concretion nodules, vugs, laminae, cross-beddings, etc.) and tocover the heterogeneity of a target. Thus we have performed 5471D or 2D rasters out of 566 activities (Table 1) for a variety of
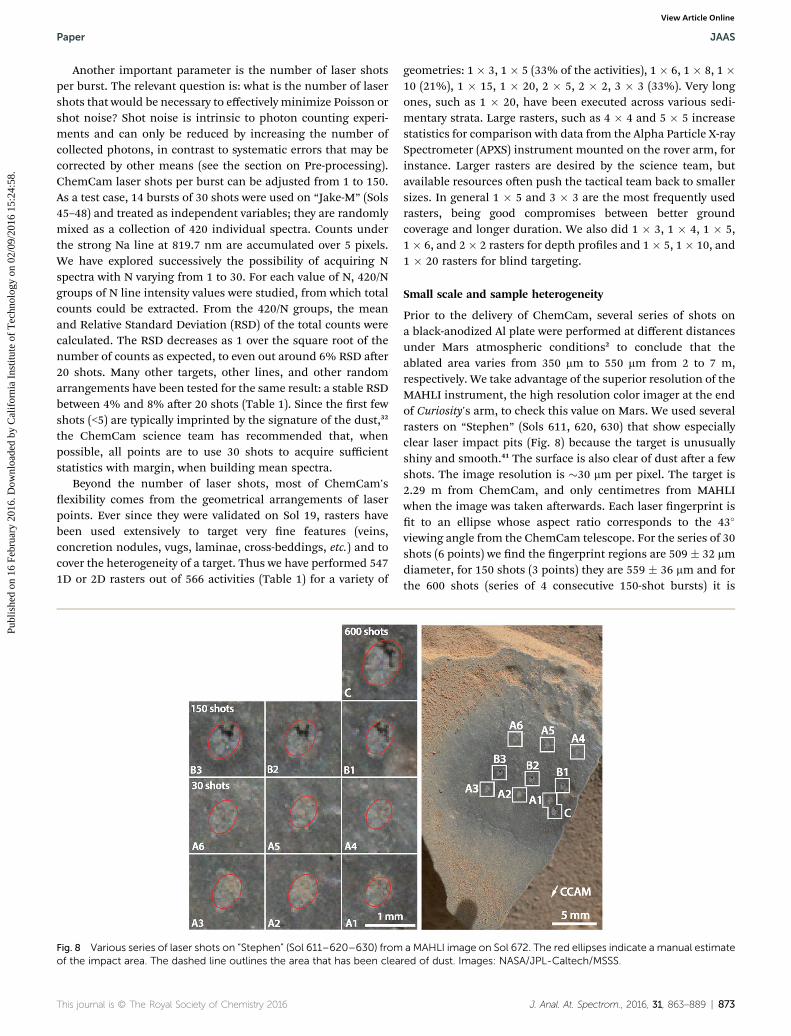
Fig. 8 Various series of laser shots on “Stephen” (Sol 611–620–630) fromof the impact area. The dashed line outlines the area that has been clea
geometries: 1 � 3, 1 � 5 (33% of the activities), 1 � 6, 1 � 8, 1 �10 (21%), 1 � 15, 1 � 20, 2 � 5, 2 � 2, 3 � 3 (33%). Very longones, such as 1 � 20, have been executed across various sedi-mentary strata. Large rasters, such as 4 � 4 and 5 � 5 increasestatistics for comparison with data from the Alpha Particle X-raySpectrometer (APXS) instrument mounted on the rover arm, forinstance. Larger rasters are desired by the science team, butavailable resources oen push the tactical team back to smallersizes. In general 1 � 5 and 3 � 3 are the most frequently usedrasters, being good compromises between better groundcoverage and longer duration. We also did 1 � 3, 1 � 4, 1 � 5,1� 6, and 2� 2 rasters for depth proles and 1� 5, 1� 10, and1 � 20 rasters for blind targeting.
Small scale and sample heterogeneity
Prior to the delivery of ChemCam, several series of shots ona black-anodized Al plate were performed at different distancesunder Mars atmospheric conditions2 to conclude that theablated area varies from 350 mm to 550 mm from 2 to 7 m,respectively. We take advantage of the superior resolution of theMAHLI instrument, the high resolution color imager at the endof Curiosity's arm, to check this value on Mars. We used severalrasters on “Stephen” (Sols 611, 620, 630) that show especiallyclear laser impact pits (Fig. 8) because the target is unusuallyshiny and smooth.41 The surface is also clear of dust aer a fewshots. The image resolution is �30 mm per pixel. The target is2.29 m from ChemCam, and only centimetres from MAHLIwhen the image was taken aerwards. Each laser ngerprint ist to an ellipse whose aspect ratio corresponds to the 43�
viewing angle from the ChemCam telescope. For the series of 30shots (6 points) we nd the ngerprint regions are 509 � 32 mmdiameter, for 150 shots (3 points) they are 559 � 36 mm and forthe 600 shots (series of 4 consecutive 150-shot bursts) it is
a MAHLI image on Sol 672. The red ellipses indicate a manual estimatered of dust. Images: NASA/JPL-Caltech/MSSS.
Fig. 9 ChemCam shots on coarse soils (top panel, “Holts_Ledge”, 1 �10 raster, Sol 669) and fine soils (bottom panel, “Sandy Dam”, 1 � 5raster, Sol 544). Context images from Mastcam. Images: NASA/JPL-Caltech/MSSS; NASA/JPL-Caltech/LANL/CNES/IRAP/IAS/LPGN/CNRS/LGLyon/Planet-Terre.
Fig. 10 Histogram of soil cavity (surface area diameter in mm) from201 bursts of 30 shots. Box plot (max whisker length ¼ 1.5) frombottom to top (in mm): lower adjacent value ¼ 0.69, 25th percentile ¼1.11, median (red)¼ 1.23, 75th percentile¼ 1.42, upper adjacent value¼1.90, and red crosses for outliers.
JAAS Paper
Publ
ishe
d on
16
Febr
uary
201
6. D
ownl
oade
d by
Cal
ifor
nia
Inst
itute
of
Tec
hnol
ogy
on 0
2/09
/201
6 15
:24:
58.
View Article Online
749 mm. Those diameters correspond to areas that have beenclearly modied by the laser impact. They are upper values forthe laser pits themselves. This result is consistent with what wasmeasured in the laboratory on a very simple plane surface. It islikely that the increased size observed on Mars is due to micro-motion (slight wobbling) of the rover and its mast. The durationover which the 30 shots were red is 10 seconds. However, for600 shots, which require several 150-shot bursts, the duration is>3 minutes. Thus the larger spot size may be largely due toadditional motion of the mast over this longer duration. Thiseffect can be checked by using the acquisition of several RMIimages interbedded with laser shots.
Measuring pit diameters in soils is much easier, since theyare readily observable in RMI images (Fig. 9). In ne soils, crateredges are very sharp. For 201 separate bursts of 30 shots onsoils, the median crater diameter is at 1.2 mm, with a rangefrom 0.7 to 1.9 mm that is probably due to varying grain sizes(Fig. 10). In the laboratory, prior to launch, Wiens et al.3 re-ported on experiments at Mars ambient pressure in a ne-grained soil simulant using JDo-1 (73% of this standard hasgrain sizes <20 mm). The hole produced by the ight instrumentwas 1.4 mm in diameter aer 50 pulses and 1.8 mm aer150 pulses. Mars data are consistent with these results.
Fig. 11 Histogram of dust free area (diameter in mm) from 135 burstsof 30 shots. Box plot (max whisker length¼ 1.5) from right to left to top(in mm): min ¼ 4.3, 25th percentile ¼ 6.2, median (red) ¼ 7.5, 75th
percentile ¼ 9.0, upper adjacent value ¼ 12.5, and red crosses foroutliers.
Dust removal
Dust is ubiquitous on Mars and this is illustrated by ChemCam.Of >5000 points interrogated with LIBS during Season-1, inmore than 99% of the cases, the rst few shots show chemicalevidence of dust. The only exception is when the same spot isinterrogated twice, a few minutes apart. Thirteen sols aerlanding, the rst shots on the on-board calibration targetsalready exhibit evidence of dust. Even if the target was cleared ofdust (see below), dust was again detected by the LIBS when itwas interrogated a few sols later.42 Individual moving dustgrains could even be seen on different RMI images of the cali-bration targets.
874 | J. Anal. At. Spectrom., 2016, 31, 863–889
Dust can be blown away by the LIBS impact shock wave wellbeyond the 350–550 mm diameter of the LIBS crater. There arenumerous cases of dust removal in the Season-1 ChemCamdataset as shown by the difference between two RMI imagesbefore and aer the LIBS shots. There were 135 cases of rocktargets studied for 30-shot bursts. Independent of the localgeometry, the dust-free area is found to be nearly circulararound the LIBS pit. There is no apparent dependence of thedust-free diameter on target distance. Fig. 11 is a histogram ofdust-free diameters (in mm): the median value is 7.5 mm witha signicant dispersion between 6.2 mm and 9.0 mm from the1st to 3rd quartile. The variation is likely due to surface
Fig. 12 Dust removal: “Cockscomb” (single point, 150 shots, Sol 773) and “Hanaupah” (3� 3 raster, 30 shots, Sol 779). The left panel is a Mastcamcontext image. The right panel is a zoom of the middle RMI image. On the right panel, the red circle is 5 mm diameter. The green circle diameteris the area clear of dust: 11.9 mm for “Cockscomb” and 4.9 mm for “Hanaupah”. Images: NASA/JPL-Caltech/MSSS, NASA/JPL-Caltech/LANL/CNES/IRAP/IAS/LPGN/CNRS/LGLyon/Planet-Terre.
Paper JAAS
Publ
ishe
d on
16
Febr
uary
201
6. D
ownl
oade
d by
Cal
ifor
nia
Inst
itute
of
Tec
hnol
ogy
on 0
2/09
/201
6 15
:24:
58.
View Article Online
roughness, its coupling efficiency with the laser beam, slope,and (obviously) the amount of original dust cover. Areas assmall as 4 mm or up to 12 mm diameter have been observed.Fig. 12 (top) shows an area that has been cleared by 150 lasershots. The area over which dust is cleared is slightly larger thanwith only 30 shots (bottom). When performing depth proles,four bursts of 150 shots are usually used with no motion of themast. From eight depth proles, we obtain a range for dust-freediameters from 10.0 to 15.2 mm, with a maximum value at 17.8mm. This is therefore, as expected intuitively, larger than for 30shots, as illustrated in Fig. 13.
When performing rasters with appropriate spacing betweenlaser pits, the dust free area can be enhanced. Fig. 14 (right) is
Fig. 13 Dust free area (diameter in mm) for 30 shot bursts (135 points)and 600 shot depth profiles (8 points). Box plots (max whisker length¼1.5) for 600 shots from bottom to top (in mm): min ¼ 8.8, 25th
percentile ¼ 10.0, median ¼ 11.1, 75th percentile ¼ 15.2, max ¼ 17.8.
an example of two consecutive 1 � 10 rasters that had removeddust along more than 10 cm for a width of 1 cm. For 2D rasters,dust-free areas of several cm2 were obtained. Typically, the dustfree area has a �1 cm diameter aer a 3 � 3 raster (Fig. 14 le).On a target like “Stephen” (Sols 611, 620, and 630, Fig. 8), witha combination of different rasters, more than 2 cm2 werecleared of dust. The dust-free areas can provide better views oftarget characteristics in later imaging.
Depth proling
For each laser shot, nanograms of material are ablated when thedistinctive craters are formed.36 In general, nanosecond IR laserpulses generate craters with blobs of melt material on theiredges. The ablation process is noticeably less efficient than with
Fig. 14 Dust removal from rasters: “Liga3”, raster 3 � 3, Sol 601 (left)“Rocknest_3”, raster 1 � 10, Sol 84 (right). Images: NASA/JPL-Caltech/LANL/CNES/IRAP/IAS/LPGN/CNRS/LGLyon/Planet-Terre.
Fig. 15 Depth of LIBS impact crater as a function of the number ofshots, for two types of target: a dolomite (red) and compact Mars soilsimulant (blue). The data point at the far right is for 900 laser shots. Asan inset a crater elevation pattern for 300 shots on the Mars soilsimulant.
JAAS Paper
Publ
ishe
d on
16
Febr
uary
201
6. D
ownl
oade
d by
Cal
ifor
nia
Inst
itute
of
Tec
hnol
ogy
on 0
2/09
/201
6 15
:24:
58.
View Article Online
femtosecond UV lasers. Under Martian conditions, the ablationprocess is somewhat more effective than at terrestrial ambientpressure.48 A recurrent question is how deep LIBS impacts canpenetrate a geological target. A systematic study of crater depthwith the number of laser shots is outside the scope of thismanuscript, as many parameters control the laser–matterinteraction: the laser beam characteristics; the target density,crystallinity, thermal and electrical properties that govern thecoupling with the beam electric eld and the associated heatdissipation. However, a small example is given below.
A fewmeasurements from the laboratory setup at the Institutde Recherche en Astrophysique et Planetologie (IRAP, Toulouse,France) provide insights into the general processes that occuron Mars. We used the ChemCam Mast-Unit qualicationmodel, a CO2 pressure-controlled chamber at �0.7 kPa and 3 mstandoff distance. The instrument is cooled to �10 �C. Except
Fig. 16 Measurements in the laboratory of crater diameter and depth in abetween 40 and 80 mm. Data were acquired at 6.7 mbar of CO2 at 3 m disa real LIBS plasma. On the right panel, measurement of crater depth foplasma measured on each image and used to locate the crater depth.
876 | J. Anal. At. Spectrom., 2016, 31, 863–889
for ring through windows in the Martian chamber and thethermal chamber containing the instrument, the congurationis as close as possible to ChemCam at Gale crater. Two targetshave been used: a pressed Mars soil simulant (JSC-1) anda dolomite-cemented sandstone from the Grand Canyon. Forthis study, both targets are considered so on a geologicalhardness scale, leading to relatively large maximum depths ofpenetration. On each one, series of multiple shots were repeatedthree times. The depth was measured by a calibrated micro-scope. Fig. 15 displays the depth of penetration as a function ofthe number of shots for both targets. The proles are verysimilar: a high ablation rate at rst (�5 mm per shot) transitionsto a very low rate (�0.6 mm per shot) aer �100 shots. Amaximum depth around 400 mm is reached. A spectral signal isrecorded at this depth, which means that while ablation occurs,the hole gets re-lled by the ablated material from the walls.Using the ight instrument, Wiens et al.3 obtained a nearly 50%larger depth of penetration for dolomite, but a much shallowerdepth for basalt. Differences between these two sets ofmeasurements may well correspond to variations in thecementation of the dolomites/sandstones and the porosity ofthe basalts. There are two explanations for the maximum depth:an extreme connement of the plasma and a lower coupling tothe material that has been previously ablated and partiallymelted. Cousin et al.12 further explored how LIBS spectra behavewith depth, with the conclusion that the SNR is not clearlydependent on the depth or laser energy. The full width at halfmaximum (FWHM) values of emission lines are constant withdepth in rock but can broaden signicantly in holes made insoils, due presumably to saturation and self-absorption of theplasma even at Martian ambient pressures.3
The ChemCam setup at IRAP was also adapted for soilstudies. We used a Mars simulant (JSC-1) that had been sievedto different maximum grain sizes. We report here on results forthe 40–80 mm range (Fig. 16, le). As shown, the craters are�2 mm in diameter, which is close to the upper bound of soil
JSC-1 Mars soil simulant that was sieved to produce layers of thicknesstance. The laser is run at 1 Hz. The bright spot on the left panel is that ofr 150 shots. The error bars represent the size of the luminous primary
craters observed on Mars that are indeed coarser than thesimulant. For a series of 150 shots, the depth was measuredoptically and is reported in Fig. 16, right. The LIBS shock waveexcavates rapidly with the initial shots. Aer 50 shots, the maxdepth �3.5 mm is reached, which is 1.5� the crater diameter.The bright spot on Fig. 16 is that of a real LIBS plasma, deep inthe soil crater, where coupling becomes more difficult, andgrains fall down the hole.
Rapid measurement
Acquiring a LIBS plasma takes a fewms and thus a burst goes asfast as the repetition rate of the laser. However, in a complexexperiment such as ChemCam, a signicant overhead has to betaken into account for the actual duration of a typical LIBSanalysis (here dened as a burst of 30 shots). From ChemCamactivity templates, we nd that a 3 � 3 raster of 30 shots, i.e.nine analyses, has a duration of 40 min: 11 min to turn theinstrument ON and warm up the lasers at a controlled rate;22 min to acquire the LIBS spectra plus four autofocus routines(one on each row plus one for the nal image) and two contextimages, mast motion, data processing and transfer to the rover;7 min to cool down the lasers and turn the instrument OFF. A1 � 5 raster (including two RMIs and two autofocus) takes30 min, a 1 � 20 raster (incl. 5 RMIs and 8 autofocus) an hour.Many other combinations are possible, oen with severalrasters sharing the same ON/OFF sequence. The uplink teamadjusts the number of images and autofocus routines asa function of the EL/AZ spacing within the rasters and thegeometric shape of the target. As a guideline, averaged acrossa raster, it takes for ChemCam between 3 and 6 minutes toperform a LIBS analysis (single point) with context images.
Key findings from elementalcomposition
In this review, we have assembled most of ChemCam originalresults into a few topics that utilize major element compositionas a framework for the geological setting and oen minor andtrace elements as markers of evolution and alteration. As part ofan integrated payload, the ChemCam results are supported byimages from the Mastcam and MAHLI imagers, by chemistryand mineralogy from SAM and CheMin onboard laboratories,and by organic and volatile chemistry from the Sample Analysison Mars (SAM) instrument, mineralogy from the CheMin X-raydiffraction instrument, and by chemistry from APXS. Theimportance of RMI images for the interpretation of elementalcomposition, as shown below, also proved to be signicant.
Igneous compositions
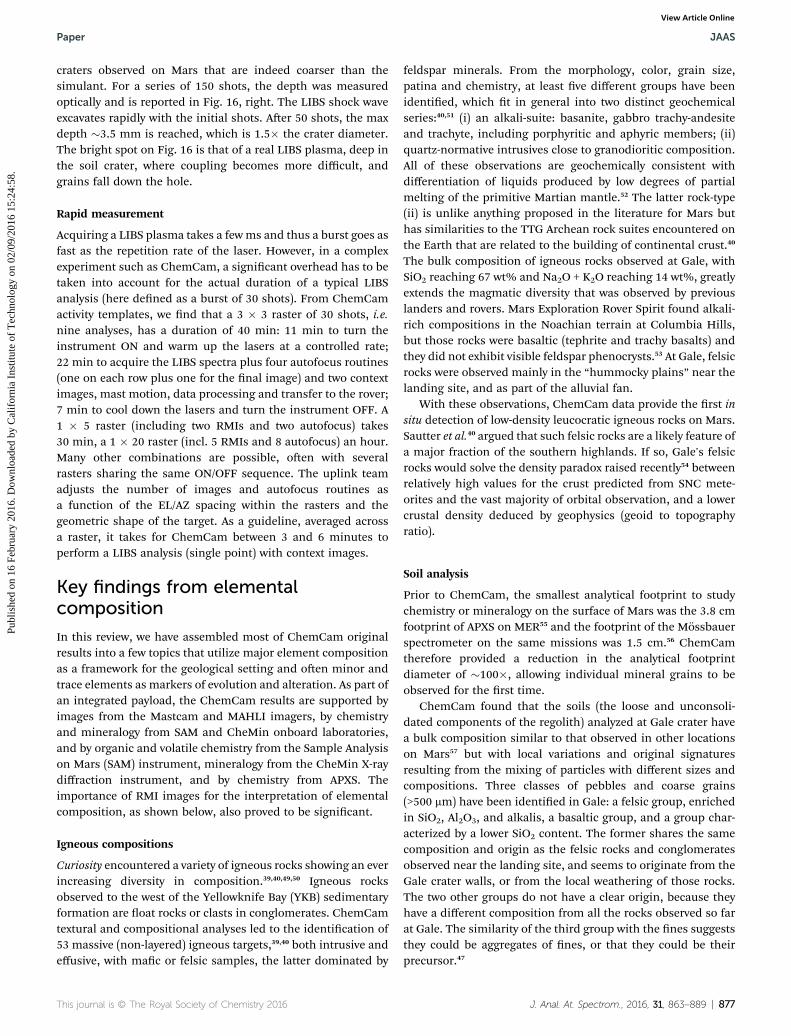
Curiosity encountered a variety of igneous rocks showing an everincreasing diversity in composition.39,40,49,50 Igneous rocksobserved to the west of the Yellowknife Bay (YKB) sedimentaryformation are oat rocks or clasts in conglomerates. ChemCamtextural and compositional analyses led to the identication of53 massive (non-layered) igneous targets,39,40 both intrusive andeffusive, with mac or felsic samples, the latter dominated by
feldspar minerals. From the morphology, color, grain size,patina and chemistry, at least ve different groups have beenidentied, which t in general into two distinct geochemicalseries:40,51 (i) an alkali-suite: basanite, gabbro trachy-andesiteand trachyte, including porphyritic and aphyric members; (ii)quartz-normative intrusives close to granodioritic composition.All of these observations are geochemically consistent withdifferentiation of liquids produced by low degrees of partialmelting of the primitive Martian mantle.52 The latter rock-type(ii) is unlike anything proposed in the literature for Mars buthas similarities to the TTG Archean rock suites encountered onthe Earth that are related to the building of continental crust.40
The bulk composition of igneous rocks observed at Gale, withSiO2 reaching 67 wt% and Na2O + K2O reaching 14 wt%, greatlyextends the magmatic diversity that was observed by previouslanders and rovers. Mars Exploration Rover Spirit found alkali-rich compositions in the Noachian terrain at Columbia Hills,but those rocks were basaltic (tephrite and trachy basalts) andthey did not exhibit visible feldspar phenocrysts.53 At Gale, felsicrocks were observed mainly in the “hummocky plains” near thelanding site, and as part of the alluvial fan.
With these observations, ChemCam data provide the rst insitu detection of low-density leucocratic igneous rocks on Mars.Sautter et al.40 argued that such felsic rocks are a likely feature ofa major fraction of the southern highlands. If so, Gale's felsicrocks would solve the density paradox raised recently54 betweenrelatively high values for the crust predicted from SNC mete-orites and the vast majority of orbital observation, and a lowercrustal density deduced by geophysics (geoid to topographyratio).
Soil analysis
Prior to ChemCam, the smallest analytical footprint to studychemistry or mineralogy on the surface of Mars was the 3.8 cmfootprint of APXS on MER55 and the footprint of the Mossbauerspectrometer on the same missions was 1.5 cm.56 ChemCamtherefore provided a reduction in the analytical footprintdiameter of �100�, allowing individual mineral grains to beobserved for the rst time.
ChemCam found that the soils (the loose and unconsoli-dated components of the regolith) analyzed at Gale crater havea bulk composition similar to that observed in other locationson Mars57 but with local variations and original signaturesresulting from the mixing of particles with different sizes andcompositions. Three classes of pebbles and coarse grains(>500 mm) have been identied in Gale: a felsic group, enrichedin SiO2, Al2O3, and alkalis, a basaltic group, and a group char-acterized by a lower SiO2 content. The former shares the samecomposition and origin as the felsic rocks and conglomeratesobserved near the landing site, and seems to originate from theGale crater walls, or from the local weathering of those rocks.The two other groups do not have a clear origin, because theyhave a different composition from all the rocks observed so farat Gale. The similarity of the third group with the nes suggeststhey could be aggregates of nes, or that they could be theirprecursor.47
Fine-grained particles have a close-to-basaltic compositioncentered between plagioclase andmac end-members. They areconsistent with the presence of plagioclase, olivine, augite,pigeonite, and some alkali feldspars revealed by CheMin,58 butwith lower SiO2 content than the larger particles. Overall, thecomposition of the ne particles is quite homogeneous andlacks an obvious spatial trend with either depth or location.This chemical homogeneity and the presence of olivine58
suggest limited or isochemical aqueous alteration. ChemCamhas seen varying proportions of a SiO2-poor, volatile-rich phase,hinting at the presence of a signicant content of constituentswhose concentrations are not currently estimated by ChemCam(SO3, H2O, P2O5, Cl, etc.). This phase is likely related to the X-rayamorphous component observed by CheMin.59 This is consis-tent with multiple studies from previous missions,60 showingthat Martian soils have a composition different from all therocks analyzed so far. Therefore the question of their originremains open.
One of the early results from ChemCam is the rst detec-tion of Li in Martian materials, especially soils.17 Li abun-dances are generally low (<15 ppm). The abundance of Liprovides a test of the sources of uid mobile elements in thesoils, including sulfur and chlorine, which have been knownsince Viking.61 Models for the origin of these mobile elementsin the soils include volcanic aerosols and hydrothermaluids.62 The lack of enrichment of the present soils in Li,which is highly uid-mobile, is consistent with the limitedinux of subsurface ground waters, or neutral chloridehydrothermal uids. These results do not exclude a role forvolcanic aerosols or acid sulfate uids, both of which involvevapor transport, where Li is immobile. Some of the diageneticeffects noted recently in the mission may also be consistentwith acid sulfate processes.
The submillimeter scale of ChemCam analyses andChemCam's ability to retrieve proles of chemical composi-tion to depths of �4 mm in ne-grained soils are particularlysuited to the analysis of processes involved in the genesis ofthe Martian soils. The presence of this volatile-rich amorphouscomponent is responsible for the large hydrogen signalobserved by ChemCam in soils, and this hydration likelyaccounts for an important fraction of the global hydration ofthe surface seen by previous orbital measurements.63 In theend, comparison between daytime and nighttime soilmeasurements, however, even at the coldest time of the year,does not show any signicant difference, suggesting that thishydration signature does not mostly come from the presenceof adsorbed water. This is in spite of some high relativehumidity observations by the REMS instrument at some timesof the year and locations.64
Aeolian dust analysis
The rst LIBS spectrum acquired on Mars (Sol 13) was that ofdust. Ever since, at least the rst shot of every burst is mixedwith a dust signature, except when the same target is shot twicewithin less than a day. ChemCam data on single-element cali-bration targets were used to retrieve and analyze in detail the
878 | J. Anal. At. Spectrom., 2016, 31, 863–889
chemical composition of the mobile aeolian dust (<2–3 mm)deposited on its surface. The rst spectrum of a burst acquiredon a graphite calibration target4 clearly presents all of the majorelements (Fe, Si, Mg, Al, Ca, Ti) that are typically absent froma dust-free graphite spectrum.32 The comparison between therst and last spectrum of a burst yields the chemical composi-tion of the dust layer on the target, assuming no C is presentother than the atmospheric contribution. The procedure isrepeated on a titanium plate4 (Ti �96%, Al, and traces of V),which is routinely sampled to assess the instrument health andwavelength calibration. The dust spectrum is the same throughthe rst 800 Sols of the mission. Dust spectra show a composi-tional relationship to typical soils analyzed at Gale crater.Spectral line ratios are consistent with a basaltic compositionsimilar to the one detected globally on the planet.30,60,65,66 Ingreater detail, comparison between the dust component andtypical ne soils such as “Crestaurum” (Sol 89) indicatesa similar content in Fe, Mg, Si, Ti, Al, and H, but a highercontent in Ca and K. Quantication of the major elementsreinforces their similarity to the ne soil composition.30,47 Theminor elements that were detected (Ba, Sr, Rb, Li, H, Mn, Cr) arewithin the range of the composition from soil surveys, butexhibit a higher concentration of Li. Every ChemCam rst shotpresents a strong H line, indicating that dust is a contributor tothe H content of the Martian samples, which was also detectedby the SAM and CheMin instruments.58,65 This in turn meansthat ne dust also contains part of the hydrated amorphousphase reported by CheMin in the soils.32 This hydrated dustcover measured in situ is consistent with the global infraredwater absorption band seen in orbital data.67
Conglomerates
Conglomerates are rocks composed of grains that are cementedtogether, from sand-size grains (<1 mm) to pebbles up to 10 cmor more. Pebbles oen display locally signicant rounding andlocal imbrications that demonstrate a uvial origin. Conglom-erates were observed for the rst time on Mars by the Curiosityrover shortly aer landing.68 The clasts contained in them likelycame from Gale crater's rim, transported via watersheds such asthe Peace Vallis.69 ChemCam has analyzed �40 conglomeratetargets along the rover traverse, starting at Bradbury landingsite in the rst month of the mission.68,70–72 RMI images ofconglomerates display a variety of grains with various tones,from light to dark, including pebbles with white, obviouslyigneous minerals visible as phenocrysts. The capability ofChemCam to sample individual minerals when larger than thelaser beam size (>0.5 mm) is a powerful analytical tool on thiskind of rock. Conglomerates predominantly incorporateigneous clasts, enabling ChemCam to analyze a chemistryrepresentative of the source rocks.
The chemistry of conglomerates can be split into two majorchemical groups. First, conglomerates from the hummockyplains and the outcrop named Darwin (Sol 390) are enhanced infelsic components (higher Si, Al, Na and K) compared to theaverage crust composition.71 This chemistry suggests a strongcontribution of the felsic crust identied from the analysis of
leucocratic clasts.39,40 The analysis of individual grains suggestsa plagioclase-dominated mineralogy with the contribution ofmac minerals, local alkali feldspars, and micas.37,71 Second,conglomerates found in the vicinity of the Kimberley outcrop(Sol 572) display much higher K abundance and relatively highFe content as well, compared to the average Martian crust andthe rst conglomerate type. This property suggests a geneticlink with the potassic sandstones and mudstones observed atthe Kimberley outcrop.73
Ca-sulfate detection
Since early in the mission ChemCam has reported numerousCa-enhancements associated with the detection of sulfur peaks.These points are also depleted in other major elements (Si, Fe,Mg, Al, Na, K, Ti), apart from O. This indicates a calcium sulfatephase.74 The RMI images show that the Ca-sulfate signaturescorrespond to a light-toned material, in contrast with thesurrounding sediment.74 The majority of these light-tonedCa-sulfate targets are elongated veins, and occasionally sub-spherical nodules, and polygonal (nodular) texture. The lattertexture raises a question about the hydration state of theCa-sulfate analyzed. Calcium sulfates can be found on the Earthin three different hydration states: gypsum, with two watermolecules; bassanite, with one water molecule per twoCa-sulfate molecules; and an anhydrous form, anhydrite. Anenterolithic texture suggests anhydrite or bassanite (see “Hdetection and hydration” paragraph hereaer). These inter-pretations are in agreement with analyses performed by otherCuriosity instruments, for example at YKB. There CaSO4 wasidentied75 by APXS (Alpha Particle X-ray Spectrometer) in the“Rapitan” target that ChemCam also analyzed. Anhydrite andbassanite were also detected by CheMin (Chemistry andMineralogy) in the rst drilled samples.76 Finally, Mastcamobservations were consistent with the presence of gypsum inmultiple locations,77 as well as, on various locations, of otherphases such as bassanite and/or anhydrite.
Along the traverse, ChemCam rst reported Ca-sulfate circaSol 113, when entering the YKB formation. Since leaving theYKB formation, and up to the �10 km point of the traverse atthe Pahrump Hills area around Sol 750, ChemCam identiedmore than 34 Ca-sulfate targets. Along the traverse, ChemCamanalyzed an extensive boxwork of bright veins that also displaya Ca-sulfate composition,27 the texture of which is underinvestigation.78 Among all these detections, Ca-sulfates mostlyappear as veins, crossing into the sediment as a fracture-lledmaterial. They are thus interpreted as having formed by a uidevent or events subsequent to the local sediment deposition.The occurrence of Ca-sulfate veins is not distributed uniformlythrough the entire Curiosity path but remains persistent: noother diagenetic feature has been reported so widespread alongthe traverse.79 Moreover, the Ca-sulfate veins cross otherdiagenetic features (such as nodules at the YKB formation, andcluster-like features at Pahrump Hills).27,80 This suggests theoccurrence of a late, quite-widespread precipitation of sulfatesfrom groundwater. Ca-sulfates suggest relatively mildly acidicformation conditions compared to Mg- and Fe-sulfates that
appear to be more widespread on Mars as detected from orbitalobservations.
Chemical survey of sedimentary rocks
Along the path of the rover from the Bradbury landing site to Sol800, ChemCam has sampled various chemistries81 that can besummarized as follows for sedimentary rocks. Aer traversingseveral hundred meters across the pebble and conglomerate-rich Bradbury Rise, Curiosity arrived in YKB. The rst outcropsurveyed at Rocknest showed strong enrichment in Fe anddepletions inMg.28 This may be a hint of what Curiosity will ndwhen it reaches the Hematite Ridge.82 Aer leaving Rocknest,Curiosity reached the lowest point in its traverse, the Sheepbedarea in the YKB formation (Sols 126–300), which is essentiallycomposed of mudstone. Curiosity performed its rst drillsampling at this location. The mudstone shows a very homo-geneous composition, close to the average Martian crust.71,75
The nearby Shaler uvial sandstone outcrop (Sols 306–325), therst outcrop of potential deltaic foreset beds (alternation ofrecessive and resistant sandstone strata), shows K enrich-ment.83 This enrichment is even more important at the Kim-berley formation (Sols 576–632 another drill site anked byforeset beds), located 7 km SW of Shaler, with up to 5.3 wt%K2O on average for the Mount Remarkable member.73 Althoughit is outside the scope of this review, it can be noted thatChemCam subsequently probed the Murray unit at the Pah-rump (Sols 801–919) and Marias_Pass (Sols 992–1072) loca-tions. This unit represents the rst observed material of MtSharp's base, and shows a very diverse composition, includingareas highly enriched in SiO2 (75–85 wt%) and TiO2, suggestinga stronger alteration. Curiosity drilled its 7th sampling hole nearthis high SiO2 area. Overall, ChemCam has observed a widevariety of compositions in sedimentary rocks that comes inaddition to the diversity reported for igneous rocks, implyinga multiplicity of sources, and of alteration and diagenesisprocesses.
H detection and hydration
ChemCam has a unique sensitivity to hydrogen at a submilli-meter scale. The hydration of dust has already been discussedabove. In rocks, soils, veins, drill holes and tailings, ChemCamfound a H signal in most of the targets along the rover traverse,revealing hydrated materials to different degrees.29 The highesthydrogen signal from rocks is mostly found in calcium sulfateformations74 and mudstones. The latter observation is consis-tent with the uvio-lacustrine mineralogy found by the CheMininstrument in the mudstone drill tailings indicating the pres-ence of hydrated Mg-smectites76 and hydrated iron oxides ex-pected in the amorphous phase.84 Although several studieshighlight physical and chemical LIBS matrix effects specic tohydrogen,29,85 a normalization of the hydrogen signal was foundto correct for most of the effects in a range applicable for themajority of the data acquired on Mars. Applied to the calciumsulfates targeted on Mars, the calibration reveals a hydrogensignal consistent with around 6 wt% H2O content. This corre-sponds to the presence of bassanite 2CaSO4$H2O but not
gypsum CaSO4$2H2O or anhydrite CaSO4. Bassanite likelyoriginates from the dehydration of gypsum which impliesrelatively low temperature uid evaporation from gypsum86 andthat later desiccating conditions occurred. This recent workdemonstrates that the ChemCam hydrogen signal could beused not only to detect but to constrain the water content withinne target features at remote distances. The calibration of the HLIBS signal remains a challenge because many sources of vari-ability have been identied, but further experiments are beingperformed to help expand the calibration to target types otherthan calcium sulfates.
Manganese detection and consequences
Elevated abundances of Mn have been observed by ChemCamalong Curiosity's traverse in Gale crater. In the rst 360 Sols ofthe mission, �3% of rock targets analyzed by ChemCam con-tainedMn abundances that were at least three times the averageMartian basalt value of 0.4 wt% MnO based on previous in situmeasurements,57 suggesting the presence of a high-Mn mineralphase.41 One target named Caribou (observed on Sol 342) hada single analysis location containing MnO in excess of 60 wt%,the highest observed on Mars to date.41 Not all of the high-Mnobservations have a clear geological context (e.g., mineralgrains, or a depositional environment), but in at least onelocation it appears that Mn concentrations occur primarily asMn-oxide veins that ll fractures within a sandstone. ChemCamobservations at the Dillinger outcrop on Sols 606–630 foundthin layers of high Mn on three erosion-resistant n-likefeatures, which appear throughout the outcrop and are inter-preted as post-depositional fracture lls.87 Precipitation of Mnminerals requires abundant water and strongly oxidizingconditions. On the Earth, concentrated Mn deposits did notoccur until aer the rise of oxygenic photosynthesis, whichchanged redox conditions across the planet. The reddish colorof most free surfaces on Mars may suggest that the surface ishighly oxidized. However, Mossbauer-spectra obtained on Marsby Spirit in Gusev crater showed a surprisingly low degree ofoxidation as only about 40% of the iron of the soil was presentin ferric phases.56 Even small airborne dust particles collectedby on-board magnets turned out not to be fully oxidized.88–90
Nevertheless, the abundance of ferric phases on the surface ofMars demonstrates the occurrence of at least partially oxidizingconditions.91 However, until recently there was little evidencethat conditions on Mars were ever oxidizing enough to produceMn-rich minerals. Given the association between Mn-rich rocksand the redox state of surface environments on the Earth,observations of anomalous Mn enrichments on Mars raiseimportant questions about past environmental conditions onthe planet. Additionally, observations of Mn enrichments fromtheOpportunity rover on the other side of the planet suggest thatthe strongly oxidizing conditions present at Gale were notsimply local in nature. Thin Mn-rich rock coatings were foundunderneath rocks in Endeavor crater.92 Overall, these observa-tions of high Mn materials suggest that, at some point in thepast, conditions on Mars were wet and more strongly oxidizing
880 | J. Anal. At. Spectrom., 2016, 31, 863–889
than they are today, and open up the possibility that theMartianatmosphere contained considerably more free oxygen.87
Zinc detection and implications
More than 10 Zn-enriched points have been detected at theKimberley formation (Sols > 600) with high ZnO contentranging from 1.0 wt% to a maximum of 7.5 wt% (Yarrada, Sol628). Almost all of those Zn-enriched targets are localized at theDillinger member of the Kimberley formation, where high Mnand alkali contents were also detected,73,87 but probably indifferent phases. The Dillinger member consists of medium- tone-grained sandstones with low angle cross-bedding repre-senting a complex southwesterly mixed uvial–aeolian systemdeposition.93 Furthermore, the Dillinger member is alsocrosscut by fractures containing a resistant material that indi-cate a later stage water circulation within the member. Chem-istry at the Kimberley outcrop is proving to be anomalous ina number of respects. As mentioned previously, the region isespecially enriched in potassium,73 reecting the substantialfraction of K-feldspar (20 wt%) detected by the CheMin instru-ment.94 Relatively abundant uorine detections were made,37
and the apparent fracture-lling material was found to containhigh concentrations (>10 wt%) of manganese-oxide minerals.87
Zn enrichment turns out to be independent of the textures ofthe rocks detected in that stratigraphic member, from ne- andcoarse-grained sandstones to pebbly conglomerates and resis-tant ns. It is detected uniformly at all depths within the rocksby ChemCam and high detections were made by APXS in thesame area, conrming the local enrichment.95 The lack of sulfurenhancement or other chalcophile elements in the ChemCam,APXS or CheMin analyses suggests that Zn is not present in thecommon terrestrial or sphalerite (ZnS) phase. Alternatively, Zncould be in an amorphous clay phase, a cement or deposited asan oxide aer hydrothermal alteration.42 Finally, Zn enrich-ments have been observed within lunar soils as vapor conden-sates from impact ejecta plumes.96
Mg enrichments and raised ridges
So-called “raised ridges” consist of narrow (<1 to 6 mm in totalwidth; several cm in length), curvilinear ridges that are moreresistant to erosion than the surrounding mudstone rock,creating a raised relief of several millimeters97,98 that have beenintensively studied by ChemCam at YKB (Sheepbedmember).75,79,99 Between Sols 125 and 288, over 6000 laser shotswere targeted at 102 locations across ten different raised ridges.The bulk average composition of the raised ridges was found tobe enriched in MgO by 1.2–1.7� over that of the surroundingmudstone and showing some of the highest MgO valuesmeasured to date (single shot maximum of 19.0 wt%).79 Al2O3
was found to be anti-correlated with MgO, while Li is somewhatenriched where MgO is highest.75 Some ridges show a variationin composition with different layers on a sub-mm scale as shownby 600-shot depth proles, where ChemCam probes more thanone distinct layer. Overall, the average composition of the raisedridges is close to that of aMg- and Fe-rich smectite, or saponite,79
which may also be the main clay mineral constituent of the host
mudstone,76 formed through diagenetic reaction of a dilutebrine with, predominantly, olivine and amorphous material.99
These detailed analyses by ChemCam provide evidence ofdiagenesis and aqueous activity in the early post-depositionalhistory of the YKB formation, consistent with a low salinity tobrackish uid at near-neutral or slightly alkaline pH.
Conclusions
Aer more than 800 Sols on the surface of Mars and more than180 000 laser shots, we highlight the different lessons learnedfrom the rst use of LIBS in space. For data processing andelement detection, new tools had to be developed to account forthe specicity and uniqueness ofMars data. First, we noticed thepresence of solar absorption lines in LIBS spectra that wereunderestimated prior to launch. As a result, the processing of Hsignals is more complex. More generally, background removal isa challenge with LIBS on geologic targets because the targetalbedo is slightly modied aer each laser shot. A novel frame-work for fully customized baseline removal has now beendeveloped100 and is being applied to ChemCam data withpromising results.101 In theory, there should be a dark spectrumfor each LIBS spectrum (i.e., each laser shot); in practice we haveacquired a dark spectrum before or aer each laser burst. Con-tinua are subtracted; however at this point, it is not clear if thereis any useful and original information in the LIBS continua. Forwavelength calibration of LIBS spectra, a Ti target proved to be
Table 2 LIBS key characteristics on Mars, as benchmarked by ChemCam
Origin
Crater sizeReference 350–550 mm Lab.Rocks <509 � 32 mm MarsSoils 1.1–1.4 mm Both
Dust free area B
30 shots 6–9 mm Mars150 shots 10–15 mm Mars3 � 3 raster �20 mm Mars
Depth proleAblation rate <10 mm per pulse Lab.Max. depth in rocks 400 mm Lab.Max. depth in soils 3.5 mm Lab.
Spectra# shots affected by dust 1–5 Mars# shots for statistics >20 MarsBurst RSD on rocks 4–8% Mars
ActivitiesDuty cycles �50% MarsLaser shots average 238/sol Mars
Ave. activity
30 shots per burst Mars3–6 min per burst Mars9 bursts per target Mars0.8 target per sol Mars
very helpful because of the large number of spectral lines.Higher order distance correction is still under development, butit is already known that bias with distance is relatively limitedover the 2–5 m range where 95% of the data are acquired. Asa whole, data processing of LIBS spectra from Mars is not socomplex, but some limitations arise due to the lack of control ofthe different parameters of the experiment. Overall Martianspectra are of very high quality, with signal intensities slightlybetter than those obtained with instrument surrogates on theEarth, compared to laboratory tests in a similar environment.
Regarding chemistry, some elements that can be detected inthe laboratory have not been seen on Mars yet (e.g., Pb, Cu). Forother elements, more work is needed to rene their quanti-cation. For instance, contribution of atmospheric C still needsto be calculated to distinguish low levels of carbon.31 By andlarge, the keys to success for quantitative analysis are thedatabases for multivariate and univariate techniques. TheChemCam team is still augmenting its reference dataset, tomimic the expected mineralogy and chemistry on Mars.23
With regard to the use of ChemCam, we nd that remote (i.e.2.3–6m distance) sensing is indeed a clear advantage of LIBS forplanetary exploration. However, targets are not uniformlydistributed with distance as expected, but have been selectedmostly within 3.5 m distance from the rover. We interpret thisbias as being due primarily to the limited image resolutions thatare available for pointing during tactical operations when onlyNavcam images are available. As a whole, the success of remote
of data Comments
See Maurice et al.2 on Al plateStephen target 2.3 m distance 30 shotsThis study and Wiens et al.3
Depend on surface roughness and amount of dust
This study and Wiens et al.3
From so dolomite and pressed simulantFrom 40–80 mm sieved simulant
science is mainly due to the high-performance pointing capa-bility of the Remote Sensing Mast that carries ChemCam.
ChemCam is a very versatile instrument because manyparameters can be adjusted. However, to avoid the potential forincreasedmatrix effects, the laser energy should not be adjusted.The laser repetition rate has no inuence. The number of lasershots per burst should be optimally greater than 25 shots: 5 toremove dust or surface contamination, 20 to minimize shotnoise. Very generally, there is a large exibility in terms of thegeometrical arrangement of observation points in the form ofrasters. Many combinations were tried, but 3� 3, 1� 5, and 1�10 were the ones most oen used. LIBS is also a very rapidtechnique. Considering different overheads, ChemCam's typicaldurations of a few minutes per raster are far faster and moreenergy efficient than the days it can take to position the roverand arm to provide alternative in situ measurements.
Several original results were obtained as part of this review(Table 2). First about pit sizes, laboratory data as well as Marsmeasurements show that LIBS craters on Mars are up to halfa millimeter diameter in rocks, and 2–3 times larger in soils. Wehave quantied dust removal by the laser shock wave: a circulardust-free area of �1 cm diameter arises from 30 shots, andnearly 2 cm from 150 shots. Rasters can clear several cm2. Wealso looked at crater depths. More shots excavate deeper, butsaturation is rapidly reached. Most laboratory data do notexcavate more than half a millimeter in solid samples. In soils,the crater is much larger, with depths up to a few millimeters.Almost no surface coatings have been observed with ChemCam.As a whole, we conclude that advantages for LIBS that werediscussed prior to the ChemCam launch are conrmed; thosecapabilities are now quantied.
Experience on the MSL mission has shown that this ability toquickly survey the geochemistry of several targets in a vicinity isof great value for its own sake, but also in aiding rapid under-standing of an environment for efficient use of mission time.Moreover, it provides valuable support to decisions aboutselecting where and whether to make observations with moretime- and resource-intensive tools in the rover's instrumentsuite. This value as a tactical tool will soon be further enhancedby the implementation of an autonomous target-selectioncapability. The Autonomous Exploration for GatheringIncreased Science (AEGIS) system, a soware package opera-tional since 2010 on the MER Opportunity rover,102 has beenadapted for ChemCam and is expected to be available opera-tionally in late 2015.103 AEGIS will allow the Curiosity rover toautonomously select targets and acquire ChemCam observa-tions of them, during mission phases when the science team onthe Earth cannot review targeting images without incurringa mission delay. AEGIS will also enable autonomous, real-timerenement of ChemCam pointing for ne-scale targets, relievingthe difficulty of targeting such features. These capabilities willallow more rapid delivery of geochemical data, and faster prog-ress for the mission when making decisions based on it.
Several key results highlight the potential of LIBS forgeochemistry on Mars. For completeness, we assess here brieythe performance of ChemCam's non-LIBS capabilities, whichhave also been validated during Season-1: passive spectroscopy
882 | J. Anal. At. Spectrom., 2016, 31, 863–889
and micro-imaging. The RMI has proven to be decisive for theinterpretation of LIBS data. The resolution (the angular pixelsize�20 mrad per pixel corresponds to�40 mmat 2m) is ideal tolocalize the LIBS pits, to understand the geological context, theamount of dust covering the targets, and to identify veins,mineral grains, etc. Accurate registration of RMI images inNavcam, Mastcam, and MAHLI images is important to datainterpretation. The monochromatic output of the imager is nota major penalty for most of RMI objectives, e.g., to makea denitive distinction between bright dust and bright clasts.When necessary, a Mastcam color image (at �1/3 of RMI'sresolution) can be merged with an RMI image to create a singlehigh-resolution color image. Passive spectroscopy is obtainedwithout turning on the laser. Its eld-of-view is 0.67 mrad. Itcovers the same spectral range as LIBS spectra, with the samespectral resolution but lower signal-to-noise because of theweakness of the input signal. This is especially true in the UVrange due to the very low UV reectance of most geologicalmaterials. The spectral range of ChemCam is designed for LIBS,and does provide coverage of IR wavelengths above 1 mm, whichwould benet passive observations. Still, very interesting resultswere obtained from passive spectroscopy,104 especially atdistances beyond the LIBS range. The spectral resolution ismore than enough for passive spectroscopy of Mars rocks, andvery advantageous for sky observations.105
The next opportunity to use LIBS in space will once again beon Mars. SuperCam is a suite of four co-boresighted instru-ments (LIBS, Raman spectroscopy, visible/near-IR spectroscopy,and color micro-imaging) that is scheduled to y on board theNASA Mars2020 rover.106,107 The LIBS, visible spectroscopy, andimaging capabilities rely heavily on ChemCam heritage, whilethe remote Raman and IR spectroscopies will be new tools onthe surface of Mars. Together, these techniques will charac-terize at sub-millimeter scales the mineralogy and elementalchemistry of the Martian surface, and will join the search forextant organic materials. These techniques are fundamentalinvestigations that lay the groundwork for all types of Marsgeochemistry and astrobiology investigations. Each techniquehas its range of target distance capabilities, from 2 m to 7 m forLIBS, up to 12 m for Raman, up to the horizon for visible/IR andRMI. Up to 7 m, the capability of LIBS to remove dust will beimportant to extract unambiguous mineral signatures withRaman and IR spectroscopy. SuperCam will clearly benet inmany ways from our experience using ChemCam.
Acknowledgements
This work was supported in France by the French Space Agency(CNES), the Centre National de la Recherche Scientique(CNRS), and many institutes and universities across thecountry. Collaboration with colleagues in the US was funded byNASA’s Mars Program Office.
References
1 R. C. Wiens, S. Maurice and The ChemCam Team,ChemCam: Chemostratigraphy by the First Mars Microprobe,
Elements, February 2015, vol. 11, pp. 33–38, DOI: 10.2113/gselements.11.1.33.
2 S. Maurice, R. C. Wiens, M. Saccoccio, B. Barraclough,O. Gasnault, O. Forni, N. Mangold, D. Baratoux,S. Bender, G. Berger, J. Bernardin, M. Berthe, N. Bridges,D. Blaney, M. Bouye, P. Caıs, B. Clark, S. Clegg, A. Cousin,D. Cremers, A. Cros, L. DeFlores, C. Derycke, B. Dingler,G. Dromart, B. Dubois, M. Dupieux, E. Durand,L. d'Uston, C. Fabre, B. Faure, A. Gaboriaud, T. Gharsa,K. Herkenhoff, E. Kan, L. Kirkland, D. Kouach,J.-L. Lacour, Y. Langevin, J. Lasue, S. Le Mouelic,M. Lescure, E. Lewin, D. Limonadi, G. Manhes,P. Mauchien, C. McKay, P.-Y. Meslin, Y. Michel, E. Miller,H. E. Newsom, G. Orttner, A. Paillet, L. Pares, Y. Parot,R. Perez, P. Pinet, F. Poitrasson, B. Quertier, B. Salle,C. Sotin, V. Sautter, H. Seran, J. J. Simmonds, J.-B. Sirven,R. Stiglich, N. Striebig, J.-J. Thocaven, M. J. Toplis andD. Vaniman, The ChemCam Instrument Suite on the MarsScience Laboratory (MSL) Rover: Science Objectives andMast Unit Description, Space Sci. Rev., 2012, 170(1–4), 95–166, DOI: 10.1007/s11214-012-9912-2.
3 R. C. Wiens, S. Maurice, B. Barraclough, M. Saccoccio,W. C. Barkley, J. F. Bell, S. Bender, J. Bernardin,D. Blaney, J. Blank, M. Bouye, N. Bridges, N. Bultman,P. Caıs, R. C. Clanton, B. Clark, S. Clegg, A. Cousin,D. Cremers, A. Cros, L. DeFlores, D. Delapp, R. Dingler,C. d'Uston, M. Darby Dyar, T. Elliott, D. Enemark,C. Fabre, M. Flores, O. Forni, O. Gasnault, T. Hale,C. Hays, K. Herkenhoff, E. Kan, L. Kirkland, D. Kouach,D. Landis, Y. Langevin, N. Lanza, F. LaRocca, J. Lasue,J. Latino, D. Limonadi, C. Lindensmith, C. Little,N. Mangold, G. Manhes, P. Mauchien, C. McKay,E. Miller, J. Mooney, R. V. Morris, L. Morrison, T. Nelson,H. Newsom, A. Ollila, M. Ott, L. Pares, R. Perez,F. Poitrasson, C. Provost, J. W. Reiter, T. Roberts,F. Romero, V. Sautter, S. Salazar, J. J. Simmonds,R. Stiglich, S. Storms, N. Striebig, J.-J. Thocaven,T. Trujillo, M. Ulibarri, D. Vaniman, N. Warner,R. Waterbury, R. Whitaker, J. Witt and B. Wong-Swanson,The ChemCam Instrument Suite on the Mars ScienceLaboratory (MSL) Rover: Body Unit and Combined SystemTests, Space Sci. Rev., 2012, 170(1–4), 167–227, DOI:10.1007/s11214-012-9902-4.
4 R. C. Wiens, S. Maurice, J. Lasue, O. Forni, R. B. Anderson,S. Clegg, S. Bender, D. Blaney, B. L. Barraclough, A. Cousin,L. Deores, D. Delapp, M. D. Dyar, C. Fabre, O. Gasnault,N. Lanza, J. Mazoyer, N. Melikechi, P.-Y. Meslin,H. Newsom, A. Ollila, R. Perez, R. L. Tokar andD. Vaniman, Pre-ight calibration and initial dataprocessing for the ChemCam laser-induced breakdownspectroscopy instrument on the Mars Science Laboratoryrover, Spectrochim. Acta, Part B, 2013, 82, 1–27, DOI:10.1016/j.sab.2013.02.003.
5 S. Le Mouelic, O. Gasnault, K. E. Herkenhoff, N. T. Bridges,Y. Langevin, N. Mangold, S. Maurice, R. C. Wiens, P. Pinet,H. E. Newsom, R. G. Deen, J. F. Bell, J. R. Johnson, W. Rapin,B. Barraclough, D. L. Blaney, L. Deores, J. Maki,
M. C. Malin, R. Perez and M. Saccoccio, The ChemCamRemote Micro-Imager at Gale crater: review of the rstyear of operations on Mars, Icarus, 2015, 249, 93–107,DOI: 10.1016/j.icarus.2014.05.030.
6 C. Yana, C. Donny, P. Guillemot, V. Lafaille, E. Lorigny,L. Peret, A. Nelson, R. Wiens, B. Barraclough, O. Gasnaultand S. Maurice, Two years of operations of the ChemCaminstrument on-board the Curiosity rover at FIMOC, theFrench operations center for Mars instruments, ThirteenthInternational Conference on Space Operations, May 2014,DOI: 10.2514/6.2014-1901.
7 H. Newsom, Planetary science: clays in the history of Mars,Nature, 2005, 438(7068), 570–571, DOI: 10.1038/438570a.
8 F. Poulet, J.-P. Bibring, J. F. Mustard, A. Gendrin,N. Mangold, Y. Langevin, R. E. Arvidson, B. Gondet andC. Gomez, Phyllosilicates on Mars and implications forearly Martian climate, Nature, 2005, 438(7068), 623–627,DOI: 10.1038/nature04274.
9 J.-P. Bibring, Y. Langevin, J. F. Mustard, F. Poulet,R. Arvidson, A. Gendrin, B. Gondet, N. Mangold, P. Pinet,F. Forget, et al., Global Mineralogical and Aqueous MarsHistory Derived from OMEGA/Mars Express Data, Science,2006, 312(5772), 400–404, DOI: 10.1126/science.1122659.
10 F.-T. Chau, Y.-Z. Liang, J. Gao and X.-G. Shao, Chemometrics:From Basics to Wavelet Transform (Chemical Analysis: A Seriesof Monographs on Analytical Chemistry and Its Applications),Interscience Publishers, Incorporated, March 2004, ISBN:978-0-471-20242-4; P. R. Christensen, R. V. Morris,M. D. Lane, J. L. Bandeld and M. C. Malin, Globalmapping of Martian hematite mineral deposits: remnantsof water-driven processes on early Mars, J. Geophys. Res.,2001, 106(E10), 23873–23886, DOI: 10.1029/2000JE001415.
11 N. Melikechi, A. Mezzacappa, A. Cousin, N. L. Lanza,J. Lasue, S. M. Clegg, G. Berger, R. C. Wiens, S. Maurice,R. L. Tokar, S. Bender, O. Forni, E. A. Breves, M. D. Dyar,J. Frydenvang, D. Delapp, O. Gasnault, H. Newsom,A. M. Ollila, E. Lewin, B. C. Clark, B. L. Ehlmann,D. Blaney and C. Fabre, Correcting for variable laser-target distances of laser-induced breakdown spectroscopymeasurements with ChemCam using emission lines ofMartian dust spectra, Spectrochim. Acta, Part B, 2014, 96,51–60, DOI: 10.1016/j.sab.2014.04.004.
12 A. Cousin, O. Forni, S. Maurice, O. Gasnault, C. Fabre,V. Sautter, R. C. Wiens and J. Mazoyer, Laser inducedbreakdown spectroscopy library for the Martianenvironment, Spectrochim. Acta, Part B, 2011, 66(11–12),805–814, DOI: 10.1016/j.sab.2011.10.004.
13 R. E. Russo, A. A. Bol'shakov, X. Mao, C. P. McKay,D. L. Perry and O. Sorkhabi, Laser Ablation MolecularIsotopic Spectrometry, Spectrochim. Acta, Part B, 2011,66(2), 99–104, DOI: 10.1016/j.sab.2011.01.007.
14 M. Ga, L. Nagli, N. Eliezer, Y. Groisman and O. Forni,Elemental analysis of halogens using molecular emissionby laser-induced breakdown spectroscopy in air,Spectrochim. Acta, Part B, 2014, 98, 39–47, DOI: 10.1016/j.sab.2014.05.011.
15 C. G. Parigger, Atomic and molecular emissions in laser-induced breakdown spectroscopy, Spectrochim. Acta, PartB, 2013, 79–80, 4–16, DOI: 10.1016/j.sab.2012.11.012.
16 C. Fabre, A. Cousin, R. C. Wiens, A. Ollila, O. Gasnault,S. Maurice, V. Sautter, O. Forni, J. Lasue, R. Tokar,D. Vaniman and N. Melikechi, In situ calibration usingunivariate analyses based on the on-board ChemCamtargets: rst prediction of Martian rock and soilcompositions, Spectrochim. Acta, Part B, 2014, 99, 34–51,DOI: 10.1016/j.sab.2014.03.014.
17 A. M. Ollila, H. E. Newsom, B. Clark, R. C. Wiens, A. Cousin,J. G. Blank, N. Mangold, V. Sautter, S. Maurice, S. M. Clegg,O. Gasnault, O. Forni, R. Tokar, E. Lewin, M. D. Dyar,J. Lasue, R. Anderson, S. M. McLennan, J. Bridges,D. Vaniman, N. Lanza, C. Fabre, N. Melikechi,G. M. Perrett, J. L. Campbell, P. L. King, B. Barraclough,D. Delapp, S. Johnstone, P.-Y. Meslin, A. Rosen-Goodingand J. Williams, Trace element geochemistry (Li, Ba, Sr,and Rb) using Curiosity's ChemCam: early results for Galecrater from Bradbury landing site to Rocknest, J. Geophys.Res.: Planets, 2014, 119(1), 255–285, DOI: 10.1002/2013JE004517.
18 M. Clegg Samuel, S. Elizabeth, M. Darby Dyar, J. E. Bareeldand R. C. Wiens, Multivariate analysis of remote laser-induced breakdown spectroscopy spectra using partialleast squares, principal component analysis, and relatedtechniques, Spectrochim. Acta, Part B, 2009, 64(1), 79–88,DOI: 10.1016/j.sab.2008.10.045.
19 J. Lasue, R. C. Wiens, T. F. Stepinski, O. Forni, S. M. Clegg,S. Maurice and ChemCam team, Nonlinear mappingtechnique for data visualization and clusteringassessment of LIBS data: application to ChemCam data,Anal. Bioanal. Chem., 2011, 400(10), 3247–3260, DOI:10.1007/s00216-011-4747-3.
20 M. D. Dyar, M. L. Carmosino, E. A. Speicher, M. V. Ozanne,S. M. Clegg and R. C. Wiens, Comparison of partial leastsquares and lasso regression techniques for laser-inducedbreakdown spectroscopy of geological samples,Spectrochim. Acta, Part B, 2012, 70, 51–67, DOI: 10.1016/j.sab.2012.04.011.
21 M. Ollila Ann, J. Lasue, H. E. Newsom, R. A. Multari,R. C. Wiens and S. M. Clegg, Comparison of two partialleast squares-discriminant analysis algorithms foridentifying geological samples with the ChemCam laser-induced breakdown spectroscopy instrument, Appl. Opt.,2012, 51(7), B130–B142, DOI: 10.1364/AO.51.00B130.
22 O. Forni, S. Maurice, O. Gasnault, R. C. Wiens, A. Cousin,S. M. Clegg, J.-B. Sirven and J. Lasue, Independentcomponent analysis classication of laser inducedbreakdown spectroscopy spectra, Spectrochim. Acta, Part B,2013, 86, 31–41, DOI: 10.1016/j.sab.2013.05.003.
23 R. B. Anderson, S. M. Clegg, B. L. Ehlmann, R. V. Morris,S. M. McLennan, T. Boucher, M. D. Dyar, R. McInroy,D. Delapp, R. C. Wiens, J. Frydenvang, O. Forni,S. Maurice, O. Gasnault, J. Lasue and C. Fabre, ExpandedCompositional Database for ChemCam QuantitativeCalibration, 8th International Conference on Mars,
884 | J. Anal. At. Spectrom., 2016, 31, 863–889
Pasadena, California, 14–18 July 2014, LPI ContributionNo. 1791, p. 1275.
24 C. Fabre, S. Maurice, A. Cousin, R. C. Wiens, O. Forni,V. Sautter and D. Guillaume, Onboard calibration igneoustargets for the Mars Science Laboratory Curiosity roverand the Chemistry Camera laser induced breakdownspectroscopy instrument, Spectrochim. Acta, Part B, 2011,66, 280–289, DOI: 10.1016/j.sab.2011.03.012.
25 D. Vaniman, M. D. Dyar, R. Wiens, A. Ollila, N. Lanza,J. Lasue, J. M. Rhodes, S. Clegg and H. Newsom, CeramicChemCam calibration targets on Mars Science Laboratory,Space Sci. Rev., 2012, 170(1–4), 229–255, DOI: 10.1007/s11214-012-9886-0.
26 A. Cremers David and L. J. Radziemski, Detection ofchlorine and uorine in air by laser-induced breakdownspectrometry, Anal. Chem., 1983, 55(8), 1252–1256, DOI:10.1021/ac00259a017.
27 M. Nachon, N. Mangold, A. Cousin, R. B. Anderson,J. G. Blank, F. Calef, S. Clegg, C. Fabre, M. Fisk,O. Gasnault, L. C. Kah, R. Kronyak, J. Lasuer, P.-Y. Meslin,S. Le Mouelic, S. Maurice, D. Z. Oehler, V. Payre,W. Rapin, D. Sumner, K. Stack, S. Schroder andR. C. Wiens, Diagenetic Features Analyzed by ChemCam/Curiosity at Pahrump Hills, Gale crater, Mars, 46th Lunarand Planetary Science Conference, held March 16–20, 2015in The Woodlands, Texas, LPI Contribution No. 1832,March 2015, p. 1524.
28 D. L. Blaney, R. C. Wiens, S. Maurice, S. M. Clegg,R. B. Anderson, L. C. Kah, S. Le Mouelic, A. Ollila,N. Bridges, R. Tokar, G. Berger, J. C. Bridges, A. Cousin,B. Clark, M. D. Dyar, P. L. King, N. Lanza, N. Mangold,P.-Y. Meslin, H. Newsom, S. Schroder, S. Rowland,J. Johnson, L. Edgar, O. Gasnault, O. Forni, M. Schmidt,W. Goetz, K. Stack, D. Sumner, M. Fisk andM. B. Madsen, Chemistry and texture of the rocks atRocknest, Gale crater: evidence for sedimentary originand diagenetic alteration, J. Geophys. Res.: Planets, 2014,119(9), 2109–2131, DOI: 10.1002/2013JE004590.
29 S. Schroder, P.-Y. Meslin, O. Gasnault, S. Maurice,A. Cousin, R. C. Wiens, W. Rapin, M. D. Dyar,N. Mangold, O. Forni, M. Nachon, S. Clegg, J. R. Johnson,J. Lasue, S. Le Mouelic, A. Ollila, P. Pinet, V. Sautter andD. Vaniman, Hydrogen detection with ChemCam at Galecrater, Icarus, 2015, 249, 43–61, DOI: 10.1016/j.icarus.2014.08.029.
30 P.-Y. Meslin, O. Gasnault, O. Forni, S. Schroder, A. Cousin,G. Berger, S. M. Clegg, J. Lasue, S. Maurice and V. Sautter,et. al., Soil Diversity and Hydration as Observed byChemCam at Gale crater, Mars, Science, 2013, 341(6153),DOI: 10.1126/science.1238670.
31 A. M. Ollila, J. G. Blank, R. C. Wiens, J. Lasue,H. E. Newsom, S. M. Clegg, A. Cousin and S. Maurice,Preliminary Results on the Capabilities of the ChemCamLaser-Induced Breakdown Spectroscopy (LIBS) Instrumentto Detect Carbon on Mars, 42nd Lunar and PlanetaryScience Conference, held March 7–11, 2011 at The
Woodlands, Texas, LPI Contribution No. 1608, March 2011,p. 2395.
32 J. Lasue, S. Maurice, A. Cousin, O. Forni, P.-Y. Meslin,W. Rapin, S. Schroder, A. Ollila, G. Berger, N. Bridges,S. M. Clegg, C. d'Uston, C. Fabre, O. Gasnault, W. Goetz,J. Johnson, N. Lanza, S. Le Mouelic, M. B. Madsen,N. Mangold, N. Melikechi, A. Mezzacappa, H. Newsomand R. C. Wiens, ChemCam Analysis of Martian FineDust, 45th Lunar and Planetary Science Conference, held17–21 March, 2014 at The Woodlands, Texas, MSL ScienceTeam, LPI Contribution No. 1777, March 2014, p. 1224.
33 J. G. Blank, A. M. Ollila, N. L. Lanza, O. Forni, N. Mangold,M. Nachon, S. M. Clegg, A. Yen, S. Maurice and R. C. Wiens,Detection of phosphorous by ChemCam in Gale crater, 46thLunar and Planetary Science Conference, held March 16–20,2015 in The Woodlands, Texas, LPI Contribution No. 1832,2015, p. 2850.
34 B. Salle, J.-L. Lacour, E. Vors, P. Fichet, S. Maurice,D. A. Cremers and R. C. Wiens, Laser-Induced BreakdownSpectroscopy for Mars surface analysis: capabilities atstand-off distances and detection of chlorine and sulfurelements, Spectrochim. Acta, Part B, 2004, 59(9), 1413–1422, DOI: 10.1016/j.sab.2004.06.006.
35 M. D. Dyar, M. T. Jonathan, H. Seth, M. C. Samuel,C. W. Roger and D. L. Melissa, Strategies for Mars remoteLaser-Induced Breakdown Spectroscopy analysis of sulfurin geological samples, Spectrochim. Acta, Part B, 2011,66(1), 39–56, DOI: 10.1016/j.sab.2010.11.016.
36 D. A. Cremers and J. R. Leon, Handbook of laser-inducedbreakdown spectroscopy, Cambridge University, 2006, vol.25.
37 O. Forni, M. Ga, M. J. Toplis, S. M. Clegg, S. Maurice,R. C. Wiens, icolas Mangold, O. Gasnault, V. Sautter, S. LeMouelic, P.-Y. Meslin, M. Nachon, R. E. McInroy,A. M. Ollila, A. Cousin, J. C. Bridges, N. L. Lanza andM. D. Dyar, First detection of uorine on Mars:Implications for Gale crater's geochemistry, Geophys. Res.Lett., 2015, 42(4), 1020–1028, DOI: 10.1002/2014GL062742.
38 C. Fabre, M.-C. Boiron, J. Dubessy, A. Chabiron andB. Charoy, Martin Crespo, Tomas, Advances in lithiumanalysis in solids by means of laser-induced breakdownspectroscopy: an exploratory study, Geochim. Cosmochim.Acta, 2002, 66(8), 1401–1407, DOI: 10.1016/S0016-7037(01)00858-4.
39 V. Sautter, C. Fabre, O. Forni, M. J. Toplis, A. Cousin,A. M. Ollila, P.-Y. Meslin, S. Maurice, R. C. Wiens,D. Baratoux, N. Mangold, S. Le Mouelic, O. Gasnault,G. Berger, J. Lasue, R. A. Anderson, E. Lewin, M. Schmidt,D. Dyar, B. L. Ehlmann, J. Bridges, B. Clark and P. Pinet,Igneous mineralogy at Bradbury Rise: the rst ChemCamcampaign at Gale crater, J. Geophys. Res.: Planets, 2014,119(1), 30–46, DOI: 10.1002/2013JE004472.
40 V. Sautter, M. J. Toplis, R. C. Wiens, A. Cousin, C. Fabre,O. Gasnault, S. Maurice, O. Forni, J. Lasue, A. Ollila,J. C. Bridges, N. Mangold, S. Le Mouelic, M. Fisk,P.-Y. Meslin, P. Beck, P. Pinet, L. Le Deit, W. Rapin,E. M. Stolper, H. Newsom, D. Dyar, N. Lanza, D. Vaniman,
S. Clegg and J. J. Wray, In situ evidence for continentalcrust on early Mars, Nat. Geosci., 2015, 8(8), 605–609, DOI:10.1038/ngeo2474.
41 N. L. Lanza, W. W. Fischer, R. C. Wiens, J. Grotzinger,A. M. Ollila, A. Cousin, R. B. Anderson, B. C. Clark,R. Gellert, N. Mangold, S. Maurice, S. Le Mouelic,M. Nachon, M. Schmidt, J. Berger, S. M. Clegg, O. Forni,C. Hardgrove, N. Melikechi, H. E. Newsom and V. Sautter,High manganese concentrations in rocks at Gale crater,Mars, Geophys. Res. Lett., 2014, 41(16), 5755–5763, DOI:10.1002/2014GL060329.
42 J. Lasue, S. M. Clegg, O. Forni, A. Cousin, R. C. Wiens,N. Lanza, N. Mangold, O. Gasnault and S. Maurice, MSLScience Team, Detection of Zn with ChemCam on Mars,46th Lunar and Planetary Science Conference, held March16–20, 2015 in The Woodlands, Texas, LPI ContributionNo. 1832, March 2015, p. 1413.
43 A. K. Knight, N. L. Scherbarth, D. A. Cremers andM. J. Ferris, Characterization of laser-induced breakdownspectroscopy (LIBS) for application to space exploration,Appl. Spectrosc., 2000, 54(3), 331–340, DOI: 10.1366/0003702001949591.
44 M. C. McCanta, P. A. Dobosh, M. D. Dyar andH. E. Newsom,Testing the veracity of LIBS analyses on Mars using theLIBSSIM program, Planet. Space Sci., 2013, 81, 48–54, DOI:10.1016/j.pss.2013.03.004.
45 D. Cremers and R. Chinni, Laser-Induced BreakdownSpectroscopy—Capabilities and Limitations, Appl.Spectrosc. Rev., 2009, 44(6), 457–506, DOI: 10.1080/05704920903058755.
46 N. J. McMillan, S. Rees, K. Kochelek and C. McManus,Geological Applications of Laser-Induced BreakdownSpectroscopy, Geostand. Geoanal. Res., 2014, 38, 329–343,DOI: 10.1111/j.1751-908X.2014.00308.x.
47 A. Cousin, V. Sautter, N. Mangold, C. Fabre, O. Forni,W. Rapin, M. Fisk, O. Gasnault, N. Lanza, J. Lasue,P.-Y. Meslin, H. Newsom, A. Ollila, V. Payre, R. C. Wiensand S. Maurice, Igneous Rock Classication at Gale (Sols13–800), 46th Lunar and Planetary Science Conference, heldMarch 16–20, 2015 in The Woodlands, Texas, LPIContribution No. 1832, March 2015, p. 2452.
48 B. Salle, D. A. Cremers, S. Maurice and R. C. Wiens, Laser-induced breakdown spectroscopy for space explorationapplications: inuence of the ambient pressure on thecalibration curves prepared from soil and clay samples,Spectrochim. Acta, Part B, 2005, 60(4), 479–490, DOI:10.1016/j.sab.2005.02.009.
49 E. M. Stolper, M. B. Baker, M. E. Newcombe, M. E. Schmidt,A. H. Treiman, A. Cousin, M. D. Dyar, M. R. Fisk, R. Gellert,P. L. King, et al. The Petrochemistry of Jake_M: A MartianMugearite, Science, 2013, 341(6153), DOI: 10.1126/science.1239463.
50 M. E. Schmidt, J. L. Campbell, R. Gellert, G. M. Perrett,A. H. Treiman, D. L. Blaney, A. Ollila, F. J. Calef, L. Edgar,B. E. Elliott, J. Grotzinger, J. Hurowitz, P. L. King,M. E. Minitti, V. Sautter, K. Stack, J. A. Berger,J. C. Bridges, B. L. Ehlmann, O. Forni, L. A. Leshin,
K. W. Lewis, S. M. McLennan, D. W. Ming, H. Newsom,I. Pradler, S. W. Squyres, E. M. Stolper, L. Thompson,S. VanBommel and R. C. Wiens, Geochemical diversity inrst rocks examined by the Curiosity Rover in Gale crater:evidence for and signicance of an alkali and volatile-richigneous source, J. Geophys. Res.: Planets, 2014, 119(1), 64–81, DOI: 10.1002/2013JE004481.
51 A. Cousin, P.-Y. Meslin, R. C. Wiens, W. Rapin, N. Mangold,C. Fabre, O. Gasnault, O. Forni, R. Tokar, A. Ollila,S. Schroder, J. Lasue, S. Maurice, V. Sautter, H. Newsom,D. Vaniman, S. Le Mouelic, D. Dyar, G. Berger, D. Blaney,M. Nachon, G. Dromart, N. Lanza, B. Clark, S. Clegg,W. Goetz, J. Berger, B. Barraclough and D. Delapp,Compositions of coarse and ne particles in Martian soilsat Gale: a window into the production of soils, Icarus,2015, 249, 22–42, DOI: 10.1016/j.icarus.2014.04.052.
52 M. Collinet, E. Medard, B. Charlier, A. Vander, G. Jacquelineand L. Timothy, Melting of the primitive Martian mantle at0.5–2.2 GPa and the origin of basalts and alkaline rocks onMars, Earth Planet. Sci. Lett., 2015, 427, 83–94, DOI: 10.1016/j.epsl.2015.06.056.
53 S. W. Squyres, R. E. Arvidson, D. L. Blaney, B. C. Clark,L. Crumpler, W. H. Farrand, S. Gorevan, K. E. Herkenhoff,J. Hurowitz, A. Kusack, H. Y. McSween, D. W. Ming,R. V. Morris, S. W. Ruff, A. Wang and A. Yen, Rocks of theColumbia Hills, J. Geophys. Res., 2006, 111(E2), DOI:10.1029/2005JE002562.
54 D. Baratoux, H. Samuel, C. Michaut, M. J. Toplis,M. Monnereau, M. Wieczorek, R. Garcia and K. Kurita,Petrological constraints on the density of the Martiancrust, J. Geophys. Res.: Planets, 2014, 119(7), 1707–1727,DOI: 10.1002/2014JE004642.
55 S. W. Squyres, R. E. Arvidson, E. T. Baumgartner, J. F. Bell,P. R. Christensen, S. Gorevan, K. E. Herkenhoff,G. Klingelhofer, M. B. Madsen, R. V. Morris, R. Riederand R. A. Romero, Athena Mars rover scienceinvestigation, J. Geophys. Res., 2003, 108(E12), 3, DOI:10.1029/2003JE002121.
56 G. Klingelhofer, R. V. Morris, B. Bernhardt, C. Schroder,D. S. Rodionov, P. A. de Souza Jr, A. Yen, R. Gellert,E. N. Evlanov, B. Zubkov, J. Foh, U. Bonnes, E. Kankeleit,P. Gutlich, D. W. Ming, F. Renz, T. Wdiwiak,S. W. Squyres and R. E. Arvidson, Jarosite and hematite atMeridiani Planum from Opportunity's MossbauerSpectrometer, Science, 2004, 306, 1740–1745.
57 S. R. Taylor and S. McLennan, Planetary Crusts: TheirComposition, Origin and Evolution, Planetary Crusts: TheirComposition, Origin and Evolution, Cambridge Catalogue,January 2009.
58 D. F. Blake, R. V. Morris, G. Kocurek, S. M. Morrison,R. T. Downs, D. Bish, D. W. Ming, K. S. Edgett, D. Rubin,W. Goetz, et al., Curiosity at Gale crater, Mars:Characterization and Analysis of the Rocknest SandShadow, Science, 2013, 341(6153), DOI: 10.1126/science.1239505.
59 D. L. Bish, D. F. Blake, D. T. Vaniman, S. J. Chipera,R. V. Morris, D. W. Ming, A. H. Treiman, P. Sarrazin,
886 | J. Anal. At. Spectrom., 2016, 31, 863–889
S. M. Morrison, R. T. Downs, et al., X-ray DiffractionResults from Mars Science Laboratory: Mineralogy ofRocknest at Gale crater, Science, 2013, 341(6153), DOI:10.1126/science.1238932.
60 A. S. Yen, R. Gellert, C. Schroder, R. V. Morris, J. F. Bell,A. T. Knudson, B. C. Clark, D. W. Ming, J. A. Crisp,R. E. Arvidson, D. Blaney, J. Bruckner, P. R. Christensen,D. J. Desmarais, P. A. de Souza, T. E. Economou,A. Ghosh, B. C. Hahn, K. E. Herkenhoff, L. A. Haskin,J. A. Hurowitz, B. L. Joliff, J. R. Johnson, G. Klingelhofer,M. B. Madsen, S. M. McLennan, H. Y. McSween,L. Richter, R. Rieder, D. Rodionov, L. Soderblom,S. W. Squyres, N. J. Tosca, A. Wang, M. Wyatt andJ. Zipfel, An integrated view of the chemistry andmineralogy of Martian soils, Nature, 2005, 436(7047), 49–54, DOI: 10.1038/nature03637.
61 B. C. Clark, A. J. Castro, C. D. Rowe, A. K. Baird, P. H. Evans,H. J. Rose Jr, P. Toulmin III, K. Keil and W. C. Kelliher,Inorganic analyses of Martian surface samples at theViking landing sites, Science, 1976, 194, 1283–1288, DOI:10.1126/science.194.4271.1283.
62 H. E. Newsom, J. J. Hagerty and F. Goff, Mixedhydrothermal uids and the origin of the Martian soil, J.Geophys. Res., 1999, 104(E4), 8717–8728, DOI: 10.1029/1998JE900043.
63 S. Maurice, W. Feldman, B. Diez, O. Gasnault,D. J. Lawrence, A. Pathare and T. Prettyman, MarsOdyssey neutron data: 1. Data processing and models ofwater-equivalent-hydrogen distribution, J. Geophys. Res.,2011, 116(E11), DOI: 10.1029/2011JE003810.
64 F. J. Martın-Torres, M.-P. Zorzano, C. Armiens, I. Carrasco,A. Delgado-Bonal, M. Genzer, F. Gomez, J. Gomez-Elvira,R. Haberle, V. E. Hamilton, A.-M. Harri, H. Kahanpaa,O. Kemppinen, M. T. Lemmon, A. Lepinette, J. MartınSoler, J. Martınez-Frıas, M. Mischna, L. Mora, S. Navarro,C. Newman, M. A. de Pablo, J. Pla-Garcıa, V. Peinado,J. Polkko, S. C. R. Rain, M. Ramos, N. O. Renno,M. Richardson, J. A. Rodrıguez-Manfredi, J. J. RomeralPlanello, E. Sebastian, M. de la Torre Juarez, J. Torres,A. Ullan, R. Urquı, P. Valentın-Serrano, A. R. Vasavadaand MSL Science Team, Highlights from the RoverEnvironmental Monitoring Station (REMS) on Board theMars Science Laboratory: New Windows for AtmosphericResearch on Mars, The Fih International Workshop on theMars Atmosphere: Modelling and Observation, held onJanuary 13–16 2014, ed. F. Forget and M. Millour, Oxford,U.K., id. 1103, January 2014.
65 L. A. Leshin, P. R. Mahaffy, C. R. Webster, M. Cabane,P. Coll, P. G. Conrad, P. D. Archer, S. K. Atreya,A. E. Brunner, et al., Volatile, Isotope, and OrganicAnalysis of Martian Fines with the Mars Curiosity Rover,Science, 2013, 341(6153), DOI: 10.1126/science.1238937.
66 R. T. Clancy, M. J. Wolff and P. R. Christensen, Mars aerosolstudies with the MGS TES emission phase functionobservations: optical depths, particle sizes, and ice cloudtypes versus latitude and solar longitude, J. Geophys. Res.,2003, 108(E9), 1–2, DOI: 10.1029/2003JE002058.
67 J. Audouard, F. Poulet, M. Vincendon, R. E. Milliken,D. Jouglet, J.-P. Bibring, B. Gondet and Y. Langevin, Waterin the Martian regolith from OMEGA/Mars Express, J.Geophys. Res.: Planets, 2014, 119(8), 1969–1989, DOI:10.1002/2014JE004649.
68 R. M. E. Williams, J. P. Grotzinger, W. E. Dietrich, S. Gupta,D. Y. Sumner, R. C. Wiens, N. Mangold, M. C. Malin,K. S. Edgett, S. Maurice, et al., Martian FluvialConglomerates at Gale crater, Science, 2013, 340(6136),1068–1072, DOI: 10.1126/science.1237317.
69 M. C. Palucis, W. E. Dietrich, A. G. Hayes, R. M. E. Williams,S. Gupta, N. Mangold, H. Newsom, C. Hardgrove, F. Calefand D. Y. Sumner, The origin and evolution of the PeaceVallis fan system that drains to the Curiosity landing area,Gale crater, Mars, J. Geophys. Res.: Planets, 2014, 119(4),705–728, DOI: 10.1002/2013JE004583.
70 N. Mangold, O. Forni, A. Ollila, R. Anderson, G. Berger,J. C. Bridges, S. M. Clegg, A. Cousin, W. E. Dietrich,S. Gupta, E. Lewin, C. Fabre, O. Gasnault, K. Herkenhoff,S. Le Mouelic, S. Maurice, P.-Y. Meslin, V. Sautter,R. C. Wiens, R. Williams and MSL Science Team,Chemcam Analysis of Conglomerates at Bradbury Site,Mars, 44th Lunar and Planetary Science Conference, heldMarch 18–22, 2013 in The Woodlands, Texas, LPIContribution No. 1719, March 2013, p. 1267.
71 N. Mangold, O. Forni, G. Dromart, K. Stack, R. C. Wiens,O. Gasnault, D. Y. Sumner, M. Nachon, P. Y. Meslin,R. B. Anderson, B. Barraclough, J. F. Bell III, G. Berger,D. L. Blaney, J. C. Bridges, F. Calef, B. Clark, S. M. Clegg,A. Cousin, L. Edgar, K. Edgett, B. Ehlmann, C. Fabre,M. Fisk, J. Grotzinger, S. Gupta, K. E. Herkenhoff,J. Hurowitz, J. R. Johnson, L. C. Kah, N. Lanza, J. Lasue,S. Le Mouelic, R. Leveille, E. Lewin, M. Malin,S. McLennan, S. Maurice, N. Melikechi, A. Mezzacappa,R. Milliken, H. Newsom, A. Ollila, S. K. Rowland,V. Sautter, M. Schmidt, S. Schroder, C. d'Uston,D. Vaniman and R. Williams, Chemical variations inYellowknife Bay formation sedimentary rocks analyzed byChemCam on board the Curiosity rover on Mars, J.Geophys. Res. Planets, 2015, 120, 452–482, DOI: 10.1002/2014JE004681.
72 A. R. Vasavada, J. P. Grotzinger, R. E. Arvidson, F. J. Calef,J. A. Crisp, S. Gupta, J. Hurowitz, N. Mangold, S. Maurice,M. E. Schmidt, R. C. Wiens, R. M. E. Williams andR. A. Yingst, Overview of the Mars Science Laboratorymission: Bradbury Landing to Yellowknife Bay andbeyond, J. Geophys. Res.: Planets, 2014, 119(6), 1134–1161,DOI: 10.1002/2014JE004622.
73 L. Le Deit, N. Mangold, O. Forni, D. Blaney, A. Cousin,G. Dromart, C. Fabre, M. Fisk, O. Gasnault, N. Lanza,J. Lasue, S. Le Mouelic, S. Maurice, M. Nachon, W. Rapin,M. Rice, V. Sautter, S. Schroder, D. Sumner andR. C. Wiens, The Potassic Sedimentary Rocks in Galecrater, Mars as Seen by ChemCam On-board Curiosity,46th Lunar and Planetary Science Conference, held March16–20, 2015 in The Woodlands, Texas, LPI ContributionNo. 1832, March 2015, p. 1438.
74 M. Nachon, S. M. Clegg, N. Mangold, S. Schroder, L. C. Kah,G. Dromart, A. Ollila, J. R. Johnson, D. Z. Oehler,J. C. Bridges, S. Le Mouelic, O. Forni, R. C. Wiens,R. B. Anderson, D. L. Blaney, J. F. Bell, B. Clark,A. Cousin, M. D. Dyar, B. Ehlmann, C. Fabre, O. Gasnault,J. Grotzinger, J. Lasue, E. Lewin, R. Leveille, S. McLennan,S. Maurice, P.-Y. Meslin, W. Rapin, M. Rice,S. W. Squyres, K. Stack, D. Y. Sumner, D. Vaniman andD. Wellington, Calcium sulfate veins characterized byChemCam/Curiosity at Gale crater, Mars, J. Geophys. Res.:Planets, 2014, 119(9), 1991–2016, DOI: 10.1002/2013JE004588.
75 S. M. McLennan, R. B. Anderson, J. F. Bell, J. C. Bridges,F. Calef, J. L. Campbell, B. C. Clark, S. Clegg, P. Conrad,A. Cousin, et al., Elemental Geochemistry of SedimentaryRocks at Yellowknife Bay, Gale crater, Mars, Science, 2014,343(6169), 1244734, DOI: 10.1126/science.1244734.
76 D. T. Vaniman, D. L. Bish, D. W. Ming, T. F. Bristow,R. V. Morris, D. F. Blake, S. J. Chipera, S. M. Morrisonand A. H. Treiman, Rampe, and 435 coauthors,Mineralogy of a Mudstone at Yellowknife Bay, Gale crater,Mars, Science, 2014, 343(6169), 1243480, DOI: 10.1126/science.1243480.
77 M. S. Rice, E. A. Cloutis, J. F. Bell, D. L. Bish, B. H. Horgan,S. A. Mertzman, M. A. Craig, R. W. Renaut, B. Gautason andB. Mountain, Reectance spectra diversity of silica-richmaterials: sensitivity to environment and implications fordetections on Mars, Icarus, 2013, 223(1), 499–533, DOI:10.1016/j.icarus.2012.09.021.
78 R. E. Kronyak, L. C. Kah, M. Nachon, N. Mangold,R. C. Weins, R. Williams, J. Schieber and J. Grotzinger,Distribution of Mineralized Veins from Yellowknife Bay toMount Sharp, Gale crater, Mars: Insight from Texturaland Compositional Variation, 46th Lunar and PlanetaryScience Conference, held March 16–20, 2015 in TheWoodlands, Texas, LPI Contribution No. 1832, March2015, p. 1903.
79 R. J. Leveille, J. Bridges, R. C. Wiens, N. Mangold, A. Cousin,N. Lanza, O. Forni, A. Ollila, J. Grotzinger, S. Clegg,K. Siebach, G. Berger, B. Clark, C. Fabre, R. Anderson,O. Gasnault, D. Blaney, D. Lauren, L. Laurie, M. Sylvestreand N. Horton, Chemistry of fracture-lling raised ridgesin Yellowknife Bay, Gale crater: window into past aqueousactivity and habitability on Mars, J. Geophys. Res.: Planets,2014, 119(11), 2398–2415, DOI: 10.1002/2014JE004620.
80 L. C. Kah, R. Kronyak, J. Van Beek, M. Nachon, N. Mangold,L. Thompson, R. Wiens, J. Grotzinger, J. Farmer, M. Minitti,J. Schieber and D. Oehler, Diagenetic Crystal Clusters andDendrites, Lower Mount Sharp, Gale crater, 46th Lunarand Planetary Science Conference, held March 16–20, 2015in The Woodlands, Texas, LPI Contribution No. 1832,March 2015, p. 1901.
81 O. Gasnault, R. B. Anderson, O. Forni, S. Maurice,R. C. Wiens and P. Pinet, Classication of ChemCamTargets Along the Traverse of Curiosity at Gale, EighthInternational Conference on Mars, held July 14–18, 2014 in
Pasadena, California, LPI Contribution No. 1791, July 2014,p. 1269.
82 A. A. Freaman, Materials and Surface Processes at Galecrater and the Moons of Mars Derived from High Spatialand Spectral Resolution Orbital Datasets, Ph.D. Thesis,Washington University, St. Louis, 2014, PublicationNumber: AAT 3619813, ISBN: 9781303893384, Source:Dissertation Abstracts International, Section: B, vol. 75–08(E), p. 149.
83 R. Anderson, J. C. Bridges, A. Williams, L. Edgar, A. Ollila,J. Williams, M. Nachon, N. Mangold, M. Fisk, J. Schieber,S. Gupta, G. Dromart, R. Wiens, S. Le Mouelic, O. Forni,N. Lanza, A. Mezzacappa, V. Sautter, D. Blaney, B. Clark,S. Clegg, O. Gasnault, J. Lasue, R. Leveille, E. Lewin,K. W. Lewis, S. Maurice, H. Newsom, S. P. Schwenzer andD. Vaniman, ChemCam results from the Shaler outcropin Gale crater, Mars, Icarus, 2015, 249, 2–21, DOI: 10.1016/j.icarus.2014.07.025.
84 E. Dehouck, A. Gaudin, N. Mangold, L. Lajaunie,A. Dauzeres, O. Grauby and E. Le Menn, Weathering ofolivine under CO2 atmosphere: a Martian perspective,Geochim. Cosmochim. Acta, 2014, 135, 170–189, DOI:10.1016/j.gca.2014.03.032.
85 P. Sobron, A. Wang and F. Sobron, Extraction ofcompositional and hydration information of sulfates fromlaser-induced plasma spectra recorded under Marsatmospheric conditions—Implications for ChemCaminvestigations on Curiosity rover, Spectrochim. Acta, Part B,2012, 68, 1–16, DOI: 10.1016/j.sab.2012.01.002.
86 M. Ossorio, A. E. S. Van Driessche, P. Perez and J. M. Garcıa-Ruiz, The gypsum-anhydrite paradox revisited, Chem. Geol.,2014, 386, 16–21, DOI: 10.1016/j.chemgeo.2014.07.026.
87 N. L. Lanza, R. C. Wiens, R. E. Arvidson, B. C. Clark,W. W. Fischer, R. Gellert, J. P. Grotzinger, J. A. Hurowitz,S. M. McLennan, R. V. Morris, M. S. Rice, J. F. Bell,J. A. Berger, D. L. Blaney, J. G. Blank, N. T. Bridges,F. Calef, J. L. Campbell, S. M. Clegg, A. Cousin,K. S. Edgett, C. Fabre, M. R. Fisk, O. Forni, J. Frydenvang,K. R. Hardy, C. Hardgrove, J. R. Johnson, L. C. Kah,J. Lasue, S. Le Mouelic, M. C. Malin, N. Mangold,J. Martin-Torres, S. Maurice, M. J. McBride, D. W. Ming,H. E. Newsom, S. Schroder, L. M. Thompson,A. H. Treiman, S. VanBommel, D. T. Vaniman andM.-P. Zorzano, Oxidation of Manganese at Kimberley,Gale crater: More Free Oxygen in Mars' Past?, 46th Lunarand Planetary Science Conference, held March 16–20, 2015in The Woodlands, Texas, LPI Contribution No. 1832,March 2015, p. 2893.
88 W. Goetz, P. Bertelsen, C. S. Binau, H. P. Gunnlaugsson,S. F. Hviid, K. M. Kinch, D. E. Madsen, M. B. Madsen,M. Olsen, R. Gellert, G. Klingelhofer, D. W. Ming,R. V. Morris, R. Rieder, D. S. Rodionov, P. A. de Souza Jr,C. Schroder, S. W. Squyres, T. Wdowiak and A. Yen,Indication of drier periods on Mars from the chemistryand mineralogy of atmospheric dust, Nature, 2005, 436,62–65.
888 | J. Anal. At. Spectrom., 2016, 31, 863–889
89 D. W. Ming, R. Gellert, R. V. Morris, R. E. Arvidson,J. Bruckner, B. C. Clark, B. A. Cohen, C. d'Uston,T. Economou, I. Fleischer, G. Klingelhofer, T. J. McCoy,D. W. Mittlefehldt, M. E. Schmidt, C. Schroder,S. W. Squyres, E. Treguier, A. S. Yen and J. Zipfel,Geochemical properties of rocks and soils in Gusev crater,Mars: Results of the Alpha Particle X-ray Spectrometerfrom Cumberland Ridge to Home Plate, J. Geophys. Res.,2008, 113, E12S39, DOI: 10.1029/2008JE003195.
90 W. Goetz, P. Bertelsen, C. S. Binau, F. Folkmann,H. P. Gunnlaugsson, J. ı Hjøllum, S. F. Hviid, J. Jensen,K. M. Kinch, K. Leer, D. E. Madsen, J. Merrison, M. Olsen,H. M. Arneson, J. F. Bell III, R. Gellert, K. E. Herkenhoff,J. R. Johnson, M. J. Johnson, G. Klingelhofer,E. McCartney, D. W. Ming, R. V. Morris, J. B. Proton,D. Rodionov, M. Sims, S. W. Squyres, T. Wdowiak andA. S. Yen, Overview of the magnetic propertiesexperiments on the Mars Exploration Rovers, J. Geophys.Res., 2009, 114, E06S90, DOI: 10.1029/2008JE003098.
91 P. R. Christensen, R. V. Morris, M. D. Lane, J. L. Bandeldand M. C. Malin, Global mapping of Martian hematitemineral deposits: remnants of water-driven processes onearly Mars, J. Geophys. Res., 2001, 106(E10), 23873–23886,DOI: 10.1029/2000JE001415.
92 R. E. Arvidson, P. Bellutta, F. Calef, A. A. Fraeman,J. B. Garvin, O. Gasnault, J. A. Grant, J. P. Grotzinger,V. E. Hamilton, M. Heverly, K. A. Iagnemma,J. R. Johnson, N. Lanza, S. Le Mouelic, N. Mangold,D. W. Ming, M. Mehta, R. V. Morris, H. E. Newsom,N. Renno, D. Rubin, J. Schieber, R. Sletten, N. T. Stein,F. Thuillier, A. R. Vasavada, J. Vizcaino and R. C. Wiens,Terrain physical properties derived from orbital data andthe rst 360 Sols of Mars Science Laboratory Curiosityrover observations in Gale crater, J. Geophys. Res.: Planets,2014, 119(6), 1322–1344, DOI: 10.1002/2013JE004605.
93 S. Gupta, D. M. Rubin, M. S. Rice, K. W. Lewis and K. Stack,et al., Makingsense of Martian sediments at the Kimberley,Gale crater, AGU Fall Meeting Abstracts, vol. 1, 12/2014, p.02.
94 A. H. Treiman, D. L. Bish, D. T. Vaniman, et al., Mineralogy,Provenance, and Diagenesis of a Potassic BasalticSandstone on Mars: CheMin X-ray Diffraction of theWindjana Sample (Kimberley Area, Gale crater), J.Geophys. Res.: Planets, 2015, 121(1), 75–106, DOI: 10.1002/2015JE004932.
95 J. A. Berger, M. E. Schmidt, R. Gellert and M. R. Fisk, ZincEnrichments in the Rocks of Gale crater, Mars Measured byMSL-APXS Reect Both High Zn in Jake_M Rocks and theConcentration of Zn in Sedimentary Cements, AmericanGeophysical Union, Fall Meeting, 2014, abstract #P51E-3988.
96 F. Moynier, F. Albarede and G. F. Herzog, Isotopiccomposition of zinc, copper, and iron in lunar samples,Geochim. Cosmochim. Acta, 2006, 70(24), 6103–6117, DOI:10.1016/j.gca.2006.02.030.
97 J. P. Grotzinger, D. Y. Sumner, L. C. Kah, K. Stack, S. Gupta,L. Edgar, D. Rubin, K. Lewis, J. Schieber, N. Mangold, et al.,
A Habitable Fluvio-Lacustrine Environment at YellowknifeBay, Gale crater, Mars, Science, 2014, 343(6169), 1242777,DOI: 10.1126/science.1242777.
98 K. L. Siebach, J. P. Grotzinger, L. C. Kah, K. M. Stack,M. Malin, R. Leveille and D. Y. Sumner, Subaqueousshrinkage cracks in the Sheepbed mudstone: implicationsfor early uid diagenesis, Gale crater, Mars, J. Geophys.Res.: Planets, 2014, 119(7), 1597–1613, DOI: 10.1002/2014JE004623.
99 J. C. Bridges, S. P. Schwenzer, R. Leveille, F. Westall,R. C. Wiens, N. Mangold, T. Bristow, P. Edwards andG. Berger, Diagenesis and clay mineral formation at Galecrater, Mars, J. Geophys. Res.: Planets, 2015, 120, 1–19,DOI: 10.1002/2014JE004757.
100 S. Giguere, T. Boucher, C. Carey, M. D. Dyar andS. Mahadevan, A framework for fully-customized baselineremoval, Sci-X, Providence, RI, 2015, p. 288.
101 M. D. Dyar, T. Boucher, C. Carey, S. Giguere andS. Mahadevan, Choices and improvements in baselineremoval in LIBS spectroscopy, Sci-X, Providence, RI, 2015,p. 138.
102 A. Tara, B. J. Bornstein, D. M. Gaines, R. C. Anderson,D. R. Thompson, M. Burl, R. Castano and M. Judd, AEGISautomated science targeting for the MER Opportunityrover, ACM Transactions on Intelligent Systems andTechnology, vol. 3, Issue 3, 05/2012, DOI: 10.1145/2168752.2168764.
103 T. Estlin, D. Gaines, B. Bornstein, S. Schaffer, V. Tompkins,D. R. Thompson, A. Altinok, R. C. Anderson, M. Burl,R. Castano, D. Blaney, L. De Flores, T. Nelson andR. Wiens, Automated targeting for the MSL roverChemCam spectrometer, in 12th International Symposium
on Articial Intelligence, Robotics, and Automation in Space(i-SAIRAS), June, Montreal, Canada, 2014, pp. 17–19.
104 J. R. Johnson, J. F. Bell, S. Bender, D. Blaney, E. Cloutis,L. DeFlores, B. Ehlmann, O. Gasnault, B. Gondet,K. Kinch, M. Lemmon, S. Le Mouelic, S. Maurice, M. Riceand R. C. Wiens, ChemCam passive reectancespectroscopy of surface materials at the Curiosity landingsite, Icarus, 2015, 249, 74–92, DOI: 10.1016/j.icarus.2014.02.028.
105 T. H. McConnochie, M. D. Smith, S. Bender, M. J. Wolff,J. R. Johnson, M. T. Lemmon, R. C. Wiens, S. Maurice,O. Gasnault, D. Blaney, L. P. DeFlores, A.-M. Harri,O. Kemppinen, M. Genzer, J. E. Moores, M. H. Wong,M. G. Trainer, F. J. Martin-Torres, M.-P. Zorzano andM. de la Torre Juarez, ChemCam Passive Spectroscopy ofAtmospheric O2 and H2O, Eighth International Conferenceon Mars, held July 14–18, 2014 in Pasadena, California, LPIContribution No. 1791, p. 1328, July 2014.
106 S. M. Clegg, R. Wiens, A. K. Misra, S. K. Sharma, J. Lambert,B. Steven, N. Raymond, K. Nowak-Lovato, S. Smrekar,M. Darby Dyar and S. Maurice, Planetary GeochemicalInvestigations Using Raman and Laser-InducedBreakdown Spectroscopy, Appl. Spectrosc., 2014, 68(9),DOI: 10.1366/13-07386.
107 S. Maurice, R. C. Wiens, R. Anderson, O. Beyssac, L. Bonal,S. Clegg, L. DeFlores, G. Dromart, W. Fischer, O. Forni,O. Gasnault, J. Grotzinger, J. Johnson, J. Martinez-Frias,N. Mangold, S. McLennan, F. Montmessin, F. Rull,S. Sharma, T. Fouchet and F. Poulet, SuperCam Team,Science Objectives of the SuperCam Instrument for theMars2020 Rover, 46th Lunar and Planetary ScienceConference, held March 16–20, 2015 in The Woodlands,Texas, LPI Contribution No. 1832, p. 2818, March 2015.