JAAS Journal of Analytical Atomic Spectrometry rsc.li/jaas ISSN 0267-9477 Volume 32 Number 6 June 2017 Pages 1067–1230 PAPER Andrew M. Duffin et al. Characterization of extreme ultraviolet laser ablation mass spectrometry for actinide trace analysis and nanoscale isotopic imaging
Transcript
JAASJournal of Analytical Atomic Spectrometryrsc.li/jaas
ISSN 0267-9477
Volume 32 Number 6 June 2017 Pages 1067–1230
PAPERAndrew M. Duffi n et al. Characterization of extreme ultraviolet laser ablation mass spectrometry for actinide trace analysis and nanoscale isotopic imaging
JAAS
PAPER
Publ
ishe
d on
09
May
201
7. D
ownl
oade
d by
Col
orad
o St
ate
Uni
vers
ity o
n 28
/08/
2017
20:
00:4
7.
View Article OnlineView Journal | View Issue
Characterization
aDepartment of Electrical & Computer Eng
Collins, Colorado 80523, USAbPacic Northwest National Laboratory,
of extreme ultraviolet laserablation mass spectrometry for actinide traceanalysis and nanoscale isotopic imaging
Tyler Green, a Ilya Kuznetsov,a David Willingham,b Benjamin E. Naes,b
Gregory C. Eiden,b Zihua Zhu, b W. Chao,c Jorge J. Rocca,a Carmen S. Menonia
and Andrew M. Duffin*b
We demonstrate a new technique for trace analysis that has nanometer scale resolution imaging capability:
Extreme Ultraviolet Time-of-Flight Laser Ablation Mass Spectrometry (EUV TOF). We describe the
characterization of this technique and discuss its advantages. Using the well-standardized NIST 61x
glasses, the results show the EUV TOF spectra contain well defined signatures of U, Th, and their oxides,
with far fewer spectral interferences than observed in Time-of-Flight Secondary Ion Mass Spectrometry
(SIMS TOF). We demonstrate that the ratio of U and Th ions to the oxide ion signatures is adjustable with
EUV laser pulse energy. Sample utilization efficiency (SUE) which measures the ratio of detected ions to
atoms in the ablated volume was used as a measure of trace analysis sensitivity of EUV TOF. For U and
Th, SUE is 0.014% and 0.017%, respectively, which is comparable to SIMS TOF in the same mass range. In
imaging mode EUV TOF is capable to map variations in composition with a lateral resolution of 80 nm.
Such high lateral resolution enabled mapping of the isotope distribution of 238U and 235U in closely
spaced micron-size uranium oxide particles from isotope standard materials. Trace elemental sensitivity
and nanometer spatial resolution gives EUV TOF great potential to dramatically improve the state-of-
the-art laser ablation/ionization mass spectrometry and elemental spectro-microscopy for applications
such as geochemical, forensic and environmental analysis.
Introduction
The requirements to identify trace and impurities and mapelemental composition in solid samples with high sensitivityand high spatial resolution has driven the implementation ofanalytical methods such as atom probe tomography (APT),1,2
secondary ion mass spectrometry (SIMS),3 scanning trans-mission electron microscopy energy dispersive X-ray spec-trometry (STEM-EDX),4 and laser ablation inductively coupledplasma mass spectrometry (LA-ICPMS).5,6 These techniquesspan a wide range of spatial resolution (nm to 100's of mm) andsensitivity (weight percent to parts per trillion). Ideally, a micro-analytical technique will probe a small volume to keep thespatial resolution as high as possible with near perfectsampling efficiency to keep detection limits as low as possible.This is however very challenging to achieve because the detec-tion of ions scales with the probed sample volume.
ineering, Colorado State University, Fort
Richland, Washington, USA. E-mail:
ational Laboratory, Berkeley, California,
1092–1100
We have recently demonstrated it is possible to mapmolecular composition in organic samples with three dimen-sional nanoscale spatial resolution and high sensitivity withmass spectrometry when using a very compact extreme ultra-violet (EUV) laser operating at 46.9 nm wavelength (26.4 eVphoton energy) for ablation and ionization.7,8 The high locali-zation of EUV photon energy is possible because the EUVphotons are strongly absorbed by direct photoionization ofsolids, and interact with the sample throughout the laser pulseduration, typically a nanosecond.9–12 The high degree of locali-zation of the EUV laser energy and its strong absorption indielectrics made it possible to ablate craters micron deep atthreshold uences of �0.1 J cm�2 (peak intensity ¼ 70 MWcm�2), 20–40� smaller than when using ultraviolet lasers forablation.13
EUV TOF is conceptually similar to standard laser ablationmethods14–19 although it does not require an additional externalionization source as in LA-ICPMS.5 In this aspect it is alsosimilar to SIMS. In addition, the EUV laser light can be focuseddown to approximately 100 nm spots,7,20 roughly one to twoorders of magnitude improvement over most commercial laserablation systems and comparable with nanoSIMS, which hasdemonstrated a spot size of �50 nm.21 Research laser ablationsystems have used near-eld optics to focus fs-lasers down to
create craters with diameter down to 30 nm,22 but coupled withan external ICPMS these systems only provided analyticalresults on bulk (not trace) elements when the craters wereincreased to 800 nm.23
Herein, we describe the characterization of EUV TOF forelemental analysis. The mass spectra, taken from NIST 61xglasses, demonstrate that EUV TOF can ionize the matrixelements in the glasses and many of the trace elements goingfrom Rb, and Cs, all the way up to higher masses such as Th,and U. We show evidence that the distribution of speciesextracted from the EUV plasma, atomic and molecular ions,depends on the EUV uence offering added versatility for massspectrometric detection. We characterize ion formation andmeasure sample utilization efficiency (SUE), focusing primarilyon uranium and thorium due to their high atomic mass andsignicance in nuclear materials. By scanning micron-sizedlines made out of nickel, we are able to establish EUV TOFhas a lateral resolution of 80 nm. Finally, we apply EUV TOF tomap the composition of natural and enriched uranium oxideparticles, thereby demonstrating that this system can simulta-neously have nanoscale spatial resolution and high sensitivityin isotope analysis.
Methods
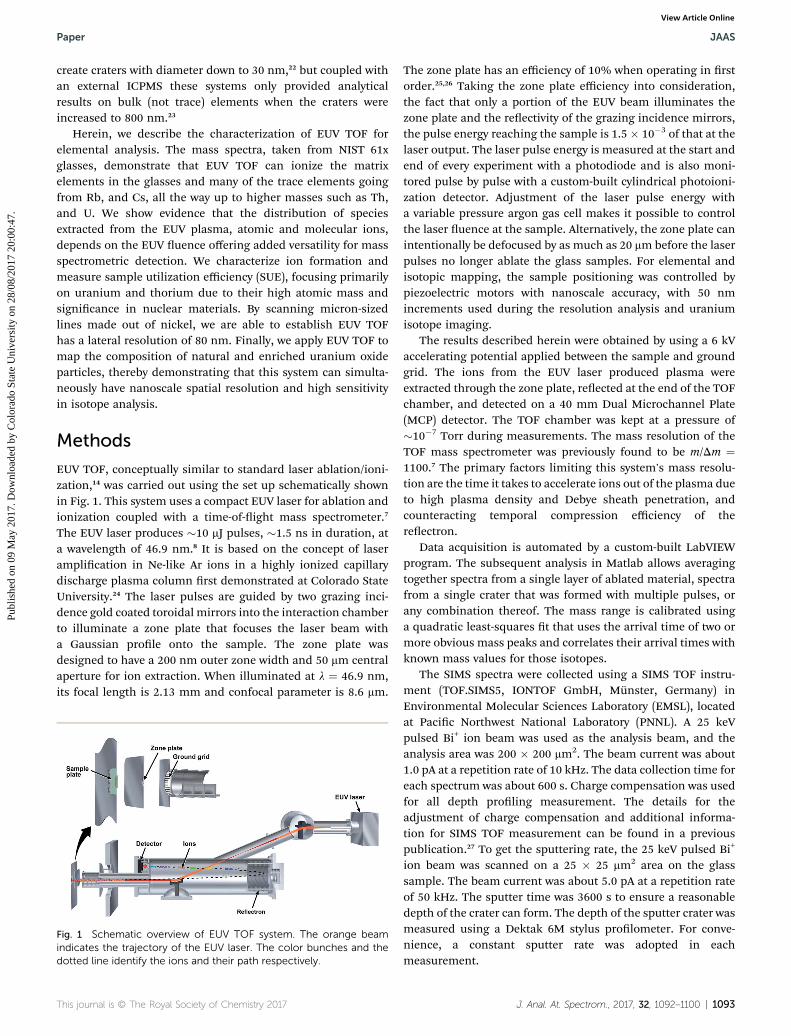
EUV TOF, conceptually similar to standard laser ablation/ioni-zation,14 was carried out using the set up schematically shownin Fig. 1. This system uses a compact EUV laser for ablation andionization coupled with a time-of-ight mass spectrometer.7
The EUV laser produces �10 mJ pulses, �1.5 ns in duration, ata wavelength of 46.9 nm.8 It is based on the concept of laseramplication in Ne-like Ar ions in a highly ionized capillarydischarge plasma column rst demonstrated at Colorado StateUniversity.24 The laser pulses are guided by two grazing inci-dence gold coated toroidal mirrors into the interaction chamberto illuminate a zone plate that focuses the laser beam witha Gaussian prole onto the sample. The zone plate wasdesigned to have a 200 nm outer zone width and 50 mm centralaperture for ion extraction. When illuminated at l ¼ 46.9 nm,its focal length is 2.13 mm and confocal parameter is 8.6 mm.
Fig. 1 Schematic overview of EUV TOF system. The orange beamindicates the trajectory of the EUV laser. The color bunches and thedotted line identify the ions and their path respectively.
The zone plate has an efficiency of 10% when operating in rstorder.25,26 Taking the zone plate efficiency into consideration,the fact that only a portion of the EUV beam illuminates thezone plate and the reectivity of the grazing incidence mirrors,the pulse energy reaching the sample is 1.5 � 10�3 of that at thelaser output. The laser pulse energy is measured at the start andend of every experiment with a photodiode and is also moni-tored pulse by pulse with a custom-built cylindrical photoioni-zation detector. Adjustment of the laser pulse energy witha variable pressure argon gas cell makes it possible to controlthe laser uence at the sample. Alternatively, the zone plate canintentionally be defocused by as much as 20 mmbefore the laserpulses no longer ablate the glass samples. For elemental andisotopic mapping, the sample positioning was controlled bypiezoelectric motors with nanoscale accuracy, with 50 nmincrements used during the resolution analysis and uraniumisotope imaging.
The results described herein were obtained by using a 6 kVaccelerating potential applied between the sample and groundgrid. The ions from the EUV laser produced plasma wereextracted through the zone plate, reected at the end of the TOFchamber, and detected on a 40 mm Dual Microchannel Plate(MCP) detector. The TOF chamber was kept at a pressure of�10�7 Torr during measurements. The mass resolution of theTOF mass spectrometer was previously found to be m/Dm ¼1100.7 The primary factors limiting this system's mass resolu-tion are the time it takes to accelerate ions out of the plasma dueto high plasma density and Debye sheath penetration, andcounteracting temporal compression efficiency of thereectron.
Data acquisition is automated by a custom-built LabVIEWprogram. The subsequent analysis in Matlab allows averagingtogether spectra from a single layer of ablated material, spectrafrom a single crater that was formed with multiple pulses, orany combination thereof. The mass range is calibrated usinga quadratic least-squares t that uses the arrival time of two ormore obvious mass peaks and correlates their arrival times withknown mass values for those isotopes.
The SIMS spectra were collected using a SIMS TOF instru-ment (TOF.SIMS5, IONTOF GmbH, Munster, Germany) inEnvironmental Molecular Sciences Laboratory (EMSL), locatedat Pacic Northwest National Laboratory (PNNL). A 25 keVpulsed Bi+ ion beam was used as the analysis beam, and theanalysis area was 200 � 200 mm2. The beam current was about1.0 pA at a repetition rate of 10 kHz. The data collection time foreach spectrum was about 600 s. Charge compensation was usedfor all depth proling measurement. The details for theadjustment of charge compensation and additional informa-tion for SIMS TOF measurement can be found in a previouspublication.27 To get the sputtering rate, the 25 keV pulsed Bi+
ion beam was scanned on a 25 � 25 mm2 area on the glasssample. The beam current was about 5.0 pA at a repetition rateof 50 kHz. The sputter time was 3600 s to ensure a reasonabledepth of the crater can form. The depth of the sputter crater wasmeasured using a Dektak 6M stylus prolometer. For conve-nience, a constant sputter rate was adopted in eachmeasurement.
J. Anal. At. Spectrom., 2017, 32, 1092–1100 | 1093
A mass spectrum from NIST 610 was also collected usinga modied CAMECA ims-4f in dynamic mode. A portion ofa NIST SRM 610 sample was mounted in epoxy and coated by Auprior to analysis. The ims-4f was operated in ion microprobemode using a Kohler illuminated, 100 nA O� primary ion beamwith an impact energy of 18.5 keV. The circular eld of view was150 mm in diameter; a 750 mm eld aperture was utilizedfollowing a 10 minute pre-sputtering event. The mass stepinterval was 0.01 with a dwell time of 0.1 s, the scan range forthe acquired spectrum was 200 to 300 Da.
We tested atomic and molecular ion formation andmeasured sample utilization efficiency (SUE) with the NIST 61xseries of glasses. Specically, we ablated NIST 611, 613, 615, and617, doped with over 60 different elements in nominalconcentrations of 500, 50, 5, and 0.05 mg g�1, respectively. Theseare well-known and well characterized laser ablation stan-dards28 which provide the ability to perform consistent analyt-ical comparison between instruments. For EUV TOF analysis,sample preparation consisted of depositing �30 nm of 99.99%-pure aluminum by thermal evaporation on each glass slide tominimize charge buildup and to create a uniform electric eldthat facilitates ion extraction. Due to signicance in the nuclearfuel cycle and in nuclear forensics, we focused on uranium andthorium as a test elements. We measured the crater volumes forthe SUE analysis with a Zygo New View 7300 Scanning WhiteLight Interferometer (SWLI). Due to limited lateral resolution ofthe SWLI, a rectangular pattern was made by the signicantlateral overlapping of individual craters. The overlapping rect-angular pattern of craters was made using 1200 laser pulses ina 20 by 20 array with each location receiving 3 laser pulses. Thecenters of the ablation craters were displaced by 500 nm. Themapping time took 34 minutes with the laser operating at0.6 Hz repetition rate. The resulting rectangular crater patternhad �10 mm on its sides and around 40 to 200 nm in depthdepending on laser energy used. For the SUE calculation ofdetected ions, the mass spectrum from each single shot abla-tion was background-adjusted to bring the baseline signal tozero. The mass peak corresponding to 238U was then integratedusing a Riemann sum of 1 ns bins. This integrated voltage wasdivided by the measured MCP gain of the system, 18.5 mV perion, to produce the number of detected ions. MCP gain wasassessed by processing data sets of NIST 611 SUE analysis byattenuating laser uence. This is the same data presented inFig. 6. Plotting a histogram of counts that correspond to zeroand single ion detection events resulted in a single ion countbeing equivalent to an MCP signal of 18.5 mV.
We measured the lateral resolution of EUV TOF by mappingcomposition on a sample that consisted of interlaced nickelcomb structures of different widths made at the Center of X-RayOptics at Livermore Berkeley National Laboratory by electronbeam lithography. The metallic lines of Ni were 1 mm wide and100 nm tall each. As a means to demonstrate isotopic imagingwith nanoscale resolution, uranium oxide particles of differentisotope compositions placed in close proximity were ablated.This sample consisted of a single particle of CRM 129A (naturalabundance) placed adjacent a single particle of CRM U200 (20%235U, 80% 238U). Scanning electron microscope (SEM) images
1094 | J. Anal. At. Spectrom., 2017, 32, 1092–1100
were taken with a JEOL-JSM 6500F SEM at a 25 000� magni-cation and 1.5 kV beam voltage.
Results and discussionMass spectrometry analysis
Fig. 2 shows the EUV TOF spectra collected for each of the fourNIST 61x glasses. The full mass spectrum for each glass isbroken up into four mass ranges, helpful to plot the signal onthe appropriate linear axis. Spectra from all four glasses arepresented to provide a rough estimate of the abundancesensitivity and to distinguish elemental ion peaks from matrixmolecular peaks. The low to mid mass spectra, panels A and Bin Fig. 2, show intense signals from the bulk glass components.While not denitively assigned, possible molecular ion peakcandidates are displayed on the gure. Unidentied molecularinterferences are marked with an asterisk. The limited dynamicrange of the TOF detection system precludes measuring rela-tively weak doped element signals in the midst of large matrixsignals. The only non-matrix peaks in the low to mid massranges are from rubidium and cesium. As the largest group Ielements, Rb and Cs have low oxygen bond strengths and thelowest ionization potentials in the periodic table. As a result,these elements are efficiently ionized and detected with the EUVTOF system, even as trace components.
The high mass range, panels C and D in Fig. 2, is nothindered by large molecular interferences from the matrix,rendering elemental contributions from the lanthanides, lowerP-block, and actinides in NIST 611 clearly visible. Some smallsignals are evident for NIST 613, but for the most part thenominal 50 ppm concentration of U and Th in NIST 613 is nearthe detection limit of the current EUV TOF system. This isa rough estimate as we did not attempt a more qualitativedetermination of detection limits. Some of the mass peaks inFig. 2C appear asymmetric or otherwise noisy compared topeaks in A, B and D. This could be the result of matrix inter-ferences occurring at similar masses or it could be due to timingirregularities from charging of the substrate, but it is uncleardue to the limited mass resolution. Data from NIST 615 and 617are plotted to give clear indication of matrix peaks that areessentially invariant across the four glasses.
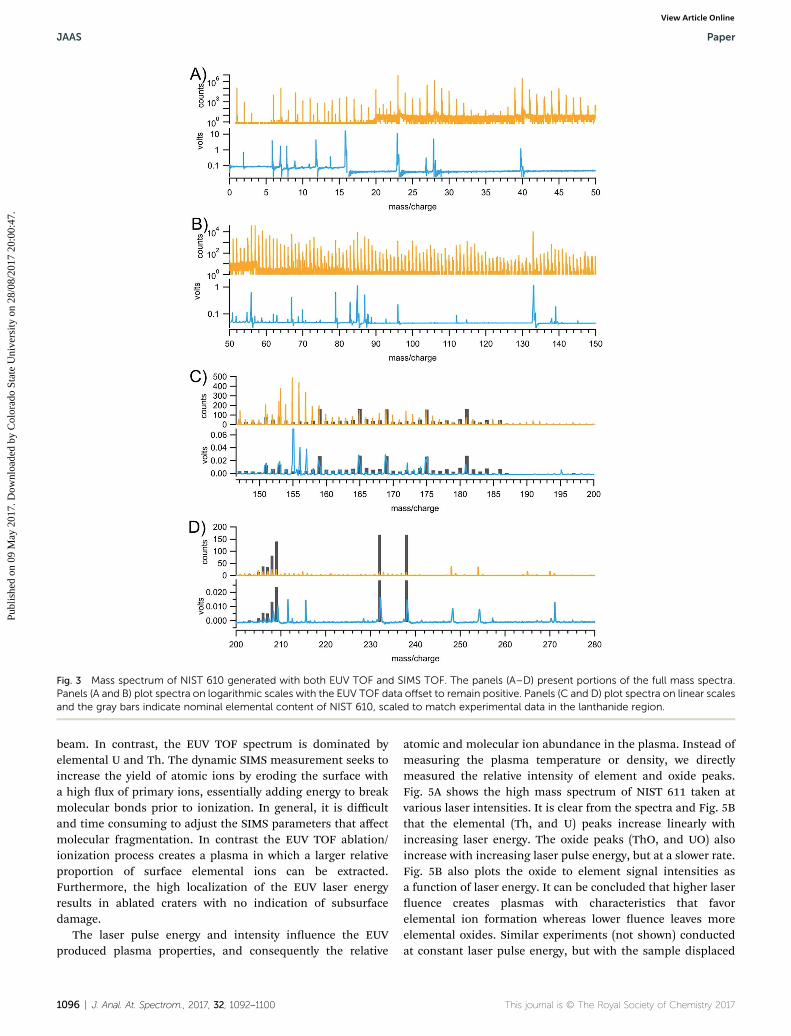
For orientation of EUV TOF within the larger eld of surfaceelemental analysis, Fig. 3 presents SIMS TOF and EUV TOFscans of NIST 610/611. Comparing EUV TOF to SIMS TOF ishelpful to partially normalize ion detection as both instrumentsutilize TOF mass spectrometers such that differences in theionization characteristics become evident. SIMS TOF is alsoa standardmeans for multi-element analysis of surfaces and thecomparison is helpful to orient the EUV TOF data within thelarger eld of surface elemental analysis. SIMS TOF has beenshown to be excellent in the analysis of glasses, having detec-tion limits of some elements ranging from 10 ppb to 10 ppm.29
The EUV TOF data is repeated from the NIST 611 data shown inFig. 2. Again, the full spectra are split into four mass ranges foroptimal visualization. Panels A and B utilize logarithmic scales(an articial offset was added to the EUV data to keep thebaseline positive) while panels C and D revert to linear scaling.
Fig. 2 EUV TOF mass spectra from NIST 611, 613, 615, and 617. The panels (A–D) present portions of the full mass spectra.
Paper JAAS
Publ
ishe
d on
09
May
201
7. D
ownl
oade
d by
Col
orad
o St
ate
Uni
vers
ity o
n 28
/08/
2017
20:
00:4
7.
View Article Online
The rst conclusion of the SIMS TOF and EUV TOF comparisonis the difference in the number of molecular ion interferencesin the whole mass range (Fig. 3). The EUV TOF spectrum hassignicantly fewer molecular ion interferences compared to theSIMS TOF which shows a peak at nearly every nominal mass.The difference in molecular interferences is likely a result of thedifferences between ablation and sputtering processes.30
The gray bars in Fig. 3C and D represent calculated relativeelemental/isotope signal intensities for NIST 611 based on theknown content28 and natural (depleted for uranium5) isotoperatios. The calculated spectrum was scaled empirically to matchthe experimental spectra. Both the SIMS TOF and EUV TOF datashow decent agreement with the known composition in the rareearth range. However, the SIMS TOF spectrum shows relativelyless intensity for the bottom P-block elements (Tl, Pb, Bi) andthe actinides (Th, U). It has only weakly discernable peaks for Th
and U, but the ThO and UO peaks are recognizable with ThO2
and UO2 also visible. In contrast, the EUV TOF spectrum hasprominent Th and U signals and P-block elements that matchthe calculated gray bars more closely. The EUV TOF spectrumalso shows signicant ThO and UO peaks (some UO2). Thedistinct feature of having fewer interferences in EUV TOFcompared to SIMS TOF observed within the high mass range ofFig. 3 will be advantageous for high mass isotope ratio analysisas carried out with magnetic sector mass analyzers.
Fig. 4 compares the EUV TOF mass spectrum with onecollected under dynamic SIMS conditions on a magnetic sectorinstrument. The axes of the two spectra are plotted such that theThO peaks are of equal intensity. In the dynamic SIMS spectrumthe lower P-block elements are diminutive, but the elemental Thand U are prominent. However, the ThO and UO still dominatewith ThO2 and UO2 present, likely a result of the O
� primary ion
J. Anal. At. Spectrom., 2017, 32, 1092–1100 | 1095
Fig. 3 Mass spectrum of NIST 610 generated with both EUV TOF and SIMS TOF. The panels (A–D) present portions of the full mass spectra.Panels (A and B) plot spectra on logarithmic scales with the EUV TOF data offset to remain positive. Panels (C and D) plot spectra on linear scalesand the gray bars indicate nominal elemental content of NIST 610, scaled to match experimental data in the lanthanide region.
JAAS Paper
Publ
ishe
d on
09
May
201
7. D
ownl
oade
d by
Col
orad
o St
ate
Uni
vers
ity o
n 28
/08/
2017
20:
00:4
7.
View Article Online
beam. In contrast, the EUV TOF spectrum is dominated byelemental U and Th. The dynamic SIMS measurement seeks toincrease the yield of atomic ions by eroding the surface witha high ux of primary ions, essentially adding energy to breakmolecular bonds prior to ionization. In general, it is difficultand time consuming to adjust the SIMS parameters that affectmolecular fragmentation. In contrast the EUV TOF ablation/ionization process creates a plasma in which a larger relativeproportion of surface elemental ions can be extracted.Furthermore, the high localization of the EUV laser energyresults in ablated craters with no indication of subsurfacedamage.
The laser pulse energy and intensity inuence the EUVproduced plasma properties, and consequently the relative
1096 | J. Anal. At. Spectrom., 2017, 32, 1092–1100
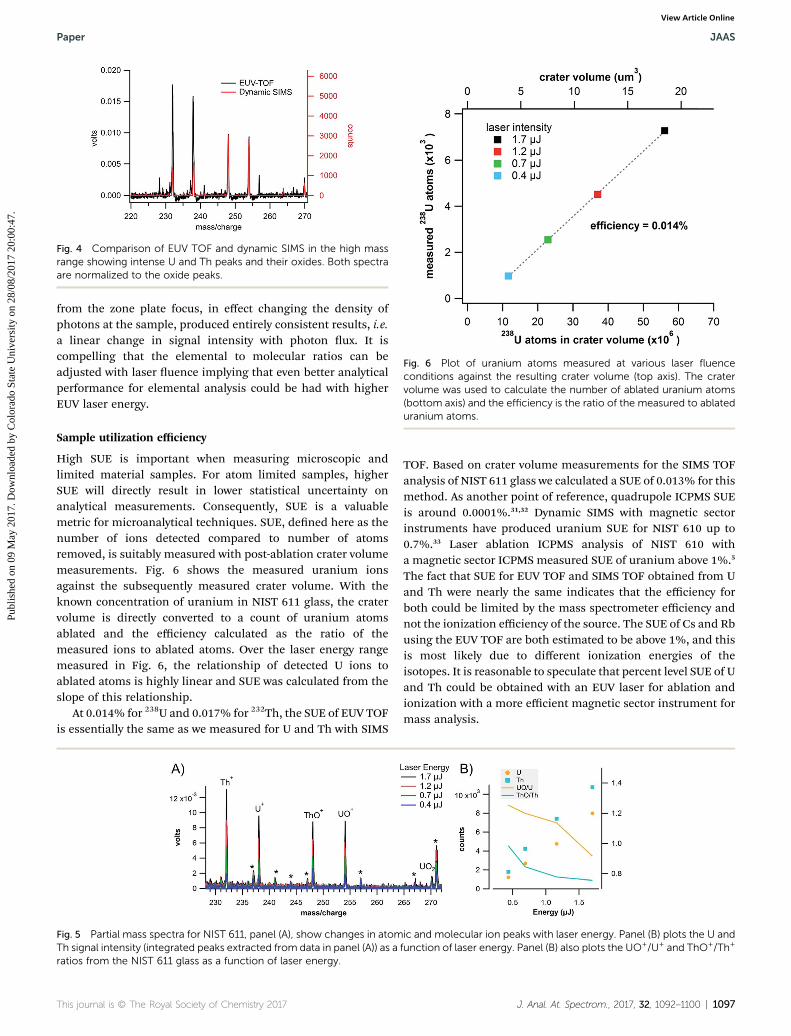
atomic and molecular ion abundance in the plasma. Instead ofmeasuring the plasma temperature or density, we directlymeasured the relative intensity of element and oxide peaks.Fig. 5A shows the high mass spectrum of NIST 611 taken atvarious laser intensities. It is clear from the spectra and Fig. 5Bthat the elemental (Th, and U) peaks increase linearly withincreasing laser energy. The oxide peaks (ThO, and UO) alsoincrease with increasing laser pulse energy, but at a slower rate.Fig. 5B also plots the oxide to element signal intensities asa function of laser energy. It can be concluded that higher laseruence creates plasmas with characteristics that favorelemental ion formation whereas lower uence leaves moreelemental oxides. Similar experiments (not shown) conductedat constant laser pulse energy, but with the sample displaced
Fig. 4 Comparison of EUV TOF and dynamic SIMS in the high massrange showing intense U and Th peaks and their oxides. Both spectraare normalized to the oxide peaks.
Fig. 6 Plot of uranium atoms measured at various laser fluenceconditions against the resulting crater volume (top axis). The cratervolume was used to calculate the number of ablated uranium atoms(bottom axis) and the efficiency is the ratio of the measured to ablateduranium atoms.
Paper JAAS
Publ
ishe
d on
09
May
201
7. D
ownl
oade
d by
Col
orad
o St
ate
Uni
vers
ity o
n 28
/08/
2017
20:
00:4
7.
View Article Online
from the zone plate focus, in effect changing the density ofphotons at the sample, produced entirely consistent results, i.e.a linear change in signal intensity with photon ux. It iscompelling that the elemental to molecular ratios can beadjusted with laser uence implying that even better analyticalperformance for elemental analysis could be had with higherEUV laser energy.
Sample utilization efficiency
High SUE is important when measuring microscopic andlimited material samples. For atom limited samples, higherSUE will directly result in lower statistical uncertainty onanalytical measurements. Consequently, SUE is a valuablemetric for microanalytical techniques. SUE, dened here as thenumber of ions detected compared to number of atomsremoved, is suitably measured with post-ablation crater volumemeasurements. Fig. 6 shows the measured uranium ionsagainst the subsequently measured crater volume. With theknown concentration of uranium in NIST 611 glass, the cratervolume is directly converted to a count of uranium atomsablated and the efficiency calculated as the ratio of themeasured ions to ablated atoms. Over the laser energy rangemeasured in Fig. 6, the relationship of detected U ions toablated atoms is highly linear and SUE was calculated from theslope of this relationship.
At 0.014% for 238U and 0.017% for 232Th, the SUE of EUV TOFis essentially the same as we measured for U and Th with SIMS
Fig. 5 Partial mass spectra for NIST 611, panel (A), show changes in atomTh signal intensity (integrated peaks extracted from data in panel (A)) as aratios from the NIST 611 glass as a function of laser energy.
TOF. Based on crater volume measurements for the SIMS TOFanalysis of NIST 611 glass we calculated a SUE of 0.013% for thismethod. As another point of reference, quadrupole ICPMS SUEis around 0.0001%.31,32 Dynamic SIMS with magnetic sectorinstruments have produced uranium SUE for NIST 610 up to0.7%.33 Laser ablation ICPMS analysis of NIST 610 witha magnetic sector ICPMS measured SUE of uranium above 1%.5
The fact that SUE for EUV TOF and SIMS TOF obtained from Uand Th were nearly the same indicates that the efficiency forboth could be limited by the mass spectrometer efficiency andnot the ionization efficiency of the source. The SUE of Cs and Rbusing the EUV TOF are both estimated to be above 1%, and thisis most likely due to different ionization energies of theisotopes. It is reasonable to speculate that percent level SUE of Uand Th could be obtained with an EUV laser for ablation andionization with a more efficient magnetic sector instrument formass analysis.
ic and molecular ion peaks with laser energy. Panel (B) plots the U andfunction of laser energy. Panel (B) also plots the UO+/U+ and ThO+/Th+
J. Anal. At. Spectrom., 2017, 32, 1092–1100 | 1097
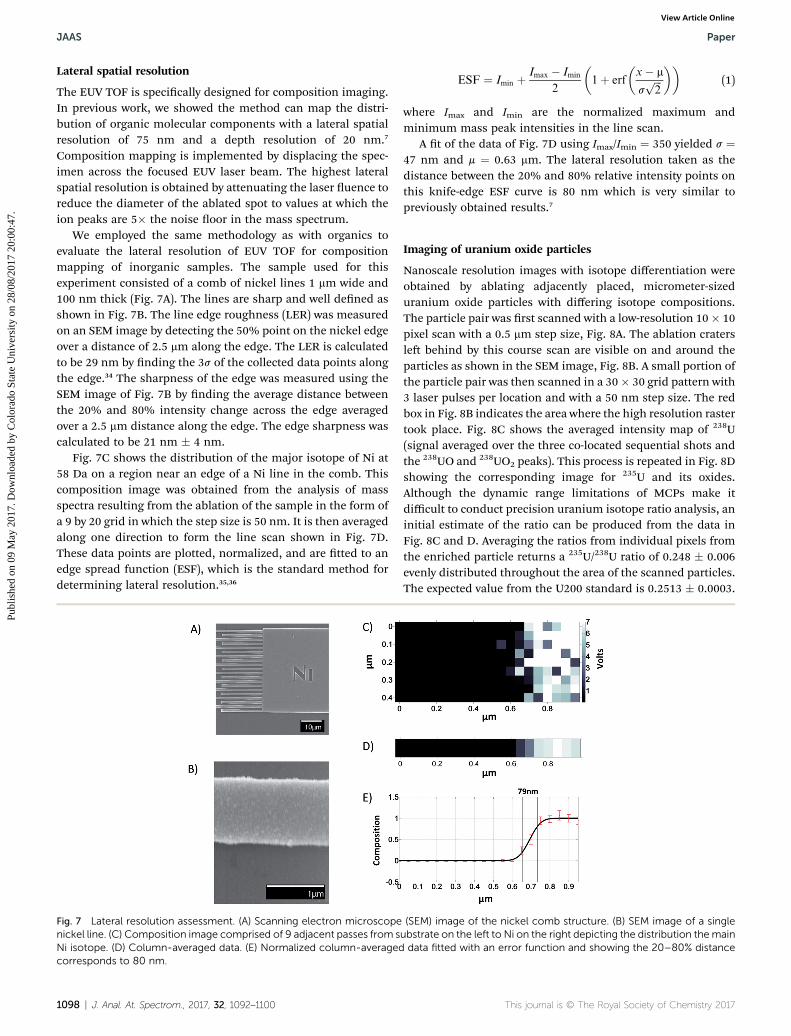
The EUV TOF is specically designed for composition imaging.In previous work, we showed the method can map the distri-bution of organic molecular components with a lateral spatialresolution of 75 nm and a depth resolution of 20 nm.7
Composition mapping is implemented by displacing the spec-imen across the focused EUV laser beam. The highest lateralspatial resolution is obtained by attenuating the laser uence toreduce the diameter of the ablated spot to values at which theion peaks are 5� the noise oor in the mass spectrum.
We employed the same methodology as with organics toevaluate the lateral resolution of EUV TOF for compositionmapping of inorganic samples. The sample used for thisexperiment consisted of a comb of nickel lines 1 mm wide and100 nm thick (Fig. 7A). The lines are sharp and well dened asshown in Fig. 7B. The line edge roughness (LER) was measuredon an SEM image by detecting the 50% point on the nickel edgeover a distance of 2.5 mm along the edge. The LER is calculatedto be 29 nm by nding the 3s of the collected data points alongthe edge.34 The sharpness of the edge was measured using theSEM image of Fig. 7B by nding the average distance betweenthe 20% and 80% intensity change across the edge averagedover a 2.5 mm distance along the edge. The edge sharpness wascalculated to be 21 nm � 4 nm.
Fig. 7C shows the distribution of the major isotope of Ni at58 Da on a region near an edge of a Ni line in the comb. Thiscomposition image was obtained from the analysis of massspectra resulting from the ablation of the sample in the form ofa 9 by 20 grid in which the step size is 50 nm. It is then averagedalong one direction to form the line scan shown in Fig. 7D.These data points are plotted, normalized, and are tted to anedge spread function (ESF), which is the standard method fordetermining lateral resolution.35,36
Fig. 7 Lateral resolution assessment. (A) Scanning electron microscopenickel line. (C) Composition image comprised of 9 adjacent passes from sNi isotope. (D) Column-averaged data. (E) Normalized column-averagedcorresponds to 80 nm.
1098 | J. Anal. At. Spectrom., 2017, 32, 1092–1100
ESF ¼ Imin þ Imax � Imin
2
�1þ erf
�x� m
sffiffiffi2
p��
(1)
where Imax and Imin are the normalized maximum andminimum mass peak intensities in the line scan.
A t of the data of Fig. 7D using Imax/Imin ¼ 350 yielded s ¼47 nm and m ¼ 0.63 mm. The lateral resolution taken as thedistance between the 20% and 80% relative intensity points onthis knife-edge ESF curve is 80 nm which is very similar topreviously obtained results.7
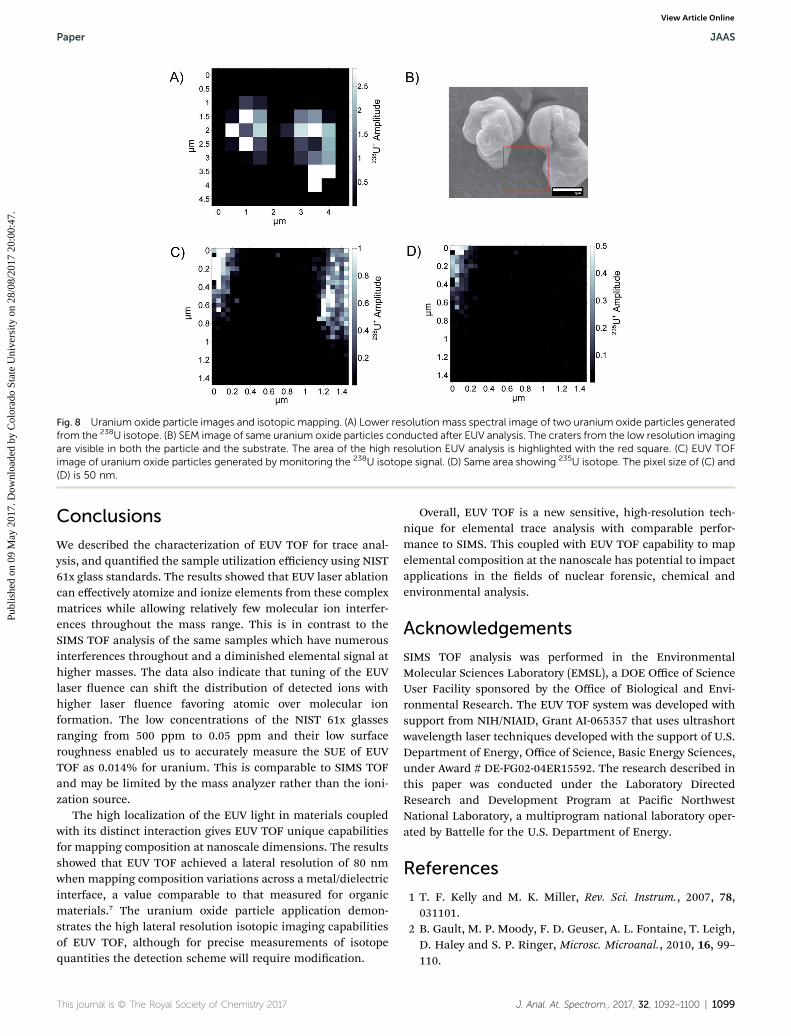
Imaging of uranium oxide particles
Nanoscale resolution images with isotope differentiation wereobtained by ablating adjacently placed, micrometer-sizeduranium oxide particles with differing isotope compositions.The particle pair was rst scanned with a low-resolution 10� 10pixel scan with a 0.5 mm step size, Fig. 8A. The ablation cratersle behind by this course scan are visible on and around theparticles as shown in the SEM image, Fig. 8B. A small portion ofthe particle pair was then scanned in a 30� 30 grid pattern with3 laser pulses per location and with a 50 nm step size. The redbox in Fig. 8B indicates the area where the high resolution rastertook place. Fig. 8C shows the averaged intensity map of 238U(signal averaged over the three co-located sequential shots andthe 238UO and 238UO2 peaks). This process is repeated in Fig. 8Dshowing the corresponding image for 235U and its oxides.Although the dynamic range limitations of MCPs make itdifficult to conduct precision uranium isotope ratio analysis, aninitial estimate of the ratio can be produced from the data inFig. 8C and D. Averaging the ratios from individual pixels fromthe enriched particle returns a 235U/238U ratio of 0.248 � 0.006evenly distributed throughout the area of the scanned particles.The expected value from the U200 standard is 0.2513 � 0.0003.
(SEM) image of the nickel comb structure. (B) SEM image of a singleubstrate on the left to Ni on the right depicting the distribution themaindata fitted with an error function and showing the 20–80% distance
Fig. 8 Uranium oxide particle images and isotopic mapping. (A) Lower resolution mass spectral image of two uranium oxide particles generatedfrom the 238U isotope. (B) SEM image of same uranium oxide particles conducted after EUV analysis. The craters from the low resolution imagingare visible in both the particle and the substrate. The area of the high resolution EUV analysis is highlighted with the red square. (C) EUV TOFimage of uranium oxide particles generated by monitoring the 238U isotope signal. (D) Same area showing 235U isotope. The pixel size of (C) and(D) is 50 nm.
Paper JAAS
Publ
ishe
d on
09
May
201
7. D
ownl
oade
d by
Col
orad
o St
ate
Uni
vers
ity o
n 28
/08/
2017
20:
00:4
7.
View Article Online
Conclusions
We described the characterization of EUV TOF for trace anal-ysis, and quantied the sample utilization efficiency using NIST61x glass standards. The results showed that EUV laser ablationcan effectively atomize and ionize elements from these complexmatrices while allowing relatively few molecular ion interfer-ences throughout the mass range. This is in contrast to theSIMS TOF analysis of the same samples which have numerousinterferences throughout and a diminished elemental signal athigher masses. The data also indicate that tuning of the EUVlaser uence can shi the distribution of detected ions withhigher laser uence favoring atomic over molecular ionformation. The low concentrations of the NIST 61x glassesranging from 500 ppm to 0.05 ppm and their low surfaceroughness enabled us to accurately measure the SUE of EUVTOF as 0.014% for uranium. This is comparable to SIMS TOFand may be limited by the mass analyzer rather than the ioni-zation source.
The high localization of the EUV light in materials coupledwith its distinct interaction gives EUV TOF unique capabilitiesfor mapping composition at nanoscale dimensions. The resultsshowed that EUV TOF achieved a lateral resolution of 80 nmwhen mapping composition variations across a metal/dielectricinterface, a value comparable to that measured for organicmaterials.7 The uranium oxide particle application demon-strates the high lateral resolution isotopic imaging capabilitiesof EUV TOF, although for precise measurements of isotopequantities the detection scheme will require modication.
Overall, EUV TOF is a new sensitive, high-resolution tech-nique for elemental trace analysis with comparable perfor-mance to SIMS. This coupled with EUV TOF capability to mapelemental composition at the nanoscale has potential to impactapplications in the elds of nuclear forensic, chemical andenvironmental analysis.
Acknowledgements
SIMS TOF analysis was performed in the EnvironmentalMolecular Sciences Laboratory (EMSL), a DOE Office of ScienceUser Facility sponsored by the Office of Biological and Envi-ronmental Research. The EUV TOF system was developed withsupport from NIH/NIAID, Grant AI-065357 that uses ultrashortwavelength laser techniques developed with the support of U.S.Department of Energy, Office of Science, Basic Energy Sciences,under Award # DE-FG02-04ER15592. The research described inthis paper was conducted under the Laboratory DirectedResearch and Development Program at Pacic NorthwestNational Laboratory, a multiprogram national laboratory oper-ated by Battelle for the U.S. Department of Energy.
References
1 T. F. Kelly and M. K. Miller, Rev. Sci. Instrum., 2007, 78,031101.
2 B. Gault, M. P. Moody, F. D. Geuser, A. L. Fontaine, T. Leigh,D. Haley and S. P. Ringer, Microsc. Microanal., 2010, 16, 99–110.
J. Anal. At. Spectrom., 2017, 32, 1092–1100 | 1099
3 A. Benninghoven, F. G. Rudenauer and H. W. Werner,International Journal, 1987, 8, 1264.
4 M. W. Chu, S. C. Liou, C. P. Chang, F. S. Choa andC. H. Chen, Phys. Rev. Lett., 2010, 104, 1–4.
5 A. M. Duffin, K. W. Springer, J. D. Ward, K. D. Jarman,J. W. Robinson, M. C. Endres, G. L. Hart, J. J. Gonzalez,D. Oropeza, R. E. Russo, D. G. Willingham, B. E. Naes,A. J. Fahey and G. C. Eiden, J. Anal. At. Spectrom., 2015, 30,1100–1107.
6 J. T. Van Elteren, A. Izmer, V. S. Selih and F. Vanhaecke, Anal.Chem., 2016, 88, 7413–7420.
7 I. Kuznetsov, J. Filevich, F. Dong, M. Woolston, W. L. Chao,E. H. Anderson, E. R. Bernstein, D. C. Crick, J. J. Rocca andC. S. Menoni, Nat. Commun., 2015, 6, 6.
8 S. Heinbuch, M. Grisham, D. Martz and J. J. Rocca, Opt.Express, 2005, 13, 4050–4055.
9 M. Berrill, F. Brizuela, B. Langdon, H. Bravo, C. S. Menoniand J. J. Rocca, J. Opt. Soc. Am. B, 2008, 25, B32.
10 V. Aslanyan, I. Kuznetsov, H. Bravo, M. R. Woolston,A. K. Rossall, C. S. Menoni, J. J. Rocca and G. J. Tallents,APL Photonics, 2016, 1, 066101.
11 A. K. Rossall, V. Aslanyan, G. J. Tallents, I. Kuznetsov,J. J. Rocca and C. S. Menoni, Phys. Rev. Appl., 2015, 3, 6.
12 A. K. Rossall and G. J. Tallents, High Energy Density Phys.,2015, 15, 67–70.
13 M. Reichling, J. Sils, H. Johansen and E. Matthias, Appl. Phys.A: Mater. Sci. Process., 1999, 69, S743–S747.
14 A. Riedo, A. Bieler, M. Neuland, M. Tulej and P. Wurz, J. MassSpectrom., 2013, 48, 1–15.
15 A. Riedo, M. Neuland, S. Meyer, M. Tulej and P.Wurz, J. Anal.At. Spectrom., 2013, 28, 1256–1269.
16 J. K. Holt, E. J. Nelson and G. L. Klunder, in Journal of Physics:Conference Series, ed. W. P. Hess, P. R. Herman, D. Bauerleand H. Koinuma, Iop Publishing Ltd, Bristol, 2007, vol. 59,pp. 657–661.
17 V. Grimaudo, P. Moreno-Garcıa, A. Riedo, M. B. Neuland,M. Tulej, P. Broekmann and P. Wurz, Anal. Chem., 2015,87, 2037–2041.
18 A. Riedo, V. Grimaudo, P. Moreno-Garcia, M. B. Neuland,M. Tulej, P. Wurz and P. Broekmann, J. Anal. At. Spectrom.,2015, 30, 2371–2374.
1100 | J. Anal. At. Spectrom., 2017, 32, 1092–1100
19 V. Grimaudo, P. Moreno-Garcıa, A. Riedo, S. Meyer, M. Tulej,M. B. Neuland, M. Mohos, C. Gutz, S. R. Waldvogel, P. Wurzand P. Broekmann, Anal. Chem., 2017, 89, 1632–1641.
20 G. Vaschenko, A. G. Etxarri, C. S. Menoni, J. J. Rocca,O. Hemberg, S. Bloom, W. Chao, E. H. Anderson,D. T. Attwood, Y. Lu and B. Parkinson, Opt. Lett., 2006, 31,3615–3617.
21 T. Wirtz, Y. Fleming, M. Gerard, U. Gysin, T. Glatzel,E. Meyer, U. Wegmann, U. Maier, A. H. Odriozola andD. Uehli, Rev. Sci. Instrum., 2012, 83, 063702.
22 V. Zorba, X. L. Mao and R. E. Russo, Anal. Bioanal. Chem.,2010, 396, 173–180.
23 V. Zorba, X. L. Mao and R. E. Russo, Spectrochim. Acta, Part B,2015, 113, 37–42.
24 J. J. Rocca, V. Shlyaptsev, F. G. Tomasel, O. D. Cortazar,D. Hartshorn and J. L. A. Chilla, Phys. Rev. Lett., 1994, 73,2192–2195.
25 E. H. Anderson, IEEE J. Quantum Electron., 2006, 42, 27–35.26 E. Anderson and D. Kern, X-Ray Microscopy III, 1992, pp. 75–
78.27 Z. Wang, K. Jin, Y. Zhang, F. Wang and Z. Zhu, Surf. Interface
Anal., 2014, 46, 257–260.28 K. P. Jochum, U. Weis, B. Stoll, D. Kuzmin, Q. C. Yang,
I. Raczek, D. E. Jacob, A. Stracke, K. Birbaum, D. A. Frick,D. Gunther and J. Enzweiler, Geostand. Geoanal. Res., 2011,35, 397–429.
29 F. J. M. Rutten, M. J. Roe, J. Henderson and D. Briggs, Appl.Surf. Sci., 2006, 252, 7124–7127.
30 P. Sigmund, Phys. Rev., 1969, 184, 383–416.31 S. M. Wilbur, Spectroscopy, 2009, http://www.spectros
copyonline.com/factors-determining-sensitivity-icp-ms.32 M. Liezers, O. T. Farmer Iii, M. P. Dion, M. L. Thomas and
G. C. Eiden, Int. J. Mass Spectrom., 2015, 376, 58–64.33 R. L. Hervig, F. K. Mazdab, P. Williams, Y. Guan, G. R. Huss
and L. A. Leshin, Chem. Geol., 2006, 227, 83–99.34 C. A. Mack, Field Guide to Optical Lithography, Spie Press
Book, 2006.35 M. Senoner, T. Wirth and W. E. S. Unger, J. Anal. At.
Spectrom., 2010, 25, 1440–1452.36 M. K. Passarelli, J. Wang, A. S. Mohammadi, R. Trouillon,
I. Gilmore and A. G. Ewing, Anal. Chem., 2014, 86, 9473–9480.