Strive • Lead • Excel | To Make a Difference Report of the Auditor-General No. 4 of 2012-13 Auditor-General’s Report on the Financial Statements of State entities Volume 4 Part I Local Government Authorities 2011-12 November 2012
Transcript
Strive • Lead • Excel | To Make a Difference
Report of the Auditor-General No. 4 of 2012-13Auditor-General’s Report on the Financial Statements of State entities
Volume 4 Part ILocal Government Authorities 2011-12
November 2012
The Role of the Auditor-GeneralThe Auditor-General’s roles and responsibilities, and therefore of the Tasmanian Audit Office, are set out in the Audit Act 2008 (Audit Act).
Our primary responsibility is to conduct financial or ‘attest’ audits of the annual financial reports of State entities. State entities are defined in the Interpretation section of the Audit Act. We also audit those elements of the Treasurer’s Annual Financial Report reporting on financial transactions in the Public Account, the General Government Sector and the Total State Sector.
Audits of financial reports are designed to add credibility to assertions made by accountable authorities in preparing their financial reports, enhancing their value to end users.
Following financial audits, we issue a variety of reports to State entities and we report periodically to the Parliament.
We also conduct performance audits and compliance audits. Performance audits examine whether a State entity is carrying out its activities effectively and doing so economically and efficiently. Audits may cover all or part of a State entity’s operations, or consider particular issues across a number of State entities.
Compliance audits are aimed at ensuring compliance by State entities with directives, regulations and appropriate internal control procedures. Audits focus on selected systems (including information technology systems), account balances or projects.
We can also carry out investigations but only relating to public money or to public property.
Performance and compliance audits are reported separately and at different times of the year, whereas outcomes from financial statement audits are included in one of the regular volumes of the Auditor-General’s reports to the Parliament normally tabled in May and November each year.
Where relevant, the Treasurer, a Minister or Ministers, other interested parties and accountable authorities are provided with opportunity to comment on any matters reported. Where they choose to do so, their responses, or summaries thereof, are detailed within the reports.
The Auditor-General’s Relationship with the Parliament and State Entities
The Auditor-General’s
role as Parliament’s auditor is unique
2012 PARLIAMENT OF TASMANIA
REPORT OF THE AUDITOR-GENERAL No. 4 of 2012-13
Volume 4 Part I
Local Government Authorities 2011-12
November 2012
Presented to both Houses of Parliament in accordance with the requirements ofSection 29 of the Audit Act 2008
2012 (No. 30)
1
To provide independent assurance to the Parliament and Community on the performance and accountability of the Tasmanian Public sector.Professionalism | Respect | Camaraderie | Continuous Improvement | Customer Focus
Auditor-General’s reports are available from the Tasmanian Audit Office, Hobart. This report and other recent reports published by the Office can be accessed via the Office’s home page. For further information please contact:
Report of the Auditor-General No. 4 of 2012-13 – Financial Statements of State entities – Volume 4 – Local Government Authorities 2011-12
In accordance with the requirements of Section 29 of the Audit Act 2008, I have pleasure in presenting my Report on the audit of the financial statements of Local Government Authorities for the year ended 30 June 2012.
To provide independent assurance to the Parliament and Community on the performance and accountability of the Tasmanian Public sector.Professionalism | Respect | Camaraderie | Continuous Improvement | Customer Focus
Strive | Lead | Excel | To Make a Difference
4 Foreword
Foreword
This Volume details findings from financial audits for the year ended 30 June 2012 of 27 local government councils and our assessments of their financial sustainability, together with six local government business units.
Two councils are not included in this Volume because, at the time of its preparation, their audits were incomplete caused by delays in receiving their financial statements or, in the case of one council, financial statements were submitted but the audit delayed following a request from Council’s management.
In the Tasmanian context, Local government councils manage significant revenues, expenditures and investments in infrastructure. In the year ended 30 June 2012, for the 27 councils included in this Volume, operating revenues totalled $644.196m, operating expenses totalled $656.967m, investment in new and existing assets was $189.377m and physical non-current assets at 30 June 2012 were $6.316bn. Cash holdings totalled $400.237m.
My assessments as to financial sustainability are based on ratios established following discussion with councils and the Institute of Public Works Engineers Australia and governance aspects as these relate to audit committees and long-term asset management and financial plans. My conclusion was that financial sustainability is improving, governance arrangements while also improving, still require attention, and there are still too many councils incurring operating deficits.
A development receiving greater attention this year is the growing trend by some councils to introduce residual values when revaluing and depreciating infrastructure assets. A separate Chapter reporting on this is included in this Part. It notes that further work is needed and will be carried out in 2012-13.
HM Blake Auditor-General 20 November 2012
5Table of Contents
PArT II
MAjor CITy CounCIls 5
Clarence City Council 6Glenorchy City Council 17Hobart City Council 27Launceston City Council 38
Appendix 1 - Guide to Using this Report 78Appendix 2 - Audit Status 85Appendix 3 - Acronyms and Abbreviations 87Appendix 4 - Recent Reports 88
Vision and Purpose 89
6 Local Government Authorities
MedIuM CounCIls 51
Brighton Council 52Burnie City Council 63Central Coast Council 77Derwent Valley Council 87Devonport City Council 96Huon Valley Council 107Kingborough Council 117Meander Valley Council 128Northern Midlands Council 139Sorell Council 149Waratah-Wynyard Council 159West Tamar Council 169
sMAll CounCIls 179
Break O’ Day Council 180Central Highlands Council 191Circular Head Council 200Dorset Council 209Flinders Council 218George Town Council 229Glamorgan Spring Bay Council 238Latrobe Council 248Southern Midlands Council 259Tasman Council 270West Coast Council 280
Appendix 1 - Guide to Using this Report 289Appendix 2 - Audit Status 296Appendix 3 - Acronyms and Abbreviations 298Appendix 4 - Recent Reports 299
Vision and Purpose 300
7Introduction
InTroduCTIon
This Report deals with the outcomes from completed financial statement audits of Local Government Authorities reporting for the financial year ended 30 June 2012. The audits of 26 councils were completed by 30 September 2012 and another one by 6 November 2012 and their financial information included in this Report. At the time of preparing this Report, audits of the financial statements of the remaining two councils were still in progress.
The Report also contains the outcomes from completed financial statement audits of six Local Government Business Units for the financial year ended 30 June 2012.
In addition, Chapters on legislative issues, residual values, financial sustainability and comparative analysis covering all completed councils are included.
Our Report includes details of matters raised with entity management during the course of audits, but only where the matter(s) raised was significant. The rationale for inclusion or otherwise rests on our perception of the public interest in each point and the need to confine comments to those matters that have more than a managerial dimension.
All councils were provided the opportunity to provide us with comments, for inclusion in their respective Chapters, on our “Conclusions as to financial sustainability”. Their comments have been included where received.
ForMAT oF THe rePorT
Unless specifically indicated, comments in this Report were current as at 14 November 2012.
In addition to this Introduction, this Report includes:
• Part I:
○ Audit Summary
○ Timeliness and Quality of Financial Statements
○ Legislative Issues
○ Residual Values
○ Local Government Financial Sustainability
○ Local Government Comparative Analysis
○ Local Government Business Units
• Part II:
○ Local Government Councils categorised as:
� Major city councils
� Medium councils
� Small councils.
8 Introduction
PresenTATIon oF FInAnCIAl InForMATIon - CounCIls
The review and analysis of the financial statements of councils covers the statement of comprehensive income, statement of financial position, statement of cash flows and financial analysis. Our review of the financial statements covers three financial periods, which represents council operations after the transfer of responsibilities for water and sewerage activities.
However, the financial analysis section of each chapter includes an examination of four years of data.
We also note our decision to re-format the Statements of Comprehensive Income by reporting interest revenue and finance costs separately. In the case of many councils this highlighted the relatively high reliance on net interest revenue as a source of income. In addition, we have disclosed Financial Assistance Grants based on the actual allocation for each financial year, not on a cash receipt basis. The offsets of grants in advance have been included below the Net Operating Surplus/(Deficit) in the Statement of Comprehensive Income.
The following two council’s audits were not completed at 6 November 2012 and as a result their financial information is not included in this Report:
• Kentish Council – financial statements submitted late
• King Island Council – audit delayed by agreement between Council and our Office.
FInAnCIAl susTAInAbIlITy rATIos
The ratios applied in assessing the financial sustainability of councils have remained unchanged from our 2011 Report. While not a ratio, we have continued assessing applicable governance arrangements and criteria to assess financial sustainability. Details of the ratios, governance arrangements considered and criteria are outlined in the Chapter headed “Local Government Financial Sustainability”.
9Audit Summary
AudIT suMMAry
overvIew oF loCAl governMenT
Tasmania’s 29 councils make strong contributions in financial terms to the activities of our State. They manage significant infrastructure associated with the provision of services to ratepayers. These observations are supported by the following statistics, for the 27 councils included in this Report, for the financial year ended 30 June 2012 when they:
• generated total revenues of $767m (2010-11, $706m)
• generated $378m ($356m) in rates
• incurred $248m ($234m) in employee costs employing 3 300 (3 263) full time equivalent employees (FTE) which represented 7.5 (7.5) FTE for every 1000 people living in Tasmania
• excluding capital revenue sources, on a “net operating” basis, for the year ended 30 June 2012 recorded a combined deficit of $12.771m ($5.371m)
• managed total assets recorded at $8.781bn ($8.369bn) of which $6.316bn ($5.980bn) was infrastructure
• held investments of $1.735bn ($1.729bn) in the three regional water Corporations
• invested $189m ($221m) in new and existing infrastructure related assets.
Based on data available from the Australian Bureau of Statistics, our major cities’ populations represented 42.90% (42.07%) of the total population, but only covered 2.9% of the State area in square kilometres. Conversely, the 13 smaller rural councils combined population represented 13.34% (13.50%) of the total population, but covered 59.7% of the State’s area in square kilometres.
TIMelIness oF FInAnCIAl sTATeMenTs
Four councils failed to meet their statutory financial reporting deadlines but of these two councils were only one day late. This is an improvement on the position in 2010-11.
The financial statements of three (2011, 4) councils required amendment prior to audit completion. The amendments were initiated either by management or the audit process.
legIslATIve Issues
Audit Act 2008
Following completion of audits in 2010-11, we sought amendment to the Audit Act to rectify unintended consequences of the Audit (Consequential Amendments) Act 2008. This resulted in council joint authorities and the Local Government Association of Tasmania (LGAT) not being subject to the financial audit requirements of the Audit Act.
As far as it relates to joint authorities, this was resolved during 2011-12 following the inclusion of the following in the definition of State entity in section 4 of the Audit Act:
(fa) a single authority, a joint authority, or a controlling authority, within the meaning of the Local Government Act 1993;
However, the situation regarding LGAT remains unchanged.
resIduAl vAlues
In recent years, we have noticed a number of councils, as part of revaluations, introduce the concept of residual values for long-lived infrastructure assets, particularly roads. This has resulted in a reduction in annual depreciation charges and improvements in road consumption ratios.
10 Audit Summary
We have accepted the implementation of a residual value because its introduction was based on expert advice from councils’ engineers and where impacts on some asset components were not material.
However, during 2011-12 we noted a number of instances where the proposed residual value was significant and materially affected the asset valuation and depreciation expense. In a number of cases, following discussion with councils, the proposed residual values were not implemented.
At 30 June 2012, at least 11 of the 29 Tasmanian councils used some form of residual value for road infrastructure assets.
We consider the use of residual values, as it relates to infrastructure assets, ignores the impact of technical or commercial obsolescence over the asset’s life. The residual balance should be depreciated on some basis, even if over an extended useful life, to ensure the calculation of depreciation complies with the requirements of Australian Accounting Standard AASB 116 Property, Plant and Equipment.
Some councils disagree with our view because they consider certain components of road infrastructure assets do not depreciate and the requirements of AASB 116 result in depreciation expenses being over-stated.
We have considered the current situation and intend to appoint an independent expert to review depreciation methods, including use of residual values, by Tasmanian councils. It is our intention to undertake the review in early 2013 and discuss our findings with councils before the end of the 2013 financial year.
FInAnCIAl PerForMAnCe oF CounCIls
local government Financial sustainability
overAll ConClusIon
Based on financial sustainability ratios assessed on average over six years and at 30 June 2012 and on our assessment of selected governance arrangements we concluded, at a consolidated level, councils in general had:
• high financial sustainability risk from a governance perspective
• moderate financial sustainability risk from operating and asset management perspectives
• low risk from a net financial liabilities perspective.
governAnCe And long-TerM PlAnnIng
A number of councils need to address continued operating deficits, consider introducing audit, or equivalent, committees and long-term asset and financial management plans.
InvesTMenT In exIsTIng AsseTs
Councils are generally under investing in existing assets with only six out of 27 councils investing in existing assets, on average over a six year period, in excess of their annual depreciation charge.
On a total road asset consumption basis, at the whole of State level, the 27 councils’ road assets had sufficient capacity to continue to provide services to ratepayers. However, some councils need to assess the state of their road networks.
In making this assessment as to road asset consumption we noted relatively low levels of consumption of council road assets with improvements over the period. The road consumption
11Audit Summary
ratio improved from 58.7% in 2007 to 65.6% in 2012, with all councils within a low or moderate asset sustainability risk. A number of reasons contributed to the improvement including:
• higher capital expenditure on road assets
• Councils reviewing and extending the useful lives of road asset components and introducing residual values. In particular, residual values have had a significant impact on the depreciation expense and the accumulated depreciation balance. The review was driven by engineers, who now have a greater base of empirical data on road assets.
neT FInAnCIAl lIAbIlITIes
In almost every case, councils’ financial assets exceed total liabilities indicating they are in strong positions to meet short-term commitments and there is a capacity to borrow should the need arise. This positive situation arises for two primary reasons:
• levels of borrowings are generally low particularly following the transfer of debt at the time of the establishment of the Regional Water Corporations
• collectively, councils held significant amounts of cash and investments which totalled $400.237m at 30 June 2012.
Our conclusion, without having assessed councils’ future cash requirements, is that councils may be holding cash and investments well beyond their day to day requirements. This requires analysis by each of them taking into account current revenue raising and asset management strategies.
summary of Financial sustainability – Individual Council Chapters
From our assessment of the financial sustainability of the 27 councils, based on financial performance over the past four financial years, we concluded that:
• no single Tasmanian council is financially unsustainable.
• four councils were assessed at high financial sustainability risk from an operating perspective, 11 at moderate risk and 12 at low risk.
• thirteen councils were assessed at moderate financial sustainability risk from an asset management perspective, with 14 at low risk.
• all councils were assessed at low risk from a net financial liabilities perspective.
• six councils were assessed at high financial sustainability risk from a governance perspective, 17 at moderate risk and four at low risk. In this regard we noted that:
○ 11 (nine in 2010-11) councils had established audit, or equivalent, committees
○ four (four) had established internal audit arrangements
○ 18 (17) had long-term asset management plans in place
○ 20 (16) had long-term financial management plans in place.
The need for both long-term asset management and long-term financial plans is important. The former establishes a council’s asset management requirements and the latter how these will be funded. It is pleasing to see an improvement in the number of councils that have implemented both long-term asset management and long-term financial plans.
Comparative analysis
Key areas related to financial performance of councils in 2011-12 identified from our audits included:
• of the 27 Tasmanian councils, 15 failed to achieve at least a net operating surplus. A number of these councils have incurred deficits for some years and in some cases budgeted for deficits.
12 Audit Summary
• in 2011-12 the self financing ratio, which assesses the capacity of councils to generate operating cash flows, improved slightly to 25.8% (23.6%).
• Councils’ revenues from their own sources decreased slightly to 79.1% (79.5%).
• eight councils (seven in 2010-11) had rate revenue to operating revenue ratios of less than 50% meaning, in general, they were heavily reliant on recurrent grant funding.
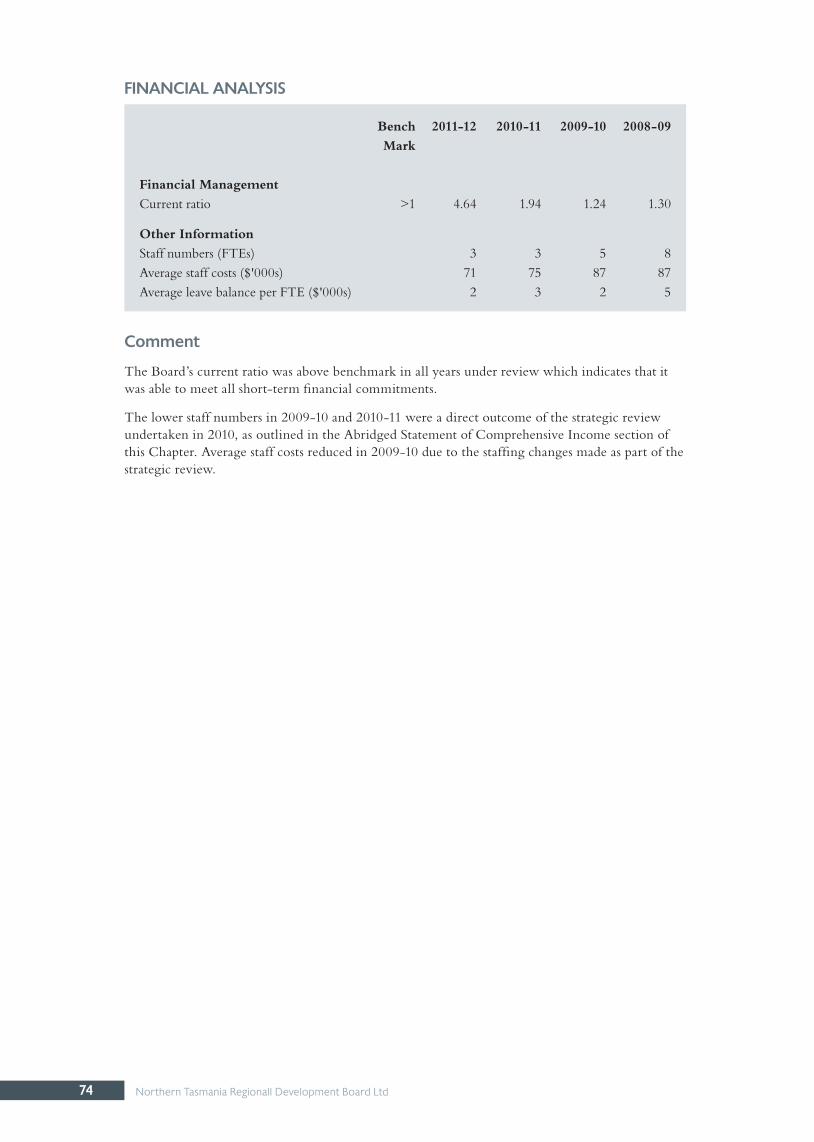
• current ratios in the last three years were well above benchmark of one with, individually, no council having a ratio of less than one at 30 June 2012 indicating that councils were in a strong position to meet short-term commitments.
• smaller councils’ operating grants per head of population were considerably greater than other councils, for example Flinders, $2 761, Central Highlands, $966 and Break O’Day, $858, compared to Hobart, $68, or Clarence, $87.
• rural councils manage a lower level of infrastructure assets, but across larger geographical areas.
• rate debtors were $12.941m at 30 June 2012 ($11.260m) which represented only 4.5% of total rates raised.
• eight councils (six) were assessed as having asset investment ratios below our benchmark of 100% (6).
us sub-PrIMe MArKeT downTurn
At 30 June 2012 two Councils continued to hold investments in Collaterised Debt Obligations (CDOs). As discussed in Report No.1 2009, Volume 2 – Local Government Authorities 2007 08, the value of CDOs held by three Councils fell significantly with the US Sub-prime market downturn and these investments were written down or impaired at 30 June 2008. Movements and values in the CDOs are reported below:
During 2011-12, Circular Head Council had one of its CDO investments mature, with it incurring a cash loss of $0.749m.
Huon Valley Council’s CDO investments were realised during 2010-11 for a $0.146m gain on the impaired value. Council ultimately received $0.240m compared to the face of $1.000m, a loss of $0.760m.
Sorell Council did not have any movement in its investment.
While the above councils were negatively impacted by investing in CDOs, we again note they did not contravene the broad investment guidelines in the Local Government Act 1993. In addition, councils must comply with the Trustee Act 1898, which also provides broad guidelines and criteria that a trustee should take into account when investing.
Council 30 June 2012 30 June 2011 30 June 2010 30 June 2009$000s $000s $000s $000s $000s $000s $000s $000s
(including where relevant actions arising from matters previously reported)
burnie City Council
AsseT revAluATIons
In response to our recommendation in 2010-11, Council completed a full revaluation of its road and drainage assets in 2011-12.
legAl ProCeedIngs
In the notes to Council’s financial statements for the year ended 30 June 2011, it included a contingent liability that detailed its involvement in an on-going legal dispute related to the proposed sale of Camdale foreshore land. Financial settlement depended on the success of an appeal which was listed to come before the Tasmanian Supreme Court. In October 2011, the Full Court ruled in favour of the appellant. Council is liable for damages and legal costs, which have not yet been determined.
During 2011-12, Council made a payment to settle the appellant’s legal costs on the failed land purchase. At that time Council was unsure whether it would be liable to make a common law settlement.
In July 2012, Council made a payment into the Supreme Court as an offer of settlement. Council are currently waiting on a response and have noted that it will not be able to recover any costs under insurance and any possible recovery action in relation to professional advice received on the matter is unclear.
Central Highlands Council
InFrAsTruCTure revAluATIon
In 2011-12 Council engaged two independent firms to assess various asset groups. One revalued roads, kerbs, guttering and footpaths resulting in higher valuations of $15.593m (roads) and $0.780m (footpaths and cycleways). Another undertook a revaluation of bridges and associated assets resulting in a revaluation of $2.559m. The valuations were based on fair value which is replacement cost less accumulated depreciation.
derwent valley Council
wIllow CourT
Our previous reports have highlighted various Council activities related to Willow Court. Initiatives this year were that Council entered into a revised Memorandum of Undertaking with the State government on 4 May 2012 which included a new Grant Deed for $0.750m requiring these monies to be expended on an “approved purpose” primarily in the Willow Court Precinct.
sAle oF wIllow CourT ovAl
We inquired into the process followed for the sale of this asset but at the time of writing, were not in a position to conclude as to the veracity of this process.
14 Audit Summary
Flinders Council
AsseT MAnAgeMenT sysTeM
In our last Report, we noted Council maintained asset registers in excel spreadsheets. During 2011-12, Council recorded its road infrastructure assets in an asset management system. It is expected other asset classes will be transferred in 2012-13.
revAluATIon oF AsseTs
As noted in our 2011-12 Report, Council had not undertaken a full revaluation of its road asset since 30 June 2006. Instead, Council had been applying ABS indexation adjustments to the carrying amount of roads.
We recommended Council update its road valuation based on a full revaluation. During 2011-12, Council undertook a full independent revaluation of road and bridge assets, which included a condition assessment. The revaluation was undertaken by Brighton Council (roads) and TasSpan (bridges). The valuation was at fair value based on replacement cost less accumulated depreciation at 30 June 2012. The revaluation concluded that the remaining service potential of Council’s road assets was high, resulting in the road asset increasing by $35.665m, of which $22.912m related to a decrease in accumulated depreciation.
resIduAl vAlues on AsseTs
The revaluation of road assets included the recognition of residual values as follows:
• 50% on roads seals
• 30% on sealed road pavements
• 95% unsealed road pavements.
The implementation of a residual reduces the depreciable amount of an asset resulting in it not being fully depreciated over its life.
We consider the concept of residual values, as it relates to infrastructure assets, ignores the impact of technical or commercial obsolescence over the asset’s life. The residual balance should be depreciated on some basis, even if over an extended useful life, to ensure the calculation of depreciation complies with the requirements of AASB 116 Property Plant and Equipment.
As a result of our audit, Council removed the residual of 95% applied to the unsealed pavement residual, but maintained the seal and seal pavement residuals.
We recommended Council review the use of both seal and seal pavement residuals. Council responded to this with details provided in the Flinders Council Chapter.
CAPe bArren IslAnd InFrAsTruCTure
The Aboriginal Lands Act 1995 vested title in Cape Barren Island, including all road assets on the island to the Aboriginal Land Council of Tasmania. Council had recorded road assets in its financial statements, believing an official transfer order would be provided by the Department of Infrastructure, Energy and Resources and that the transfer could not be affected in absence of this order. The balance at 30 June 2011, prior to any transfer was $0.600m.
During 2011-12, Council determined that it was not responsible for maintaining the Island’s road assets, it had no control over the assets and a transfer order would not be issued. Consequently, the assets have been treated as a transfer to the Aboriginal Land Council of Tasmania.
15Audit Summary
Council determined the transfer represented a restructure of administrative arrangements, with the asset being transferred between two not-for-profit entities. Consequently, the transfer was treated as a return of equity and, therefore, recorded directly to equity, not through the Statement of Comprehensive Income. As a result, Council recognised a charge against its equity of $0.600m for the de-recognition of roads and drainage assets on the Island.
ben loMond wATer – lAnd TrAnsFer
During 2011-12, Council transferred land and buildings to Ben Lomond Water under a vesting order issued by the water corporation. The land and buildings should have been transferred as part of the initial movement of assets to the water corporation. The amount involved was $0.230m.
george Town Council
vAlIdITy oF rATes
In August 2011, applications were made to the Supreme Court against Council seeking judical review of the rates resolution made for the 2011-12 financial year.
On 8 August 2012, the Court determined that the applications against Council were dismissed and orders were made requiring the applicants to pay Council’s legal costs. Council’s lawyers are pursuing execution of costs orders in this matter with the Court and the other party’s solicitors. Council are hopeful the costs will be recovered during the 2012-13 financial year.
glamorgan spring bay Council
AsseT revAluATIons
Roads, bridges, infrastructure and related assets were revalued as at 30 June 2012 using adjustment indices sourced from the Australian Bureau of Statistics. Applying indices in this manner does not constitute a full revaluation with Council’s last full revaluation of its infrastructure assets conducted on 1 July 2005.
Considerable time has therefore elapsed since the last full revaluation resulting in a risk that the carrying amount of these infrastructure assets does not reflect fair value, which in Council’s case is written down replacement cost.
Accordingly, it was recommended and Council, agreed to update its land, building, bridges and infrastructure valuations based on a full revaluation in 2012-13.
glenorchy City Council
ProvIsIon oF lAndFIll resTorATIon
Council recognises a provision for decommissioning and rehabilitating its landfill site at Jackson Street and to manage the site after closure. The amount of the provision is a combination of estimated restoration costs and the useful life of the landfill. Currently, the restoration cost estimate is based on internal costing. We recommended in 2010-11 that Council obtain an independent estimate of the cost for capping, rehabilitation and on-going maintenance of the landfill site and its useful life. An independent valuation will be undertaken in 2012-13.
16 Audit Summary
Hobart City Council
neT deFIned beneFIT suPerAnnuATIon lIAbIlITy
At 30 June 2012 Council reported a net defined benefit superannuation liability of $15.954m compared with a liability of $12.436m at 30 June 2011, an increase of $3.518m. The value of the superannuation liability and movements recognised in the financial report were based on an annual valuation carried out by Council’s actuary. This valuation was based upon a number of assumptions and the use of discount rates, all of which are volatile and increase the risk that financial report balances may be misstated.
To address this risk, we engaged an independent expert to review the work of Council’s actuary.
Our expert was satisfied that the data, assumptions and methodology used by Council’s actuary to determine the value of the Council’s Defined Benefit Fund liability as at 30 June 2012 were reasonable and concluded that the:
• data used was relevant and appropriate for the purpose of the valuation
• assumptions and methodology used were consistent with relevant accounting and professional standards and had been determined in a manner consistent with prior periods
• assumptions were consistent with industry practice
• methods and calculations applied were appropriate.
suPerAnnuATIon InTeresT exPense
Council records the interest cost component of the superannuation expense as part of its employee costs. We acknowledge there is no specific requirement in AASB 119 Employee Benefits for Council to amend its current disclosure. However, we consider recognising the change in value that reflect the passage of time as a borrowing costs is clearly stated in paragraph 60 of AASB 137 Provisions, Contingent Liabilities and Contingent Assets. It is our view that this principle is applicable to all situations where discounting is used.
We recommended that Council report the interest cost component as a financing cost in future years. Management agreed to adopt this approach in 2012-13.
Kingborough Council
KIngborougH wAsTe servICes PTy lTd
From 1 July 2011, Council’s financial results included the transactions of Kingborough Waste Service Pty Ltd (KWS). This incorporated entity was formed by Council to operate the Baretta waste transfer station. Council provides corporate support to KWS and remains the owner of the infrastructure and equipment at the site. KWS charges Council a fee based on tonnage for garbage, waste and recycling collection and disposal and green waste disposed at the transfer station.
launceston City Council
InverMAy Flood ProTeCTIon enHAnCeMenT ProjeCT
The Invermay flood protection enhancement project was once again a significant capital project during the year. The initial project budget was $39.000m funded equally by the State and Commonwealth Governments and Council. In 2010-11, the budgeted project cost was revised to $58.300m, with the State and Commonwealth Governments committing an additional $6.750m each to the project.
17Audit Summary
At 30 June 2012, Council committed, both in costs already and to be incurred, and including funds provided by the State and Commonwealth, approximately $42.000m to the project, which included an amount estimated to finalise the compulsory acquisition of properties in the flood levee area. Currently, only one property settlement remains uncompleted.
Council are confident the total project cost will meet the revised budgeted of $58.300m when completed
PossIble lIAbIlITy CArbon PrICIng
The Commonwealth’s Clean Energy Act 2011 (the Act), introduced a carbon pricing mechanism, effective 1 July 2012.
In anticipation of the Act, Council have reviewed the impact of a carbon price on its operations. It was considered that carbon price implications would arise from the disposal of waste in Council’s landfill facility. Council expects it will be liable to pay a carbon price on its landfill emissions. The amount payable will depend on the level of overall landfill emissions above the 25,000 tonne annual threshold within the Act. At 30 June 2012 Council had no liability but one may be evident at 30 June 2013.
net defined benefit superannuation liability
At 30 June 2012 Council reported a net defined benefit superannuation liability of $9.560m compared with a liability of $3.623m at 30 June 2012, an increase of $5.937m. The value of the superannuation liability and movements recognised in the financial report are based on an annual valuation. This valuation is based upon a number of assumptions and the use of discount rates, all of which are volatile and increase the risk that the financial report balances may be misstated.
To address this risk, we engaged an independent expert to review the work of Council’s actuary.
Our expert was satisfied that the data, assumptions and methodology used by Council’s actuary to determine the value of the Launceston City Council Defined Benefit Fund’s liability as at 30 June 2012 were reasonable and concluded that the:
• data used was relevant and appropriate for the purpose of the valuation
• assumptions and methodology used are consistent with relevant accounting and professional standards and have been determined in a manner consistent with prior periods
• assumptions are consistent with industry practice
• methods and calculations applied are appropriate.
Council records the interest cost component of the superannuation expense as part of its salary and wages expense. We acknowledge there is no specific requirement in AASB 119 Employee Benefits for Council to amend its current disclosure. However, we consider recognising the change in value that reflect the passage of time as a borrowing costs is clearly stated in paragraph 60 of AASB 137 Provisions, Contingent Liabilities and Contingent Assets. It is our view that this principal is applicable to all situations where discounting is used.
We recommend Council consider amending the disclosure of its superannuation interest expense and recording it as a borrowing cost.
MuseuM ColleCTIon
Collections belonging to the Queen Victoria Museum and Art Gallery have been recognised on Council’s Statement of Financial Position at $231.903m since 2009-10. At that time the value was based on an independent valuation. As at 30 June 2012, the value of the collections was still shown at the 2009-10 valuation. The key issues for the valuation of the collections are twofold:
18 Audit Summary
Currency of the valuation
We acknowledge that as the collection is not subject to depreciation, the currency of the valuation is not as significant as other infrastructure asset classes held by Council.
Additions to collections
In the past two years, new items were acquired and added to the collection. However, the value of these additions has not been recognised.
We recommend that Council adopts a revaluation model for these assets and develops a policy on about this.
Meander valley Council
resIduAl vAlues
Council revalued its road infrastructure assets at 30 June 2012 which included application of a 100% residual value on unsealed road bases. The impact of the residual was to lower total accumulated depreciation and increase the increment taken to the asset revaluation reserve. There was no impact on the depreciation expense in 2011-12, as the revaluation was at year end.
The value of unsealed road bases at 30 June 2012 was $18.799m. The impact of the 100% residual was that the depreciation expense will decrease by approximately $0.094m each year, taking effect in 2012-13.
We consider the residual value results in unsealed road base assets effectively being treated as non-depreciable assets and its use may result in the 2012-13 depreciation expense not complying with AASB 116 Property Plant and Equipment.
The matter has been raised with Council and will be followed up during the 2012-13 audit.
Aged CAre FACIlITy loAn
During the year Council borrowed $3.600m for the purpose of on-lending the funds to an external operator for the development of Independent Living Units at Deloraine and Westbury. The loan requires interest payments over a 10 year period with the principal repaid at the end of loan term.
Council recorded a liability for the loan, offset by a non-current receivable from the aged care operator.
It is anticipated the loan agreement will have a nil impact on Council’s operations over the 10 year period, as Council has on-lent the money on the same terms as it was borrowed.
sorell Council
new AsseTs regIsTer
Council implemented a new assets register, the Capital Value Register (CVR), from 1 July 2011. The CVR integrates the assets register and the general ledger. Previously, Council maintained its assets register on spreadsheets for each class of asset.
19Audit Summary
new CounCIl CHAMbers
Council plan to move into new Council chambers on 31 October 2013. It entered into an agreement for the sale of its current chambers on 31 October 2011 for $0.770m. Council’s Solicitors received $0.100m prior to June 2012 which is held in Trust. As a result, Council’s chambers were disclosed as non-current Assets held for sale of $0.432m, which was the lower of its market value and written down value as at 31 October 2011. At 30 June 2012, there were design costs of $0.043m in work in progress for the new Council chamber building.
Tasman Council
roAd revAluATIon
Council undertook a full independent revaluation of road and bridge assets in 2011-12, which included a condition assessment, by engaging Brighton Council engineers and Tasspan. The valuation was at fair value based on replacement cost less accumulated depreciation as at 30 June 2012 and concluded that the remaining service potential of Council’s road and bridge assets was high, resulting in the asset revaluation reserve increasing by $28.893m.
The following residuals were determined:
• seal residual at 40% of replacement cost
• seal pavement residual at 30% of replacement cost
• unsealed pavement has a residual of 95%.
The effect of establishing these residuals is that they will not be depreciated over the life of these assets. So, for example, in the case of road pavement, only the replacement cost to the extent of 70% will be subject to depreciation.
In our view, Roads have limited useful lives and therefore are depreciable assets in their entirety. Therefore, residual amount should be depreciated over the period which Roads are expected to be available for use by a council. The useful life is determined by various factors such as expected usage, expected physical wear and tear and technical or commercial obsolescence arising from changes or improvement.
Subsequently, Council adjusted the unsealed pavement residual amount from 95% to nil, resulting in the written down value of unsealed pavement decreasing by $4.238m. The seal and seal pavement residual remained unadjusted.
We recommended Council review in 2012-13 their approach to establishing seal and seal pavement residuals.
rATes revAluATIon
The Valuer-General carries out a full valuation of Council’s properties once every six years. The Assessed Annual Value of rateable property increased by 43% in 2011-12. In response to this, Council remodelled its rates charges to ensure an increase in total General rates did not exceed a CPI based index. This resulted in Council making a General Rate comprising 6.487214 cents (2010-11: 11.666933 cent) in the dollar on the Assessed Annual Value, with a fixed charge of $268.63 on all rateable land.
20 Timeliness and Quality of Financial Statements
TIMelIness And QuAlITy oF FInAnCIAl sTATeMenTs
sTATuTory FInAnCIAl rePorTIng And AudITIng TIMIng reQuIreMenTs
Under Section 17 of the Audit Act 2008 (the Audit Act) specific dates are set by when accountable authorities of State entities are to provide financial statements to the Auditor-General to formally allow the audit process to commence. The requirement is that financial statements are submitted for audit within 45 days after the end of the financial year.
Our responsibility under Section 19 of the Audit Act is to complete our audit within 45 days of receiving financial statements from councils.
In all cases councils have a 30 June financial year-end making 15 August the statutory date by when financial statements are to be transmitted with our deadline 30 September.
These dates were set to allow sufficient time for audits to be completed and for councils to prepare annual reports and hold annual general meetings.
21Timeliness and Quality of Financial Statements
The table below summarises the performance by Tasmania’s 29 councils in satisfying their legislated financial reporting requirement.
submission of financial statements for audit by local government Councils for 2010-11
Date initial financial
statements received by Audit
Date amended or re-signed financial statements received
by Audit
Date of audit report
Comment
LOCAL GOVERNMENT AUTHORITIES
CITIES
Clarence City Council
15 August n/a * 7 September 1
Glenorchy City Council
15 August n/a * 11 September 1
Hobart City Council 15 August n/a * 10 September 1Launceston City Council
14 August n/a * 14 September 1
MEDIUM
Brighton Council 15 August n/a * 26 September 1Burnie City Council 14 August n/a * 28 September 1Central Coast Council
15 August n/a * 20 September 1
Derwent Valley Council
15 August n/a * 28 September 1
Devonport City Council
15 August n/a * 14 September 1
Huon Valley Council 14 August n/a * 27 September 1Kingborough Council 27 July n/a * 2 August 1Meander Valley Council
15 August n/a * 28 September 1
Northern Midlands Council
15 August n/a * 27 September 1
Sorell Council 15 August n/a * 26 September 1Waratah-Wynyard Council
15 August n/a * 28 September 1
West Tamar Council 13 August n/a * 31 August 1
SMALL
Break O'Day Council 16 August 28 September 1 October 4Central Highlands Council
15 August n/a * 28 September 1
Circular Head Council
15 August n/a * 28 September 1
Dorset Council 14 August n/a * 28 September 1Flinders Council 10 September 31 October 6 November 2George Town Council
15 August n/a * 28 September 1
Glamorgan-Spring Bay Council
15 August n/a * 28 September 1
22 Timeliness and Quality of Financial Statements
Date initial financial
statements received by Audit
Date amended or re-signed financial statements received
by Audit
Date of audit report
Comment
Kentish Council 9 October n/aAudit to be completed
3
King Island Council 16 August n/aAudit to be completed
4
Latrobe Council 15 August n/a 30 September 1Southern Midlands Council
15 August n/a 28 September 1
Tasman Council 15 August 26 September 30 September 2West Coast Council 13 August n/a 5 September 1
LOCAL GOVERNMENT BUSINESS UNITS
Copping Refuse Disposal Site Joint Authority
3 August 28 September 30 September 2
Cradle Coast Authority
3 September n/a 18 October 3
Dulverton Regional Waste Management Authority
15 August n/a 28 September 1
Northern Tasmanian Regional Development Board
15 September 23 October 28 October 3
Southern Tasmanian Councils Authority
15 August n/a 17 September 1
Southern Waste Strategy Authority
17 July n/a 22 August 1
Comments1. These councils satisfied their legislated financial reporting requirements.
2. These councils all satisfied their legislated responsibilities but the financial statements submitted required amendment or re-signing prior to final completion and audit.
3. One council and two business unit submitted their financial statements late therefore failing to comply with the Audit Act.
4. These two councils were marginally late (one day) in meeting the 15 August deadline for submitting financial statements.
In summary
Three councils (2011, seven) and two business units failed to meet their statutory financial reporting deadlines.
QuAlITy oF FInAnCIAl sTATeMenTs subMITTed For AudIT
The financial statements of three (2011, four) councils and two business units required amendment prior to audit completion. The amendments were initiated either by management or the audit process.
23Timeliness and Quality of Financial Statements
At the time of writing this report the audits of two councils had yet to be completed.
24 Legislative Issues
legIslATIve IssuesAPPlICATIon oF THe AudIT ACT 2008 To CerTAIn loCAl governMenT enTITIes
joint authorities
In our Report No 6 of 2011-12, we noted that during 2011 questions arose as to the application of the Audit Act 2008 (the Audit Act) to a joint authority established pursuant to the Local Government Act 1993 (the Local Government Act).
Prior to the enactment of the Audit Act, the Local Government Act provided that the rules of a joint authority were to provide for audits to be carried out in accordance with the Financial Management and Audit Act 1990 (FMAA). In 2009, the Audit (Consequential Amendments) Act 2008 (the Consequential Amendments Act) amended section 38(1)( j) of the Local Government Act by omitting the reference to the FMAA and replacing it with a reference to the Audit Act. On 1 July 2010, section 38(1)( j) was deleted entirely by virtue of section 4 and schedule 2 of the Consequential Amendments Act. As a result there was no longer a requirement that the rules of a joint authority make provision for audits to be carried out in accordance with the Audit Act.
The above amendments mean that in order for a joint authority to be subject to the provisions of the Audit Act, that Act must directly require joint authorities to comply with its provisions. Ultimately this depends on whether a joint authority is a State entity, as defined in the Audit Act.
State entity is defined in section 3 of the Audit Act as follows:
“State entity” includes –
(a) an agency; and
(b) a council; and
(c) a Government Business Enterprise; and
(d) a State-owned company; and
(e) a State authority that is not a Government Business Enterprise; and
(f ) the council, board, trust or trustees, or other governing body (however designated) of, or for, a corporation, body of persons or institution, that is or are appointed by the Governor or a Minister of the Crown; and
(g) a Corporation within the meaning of the Water and Sewerage Corporations Act 2008;
The meaning of State entity for the purposes of the Audit Act is limited to those bodies specified in the definition above. It turns out that joint authorities were not captured by any of these definitions. The effect of this was that a number of provisions of the Audit Act did not apply to joint authorities, particularly those relating to submission of financial statements for audit by the Auditor-General and therefore inclusion in reports to Parliament of the results of those audits. At 30 June 2011 the financial audit of joint authorities could only be performed by my Office as an audit by arrangement pursuant to section 28 of the Audit Act.
This matter was resolved during 2011-12 by the inclusion in the Audit Act of Section 4 of the following amendment to the definition of State entity:
(fa) a single authority, a joint authority, or a controlling authority, within the meaning of the Local Government Act 1993;
25Legislative Issues
local government Association of Tasmania
In addition, our 2011 report noted another legislative matter identified in the Consequential Amendments Act repealed section 331 of the Local Government Act. This section previously imposed a requirement on the Local Government Association of Tasmania (LGAT) to submit its financial statements and other financial records and accounts to the Auditor-General for audit. LGAT was also not captured by the State entity definition and was similarly not subject to a number of requirements of the Audit Act. Again, the Office can only carry out the financial audit of LGAT if an arrangement is entered into pursuant to section 28 of the Audit Act.
This matter has still to be resolved.
26 Residual Values
resIduAl vAlues
InTroduCTIon
In recent years, we have noticed a number of councils, as part of revaluations, introduce the concept of residual values for long-lived infrastructure assets, particularly roads. This has resulted in a reduction in annual depreciation charges and improvements in road consumption ratios.
We have accepted the implementation of a residual value because its introduction was based on expert advice from councils’ engineers and where impacts on some asset components were not material.
However, during 2011-12 we noted a number of instances where the proposed residual value was significant and materially affected the asset valuation and depreciation expense. In a number of cases, following discussion with councils, the proposed residual values were not implemented.
At 30 June 2012, at least 11 of the 29 Tasmanian councils used some form of residual value for road infrastructure assets.
resIduAl vAlue And useFul lIFe
As defined in AASB 116 Property, Plant and Equipment, paragraph 6:
“The residual value of an asset is the estimated amount that an entity would currently obtain from disposal of the asset, after deducting the estimated costs of disposal, if the asset were already of the age and in the condition expected at the end of its useful life”.
AASB 116 defines useful life as:
a. “The period over which an asset is expected to be available for use by an entity; or
b. the number of production or similar units expected to be obtained from the asset by an entity.”
Application of this concept is illustrated in the following table.
No residual value Residual value exists
Cost of asset 1 000 1 000Estimated residual value 0 100Estimated life of asset 10 years 10 yearsAnnual depreciation charge 100 90
APPlICATIon oF THIs ConCePT by CounCIls
Councils apply this concept by assuming that at the point an asset requires major maintenance or renewal (intervention point), the difference between the cost of intervention and the full replacement cost represents the residual value.
This approach can result in very high residual values being recorded for road assets.
27Residual Values
AASB 116.57 allows an entity to adopt the point of intervention as the residual value of the asset. Paragraph 57 states that:
“The useful life of an asset is defined in terms of the asset’s expected utility to the entity. The asset management policy of the entity may involve the disposal of assets after a specified time or after the consumption of a specified proportion of the future economic benefits embodied in the asset. Therefore, the useful life of an asset may be shorter than its economic life. The estimation of the useful life of the asset is a matter of judgment based on the experience of the entity with similar assets”.
The resulting high residual values do not appear to appropriately apply, in our view, the concept of residual value. At the end of its useful life, an asset should generally be written off to zero or near zero dollars unless there is an expectation that the asset will be disposed of prior to the end of its economic life. As stated in AASB 116.53:
“the depreciable amount of an asset is determined after deducting its residual value. In practice, the residual value of an asset is often insignificant and therefore immaterial in the calculation of the depreciable amount”.
For example, at the end of the useful life of an infrastructure asset, its use will ultimately be decommissioned and the asset will have a residual value at or near zero dollars. This decommissioning may take place after several periods of renewal which act to extend the useful life of the asset. In the case of a road in a rural municipality its residual value could be its land value as farm land, on the basis it could be sold to an adjoining owner.
The figure below illustrates what has been occurring in councils whereby the residual value of the asset, in blue shading, is not being depreciated over the economic life of the asset. Instead, the annual depreciation expense is only being calculated on the cost of the periodic renewals. Effectively this results in the assumption that the residual amount has an infinite life or can be realised at a future period in time.
obsolesCenCe
Based on our review of some approaches used, it appears a substantial proportion of an infrastructure asset is attributable to the residual value, which holds its value in perpetuity. Although this might be accurate from a physical perspective, it does not appear to consider the technical and commercial obsolescence of an asset, i.e. at some point in the future the road may no longer be required and its function may be decommissioned.
28 Residual Values
The point in time when this decommissioning takes place could be difficult to determine and may only become evident when the asset is actually nearing the end of its useful life. However, it is important to attempt to replicate the functional, economic, technical and commercial obsolescence over the life of the asset (AASB 116.56), instead of recognising a large write-down immediately proceeding the decommissioning of the asset.
vAluATIons
As outlined within the International Valuation Standards 4.4 – Valuation Reporting:
• “The context in which a valuation figure is reported is as important as the basis and accuracy of the figure itself. The value conclusion should make reference to the market evidence and procedures and reasoning that support that calculation (Section 6.1).”
• “Communicating the answer to the valuation question in a consistent and logical manner demands a methodical approach that enables the user to understand the processes followed and their relevance to the conclusion (Section 6.2).”
Valuation reports provided by experts need to provide sufficient detail on the depreciation methodology adopted together with supporting valuation calculations. We would ordinarily expect such reports to provide at least a summary of the valuation calculations and assumptions. Sufficient valuation workings or calculations are needed to allow the user to understand whether the calculations are being applied in accordance with the methodology.
Such judgements and assumptions also need to be communicated through appropriate disclosure in the notes to the financial statements.
FInAnCIAl IMPACTs
As stated earlier, the financial impact of the foregoing is that annual depreciation and accumulated depreciation reduce, in some cases significantly. A reduction in accumulated depreciation increases the carrying value of the asset concerned.
This is illustrated by reference to Flinders Council. This Council was not selected because we seek to be critical of its decision to implement residual values but simply because the impact of doing so strongly illustrates its impact.
Flinders Council revalued road assets and implemented a 50% residual on its road seal and 30% residual on sealed road pavements. This was a major reason the accumulated depreciation total reduced by $21.852m between 2011 and 2012.
30-June-2012 30-June-2011
$'000s $'000sGross Asset value - roads 79 605 66 502 Accumulated depreciation (17 683) (39 635)Written down value 61 922 26 867
Road consumption ratio 78% 39%
Clear from this illustration is that implementation of a residual value reduces the:
• depreciable amount of an asset resulting in it not being fully depreciated over its life (this will have the effect of lowering depreciation expenses)
• accumulated depreciation balance leading to the asset being carried at a higher value.
29Residual Values
ACTIon now needed
From discussions with council management and engineers, it became apparent that there are differing views regarding the definition, use and validity of residual values in the valuation of infrastructure assets, such as roads, for financial reporting purposes.
We consider the use of residual values, as it relates to infrastructure assets, ignores the impact of technical or commercial obsolescence over the asset’s life. The residual balance should be depreciated on some basis, even if over an extended useful life, to ensure the calculation of depreciation complies with the requirements of Australian Accounting Standard AASB 116 Property, Plant and Equipment.
Some councils disagree with our view because they consider certain components of road infrastructure assets do not depreciate and the requirements of AASB 116 result in depreciation expenses being over-stated.
We have considered the situation and intend to appoint an independent expert to review depreciation methods, including use of residual values, by Tasmanian councils. It is our intention to undertake the review in early 2013 and discuss our findings with councils before the end of the 2013 financial year.
30 Local Government Financial Sustainability
loCAl governMenT FInAnCIAl susTAInAbIlITy
InTroduCTIon
In Report of the Auditor-General No 1 issued in June 2010, we included, for the first time, an analysis of the financial sustainability of councils by applying seven selected financial ratios assessed over a four year period. Similar analysis has been completed since then with this Report, where relevant, covering a six year period.
The ratios analyse councils’ operating results, asset management practices and net financial liabilities (liquidity) over the six year period to 30 June 2012. However, the asset renewal funding ratio was only calculated based on long-term financial and asset management plans examined at 30 June 2012.
Our assessment of financial sustainability included reviewing aspects of governance arrangements in councils. We examined whether each council had an audit (or similar) committee, and if so, the committee’s charter, and long-term financial and asset management plans at 30 June 2012.
It is emphasised that the analysis in the Chapter is limited to financial sustainability and does not include assessing social or environmental sustainability. We also note that the governance arrangements referred to here have not been subjected to audit and the transfer from councils of their water and sewerage functions on 1 July 2009 impacted some ratios.
Our assessments in this volume are necessarily high level, with further detail provided in individual chapters for each council.
IndICATors oF FInAnCIAl susTAInAbIlITy
A generally accepted definition of financial sustainability is whether local government councils have sufficient current and prospective financial capacity to meet their current and prospective financial requirements. Therefore, to be sustainable, councils needs to have sufficient capacity to be able to manage future financial risks without having to radically adjust their current revenue or expenditure policies.
The ratios applied to assess financial sustainability were selected because they provide a set of interrelated indicators enabling self and comparative assessment. Because these ratios provide a method to analyse past results they can be helpful as indicators in forecasting and identifying trends. Therefore, councils can use ratios such as those applied here to assess their own current and future financial performance and position.
These ratios also facilitate comparative assessment between councils and can be used to assess both short-term and long-term financial sustainability. The various ratios and observations reported below are only indicators of performance or of financial position. They should not be considered in isolation. We note also that other financial sustainability ratios exist which may have relevance but which are not included.
Despite these cautions, taken together these ratios can indicate low, moderate or high financial sustainability risk. The indicators used in this Report are:
• Operating surplus ratio
• Asset sustainability ratio
• Asset renewal funding ratio
• Road asset consumption ratio
• Net financial liabilities ratio
31Local Government Financial Sustainability
• Governance arrangements, particularly audit committees and long-term asset and financial management plans.
In assessing financial sustainability we have tended to consider these ratios in three groups:
• operating performance
• asset management
• liquidity and the extent to which net liabilities can be serviced by operating income.
Governance arrangements were assessed separately although long-term asset and financial management plans were also assessed as part of asset management.
The following table provides a description of the indicator, how it is calculated and, where applicable, a generally accepted benchmark result.
32 Local Government Financial Sustainability
Indicator Formula Benchmark Description
Operating surplus ratio
Net operating surplus
Total operating revenue
Greater than 0 - break even operating result
A positive result indicates a surplus, the larger the surplus the stronger the result and therefore stronger assessment of sustainability. However, too strong a result could disadvantage ratepayers. A negative result indicates a deficit which cannot be sustained in the long-term. Net result and underlying revenue are obtained from the Comprehensive income statement and are adjusted for one-off material items, asset disposal and fair value adjustments, amounts received specifically for new or upgraded assets, physical resources received free of change (such as developer contributions, operating results from discontinued operations and operating grants received in advance (such as FAGs grants), financial assistance grants received in the wrong financial period, developer contributions and any other material one-off (non-recurring) items of revenue or expenditure.
Asset sustainability
ratio
Renewal and upgrade
expenditure on existing assets
Depreciation on existing
assets
At least 100%
Comparison of the rate of spending on existing infrastructure, property, plant and equipment through renewing, restoring and replacing existing assets, with depreciation. Ratios higher than 100% indicate that spending on existing assets is greater than the depreciation rate. Expenditure included on the numerator must be expenditure that was ‘capitalised’, not expensed, on assets that will require future maintenance and depreciation .This is a long-term indicator, as capital expenditure can be deferred in the short-term if there are insufficient funds available from operations, and borrowing is not an option.
Asset renewal funding ratio
Future (planned) asset replacement expenditure
Future asset replacement expenditure
(actual) required
At least 90%
Measures the capacity to fund asset replacement requirements. An inability to fund future requirements will result in revenue or expense or debt consequences, or a reduction in service levels. This is a most useful measure relying the existence of long-term financial (or separate asset) management plans. Where these may exist, unless they have been independently assured, they will not be used (however, we subsequently decided to accept plans as provided).
Asset consumption ratio - roads
Depreciated replacement
cost
Current replacement
cost
>60%
Shows the depreciated replacement cost of an entity’s depreciable assets relative to their ‘as new’ (replacement) value . It therefore shows the average proportion of new condition left in assets. Depending on the nature of the entity’s assets, this ratio could be calculated in total and by asset class, for example roads, bridges and stormwater assets.
Net financial liabilities
ratio
Total liabilities less liquid assets
Total operating revenue
Net financial liabilities
between zero to negative 50%
of operating income.
Positive ratio indicates
liquid assets in excess of total
liabilities.
The significance of net amount owed compared with the period’s income. Indicates the extent to which net financial liabilities could be met by operating income. Where the value is falling over time, it indicates that the entity’s capacity to meet its financial obligations from operating income is strengthening.Reasons for an increase in the net financial liabilities ratio will sometimes also result in an entity incurring higher net operating costs (eg from additional maintenance and depreciation costs associated with acquiring new assets). This will detract from the entity’s overall operating result.A Council with a healthy operating surplus could quite appropriately decide to allow its net financial liabilities ratio to increase in order to provide additional services to its community through the acquisition of additional assets without detracting from its financial sustainability.
33Local Government Financial Sustainability
On the following pages we apply these ratios to the consolidated financial position of the twenty seven councils included in this Report, over a six year period and then comparatively averaging the performance to all councils. With the exception of the asset renewal funding ratio, all data used in calculating the ratios and preparing the various graphs were sourced from audited council financial statements. Also, within the graphs, where relevant, a blue line represents the actual ratio each year and a red line the benchmark for the period under review. Where we were able to assess the asset renewal funding ratio, this was based on long-term asset and financial management plans provided but not audited.
As noted we have expanded our sustainability assessment of councils to incorporate information on governance arrangement in councils. In conjunction with operating performance, asset management and liquidity and the extent to which net liabilities can be serviced by operating income, we consider governance further facilitates our comparative assessment between councils. The results of our review are detailed in a Governance section of this Chapter.
In making our assessment of financial sustainability, we adopted the following criteria:
Low Moderate High
Financial sustainability operating perspective
Average operating surplus over the past four year
Average operating deficits < 10% of operating revenue over the past four year
Average operating deficits >10% of operating revenue over the past four year
Asset sustainability ratio >100% and average road consumption ratio > 40%
Asset sustainability ratio between 50% and 100% and average road consumption ratio > 40%
Asset sustainability ratio < 50% and average road consumption ratio < 40%
Financial sustainability net financial liabilities perspective
Net financial liabilities ratio > than (50%)
Net financial liabilities ratio between (50%) and (100%)
Net financial liabilities ratio > 100%
Financial sustainability governance perspective
Audit Committee with an active internal audit function and both long-term asset and financial management plans.
Audit committee or finance committee with no internal audit function and/or both long-term asset and financial management plans.
No audit committee or either a long-term asset management plan or financial management plan, or no plans at all.
34 Local Government Financial Sustainability
FInAnCIAl susTAInAbIlITy Trends
operating surplus ratio
This ratio serves as an overall measure of financial operating effectiveness. To assure long-term financial sustainability, councils should, at a minimum, budget and operate to break-even thereby avoiding operating deficits. Doing so would enable councils to generate sufficient revenue to fulfil their operating requirements including coverage of their depreciation charges. Breaking even is represented by an operating surplus ratio of zero or greater.
Figure 1 below shows the operating surplus ratio achieved on a consolidated basis by the 27 councils in each of the past six years.
Figure 1 Average all councils operating surplus ratio
The average operating margin was below the benchmark of zero in all six years under review. The ratio declined to minus 5.0 in 2009-10 with this fall likely, in the main, to have been due to the water and sewerage reforms. A number of council’s required priority dividends to overcome lost operating income.
There was a significant improvement in 2010-11, with a ratio of minus 0.9. The improvement was generally due to councils’ improved results during that year. However, the average operating margin declined in 2011-12 to minus 2.0.
The 27 councils generated a combined net operating deficit of $12.771m, with 14 councils generating net operating deficits totalling $20.496m. The following table shows all councils that generated Net operating deficits in 2011-12.
(6)
(5)
(4)
(3)
(2)
(1)
0
2007 2008 2009 2010 2011 2012Year
Operating surplus ratio - Average (All Councils)
35Local Government Financial Sustainability
Net operating deficit Operating margin2011-12 2011-12
Break O'Day (3 224) (23.50)Burnie City (1 007) (2.80)Central Highlands (1 534) (25.48)Circular Head ( 453) (3.53)Clarence City ( 935) (1.82)Devonport ( 757) (2.24)Flinders ( 324) (6.80)Glenorchy City (3 210) (6.01)Hobart City (589) (0.59)Kingborough (3 286) (10.65)Launceston City (1 647) (1.92)Northern Midlands (1 783) (12.33)Southern Midlands (1 315) (14.79)Waratah-Wynyard ( 432) (2.88)
TOTAL (20 496)
It is our view that, to ensure long-term financial sustainability, councils should, as a minimum, operate on a break-even basis.
Figure 2 Average six-year operating surplus ratio by each council
Break O'DayBrighton
Burnie CityCentral Coast
Central HighlandsCircular Head
Clarence CityDerwent Valley
DevonportDorset
FlindersGeorge Town
Glamorgan Spring BayGlenorchy City
Hobart CityHuon Valley
KingboroughLatrobe
Launceston CityMeander Valley
Northern MidlandsSorell
Southern MidlandsTasman
Waratah-WynyardWest Coast
West Tamar
(50) (25) 0 25
Operating surplus ratio
Figure 2 shows that 14 of the 27 councils, on average over the six year period, operated below benchmark. Of the 27 councils, 14 (2010-11, 12) recorded Net operating deficits, and therefore a negative operating surplus ratios, in 2011-12.
Conclusion based on assessment of the operating surplus ratio
Fourteen councils with an average operating surplus below benchmark is too high. We recommend all councils develop plans with the objective of achieving positive operating margins in the immediate term.
36 Local Government Financial Sustainability
Asset sustainability ratio
This ratio calculates the extent to which councils are maintaining operating capacity through the renewal of their existing asset base. The generally accepted benchmark for this ratio, subject to levels of maintenance expenditure and long-term asset management plans, is 100%. The benchmark is based on a council expending its annual depreciation expense on asset renewals within the year. However, it is acknowledged that this is unlikely to occur every year or evenly over a number of years. As a result, our assessment is based on a six-year average. It is also acknowledged that this ratio has imperfections which are addressed by the asset renewal funding ratio discussed later in this Chapter. However, until all councils have established adequate long-term asset management and financial plans, we will continue to include the asset sustainability ratio in our assessments of financial sustainability.
Figure 3 below shows the asset sustainability ratio achieved on a consolidated basis by the 27 councils in each of the past six years.
Figure 3 Average asset sustainability ratio
Councils expended, on average, 89% of their depreciation expense on maintaining their existing non-current assets. The average annual ratio improved from 81% in 2007 to 94% in 2012 and indicates, on the whole, councils were improving their investment in existing assets at a level near to depreciation charges.
60
80
100
120
2007 2008 2009 2010 2011 2012
%
Year
Asset sustainability - Average (All Councils)
37Local Government Financial Sustainability
Figure 4 Six-year average asset sustainability ratio by council
Figure 4 shows the average six-year asset sustainability ratio achieved by each council.
In almost every case councils failed to meet the benchmark, with only six councils (2010-11, five) having an asset sustainability ratio above 100% over the six-year period. A further seven (nine) councils averaged above 90%.
Conclusion based on assessment of the asset sustainability ratio
Although there has been an improvement in the average ratio over the period under review, in general, councils have not matched capital expenditure on existing assets to depreciation charges. This indicates an under-investment in existing assets.
0 50 100 150 200
Break O'Day
Brighton
Burnie City
Central Coast
Central Highlands
Circular Head
Clarence City
Derwent Valley
Devonport
Dorset
Flinders
George Town
Glamorgan Spring Bay
Glenorchy City
Hobart City
Huon Valley
Kingborough
Latrobe
Launceston City
Meander Valley
Northern Midlands
Sorell
Southern Midlands
Tasman
Waratah-Wynyard
West Coast
West Tamar
%
Asset sustainability ratio
38 Local Government Financial Sustainability
Asset renewal funding ratio
This ratio measures councils’ capacity to fund future asset replacement requirements. An inability to fund future requirements will result in revenue, expenditure or debt consequences, or a reduction in service levels.
The measure relies on the existence of long-term financial and asset management plans. The ratio measures planned asset replacement requirements against planned asset replacement expenditure. To maintain operating capacity, we would expect a council to fund 90% of its planned asset requirements.
Figure 5 below shows the asset renewal funding ratio for those councils that had long-term financial and asset management plans. The ratio is calculated at 30 June 2012 on estimated required and planned capital expenditure. The periods covered by financial and asset management plans varied with some extending to up to 20 years. Where there is no blue line, this represents no asset management or financial plans making it difficult to calculate the asset renewal funding ratio.
Figure 5 Asset renewal funding ratio by council
0 50 100 150 200
Break O'Day
Brighton
Burnie City
Central Coast
Central Highlands
Circular Head
Clarence City
Derwent Valley
Devonport
Dorset
Flinders
George Town
Glamorgan Spring Bay
Glenorchy City
Hobart City
Huon Valley
Kingborough
Latrobe
Launceston City
Meander Valley
Northern Midlands
Sorell
Southern Midlands
Tasman
Waratah-Wynyard
West Coast
West Tamar
Asset renewal funding ratio
39Local Government Financial Sustainability
The majority of councils that were able to produce long-term financial and asset management plans have detailed projections of required future capital expenditure. In most cases councils indicated their intention to fully fund the required work. The ratio, at a minimum, has been calculated on road infrastructure assets by each council, but in a number of cases includes other infrastructure assets.
The councils that have a ratio greater than 100% are several years through their cycle and their ratios were calculated on the remaining years of their long-term asset management plan. These councils’ plans require expenditure in excess of projected requirements over the remaining years of their long-term asset management plan. Councils’ with lower ratios implemented long-term financial and asset management plans in 2011-12 and are aware they face a funding gap between planned and required expenditure. A key objective of long-term plans is to identify such funding gaps and allow councils to develop strategies to address future asset replacement requirements in full.
However, Figure 5 also illustrates that seven councils had not developed either long-term financial or asset management plans. This is discussed further later in this Chapter.
Conclusion based on assessment of the asset renewal funding ratio
For those councils who have prepared long-term asset and financial management plans, in the main, planned expenditure on asset management was generally funded. A number of councils will need to review their long-term plans to address identified funding gaps.
We recommend that the seven councils who have still to develop both long-term asset and financial plans do so as soon as possible. However, it is acknowledged a number are in the process of finalising and implementing both plans.
40 Local Government Financial Sustainability
road consumption ratio
Our review of asset consumption was based only on road infrastructure primarily due to:
• road infrastructure assets representing 47.6%, or $3.008bn, of total infrastructure assets held by the 27 councils of $6.318bn
• our identification that other asset classes, such as buildings, were revalued on a net basis (gross replacement cost less accumulated depreciation at the date of the revaluation) making it difficult to calculate the consumption ratio for these assets.
The ratio indicates the levels of service potential available in existing road infrastructure managed by councils. The higher the percentage, the greater future service potential is available to provide service to ratepayers.
Figure 6 below shows the road asset consumption ratio on a consolidated basis for the 27 councils in each of the past six years.
Figure 6 Average road consumption ratio
Figures 6 indicates relatively low levels of consumption of council road assets with improvement over the period. The road consumption ratio improved from 58.7% in 2007 to 65.6% in 2012, with all councils within a low or moderate asset sustainability risk. A number of reasons contributed to the improvement including:
• higher capital expenditure on road assets
• Councils, as part of regular revaluations, reviewing and extending the useful lives of road asset components and introducing residual values. In particular, residual values have had a significant impact on the depreciation expense and the accumulated depreciation balance. Appropriately, these reviews were driven by engineers, who now have a greater base of empirical data on road assets.
The ratio indicates, on a consolidated basis, that councils have sufficient service capacity remaining in their road infrastructure assets.
50
55
60
65
70
2007 2008 2009 2010 2011 2012
%
Year
Road consumption ratio - Average (All Councils)
41Local Government Financial Sustainability
Figure 7 Six-year average road consumption ratio by council
Figure 7 shows the six-year average road consumption ratio for each council.
Twelve of the 27 councils, on average over the six- year period to 30 June 2012, had low asset management risk with the remaining 15 at moderate risk.
Conclusion based on assessment of the asset consumption ratio
There has been improvement in the level of consumption of road infrastructure assets. At 30 June 2012, no council was below our high risk benchmark of 40%.
0 20 40 60 80 100
Break O'Day
Brighton
Burnie City
Central Coast
Central Highlands
Circular Head
Clarence City
Derwent Valley
Devonport
Dorset
Flinders
George Town
Glamorgan Spring Bay
Glenorchy City
Hobart City
Huon Valley
Kingborough
Latrobe
Launceston City
Meander Valley
Northern Midlands
Sorell
Southern Midlands
Tasman
Waratah-Wynyard
West Coast
West Tamar
%
Road asset consumption ratio
(50)
(40)
(30)
(20)
(10)
0
10
20
30
40
50
2007 2008 2009 2010 2011 2012
%
Year
Net financial liabilities ratio - Average (All Councils)
42 Local Government Financial Sustainability
net financial liabilities ratio
This ratio indicates the net financial obligations of councils compared to their operating income in any one year; specifically, the extent to which net financial liabilities (total liabilities less liquid assets) could be met by operating income.
Where the ratio is positive, it indicates a council’s liquid assets exceeded its total liabilities. Conversely, a negative ratio indicates an excess of total liabilities over liquid assets. Our benchmark was a ratio of between 0 and minus 50%, with a council having net liabilities at minus 50% or less than one year’s operating revenue being considered low risk.
Figure 8 below shows the net financial liabilities ratio on a consolidated basis by the 27 councils in each of the past six years.
Figure 8 Average net f inancial liabilities ratio
The average net financial liabilities ratio was positive each year. This was because, on a consolidated basis, total liquid assets exceeded total liabilities. At 30 June 2012, the 27 councils had current liabilities of $127.257m and non-current liabilities of $137.851m, which included borrowings of $77.615m. However, cash and financial assets totalled $400.237m, which was $135.129m greater than total liabilities. Operating revenue generated during 2011-12 totalled $644.196m.
The ratio improved in 2009-10 when many councils transferred borrowings to the water and sewerage corporations.
While we understand that, to an extent, councils’ cash holdings are committed to existing or future programs, this ratio indicates that:
• Collectively, councils are holding liquid assets, primarily cash balances, well beyond their day-to-day requirements. This results, as we have reported in many individual Chapters of this report, in high levels of investment incomes
• Generally asset renewal or replacement or investments in new assets are being funded from current rates, existing cash holdings or capital grants with limited use of borrowings.
43Local Government Financial Sustainability
Figure 9 Six-year average net f inancial liabilities by council
Figure 9 shows the average six-year net financial liabilities ratio for each council.
Based on our benchmark of between 0 and minus 50%, all councils were in a strong liquidity position. The figure indicates that a number of councils were holding high liquid assets relative to their liabilities.
Conclusion based on assessment of net f inancial liabilities ratio
All councils were in a position where they were able to service their current commitments, had manageable debt levels and capacity to borrow should the need arise.
Break O'Day
Brighton
Burnie City
Central Coast
Central Highlands
Circular Head
Clarence City
Derwent Valley
Devonport
Dorset
George TownGlamorgan Spring
BayGlenorchy City
Hobart City
Huon Valley
Kingborough
Latrobe
Launceston City
Meander Valley
Northern Midlands
Sorell
Southern Midlands
Tasman
Waratah-Wynyard
West Coast
West Tamar
(50) (25) 0 25 50 75 100 125
%
Net financial liabilities ratio
asb
Typewritten Text
Flinders
asb
Typewritten Text
asb
Typewritten Text
asb
Typewritten Text
asb
Typewritten Text
182%
asb
Typewritten Text
asb
Typewritten Text
asb
Typewritten Text
asb
Typewritten Text
44 Local Government Financial Sustainability
governance
Our review specifically concentrated on whether each council had:
• an audit committee and, if so, the functions of the committee
• a long-term asset management plan
• a long-term financial management plan.
Our view is that robust audit committee arrangements, and the existence of the financial plans referred to, are indicative of a council’s approach to financial sustainability. We acknowledge that councils apply many other governance arrangements which may, or may not, complement or mitigate conclusions drawn in this part of this Chapter.
Table 1 below summarises the results of our review.
Table 1 Summary of governance arrangements
Audit Committee
Long-Term Asset
Management Plan
Long-Term Financial
Management Plan
Break O'Day N N NBrighton N * Y YBurnie Y Y YCentral Coast N Y YCentral Highlands Y N NCircular Head N Y YClarence Y N NDerwent Valley N N NDevonport Y Y YDorset N Y YFlinders Y Y YGeorge Town N Y YGlamorgan Spring Bay N N NGlenorchy Y Y YHobart Y Y YHuon Valley N Y YKingborough N Y YLatrobe N Y YLaunceston Y Y YMeander Valley N Y YNorthern Midlands N Y YSorell N * N YSouthern Midlands N N YTasman N N NWaratah-Wynyard N Y YWest Coast N N NWest Tamar N * Y Y
* Finance Committees/Risk and Ethics Committee
asb
Typewritten Text
45Local Government Financial Sustainability
Based on our review eight councils had audit committees, with two new committees established during 2011-12. Of those that did not, we noted a number had finance committees that undertook some roles of an audit committee. Eighteen councils had long-term asset management plans and 20 had long-term financial management plans.
Audit Committees
It is now generally accepted that audit committees, or their equivalent, are part of a strong governance framework. All Tasmanian government departments and State owned companies and all government business enterprises have well established and functioning committees and internal audit arrangements. However, local government has been slower to incorporate audit committees into their governance structures.
We acknowledge the major cities have audit committees, but medium to smaller councils, in general have not yet introduced such committees. In our view, better practice is for there to be:
• an audit committee with independent members, an appropriate Charter and the delegated authority to pursue relevant issues and report findings to management and Council
• a requirement for an audit committee to set and ensure the delivery of an annual internal audit work plan, which reviews issues based on risk.
In addition, audit committees should play a role in reviewing and commenting on:
• year end financial statements, including resolution of accounting issues, with such a review occurring prior to adoption by General Managers. In making this observation, we acknowledge the legislative requirement for General Managers, not Councils, to prepare and sign annual financial statements for submission to audit
• internal audit reports and follow-up of actions taken as a result of such reports
• long-term financial management plans
• long-term asset management plans.
An audit committee does not relieve a Council or a General Manager of their responsibility, but work to assist both in ensuring council operates efficiently and effectively, manages risk and adopts appropriate internal controls, systems and processes.
We acknowledge that an audit committee, along with an internal audit program, adds to council costs. However, an effective committee can identify improved practices and a reduction of risk potentially leading to lower costs and improved outcomes. Also acknowledged is the availability of skills and lack of economies of scale particularly in medium and smaller councils. However, such councils could:
• reduce the range of the activities allocated to an audit committee in line with its size, risk and other governance arrangements
• resource share an audit committee and or internal audit function and undertake reviews or audits across participating councils.
long-Term Financial Management and Asset Management Plans
In our last Report, we noted the Local Government Association of Tasmania (LGAT) was managing a Local Government Financial and Asset Reform Project which aimed at developing and implementing long-term financial and asset management frameworks in all Tasmanian councils. LGAT noted that local government was committed to the long-term management of assets and services in a sustainable way and at a level acceptable to the community without unplanned rate rises or disruptive cuts.
46 Local Government Financial Sustainability
The project is a partnership between the State and Federal governments and was funded through the Commonwealth’s Local Government Reform Fund.
Expected outcomes of the project include:
• a long-term financial planning template
• long-term financial plans implemented in all councils
• asset management plans for major assets in all councils
• guidelines and training for elected members.
From our review of long-term asset management and financial plans, we noted a considerable number of councils had adopted the templates provided by LGAT or are in the process of preparing draft plans in line with the templates.
We support LGAT in its reform project and commend each council that has or is in the process of implementing long-term financial and asset management planning frameworks.
Conclusions as to governance arrangements
Overall, not enough councils have audit committees or long-term asset and financial management plans in place. However, changes being implemented were encouraging.
overAll FInAnCIAl susTAInAbIlITy AssessMenT
Based on these ratios and governance arrangements we concluded that at 30 June 2012, assessed on average performance over the past six years, councils in general had a high financial sustainability risk from a governance perspective, moderate financial sustainability risk from operating and asset management perspectives but low risk from a net financial liabilities perspective.
A number of councils need to address continued operating deficits, introduction of an audit committee and further development of long-term asset and financial management plans.
Councils are generally under investing in existing assets with only six out of 27 councils investing in existing assets, on average over a six year period, in excess of their annual depreciation charge.
On a total road asset basis, the 27 councils’ road assets had sufficient capacity to continue to provide service to ratepayers.
Collectively councils may be holding surplus cash.
Individual assessments are included in each council’s Chapter.
47Local Government Comparative Analysis
loCAl governMenT CoMPArATIve AnAlysIs
Comparative analysis covering financial and other information for 27 Tasmanian councils has been compiled with results provided in four attachments to this Chapter. The information provided is for the financial year ended 30 June 2012. The attachments are presented with councils grouped as either major city, medium or small.
This is the seventh year that this analysis has been included in this Report. While only one year’s data is provided, where relevant, comparative totals for 2010-11 are included.
The attachments are:
• Demographics
• Employee Costs
• Statements of Comprehensive Income
• Statements of Financial Position.
Our analysis of the attachments is of a general nature and should be read in conjunction with the individual Chapters on each council in this Report and the Local Government Financial Sustainability Chapter.
When considering the various ratios and observations reported in this Chapter, it needs to be borne in mind that they are only indicators of performance or of financial position. The various ratios should not be considered in isolation. However, taken together various ratios can indicate good or poor financial condition or performance. It is also important to review these ratios over time with the analysis in this Chapter only considering performance for the single 2011-12 financial year.
Demographics (note most recent data available is for 2010-11)
Comments here are made by reference to Attachment 1.
The Tasmanian population, as recorded by the Australian Bureau of Statistics – Regional Population Growth, increased by 3 563, 0.71%, from 2009-10 to 2010-11. Across the State, populations of each municipal area vary considerably, ranging from 804 (2009-10, 900) in Flinders to 67 190 (65 826) in Launceston. The major cities’ populations represented 42.90% (215 878) (42.74%, 213 555) of the total population, but only covered 2.90% or 1 986 square kilometres (sq kms) of the State’s area. Conversely, the 13 small councils’ combined populations represented 13.34%, 68 171 (13.50%, 68 552) of the total population, but covered 59.7% or 40 474 sq kms of the State’s area.
As noted in previous years, small councils can face difficulties in providing and maintaining services because they do not have access to the higher ratepayer base of larger councils and in some cases they manage large road networks. This is highlighted in the number of rateable valuations per square kilometre ratio which reflects the population and area disparity between the councils already referred to.
employee Costs
Comments here are made by reference to Attachment 2, which summarises Employee costs, Employee entitlements and Full Time Equivalents (FTE’s) for the 27 councils.
48 Local Government Comparative Analysis
The 27 councils in the table employed 3 300 (2010-11, 3 263) FTE’s at 30 June 2012 and incurred employee costs of $247.645m ($233.736m) for the financial year. Average employee costs per FTE varied from a high of $93 000 per FTE at Break O’Day Council to a low of $58 000 per FTE at Brighton Council with the average being $73 000.
Councils’ FTEs per 1 000 head of population also varied with small councils having lower population bases and higher ratios. Flinders Council had a ratio above 22.4 FTEs per 1 000 head of population due to its small population. The average for the 27 councils was 7.5 FTE per 1000 head of population.
At 30 June 2012, the amount of annual, long service and some sick leave accrued by the 27 councils for their employees totalled $56.378m (2010-11, $51.733m). On a per FTE basis this equated to $16 839 with variations between councils ranging from $6 050 per FTE at Tasman to $39 125 at Derwent Valley.
statements of Comprehensive Income
Comments here are made by reference to Attachment 3.
The combined total Surplus for the 27 councils was $104.281m, an increase of 24.60 % from 2010-11 ($83.690m) and included:
• $71.455m (2010-11, $43.865m) in capital grant funding
• $34.516m ($19.877m) in contributed assets, mainly through subdivisions
• $17.478m ($0.768m) in net Financial Assistance Grants adjustments related to 50% funding received in June 2012 for 2012-13 adjusted for 25% funding received in June 2011 for the 2011-12 financial period
• $0.339m ($0.620m) in other non-operating revenue, offset by
• $5.491m in non-operating expenditure which included losses on disposal of assets (two councils) of $2.662m and a write off of expenditure related to a capital grants used to upgrade a State Government asset, $2.171m.
Excluding these items, it could be argued that, on a “net operating” basis, for the year ended 30 June 2012 councils recorded a combined deficit of $12.771m ($5.371m deficit). Fourteen councils recorded a net operating deficit for the 2011-12 financial year.
On a Comprehensive income basis, combined comprehensive surpluses totalled $388.276m (2010-11, $515.304m), a decrease of $127.028m. The change from the total Surplus of $104.281m included:
• fair value net asset revaluation increments of $290.098m (2010-11, $439.125m)
• write up of councils’ net investments in the water and sewerage corporations of $5.209m ($11.608m) based on movements in each corporation’s net assets during 2011-12
• actuarial losses of $11.352m ($4.922m) on defined benefit superannuation schemes. These losses only applied to those councils not operating under multi-employer defined benefit schemes.
Revenue raising capacities
The 27 councils raised $378.113m (2010-11, $355.629m) in rates for the 2011-12 year, an increase of 6.32%. Cities, in general, earn a greater percentage of their operating revenue from rates. This was reflected in the rate revenue to operating revenue ratio. In contrast, councils that had a lower rate to operating revenue ratio received a higher percentage of recurrent grant revenue. It was noted that there were eight councils (six) with rate revenue to operating revenue ratios of less than 50%
49Local Government Comparative Analysis
meaning that they were heavily reliant on recurrent grant funding. One of these councils also had the lowest average rates per rateable valuation although it generated relatively high rate revenues per head of population.
On average councils are rating $1 281 per rateable property, but are expending $2 382 in operating costs. Councils operating expenses are being supported by other revenue sources including fees and charges, interest revenue and grants. A reduction in grant funding would have a significant impact on local government, with any possible loss in revenue having to be offset by an increase in rates or a reduction in costs and services, in particular those relating to grants.
Councils’ own source revenues represent operating revenue other than recurrent grants. Expressing own source revenues as a percentage of total operating revenues indicated a council’s ability to generate its own funding, without relying on recurrent government grants. In general terms, the resulting ratios in Attachment 3 highlight that, consistent with ratios discussed previously, smaller councils generate lower amounts of own source revenues in percentage terms.
Also reported in Attachment 3 are the ratios of operating (or recurrent) grants per head of population and operating grants compared to operating revenues. These ratios confirm previous observations that smaller councils were more reliant on recurrent operating grants. To illustrate this point, small councils’ grants per head of population were considerably greater than other councils, for example Flinders, $2 761, Central Highlands, $966 and Break O’Day, $858, compared to Hobart, $68, or Clarence, $87.
Depreciation coverage
The depreciation to operating revenue ratio provides an indication of the extent to which a council was funding, from current revenues, its future asset replacement through depreciation. There is no benchmark for this ratio except that we anticipate that councils should at least budget to breakeven on an operating basis therefore fully covering annual depreciation charges.
The ratio of depreciation to operating revenues for the 27 councils was 25.3% (2010-11, 25.2%), with major cities averaging 23.0% (22.4%), medium councils 23.7% (23.4%) and small councils 27.8% (28.1%). The ratios remained fairly constant from 2010-11 to 2011-12.
There were considerable fluctuations in the small council percentages, these varying between 19.1% at Glamorgan Spring Bay, which had a comparatively low infrastructure assets base with non-current infrastructure assets per head of population of $11 878, to 49.6% at Central Highlands where the non-current infrastructure assets per head of population was $52 431. This highlighted the importance of having long-term asset management plans (further information about this is included in the Local Government Financial Sustainability Chapter) and budgeting to ensure that operating revenues are sufficient to cover all operating costs, including depreciation. It is acknowledged that the latter will be more difficult in regional communities with significant infrastructure.
However, it is inappropriate to consider this ratio in isolation with further discussion about this when reviewing the depreciation to capital expenditure ratios later in this Chapter.
statements of Financial Position
Comments here are made with reference to Attachment 4.
Management of working capital
On the basis that a working capital ratio of one or better is effective, all councils manage working capital (total current assets less total current liabilities expressed as a ratio) effectively with most achieving a ratio of well above one at 30 June 2012. This ratio provides an indication as to whether or not an entity can meet its short-term commitments from existing current assets.
50 Local Government Comparative Analysis
It is noted, however, that all councils had large or reasonably large bank and investment balances some of which are committed to future capital projects. The significant cash balances are further illustrated by the net financial liabilities ratio (total liabilities less liquid assets divided by operating revenue expressed as a percentage). Most councils have positive percentages meaning liquid assets exceeded total liabilities. This is further examined in the Local Government Sustainability Chapter.
Management of infrastructure and other non-current assets
Included in total non-current assets, amounting to $8.331bn (2010-11, $7.990bn), were infrastructure assets controlled by the 27 councils at 30 June 2012 totalling $6.316bn ($5.980bn).
In 2011-12 payments made by councils for property, plant and equipment totalled $189.377m (2010-11, $220.767m) and depreciation charged on these assets totalled $150.021m ($140.185m). A useful measure to assess the extent to which a council was adequately investing in its non-current asset base is expenditure on all assets expressed as a percentage of depreciation with an ideal target of 100%. However, a better measure for this ratio is to express expenditure on existing assets as a percentage of depreciation. This particular measure is further assessed in the Chapter dealing with Financial Sustainability.
For the 27 councils, the average of total capital expenditure, on existing and new assets, to depreciation ratio was 124.2% (2010-11, 148.0%) indicating most councils were re-investing in their non-current assets at an appropriate rate. However, some councils stand out as being below the target of 100%. In each case, further details are provided in individual council Chapters of this Report.
Another indicator which can be used to assess whether or not a council is adequately re-investing in its non-current asset base is to compare rate revenue to non-current infrastructure assets. This ratio indicates the level of rating undertaken in relation to the infrastructure bases being managed by each council. The higher the ratio the better. Lower ratios were noted in the small councils possibly indicating that these councils were under-rating. As noted previously under the Statement of Comprehensive Income discussion in this Chapter, small councils had a greater dependence on grant funding and earned lower rate revenue per rateable valuation.
The analysis of non-current infrastructure assets per square kilometre and per head of population confirms the concentration of infrastructure and people in the major cities and larger urban areas. Small councils manage lower levels of infrastructure assets, but across a larger geographical area.
The ratio of non-current infrastructure assets per rateable valuation indicated that each rateable valuation supported a fairly consistent level of infrastructure. We have not analysed why it is that some councils vary significantly from the average of $24 124 (2010-11, $21 228).
Management of debt
We have included in our analysis relevant ratios around debt management because how councils manage debt and associated interest costs can have short and long term impacts on rating strategies and asset replacement programs. Inter-generational equity also needs to be considered as does the impact of asset replacement programs and any effect of proposed new initiatives.
A review of the interest coverage ratio for each council (cash interest payments divided by net operating cash flows expressed as a percentage) indicated that all councils with debt are comfortably able to meet their loan interest charges.
It is noted that Brighton, Huon Valley, Kingborough, Northern Midlands, Break O’Day, Central Highlands and Flinders Councils did not hold any loan debt at 30 June 2012.
51Local Government Comparative Analysis
The indebtedness ratio complements the current ratio and illustrates a council’s ability to meet longer term commitments. The ratio compares non-current liabilities to a council’s own source revenue, the lower the percentage the stronger a council’s position to meet longer term liabilities. Those councils with ratios well above the average of 17.7% (2010-11, 16.3%) were, in general, holding higher levels of non-current borrowings at 30 June 2012 than the councils with lower ratios. However, the ratios indicate all councils can meet future longer term debt commitments.
Collection of rates
For the 27 councils, rate debts owing to councils at 30 June 2012 totalled $12.941m (2010-11, $11.260m) with an average per council of $479 000 ($417 000). Expressing rate debtors as a percentage of rates raised indicated that, in general, councils were recovering outstanding rate debts in a reasonable timeframe. Derwent Valley Council at 11.1% had the highest ratio. It is noted, however, that all councils had significant power under the Local Government Act 1993 to recover rate debts against a property.
52 Local Government Comparative Analysis
Attachment 1 – loCAl governMenT CoMPArATIve AnAlysIs demographics - 2011-12
Council Population
Area in Square
Kilometres
Population Per Square Kilometre
Number of Rateable
Valuations
Number of Rateable Valuations Per Square Kilometre
Average Rateable
Valuations Per
Head of Population
Clarence 52,824 377 140.1 23,618 62.6 0.4
Glenorchy 45,471 120 378.9 20,900 174.2 0.5
Hobart 50,393 78 647.7 23,534 302.5 0.5
Launceston 67,190 1,411 47.6 30,299 21.5 0.5
Brighton 15,675 171 91.7 6,854 40.1 0.4
Burnie 20,208 610 33.1 9,541 15.6 0.5
Central Coast 22,334 931 24.0 10,518 11.3 0.5
Derwent Valley 9,904 4,104 2.4 4,992 1.2 0.5
Devonport 25,657 111 231.1 11,897 107.2 0.5
Huon Valley 15,841 5,498 2.9 10,200 1.9 0.6
Kingborough 34,691 1,094 31.7 16,095 14.7 0.5
Meander Valley 19,637 3,320 5.9 9,559 2.9 0.5
Northern Midlands 12,688 5,126 2.5 6,903 1.3 0.5
Sorell 13,397 583 23.0 8,534 14.6 0.6
Waratah-Wynyard 14,327 3,526 4.1 7,494 2.1 0.5
West Tamar 22,787 690 33.0 10,943 15.9 0.5
Break O'Day 6,441 3,521 1.8 6,342 1.8 1.0
Central Highlands 2,348 7,976 0.3 3,674 0.5 1.6
Circular Head 8,379 4,891 1.7 4,778 1.0 0.6
Dorset 7,106 3,223 2.2 5,137 1.6 0.7
Flinders 804 1,994 0.4 1,163 0.6 1.4
George Town 6,906 653 10.6 4,373 6.7 0.6
Glamorgan Spring Bay 4,407 2,522 1.7 5,554 2.2 1.3
Latrobe 10,199 600 17.0 5,596 9.3 0.5
Southern Midlands 6,258 2,611 2.4 3,537 1.4 0.6
Tasman 2,457 659 3.7 3,364 5.1 1.4
West Coast 4,908 9,575 0.5 4,661 0.5 0.9
Total 503,237 65,975 7.63 260,060
Average per
Council 18,638 2,444 64.5 9,632 30.4 0.7
Total 2010-11 499,674 66,114 7.6 268,420
Average per
Council 2010-11 18,506 2,449 64 9,941 31.0 0.7
Average Population per square kilometre for Tasmania
Average Rateable properties per square kilometre
Average Rateable properties per Head of Population
7.63
3.94
0.52
* Total and averages based on 25 councils' information, comparative information amended to reflect 25 councils.
Source Population figures derived from Australian Bureau of Statistics - Regional Population Growth, Australia 2009-10. Local Government areas taken from ABS website "2001 Census Community Profile Series" Statistics estimated at 30 June 2005. Rateable properties obtained from council
53Local Government Comparative Analysis
Attachment 2 – loCAl governMenT CoMPArATIve AnAlysIs employee Costs - 2011-12
* Operating revenue includes 2010 Financial Assistance Grant received in June 2009. ** Non operating revenue and expenditure include capital grants, contributed assets and revaluation and impairment adjustments. Also, Non operating revenue includes the net result of Financial Assistance Grant received in advance. *** Total and averages based on 27 councils' information, comparative information amended to reflect the 27 councils. # Operating costs per Rateable Valuation calculated on Council’s financial information excluding subsidiaries.
55Local Government Comparative Analysis
Attachment 3 – loCAl governMenT CoMPArATIve AnAlysIs Income statements - 2011-12 (continued)
* Operating grant revenue excludes 2012-13 Financial Assistance Grant received in June 2012, but includes 2011-12 Financial Assistance Grant received in June 2012. ** First year ratio has been included in Comparative Analysis # Operating costs per Rateable Valuation calculated on Council’s financial information excluding subsidiaries.
56 Local Government Comparative Analysis
Attachment 4 – loCAl governMenT CoMPArATIve AnAlysIs balance sheets - 2011-12
* First year information included in table. ** Total and averages based on 27 councils' information, comparative information amended to reflect the 27 councils.
57Local Government Comparative Analysis
Attachment 4 – loCAl governMenT CoMPArATIve AnAlysIs balance sheets - 2011-12 (continued)
The Copping Refuse Disposal Site Joint Authority (the Authority) was established as a joint authority under Section 30 of the Local Government Act 1993 and gazetted on 1 March 2001. The Authority trades under the name of Southern Waste Solutions.
The principal objectives of the Authority are to manage a putrescibles landfill disposal site which conforms to the Development Proposal and Environmental Management Plan and associated permit conditions issued by the then Environmental Management and Pollution Control Board. It must successfully manage the landfill disposal site business and balance area by:
• operating efficiently in accordance with sound commercial practice
• maximising the net worth of the Authority’s assets
• operating the site to maximise benefits to member councils.
The Authority is jointly owned by the Clarence City, Kingborough, Sorell and Tasman Councils. It also has long-term contracts for waste disposal and transport with Huon Valley and Break O’Day Councils and a contract for waste disposal with Glamorgan Spring Bay Council.
AudIT oF THe 2011-12 FInAnCIAl sTATeMenTs
Initial signed financial statements were received on 3 August 2012 with amended statements received on 28 September 2012 an unqualified audit report was issued on 30 September 2012.
The audit was completed satisfactorily with no major issues outstanding.
Key FIndIngs And develoPMenTs
new board
The Joint Authority members, including Participating and Owner Councils, delegated certain powers to a new Board. The new Board commenced on 19 March 2012 and the amended rules came into effect as at that date. The inaugural face-to-face meeting of the new Board was held on 23 March 2012. The Board has the power to set fees, charges, terms and conditions relating to work done, or services, goods or information supplied by it except any fee or charge referred to in section 205 of the Local Government Act 1993 or any rate or charge referred to in Part 9 of the Act.
debt reduction and operational needs payment
In July 2012 the participating Councils agreed to make a proportionate payment of $1.300m to the Authority for debt reduction and the operational needs of the Authority. This was to be paid by the Clarence, Sorell, Tasman and Kingborough Councils based on their respective shares in the Authority.
60 Copping Refuse Disposal Site Joint Authority
national Taxation equivalency regime (nTer)
From the 1 July 2011 the Authority was included under the NTER. The Authority recorded tax entries for the first time this year which gave rise to a direct adjustment to equity of $0.299m at 1 July 2011, income tax of $0.099m for 2011-12 and a defered tax asset of $0.201m and a defered tax liability of $2 000 at 30 June 2012.
Carbon pricing
The Clean Energy Act 2011 (the Act), introduced a carbon pricing mechanism effective 1 July 2012. In anticipation of the Act, the Authority commissioned two investigations into the impact of a carbon price on its operations. Modelling indicated that under a business as usual approach the site will meet and exceed the trigger threshold of 25 000 tonnes of carbon dioxide equivalent emissions by the 2014-15 financial year. The Authority is working to limit its potential liability under the Act. It will pass on any liability to its customers.
The Authority recorded a Net Profit of $0.330m in 2011-12, which was $0.464m better compared to the loss of $0.134m in the previous year. The improvement in the operating result was primarily due to:
• higher revenue, $0.858m, due to greater tonnage delivered and increased gate fees. These items increased because Kingborough had a full year of deliveries and delivery of low level contaminated soil from a mjaor company
• Depreciation increased by $0.145m. This reflected a full year’s depreciation on assets capitalised last year but also because landfill cell depreciation expense will increase as volume rises as was the case this year. Also, depreciation was allocated on a per tonne basis during 2010-11. Depreciation is allocated by multiplying the tonnage delivered per month by a standard rate. Under this approach, depreciation is based on when the useful lives of the cells, which will vary depending on how quickly they are filled
• Other expenses rose by $0.229m mainly due to $0.053m related to the installation of a gas collection system, break-ins and vandalism, $0.053m, unplanned repairs to items of plant and equipment including trailers of $0.033m and increased rates of $0.013m.
61Copping Refuse Disposal Site Joint Authority
2012 2011 2010 2009
$'000s $'000s $'000s $'000s
Cash and financial assets 577 133 441 777 Receivables 525 447 311 248 Other 5 8 67 223 Total Current Assets 1 107 588 819 1 248
Total Equity increased by $0.530m, being the Comprehensive Result for 2011-12, $0.231m, and deferred income tax recognised directly in equity of $0.299m.
The corresponding increase in Net Assets related to:
• higher Cash and financial assets, $0.444m, due to increased cash generated from operations, $0.494m
• inclusion of a balance for Deferred tax assets of $0.201m, resulting from the requirement for the Authority to pay tax under the NTER
• capitalised Property, plant and equipment decreased by $0.627m due mainly to the annual depreciation charge
• lower total borrowings of $0.392m due to loan repayments during the year.
62 Copping Refuse Disposal Site Joint Authority
FInAnCIAl AnAlysIs
Bench 2011-12 2010-11 2009-10 2008-09
Mark
Financial Performance
Profit (Loss) from operations ($'000s) 330 (134) (124) 44 Return on assets 4.5% (1.9%) (1.8%) 0.7%Return on equity* 15.0% 43.6% (24.0%) (18.0%) 6.0%
Financial Management
Current ratio >1 1.07 0.56 0.95 1.16 Indebtedness ratio 131.4% 179.0% 181.6% 212.3%
Debt to equity 565.9% 1 255.3% 916.1% 758.5%Debt to total assets 77.8% 84.1% 83.5% 79.0%Cost of debt 5.9% 6.0% 6.2% 6.3%
Debt collection 30 days 47 50 38 36 Creditor turnover 30 days 60 66 60 61
Capital expenditure/depreciation 25.1% 225.6% 120.4% 924.1%
Returns to ShareholdersDividend paid or payable ($'000s) 0 0 0 0
Other Information
Staff numbers (FTEs) 4.6 4.6 4.6 3.0 Average staff costs ($'000s) 101 95 77 78 Average leave balance per FTE ($'000s) 7 4 3 0 * Industry specific rate of return
Comment
The Authority generated a positive return on assets and equity for the first time in two years due to the Net Profit this year.
Current ratio was slightly above the benchmark in 2012 reflecting the higher cash levels.
Debt ratios were high reflecting the Authority was highly leveraged with the high level of debt used to fund infrastructure requirements. Debt to equity ratio returned to the average in the period under review following a peak in 2010-11 which resulted from lower equity, due to the loss incurred. Debt to Total Assets ratio, while decreasing slightly, stabilised and remained high also reflecting the highly geared nature of the business. Indebtedness ratio decreased in 2011-12 due to higher Operating revenue.
While Debt collection was worse than benchmark, there are no concerns over the collectability of debts. The high days reflected that more than one month’s charges were outstanding for a number of the Authority’s larger clients.
Creditor turnover was higher than the benchmark over the review period. This results from the Authority processing all payments in the first week of each month.
Capital expenditure to depreciation ratio was well below the preceding three years due to the large decrease in capital expenditure this year. The exceptionally high ratio in 2008-09 reflected the long term waste strategy capital expenditure. Due to the nature of the Authority’s operations, it was expected that the capital expenditure would not be constant on an annual basis.
63Cradle Coast Authority
CrAdle CoAsT AuTHorITy
InTroduCTIon
Cradle Coast Authority (the Authority) was established in 2000 as a Joint Authority under section 38 of the Local Government Act 1993 (the Act), by its participating Councils; Burnie City, Devonport City, Waratah-Wynyard, Central Coast, Latrobe, Kentish, Circular Head, King Island and West Coast. These municipal areas combine to form the Cradle Coast region.
The Authority’s aim is to identify areas of importance for economic development and to organise partnerships between the different levels of government, industry and community groups to address these areas throughout the Cradle Coast region.
The Authority is engaged in a range of regional initiatives including:
• Tourism
• Natural Resource Management (NRM)
• Health
• Industry development
• Education, Training and Workforce Development
• Transport
• Local Government
• any other issues identified by its Board or councils.
The Board has eight directors comprising business and community leaders who are appointed by the representative councils.
AudIT oF THe 2011-12 FInAnCIAl sTATeMenTs
Signed financial statements were received on 3 September 2012 and an unqualified audit report was issued on 18 October 2012. The Audit Act 2008 requires the Authority to provide to the Auditor-General financial statements on or before 15 August each year.
Other than the Authority failing to meet its statutory reporting deadline, the audit was completed with no major matters outstanding.
64 Cradle Coast Authority
AbrIdged sTATeMenT oF CoMPreHensIve InCoMe
Comment
The Authority recorded a Net Surplus of $0.055m in 2011-12, an improvement of $0.772m from the prior year. The movement was predominately due to:
• reduced Other expenses, $1.376m, which was primarily due to a reduction of $0.775m in expenditure between 2011-12 and 2010-11 for the Caring for our Country project. In addition, there were a number of smaller projects completed in 2010-11, that did not carry forward, offset by
• lower Government grants funding, $0.429m, due to;
○ a reduction in grant funding for the federally funded Caring for our Country project, $0.168m
○ funding received in 2010-11 under the T-QUAL grant program for the Integrated Tourism Development project, $0.216m.
2011-12 2010-11 2009-10 2008-09
$'000s $'000s $'000s $'000s
Government grants 3 343 3 772 3 362 4 124 Council contributions 896 863 795 828 Other Income 679 655 1 045 785 Total Revenue 4 918 5 290 5 202 5 737
The Authority’s current ratio was above benchmark in all years under review which indicates that it was able to meet all short-term financial commitments.
Average staff costs increased in 2011-12 due to higher leave provisions and staff promotions.
Total Equity increased by $0.055m in 2011-12 in line with the Net Surplus. Net Assets increased by a corresponding amount to $2.572m. Reasons for major line item movements included:
• lower Payables of $0.206m, mainly due to a number of larger grant project invoices included in the 2010-11 balance
• reduced Receivables of $0.141m, predominantly due to a number of larger invoices outstanding at 30 June 2011 relating to grant funding and other project contributions.
The majority of the Authority’s cash balance at 30 June 2012 comprised unexpended grant funds, relating to projects carried forward to 2012-13.
FInAnCIAl AnAlysIs
66 Dulverton Regional Waste Management Authoriity
dulverTon regIonAl wAsTe MAnAgeMenT AuTHorITy
InTroduCTIon
The Dulverton Regional Waste Management Authority was established as a joint authority under Section 38 of the Local Government Act 1993 effective 1 January 1995. The Authority was established for the purpose of conducting a licensed waste disposal landfill.
The Devonport City, Central Coast, Latrobe and Kentish Councils are the four participants in the Authority.
AudIT oF THe 2011-12 FInAnCIAl sTATeMenTs
Signed financial statements were received on 15 August 2012. An unqualified audit report was issued on 28 September 2012.
The audit was completed satisfactorily with no major issues outstanding.
Key FIndIngs And develoPMenTs
Carbon pricing
The Clean Energy Act 2011 (the Act), introduced a carbon pricing mechanism, effective 1 July 2012.
In anticipation of the Act, the Authority undertook an investigation into the impact of a carbon price on its operations. A consultant was appointed to estimate the carbon tax implications resulting from the disposal of waste in the landfill facility.
The report indicated that the Authority’s ability to pay the proposed carbon price, or purchase emissions permits under the subsequent emissions trading scheme, could be mitigated if a landfill gas capture system was implemented.
Consequently, in 2012-13, the Authority expects to establish infrastructure to capture 50% of its landfill emissions. The Authority considers it can minimise overall landfill emissions below the 25 000 tonne annual threshold within the Act and avoid the payment of a carbon price.
67Dulverton Regional Waste Management Authoriity
sTATeMenT oF CoMPreHensIve InCoMe
Comment
In 2011-12 the Authority recorded a Net Profit from operations of $1.107m (2010-11, $0.216m), an increase of $0.891m. The improved result was primarily due to:
• higher Operating revenue of $0.704m, due to additional waste received from the demolition of two large industrial sites in Burnie and Devonport
• lower Other expenses of $0.303m, mainly due to:
○ savings in leachate costs. The construction of a pump station and pipeline removed the need to use trucks to transport the leachate to Cradle Mountain Water’s sewerage system
○ lower general repairs and maintenance costs in 2011-12 as a number of these tasks were undertaken by site staff.
The Rehabilitation provision was reassessed during the year resulting in an increase to the provision of $0.135m, compared with $0.182m in the prior year. Further details about this provision are included in the Statement of Financial Position section of this Chapter.
The Authority’s Comprehensive income for 2011-12 was $0.724m, after accounting for an upward revaluation of assets of $0.085m for land, buildings and improvements.
Net Profit from operations before 1 107 216 465 625
Income tax expense ( 333) ( 66) ( 166) ( 236)Net Profit after taxation 774 150 299 389
Rehabilitation provision reassessment (net of tax) ( 135) ( 182) 87 160 Net Profit (Loss) for the year 639 ( 32) 386 549
Other comprehensive income
Revaluation increment net of tax 85 135 432 122 Comprehensive income 724 103 818 671
68 Dulverton Regional Waste Management Authoriity
Comment
For the reasons outlined in the Statement of Comprehensive Income section of this Chapter, Total Equity increased by $0.724m. Net Assets increased in 2012 by the same amount to $5.457m. Reasons for major line item movements included:
• increased Cash of $0.925m, with cash from operations, $1.642m, proceeds from sale of Property, plant and equipment, $0.194m, and proceeds from borrowings, $1.740m, being more than sufficient to fund payments for Property, plant and equipment of $2.157m and the repayment of borrowings, $0.494m
• increased Property, plant and equipment of $1.699m due to:
○ revaluation increments of $0.122m
○ additions of $2.157m, offset by
○ depreciation expense of $0.365m
○ disposals of $0.215m
• increased Borrowings of $1.246m due to:
○ new loans of $1.740m for development of a new landfill cell, offset by
• increased Payables of $0.311m due to an increase in site maintenance and contractor costs outstanding at 30 June 2012
• increased rehabilitation provisions of $0.193m as a result of the upwards reassessment of this provision. The Authority recorded $0.720m of the liability as current, as it anticipated it will remediate cell four, which will be closed in November 2012 to allow work to be undertaken in summer.
rehabilitation Provision
The rehabilitation provision includes two components – rehabilitation and aftercare. These provisions are required to ensure long-term environmental sustainability.
The aftercare provision is to cover the cost of maintaining the site for a period of 20 years after closure. The provision is to cover monitoring, management, financing of contingent liabilities and maintenance.
Rehabilitation only includes costs associated with of the currently utilised portion (or cell) of the landfill. This occurs progressively as cells are completed. The environmental protection notice requires rehabilitation on a two yearly basis.
As a result, the Authority must review future costs and discount the provision for rehabilitation and aftercare to present value each year.
70 Dulverton Regional Waste Management Authoriity
Comment
Operating surplus ratio indicates the Authority achieved profits from operations in each year under review and generated sufficient revenue to fulfil its operating requirements, including loan interest repayments and depreciation charges.
Current ratio has been above benchmark in all years under review and shows the Authority has sufficient funds to meet all it current liabilities. However, the ratio declined steadily over the four years with the decline at 30 June 2012 mainly due to $0.720m of the Rehabilitation provision reported as a current liability whereas in prior years none of the obligation was reported as current.
Debt to Equity increased over the four year period, with debt at 30 June 2012 being slightly above 60% of total equity. The Authority may need to review this trend. Although debt increased, Cost of Debt has reduced, with interest rates applicable to borrowings decreasing over the period.
Employee costs as a percentage of operating expenses is low and has remained fairly stable over the period. The majority of work on site is undertaken by an external contractor. Employee costs relate to management and administration.
The Authority has not paid any dividends since 2008-09 because it has elected to invest in infrastructure. The Authority’s five year plan indicates a recommencement of dividend payments in 2014-15. Tax equivalent payments have been made on annual surpluses and are paid to the owner councils.
Bench 2011-12 2010-11 2009-10 2008-09
Mark
Financial ratios
Profitability
Operating surplus ratio > 0 0.17 0.04 0.10 0.21
Operational efficiency
Current ratio 1:1 1.15 1.88 1.93 2.47 Debt to Equity 60.2% 43.1% 23.8% 21.5%Cost of Debt 5.3% 6.5% 7.0% 7.0%
Employee costs as a % of operating expenses 5.19% 4.73% 5.30% 7.97%
Returns to Shareholders
Dividends paid or payable ($'000s) 0 0 0 74 Tax equivalents paid or payable ($'000s) 366 92 211 90Total returns to shareholders ($'000s) 102 210 205 348 Total return to equity ratio 1.9% 4.4% 4.4% 9.0%
FInAnCIAl AnAlysIs
71Northern Tasmania Regionall Development Board Ltd
norTHern TAsMAnIA regIonAl develoPMenT boArd lTd
InTroduCTIon
The Northern Tasmania Regional Development Board Ltd (the Board) was established as a Company in 1992. It is owned by eight shareholders being Break O’Day, Dorset, Flinders, George Town, Launceston City, Meander Valley, Northern Midlands and West Tamar Councils.
The principal activity of the Board is to identify and facilitate economic and community development opportunities for the benefit of the residents of Northern Tasmania. The Board provides tourism development and marketing for Northern Tasmania and it manages projects which are either funded by shareholder councils, or by State or Federal governments.
AudIT oF THe 2011-12 FInAnCIAl sTATeMenTs
Initial signed financial statements were received on 15 September 2012, with amended statements received on 23 October 2012. An unqualified audit report was issued on 28 October 2012.
Key FIndIngs And develoPMenTs
In 2011, the Board commenced a review of its structure. At 30 June 2012, the Board was in the process of establishing an incorporated association, which will operate as Northern Tasmania Development. The company will be wound up and the assets and liabilities transferred to the association. The new entity will continue to rely on contributions from the eight member councils and other government grants.
Other than the Authority’s failure to meet the statutory reporting deadline, the audit was completed satisfactorily with no major items outstanding.
FInAnCIAl resulTs
The Board recorded a Surplus before Income Tax of $0.017m in 2011-12 compared with $0.065m in 2010-11. The decline was mainly due to decreased government grant funding for specified projects. After accounting for an Income tax benefit of $0.029m (2010-11, expense of $0.017m), the Board achieved a Net Surplus of $0.046m ($0.048m).
In 2011-12, the Board’s Total Equity increased by $0.046m, represented by the Net Surplus.
The Board had a working capital surplus of $0.193m at 30 June 2012 (2011, $0.178m) which indicates it should be able to meet its short-term financial commitments.
72 Northern Tasmania Regionall Development Board Ltd
AbrIdged sTATeMenT oF CoMPreHensIve InCoMe
Comment
The Board recorded surpluses before income tax totalling $0.082m in the two years to 30 June 2012, compared with deficits totalling $0.166m in the first two years under review. The improved financial performance was mainly due to a strategic review during 2009-10 which resulted in the decision to reduce focus on project areas.
The strategic review also resulted in:
• less funding being required from councils with their contributions reduced by $0.154m in 2009-10
• a reduction in permanent staffing, with Employee expenses down by $0.228m in 2009-10 and a further $0.260m in 2010-11
• a reduction in Contractor costs of $0.111m in 2010-11 and a further $0.058m in 2011-12.
The main movements in 2011-12 were as follows:
• revenue from Government grants decreased by $0.386m, predominantly due to the receipt of $0.412m in 2010-11 for the Northern Regional Planning Initiative project. The project, which was funded by the State Government and managed by the Board, was a major undertaking in 2010-11. In 2011-12, the Board received funding of $0.050m for regional planning implementation
• Project expenses decreased by $0.217m, which reflected the reduction in government grant revenue and the Regional Planning Initiative project nearing completion
• Contractor costs decreased by $0.058m due, in part, to the executive officer role being outsourced for half the year in 2010-11 and the administration officer role being outsourced for the full year in 2010-11
• Other expenses decreased by $0.051m due mainly to a reduction of $0.025m in occupancy expenses as a result of the office relocation in late 2010-11 following the downsizing. Rent charges were reduced and costs such as electricity and cleaning were no longer borne by the Board.
After accounting for income tax, the Board recorded a Net Surplus of $0.046m (2010-11, $0.048m). The Income tax benefit of $0.074m in 2009-10 included bringing to account tax losses.
2011-12 2010-11 2009-10 2008-09
$'000s $'000s $'000s $'000s
Government grants 176 562 558 616 Council contributions 397 400 393 547 Other revenue 58 40 81 99 Total Revenue 631 1 002 1 032 1 262
Surplus (Deficit) before Income Tax 17 65 ( 113) ( 53)
Income Tax Benefit (Expense) 29 ( 17) 74 31
Net Surplus (Deficit) 46 48 ( 39) ( 22)
73Northern Tasmania Regionall Development Board Ltd
Comment
For the reasons outlined in the Abridged Statement of Comprehensive Income section of this Chapter, Total Equity increased by $0.046m in 2011-12.
Net Assets increased by a corresponding amount to $0.204m. The main movements included:
• a decrease in Cash of $0.153m, as project funding received in the prior year was expended
• a decrease in Payables of $0.137m, due mainly to reduced project funding and accounting fees outstanding at 30 June
• deferred tax balances were not recognised at 30 June 2012 due to the Board’s impending restructure, which will include applying for tax exemption. The Board does not expect to be liable for income tax in future years.
At 30 June 2009 and 2010, the Board recorded Income in advance as liabilities of $0.331m and $0.059m, respectively. These liabilities related to unspent specific purpose grant funding. As there was no obligation at reporting date to refund unspent monies for uncompleted projects, these liabilities should not have been recorded. The 2011-12 financial statements, including the 2010-11 comparatives, were restated to reflect the correct accounting treatment. The impact on the 2010-11 financial statements was to eliminate the Income in advance liability of $0.105m, increase revenue from Government grants by $0.046m, increase Income tax expense by $0.014m and increase the net deferred tax liability by $0.032m. The net impact on Equity of $0.073m was comprised of an increase in Reserves of $0.105m (representing the balance of unspent grant funds previously recorded as a liability) and a decrease in Retained earnings of $0.032m (representing the increased tax liability).
74 Northern Tasmania Regionall Development Board Ltd
Comment
The Board’s current ratio was above benchmark in all years under review which indicates that it was able to meet all short-term financial commitments.
The lower staff numbers in 2009-10 and 2010-11 were a direct outcome of the strategic review undertaken in 2010, as outlined in the Abridged Statement of Comprehensive Income section of this Chapter. Average staff costs reduced in 2009-10 due to the staffing changes made as part of the strategic review.
The Southern Tasmanian Councils Authority (the Authority) was created on 1 July 2006 under section 29 of the Local Government Act 1993.
The Authority operates as a Joint Authority of the twelve Southern Tasmanian Councils (Councils). The functions of the Authority are to enable members to work together to facilitate and coordinate agreed regional development strategies and actions to achieve sustainable economic, environmental and social outcomes for the southern region of Tasmania.
The Authority is funded by Councils’ contributions and operational grants for specific activities undertaken. The Authority had two joint Chief Executive Officers and several Project Officers as at 30 June 2012. Hobart City Council provided employment and accounting services.
AudIT oF THe 2011-12 FInAnCIAl sTATeMenTs
Signed financial statements were received on 15 August 2012 and an unqualified audit report was issued on 17 September 2012.
The audit was completed satisfactorily with no major items outstanding.
Key FIndIngs And develoPMenTs
For reasons outlined in this Chapter, the Authority operated at a deficit of $0.411m in 2011-12. This had the effect of reducing the Authority’s Net Assets and Equity from $0.798m at 30 June 2011 to $0.387m at 30 June 2012. Another deficit of this magnitude will see the Authority with negative equity, a matter it needs to keep under review.
CoMPreHensIve InCoMe sTATeMenT
2011-12 2010-11$'000s $'000s
Government grants 622 788 Contributions by member Councils' 359 245 Other income 37 106 Total Revenue 1 018 1 139
The Authority is a not-for-profit entity and operates on a break-even basis. There is no expectation of dividends or taxation equivalent returns from its activities.
In 2011-12 the Authority incurred a Net Deficit of $0.411m, which was $0.621m worse than prior year. This was due to an increase in Total Expenses, $0.500m, and decline in Total Revenue, $0.121m. The reasons for the movements were primarily due to:
• additional external consultancy fees, $0.383m, and external labour costs, $0.075m, required for several projects, with the majority of additional expenditure associated to the Climate Change and Aerial Photography projects
• lower Operational Grants, $0.166m, due to reduced funding of multiple projects, and lower Other Income, $0.069m, due to a one-off receipt in 2010-11 from Southern Water to assist with the costs of the Aerial Photography project. These revenue reductions were partially offset by higher Council Contributions, $0.114m, for the purpose of completing a project that was ineligible for further Government funding.
sTATeMenT oF FInAnCIAl PosITIon
Comment
Total Equity decreased by $0.411m, which represented the Authority’s Net Deficit. Total Assets comprised predominately Cash, $0.367m (2010-11, $0.739m) and receivables, $0.079m ($0.085m). The decrease in the cash balance, $0.372m, was attributable to cash used to fund operating activities.
Total Liabilities increased by $0.027m, reflected by an increase in Payables of $0.030m, and offset slightly by a decrease in Employee Provisions of $0.003m. The increase in Payables was primarily due to unpaid invoices relating to consultancy fees, $0.019m, and website development, $0.005m.
2012 2011$'000s $'000s
Cash 367 739Receivables 79 85Total Current Assets 446 824
Property, plant and equipment 4 10Total Non-Current Assets 4 10
Net Assets 387 798
Total Equity 387 798
77Southern Waste Strategy Authority
souTHern wAsTe sTrATegy AuTHorITy
InTroduCTIon
The Southern Waste Strategy Authority (the Authority) is a joint authority established under the Local Government Act 1993. The Authority is a body corporate, whose powers and functions are specified in its rules, as adopted by the member Councils. The members of the Authority represent all twelve Southern Tasmanian councils. Each member Council appoints a councillor to represent it and vote on its behalf at general meetings of the Authority. The purpose of the Authority is to facilitate integrated regional strategic waste planning in Southern Tasmania and implementation thereof.
AudIT oF THe 2011–12 FInAnCIAl sTATeMenTs
Signed financial statements were received on 17 July 2012 and an unqualified audit report was issued on 22 August 2012. The audit was completed satisfactorily with no major items outstanding.
suMMAry oF FInAnCIAl resulTs
Comment
In 2011-12 the Authority recorded a Net Deficit of $0.034m, which was an improvement of $0.044m from last year. This improvement was primarily due to decreased Total Expenses of $0.061m attributable to a reduction in consultants expenditure, $0.058m, being a one-off review conducted in the prior year into waste management practices in Southern Tasmania.
Net Assets reduced by $0.035m, predominantly caused by the Authority withdrawing $0.025m from its term deposits to fund its operations because of continued deficits.
The Authority’s main sources of revenue are from its member councils. Deficits are funded by member Councils’ annual contributions and cash reserves. The Authority had budgeted for the deficits and has a plan to reduce them through cost reduction strategies.
2011-12 2010-11$'000s $'000s
Total Revenue 321 338 Total Expenses 355 416 Net Surplus (Deficit) (34) (78)
2012 2011
Total Assets 201 230 Total Liabilities 50 44 Net Assets 151 186
Total Equity 151 186
78 Appendix 1 - Guide to Using This Report
APPendIx 1 - guIde To usIng THIs rePorT
This Report is prepared under section 29 of the Audit Act 2008 (the Audit Act), which requires the Auditor-General, on or before 31 December in each year, to report to Parliament in writing on the audit of State entities and audited subsidiaries of State entities in respect of the preceding financial year. The issue of more than one report entitled the Auditor-General’s Report on the Financial Statements of State Entities, comprising six volumes, satisfies this requirement each year. The volumes are:
• Volume 1 – Analysis of the Treasurer’s Annual Financial Report
• Volume 2 – Executive and Legislature, Government Departments, other General Government State entities, other State entities and Superannuation Funds
• Volume 3 – Government Business Enterprises, State Owned Corporations and Water Corporations
• Volume 4 – Local Government Authorities
• Volume 5 - Other State entities 31 December, including University of Tasmania.
Where relevant, State entities are provided with the opportunity to comment on any of the matters reported. Where they choose to do so, responses are detailed within that particular section.
79Appendix 1 - Guide to Using This Report
ForMAT oF THe FInAnCIAl AnAlysIs
Each entity’s financial performance is analysed by discussing the Comprehensive Income Statement, Statement of Financial Position and Statement of Cash Flows supplemented by financial analysis applying the indicators documented in the Financial Performance sections of this Report. The layout of some of these primary statements has been amended from the audited statements to, where appropriate:
• make the statements more relevant to the nature of the entity’s business
• highlight the entity’s working capital, which is a useful measure of liquidity.
Departments are required to present budget amounts on the face of their primary statements. As a consequence details and commentary in relation to these amounts have been included in this Report.
FInAnCIAl AnAlysIs
The following tables illustrate the methods of calculating:
• performance indicators used in the individual financial analysis sections of this Report, together with a number of benchmarks used to measure financial performance
Financial Performance Indicator Benchmark1 Method of Calculation
Financial Performance
Earnings Before Interest and Tax (EBIT) ($'000s)
Result from Ordinary Activities before Gross Interest Expense and Tax
EBITDA ($’000s)Result from Ordinary Activities before
Gross Interest Expense, Tax, Depreciation and Amortisation
Operating margin >1.0Operating Revenue divided by Operating
Expenses
Operating surplus (deficit) ($'000s)
Result from Operating Revenues less Operating Expenses
Operating surplus ratio >0Net operating surplus (deficit) divided by
total operating revenue
Own source revenueTotal Revenue less Total Grant Revenue,
Contributed Assets and Asset Revaluation Adjustments
Return on assets EBIT divided by Average Total Assets
Return on equityResult from Ordinary Activities after
Taxation divided by Average Total Equity
Self financing ratioNet Operating Cash Flows divided by
Operating Revenue
80 Appendix 1 - Guide to Using This Report
Financial Performance Indicator Benchmark1 Method of Calculation
Financial Management
Asset consumption ratioBetween 40%
and 80%
Depreciated replacement cost of asset (eg. infrastructure, roads, bridges) divided by current replacement cost of asset
Asset renewal funding ratio 90%-100%Future (planned) asset replacement
expenditure divided by future asset replacement expenditure (actual) required
Asset sustainability ratio >100%Renewal and upgrade expenditure on
existing assets divided by depreciation on existing assets
Capital Investment Gap, Asset investment ratio or Investment gap
>100%Payments for Property, plant and equipment
divided by Depreciation expenses
Capital Replacement Gap, Asset renewal ratio or Renewal gap
100%Payments for Property, plant and equipment
on existing assets divided by Depreciation expenses
Cost of debtGross Interest Expense divided by Average
Borrowings (include finance leases)
Creditor turnover 30 daysPayables divided by credit purchases
multiplied by 365
Current ratio >1 Current Assets divided by Current Liabilities
Debt collection 30 daysReceivables divided by billable Revenue
multiplied by 365
Debt to equity Debt divided by Total Equity
Debt to total assets Debt divided by Total Assets
Indebtedness RatioNon-Current Liabilities divided by Own
Source Revenue
Interest coverage ratioNet operating cashflows less interest and
Liquidity ratio 2:1Liquid assets divided by current liabilities
other than provisions
Net financial assets (liabilities)($’000s)
Total financial liabilities less liquid assets
Net financial liabilities ratio 0 – (50%)Total liabilities less liquid assets divided by
total operating income
81Appendix 1 - Guide to Using This Report
Financial Performance Indicator Benchmark1 Method of Calculation
returns to government
CSO funding ($’000)Amount of community service obligation
funding received from Government
Dividend payout ratio 50%Dividend divided by Result from Ordinary
Activities after Tax
Dividend to equity ratioDividend paid or payable divided by Average
Total Equity
Dividends paid or payable ($'000s)
Dividends paid or payable that relate to the year subject to analysis
Effective tax rate 30%Income Tax paid or payable divided by
Result form Ordinary Activities before Tax
Government guarantee fees ($’000)
Amount of guarantee fees paid to owners (usually Government)
Income tax paid ($'000s)Income Tax paid or payable that relates to
the year subject to analysis
Total return to equity ratio Total Return divided by Average Equity
Total return to the State ($'000s) or total return to owners
Dividends plus Income Tax and Loan Guarantee fees
other Information
Average leave per FTE ($'000s)Total employee annual and long service
leave entitlements divided by Staff Numbers
Average long service leave balance
Not more than 100 days
Actual long service leave provision days due divided by average FTE’s
Average recreational leave balance
20 days 3
Actual annual leave provision days due divided by average FTE’s
Average staff costs (2)
($'000s)
Total employee expenses (including capitalised employee costs) divided by Staff Numbers
Employee costs (2)
as a % of operating expenses
Total employee costs divided by Total Operating Expenses
Employee costs capitalised ($'000s)
Capitalised employee costs
Employee costs expensed ($'000s)
Total employee costs per Income Statement
Operating cost to rateable property
Operating expenses plus finance costs divided by rateable properties per valuation roll
Rates per capitaPopulation of council area divided by rates
revenue
82 Appendix 1 - Guide to Using This Report
Financial Performance Indicator Benchmark1 Method of Calculation
Rates per operating revenueTotal rates divided by operating revenue
including interest income
Rates per rateable propertyTotal rates revenue divided by rateable
properties per valuation rolls
Staff numbers FTEs Effective full time equivalents
1 Benchmarks vary depending on the nature of the business being analysed. For the purposes of this Report, a single generic benchmark has been applied. 2 Employee costs include capitalised employee costs, where applicable, plus on-costs.3 May vary in some circumstances because of different award entitlements.
An explanation of most financial performance indicators is provided below:
FInAnCIAl PerForMAnCe• Earnings before interest and tax (EBIT) – measures how well an entity can earn a
profit, from its operations, regardless of how it is financed (debt or equity) and before it has to meet external obligations such as income tax. This is a measure of how well it goes about its core business.
• Earnings before income tax, depreciation and amortisation (EBITDA) – measures how well an entity can generate funds without the effects of financing (debt or equity), depreciation and amortisation and before it has to meet external obligations such as income tax. This measure is of particular relevance in cases of entities with large amounts of non-current assets as the distortionary accounting and financing effects on the entity’s earnings are removed, enabling comparisons to be made across different entities and sectors.
• Operating margin – this ratio serves as an overall measure of operating effectiveness.
• Operating Surplus (Deficit) or Result from operations – summarises revenue transactions and expense transactions incurred in the same period of time and calculates the difference.
• Operating surplus ratio – a positive result indicates a surplus with the larger the surplus the stronger surplus and therefore stronger assessment of sustainability. However, too strong a result could disadvantage ratepayers. A negative result indicates a deficit which cannot be sustained in the long-term.
• Own source revenue – represents revenue generated by a council through its own operations. It excludes any external government funding, contributed assets and revaluation adjustments.
• Return on assets – measures how efficiently management used assets to earn profit. If assets are used efficiently, they earn profit for the entity. The harder the assets work at generating revenues, and thus profit, the better the potential return for the owners.
• Return on equity – measures the return the entity has made for the shareholders on their investment.
• Self financing ratio – this is a measure of council’s ability to fund the replacement of assets from cash generated from operations.
83Appendix 1 - Guide to Using This Report
FInAnCIAl MAnAgeMenT• Asset consumption ratio – shows the depreciated replacement cost of an entity’s
depreciable assets relative to their “as new” (replacement) value. It therefore shows the average proportion of new condition left in the depreciable assets.
• Asset renewal funding ratio – measures the capacity to fund asset replacement requirements. An inability to fund future requirements will result in revenue, expense or debt consequences, or a reduction in service levels. This is a most useful measure relying on the existence of long-term financial and asset management plans.
• Asset sustainability ratio – provides a comparison of the rate of spending on existing infrastructure, property, plant and equipment through renewing, restoring and replacing existing assets, with depreciation. Ratios higher than 100% indicate that spending on existing assets is greater than the depreciation rate. This is a long-term indicator, as capital expenditure can be deferred in the short-term if there are insufficient funds available from operations and borrowing is not an option.
• Capital Investment Gap, Asset investment ratio or Investment gap – indicates whether the entity is maintaining its physical capital by reinvesting in or renewing non-current assets (caution should be exercised when interpreting this ratio for entities with significant asset balances at cost as the level of depreciation may be insufficient).
• Capital Replacement Gap, Asset renewal ratio or Renewal gap – indicates whether the entity is maintaining its physical capital by reinvesting in or renewing existing non-current assets (caution should be exercised when interpreting this ratio as the amount of capital expenditure on existing assets has largely been provided by the respective councils and not subject to audit).
• Cost of debt – reflects the average interest rate applicable to debt.
• Creditors turnover – indicates how extensively the entity utilises credit extended by suppliers.
• Current ratio – current assets should exceed current liabilities by a ‘considerable’ margin. It is a measure of liquidity that shows an entity’s ability to pay its short term debts.
• Debt collection – indicates how effectively the entity uses debt collection practices to ensure timely receipt of monies owed by its customers.
• Debt to equity – an indicator of the risk of the entity’s capital structure in terms of the amount sourced from borrowings and the amount from Government.
• Debt to total assets – an indicator of the proportion of assets that are financed through borrowings.
• Interest cover – EBIT – an indicator of the ability to meet periodic interest payments from current profit (before interest expense). The level of interest cover gives a guide of how much room there is for interest payments to be maintained in the face of interest rate increases or reduced profitability.
• Interest cover – Funds from operations – examines the exposure or risk in relation to debt, an indicator of the ability to meet periodic interest payments from funds from operations (before interest expense). The level of interest cover gives a guide of how much room there is for interest payments to be maintained in the face of interest rate increases or reduced funds from operations.
• Net financial liabilities ratio – indicates the extent to which net liabilities can be met by operating income. A falling ratio indicates that the entity’s capacity to meet its financial obligations from operating income is weakening.
84 Appendix 1 - Guide to Using This Report
reTurns To governMenT• Dividend payout ratio – the amount of dividends relative to the entity’s net income.
• Dividend to equity ratio – the relative size an entity’s dividend payments to shareholders’ equity. A low dividend to equity ratio may indicate that profits are being retained by the entity to fund capital expenditure.
• Dividends paid or payable – payment by the entity to its shareholders (whether paid or declared as a payable).
• Effective tax rate – is the actual rate of tax paid on profits.
• Income tax paid – tax payments by the entity to the State in the year.
• Total return to equity ratio – measures the Government’s return on its investment in the entity.
• Total return to the State – is the funds paid to the Owners consisting of income tax, dividends and guarantee fees.
oTHer InForMATIon• Average leave balance per FTE ($’000s) – indicates the extent of unused leave at balance
date.
• Average long service leave balance or days long service leave due – records the average number of days long service leave accumulated per staff member. In general public servants cannot accrue more than 100 days annual leave.
• Average recreational leave balance or days annual leave due – records the average number of days annual leave accumulated per staff member. In general public service employees accrue 20 days annual leave per annum.
• Average staff costs – measures the average cost of employing staff in the entity for the year.
• Employee costs as a percentage of operating expenses - indicates the relative significance of employee costs compared to other operating expenses.
• Employee costs capitalised ($’000s) – represents employee costs that have been capitalised rather than expensed.
• Employee costs expensed ($’000s) – represents the level of employee costs expensed, ie. included in the Income Statement. This together with the Employee costs Capitalised will provide a total employee cost figure for use in other related ratios.
• Staff numbers FTEs – as at the end of the reporting period the number of staff employed expressed as full-time equivalents (FTEs).
The above indicators are used because they are commonly applied to the evaluation of financial performance. Care should be taken in interpreting these measures, as by definition they are only indicators, and they should not be read in isolation.
85Appendix 2 - Audit Status
APPendIx 2 - AudIT sTATus
Enti
tyB
alan
ce D
ate
Fin
anci
al
Sta
tem
ent
dea
dline
Sig
ned
Fin
anci
al
Sta
tem
ents
R
ecei
ved
Re-
signed
/A
men
ded
Fin
anci
al
Sta
tem
ents
R
ecei
ved
Audit o
pin
ion
signed
< 8 weeks
8 to 10 weeks
10 to 12 weeks
12 to 14 weeks
14 to 16 weeks
> 16 weeks
LO
CA
L G
OV
ER
NM
EN
T A
UT
HO
RIT
IES
MA
JOR
CIT
Y
CO
UN
CIL
S
Cla
renc
e C
ity
Cou
ncil
30 Ju
ne 2
012
15 A
ugus
t 201
215
Aug
ust 2
012
7 Se
ptem
ber
2012
P
Gle
norc
hy C
ity
Cou
ncil
30 Ju
ne 2
012
15 A
ugus
t 201
215
Aug
ust 2
012
11 S
epte
mbe
r 20
12P
Hob
art C
ity
Cou
ncil
30 Ju
ne 2
012
15 A
ugus
t 201
215
Aug
ust 2
012
10 S
epte
mbe
r 20
12P
Laun
cest
on C
ity
Cou
ncil
30 Ju
ne 2
012
15 A
ugus
t 201
214
Aug
ust 2
012
14 S
epte
mbe
r 20
12P
ME
DIU
M C
OU
NC
ILS
Bri
ghto
n C
ounc
il 30
June
201
215
Aug
ust 2
012
15 A
ugus
t 201
226
Sep
tem
ber
2012
P
Bur
nie
Cit
y C
ounc
il30
June
201
215
Aug
ust 2
012
14 A
ugus
t 201
228
Sep
tem
ber
2012
P
Cen
tral
Coa
st C
ounc
il30
June
201
215
Aug
ust 2
012
15 A
ugus
t 201
220
Sep
tem
ber
2012
P
Der
wen
t Val
ley
Cou
ncil
30 Ju
ne 2
012
15 A
ugus
t 201
215
Aug
ust 2
012
28 S
epte
mbe
r 20
12P
Dev
onpo
rt C
ity
Cou
ncil
30 Ju
ne 2
012
15 A
ugus
t 201
215
Aug
ust 2
012
14 S
epte
mbe
r 20
12P
Huo
n V
alle
y C
ounc
il30
June
201
215
Aug
ust 2
012
14 A
ugus
t 201
227
Sep
tem
ber
2012
P
Kin
gbor
ough
Cou
ncil
30 Ju
ne 2
012
15 A
ugus
t 201
227
July
201
22
Aug
ust 2
012
P
Mea
nder
Val
ley
Cou
ncil
30 Ju
ne 2
012
15 A
ugus
t 201
215
Aug
ust 2
012
28 S
epte
mbe
r 20
12P
Nor
ther
n M
idla
nds C
ounc
il 30
June
201
215
Aug
ust 2
012
15 A
ugus
t 201
227
Sep
tem
ber
2012
P
Sore
ll C
ounc
il30
June
201
215
Aug
ust 2
012
15 A
ugus
t 201
226
Sep
tem
ber
2012
P
War
atah
-Wyn
yard
Cou
ncil
30 Ju
ne 2
012
15 A
ugus
t 201
215
Aug
ust 2
012
28 S
epte
mbe
r 20
12P
Wes
t Tam
ar C
ounc
il30
June
201
215
Aug
ust 2
012
13 A
ugus
t 201
231
Aug
ust 2
012
P
Fin
anci
al s
tate
men
tsT
imel
ines
s of
aud
it op
inio
n issu
e fr
om b
alan
ce d
ate
86 Appendix 2 - Audit Status
Enti
ty
Fin
anci
al
Sta
tem
ent
dea
dline
Fin
anci
al
Sta
tem
ent
dea
dline
Sig
ned
Fin
anci
al
Sta
tem
ents
R
ecei
ved
Re-
signed
/A
men
ded
Fin
anci
al
Sta
tem
ents
R
ecei
ved
Audit o
pin
ion
signed
< 8 weeks
8 to 10 weeks
10 to 12 weeks
12 to 14 weeks
14 to 16 weeks
> 16 weeksSM
ALL C
OU
NC
ILS
Bre
ak O
'Day
Cou
ncil
30 Ju
ne 2
012
15 A
ugus
t 201
216
Aug
ust 2
012
28 S
epte
mbe
r 20
121
Oct
ober
201
2P
Cen
tral
Hig
hlan
ds C
ounc
il30
June
201
215
Aug
ust 2
012
15 A
ugus
t 201
228
Sep
tem
ber
2012
P
Cir
cula
r H
ead
Cou
ncil
30 Ju
ne 2
012
15 A
ugus
t 201
215
Aug
ust 2
012
28 S
epte
mbe
r 20
12P
Dor
set C
ounc
il30
June
201
215
Aug
ust 2
012
14 A
ugus
t 201
228
Sep
tem
ber
2012
P
Flin
ders
Cou
ncil
30 Ju
ne 2
012
15 A
ugus
t 201
210
Sep
tem
ber
2012
31 O
ctob
er 2
012
6 N
ovem
ber
2012
P
Geo
rge
Tow
n C
ounc
il
30 Ju
ne 2
012
15 A
ugus
t 201
215
Aug
ust 2
012
28 S
epte
mbe
r 20
12P
Gla
mor
gan-
Spri
ng B
ay
Cou
ncil
30 Ju
ne 2
012
15 A
ugus
t 201
215
Aug
ust 2
012
28 S
epte
mbe
r 20
12P
Ken
tish
Cou
ncil
30 Ju
ne 2
012
15 A
ugus
t 201
29
Oct
ober
201
2P
Kin
g Is
land
Cou
ncil
30 Ju
ne 2
012
15 A
ugus
t 201
216
Aug
ust 2
012
P
Latr
obe
Cou
ncil
30 Ju
ne 2
012
15 A
ugus
t 201
215
Aug
ust 2
012
30 S
epte
mbe
r 20
12P
Sout
hern
Mid
land
s Cou
ncil
30 Ju
ne 2
012
15 A
ugus
t 201
215
Aug
ust 2
012
28 S
epte
mbe
r 20
12P
Tas
man
Cou
ncil
30 Ju
ne 2
012
15 A
ugus
t 201
215
Aug
ust 2
012
26 S
epte
mbe
r 20
1230
Sep
tem
ber
2012
P
Wes
t Coa
st C
ounc
il30
June
201
215
Aug
ust 2
012
13 A
ugus
t 201
25
Sept
embe
r 20
12P
LO
CA
L G
OV
ER
NM
EN
T B
USI
NESS
UN
ITS
Cop
ping
Ref
use
Dis
posa
l Site
Jo
int A
utho
rity
30 Ju
ne 2
012
15 A
ugus
t 201
23
Aug
ust 2
012
28 S
epte
mbe
r 20
1230
Sep
tem
ber
2012
P
Cra
dle
Coa
st A
utho
rity
30 Ju
ne 2
012
15 A
ugus
t 201
23
Sept
embe
r 20
1218
Oct
ober
201
2P
Dul
vert
on R
egio
nal W
aste
M
anag
emen
t Aut
hori
ty30
June
201
215
Aug
ust 2
012
15 A
ugus
t 201
228
Sep
tem
ber
2012
P
Nor
ther
n T
asm
ania
n D
evel
opm
ent B
oard
30 Ju
ne 2
012
15 A
ugus
t 201
215
Sep
tem
ber
2012
23 O
ctob
er 2
012
28 O
ctob
er 2
012
P
Sout
hern
Tas
man
ian
Cou
ncils
A
utho
rity
30 Ju
ne 2
012
15 A
ugus
t 201
215
Aug
ust 2
012
17 S
epte
mbe
r 20
12P
Sout
hern
Was
te S
trat
egy
Aut
hori
ty30
June
201
215
Aug
ust 2
012
17 Ju
ly 2
012
22 A
ugus
t 201
2P
Fin
anci
al s
tate
men
tsT
imel
ines
s of
aud
it op
inio
n issu
e fr
om b
alan
ce d
ate
87Appendix 3 - Acronyms and Abbreviations
APPendIx 3 - ACronyMs And AbbrevIATIons
BAC Burnie Airport Corporation Unit Trust
BSE Burnie Sports and Events
CDO Collateralised Debt Obligation
CPM Creative Paper Mills Pty Ltd
DHHS Department of Health and Human Services
EBA Enterprise Bargaining Agreement
FTE Full Time Equivalents
GASP! Glenorchy Art & Sculpture Park
KWS Kingborough Waste Services Pty Ltd
NTER National Tax Equivalency Regime
QVMAG Queen Victoria Museum and Art Gallery
TAFE TAFE TasmaniaTCU Tas Communications Unit Trust
88 Appendix 4 - Recent Reports
APPendIx 4 - reCenT rePorTs
TAbled no. TITle
May 2011 97 Follow of special reports 69–73
May 2011 Volume 5: Other State Entities 30 June 2010 and 31 December 2010, including University of Tasmania
Jun 2011 98 Premier’s Sundry Grants Program and Urban Renewal and Heritage Fund
Jun 2011 99 Bushfire management
Jun 2011 Volume 4 Part 1: Local Government Authorities and Business Units 2009–10
Jun 2011 Volume 4 Part 2: Local Government Authorities and Business Units 2009–10
Jul 2011 100 Financial and economic performance of Forestry Tasmania
Sep No. 1 of 2011–12 Tourism Tasmania: is it effective?
Sep No. 2 of 2011–12 Children in out of home care
Nov No. 3 of 2011–12 Financial Statements of State Entities: Volume 1 — Analysis of the Treasurer’s Annual Financial Report 2010–11
Nov No. 4 of 2011–12 Financial Statements of State Entities: Volume 2 — Executive and Legislature, Government Departments and other General Government Sector entities 2010–11
Nov No. 5 of 2011–12 Financial Statements of State Entities: Volume 3 — Government Business Enterprises, State Owned Companies, Water Corporations and Superannuation Funds 2010–11
Nov No. 6 of 2011–12 Financial Statements of State Entities: Volume 4 Part I — Local Government Authorities 2010–11
Dec No. 7 0f 2011–12 Financial Statements of State entities: Volume 5 — Other State Entities 30 June 2011 and 31 December 2010
Mar No. 8 of 2011–12 The assessment of land-use planning applications
Jun No. 9 of 2011–12 Financial Statements of State Entities: Volume 6 — Other State Entities 30 June 2011 and 31 December 2011
Jun No. 10 of 2011–12 Public Trustee: Management of minor trusts
Jun No. 11 of 2011–12 Updating the Motor Registry System
Jun No.12 of 2011–12 Follow up of special Reports 75–81
Jul No. 1 of 2012–13 Sale of TOTE Tasmania
Oct No. 2 of 2012-13 TasPorts: benefits of amalgamation
Auditor-General’s reports are available from the Tasmanian Audit Office. These and other published reports can be accessed via the Office’s homepage www.audit.tas.gov.au
To provide independent assurance to the Parliament and Community on the performance and accountability of the Tasmanian Public sector.Professionalism | Respect | Camaraderie | Continuous Improvement | Customer Focus
Strive | Lead | Excel | To Make a Difference
VISION AND PURPOSE
our vision
STRIVE | LEAD | EXCEL | TO MAKE A DIFFERENCE
our Purpose
To provide independent assurance to the Parliament and Community on the performance and accountability of the Tasmanian Public sector
Availability of reports
Auditor-General’s reports are available from the Tasmanian Audit Office, Hobart. This report and other recent reports published by the Office can be accessed via the Office’s home page. For further information please contact the Office.
MANDATESection 17(1) of the Audit Act 2008 states that:
“An accountable authority other than the Auditor-General, as soon as possible and within 45 days after the end of each financial year, is to prepare and forward to the Auditor-General a copy of the financial statements for that financial year which are complete in all material respects.”
Under the provisions of section 18, the Auditor-General:
“(1) is to audit the financial statements and any other information submitted by a State entity or an audited subsidiary of a State entity under section 17(1).”
Under the provisions of section 19, the Auditor-General:
“(1) is to prepare and sign an opinion on an audit carried out under section 18(1) in accordance with requirements determined by the Australian Auditing and Assurance Standards.
(2) is to provide the opinion prepared and signed under subsection (1), and any formal communication of audit findings that is required to be prepared in accordance with the Australian Auditing and Assurance Standards, to the State entity’s appropriate Minister and provide a copy to the relevant accountable authority.”
STANDARDS APPLIEDSection 31 specifies that:
“The Auditor-General is to perform the audits required by this or any other Act in such a manner as the Auditor-General thinks fit having regard to –
(a) the character and effectiveness of the internal control and internal audit of the relevant State entity or audited subsidiary of a State entity; and
(b) the Australian Auditing and Assurance Standards.”
The auditing standards referred to are Australian Auditing Standards as issued by the Australian Auditing and Assurance Standards Board.