95
Volume 44, No. 2, 2015 (ISSN: 1179-7924)
Volume 44, No. 2, 2015(ISSN: 1179-7924)
The New Zealand Journal of
Psychology
EDITOR
John Fitzgerald School of Psychology Massey University at Wellington
ASSOCIATE EDITORS
Neville BlampiedDepartment of Psychology University of Canterbury
Janet LeathemSchool of Psychology Massey University at Wellington
Bronwyn CampbellSchool of Māori Studies Massey University at Palmerston North
Harlene HayneDepartment of Psychology University of Otago
Michael O’DriscollDepartment of Psychology University of Waikato
BOOK REVIEW EDITOR
Iris Fontanilla Auckland DHB
© The material published in this issue is copyright to the New Zealand Psychologi-cal Society. Publication does not necessarily reflect the views of the Society.
The New Zealand Journal of Psychology is published online in three editions a year (articles will be posted as they become avail-able) by the New Zealand Psychological Society Inc.
Content may include manuscripts and shorter research notes in any substan-tive area of Psychology, and book reviews. Submitted manuscripts may be (1) empirical, (2) reviews of the literature, or (3) discus-sions of theoretical/conceptual frameworks of relevance to the practice of Psychology. Manuscripts will be considered for publica-tion if they (a) include data collected from New Zealand samples, or (b) discuss the relevance of issues contained in the manu-script to the New Zealand social and cultural context, or to the practice of Psychology in this country. For further clarification of these requirements, please contact the Editor. See Instructions to Authors on back page for preparation and submission of manuscripts and material.
SubscriptionsSubscription to the Journal is included in Membership dues for the Society. Non-members may subscribe at NZ$60.00 per volume/year (three issues), plus GST (NZ only) and postage (overseas). Subscrip-tion and advertising enquiries should be addressed to the:
Business Manager New Zealand Journal of Psychology
NZ Psychological Society Inc. (contact details below)
Production, Printing & Distribution Is managed by the National Office of the
NZ Psychological Society Inc. P.O. Box 25 271, Featherston Street, Wel-
lington 6146, New Zealand Ph (04) 473 4884; Fax (04) 473 4889
Email: [email protected]
CONTENTS
New Zealand Journal of
PsychologyVolume 44, Number 2, 2015
The Facebook Feedback Hypothesis of personality and social belonging
Samantha Stronge, Danny Osborne, Tim West-Newman, Marc S. Wilson, Petar Milojev, Lara M. Greaves, Chris G. Sibley
4
Culture as Cure? The Protective Function of Māori Cultural Efficacy on Psychological Distress
E. Muriwai, C. A. Houkamau, C. G. Sibley 14
Dimensions of Social Dominance: Their Personality and Socio-political Correlates within a New Zealand Probability Sample
Robin Bergh, Jim Sidanius, Chris G. Sibley
25
A survey of New Zealand psychologists’ practices with respect to the assessment of performance validity
Suzanne L Barker-Collo, Kris Fernando 35
Profiling the Fence-Sitters in New Zealand Elections: A Latent Profile Model of Political Voting Blocs
Lara M. Greaves, Danny Osborne, Chris G. Sibley
43
Incidence of Bullying and Victimisation among Adolescents in New Zealand
Moja Kljakovic, Caroline Hunt, Paul E. Jose
57
Using video self-modeling and the peer group to increase the social skills of a preschool child
Kristy Haslam Lemmon, Vanessa A. Green
68
Developing Mahi Oranga: A Culturally Responsive Measure of Māori Occupational Stress and Wellbeing
Lisa Stewart, Dianne Gardner 79
The Migrant Personality Revisited: Individual Differences and International Mobility Intentions
Aidan S. Tabor, Taciano L. Milfont, Colleen Ward
89

New Zealand Journal of Psychology Vol. 44 No. 2, September 2015• 4 •
S. Stronge, D. Osborne, T. West-Newman, M. S. Wilson, P. Milojev, L. M. Greaves, C. G. Sibley
The Facebook Feedback Hypothesis of personality and social belonging
Samantha Stronge, Danny Osborne, Tim West-Newman, Petar Milojev, Lara M. Greaves, Chris G. Sibley University of Auckland, New Zealand
Marc S. Wilson Victoria University, Wellington, New Zealand
The growing use of social networking sites raises important questions about the value of social media-based interaction. We test a novel Facebook Feedback Hypothesis of personality and social belonging in a national probability sample (N = 6,428), and show that Facebook usage is not equally beneficial to everyone. Our findings indicate that introverted people with a Facebook profile had lower levels of social capital (felt belongingness) than those without a profile. Extraverted people, in contrast, were higher in social capital regardless of whether or not they used Facebook. Other dimensions of Big-Five personality interacted with Facebook usage. This research raises concerns that new mediums of online social connection may be detrimental to those who are not highly oriented toward sociability.
Keywords: Big-Five personality, Facebook, social capital, belonging, extraversion, social networks.
Social networking sites such as Facebook are used daily by over 70% of the American online population (Duggan & Smith, 2013), and 65% of New Zealands online population (Bascand, 2013). Such sites sell themselves by claiming to help you “connect and share with the people in your life” (Facebook, 2014). The growing popularity of Facebook and other social networking sites is at the heart of a debate surrounding meanings of modern society, and how social networking may be affecting our sense of community, connectedness, and belonging. In his book Bowling Alone: America’s Declining Social Capital, Putnam (2000) argues that our collective social capital - the sum of our meaningful social ties with each other - is decreasing as evidenced by the weakening of our relationships with family, friends and community (Putnam, 2000). Such observations raise the question: is Facebook, and the growing use of online social media in general, helping, hindering or hurting the way we connect with each other? Here we seek to contribute to research examining this topical issue by focusing specifically
on whether the relationship between online social media usage and social capital differ across individuals, and are contingent upon the basic personality traits that regulate social interaction across numerous contexts. Put another way: is Facebook beneficial for some, but detrimental for others?
Like the use of any communication medium, social network use is not good or bad on its own, and so it is important to examine the individual differences of social network users and how these differences moderate psychosocial outcomes (McKenna & Bargh, 2000). In this research, we employ a large, nationally representative sample of adult New Zealanders to examine the possible interactions between Facebook use and the Five Factor Model of personality (Goldberg, 1990; McCrae & Costa, 1997) in predicting social capital outcomes. In particular, we examine Extraversion as it reflects the extent to which people invest in engagement in social endeavours, and reflects the traits of sociability, liveliness and exhibition (Ashton & Lee, 2007; Sibley et al., 2011). As Ashton and Lee (2007) argued, Extraversion should have
different adaptive benefits and costs, depending on one’s social environment. On the one hand, a high level of Extraversion should be beneficial to the extent that it helps facilitate social gains in the form of friends, mates, and alliances with others. On the other hand, a high level of Extraversion may also have costs in terms of expenditure of energy and time, and also increased risks from the social environment when interacting with unfamiliar others. Here, we examine the moderating effects of Extraversion on the relationship between Facebook usage and felt belongingness. Felt belongingness is a general measure of how included and accepted someone feels, and is widely used in the psychological literature as an indicator of social capital and connection with others (Baumeister & Leary, 1995).
How might Facebook usage be differentially related to the level of social capital enjoyed by extraverts and introverts? There are currently two major theories surrounding the use of social technology: the social enhancement hypothesis and the social compensation hypothesis (Kraut et al., 2002). The social enhancement perspective argues that individuals high in Extraversion will use social networking sites in the same way as they socialize offline, and thus will receive greater social benefits from the use of these sites relative to more introverted individuals (i.e., the ‘rich get richer’). According to this theory, the time and energy committed to interacting with others on social media should pay off for extraverts in much the same way as it does in other contexts.
T h e s o c i a l c o m p e n s a t i o n hypothesis, in contrast, argues that social networking sites afford those low in Extraversion a chance to make up for the relationships they struggle
• 5 •New Zealand Journal of Psychology Vol. 44 No. 2, September 2015
Personality, Facebook use, and felt belonging
to establish or maintain offline (i.e., ‘poor get richer’; Zywica & Danowski, 2008). Thus, according to this theory, online social media may change the balance of costs and benefits of social interaction, and reduce the risks from the social environment to the point where introverts may experience benefits on par with their more extraverted peers.
However, both of these hypotheses assume positive outcomes from Facebook use. Applying sociometer theory (Leary, Tambor, Terdal, & Downs, 1995), we propose an alternative ‘poor get poorer’ effect where introverted people who use Facebook will have lower feelings of belongingness than non-users, while extraverted people will not. We call this the Facebook Feedback Hypothesis. According to this hypothesis, exposure to a stream of information from other’s lives provides social cues to exclusion that can further decrease the lower levels of felt belongingness generally experienced by more introverted people.
Sociometer Theory and the Facebook Feedback Hypothesis
The belongingness hypothesis states that all humans have an evolved need to form and maintain intimate, long-term relationships (Baumeister & Leary, 1995); relationships that would have ensured survival through the protection of other group members. In order to track one’s inclusionary status in these relationships, an individual must continuously monitor cues relating to rejection and exclusion. Sociometer theory proposes that self-esteem, which largely reflects an individual’s beliefs about how others see them, fulfils this monitoring role. Cues to exclusion can be anything that make social exclusion appear possible to the individual, whether it is real, potential, or their own perception. Perceived social exclusion is said to cause a drop in state self-esteem that works in two ways: (a) as an affective mechanism that warns the individual about the change in their social status, and (b) as a motivating force to restore the individual’s social status or form new relationships (Leary et al., 1995). We argue that the Facebook newsfeed (a constantly updating list of posts from other Facebook users) becomes a set of cues to social exclusion. People’s
online social networks are much larger than their offline social networks (Acar, 2008), and Facebook users tend to share more social information online than offline, present their lives as more positive than they really are, and attempt to represent their ideal selves (Christofides, Muise, & Desmarais, 2009; Qiu, Lin, Leung, & Tov, 2012; Zhao, Grasmuck, & Martin, 2008). Thus Facebook users could be exposed to a stream of depictions of positive social interaction in other people’s lives that they would not normally see.
Thus, Facebook users who do not actively engage with their Facebook friends, but still passively consume information about other people’s social events, could experience a sense of decreased belonging. Bohn, Nuchta, Hornik and Mair (2014) examined data from over 400,000 Facebook users and concluded that access to social capital was most readily available to those who used active and directed communication. Though some have found gains in social support and social capital from Facebook use for shy users and users with low self-esteem (Baker & Oswald, 2010; Steinfield, Ellison, & Lampe, 2008), this is only true for those who use Facebook intensely. When Deters and Mehl (2012) specifically instructed Facebook users to post more frequent status updates for a week, users reported lower loneliness at the end of the experiment, mediated by increased social connectedness. Both Ryan and Xenos (2011) and Burke, Marlow and Lento (2010) reported that active and communicative use of Facebook (such as sending messages or writing on friends’ Facebook walls) was linked to lower loneliness and higher social capital, respectively, whereas passive use of Facebook and consumption of social information (such as playing games or liking pages) had the opposite results.
Because the trait of Extraversion measures an individual’s tendency to seek out social interaction, form new relationships, and enjoy socializing (Goldberg, 1990; McCrae & Costa, 1997), those low in Extraversion tend to be the more passive Facebook users. Extraversion positively predicts active social contributions, while negatively predicting passive engagement (Ryan
& Xenos, 2011). Relative to introverted people, extraverted people are more likely to use the synchronous and communicative features of Facebook (Ryan & Xenos, 2011), take a more central role in social networks (Wehrli, 2008), and are less likely to use Facebook just to pass the time (Sheldon, 2008). Extraverted people also write more status updates (Ong et al., 2011), are involved in more Facebook groups (Ross et al., 2009), have more Facebook friends (Amichai-Hamburger & Vinitzky, 2010) and communicate with friends more (Seidman, 2013) than their introverted counterparts. Thus, more extraverted Facebook users should not experience a decrease in felt belonging as they are likely to be actively involved with their Facebook friends and the events depicted on Facebook. In comparison, the more introverted Facebook users may be vulnerable to experiencing a sense of decreased belonging.
Support for a Facebook Feedback Hypothesis
Research into social comparison on Facebook provides important evidence for the link between Facebook use, consumption of positive information about others, and lower wellbeing. Qiu, Lin, and Leung (2010) showed that for participants who were low in narcissism, comparing one’s life to others mediated the relationship between browsing Facebook and higher levels of loneliness and negative affect. Similarly, Chou and Edge (2012) found that the more hours people spent on Facebook, the more they believed that others were happier and generally had better lives than them. Krasnova, Wenninger, Widjaja and Buxmann (2013) found that passive consumption of information on Facebook was related to lower life satisfaction, mediated by feelings of envy. Finally, university students who engaged in greater levels of self-comparison with others on Facebook felt more negative about such comparisons (Lee, 2014).
In addition to causing negative affect, cues to exclusion on Facebook should also lead to behaviour directed at avoiding rejection or forming new relationships (Leary et al., 1995). Because introverted people are more comfortable communicating online than
New Zealand Journal of Psychology Vol. 44 No. 2, September 2015• 6 •
S. Stronge, D. Osborne, T. West-Newman, M. S. Wilson, P. Milojev, L. M. Greaves, C. G. Sibley
offline (Amiel & Sargent, 2004), the steps they take to avoid social exclusion may lead them back to Facebook. Research supports this idea, showing that wanting to belong to a group (Amiel & Sargent, 2004) and avoid loneliness (Amichai-Hamburger & Vinitzky, 2010) are some of the motivating factors behind more introverted peoples’ use of the internet and Facebook. Loneliness is associated with holding more positive attitudes towards Facebook, spending more time on Facebook (Jin, 2013; Lemieux, Lajoie, & Trainor, 2013) and wanting to use Facebook to compensate for weak social ties and reduce loneliness (Teppers, Luyckx, Klimstra, & Goossens, 2013). Indeed, visiting a social networking site is a logical step towards relationship formation and social compensation. Yet this process could cause a vicious cycle if introverted people continue to feel socially excluded. Sheldon, Abad, and Hinsch (2011) measured connection (relatedness-need satisfaction), disconnection, and Facebook use and reported that Facebook use increased feelings of both connection and disconnection. However, feelings of connection faded after time spent away from Facebook, whereas feelings of disconnection persisted and drove further Facebook use.
In contrast with the predominantly cross-sectional studies reported above, Teppers et al. (2013) have reported similar cyclical findings in a longitudinal study. They found that the motive to use Facebook as a form of social compensation predicted later loneliness, which, in turn, predicted using Facebook for social compensation later on. Similar cycles have been found for general internet use whereby loneliness is both the cause and effect of socially compensatory behaviour (Kim, LaRose, & Peng, 2009). In fact, simply having a social compensation motive suggests that users will be more vulnerable to experiencing exclusion – the desire to compensate indicates they already feel they do not belong, which makes individuals more sensitive to cues to exclusion (Dandeneau & Baldwin, 2004). Additionally, users who are lonely or have low self-esteem are more likely to accept friend requests from strangers (Acar, 2008) or have a high ratio of strangers in their online
social network (Jin, 2013; Skues et al., 2012). This is consistent with the theory that low self-esteem motivates relationship formation behaviour (Baumeister & Leary, 1995). More friends on Facebook, however, most likely indicates a concomitantly higher ratio of strangers in users’ network with whom they do not feel a personal sense of belonging.
Together, this evidence demonstrates that, consistent with the sociometer hypothesis, Facebook use is associated with (and may lead to) negative affect and poor social outcomes when used in a passive manner – behaviour typical of more introverted users (e.g., Burke et al., 2010; Ryan & Xenos, 2011). Facebook use is also associated with a tendency to compare oneself negatively to others (e.g., Qiu et al., 2010). Additionally, for some users Facebook use is driven by feelings of disconnection, loneliness and the desire for social compensation (e.g., Sheldon et al., 2011; Teppers et al., 2013)—findings that are consistent with the idea that a low sense of belonging creates a motivation to maintain or form new relationships. Unfortunately, in the studies described above, using Facebook for these reasons predicts further loneliness, as these motives are associated with behaviour that exposes one to even more cues of exclusion (e.g., Forest & Wood, 2012).
Facebook and Big Five personality
Research into the factors of the Big-Five model of personality (Goldberg, 1990) and social networking sites or Facebook use has found that users tend to have lower Conscientiousness (being diligent and organized; Ryan & Xenos, 2011; Wehrli, 2008), and higher Neuroticism (low emotional stability; Hughes, Rowe, Batey, & Lee, 2012) than non-users. Moreover, time spent using Facebook is positively associated with Neuroticism (Moore & McElroy, 2010; Ryan & Xenos, 2011) and negatively associated with Conscientiousness (Gosling, Augustine, Vazire, Holtzman, & Gaddis, 2011; Ryan & Xenos, 2011; Wilson, Fornasier, & White, 2010). Finally, Facebook use tends to be uncorrelated with Agreeableness (being tolerant and forgiving) or Openness to
Experience (being curious and broad-minded; Moore & McElroy, 2010; Ross et al., 2009; Wehrli, 2008).
F a c e b o o k u s e r s t y p i c a l l y have significantly higher levels of Extraversion compared to non-users (Hughes et al., 2012; Ryan & Xenos, 2011), as do users of social networking sites in general (Wehrli, 2008; Wilson et al., 2010). Higher levels of Extraversion have also been found to correlate with spending more time on social networks, (Correa, Hinsley, & de Zúñiga, 2010; Wilson et al., 2010) including Facebook (Acar, 2008; Gosling et al., 2011; Ong et al., 2011). Unlike general social internet use, where people make their friends online and then meet them in person later, Facebook appears to demonstrate an ‘offline to online’ trend in which people’s existing social networks create their online social networks (Ellison, Steinfield, & Lampe, 2007). Therefore, those who are more sociable offline, such as extraverted people, use online social media the most. However several studies found no relationship between Extraversion and time spent on Facebook (Moore & McElroy, 2010; Ross et al., 2009; Ryan & Xenos, 2011; Skues et al., 2012).
Some of these contradictory results may be due to the use of small sample sizes and dichotomized continuous variables in this research area, which can lead to a loss of power and lower the likelihood of a significant result. Moreover, to reiterate the point made by Ryan and Xenos (2011), the heavy focus on college populations means results may not be generalisable (e.g., Ellison et al., 2007; Gosling et al., 2011; Moore & McElroy, 2010; Ross et al., 2009; Wehrli, 2008; Wilson et al., 2010). Correa et al. (2010) is one of the few studies to use an older population and found that Neuroticism negatively predicts time on Facebook for men and older users, and that Openness to Experience positively predicts time spent on Facebook for women and older users. To address this lacuna in the research, this study will investigate the links between personality, demographics and Facebook usage with a large, nationally representative sample.

• 7 •New Zealand Journal of Psychology Vol. 44 No. 2, September 2015
Personality, Facebook use, and felt belonging
Overview and Guiding Hypotheses
We predict that more introverted people will show evidence of the Facebook Feedback Hypothesis. Because of its offline-to-online nature, Facebook should be an attractive social option to those high in Extraversion. As such, Extraversion should predict a higher likelihood of being a Facebook user versus a non-user. We also predict that Extraversion will moderate the relationship between having a Facebook profile and felt belongingness. Because Facebook provides a stream of cues to exclusion that can exacerbate deficits in one’s sense of belonging, more introverted people with a Facebook profile should report decreased belonging whereas more extraverted people with a Facebook profile will not. The competing social compensation hypothesis would be supported if those low in Extraversion with a Facebook profile show higher levels of belongingness relative to those without a profile.
Method
Sampling procedureThis study analysed data from
the Time 3 (2011) wave of the New Zealand Attitudes and Values Study. The Time 3 (2011) NZAVS contained responses from 6,884 participants. 3,915 of these participants were retained from the initial Time 1 national probability sample, sampled from the 2009 New Zealand electoral roll (a 60.0% retention rate over two years). Participants were posted a copy of the questionnaire, with a second postal follow-up two months later. Participants who provided an email address were also emailed and invited to complete an online version if they preferred.
To boost sample size at Time 3 and compensate for sample attrition, a booster sample was recruited through an unrelated survey posted on the website of a major New Zealand newspaper in 2011. A total of 3,208 participants registered an initial expression of interest in being contacted to participate in the NZAVS via this survey. Participants in
this non-random booster sample were emailed an invitation to participate in an online version of the NZAVS, and those who did not respond to the email were also sent a postal version of the questionnaire. A total of 2,962 participants completed the questionnaire when subsequently contacted (response rate = 92.4%). This yielded a total sample size for the Time 3 (2011) NZAVS of 6,884 (3,915 retained from Time 1, 3 additions retained from Time 2, 2,962 additions at Time 3, and 4 opt-ins at Time 3).
We limited our analyses to the 6,428 participants (93% of the full sample) who provided complete responses to the questions analysed here (measures of personality, demographics, and responses to the question about having a Facebook profile). All subsequent results and samples detailed refer to these 6,428 participants (2,423 men, 4,005 women). The majority of the sample (59.9%, N = 3,850) reported that they had a Facebook profile (the remaining 40.1%, N = 2,578 did not). The sample consisted of 69% Pākehā/New Zealand Europeans (N = 4,460), 11% Māori (Indigenous New Zealanders; N = 690), 2% Pacific Nations (N = 136), and 3% Asians (N = 219). Participants’ mean age was 50.42 (SD =15.82), and their average household income was $97,173 (SD = 16,129).
In terms of other demographics, 40% of participants described themselves as religious (N = 2,544), 72% of the sample were parents (N = 4,663), 70% had a partner (N = 4,502), and 76% were employed (N = 4,879). These variables were included as standard demographic controls.
Questionnaire measuresFacebook profile status was
measured using the following question: ‘Do you have a Facebook profile?’ (yes/no response option). Big-Five personality was assessed using the Mini-IPIP. This is a 20-item scale developed by Donnellan, Oswald, Baird, and Lucas (2006) using items from Goldberg’s (1999) International Personality Item Pool. Items were rated from 1 (very inaccurate) to 7 (very accurate) and
averaged to give scale scores for each trait. The Mini-IPIP personality markers have been previously validated for use in New Zealand and show good internal reliability (Sibley et al., 2011), temporal stability (Milojev, Osborne, Greaves, Barlow, & Sibley, 2013) and item response properties (Sibley, 2012).
Felt belongingness was measured with three items adapted from Cutrona and Russell’s (1987) Social Provisions Scale. These items were, ‘I know that people in my life accept and value me’, ‘I feel like an outsider’, and ‘I know that people around me share my attitudes and beliefs’.
Religiosity was measured by a single item that asked participants if they ‘identify with a religion and/or a spiritual group’ (yes/no response). Parenthood was measured using an open-ended question that asked participants to indicate the number of ‘children [they have] given birth to, fathered, or adopted’. Responses were coded as 0 for no children and 1 for children. Partnership was measured by asking participants to indicate their ‘relationship status.’ Possible responses listed were single, dating, living together/de facto, married, or other. Responses were coded as 0 for single and 1 for those with a partner. Employment was measured by having participants indicate their ‘current employment situation.’ Responses were coded as 1 for those who chose employed full-time, employed part-time, self-employed, or who owned their own business. Those who were unemployed were coded as 0, including students and the retired.
Scale reliabilities, correlations, and descriptive statistics for all variables are reported in Table 1. As shown here, the personality scales had reasonable levels of internal reliability given the limited number of items used to assess each construct. The Cronbach’s alpha for Felt Belongingness was lower than ideal, being only 0.55. This scale included only three items, and was designed as a short-form scale. The scale does have a lower internal reliability than ideal, which may attenuate the size of the effects we observe.

New Zealand Journal of Psychology Vol. 44 No. 2, September 2015• 8 •
S. Stronge, D. Osborne, T. West-Newman, M. S. Wilson, P. Milojev, L. M. Greaves, C. G. Sibley
Results
Demographic and personality differences in Facebook users versus non-users
C h i - s q u a r e t e s t s o f independence for gender and ethnicity were conducted with Facebook profile status. A significant relationship between gender and Facebook use was found such that women were more likely than men to have a Facebook profile
(69% vs. 49%, respectively (χ2(1)= 199.89, p < .001). There was also a significant relationship between self-reported ethnicity and Facebook use (χ2(4)= 50.37, p < .001). Specifically, Asians were the most likely to have a Facebook profile (78%), followed by Pacific Nations (66%), Māori (60%), and finally Pākehā/New Zealand European (58%). In addition, those
with a Facebook profile were younger on average (M = 45.02, SD = 15.02) than those without a profile (M = 58.48, SD = 13.37, t = 37.61, p < .001). Means and standard deviations for personality differences between users and non-users are presented in Table 2. Those with a Facebook profile scored significantly higher on Extraversion, Agreeableness, Neurot ic ism, and Openness to Experience, and significantly lower in Conscientiousness, when compared to those without a profile.
Regression model predicting felt belongingness
The analyses were conducted in Mplus version 7.3 (Muthen & Muthen, 1998-2014). The full regression model assessing the unique concurrent effects of all predictors on felt belongingness is presented in Table 3. We tested for the moderating effect of having a Facebook profile on the association between
Extraversion and felt belongingness by entering the product term of these two variables, after centering, into the model. For completeness, we also tested the interaction with the other four personality dimensions. This adjusted for the effects of the other dimensions of personality in all analyses, thus allowing us to derive a ‘pure’ estimate of the effect of Extraversion on felt belongingness. The predicted interactions of having a Facebook profile with Extraversion held in a baseline model with no controls. Regression parameters are reported in Table 3. The full regression model predicted 33.3% of the variance in felt belongingness, while the interaction term for Facebook and Extraversion explained .1% of the variance on its own, reflecting research that demonstrates interaction effects as being difficult to detect (Aiken and West, 1991; McClelland & Judd, 1993).
As reported in Table 3, Pacific ethnicity, religiosity, parental and partnered status, and income all significantly predicted greater felt belongingness, while gender (women) and Facebook membership predicted weaker felt belongingness. Extraversion significantly predicted increased levels of felt belongingness. Agreeableness and Conscientiousness also both significantly predicted increased levels of belongingness, whereas Neuroticism significantly predicted decreased levels of belongingness. No
Table 2. Differences in Big-Five personality for New Zealanders with and without a Facebook profile
Facebook Profile No Profile tM SD M SD
Extraversion 4.056 1.186 3.797 1.112 -8.897**Agreeableness 5.476 0.932 5.236 0.943 -10.071**
Conscientiousness 4.910 1.049 5.119 1.002 7.943**
Neuroticism 3.465 1.163 3.248 1.076 -7.662**
Openness to Experience 5.081 1.098 4.737 1.094 -12.328**
Note. ** p < .01
Table 1. Bivariate correlations between all scale variables.1. 2. 3. 4. 5. 6. 7. 8. 9. 10. 11. 12. 13. 14. 15. 16. 17.
1. Felt Belongingness 2. Gender (0 female, 1 male) -.081 3. Age .109 .169 4. Ethnicity – Māori (0 no, 1 yes) .009 -.013 -.069 5. Ethnicity – Pacific (0 no, 1 yes) .019 -.006 -.088 .028 6. Ethnicity – Asian (0 no, 1 yes) -.043 -.012 -.156 -.036 .016 7. Religious (0 no, 1 yes) .067 -.042 .137 .033 .082 .077 8. Parent (0 no, 1 yes) .146 .076 .512 .022 -.040 -.119 .0769. Partnered (0 no, 1 yes) .139 .132 .187 -.026 -.047 -.071 .000 .36410. Employed (0 no, 1 yes) -.014 -.015 -.429 .006 .009 .031 -.094 -.158 .01611. Facebook Profile (0 no, 1 yes) -.035 -.176 -.417 .001 .019 .070 -.076 -.193 -.079 .21112. Extraversion .324 -.064 -.050 .025 .021 -.010 .030 .051 .030 .053 .109 13. Agreeableness .247 -.290 -.042 -.047 -.011 -.003 .070 -.022 -.043 -.003 .125 .206 14. Conscientiousness .269 -.069 .134 .011 .012 -.012 .050 .154 .125 -.026 -.098 .063 .142 15. Neuroticism -.439 -.128 -.195 .001 .011 .046 -.027 -.135 -.066 .016 .094 -.163 -.070 -.209 16. Openness .046 .002 -.164 -.047 -.011 .007 -.074 -.120 -.072 .108 .152 .207 .257 -.032 -.057 17. Income .064 .015 -.039 -.023 -.017 -.001 -.008 .006 .103 .093 .040 .028 -.013 .042 -.035 .046M 5.07 3.95 5.38 5.00 3.38 4.94SD 1.01 1.16 .94 1.04 1.13 1.11Cronbach’s α .55 .75 .69 .66 .72 .70
Note. N = 6428, r-values > .024 significant at p < .05.
• 9 •New Zealand Journal of Psychology Vol. 44 No. 2, September 2015
Personality, Facebook use, and felt belonging
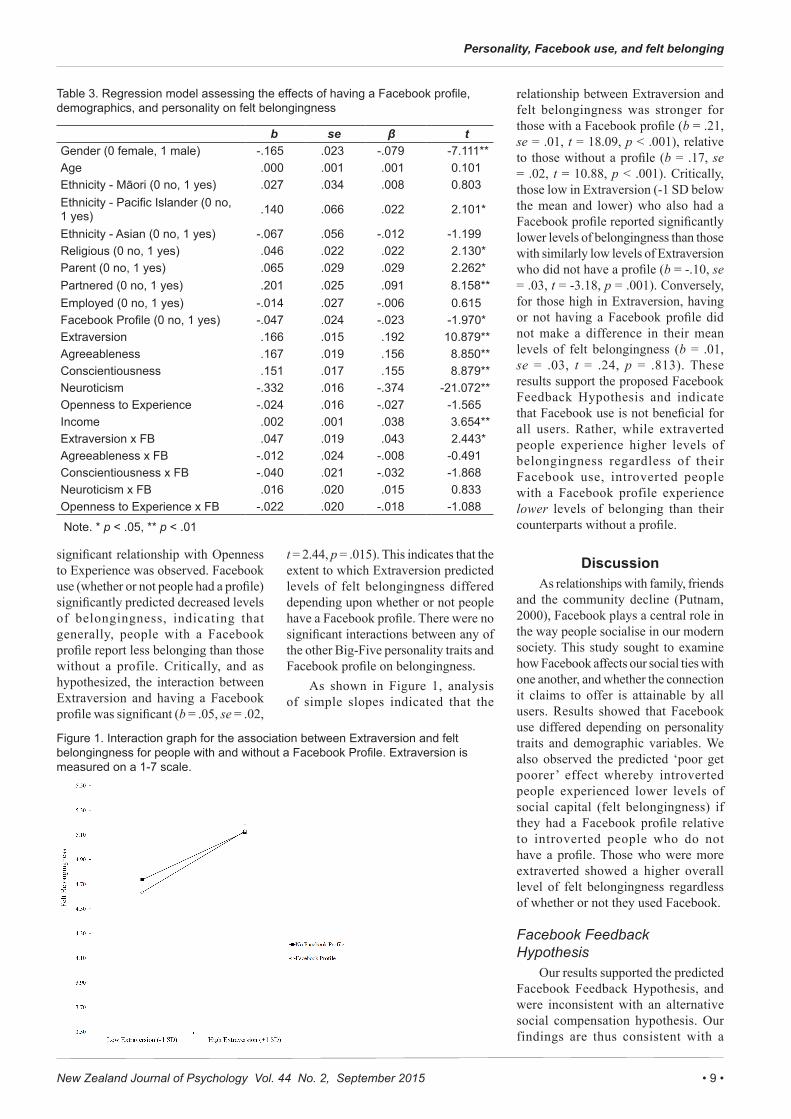
significant relationship with Openness to Experience was observed. Facebook use (whether or not people had a profile) significantly predicted decreased levels of belongingness, indicating that generally, people with a Facebook profile report less belonging than those without a profile. Critically, and as hypothesized, the interaction between Extraversion and having a Facebook profile was significant (b = .05, se = .02,
t = 2.44, p = .015). This indicates that the extent to which Extraversion predicted levels of felt belongingness differed depending upon whether or not people have a Facebook profile. There were no significant interactions between any of the other Big-Five personality traits and Facebook profile on belongingness.
As shown in Figure 1, analysis of simple slopes indicated that the
relationship between Extraversion and felt belongingness was stronger for those with a Facebook profile (b = .21, se = .01, t = 18.09, p < .001), relative to those without a profile (b = .17, se = .02, t = 10.88, p < .001). Critically, those low in Extraversion (-1 SD below the mean and lower) who also had a Facebook profile reported significantly lower levels of belongingness than those with similarly low levels of Extraversion who did not have a profile (b = -.10, se = .03, t = -3.18, p = .001). Conversely, for those high in Extraversion, having or not having a Facebook profile did not make a difference in their mean levels of felt belongingness (b = .01, se = .03, t = .24, p = .813). These results support the proposed Facebook Feedback Hypothesis and indicate that Facebook use is not beneficial for all users. Rather, while extraverted people experience higher levels of belongingness regardless of their Facebook use, introverted people with a Facebook profile experience lower levels of belonging than their counterparts without a profile.
DiscussionAs relationships with family, friends
and the community decline (Putnam, 2000), Facebook plays a central role in the way people socialise in our modern society. This study sought to examine how Facebook affects our social ties with one another, and whether the connection it claims to offer is attainable by all users. Results showed that Facebook use differed depending on personality traits and demographic variables. We also observed the predicted ‘poor get poorer’ effect whereby introverted people experienced lower levels of social capital (felt belongingness) if they had a Facebook profile relative to introverted people who do not have a profile. Those who were more extraverted showed a higher overall level of felt belongingness regardless of whether or not they used Facebook.
Facebook Feedback Hypothesis
Our results supported the predicted Facebook Feedback Hypothesis, and were inconsistent with an alternative social compensation hypothesis. Our findings are thus consistent with a
Table 3. Regression model assessing the effects of having a Facebook profile, demographics, and personality on felt belongingness
b se β tGender (0 female, 1 male) -.165 .023 -.079 -7.111**Age .000 .001 .001 0.101Ethnicity - Māori (0 no, 1 yes) .027 .034 .008 0.803Ethnicity - Pacific Islander (0 no, 1 yes) .140 .066 .022 2.101*
Ethnicity - Asian (0 no, 1 yes) -.067 .056 -.012 -1.199Religious (0 no, 1 yes) .046 .022 .022 2.130*Parent (0 no, 1 yes) .065 .029 .029 2.262*Partnered (0 no, 1 yes) .201 .025 .091 8.158**Employed (0 no, 1 yes) -.014 .027 -.006 0.615Facebook Profile (0 no, 1 yes) -.047 .024 -.023 -1.970*Extraversion .166 .015 .192 10.879**Agreeableness .167 .019 .156 8.850**Conscientiousness .151 .017 .155 8.879**Neuroticism -.332 .016 -.374 -21.072**Openness to Experience -.024 .016 -.027 -1.565Income .002 .001 .038 3.654**Extraversion x FB .047 .019 .043 2.443*Agreeableness x FB -.012 .024 -.008 -0.491Conscientiousness x FB -.040 .021 -.032 -1.868Neuroticism x FB .016 .020 .015 0.833Openness to Experience x FB -.022 .020 -.018 -1.088
Note. * p < .05, ** p < .01
Figure 1. Interaction graph for the association between Extraversion and felt belongingness for people with and without a Facebook Profile. Extraversion is measured on a 1-7 scale.
New Zealand Journal of Psychology Vol. 44 No. 2, September 2015• 10 •
S. Stronge, D. Osborne, T. West-Newman, M. S. Wilson, P. Milojev, L. M. Greaves, C. G. Sibley
body of research showing a ‘poor get poorer’ effect for socially isolated Facebook users (Kim et al., 2009; Ryan & Xenos, 2011; Teppers et al., 2013). Having a Facebook profile had a small, negative association with lower felt belongingness. However when moderated by Extraversion, introverted people with a Facebook profile reported lower levels of felt belongingness than their counterparts without a profile, while extraverted Facebook users did not. We argue that Facebook use may negatively affect felt belongingness of more introverted people. Because introverted people had low levels of felt belonging overall and tend to be less active on Facebook than their extroverted counterparts (e.g., Ryan & Xenos, 2011), they should be more likely to perceive cues to exclusion when using Facebook. These cues should, in turn, further decrease their sense of belonging. In contrast, extraverted people experience higher levels of belonging overall, which does not vary on the basis of their Facebook usage. These results are consistent with sociometer theory as those who are high in belonging are less sensitive to cues to exclusion than those low in belonging (Dandeneau & Baldwin, 2004). Additionally, because people who already feel included and have their need to belong met do not show further gains in belonging (Leary et al., 1995), those high in Extraversion with a Facebook profile do not have higher levels of felt belonging.
These results have interesting implications for our understanding of Extraversion. Social media, whether in the form of Facebook or any of the myriad of social networking sites, is unlikely to go away any time soon. As traditional forms of communication and our collective social capital decline (Putnam, 2000), adopting new technology such as Facebook is important. Highly extraverted people, because they are oriented towards engagement in social endeavours, may quickly and easily make use of any avenue that allows them to manage their social life (Wehrli, 2008). In terms of time and energy, Facebook offers a ‘cheap’ way of creating and maintaining large networks and accompanying social capital. An extraverted person’s
use of Facebook demonstrates their interactional adaptability in the face of a changing society; they are willing—and able—to use different mediums in the same manner as more traditional forms of communication.
As has been suggested by a number of other studies, socially ‘poor’ users do use Facebook, but not to its full potential (Forest & Wood, 2012; Ryan & Xenos, 2011). Introverted people feel less belonging than extraverted people in general, and, as we have shown here, this difference increases when looking at Facebook users. Despite popular belief (e.g., Amichai-Hamburger & Vinitzky, 2010), it appears that Facebook is not a good place for those low in Extraversion to look for social compensation. Indeed, our results suggest that, rather than helping all users find connection, Facebook is geared towards a certain type of socialising; Facebook works best for extraverted peoples’ larger social circles and need to manage many weak ties. More introverted users may fair better by focusing their Facebook usage on a smaller circle of friends who they know well, thus mirroring their offline social networks, or by making a conscious effort to be a more active user (e.g. Deters & Mehl, 2012). Future research could investigate what kinds of online social interaction do function as a form of social compensation for introverts; some research has shown that online-exclusive interaction can in fact be beneficial to introverts (Zalk, Branje, Denissen, Aken, & Meeus, 2011). The poor-get-poorer effect may reflect Facebook’s unique ‘offline to online’ pattern of use (Ellison et al., 2007).
Personality, Demographics, and Facebook usage in New Zealand
Although our focus was on the use of Facebook, Extraversion, and felt belongingness, our results provide other insights into New Zealand Facebook users. Results from our national sample indicated that having a Facebook profile is associated with higher levels of Extraversion, Neuroticism, and Agreeableness, and with lower levels of Conscientiousness. Overall, 60% of our sample used Facebook. Consistent with previous research (Bascand, 2013; Hargittai, 2008), women were
much more likely to have a Facebook profile than were men. Indeed, nearly two thirds of women had a Facebook profile, whereas slightly less than half of men did. Facebook users were also younger than non-users; yet the average age of the Facebook user was 45. This demonstrates the importance of assessing the effects of Facebook usage on non-student populations.
Significant differences in self-identified ethnicity were also found, with Asians being the most likely to use Facebook, followed by Pacific peoples, Māori, and finally Pākehā/Europeans. While differences in ethnicity and social network use have been shown before (Hargittai, 2008), this research provides the first comprehensive look at Facebook use and demographic differences in New Zealand. Despite demographic differences, these results indicate that Facebook is widely used by New Zealanders, across gender, ethnicity and age.
Strengths, Limitations, and Future Research
The data in this study are from a nationally representative sample and cover a variety of age groups and ethnicities, thereby providing insight into Facebook use in contemporary New Zealand society. Much of the current research on Facebook use and personality has employed undergraduate samples. However, Facebook has grown exponentially in recent years and is no longer solely used by students; the average age of the American Facebook user is now 38 (Brenner, 2012), and usage by older adults is rapidly growing (Bascand, 2013; Duggan & Smith, 2013). As such, it is no longer appropriate to use student samples if we wish to generalise research results or discuss the ‘average’ user.
Because these data are cross-sectional, we are unable to infer causality. Indeed, it is possible that introverted users who are low in belonging are more likely to create a Facebook profile in order to feel more included. Previous cross-sectional research into Facebook or internet use and social outcomes have found ‘poor get poorer’ effects, only to report positive outcomes in follow-up longitudinal studies (Burke, Kraut, & Marlow, 2011; Kraut et al.,

• 11 •New Zealand Journal of Psychology Vol. 44 No. 2, September 2015
Personality, Facebook use, and felt belonging
2002), so more longitudinal research is needed in this area. In comparison, the Facebook Feedback Hypothesis predicts that introverted peoples’ lower sense of belonging could lead to further Facebook use, thereby increasing the gap between introverted and extraverted peoples’ social outcomes over time. Future longitudinal research into Facebook and belonging will be able to tell us whether Facebook use causally decreases levels of felt belonging for those low in Extraversion as hypothesised.
The results we present here are derived from the Facebook Feedback Hypothesis, however, we have been unable to examine the effect directly. Nonetheless, a body of evidence is beginning to accumulate documenting distinct motives for Facebook use and subsequent behaviour and outcomes. Previous literature strongly supports the idea that Extraverts use Facebook more actively than Introverts (e.g., Amichai-Hamburger & Vinitzky, 2010; Gosling et al., 2011) and that passive consumption of information on Facebook is associated with negative outcomes (e.g., Qiu et al., 2010). However, future research should examine the link between Facebook use, feeling excluded, and low belonging more directly. Although we do not examine the mechanisms here, we demonstrate that poorer social outcomes are associated with Facebook users as compared to non-users, across a large representative sample in a natural setting.
Finally, it is worth emphasizing that the relationship predicted by the Facebook Feedback Hypothesis is extremely subtle. The interaction between Extraversion and Facebook usage on social belonging is reliable in a national population sample of New Zealanders, but it is not large. Nor would we necessarily expect it to be. Our findings point to one specific factor potentially linked to differences in social belonging among a vast array of complex and interconnected factors in people’s environments. That said, we show that the relationship is statistically reliable in a national sample as of 2011. From our point of view, this documents a new and interesting disparity in the social outcomes experienced by Extraverts and Introverts at the beginning of the rise of
social media. Social media represents one of the biggest changes in the ways we connect with others to have occurred in recent times. While the hypothesised relationship was detectable but subtle in 2011, we wonder whether it may strengthen, and thus the gap between Extraverts and Introverts may widen, as social media becomes an increasingly central part of our social environment. Future research tracking these trends over time is needed in order to answer this intriguing question. Such research could also use a wider and more reliable set of indicators of social capital, as our three-item measure of social belongingness had a relatively low internal reliability, which may also have attenuated the size of the association we observed.
Concluding commentsWe began this article with the
observation offered by Putnam (2000) that our collective social capital - the sum of our meaningful social ties with each other - is decreasing as our relationships with family, friends and community weaken. Here, we sought to examine whether Facebook might contribute to or ameliorate this effect, and moreover, whether the positive or negative associations between Facebook usage and social capital (felt belongingness) depend upon people’s general personality and their level of Extraversion in particular. Using data from a large national probability sample, we showed that Facebook usage is not beneficial to everyone. Rather, our data show that those high in Extraversion experienced consistently high levels of social capital regardless of Facebook use, whereas those low in Extraversion experienced lower levels of social capital if they had a Facebook profile. These data provide a snapshot of the links between personality, Facebook usage and felt belongingness at a single point in time and indicate that new mediums of online social connection such as Facebook may be detrimental to those who are not highly oriented toward sociability (i.e., introverted people)
ReferencesAcar, A. (2008) . Antecedents and
Consequences of Onl ine Socia l Networking Behavior: The Case of Facebook. Journal of Website Promot ion , 3 (1-2) , 62-83 . do i : 10.1080/15533610802052654
Aiken, L. S., & West, S. G. (1991). Multiple regression: Testing and interpreting interactions. Thousand Oaks, CA: Sage Publications, Inc.
Amichai-Hamburger, Y., & Vinitzky, G. (2010). Social network use and personality. Computers in Human Behavior, 26(6), 1289-1295. doi: 10.1016/j.chb.2010.03.018
Amiel, T., & Sargent, S. L. (2004). Individual differences in Internet usage motives. Computers in Human Behavior, 20(6), 711-726. doi: 10.1016/j.chb.2004.09.002
Ashton, M. C., & Lee, K. (2007). Empirical, Theoretical, and Practical Advantages of the HEXACO Model of Personality Structure. Personality and Social Psychology Review, 11(2), 150-166. doi: 10.1177/1088868306294907
Baker, L. R., & Oswald, D. L. (2010). Shyness and online social networking services.
J o u r n a l o f S o c i a l a n d P e r s o n a l Relationships, 27(7), 873-889. doi: 10.1177/0265407510375261
Bascand, G. (2013). Statistics New Zealand - Household Use of Information and Communication Technology: 2012. Retrieved from http://www.stats.govt.nz/browse_for_stats/industry_sectors/information_technology_and_communications/HouseholdUseofICT_HOTP2012.aspx
Baumeister, R. F., & Leary, M. R. (1995). The Need to Belong: Desire for Interpersonal Attachments as a Fundamental Human Motivation. Psychological Bulletin, 117(3), 497-529.
Bohn, A., Buchta, C. , Hornik, K., & Mair, P. (2014). Making friends and communicating on Facebook: Implications for the access to social capital. Social Networks, 37, 29-41. doi: 10.1016/j.socnet.2013.11.003
Brenner, J. (Mar 29, 2012). Pew Internet: Social Networking ( ful l detai l ) . Retrieved from http://pewinternet.org/Commentary/2012/March/Pew-Internet-Social-Networking-full-detail.aspx
Burke, M., Marlow, C., & Lento, T. (2010). Social Network Activity and Social Well-Being. In CHI ‘10: Proceedings of the SIGCHI Conference on Human Factors in Computing Systems. New York: ACM.
New Zealand Journal of Psychology Vol. 44 No. 2, September 2015• 12 •
S. Stronge, D. Osborne, T. West-Newman, M. S. Wilson, P. Milojev, L. M. Greaves, C. G. Sibley
Burke, M., Kraut, R., & Marlow, C. (2011). Social capital on Facebook: Differentiating uses and users. In CHI ‘11: Proceedings of the SIGCHI Conference on Human Factors in Computing Systems. New York: ACM.
Chou, H.-T. G., & Edge, N. (2012). ‘‘They Are Happier and Having Better Lives than I Am’’: The Impact of Using Facebook on Perceptions of Others’ Lives. Cyberpsychology, Behavior, and Social Networking, 15(2), 117-121. doi: 10.1089/cyber.2011.0324
Christofides, E., Muise, A., & Desmarais, S. (2009). Information Disclosure and Control on Facebook: Are They Two Sides of the Same Coin or Two Different Processes? CyberPsychology & Behavior, 12(3), 341-345. doi: 10.1089/cpb.2008.0226
Correa, T., Hinsley, A. W., & de Zúñiga, H. G. (2010). Who interacts on the Web?: The intersection of users’ personality and social media use. Computers in Human Behavior, 26(2), 247-253. doi: 10.1016/j.chb.2009.09.003
Cutrona, C.E., & Russell, D. (1987). The provisions of social relationships and adaptation to stress. In W. Jones, & D. P. (Eds.). Advances in personal relationships (pp. Vol. 1. pp. 37-67). Greenwich, Conn: JAI Press.
Dandeneau, S. D., & Baldwin, M. W. (2004). The Inhibition of Socially Rejecting Information Among People with High versus Low Self-Esteem: The Role of Attentional Bias and the Effects of Bias Reduction Training. Journal of Social and Clinical Psychology, 23(4), 584-603. doi: 10.1521/jscp.23.4.584.40306
Deters, F. g., & Mehl, M. R. (2012). Does Posting Facebook Status Updates Increase or Decrease Loneliness? A n O n l i n e S o c i a l N e t w o r k i n g Experiment. Social Psychological and Personality Science, 4(5), 579-586. doi: 10.1177/1948550612469233.
Donnellan, M. B., Oswald, F. L., Baird, B. M., & Lucas, R. E. (2006). The mini-IPIP scales: Tiny-yet-effective measures of the Big Five factors of personality. Psychological Assessment, 18(2), 192-203. doi: 10.1037/1040-3590.18.2.192
Duggan, M., & Smith, A. (2013). Social Media Update 2013. Retrieved from www.pewinternet.org/2013/12/30/social-media-update-2013/
Ellison, N. B., Steinfield, C., & Lampe, C. (2007). The Benefits of Facebook ‘Friends:’ Social Capital and College Students’ Use of Online Social Network Sites. Journal of Computer-Mediated Communication, 12(4), 1143-1168. doi: 10.1111/j.1083-6101.2007.00367.x
Facebook. (2014). Welcome to Facebook -- Log in, sign up or learn more. Retrieved March 19, 2014, from https://www.facebook.com/
Forest, A. L., & Wood, J. V. (2012). When Social Networking Is Not Working : Individuals With Low Self-Esteem Recognize but Do Not Reap the Benefits of Self-Disclosure on Facebook. Psychological Science, 23(3), 295-302. doi: 10.1177/0956797611429709
Goldberg, L. R. (1990). An Alternative ‘Description of Personality’: The Big-Five Factor Structure. Journal of Personality and Social Psychology, 59(6), 1216-1229.
Goldberg, L. R. (1999). A Broad-Bandwidth, Public-Domain, Personality Inventory Measuring the Lower-Level Facets of Several Five-Factor Models. In I. Mervielde, I. Deary, F. De Fruyt, & F. Ostendorf (Eds.), Personality Psychology in Europe, Vol. 7. (pp. 7-28). Tilburg, The Netherlands: Tilburg University Press.
Gosling, S. D., Augustine, A. A., Vazire, S. , Holtzman, N., & Gaddis, S. (2011). Manifestations of Personality in Online Social Networks: Self-Reported Facebook-Related Behaviors and Observable Profile Information. Cyberpsychology, Behavior, and Social Networking, 14(9), 483-488. doi: 10.1089/cyber.2010.0087
Hargittai, E. (2008). Whose Space? Differences Among Users and Non-Users of Social Network Sites. Journal of Computer-Mediated Communication, 13(1), 276-297. doi:10.1111/j.1083-6101.2007.00396.x
Hughes, D. J., Rowe, M., Batey, M., & Lee, A. (2012). A tale of two sites: Twitter vs. Facebook and the personality predictors of social media usage. Computers in Human Behavior, 28(2), 561-569. doi: 10.1016/j.chb.2011.11.001
Jin, B. (2013). How lonely people use and perceive Facebook. Computers in Human Behavior, 29(6), 2463-2470. doi: 10.1016/j.chb.2013.05.034
Kim, J., LaRose, R., & Peng, W. (2009). Loneliness as the Cause and the Effect of Problematic Internet Use: The Relationship between and Psychological Well-Being. CyberPsychology & Behavior, 12(4), 451-455. doi: 10.1089/cpb.2008.0327
Krasnova, H., Wenninger, H., Widjaja, T., & Buxmann, P. (2013). Envy on Facebook: A Hidden Threat to Users’ Life Satisfaction? Wirtschaftsinformatik Proceedings 2013, Paper 92.
Kraut, R., Kiesler, S., Boneva, B., Cummings, J., Helgeson, V., & Crawford, A. (2002). Internet Paradox Revisited. Journal
of Social Issues, 58(1), 49-74. doi: 10.1111/1540-4560.00248
Leary, M. R., Tambor, E. S., Terdal, S. K., & Downs, D. L. (1995). Self-Esteem as an Interpersonal Monitor: The Sociometer Hypothesis. Journal of Personality and Social Psychology, 68(3), 518-530.
Lee, S. Y. (2014). How do people compare themselves with others on social network sites?: The case of Facebook. Computers in Human Behavior, 32, 253-260. doi: 10.1016/j.chb.2013.12.009
Lemieux, R., Lajoie, S., & Trainor, N. E. (2013). Affinity-Seeking, Social Loneliness, and Social Avoidance among Facebook Users. Psychological Reports, 112(2), 545-552. doi: 10.2466/07.pr0.112.2.545-552
McClelland, G., & Judd, C. (1993). Statistical difficulties of detecting interactions and moderator effects. Psychological Bulletin, 114(2), 376-390. doi: 10.1037/0033-2909.114.2.376.
McCrae, R. R., & Costa, P. T. (1997). Personality Trait Structure as a Human Universal. American Psychologist, 52(5), 509-516.
McKenna, K. Y. A., & Bargh, J. A. (2000). Plan 9 From Cyberspace: The Implications of the Internet for Personality and Social Psychology. Personality and Social Psychology Review, 4(1), 57-75. doi: 10.1207/S15327957PSPR0401_6
Milojev, P., Osborne, D., Greaves, L. M., Barlow, F. K., & Sibley, C. G. (2013). The Mini-IPIP6: Tiny yet highly stable markers of Big Six personality. Journal of Research in Personality, 47(6), 936-944. doi: 10.1016/j.jrp.2013.09.004
Moore, K., & McElroy, J. C. (2010). The influence of personality on Facebook usage, wall postings, and regret. Computers in Human Behavior, 28(1), 267-274. doi: 10.1016/j.chb.2011.09.009
Muthén, L. K., & Muthén, B. O. (1998-2014). Mplus user’s guide. Los Angeles, CA: Muthén & Muthén.
Ong, E. Y. L., Ang, R. P., Ho, J. C. M., Lim, J. C. Y., Goh, D. H., Lee, C. S., & Chua, A. Y. K. (2011). Narcissism, extraversion and adolescents’ self-presentation on Facebook. Personality and Individual Differences, 50(2), 180-185. doi: 10.1016/j.paid.2010.09.022
Putnam, R. D. (2000). Bowling Alone: The Collapse and Revival of American Community . New York: Simon & Schuster.
Qiu, L., Lin, H., & Leung, A. K.-Y. (2010). How Does Facebook Browsing Affect Self-Awareness and Social Well-Being: the Role of Narcissism. In Proceedings of the 7th International Conference on

• 13 •New Zealand Journal of Psychology Vol. 44 No. 2, September 2015
Personality, Facebook use, and felt belonging
Advances in Computer Entertainment Technology – ACE ‘10. New York, NY: ACM
Qiu, L., Lin, H., Leung, A. K., & Tov, W. (2012). Putting their best foot forward: emotional disclosure on Facebook. Cyberpsychology, Behavior, and Social Networking, 15(10), 569-572. doi: 10.1089/cyber.2012.0200
Ross, C., Orr, E. S., Sisic, M., Arseneault, J. M., Simmering, M. G., & Orr, R. R. (2009). Personality and motivations associated with Facebook use. Computers in Human Behavior, 25(2), 578-586. doi: 10.1016/j.chb.2008.12.024
Ryan, T., & Xenos, S. (2011). Who uses Facebook? An investigation into the relationship between the Big Five, shyness, narcissism, loneliness, and Facebook usage. Computers in Human Behavior, 27(5), 1658-1664. doi: 10.1016/j.chb.2011.02.004
Seidman, G. (2013). Self-presentation and belonging on Facebook: How personality influences social media use and motivations. Personality and Individual Differences, 54(3), 402-407. doi: 10.1016/j.paid.2012.10.009.
Sheldon, P. (2008). The Relationship Between Unwillingness-to-Communicate and Students’ Facebook Use. Journal of Media Psychology: Theories, Methods, and Applications, 20(2), 67-75. doi: 10.1027/1864-1105.20.2.67
Sheldon, K. M., Abad, N., & Hinsch, C. (2011). A Two-Process View of Facebook Use and Relatedness Need-Satisfaction: Disconnection Drives Use, and Connection Rewards It. Journal of Personality and Social Psychology, 100(4), 766-775. doi: 10.1037/a0022407
Sibley, C. G., Luyten, N., Purnomo, M., Moberly, A., Wootton, L. W., Hammond, M. D., Sengupta, N., …& Robertson, A. (2011). The Mini-IPIP6: Validation and extension of a short measure of the Big-Six factors of personality in
New Zealand. New Zealand Journal of Psychology, 40(3), 142-159.
Sibley, C. G. (2012). The Mini-IPIP6: Item Response Theory analysis of a short measure of the big-six factors of personality in New Zealand. New Zealand Journal of Psychology, 41(3), 21-31.
Skues, J. L., Williams, B., & Wise, L. (2012). The effect of personality traits, self-esteem, loneliness, and narcissism on Facebook use among university students. Computers in Human Behavior, 28(6), 2414-2419. doi: 10.1016/j.chb.2012.07.012
Steinfield, C., Ellison, N., & Lampe, C. (2008). Social capital, self-esteem, and use of online social network sites: A longitudinal analysis. Journal of Applied Developmental Psychology, 29(6), 434-445. doi: 10.1016/j.appdev.2008.07.002
Teppers, E., Luyckx, K., Klimstra, T. A., & Goossens, L. (2013). Loneliness and Facebook motives in adolescence: A longitudinal inquiry into directionality of effect. Journal of Adolescence 37 (5) , 691-699. doi : 10.1016/ j .adolescence.2013.11.003
Wehrli, S. (2008). Personality on Social Network Sites: An Application of the Five Factor Model. ETH Zurich Sociology Working Papers 7.
Wilson, K., Fornasier, S., & White, K. M. (2010). Psychological Predictors of Young Adults’ Use of Social Networking Sites. Cyberpsychology, Behavior, and Social Networking, 13(2), 173-177. doi:10.1089/cyber.2009.0094
Zalk, M. H., Branje, S. J., Denissen, J., Aken, M. A., & Meeus, W. H. (2011). Who Benefits From Chatting, and Why? The Roles of Extraversion and Supportiveness in Online Chatting and Emotional Adjustment. Personality and Social Psychology Bulletin, 37(9), 1202-1215. doi: 10.1177/0146167211409053.
Zhao, S., Grasmuck, S., & Martin, J. (2008). Identity construction on Facebook: Digital empowerment in anchored relationships. Computers in Human Behavior, 24(5), 1816-1836. doi: 10.1016/j.chb.2008.02.012
Zywica, J., & Danowski, J. (2008). The Faces of Facebookers: Investigating Social Enhancement and Social Compensation Hypotheses; Predicting FacebookTM and Offline Popularity from Sociability and Self-Esteem, and Mapping the Meanings of Popularity with Semantic Networks. Journal of Computer-Mediated Communication, 14(1), 1-34. doi:10.1111/j.1083-6101.2008.01429.x
Acknowledgements: This manuscript is based on
Samantha Stronge’s honours research project supervised by Chris Sibley. This research was supported by a Templeton World Charity Foundation Grant (ID: 0077). Mplus syntax for the models reported here will be posted on the NZAVS website upon acceptance of this article. Syntax and data are also available upon request for reviewing purposes. www.psych.auckland.ac.nz/uoa/NZAVS
Address for CorrespondenceSamantha StrongeSchool of PsychologyUniversity of AucklandPrivate Bag 92019,Auckland,New Zealand.Email: [email protected]
New Zealand Journal of Psychology Vol. 44 No. 2, September 2015• 14 •
E. Muriwai, C. A. Houkamau, C. G. Sibley
Culture as Cure? The Protective Function of Māori Cultural Efficacy
on Psychological Distress Emerald Muriwai, Carla A. Houkamau, Chris G. Sibley
University of Auckland, New Zealand
Māori, the indigenous peoples of New Zealand, continue to experience health disparities in comparison to other ethnic groups. Previous research suggests Māori who affiliate jointly as Māori and Pākehā (New Zealand European) tend to experience different psychological outcomes than those who solely identify as Māori. Using a culturally-specific approach we propose and test an Efficacy-Distress Buffering Model, which posits that high levels of Māori Cultural Efficacy should have a buffering function, protecting Māori against Psychological Distress (N = 632). Our findings indicate that Māori with a higher level of Cultural Efficacy showed greater psychological resilience. In contrast, increased rates of psychological distress were documented amongst those who were lower in Cultural Efficacy and this effect was most pronounced among individuals who identified solely as Māori. Our results support a ‘culture-as-cure’ perspective and indicate that increased Māori Cultural Efficacy has a direct protective effect for those who may be at risk of negative psychological outcomes and associated risk factors.
Keywords: Māori, protective factors, resilience, stress-buffer, psychological distress, mental health.
“Kia mau koe ki ngā kupu ā ōu tūpuna, kia mau ki to Māoritanga, ” “Hold fast the words of your ancestors, hold fast your Māori culture.” – Māori whakataukī
Māori are the indigenous people who comprise 15% of the population in Aotearoa, New Zealand (Statistics New Zealand, 2013). Māori continue to experience health disparities compared to the European or Pākehā majority (Robson & Reid, 2001; Borrel, McCreanor, Jensen & Barnes, 2009; Sibley, Harré, Hoverd & Houkamau, 2011; Houkamau & Sibley, 2011). Māori clinicians and researchers tend to emphasise that interventions meant to benefit Māori must be culturally appropriate and address Māori cultural needs in order to be effective (e.g. Durie, 1985, 1986, 1997, 2001). The reasoning behind the view that ‘culture is cure’ is based on both theory and practice which suggests that greater access to,
awareness of and engagement in Māori cultural traditions (e.g. Tikanga Māori, Te Reo Māori, Whanaungatanga) can serve as a protective factor against a range of negative outcomes faced by Māori (e.g. Borell, 2005; Durie, 1994, 1997; Houkamau & Sibley, 2011; Mead. S, 1999; Mead. H, 2003). Contextually, enculturation is not readily available to many Māori due to the intersecting forces of racism, mass deculturation, assimilation and other remnants of colonisation (see: Houkamau & Sibley, 2011). Additionally, previous research suggests Māori who affiliate jointly as Māori and Pākehā (from here on referred to as mixed Māori-Europeans) experience different psychological outcomes to those who solely identify as Māori (Houkamau & Sibley, 2011; Marie, Boden & Fergusson, 2008). With this in mind this study investigates the buffer ing effects of Māori enculturation using a within-culture measure, ‘Cultural Efficacy’, which was designed specifically for Māori from
Houkaumau and Sibley’s (2010, 2015) Multi-Dimensional Model of Māori Identity and Cultural Engagement.
In this study we propose an Efficacy-Distress Buffering Model of Māori identity which addresses the theoretical discrepancy between research identifying the protective function of enculturation (measured as ‘Cultural Efficacy’) and the documented differences in psychological outcomes experienced by sole-identifying Māori relative to mixed Māori-Europeans (e.g. Ward, 2006; Marie et al., 2008; Houkamau & Sibley, 2014). Our model posits that high levels of Cultural Efficacy should have a buffering function which protects Māori against psychological distress. We anticipate that higher levels of Cultural Efficacy will have a more pronounced effect on sole-identifying Māori, relative to their mixed Māori-European counterparts. Thus, our model asserts that sole-identifying Māori who are high in Cultural Efficacy will show greater psychological resilience than sole-identifying Māori with lower levels. Indeed, our model explores the possibility that sole-identifying Māori who are high in Cultural Efficacy may experience better psychological outcomes than mixed Māori-Europeans regardless of the latter group’s Cultural Efficacy. We test our model using data from the New Zealand Attitudes and Values Study, a national probability postal survey.
A brief review of Māori diversityResearch on indigenous identity in
Aotearoa has been limited in capturing the unique characteristics and diverse range of experiences which constitute ‘being Māori’ (e.g. Cormack & Robson, 2010; Durie, 1994; Houkamau, 2006; Houkamau & Sibley, 2011; Kukutai, 2004, Kukutai & Zealand, 2008,
• 15 •New Zealand Journal of Psychology Vol. 44 No. 2, September 2015
The Protective Function of Māori Cultural Efficacy
Kukutai & Callister, 2009; Moeke-Pickering, 1996; Mikaere, 2004; Poata-Smith, 2013). In the past, Māori have often been homogenised into a mono-dimensional and essentialised group identity which overlooks and erases the vast diversity among Māori at both a national and tribal level. In Te Ao Māori (The Māori World), Māori traditionally affiliate to subgroups such as iwi (tribe), hapū (sub-tribe) and whānau (family). Today some Māori have formed a variety of new identities which resonate with the subcultures of their various geographical locations (i.e. ‘Southside pride’) where access to Te Ao Māori may be limited (e.g. Borrel, 2005). The variation in how Māori affiliate is often overlooked when Māori identity is considered solely on the basis of Māori culture (Borrel, 2005; Houkamau & Sibley, 2014, Ramsden, 1993). Although today nearly 20% of Māori are unable to identify their hapū or iwi affiliations (Statistics New Zealand, 2013) it is important to recognise Māori identities are constructed within the diversity of a complex, colonised reality.
R e s e a r c h e r s h a v e o f t e n distinguished Māori identities in relation to the way Māori engage with and/or have access to Māori culture (Houkamau & Sibley, 2011, 2014; Marie, et al., 2008). This approach is consistent with many decades of kōrero (discussion) dedicated to exploring the protective role Māori culture may play in increasing and maintaining the wellbeing of Māori (see: Durie, 1985, 2004). However, it is problematic to assume that Māori wellbeing is enabled solely by full enculturation in Te Ao Māori. Due to colonisation, access to one’s culture is limited by context rather than choice. This said, ethnic affiliation appears to be a matter of choice for some. Studies suggest self-identifying as solely Māori or mixed Māori-European may be oriented by choice (or ‘prioritisation’) based on one’s experiences – and presumably their connectedness to Te Ao Māori (Kukutai & Callister, 2009; Houkamau & Sibley, 2014). By investigating Māori diversity within the measures of our study we hope to recognise that Māori with higher levels of Cultural Efficacy may be more psychologically resilient. In exploring this possibility we also aim
to identify those at risk of psychological distress and we hope to show further support for the kaupapa that Māori culture promotes Māori well-being.
He aha te raruraru? What is the problem for Māori today?
In recent years several researchers have explored the apparent differences in health, socio-economic, education and corrections outcomes between sole-identifying Māori and mixed Māori-Europeans (e.g., Cormack & Robson, 2010; Houkamau & Sibley, 2014; Kukutai, 2004; Mikaere, 1999; Pihama, 2001). The distinction between these two groups has been subject of debate due to the fluidity and generational diversity of Māori identities in Aotearoa (Callister, 2004). Studies indicate that sole-identifying Māori are more likely to experience overt racism in their interactions with Pākehā (Nairn & McCreanor, 1991; Pihama, 2001; Thomas & Nikora, 1995). It is important to understand this point of difference as racism is a widely-acknowledged key determinant of detrimental outcomes for Māori internally, interpersonally, institutionally and societally (Moewaka-Barnes, Taiapa, Borell and McCreanor, 2013).
Mixed Māori-Europeans appear to be at an advantage due to their affiliation with the Pākehā majority. Limited research has focused on the realities of Mixed Māori-Europeans, but studies in this area seem to be evolving (e.g. Gibson, 1999; Houkamau &Sibley, 2014; Kukutai & Zealand, 2008; Paterson, 2010; Ward, 2006). Research suggests that mixed Māori-Europeans often possess the ability to draw upon a larger range of resources which are available to Māori and Pākehā for support and navigation in Pākehā society (Houkamau & Sibley, 2014; Marie et al., 2008). Following this it is possible that the absence of cultural connection may affect mixed Māori-Europeans less than that it does for their sole-Māori counterparts, though mixed Māori-Europeans encounter their own unique struggles (see: Webber, 2008). Some researchers suggest that mixed Māori-Europeans possess the ability to be ‘ethnically mobile’ which may position them at an advantage compared to sole-identifying Māori
(e.g. Borell, McCreanor, Jensen & Barnes, 2009; Cormack & Robson, 2010; Gibson, 1999; Houkamau & Sibley, 2014; Kukutai, 2004; Leonardo, 2004; Storrs, 1999). This said, recent research suggests that even with this ‘advantage’ mixed Māori-Europeans still suffer similar negative outcomes as sole-identifying Māori, which are vastly disproportionate to the outcomes of the European majority (Houkamau & Sibley, 2014).
Te Ahurea, te Tuariki, me te Hauora Hinengaro – Culture, Identity and Māori Mental Health
Most research identifies Māori as the ethnic group with the greatest prevalence of issues relating to psychological health and wellbeing (Baxter, Kokaua, Wells, McGee, Oakley Brown, 2006; Edmonds, Williams & Walsh, 2000). Māori Mental Health (or Hauora Hinengaro) has been primarily investigated through qualitative frameworks addressing the theory and practice of culture as a protective resource (see: Durie, 1985, 2004). Many Māori (academics and communities alike) have identified factors which promote positive Māori mental health (e.g. Durie 1985, 1991, 2001; Harris, Tobias, Jeffreys, Waldegrove, Karlsen & Nazaroo, 2006, Harris, Cormack & Stanley, 2013). Unfortunately, much of this remains in theory rather than practice (Mathieson, Mihaere, Collings, Dowell & Stanley, 2012). Researchers have explored a number of associated factors when it comes to Māori Mental Health. Harris and colleague. (2013) shared some critical insights in their study of Māori Mental Health where they suggest socially-assigned ethnicity (rather than self-identified ethnicity) held a powerful relationship with mental health for all Māori. Social factors like these remain largely unaddressed by a dominant and culturally incompatible Western framework (DeSouza, 2008; Pihama, Smith, Taki, & Lee, 2004; Wilson, 2008).
Recent studies have drawn a variety of conclusions regarding the differences between sole-identifying Māori relative mixed Māori-Europeans and their comparative mental health outcomes. Marie and colleagues’ (2008)

New Zealand Journal of Psychology Vol. 44 No. 2, September 2015• 16 •
E. Muriwai, C. A. Houkamau, C. G. Sibley
analysis of data from the Christchurch longitudinal study of mental health (N = 1265) reported that sole-identifying Māori had 1.3x worse mental health outcomes (i.e. higher prevalence of anxiety, depression) than non-Māori. Comparatively, their results suggested that mixed Māori-Europeans were even worse off with 1.6x higher rates of mental illnesses than non-Māori. This study proposed that ‘cultural identification’ may be the buffer to negative mental-health outcomes, hypothesising that those higher in cultural identification would experience lower rates of mental disorder (assessed using scales specific to Anxiety, Major Depression, Substance Abuse and ‘suicide related behaviour’). Furthermore, Marie and colleagues (2008) proposed that sole-Māori were more likely to be in possession of a ‘secure Māori identity’, seemingly overlooking that many sole-identifying Māori may lack vital access to their Māori culture and identity.
The f indings by Marie and colleagues (2008) provide a different perspective to more recent studies which situate mixed Māori-Europeans at an advantage with regards to mental health (e.g. Harris et al., 2013; Houkamau & Sibley, 2014). Nonetheless, the differing results emphasise a need for clarification in what constitutes ‘ethnic identity’ and the relationship between identification/affiliation and Māori culture. We hope to clarify this with our measures. Marie and colleagues’ (2008) appeared to combine cultural identity with a type of cultural efficacy, implying that the blending of these measures exist as a parsimonious and unvarying unit for all sole-identifying Māori. This idea overlooks the subordinate, and arguably most vulnerable, group of Māori who identify solely as Māori but lack access to Māori culture. For this reason it seems that the resources sole-identifying Māori may access to protect their health against instances of adversity are of considerable importance. In a society subjected to colonisation and its on-going effects, a focus on protective factors for sole-identifying Māori and their health is not only interesting, but necessary.
The current study investigates Māori mental health, or hauora hinengaro,
as indexed by the cross-cultural measure for Psychological Distress, the Kessler-6 (K-6) (Houkamau & Sibley, 2013; Kessler, Andrews, Colpe, Hiripi, Mroczek, Normand, Walters & Zaslavsky, 2002; Krynen, Osborne, Duck, Sibley & Houkamau, 2013). Psychological Distress is a well-known antecedent to poor mental health and/or disorder which is commonly explored through the administration of the Kessler-6 test (Kessler et al., 2002). This test has been widely distributed throughout health practices in Aotearoa in both the Kessler-6 and Kessler-10 versions of the measure (Bécares, Cormack & Harris, 2013; Harris et al., 2013; Krynen et al., 2013). Interestingly, the K6 has been suggested as an inappropriate tool for some indigenous peoples such as Indigenous Australians for whom an abbreviated ‘K5’ test is used – erasing the ‘worthless’ dimension from the scale (Stolk, Kaplan & Szwark, 2014).
Māori are prevalent clients in Aotearoa’s mental health system and are overrepresented in diagnoses of mental illness (e.g. Harris et al., 2013; Mathieson et al., 2012; Ring & Brown, 2003; Sachdev, 1990, 1997, 1998). In general, Māori appear to be at higher risk for developing several mental disorders including Anxiety, Major Depression, Substance Disorders and ‘suicide-related behaviour’ (Marie et al., 2008; Sachdev, 1998). The young Māori population are particularly at risk for psychological distress (Kukutai & Zealand, 2008; Kukutai & Calister, 2009; Marie et al., 2008; van Meijl, 2006). In his writing on Māori Illness and Healing, Marsden (1998) identifies that cultural intrusion and exploitation pose the most ‘serious threats’ to Māori mental and spiritual health. Despite decades of expansion to the field (see: Durie, 1985 to present) Māori approaches to mental health are vastly underused by practitioners. We anticipate this study will provide some meaningful findings as to why cultural pedagogies for hauora hinengaro may, and should, be encouraged to improve Māori mental health.
Overview and Guiding Hypotheses
The current study proposes an Efficacy-Distress Buffering Model o f Psycho log ica l Dis t r e s s fo r Māori. Buffering models explore the conditions under which certain resources may protect or buffer people from negative outcomes. In Western psychology, Cohen and Wills (1985) famously proposed a buffering model investigating how high or low levels of social support might play a buffering role in the relationship between stress and wellbeing. Cohen and Wills’ (1985) buffering hypothesis was confirmed and their results provided the basis for encouraging greater social support to be provided for those who were at risk of high levels of stress. Furthermore, many others have replicated these findings (e.g. Kornblith et al., 2001; Salanova, Llorens, Cifre, Martínez, & Schaufeli, 2003; Terry, Neilsen & Perchard, 1993; Viswesvaran et al., 1999). Within Psychology buffering models have been used as appropriate tools to explore factors which may protect those most at risk of adverse outcomes.
The Efficacy-Distress buffering model we propose states that, for Māori, levels of Cultural Efficacy should function as a key protective factor that ‘buffers’ or ‘breaks’ the link between Ethnic Affiliation and levels of Psychological Distress. We tested this Efficacy-Distress buffering hypothesis using Houkamau and Sibley’s (2010, 2015) Multi-Dimensional Model of Māori Identity and Cultural Engagement (MMM-ICE 2) and data from the New Zealand Attitudes and Values Study (NZAVS) Māori focus sample from 2012. The current study follows through on Houkamau and Sibley’s (2014) research into the differences in outcomes between sole-identifying and mixed Māori-Europeans. Houkamau & Sibley (2014) suggested that these groups differed in fundamental ways relating to their attitudes as Māori as well as their economic and social wellbeing. This study extends on this work with the aim of understanding why such differences occur with reference to the protective function of Māori Cultural Efficacy (Houkamau & Sibley, 2010, 2011, 2015).

• 17 •New Zealand Journal of Psychology Vol. 44 No. 2, September 2015
The Protective Function of Māori Cultural Efficacy
We argue that high levels of Cultural Efficacy will significantly buffer levels of psychological distress for sole-identifying Māori and mixed Māori-Europeans. We expect the effect to be more pronounced among sole-identifying Māori based on the notion that mixed-Māori-Europeans may generally able to access more resources to cope with the risk of Psychological Distress. We test our model by assessing whether Cultural Efficacy buffers or ameliorates the increased rates of psychological distress reported by solely-identified Māori relative to Māori who affiliate jointly with Māori and European ancestry. Stated formally, our model predicts that Cultural Efficacy should moderate the difference in psychological distress between sole-identifying Māori and mixed Māori-Europeans; such increased rates of psychological distress documented amongst those who identify solely as Māori occur only for individuals who are also low in Cultural Efficacy.
Method
ParticipantsT h e N Z AV S M ā o r i F o c u s
questionnaire contained responses from 632 participants (398 Female, 234 Male) who identified as Māori and/or having Māori ancestry. Participants all answered “Yes” to the question “Do you identify as Māori and/or have ancestors who are Māori?” This follows the inclusion criteria for administering the MMM-ICE recommended by Houkamau and Sibley (2010, 2015). Participants were sorted by their selection of both ancestral affiliation (aforementioned) and ethnic affiliation as ‘Māori’ and/or ‘NZ European’. From these self-reported measures two main ethnic affiliations emerged; those who answered yes to Māori ancestry and ticked ‘Māori’ as their only ethnic identification emerged as ‘Sole-identified Māori’ (N = 269) and those who answered yes to Māori ancestry and ticked both ‘Māori’ and ‘NZ European’ comprised the second affiliation: ‘Mixed Māori-European’ (N = 363). Participants ranged from 18 to 69 years (M =44.15, SD = 13.0) and roughly two thirds were employed (426 Employed, 206 Unemployed). As well as this, participants ranged in
levels of deprivation with the majority being on the more deprived of the scale which ranged from 1-10 (1 being low deprivation, 10 being high deprivation) as indexed by The NZ Deprivation Index (M = 6.35, SD = 2.871).
Sampling Procedure Participants were part of the Time
4 of the New Zealand Attitudes and Values Study (N =12,183). This phase of the NZAVS included a booster sample aimed specifically at recruiting Māori participants (Frame 5 of the Time 4 NZAVS). To recruit Māori into the sample 9,000 people were randomly selected from those who indicated on the 2012 Electoral Roll that they were of Māori ancestry. A total of 690 Māori participants responded to this booster sample.
When adjusting for the overall address accuracy of the electoral roll as a whole, this represents an (adjusted) response rate of 7.78%. It should be noted that this response rate is lower than that observed for the main (full random probability) sample frames used in the NZAVS, which give responses rates of approximately 16%. The low response rate for this sample likely indicates a combination of factors relating to Māori. Among the most influential of factors is the overall reduced likelihood of Māori participants responding to postal surveys in general, combined with the possibility that contact details for Māori in the electoral roll may (on average) have a lower level of accuracy. It is likely that this relatively low response rate was also partially affected by the longitudinal nature of the study as participants are asked to provide their contact details for the next 15 years and indicate that they were willing to be contacted to complete similar questionnaires in the future.
To efficiently test this target demographic g roup , ques t ions specifically designed for Māori were administered for these participants a m o n g s t t h e g e n e r a l T i m e 4 Questionnaire. The cover letter introduced the survey as a ‘The New Zealand Attitudes and Values Study – Māori Identity Focus Questionnaire.’ The lead researcher and primary point of contact for this sample frame was the second author, who is of Māori descent, and was introduced to participants in the
cover letter by listing Iwi affiliations. This approach reiterates the kaupapa of tika (respectful relationships), aroha ki te tangata (respect for the people) and connectedness with whānau, hapu and the wider Māori community (Durie, 1998; Pihama, 2012; Smith, 1999). Māori participants were informed that they had been randomly sampled for this study when they indicated that they were of Māori descent on the electoral roll. The questionnaire was similar in format and content to the standard NZAVS questionnaire, with the exception that it included approximately 2 pages of questions revised specifically to assess aspects of identity and wellbeing specifically for Māori, and in Māori cultural context.
Questionnaire MeasuresParticipants completed the Cultural
Efficacy subscale of the revised MMM-ICE-2 (Houkamau & Sibley, 2014). The Cultural Efficacy subscale, formally named Cultural Efficacy and Active Identity Engagement (CEAIE) “refers to the extent to which the individual perceives they have the personal resources required… to engage appropriately with other Māori in Māori social and cultural contexts” (Houkamau & Sibley, 2010 p.13). This measure represents ‘cultural competency’ as an appropriate and important dimension of Māori identity which varies among different Māori and their various experiences. The Cultural Efficacy factor has been rigorously statistically validated using exploratory and confirmatory factor analysis as well as item response theory (Houkamau & Sibley, 2010, 2015, Sibley & Houkamau, 2013).
Cultural Efficacy was assessed by asking participants rated how strongly they agreed or disagreed with eight statements on a scale from 1 (strongly disagree) to 7 (strongly agree). Reverse-worded items were recoded, so that a higher score represented higher levels of cultural efficacy. Rating of each item were then averaged to give an overall scale score, with 1 representing a low level of cultural efficacy and 7 representing a high level (M= 4.74, SD = 1.37, α = .85).
Items included in the Cultural Efficacy and Active Identity Engagement

New Zealand Journal of Psychology Vol. 44 No. 2, September 2015• 18 •
E. Muriwai, C. A. Houkamau, C. G. Sibley
subscale include ‘I don’t know how to act like a real Māori on a marae. (reverse coded)’, ‘I can’t do Māori cultural stuff properly.(reverse coded)’, ‘I can’t do Māori culture or speak Māori.(reverse coded)’, ‘I know how to act the right way when I am on a marae.’, ‘I’m comfortable doing Māori cultural stuff when I need to.’, ‘I have a clear sense of my Māori heritage and what it means for me.’, ‘I try to kōrero (speak) Māori whenever I can.’, ‘I sometimes feel that I don’t fit in with other Māori’ (reverse coded).
Psychological distress was assessed using the Kessler-6 (or K6). The Kessler-6 is a self-report measure of non-specific psychological distress and is widely used throughout Western populations to assess mental health (Kessler et al., 2002; see also Krynen et al., 2013, for validation information in the NZAVS). The Kessler-6 and Kessler-10 are regularly used as assessment tools in mental health in New Zealand, both for Māori and non-Māori (Bécares et al., 2013; Mathieson et al., 2012). Participants read the item stem ‘during the last 30 days, how often did…’ and then rated the six items below on a scale from 0 (none of the time) to 4 (all of the time). Rating of each item were then averaged to give an overall scale score, with 0 representing a low level of psychological distress and 4 representing a high level (M= .92, SD = .79, α = .88).
Items included in the Kessler-6 scale corresponded to the statement ‘During the last 30 days, how often did’; ‘… you feel nervous?’, ‘… you feel hopeless?’, ‘… you feel restless or fidgety?’, ‘… you feel so depressed that nothing could cheer you up?’, ‘… you feel that everything was an effort?’ and ‘… you feel worthless?’
New Zealand Deprivation IndexWe included an index of deprivation
as a covariate in our analyses. We measured the deprivation of participants’ immediate (small area) neighborhood using the New Zealand Deprivation Index (Salmond, Crampton & Atkinson, 2007). New Zealand is unusual in having rich census information about each area unit/neighborhood of the country available for research purposes. The smallest of these area units are
meshblocks. Statistics New Zealand (2006) defined a meshblock as ‘a defined geographic area, varying in size from part of a city block to large areas of rural land. Each meshblock abuts against another to form a network covering all of New Zealand including coasts and inlets, and extending out to the two hundred mile economic zone. The geographical size of these meshblock units differs depending on population density, but each unit tends to cover a region containing a median of roughly 90 residents (M = 103, SD = 72, range = 3-1,431).
The 2006 New Zealand Deprivation Index (Salmond et al., 2007) uses aggregate census information about the residents of each meshblock to assign a decile-rank index from 1 (least deprived) to 10 (most deprived) to each meshblock unit. Because it is a decile-ranked index, the 10% of meshblocks that most deprived areas are given a score of 1, the next 10% a score of 2, and so on. The index is based on a principal components analysis of the following nine variables (in weighted order): proportion of adults who received a means-tested benefit, household income, proportion not owning own home, proportion single-parent families, proportion unemployed, proportion lacking qualifications, proportion household crowding, proportion no telephone access, and proportion no car access.
The New Zealand Deprivation Index thus reflects the average level of deprivation for small neighborhood-type units (or small community areas) across the entire country. The index is a well-validated index of the level of deprivation of small area units, and has been widely used in health and social policy research examining numerous health outcomes, including mortality, rates of hospitalization, smoking, cot death, and access to health care, to name just a few examples (e.g., Crampton, Salmond, Woodward & Reid, 2000; Salmond & Crampton, 2000; Stewart, Salmond & Crampton, 2000). The index is also widely used in service planning by government and local council, and is a key indicator used identify high needs areas and allocate resources such as health funding (see Salmond & Crampton, 2012, White, Gunston,
Salmond, Atkinson, & Crampton, 2008, for review). The current sample had a mean deprivation index of 6.35 (SD =2.87).
Results
Overview of analyses The Efficacy-Distress buffering
model was tested using moderated regression analyses. To do this we assessed the extent to which differences in psychological distress (indexed by Kessler-6 scores) between ‘Sole-Māori’ and ‘mixed Māori-Europeans’ were moderated by differences in Cultural Efficacy. Specifically, a model was tested in which ethnic affiliation as Sole-identified Māori or Mixed Māori-European, scores on the Cultural Efficacy subscale of the MMM-ICE 2, and the interaction of these two variables predicted Kessler-6 scores.
To investigate the Efficacy-Distress Buffering Model moderated regression analyses were conducted using data from the New Zealand Attitudes and Values Study (NZAVS) Māori focus sample (N= 632). To complete these analyses an interaction or product term was created by multiplying (dummy coded) ethnic affiliation as either Sole or Mixed Māori-European with continuous (centred) scores on the MMM-ICE2 measure of Cultural Efficacy. In this model, ethnic affiliation was the predictor variable, Cultural Efficacy was the buffer or moderating variable and psychological distress was the criterion or outcome variable. The predictor (Ethnic Affiliation), moderator (Cultural Efficacy) and the interaction term were entered as simultaneous predictors of the outcome variable (Psychological Distress). If the model holds, then the interaction term should predict unique variance in K6 scores beyond that explained by the simple linear combination of the predictor and moderator. If this hypothesized interaction was significant, then analyses would indicate a moderated effect, where the extent to which one variable is linked with the outcome depends on the level of the other (moderating) variable. Other demographics such as gender, age, neighbourhood deprivation (NZDep) and employment status were also included as covariates in the model.
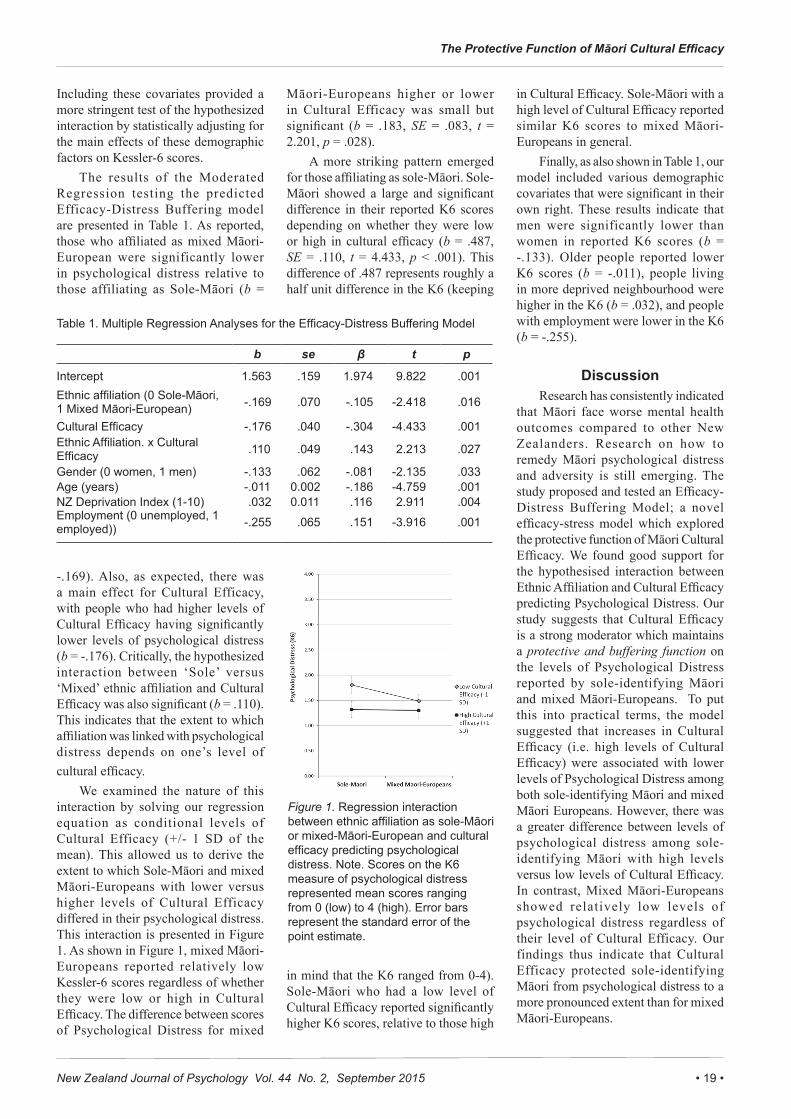
• 19 •New Zealand Journal of Psychology Vol. 44 No. 2, September 2015
The Protective Function of Māori Cultural Efficacy
Including these covariates provided a more stringent test of the hypothesized interaction by statistically adjusting for the main effects of these demographic factors on Kessler-6 scores.
The results of the Moderated Regression testing the predicted Efficacy-Distress Buffering model are presented in Table 1. As reported, those who affiliated as mixed Māori-European were significantly lower in psychological distress relative to those affiliating as Sole-Māori (b =
-.169). Also, as expected, there was a main effect for Cultural Efficacy, with people who had higher levels of Cultural Efficacy having significantly lower levels of psychological distress (b = -.176). Critically, the hypothesized interaction between ‘Sole’ versus ‘Mixed’ ethnic affiliation and Cultural Efficacy was also significant (b = .110). This indicates that the extent to which affiliation was linked with psychological distress depends on one’s level of cultural efficacy.
We examined the nature of this interaction by solving our regression equation as conditional levels of Cultural Efficacy (+/- 1 SD of the mean). This allowed us to derive the extent to which Sole-Māori and mixed Māori-Europeans with lower versus higher levels of Cultural Efficacy differed in their psychological distress. This interaction is presented in Figure 1. As shown in Figure 1, mixed Māori-Europeans reported relatively low Kessler-6 scores regardless of whether they were low or high in Cultural Efficacy. The difference between scores of Psychological Distress for mixed
Māori-Europeans higher or lower in Cultural Efficacy was small but significant (b = .183, SE = .083, t = 2.201, p = .028).
A more striking pattern emerged for those affiliating as sole-Māori. Sole-Māori showed a large and significant difference in their reported K6 scores depending on whether they were low or high in cultural efficacy (b = .487, SE = .110, t = 4.433, p < .001). This difference of .487 represents roughly a half unit difference in the K6 (keeping
in mind that the K6 ranged from 0-4). Sole-Māori who had a low level of Cultural Efficacy reported significantly higher K6 scores, relative to those high
in Cultural Efficacy. Sole-Māori with a high level of Cultural Efficacy reported similar K6 scores to mixed Māori-Europeans in general.
Finally, as also shown in Table 1, our model included various demographic covariates that were significant in their own right. These results indicate that men were significantly lower than women in reported K6 scores (b = -.133). Older people reported lower K6 scores (b = -.011), people living in more deprived neighbourhood were higher in the K6 (b = .032), and people with employment were lower in the K6 (b = -.255).
DiscussionResearch has consistently indicated
that Māori face worse mental health outcomes compared to other New Zealanders. Research on how to remedy Māori psychological distress and adversity is still emerging. The study proposed and tested an Efficacy-Distress Buffering Model; a novel efficacy-stress model which explored the protective function of Māori Cultural Efficacy. We found good support for the hypothesised interaction between Ethnic Affiliation and Cultural Efficacy predicting Psychological Distress. Our study suggests that Cultural Efficacy is a strong moderator which maintains a protective and buffering function on the levels of Psychological Distress reported by sole-identifying Māori and mixed Māori-Europeans. To put this into practical terms, the model suggested that increases in Cultural Efficacy (i.e. high levels of Cultural Efficacy) were associated with lower levels of Psychological Distress among both sole-identifying Māori and mixed Māori Europeans. However, there was a greater difference between levels of psychological distress among sole-identifying Māori with high levels versus low levels of Cultural Efficacy. In contrast, Mixed Māori-Europeans showed relatively low levels of psychological distress regardless of their level of Cultural Efficacy. Our findings thus indicate that Cultural Efficacy protected sole-identifying Māori from psychological distress to a more pronounced extent than for mixed Māori-Europeans.
Figure 1. Regression interaction between ethnic affiliation as sole-Māori or mixed-Māori-European and cultural efficacy predicting psychological distress. Note. Scores on the K6 measure of psychological distress represented mean scores ranging from 0 (low) to 4 (high). Error bars represent the standard error of the point estimate.
Table 1. Multiple Regression Analyses for the Efficacy-Distress Buffering Model
b se β t p
Intercept 1.563 .159 1.974 9.822 .001Ethnic affiliation (0 Sole-Māori, 1 Mixed Māori-European) -.169 .070 -.105 -2.418 .016
Cultural Efficacy -.176 .040 -.304 -4.433 .001Ethnic Affiliation. x Cultural Efficacy .110 .049 .143 2.213 .027
Gender (0 women, 1 men) -.133 .062 -.081 -2.135 .033Age (years) -.011 0.002 -.186 -4.759 .001NZ Deprivation Index (1-10) .032 0.011 .116 2.911 .004Employment (0 unemployed, 1 employed)) -.255 .065 .151 -3.916 .001

New Zealand Journal of Psychology Vol. 44 No. 2, September 2015• 20 •
E. Muriwai, C. A. Houkamau, C. G. Sibley
Adding to recent literature on Māori identity diversity, this study confirms a difference in wellbeing between Māori of different Ethnic Affiliations (i.e. sole-identifying Māori and mixed Māori-Europeans). Critically, sole-identifying Māori who reported lower Cultural Efficacy scores reported greater levels of Psychological Distress than sole-identifying Māori with higher Cultural Efficacy, reflecting an almost half-point difference on the Kessler scale. Such a difference could distinguish the critical distinction between ‘good’ psychological health and potential diagnoses of mental illness stemming from psychological distress. Sole-identifying Māori with High Cultural Efficacy shared similar levels of (lower) psychological distress as mixed Māori-Europeans regardless of the Cultural Efficacy of this latter group. Our findings suggest that mixed Māori-Europeans have generally lower levels of psychological distress because they are able to access Māori and Pākehā cultural resources to buffer and protect their mental health. Sole-identifying Māori who reported low Cultural Efficacy scores, on the other hand, presumably have limited resources to protect their mental health. As sole-identifying Māori only affiliate to one ethnic group it is possible that they have less social-ethnic (Māori) group resources to draw upon in other domains as well.
Demographic covariates were included in the final model to strengthen the overall findings of the study. Even when controlling for gender, age, deprivation and employment, Cultural Efficacy still played a significant role in moderating levels of Psychological Distress among different Māori people. Perhaps replicating more general findings among the clinical field, men exhibited lower psychological distress than women throughout the sample. Consistent with ideas surrounding whānau and matauranga Māori (Māori knowledge), older people within the sample generally exhibited lower levels of Psychological Distress. This is in line with the idea that older people or kaumātua (i.e. koro and kuia) contain stability and mana as the protectors of Māori people and their customs, knowledge and whakapapa.
Ultimately these findings suggest that sole identifying Māori who are young and female are at greater risk of Psychological Distress and plausibly more susceptible to a mental health diagnosis.
Employment and Deprivation covariates included in the model provided a more holistic understanding of the prevalence of Psychological Distress among the wider Māori population. Those who were employed were on average .255 lower in their score on the K6 measure of Psychological Distress relative to the unemployed. Importantly, unemployed Māori made up nearly a third of the total sample in this study. Results from the Deprivation covariate also offer vital information on the factors which could put Māori at greatest risk to Psychological Distress. The New Zealand Deprivation Index ranged from 1-10 with 1 indicating the least deprived areas and 10 indicating the most deprived. The model predicted that each one unit increase in deprivation predicted an increase in the K6 of .032 units. Framed within the scale of 1-10 this means that the predicted difference in K6 scores between Māori living in the least deprived (NZDep = 1) versus most deprived (NZDep = 10) regions was .288. Again, this is a significant and large difference. Certainly, employment status and deprivation, when coupled with being a sole-identifying Māori with low Cultural Efficacy could potentially contain the vital ingredients for high levels of psychological distress and consequent levels of mental health illnesses.
Tātau Tātau – Implications for Māori Health and Collective Responsibility
This s tudy contr ibutes to a longstanding literature endorsing Māori culture as a protective resource to maintain and increase Māori wellbeing. This study offers suggestions which may appeal to the institutions with the ability to investigate ways to increase Cultural Efficacy for Māori by Māori in the mental-health sector (Ruwhiu, 2009). Durie (1998) outlined that Māori health is a collective responsibility which is best addressed in Te Ao Māori, this study confirms this imperative. As Māori are already overrepresented
in most indices of mental-illnesses, the suggestion that increased Cultural Efficacy could remedy psychological distress is a hugely important finding for the reality of the most vulnerable in the Māori population.
Further research needs to be conducted alongside experts in Māori Studies who understand the cultural facets of Hauora Hinengaro and Māori culture generally. To put this in simple terms, Māori cultural experts, clinicians, educators, academics, kaumātua and whānau need to work together holistically in the step forward in bettering Māori mental health. Although the measures of this study give good indication into specific cultural aspects of Māori life (i.e. knowing how to act on a marae), these measures are not specific to the relationship between culture and wellbeing (i.e. knowing how to use Māori medicine or other therapy).
Several existing models of Māori health have been used sporadically throughout the nation but what is apparent is that these initiatives (while excellent) tend to look after Māori after they have experienced psychological distress. This study suggests that increasing Cultural Efficacy, whether that be through exploring a number of different ways to ‘be Māori’ or ‘do Māori cultural things’, can act as a buffer or safeguard against psychological distress. The implication here is that early intervention should be a focus for the future of Māori mental health, especially so among the most vulnerable; sole-identifying rangatahi Māori. If earlier intervention is a realistic goal for Māori then it is possible that such intervention may generalise to better outcomes across the board for Māori in Aotearoa.
A Research Agenda for Future Study on Māori Identity and Wellbeing
Houkamau and Sibley (2014) h ighl ighted the impor tance of research which differentiates between sole-identifying and mixed Māori experiences. In saying this, we understand more diverse identities within the Māori population need to be considered in future research. It is possible that longitudinal models of identity and affiliation may shed more light on our findings. As well

• 21 •New Zealand Journal of Psychology Vol. 44 No. 2, September 2015
The Protective Function of Māori Cultural Efficacy
as this a continuing exploration into identification and affiliation as Māori needs to be considered within the complex colonised reality of today. Extending the agenda laid out by Houkamau and Sibley (2013), this research provides insight into which ‘subgroups’ in the Māori population may be at greatest risk to negative outcomes. Our study emphasised that sole-identifying Māori who are lacking in Cultural Efficacy may benefit the most by initiatives which may increase their Cultural Efficacy and thus decrease their levels of psychological distress. In reality this is a lot easier said than done and it is important to keep in mind that further alternatives need to be explored for diverse Māori populations.
More research in this area needs to address how and why sole-identifying Māori and mixed Māori-Europeans exhibit poorer mental health outcomes comparative to Europeans. Our study addresses Māori culture as a protective factor however, it is possible that there are other identity-related factors which may leave mixed Māori-Europeans and low Cultural Efficacy sole-Māori at a disadvantage. Indeed, our study suggests that it is possible that highly enculturated sole-identifying Māori may be in possession of the lowest levels of psychological distress. It is important to extend on this in future studies and address the complex variation in Māori identities and affiliation and explore beyond the measures used in this study. As well as this analyses of the construction of Māori identities and the influences of racism in modern Aotearoa need to be followed up on in future study.
Concluding commentsUltimately, we hope that this study
may contribute to the growing literature on different Māori identities and the ways in which culture can potentially protect Māori against negat ive outcomes. In light of our findings we think it is of great significance to expand understandings of Māori mental health and encourage the promotion of Māori culture from an early age. This study empirically supports the view that culture plays an important protective function for Maori. Further research needs to address the practicality of a
‘culture as cure’ perspective within the context of colonisation and the various needs of diverse Māori peoples today.
To conclude, we proposed and tested an Efficacy-Distress Buffering Model of psychological distress for Māori. This model posits that high levels of Cultural Efficacy should have a protective or buffering function that protects against psychological distress for Māori. Consistent with a ‘culture-as-cure’ perspective, our data indicated that Cultural Efficacy moderated the difference in psychological distress between sole-identifying Māori and mixed Māori-Europeans. Our findings indicated that Cultural Efficacy protected sole-identifying Māori from psychological distress to a more pronounced extent than for mixed Māori-Europeans. For sole-identifying Māori, a high level of Cultural Efficacy predicted lower psychological distress or higher psychological resilience, whereas those sole-identifying Māori who were low in Cultural Efficacy showed higher rates of psychological distress. Mixed Māori-Europeans, in contrast, showed relatively low levels of psychological distress regardless of their level of Cultural Efficacy. Our analysis indicates that sole-identifying Māori with low Cultural Efficacy may be most at risk of psychological distress. Knowing this, future research should focus on understanding the important role of culture for Maori people and how this can be understood in the context of diverse Māori realities. Our findings thus support the notion that increased Cultural Efficacy, or the ability to navigate the Māori world, has a direct protective effect that can reduce the risk of negative psychological outcomes and associated risk factors.
ReferencesBaxter, J., Kokaua, J., Wells, J. E., McGee,
M. A., & Oakley Browne, M. A. (2006). Ethnic comparisons of the 12 month prevalence of mental disorders and treatment contact in Te Rau Hinengaro: The New Zealand Mental Health Survey. Australian and New Zealand Journal of Psychiatry, 40(10), 905-913.
Bécares, L., Cormack, D., & Harris, R. (2013). Ethnic density and area deprivation: Neighbourhood effects on Māori health and racial discrimination in Aotearoa/New Zealand. Social Science &
Medicine, 88, 76-82. Borell, B. (2005). Living in the city Ain’t So
Bad: Cultural diversity of south Auckland Rangatahi. Unpublished Masters Thesis, Massey University.
Borell, B. A., Gregory, A. S., McCreanor, T. N., Jensen, V. G., & Barnes, H. E. M. (2009). “ It’s Hard at the Top but It’s a Whole Lot Easier than Being at the Bottom”: The Role of Privilege in Understanding Dispari t ies in Aotearoa/New Zealand. Race/Ethnicity: Multidisciplinary Global Contexts, 3(1), 29-50.
Callister, P. (2004). Ethnicity Measures, Intermarriage and Social Policy. Social Policy Journal of New Zealand Te Puna Whakaaro, 23, 109-140.
Cohen, S., & Wills, T. A. (1985). Stress, social support, and the buffering hypothesis. Psychological bulletin, 98(2), 310-357.
Cormack, D., & Robson, C. (2010). Classification and output of multiple ethnicities: considerations for monitoring Māori health: Report for Te Rōpū Rangahau Hauora a Eru Pōmare, Wellington.
Crampton, P., Salmond, C., Woodward, A., & Reid, P. (2000). Socioeconomic deprivation and ethnicity are both important for anti-tobacco health promotion. Health Education and Behavior, 27, 317-27.
DeSouza, R. (2008). Wellness for all: the possibilities of cultural safety and cultural competence in New Zealand. Journal of Research in Nursing, 13(2), 125-135.
Durie, M. H. (1985). A Māori perspective of health. Social Science & Medicine, 20(5), 483-486.
Durie, M. (1994). Whaiora: Māori health development . Auckland: Oxford University Press.
Durie, A. (1997). Te Aka Matua: Keeping a Māori identity. In P. Te Whaiti, M. McCarthy, & A. Durie (Eds.), Mai I Rangiatea: Māori wellbeing and development. Auckland: Auckland University Press/Bridget Williams Books.
Durie, M. (2001). Mauri ora: The dynamics of Māori health. Oxford University Press.
Durie, M. (2004). Understanding health and illness: research at the interface between science and indigenous knowledge. International Journal of Epidemiology, 33(5), 1138-1143.
Edmonds, L. K., Williams, S., & Walsh, A. E. (2000). Trends in Māori mental health in Otago. Australian and New Zealand Journal of Psychiatry, 34(4), 677-683.
Gibson, K. (1999). Māori women and dual ethnicity: Non-congruence,“passing” and “real” Māori. Paper presented
New Zealand Journal of Psychology Vol. 44 No. 2, September 2015• 22 •
E. Muriwai, C. A. Houkamau, C. G. Sibley
at the Māori psychology: research and practice–The proceedings of a symposium sponsored by the Māori and Psychology Research Unit, Hamilton.
Harris, R., Tobias, M., Jeffreys, M., Waldegrave, K., Karlsen, S., & Nazroo, J. (2006). Effects of self-reported racial discrimination and deprivation on Māori health and inequalities in New Zealand: cross-sectional study. The Lancet, 367(9527), 2005-2009.
Harris, R. B., Cormack, D. M., & Stanley, J. (2013). The relationship between socially-assigned ethnicity, health and experience of racial discrimination for Māori: analysis of the 2006/07 New Zealand Health Survey. BMC Public Health, 13(1), 1-11.
Houkamau, C. A. (2006). Identity and socio-historical context: Transformations and change among Māori women. Unpublished Doctoral thesis. University of Auckland.
Houkamau, C. A., & Sibley, C. G. (2010). The multi-dimensional model of Māori identity and cultural engagement. New Zealand Journal of Psychology, 39(1), 8-28.
Houkamau, C. A., & Sibley, C. G. (2011). Māori cultural efficacy and subjective wellbeing: A psychological model and research agenda. Social indicators research, 103(3), 379-398.
Houkamau, C. A., & Sibley, C. G. (2014). Social identity and differences in psychological and economic outcomes for mixed and sole-identified Māori. International Journal of Intercultural Relations, 40, 113-125.
Houkamau, C. A., & Sibley, C. G. (2015). The Revised Multidimensional Model of Māori Identity and Cultural Engagement (MMM-ICE2). Social Indicators Research, 122, 279-296.
Kessler, R.C., Andrews, G., Colpe, L.J., Hiripi, E., Mroczek, D.K., Normand, S.-L.T., Walters, E.E., & Zaslavsky, A. (2002). Short screening scales to monitor population prevalances and trends in nonspecific psychological distress. Psychological Medicine. 32(6), 959-976.
Kornblith, A. B., Herndon, J. E., Zuckerman, E., Viscoli, C. M., Horwitz, R. I., Cooper, M. R., ... & Holland, J. C. (2001). Social support as a buffer to the psychological impact of stressful life events in women with breast cancer. Cancer, 91(2), 443-454.
Krynen, A. M., Osborne, D., Duck, I. M., Houkamau, C. A., & Sibley, C. G. (2013). Measuring psychological distress in New Zealand: Item response properties and demographic differences in the Kessler-6 screening measure. New Zealand Journal
of Psychology, 42(2), 69-83. Kukutai, T. (2004). The problem of defining
an ethnic group for public policy: Who is Māori and why does it matter. Social Policy Journal of New Zealand, 23, 86-108.
Kukutai, T. H. (2007). White Mothers, Brown Children: Ethnic Identification of Māori‐European Children in New Zealand. Journal of Marriage and Family, 69(5), 1150-1161.
Kukutai, T., & Zealand, S. N. (2008). Ethnic Self-Prioritisation of Dual and Multi-Ethnic Youth in New Zealand: A Discussion Paper: Report Prepared for Statistics New Zealand, Wellington.
Kukutai, T., & Callister, P. (2009). A “main” ethnic group? Ethnic self-prioritisation among New Zealand youth. Social Policy Journal of New Zealand, 36, 16-31.
Kukutai, T. (2013). Building ethnic b o u n d a r i e s i n N e w Z e a l a n d : Representations of Māori identity in the census. In Axelsson, P., & Skold, P., (Eds.), Indigenous Peoples and Demography: The Complex Relation between Identity and Statistics, (pp.33-54) New York: Berghahn Books.
Leonardo, Z. (2004). The color of supremacy: Beyond the discourse of ‘white privilege’. Educational Philosophy and Theory, 36(2), 137-152.
Marie, D., Fergusson, D. M., & Boden, J. M. (2008). Ethnic identification, social disadvantage, and mental health in adolescence/young adulthood: results of a 25 year longitudinal study. Australasian Psychiatry, 42(4), 293-300.
Marsden, M. (1998) ‘Maori illness and death’. In The Mental Health Foundation (Ed.) , Te Ao Pumau: Standards and Foundations of Maori Society. Wellington: Mental Health Foundation.
Mathieson, F., Mihaere, K., Collings, S., Dowell, A., & Stanley, J. (2012). Māori cultural adaptation of a brief mental health intervention in primary care. Journal of primary health care, 4(3), 231-238.
Mead, S. (1999). Māori language and identity. Landmarks, bridges and visions. Aspects of Māori culture. Essays by Sidney Moko Mead. Wellington: Victoria University Press.
Mead, H. M. (2003). Tikanga Māori: Living by Māori values. Wellington: Huia Publishing.
Mikaere, A. (1999). Colonisation and the imposition of patriarchy: A Ngāti Raukawa woman’s perspective. Te Ukaipo, 1, 34-49.
Mikaere, A. (2004). Are we all New Zealanders now? A Māori response
to the Pākehā quest for indigeneity. Unpublished Bruce Jesson Lecture. Auckland, New Zealand.
Moeke-Pickering, T. M. (1996). Māori identity within whanau: A review of literature. Unpublished Paper: Hamilton, New Zealand.
Moewaka-Barnes, A. M., Taiapa, K., Borell, B., & McCreanor, T. (2013). Māori Experiences and Responses to Racism in Aotearoa New Zealand. Mai Journal: A New Zealand Journal of Indigenous Scholarship 2, 63-77.
Nairn, R. G., & McCreanor, T. N. (1991). Race talk and common sense: Patterns in Pākehā discourse on Māori/Pākehā relations in New Zealand. Journal of Language and Social Psychology, 10(4), 245-262.
Nikora, L. W. (1995). Race, culture and ethnicity: Organisation of Māori social groups. Unpublished Article: The University of Waikato, New Zealand.
Paterson, L. (2010). Hawhekaihe: Māori Voices on the Position of ‘Half-castes’ Within Māori Society. Journal of New Zealand Studies, (9), 135-156.
Pihama, L. E. (2001). Tīhei mauri ora: honouring our voices: mana wahine as a kaupapa Māori: theoretical framework. Unpublished Doctoral Thesis, The University of Auckland.
Pihama, L., Smith, K., Taki, M., & Lee, J. (2004). A literature review on kaupapa Māori and Māori education pedagogy. Paper Presented for the International Research Institute, Wellington, New Zealand.
Poata-Smith, E. S. (2013). Emergent identities: the changing contours of Indigenous identities in Aotearoa/New Zealand. In M. Nakata, M. Harris and B. Carlson (Eds.), The Politics of Identity: Emerging Indigeneity (pp. 24-59). Sydney: University of Technology Sydney E-Press.
Ramsden, I. (1993) Borders and frontiers, In A. Calder (Ed.), The Writing of New Zealand; Inventions and Identities. (pp. 236-244) Reed, Auckland.
Ring, I., & Brown, N. (2003). The health status of indigenous peoples and others: The gap is narrowing in the United States, Canada, and New Zealand, but a lot more is needed. BMJ: British Medical Journal, 327(7412), 404-405.
Robson, B., & Reid, P. (2001) Ethnicity Matters: Māori Perspectives. (Review of Measurement of Ethnicity in Official Statistics, Māori Perspectives Paper for Consultation). Statistics New Zealand.
Ruwhiu, D. (2009). The sleeping taniwha: Exploring the practical utility of kaupapa

• 23 •New Zealand Journal of Psychology Vol. 44 No. 2, September 2015
The Protective Function of Māori Cultural Efficacy
Māori in firm performance. Unpublished Doctoral Disseration, University of Otago.
Sachdev, P. S. (1990). Whakama: culturally determined behaviour in the New Zealand Māori. Psychological medicine, 20(2), 433-444.
Sachdev, P. (1997). The Māori of New Zealand. Ethnicity, Immigration, and Psychopathology, 189-211.
Sachdev, P. (1998). The New Zealand Māori and the contemporary health system. Clinical Methods in Transcultural Psychiatry, 111-136.
Salanova, M., Llorens, S., Cifre, E., Martínez, I. M., & Schaufeli, W. B. (2003). Perceived collective efficacy, subjective well-being and task performance among electronic work groups an experimental study. Small Group Research, 34(1), 43-73.
Salmond, C., & Crampton, P. (2000). Deprivation and health. In P. Howden-Chapman & M. Tobias (Eds.), Social Inequalities in Health: New Zealand 1999 (pp. 9-63). Wellington: Ministry of Health.
Salmond, C., Crampton, P., & Atkinson, J. (2007). NZDep2006 Index of Deprivation. Wellington. Department of Public Health, University of Otago Wellington.
Salmond, C., & Crampton, P, (2012). Development of New Zealand’s deprivation index (NZDep) and its uptake as a national policy tool. Canadian Journal of Public Health, 103, 7-11.
Sibley, C. G., Harré, N., Hoverd, W. J., & Houkamau, C. A. (2011). The gap in the subjective wellbeing of Māori and New Zealand Europeans widened between 2005 and 2009. Social Indicators Research, 104(1), 103-115.
Sibley, C. G., & Houkamau, C. A. (2013). The multi-dimensional model of Māori identity and cultural engagement: Item response theory analysis of scale properties. Cultural Diversity and Ethnic Minority Psychology, 19 (1), 97-110.
Smi th , L .T. (1999) Deco lon i s ing Methodologies: Research and Indigenous Peoples, Zed Books, New York, and Otago University Press, Dunedin.
Statistics New Zealand (2006). 2006 Census of Populations and Dwellings. Wellington, NZ: Statistics New Zealand.
Statistics New Zealand (2014) 2013 Census – Major Ethnic Groups in New Zealand. Wellington, NZ: Statistics New Zealand.
Stolk, Y., Kaplan, I., & Szwarc, J. (2014). Clinical use of the Kessler psychological distress scales with culturally diverse groups. International journal of methods in psychiatric research. 23(2), 161-183.
Storrs, D. (1999). Whiteness as stigma: Essentialist identity work by mixed‐race women. Symbolic Interaction, 22(3), 187-212.
Terry, D. J., Nielsen, M., & Perchard, L. (1993). Effects of work stress on psychological well‐being and job satisfaction: The stress‐buffering role of social support. Australian Journal of Psychology, 45(3), 168-175.
Thomas, D. R., & Nikora, L. W. (1996). Māori, Pākehā and New Zealander: Ethnic and national identity among New Zealand students. Journal of Intercultural Studies, 17(1-2), 29-40.
Van Meijl, T. (2006). Multiple identifications and the dialogical self: urban Māori youngsters and the cultural renaissance. Journal of the Royal Anthropological Institute, 12(4), 917-933.
Viswesvaran, C., Sanchez, J. I., & Fisher, J. (1999). The role of social support in the process of work stress: A meta-analysis. Journal of Vocational Behavior, 54(2), 314-334.
Ward, C. (2006). Acculturation, identity and adaptation in dual heritage adolescents. International Journal of Intercultural Relations, 30(2), 243-259.
Webber, Melinda (2008) Walking the Space Between, NZCER, Wellington.
Wilson, D. (2008). The significance of a culturally appropriate health service for Indigenous Māori women. Contemporary Nurse, 28(1-2), 173-188.
White, P., Gunston, J., Salmond, C., Atkinson, J., & Crampton, P. (2008). Atlas of Socioeconomic Deprivation in New Zealand: NZDep2006. Wellington Ministry of Health.
AcknowledgementsThis research was supported by
a Te Whare Kura New Knowledge Acquis i t ion Gran t awarded to Carla Houkamau and Chris Sibley (#03903/1550). Data collection for the NZAVS was also supported by a Templeton World Charity Foundation Grant (ID: 0077). Mplus syntax for the models reported here are available on the NZAVS website: http://www.psych.auckland.ac.nz/uoa/NZAVS
Address for correspondenceEmerald Muriwai School of Psychology University of Auckland Email: [email protected]

New Zealand Journal of Psychology Vol. 44 No. 2, September 2015• 24 •
E. Muriwai, C. A. Houkamau, C. G. Sibley
Appendix: Glossary of Terms____________________________________________________________________________________________________
Aotearoa The Māori word for New Zealand
Aroha ki te tangata Respect and/or love for the people
Hapū Sub-tribe
Iwi Tribe
Kaumātua Guardians of knowledge and protocol, older people, grandparents
Kaupapa Matter for discussion, agenda
Kaupapa Māori The conceptualisation of Māori knowledge, a Māori framework
Kōrero To speak, have a discussion
Koro Grandfather
Kuia Grandmother
Mana Strength, respect, pride
Māori The indigenous people of New Zealand
Marae The meeting house, belonging to a certain hapū/iwi
Matauranga Māori Māori knowledge
Pākehā ‘Other’, referring to British/European New Zealanders
Rangatahi Youth
Tika Relationships
Tikanga Māori Māori protocols and customs
Tino Rangatiratanga Self-governance
Te Ao Māori The Māori World
Te Reo Māori Māori Language
Whakapapa Ancestry/Genealogy
Whānau Family, inclusive of extended family
Whanaungatanga Collective/family-based orientation and commitment
___________________________________________________________________________________

• 25 •New Zealand Journal of Psychology Vol. 44 No. 2, September 2015
Dimensions of Social Dominance
Dimensions of Social Dominance: Their Personality and Socio-political Correlates within a
New Zealand Probability Sample Robin Bergh Harvard University, Cambridge MA, USA / Uppsala University, Sweden
Jim Sidanius Harvard University, Cambridge MA, USA Chris G. Sibley University of Auckland, New Zealand
Social Dominance Orientation (SDO) was introduced as a unidimensional construct predicting numerous socio-political attitudes. However, recent findings suggest that SDO is composed of two sub-dimensions: dominance (SDO-D) and anti-egalitarianism (SDO-E). Despite converging evidence concerning their empirical differentiability, there is little consensus on how to best define them. Thus, we examined the correlates of SDO-D and SDO-E using a broad array of personality, political, ethnic and gender issue variables within a New Zealand national probability sample (N = 5,741) with European and Māori participants. SDO-D primarily related to the personality trait of honesty-humility, hostile and benevolent sexism. SDO-E primarily related to political conservatism and pro-Māori policies. In many cases, the predictive power differed between SDO-D and SDO-E, and across ethnic groups.
Keywords: Social Dominance Orientation, sub-dimensions, predictive validity, HEXACO personality, group attitudes
IntroductionSocial dominance orientation
(SDO) is widely recognized as one of the most powerful individual difference predictors of intergroup attitudes and prejudice (McFarland & Adelson, 1996; Sibley & Duckitt, 2008). SDO was introduced as a unidimensional construct (Pratto, Sidanius, Stallworth, & Malle, 1994; Sidanius & Pratto, 1999) but there is increasing agreement in the literature that SDO is composed of two related sub-dimensions (e.g., Ho et al., 2012; Jost & Thompson, 2000). Following Ho and associates (2012), we refer to the two sub-dimensions as SDO-Dominance (SDO-D) and SDO-Egalitarianism (SDO-E).
Although there is now an emerging consensus about existence of two sub-dimensions, there is less agreement on how to best define them. For example, Jost and Thompson (2000) emphasized a difference between an ethnocentric orientation (i.e., wanting one’s own group to dominate, SDO-D) and a non-ethnocentric, general “preference
for unequal social relations” (p. 211, SDO-E). Empirically, however, their distinction was premised on the difference between promoting inequality between groups versus opposing equality. Of note, three of the SDO-D items in the SDO6 scale, on which they built most of their work, refer to dominating other groups, but the remaining five tap attitudes about group hierarchies in general (e.g., “some groups of people are simply inferior to other groups”).
Recently, Ho et al. (2012) replicated the two-dimensional structure of SDO in seven samples. Nonetheless, their interpretation of these findings differed from that of Jost and Thompson (2000). Ho et al. suggested that the key difference between SDO-D and SDO-E concerns how blatant or aggressive they are (SDO-E being more subtle). In other words, the distinction made by Ho and associates basically mirrors the one between “old-fashioned” and “modern” prejudice (see e.g., McConahay, 1986).
The main aim of this study was to
conduct an exploratory analysis based on a broader set of criterion variables than used in previous studies to shed further light on what differentiates SDO-D and SDO-E. The rationale here was simple: Improved knowledge of the correlates of SDO-D and SDO-E should be informative about how best to define the two dimensions. Our 15 criterion variables centered on personality, political ideological beliefs as well as more specific social attitudes about gender and ethnic issues. Extending previous research we compared relations of SDO-D and SDO-E with the criterion variables within two groups of different social status. Jost and Thompson (2000) contrasted high and low status ethnic groups (White versus Black Americans) when examining the relationships of SDO-D and SDO-E with two outcomes (self-esteem and ethnocentrism). In comparison, we examined such contrasts for as many as 15 criterion variables in a national probability sample with European (Pākehā) and Māori New Zealanders (of which the first group enjoys higher status, see Sibley et al., 2011a).
Our compar ison of Pākehā and Māori would also speak to the generalizability of Jost and Thompson’s (2000) findings regarding high and low status groups, and the different effects of SDO-D and SDO-E. They found that SDO-D was positively related to ingroup bias among both White and Black Americans, while SDO-E was positively correlated with ingroup bias among White participants, and negatively among Black participants. Analogous findings for Pākehā and Māori New Zealanders would suggest that this applies to high and low status groups in general, and not Black and White Americans in particular. Further

New Zealand Journal of Psychology Vol. 44 No. 2, September 2015• 26 •
R. Bergh, J. Sidanius, C. G. Sibley
hypotheses about outcomes that were expected to vary across ethnic groups are presented in the closing paragraphs of the introduction.
While seeking to replicate findings regarding some political and ethnic attitudes in relation to SDO-D and SDO-E, a second aim was to move beyond such attitudes and also examine blatant or aggressive versus subtle gender attitudes. In this domain, Eagly, Diekman, Johannesen-Schmidt, and Koenig (2004) hypothesized that group-based dominance (cf. SDO-D) would predict attitudes specifically related to “issues that directly threaten men’s higher social status” (p. 806) whereas group-based equality (cf. SDO-E) should account for inequality attitudes more broadly. Here we tested another perspective concerning what SDO-D and SDO-E predict in terms of gender attitudes. Specifically, we tested the possibility that SDO-D predicts hostile sexism whereas SDO-E predicts benevolent sexism (Glick & Fiske, 2001) as well as gender based system justification (Kay & Jost, 2003). Such a notion would be in line with the defining features of SDO-D and SDO-E as proposed by Ho et al. (2012).
A unique contribution of this study compared to previous studies is that we also mapped SDO-D and SDO-E in relation to basic personality traits. Importantly, much research has focused on SDO as a broad ideological belief system that predicts a variety of more specific attitudes and beliefs (see e.g. Pratto, Sidanius, & Levin, 2006). As such, SDO has sometimes been portrayed as a personality variable, and this is indeed how it was first introduced (see Pratto et al., 1994). However, there are few scholars who take this position today. SDO is rather considered to be a general ideological orientation belonging in the attitudinal domain (see e.g., Sibley & Duckitt, 2008; Sibley & Liu, 2010). This is also the position that we take in this paper. Likewise, in more recent publications, social dominance theorists discuss SDO as “as a partial reflection of personality” (Pratto et al., 2006, p. 293; emphasis added). Others have described SDO as surface traits, or characteristic adaptations, as opposed to core traits (see e.g., Ekehammar & Akrami, 2007).
The aforementioned perspectives all converge on the position that SDO is not a core personality trait in itself, but it should be related to such variables nonetheless. In line with this perspective, it is well documented that SDO is related to tough-minded, or non-agreeable, personality characteristics (e.g., Akrami & Ekehammar, 2006; Sibley & Duckitt, 2008). However, when it comes to the suggestion that SDO actually taps two sub-dimensions, there is no research at all on how they might relate differently to personality. Thus, in this study we provide the first mapping of SDO-D and SDO-E onto basic personality traits in terms of the Big-Five and HEXACO models (see Ashton & Lee, 2008; Donnellan, Frederick, Oswald & Lucas, 2006).
In terms of political attitudes, the study examined SDO-D and SDO-E in relation to two other ideological orientations. These were political identification (liberal – conservative) and right-wing authoritarianism (RWA; e.g., Altemeyer, 1996). Although much research has focused on the overall relation between RWA and SDO (e.g., Roccato & Ricolfi, 2005), no studies to our knowledge have examined the specific links to SDO-D and SDO-E. Yet, as RWA includes tendencies for aggression/hostility (Altemeyer, 1981; presumably a SDO-D domain) but also adherence to conservative ideology (Jost, Glaser, Kruglanski, & Sulloway, 2003; presumably a SDO-E domain), we expected relations with both sub-dimensions. Nonetheless, exploring potential differences in the strength of the associations could lead to more fine-grained theorizing when and how authoritarian and dominance-based ideologies converge or not.
Pol i t ica l ident i f ica t ion has previously been found to be more closely related to SDO-E (see Ho et al., 2012; Jost & Thompson, 2000; Sidanius, Levin, van Laar & Sears, 2008). Here, we examined whether this finding replicates in a third geographic region (besides the United States and Israel). More to the point, if conservative ideology reflect motivated cognition (Jost et al., 2003) and a subtle form of dominance (Ho et al., 2012), then the relation with SDO-E could be expected to be reliable across countries
(at least as long as conservative or right-wing ideology has a reasonably similar meaning across the geographic contexts).
Also, in terms of political attitudes, we aimed to examine issues specific to the New Zealand context. We were interested in support for policies favoring Māori, being either resource-based (e.g., Māori ownership to land as historically agreed upon) or symbolic (e.g., teaching Māori language in primary schools). Taken together, these attitudes address social inequalities between the two major ethnic groups in New Zealand. As such, they should relate to the sub-dimensions of SDO, and possibly stronger with SDO-E due to their political nature.
As fo r a t t i t udes cen te r ing on ethnicity, this inquiry was also concerned with ethnic identification and ingroup bias. SDO has been found to be positively related to group identification in high status groups, but less so (or reversely related) in low status groups (e.g., Levin, Sidanius, Rabinowitz, & Federico, 1998). Likewise, SDO has been found to relate differently to in- and outgroup negativity and among high and low status groups (Levin & Sidanius, 1999; Levin, Pratto, Matthews, Sidanius, & Kteily, 2013). Still, Jost and Thompson (2000) showed that the direction and strength of such relations may vary for SDO-D and SDO-E. Specifically, they found SDO-D to be positively related to ingroup bias in both high and low status groups, but negatively related to SDO-E in a low status group. In this study we examined if Jost and Thompson’s (2000) findings would replicate in another context.
In pr inc ip le the s tudy was exploratory and we did not derive specific predictions for all criterion variables about the differences between SDO-D and SDO-E or between the ethnic groups. Noteworthy, the number of contrasts examined would make a strictly hypothesis-driven approach both untenable with any space limitation of the manuscript, and also appear to be a large-scale guessing game. Thus, while conducting a largely explorative study, with the overarching aim of shedding more light on what differentiates SDO-D and SDO-E, we sought to safe-guard against type I errors in our inferences by
• 27 •New Zealand Journal of Psychology Vol. 44 No. 2, September 2015
Dimensions of Social Dominance
employing a very large sample.Whi le no t hav ing spec i f i c
predictions about every single contrast examined, the study was premised on a few broad-spanning predictions. The first was that to the extent that SDO taps core personality tendencies, the relations should not vary across ethnic groups. Neither did we did expect the relations with attitudes concerning gender to vary across ethnic groups. In contrast, we expected the two groups to differ in terms of the relations of SDO-D and SDO-E with attitudes centering on ethnicity. That is, we expected relations to vary across groups when the criteria matched the dimension along which the groups differed (ethnicity; see also Reynolds & Turner, 2006).
Beyond e thnic d i ffe rences , and following Ho et al. (2012), we considered the possibility that SDO-D would correlate most strongly with statements for which there is normative pressure concerning the “right” way to answer. The rationale here is that people high on SDO-D simply do not care much about holding back their thoughts and feelings about themselves and others. In contrast, we expected SDO-E to be more predictive than SDO-D concerning more socially accepted expressions of anti-egalitarian attitudes (i.e. “modern” expressions of social dominance). In other words, SDO-E should be expressed when it is safe to do so. Thus, we considered honesty humility and hostile sexism to be plausible marker criteria of SDO-D. In contrast, conservatism, benevolent sexism, ethnic identification, and opposition to pro- Māori policies were expected to be SDO-E domains (see also Ho et al., 2012).
Method
Sampling Procedure and Participants
We analyzed data from the 2009 New Zealand Attitudes and Values Study (NZAVS). The Time 1 (2009) NZAVS contained responses from
6,518 participants sampled from the 2009 New Zealand electoral roll. The electoral roll is publicly available for scientific research and in 2009 contained 2,986,546 registered voters. This represented all citizens over 18 years of age who were eligible to vote regardless of whether they chose to vote, barring people who had their contact details removed due to specific case-by-case concerns about privacy. The sample frame was spilt into three parts. Sample Frame 1 constituted a random sample of 25,000 people from the electoral roll (4,060 respondents). Sample Frame 2 constituted a second random sample of a further 10,000 people from the electoral roll (1,609 respondents).
Sample Frame 3 constituted a booster sample of 5,500 people randomly selected from meshblock area units of the country with a high proportion of Māori, Pacific Nations and Asian peoples (671 respondents). Statistics New Zealand (2014) define the meshblock as “the smallest geographic unit for which statistical data is collected and processed by Statistics New Zealand. A meshblock is a defined geographic area, varying in size from part of a city block to large areas of rural land. Each meshblock abuts against another to form a network covering all of New Zealand including coasts and inlets, and extending out to the two hundred mile economic zone. Meshblocks are added together to ‘build up’ larger geographic areas such as area units and urban areas. They are also the principal unit used to draw-up and define electoral district and local authority boundaries.” Meshblocks were selected using ethnic group proportions based on 2006 national census data. A further 178 people responded but did not provide contact details and so could not be matched to a sample frame (see also Sibley, 2014).
In sum, postal questionnaires were sent to 40,500 registered voters or roughly 1.36% of all registered voters in New Zealand. The overall response rate (adjusting for the address accuracy of the electoral roll and including
anonymous responses) was 16.6%. We limited the analyses to the 5741 (3435 women) participants who were either Pākehā (n = 4,629) or Māori (n = 1,112). The mean age was 48.62 years (SD = 15.83).
There are three things to note concerning the sample characteristics for Pākehā and Māori. First, the respondents in this sample did not differ in terms of employment, χ2(1) = 1.91, p = .17. Second, there was a higher proportion with a degree or certificate from high school among Pākehā (50%) compared to Māori (34%), χ2(1) = 91.88, p < .001. Importantly, however, these descriptive statistics are fairly close to the percentages in the general population (55 and 38% for Pākehā and Māori respectively for adults 25-34 years old; see Statistics New Zealand, 2013). Finally, the gender distribution was somewhat skewed with 40% men and 60% women, χ2(1) = 217.33, p < .001. To adjust for this, we used sample weights for gender in all analyses concerning relations with the criterion variables. For extensive details about sample characteristics, see Sibley, McPhee, & Greaves, (2014).
Questionnaire measuresSDO was assessed using 6-items
from the SDO-6 scale (see Pratto et al., 1994). The items assessing SDO-D were “it is OK if some groups have more of a chance in life than others”, “inferior groups should stay in their place”, and “to get ahead in life, it is sometimes okay to step on other groups”. The SDO-E items included “we should have increased social equality”, “it would be good if groups could be equal”, and “we should do what we can to equalize conditions for different groups”. Response alternatives ranged from 1 (strongly disagree) to 7 (strongly agree), and SDO-E items were reversed coded to assess anti-egalitarianism. The response format above was used for all scales unless otherwise specified. For means, standard deviations, and internal consistency reliabilities for all variables, see Table 1.

New Zealand Journal of Psychology Vol. 44 No. 2, September 2015• 28 •
R. Bergh, J. Sidanius, C. G. Sibley
The Big-Five dimensions were measured using the Mini-IPIP scale developed by Donnellan et al. (2006). The honesty-humility scale used marker items from Ashton and Lee (2008). All scales were validated for use in New Zealand by Sibley et al. (2011b). Each personality scale included 4 items, including statements such as “I don’t talk a lot” (reverse-scored extraversion), “I sympathize with others’ feelings” (agreeableness), “I like order” (conscientiousness), “I get upset easily” (emotionality), “I have a vivid imagination” (openness to experience), and “I deserve more things in life” (reverse-scored honesty-humility).
To assess RWA, a balanced 6-item scale was adopted from Altemeyer (1996; e.g., “it would be best for everyone if the proper authorities censored magazines so that people could not get their hands on trashy and disgusting material”). Political orientation was assessed with the item “Please rate how politically conservative versus liberal you see yourself as being”, with 1 representing extremely liberal and 7 representing extremely conservative. Attitudes toward resource-specific and symbolic Māori policies were assessed with four items each. These were selected from Liu and Sibley (2006; e.g., I support…
“Maori ownership of the seabed and foreshore” [resource-specific], and “teaching Maori language in New Zealand primary schools” [symbolic]). Gender-specific system justification was measured with two items selected from Jost and Kay (2005), one of these two was “in general, relations between men and women in New Zealand are fair”. Benevolent and hostile sexism were represented by five items each from Glick and Fiske (1996). Items included “women should be cherished and protected by men” (benevolent sexism) and “women exaggerate problems they have at work” (hostile sexism).
Three items from Leach et al. (2008) measuring identity centrality were used to index ethnic identity, with an example being “I often think about the fact that I am a member of my ethnic group”. Affective thermometer ratings toward Pākehā, and Māori were used to create an index for ethnic ingroup bias by subtracting the outgroup rating from the ingroup one. Both groups showed an ingroup bias in terms of a mean difference between the ingroup and outgroup ratings, yet it was more pronounced for Pākehā than Māori participants, t(4512) = 38.58, p < .001, d = .57, and , t(1090) = 5.59, p < .001, d = .17 respectively.
Results
Preliminary analysesUsing both Pākehā and Māori
participants, we first ran a confirmatory factor analysis to examine the suggested factor structure with two SDO sub-dimensions (with three indicators per construct, factors correlated). We used a robust maximum likelihood (referred to as T2* by Yuan & Bentler, 2000) estimator as we suspected somewhat non-normally distributed data. The proposed factor model had a good fit to the data, scaled χ2(8) = 121.54, p < .001, CFI = .98, RMSEA = .05, 90% CI [.04, .06]. The correlation between the factors was .56, p <.001.
Next, we ran a multi-group confirmatory factor analysis to examine if the relationships between the two factors varied across ethnic groups. Notably, previous research suggests that the relation between the two dimensions is stronger in groups with higher status (see Jost & Thompson, 2000). Indeed, we found support for this prediction in a New Zealand probability sample as well. Good fit was achieved when allowing the correlation to vary across ethnic groups while keeping loadings and intercepts equal, χ2(26) = 182.21, p < .001, CFI = .96, RMSEA = .05, 90% CI [.04, .05]. For Pākehā, the correlation was .61, p <.001, and for Māori it was .39, p <.001. Also, assuming the correlation between SDO-D and SDO-E to be equal among Pākehā and Māori resulted in a significantly worse fit, scaled Δχ2(1) = 17.72, p < .001.
Comparison of SDO-D and SDO-E Criteria Relations among Pākehā and Māori
To examine the relations of SDO-D and SDO-E with our 15 outcomes, we ran multi-group (Pākehā versus Māori) regression analyses (i.e. SDO-D and SDO-E manifest) with each criterion as a dependent variable. More specifically, we ran five models for each criterion. First, we ran a baseline model (0 df) in which both coefficients in each ethnic group were free to vary. We then tested the difference of the SDO-D and SDO-E coefficients among Pākehā by running a model with the unstandardized relations constrained to be equal (1
Table 1. Means, Standard Deviations and Internal Consistency Reliabilities for Study Variables.
Instrument M SD α
Social Dominance Orientation D 2.38 1.12 .52Social Dominance Orientation E 2.79 1.21 .76Agreeableness 5.27 0.99 .67Conscientiousness 5.10 1.07 .66Extraversion 4.05 1.16 .72Neuroticism 3.43 1.10 .65Openness to Experience 4.76 1.13 .68Honesty-Humility 5.11 1.33 .78Right-Wing Authoritarianism 3.56 1.16 .69Political Identity (Conservatism) 3.76 1.23 -Māori Resource Policy 5.25 1.55 .83Māori Symbolic Policy 3.07 1.43 .78Ethnic Identity 3.66 1.66 .83Ingroup bias 0.70 1.41 -Gender System Justification 4.80 1.27 .59Benevolent Sexism 4.11 1.17 .72Hostile Sexism 3.36 1.27 .81

• 29 •New Zealand Journal of Psychology Vol. 44 No. 2, September 2015
Dimensions of Social Dominance
Table 2. Relations for SDO-D and SDO-E with Criterion Variables.
Pākehā (European New Zealanders) Māori
B β p B β p X2 p
Agreeableness D -0.19 -0.21 <.001 -0.13 -0.16 <.001 3.15 .08E -0.12 -0.15 <.001 -0.14 -0.17 <.001 0.37 .55X2 6.98 .01 0.05 .82
Conscientiousness D -0.06 -0.06 <.001 0.01 0.01 .68 4.11 .04E 0.05 0.06 .001 -0.08 -0.09 .01 13.13 <.001X2 17.02 <.001 3.59 .06
Extraversion D 0.02 0.02 .29 0.03 0.03 .31 0.12 .73E 0.00 0.00 .95 -0.04 -0.04 .15 1.65 .20X2 0.38 .54 2.52 .11
Neuroticism D 0.03 0.03 .06 0.07 0.08 .01 1.73 .19E -0.06 -0.07 <.001 -0.03 -0.03 .33 1.06 .30X2 11.79 <.001 5.36 .02
Openness to Experience D -0.13 -0.13 <.001 -0.18 -0.19 <.001 1.99 .16E -0.04 -0.05 .01 -0.08 -0.09 .01 1.28 .26X2 8.22 <.001 4.00 .05
Honesty-Humility D -0.33 -0.28 <.001 -0.31 -0.26 <.001 0.29 .59E 0.02 0.02 .20 0.05 0.04 .17 0.45 .50X2 111.38 <.001 35.43 <.001
Right-Wing D 0.10 0.09 <.001 0.19 0.20 <.001 7.48 .01Authoritarianism E 0.14 0.14 <.001 0.06 0.07 .04 4.74 .03
X2 1.88 .17 7.32 .01Political identification D 0.06 0.05 .003 -0.04 -0.04 .34 4.77 .03
E 0.24 0.24 <.001 0.19 0.18 <.001 1.46 .23X2 32.77 <.001 14.68 <.001
Māori D 0.07 0.06 <.001 -0.18 -0.12 <.001 25.21 <.001resource policy E 0.20 0.20 <.001 0.26 0.18 <.001 1.18 .28
X2 22.47 <.001 34.71 <.001Māori D 0.17 0.14 <.001 -0.03 -0.03 0.31 31.67 <.001symbolic policy E 0.28 0.24 <.001 0.20 0.21 <.001 3.85 .05
X2 9.44 <.001 21.67 <.001Ethnic identity D 0.21 0.15 <.001 0.16 0.12 <.001 0.93 .34
E -0.12 -0.10 <.001 -0.38 -0.28 <.001 27.86 <.001X2 78.05 <.001 71.79 <.001
Ingroup bias D 0.21 0.16 <.001 0.01 0.01 .85 25.00 <.001E 0.14 0.11 <.001 -0.09 -0.09 .01 34.10 <.001X2 4.21 .04 3.31 .07
Gender D 0.15 0.13 <.001 0.19 0.17 <.001 1.12 .29system justification E 0.08 0.08 <.001 -0.04 -0.04 .26 7.89 .01
X2 6.16 .01 15.56 <.001Benevolent sexism D 0.27 0.26 <.001 0.25 0.25 <.001 0.30 .58
E -0.02 -0.02 .28 -0.14 -0.15 <.001 9.95 <.001X2 98.20 <.001 46.30 <.001
Hostile sexism D 0.32 0.28 <.001 0.27 0.24 <.001 2.04 .15E 0.08 0.07 <.001 0.00 0.00 .90 3.05 .08X2 60.26 <.001 20.24 <.001
Note. D = SDO-D, E = SDO-E. All coefficients are based on robust maximum likelihood estimation (see Muthén & Muthén, 2012) and weighted for gender. The X2 values are mean-adjusted and equivalent to Yuan and Bentler’s (2000) T2*. For political orientation, high scores represent conservative (as opposed to liberal) identification. Pākehā n varies between 4340 and 4593 Māori n varies between 1019 and 1102.
df). Consequently, the X2 statistic for this model would give the significance level for the hypothesis that the two paths are different. By the same logic, we then tested the difference between the SDO-D and SDO-E coefficients in the Māori group. Subsequently, we constrained the SDO-D paths to be equal for Pākehā and Māori to test the difference across ethnic groups for this predictor. Finally, in a fifth model, we constrained the SDO-E paths to be equal across ethnic groups. The results of these analyses are presented in Table 2.
The results showed that both SDO-D and SDO-E predicted most variables, and many effects were highly significant, as could be expected in a sample of this size. Still, most of these effects were relatively weak. As for the contrasts between SDO-D and SDO-E within each ethnicity, we found that 18 out of 30 were significant at p < .001. Because of the sample size and number of tests, we do not put much emphasis on effects that were not significant at this level. Nonetheless, many of the contrasts held up in both ethnic groups (see Table 2). While some of these were relatively small in an absolute sense, a couple of variables appeared to be marker criterion for SDO-D. Honesty-humility and hostile sexism both revealed moderately strong relations with SDO-D, but only marginal relations with SDO-E. Benevolent sexism revealed the same pattern overall, but also a weak negative relation with SDO-E among Māori. In contrast, political identification was most clearly related to SDO-E.
There were also differences across ethnic groups for many variables in relation to either SDO-D or SDO-E. Both SDO-D and SDO-E displayed variation in relation to some of the other ideological and attitudinal variables, dependent on membership in a group of either high or low social status. More specifically, of the 30 contrasts tested, we found 7 to be significant at p <.001. Again, we did not pay much attention to effects that failed to reach significance at this level in such a big sample as this one. Not surprising, the more pronounced differences between the ethnic groups were often associated with ethnicity-specific attitudes. In contrast, it is noteworthy that there was little
variation across ethnic groups in relation to personality (except conscientiousness – SDO-E), political orientation and hostile sexism (for details, see Table 2).
Finally, in addition to the regression analyses, we also examined the zero-order relations of SDO-D, SDO-E, and the full SDO scale with all criterion variables. For a majority of the criterion variables the full SDO revealed correlations in between the estimates for SDO-D and SDO-E, but in some
cases the full SDO scale rather matched or slightly outperformed both of the component measures. For example, the relation with agreeableness shows a small difference between SDO-D and SDO-E to start with, and neither of the components showed an advantage over the full SDO scale. On the other hand, for many criterion variables we found more substantial differences between SDO-D and SDO-E in the regression analyses, and these were

New Zealand Journal of Psychology Vol. 44 No. 2, September 2015• 30 •
R. Bergh, J. Sidanius, C. G. Sibley
largely consistent with differences at the zero-order level as well. Again, most effects were relatively weak, few correlations were above or approaching .30. The contrasts between the two ethnic groups were also consistent in the regression and correlational analyses. To avoid redundancy the results from the correlational analyses, along with details on how we tested these contrasts, are presented in Appendix A.
DiscussionWe explored the relations for two
sub-dimensions of the SDO scale with a number of criterion variables in a national probability sample in New Zealand. The main rationale was that a study on the relations of SDO-D and SDO-E with a broad range of personality and socio-political variables would help clarify the distinctions between these two dimensions. Clearly, the full SDO scale still provides a useful tool in many settings, and parsimony speaks for it being preferable to using its components in some cases (e.g., in relation to Agreeableness). Nonetheless, there were also many cases where SDO-D and SDO-E revealed somewhat different relations with our criterion variables.
Overall the results revealed some clear patterns, but also a couple of surprises. Consistent with the findings of Ho and colleagues (2012), and in contrast to the argument of Sears, Haley, and Henry (2008), there seemed to be more of a story to tell about SDO-D than SDO-E. Compared to SDO-E, SDO-D displayed both stronger and more diverse relationships across the range of personality and socio-political variables. This finding is noteworthy considering that SDO-E was markedly more reliable than SDO-D. Put differently, while some might consider the reliabilities of our SDO instruments to be problematic it should be recognized that psychometrics tells us that the contrasts where SDO-D outperforms SDO-E would be stronger, if anything, if we had better instruments. Also, in this study we used more variables than Ho et al. (2012) that were likely to represent subtle expressions of dominance (e.g., agreeableness and benevolent sexism). Nonetheless, even with these additional “SDO-E candidates”, SDO-D often came out on top.
An exception to the tendency for SDO-D to outperform SDO-E was found with regards to political identification (see also Sears, et al., 2008). Noteworthy, it is well known that conservatism maps onto a broad range of attitudes (e.g., Jost et al., 2003). However, the current study indicates that the binding factor that holds it all together may not be conservative ideology in itself, but rather the D dimension of SDO. More specifically, conservatism in itself seemed to be an SDO-E domain, whereas most social attitudes are more closely related to SDO-D. This suggests that SDO-D bridges the relation between conservatism (as well as SDO-E) and various social attitudes.
The second clearest example of an SDO-E domain of attitudes dealt with pro-Māori policies. SDO-E was more strongly associated with an opposition toward both resource and symbolic policies favoring Māori, and this was true within both ethnic groups. This finding is intriguing when considering the link between SDO-E and conservative identity. Reasonably, support for giving positive attention to disadvantaged groups is a key ingredient in both conservatism-liberalism and SDO-E, and it seems to overrun in-group interests (see Jost & Thompson, 2000).
In terms of mapping SDO-D and SDO-E onto basic personality, the strongest relations were found between honesty-humility and SDO-D. Thus, the current focus on agreeableness as the primary (core) personality correlate SDO (see Sibley & Duckitt, 2008), needs to be supplemented with more research on honesty-humility. Obviously, we cannot draw any causal inferences from these analyses, but the fact that honesty-humility was practically unrelated to SDO-E also suggests that the personality roots of SDO-D and SDO-E may differ. Interestingly, a similar pattern was also found for openness to experience, and to some extent, agreeableness. Conscientiousness, extraversion and neuroticism showed only trivial relations with the two SDO dimensions.
Consistent with our predictions, the relations with the personality variables showed only minor variation across the two ethnic groups. The observed difference for SDO-E in relation to
conscientiousness seems uninformative when considering how weak the relations were in both groups, but of opposite signs. In principle, it seems to be the same kind of individuals, in terms of basic personality, who are drawn to social dominance (especially SDO-D) in high and low status groups. This also suggests that when the relations between SDO and prejudice fluctuate across groups (e.g., Levin & Sidanius, 1993) it is not because different group identities shift peoples’ sense of personality (as proposed in self-categorization theory, e.g., Reynolds & Turner, 2006).
With regards to somewhat puzzling and unexpected results, the coefficients found here were generally low compared to the results of other studies. For example, the relations for the SDO dimensions with RWA were lower than what has been previously found for the full scale (see e.g., Roccato & Ricolfi, 2005). However, this could in part be due to the lower reliabilities of the instruments used here, which would attenuate our effect size estimates as we necessarily used short-form scales. Also, another reason for some of the weak effects could be the cultural context of the study (see Mirisola, Sibley, Boca, & Duckitt, 2007). For example, the bicultural national identity in New Zealand (e.g., Liu & Sibley, 2009) might explain the counter-intuitive weak and negative relationship between SDO-E and ethnic identity among Pākehā. More specifically, a bicultural or even multicultural national identity may imply a more egalitarian stand compared to a mono-cultural identity, and hence lower or reverse the typical positive relationship between SDO and high status group identification.
Another surprising result concerned benevolent sexism. More specifically, we expected benevolent sexism to be in the SDO-E domain, as this dimension has been portrayed as dealing with more subtle expressions of dominance. However, benevolent sexism had a moderately strong relation with SDO-D while being unrelated to SDO-E among Pākehā and only weakly (negatively) related among Māori. The negative relation among Māori is noteworthy for the theorizing about ambivalent sexism. Glick and Fiske (2001) suggested that prejudice is about social inequality, and

• 31 •New Zealand Journal of Psychology Vol. 44 No. 2, September 2015
Dimensions of Social Dominance
noted that people express benevolent sexism as a means to keep women “in their place”. However, it is possible that this effect is weaker in groups that are disadvantaged, especially among individuals supporting group equality (as indexed by low SDO-E scores). Specifically, what appears to be benevolent sexism among such individuals might be an expression of genuine benevolence, rather than a mild, or disguised form of sexism.
These results also speak to a debate as to whether SDO-E is the system justifying aspect of SDO (see Jost & Thompson, 2000). In contrast to this idea, SDO-D was more strongly related to gender-specific system justification and this was true for both Pākehā and Māori. Also, many of the other criterion variables here could be described as hierarchy-enhancing ideologies (see Sidanius & Pratto, 1999) operating to maintain the status quo of group inequalities. Among several of these variables, such as benevolent and hostile sexism SDO-D was the stronger predictor. On the other hand, the data for the Māori policies were much in line with the system-justification perspective as proposed by Jost and Thompson (2000). Overall then, the arguments about system justifying tendencies in SDO seems to depend on the attitude domain that it is mapped onto (e.g. gender versus ethnic issues).
In evaluating the strengths and weaknesses of this study it is an obvious limitation that we did not have balanced scales for SDO-D and SDO-E (as opposed to e.g., Ho et al., 2012). This was due to the fact that we used data embedded in a large questionnaire, and only had a few SDO items available. On the other hand, the broad range of criterion variables (including all Big-Five factors) represents a clear strength compared to previous studies. More important still, the findings were based on national probability sample, and include a large number of respondents from an ethnic minori ty group (Māori). Thus, in terms of the breadth of criterion variables and statistical power the current study provided the most extensive examination SDO-D and SDO-E to date. Based on the current results we would argue that the distinction between these two
sub-dimensions is more complex than a drive to dominate outgroups versus general anti-egalitarianism. Beside the conceptual problem that most SDO-D items do not specifically refer to in- and outgroups, there are some findings here that are difficult to reconcile with such a conceptualization. Neither does it seem correct that the distinction is all about blatant and aggressive versus subtle expressions of dominance (see Ho et al., 2012). Instead, the closest thing to defining features of the two dimensions in these data appears to be the following: SDO-D is a demeaning attitude promoting hierarchies between groups whereas SDO-E is about opposing the recognition of groups as disadvantaged.
ReferencesAkrami, N., & Ekehammar, B. (2006).
Right-wing authoritarianism and social dominance orientation: Their roots in Big-Five personality factors and facets. Journal of Individual Differences, 27, 117-126.
Altemeyer, B. (1996). The authoritarian specter. London: Harvard University Press.
Ashton, M. C., & Lee, K. (2008). The prediction of honesty-humility-related criteria by the HEXACO and Five-Factor models of personality. Journal of Research in Personality, 42, 1216-1228.
Donnellan, M.B., Frederick, L., Oswald, B.M.B, & Lucas, R.E. (2006). The Mini-IPIP scales: Tiny-yet effective measures of the Big Five factors of personality. Psychological Assessment, 18, 192-203.
Eagly, A. H., Diekman, A. B., Johannesen-Schmidt, M. C., & Koenig, A. M. (2004). Gender gaps in socio-political attitudes: A social psychological analysis. Journal of Personality and Social Psychology, 87, 796 -816.
Ekehammar, B., & Akrami, N. (2007). Personality and prejudice. From big five personality factors to facets. Journal of Personality, 75, 899-925.
Glick, P., & Fiske, S. T. (1996). The Ambiva len t Sex i sm Inven to ry : Differentiating hostile and benevolent sexism. Journal of Personality and Social Psychology, 70, 491-512.
Glick, P., & Fiske, S. T. (2001). An ambivalent alliance: Hostile and benevolent sexism as complementary justifications for gender inequality. American Psychologist, 56, 109-118.
Ho, A. K., Sidanius, J., Pratto, F., Levin, S.,
Thomsen, L., Kteily, N. S., & Sheehy-Skeffington, J. (2012). Social dominance orientation: Revisiting the structure and function of a variable predicting social and political attitudes. Personality and Social Psychology Bulletin, 38, 583-606.
Jost, J. T., Glaser, J., Kruglanski, A. W., & Sulloway, F. J. (2003). Political conservatism as motivated social cognition. Psychological Bulletin, 129, 339-375.
Jost, J. T., & Kay, A. C. (2005). Exposure to benevolent sexism and complementary gender stereotypes: Consequences for specific and diffuse forms of system justification. Journal of Personality and Social Psychology, 88, 498–509.
Jost, J. T., & Thompson, E. P. (2000). Group-based dominance and opposition to equality as independent predictors of self-esteem, ethnocentrism, and social policy attitudes among African Americans and European Americans. Journal of Experimental Social Psychology, 36, 209–232.
Leach, C.W., van Zomeren, M., Zebel, S., Vliek, M. L. W., Pennekamp, S. F., Doosje, B.,... Spears, R. (2008). Group-level self-definition and self-investment: A hierarchical (multicomponent) model of ingroup identification. Journal of Personality and Social Psychology, 95, 144-165.
Levin, S., Pratto, F., Matthews, M., Sidanius, J., & Kteily, N. (2013). A dual process approach to understanding prejudice toward Americans in Lebanon: An extension of intergroup threat perceptions and emotions. Group Processes and Intergroup Relations, 16, 139-158.
Levin, S., & Sidanius, J.(1999). Social dominance and social identity in the United States and Israel: Ingroup favoritism or outgroup derogation? Political Psychology, 20, 99-126.
Levin, S., Sidanius, J., Rabinowitz, J. L., & Federico, C. (1998). Ethnic identity, legitimizing ideologies and social status: A matter of ideological asymmetry. Political Psychology, 19, 373-404.
Liu, J. H., & Sibley, C. G. (2006). Differential effects of societal anchoring and personal importance in determining support or opposition to (bi)cultural diversity in New Zealand. Papers on Social Representations, 15, 1-15.
McConahay, J. B. (1986). Modern racism, ambivalence, and the Modern Racism Scale. In J. F. Dovidio, & S. L. Gaertner (Eds.), Prejudice, discrimination and racism (pp. 91–126). New York: Academic.
McFarland, S., & Adelson, S. (1996). An omnibus study of personality, values, and
New Zealand Journal of Psychology Vol. 44 No. 2, September 2015• 32 •
R. Bergh, J. Sidanius, C. G. Sibley
prejudice. Paper presented at the annual meeting of the International Society of Political Psychology, Vancouver, Canada.
Mirisola, A., Sibley, C. G., Boca, S., & Duckitt, J. (2007). On the ideological consistency between Right-Wing Authoritarianism and Social Dominance Orientation. Personality and Individual Differences, 43, 1851-1862.
Pratto, F., Sidanius, J., & Levin, S. (2006). Social dominance theory and the dynamics of intergroup relations: Taking stock and looking forward. European Review of Social Psychology, 17, 271-320.
Pratto, F., Sidanius, J., Stallworth, L. M., & Malle, B. F. (1994). Social dominance orientation: A personality variable predicting social and political attitudes. Journal of Personality and Social Psychology, 67, 741-763.
Reynolds, K. J., & Turner, J. C. (2006). Individuality and the prejudiced personality. European Review of Social Psychology, 17, 233-270.
Roccato, M., & Ricolfi, L. (2005). On the correlation between right-wing authoritarianism and social dominance orientation. Basic and Applied Social Psychology, 27, 187-200.
Sears, D. O., Haley, H., & Henry, P. J. (2008). Cultural diversity and sociopolitical attitudes at college entry. In J. Sidanius, S. Levin, C. van Laar, & D. O. Sears (Eds.), The diversity challenge (pp. 65-99). New York, NY: Russell Sage.
Sibley, C. G. (2014) Sampling procedure and sample details for the New Zealand Attitudes and Values Study. NZAVS Technical Documents, e01.
Sibley, C. G., & Duckitt, J. (2008). Personality and prejudice: A meta-analysis and theoretical review. Personality and Social Psychology Review, 12, 248–279.
Sibley, C. G., Harding, J. F., Perry, R., Asbrock, F., & Duckitt, J. (2010). Personality and prejudice: Extension to the HEXACO personality model. European Journal of Personality, 24, 515-534.
Sibley, C. G., & Liu, J. H. (2010). Social Dominance Orientation: Testing a global individual difference perspective. Political Psychology, 31, 175-207.
Sibley, C. G., McPhee, E., & Greaves, L., M. (2014). Appendix of consecutive NZAVS sample frequencies and New Zealand census data. NZAVS Technical Documents, e04.
Sibley, C. G., Luyten, N., Purnomo, M., Moberly, A., Wootton, L. W., Hammond, M.,… & Robertson, A. (2011b). The Mini-IPIP6: Validation and extension of a short measure of the Big-Six factors of personality in New Zealand. New Zealand Journal of Psychology, 40, 142-159.
Sibley, C. G., Stewart, K., Houkamau, C., Manuela, S., Perry, R., Wootton, L., ... & Asbrock, F. (2011a). Ethnic group stereotypes in New Zealand. New Zealand Journal of Psychology, 40, 25-36.
Sidanius, J., Levin, S., van Laar, C., & Sears, D. O. (2008). “The Diversity Challenge: Social Identity and Intergroup Relations on the College Campus.” New York: The Russell Sage Foundation.
Sidanius, J., & Pratto, F. (1999). Social dominance: An intergroup theory of social hierarchy and oppression. New York, NY: Cambridge University Press.
Statistics New Zealand (2013). Educational attainment of adults aged 25 to 34 years. Retrieved from: http://www.stats.govt.nz/browse_for_stats/snapshots-of-nz/nz-social-indicators/Home/Education/ed-attainment-adults.aspx
Statistics New Zealand (2014). Glossary and references. Retrieved from: http://www.stats.govt.nz/methods/classifications-and-standards/classification-related-stats-standards/usual-residence-n-years-ago/glossary-and-references.aspx
Yuan, K. H. & Bentler, P. M. (2000). Three likelihood-based methods for mean and covariance structure analysis with non-normal missing data. In M.E. Sobel & M.P. Becker (eds.), Sociological Methodology 2000 (pp. 165-200). Washington D.C.: ASA.
Authors Note: The NZAVS is supported by a
Templeton World Charity Foundation Grant (ID: 0077). The funders had no role in study design, data collection and analysis, decision to publish, or preparation of the manuscript. Mplus syntax for the analyses reported in this paper is available on the NZAVS website: www.psych.auckland.ac.nz/uoa/NZAVS.
Address correspondence to: Robin Bergh, Department of
Psychology, Harvard University, William James Hall, 33 Kirkland Street, Cambridge, MA 02138, [email protected], Phone: +1 (617) 495-3804
Appendix APearson correlations for SDO-D and
SDO-E with the criterion variables were analyzed within each ethnic group in our sample. We then examined contrasts within (SDO-D versus SDO-E) and across groups (Pākehā versus Māori). We used Steiger’s (1980) formula to compare dependent correlations (i.e. within groups) and Fisher’s z-transformation for the independent correlations (i.e. between groups). All contrasts were tested at http://www.quantpsy.org/
corrtest/corrtest.htm, and http://www.quantpsy.org/corrtest/corrtest2.htm ). The results of these analyses are summarized in Table A1.

• 33 •New Zealand Journal of Psychology Vol. 44 No. 2, September 2015
Dimensions of Social Dominance
Table A1. Zero-order relations of SDO (full scale), SDO-D and SDO-E with criterion variables and z-contrasts.
Pākehā (European New Zealanders)
Māori
Criterion Variable r p r p z p
Agreeableness SDO -.30 <.001 -.27 <.001 -1.04 .30D -.27 <.001 -.21 <.001 -1.92 .06E -.24 <.001 -.21 <.001 -0.81 .42z* -1.93 .05 0.15 .88
Conscientiousness SDO .00 .83 -.05 .10 1.40 .16D -.04 .01 .00 .97 -1.14 .25E .03 .05 -.08 .01 3.21 <.001z* -4.15 <.001 2.14 .03
Extraversion SDO .01 .41 -.02 .57 .86 .39D .02 .19 .02 .59 0.09 .93E .00 .94 -.04 .14 1.35 .18z* 1.15 .25 1.62 .10
Neuroticism SDO -.03 .03 .03 .33 .95 .34D .00 .86 .06 .04 -1.97 .05E -.05 <.001 -.02 .55 -1.03 .30z* 3.13 <.001 2.18 .03
Openness to Experience SDO -.15 <.001 -.23 <.001 2.50 .01D -.15 <.001 -.22 <.001 2.29 .02E -.11 <.001 -.14 <.001 0.93 .35z* -2.55 .01 -2.30 .02
Honesty-Humility SDO -.22 <.001 -.18 <.001 -1.24 .22D -.27 <.001 -.25 <.001 -0.54 .59E -.10 <.001 -.02 .42 -2.17 .03z* -11.15 <.001 -6.25 <.001
Right-Wing SDO .20 <.001 .22 <.001 -0.72 .48Authoritarianism D .15 <.001 .23 <.001 -2.30 .02
E .19 <.001 .12 <.001 2.04 .04z* -2.25 .03 2.90 .00
Political identification SDO .24 <.001 .13 <.001 3.27 .001D .14 <.001 .02 .54 3.60 <.001E .26 <.001 .18 <.001 2.25 .02z* -7.02 <.001 -4.21 <.001
Māori SDO .22 <.001 .04 .18 5.37 <.001resource policy D .14 <.001 -.08 .01 6.66 <.001
E .22 <.001 .15 <.001 2.27 .02z* -5.29 <.001 -6.25 <.001
Māori SDO .32 <.001 .14 <.001 5.87 <.001symbolic policy D .24 <.001 .02 .56 6.68 <.001
E .31 <.001 .20 <.001 3.44 .001z* -4.52 <.001 -4.88 <.001
Ethnic identity SDO .04 .01 -.12 <.001 -2.46 .01D .11 <.001 .05 .08 1.55 .12E -.04 .02 -.24 <.001 6.29 <.001z* 8.89 <.001 8.08 <.001

New Zealand Journal of Psychology Vol. 44 No. 2, September 2015• 34 •
R. Bergh, J. Sidanius, C. G. Sibley
Ethnic ingroup bias SDO .23 <.001 -.06 .04 5.02 <.001D .21 <.001 -.01 .70 6.48 <.001E .18 <.001 -.09 <.001 7.92 <.001z* 1.62 .10 2.00 .05
Gender SDO .18 <.001 .11 <.001 2.07 .04system justification D .17 <.001 .16 <.001 0.10 .92
E .13 <.001 .00 .90 3.81 <.001z* 2.20 .03 4.28 <.001
Benevolent sexism SDO .20 <.001 .10 <.001 3.12 .001D .25 <.001 .23 <.001 0.79 .43E .10 <.001 -.08 .01 5.29 <.001z* 1.20 <.001 8.48 <.001
Hostile sexism SDO .29 <.001 .20 <.001 2.95 .003D .31 <.001 .25 <.001 2.03 .04E .19 <.001 .07 .02 3.72 <.001z* 7.60 <.001 4.81 <.001
Note. D = SDO-D. E = SDO-E. z* refers to the contrast between SDO-D and SDO-E, calculations of these were based on Steiger’s (1980) formula. High scores on political orientation represent conservative (as opposed to liberal) identification. Pākehā n varies between 4340 and 4595 Māori n varies between 1019 and 1103.
Pākehā (European New Zealanders)
Māori
Criterion Variable r p r p z p

• 35 •New Zealand Journal of Psychology Vol. 44 No. 2, September 2015
Assessment of Performance Validity
A survey of New Zealand psychologists’ practices with respect to the assessment of
performance validity Suzanne L Barker-Collo School of Psychology, University of Auckland
Kris Fernando The Accident Compensation Corporation, New Zealand
Reduced effort or exaggerated symptoms are recognized as a potential confound of neuropsychological assessment. An online survey of 73 registered psychologists in New Zealand was conducted, gaining a snapshot of current practices in the assessment of performance/symptom validity. Most respondents were clinicians working for ACC or privately. Clinical judgement and use of subscales/embedded methods were the most commonly used method of establishing performance validity. The majority of respondents (56.9%) assessed performance validity in < 50% of cases. Decisions on when to test performance validity were based upon client characteristics (e.g., secondary gain, inconsistent history) or context (e.g., ACC, neuropsychological assessment). Reasons for not using tests of performance validity included work with particular populations and contexts where these tests were not seen as appropriate, as well as practical concerns (e.g., costs, time required, lack of training).
Psychological assessment is helpful only if the conclusions it draws are accurate, reliable, and valid. Evidence from various populations (e.g., criminal, compensation seeking, litigant, medical, psychiatric) suggests that reported disabilities or symptom complaints are not always genuine (Ardolf, Denney, & Houston, 2007; Greve, Bianchini, & Ameduni, 2003; McCarter, Walton, Brooks, & Powell, 2009).
Although the prevalence of performance invalidity is reportedly relatively low in clinical samples (i.e., 5-10%), rates of putting forth insufficient effort or symptom exaggeration as high as 40% or more have been reported in litigant samples (Larabee, 2005; Larabee 2007; Mittenberg et al., 2002; Greve et al 2006b); with even higher rates (up to 89%) reported for those in criminal cases of alleged cognitive disorder (Ardolf et al., 2007).
Reduced effor t , fe igned or exaggerated symptoms are particularly recognized as a potential complication of neuropsychological assessment and are deemed a legitimate focus of specific examination (McCarter, Walton, Brooks, &Powell, 2009; Chaftez & Prentkowski,
2011; Dandachi-Fitzgerald, Ponds, Peters , & Merckelbach, 2001). Indeed, evaluation of performance validity is recognized as an essential component of a proper and defensible neuropsychological assessment (Greve & Bianchini, 2004).
At present there is one published paper on the use of performance validity tests in New Zealand. Webb, Batchelor, Meares, Taylor, and Marsh (2012) used logistic regression to examine the contribution of compensation-seeking, injury-related factors, and psychological, cultural and demographic factors to the prediction of failure on tests of performance validity using an archival sample of 555 traumatic brain injury cases assessed within a single clinical practice over a seven year period. Whilst the findings are of import in identifying a raft of factors that predict failure on performance validity tests, they do not provide information on practices related to performance validity testing within New Zealand as a whole.
What is known about performance validity testing is largely based on data from the United States. Unfortunately litigation is a common occurrence in
the United States, and seeking financial gains through such litigation has repeatedly been shown to predict failure on tests of performance validity (Henry et al., 2011). Thus the data available on performance validity testing are largely produced within a context of frequent litigation, which is a very different context to that of New Zealand. In New Zealand the government funded Accident Compensation Corporation (ACC) provides no-fault personal injury cover for all New Zealand residents and visitors to New Zealand, and litigation for damages is specifically precluded.
In New Zealand, the ACC provides guidelines (2013) for clinicians on the use of psychometric tests. They make a clear statement that tests of performance validity should be used by asking that assessors to “Please consider the validity of symptoms for any assessment where there is a potential benefit to be gained from the client managing their symptom presentation. The assessor needs to provide comment regarding this as part of their assessment.” (p.6)
Going beyond those who conduct assessments through ACC, the New Zealand Psychologists Board (March, 2015) developed draft guidelines for the use of psychometric tests in which they provide clear guidelines for the inclusion of tests of performance validity. They precede this with a statement that:
“In any assessment in which there are known advantages or potential advantages to a client presenting him or herself in a particular way, then the psychologist should consider and comment on this issue directly. There may also be unexplained discrepancies between client self-report, various sources of collateral information, observed behaviour and changes
New Zealand Journal of Psychology Vol. 44 No. 2, September 2015• 36 •
S. L. Barker-Collo, K. Fernando
in functionality over time. In these circumstances the psychologist may choose to include tests which are sensitive to detecting the effort applied by the client.“ (NZPS, 2015, p. 10)
This reflects empirical evidence which sugges t s tha t de tec t ion of performance invalidity requires specific assessment; with the literature repeatedly showing that subjective evaluations and ‘clinical judgment’ are unreliable (Faust, 1995; van Gorp, Humphrey, Kalechstien, Brumm, McMullen, Stoddard, et al., 1999).
In a survey of members of the American Board of Neuropsychology (N = 144), subjective evaluations based on observation, on perceived discrepancies in presentation, or on implausible patters of test scores were the primary method used for detecting invalid performance (Mittenberg, Patton, Canyock, & Condit, 2002).
In a Canadian study (Slick et al., 2004) 79% of respondents reported “frequently” using tests to assess performance validity though this is likely to be inflated due to sampling bias (i.e., sampled neuropsychologists who had published articles on symptom validity testing).
A survey of members of the British Psychological Society division of Neuropsychology (McCarter et al, 2009) (N=130) indicated that 95% felt performance validity should be commented on, only 59% formally assessed this in legal contexts. .
Aim To date, the majority of published
information on the practice of testing performance/symptom validity has come from North America and the United Kingdom. In New Zealand, little is known about the degree to which performance validity is examined within clinical practice, despite its inclusion in guidelines produced by the New Zealand Psychologists Board and ACC. The aim of this project was to survey individuals who are registered New Zealand Psychologists to determine the extent to which performance validity tests are used in the New Zealand context, identify the most commonly used methods of testing performance
validity, and determine what beliefs are held by psychologists about the use of these tests.
Methods
ParticipantsParticipations were 73 individuals
practicing as psychologists within New Zealand. Participation was open to any individual who self-identified as a psychologist, with recruitment being advertised through the two largest psychologists’ organisations in the country, the New Zealand Psychological Society and the New Zealand College of Clinical Psychologists. Participants had been practicing as psychologists for an average of 13.94 years.
MeasuresThe survey contained was based
upon that used by McCarter et al. (2009) in their survey of psychologists’ practices around effort testing in the United Kingdom. Respondents were asked to provide information about their length of registration and area of practice, and were then asked to indicate how often they assessed performance validity, the frequency with which they used performance validity tests, to indicate which tests/methods they typically used, and if there were particular context in which they used or did not use these tests. They were also asked about reasons they might include or exclude tests of performance validity in their practice.
ProceduresInformation about the project was
provided via a written advertisement/invitation provided in professional society newsletters within New Zealand. This included contact details of the investigators, who could provide further information to participants if they wish to ask questions or clarify the nature of the project. For those interested in participating, this advertisement included a web-link to allow them to connect directly to the on-line survey in Survey Monkey. A written Participant Information Sheet was provided at the start of the survey which indicated that participation was entirely voluntary, and that data collected may be used in
presentations, academic publications, and to make comparisons with other research. The data gathered will be stored for a period of six years after which all electronic files will be deleted. Surveys were identified using an anonymous code number (e.g., 1 through 999), with consent to participate needing to be provided electronically before the survey could be accessed. The survey remained on-line for a total of 4 months, after this, all data were uploaded into an SPSS 2.0 file for analysis.
Results
Describing the SampleA total of 73 individuals completed
the survey. In New Zealand it is possible to be registered as a psychologist without being registered within a particular scope of practice (i.e., generalist registration). It is also possible to be registered within specialist scopes of practice including Clinical Psychologists, Counsel l ing Psychologis t , and Educational Psychologist . One can also be registered as an intern psychologist (individuals who are in a supervised internship setting and who are enrolled in a post graduate diploma or doctoral course of studies), or as a trainee psychologist (completed formal academic qualifications that provide the foundation competencies required for safe practice in a supervised setting and who are entering board-approved supervised practice for the purpose of achieving full registration).
Of the 73 indiv iduals who responded, 65 were registered within a particular scope of practice (63 Clinical; 2 Educational). Six individuals indicated they were not registered within a particular scope and were therefore ‘generalists’. The remaining two participants were registered as intern psychologists.
In regards to years of practice, the frequency distribution in years is shown in Figure 1. Of the 68 individuals who responded to this question relatively even numbers of respondents fell within each of the 5-year age bands from 1 to 20 years of practice, producing an average of 13.94 years of practice overall. There were three individuals completing their first year of practice and a dozen who

• 37 •New Zealand Journal of Psychology Vol. 44 No. 2, September 2015
Assessment of Performance Validity
had completed 21 or more years of practice.
In regards to area of practice, the most commonly endorsed activities within the sample were Clinical treatment in private practice and ACC funded treatment, followed by Clinical assessment in private practice and ACC funded assessments. Though these were the most commonly endorsed activities of the sample, on average the participants only conducted these activities for 16% to 28% of their activities (see table 1).
Figure 1. Histogram showing number of respondents grouped by years of practice.
Table 1. The proportion of time allocated to each activity (minimum%, maximum%, mean and SD) by the 73 respondents.
Number Min % Max % Mean SDPrivate Practice
Clinical Assessment 26 2 100 16.37 20.01
Clinical Treatment 29 2 100 28.00 27.07
Neuropsych Assessment 18 1 85 20.58 25.28
Neuropsych Treatment 6 10 30 18.33 6.83
Legal
Legal (e.g., Family Court) 15 3 90 28.17 24.58
Medico-Legal (not ACC funded) 8 5 26 13.88 6.67
ACC Funded
Assessment 26 1 65 24.50 17.16
Treatment 28 2 85 26.93 23.31
District Health Board
Inpatient Mental Health 6 5 100 52.17 40.10
Outpatient Mental Health Adult 12 10 100 63.75 35.62
Outpatient Mental Health Child & Family 6 5 100 56.67 38.94
Older Adult Services 4 5 95 50.00 49.16
Rehabilitation 9 5 80 60.00 25.77
Other 10 5 95 51.00 36.42
Non-Government Organization
Rehabilitation 4 5 40 15.00 16.83
Clinical 5 5 90 59.00 42.78
Outpatient 0 - - - -
Other 3 20 50 36.67 15.28
Department of Corrections 4 5 100 43.75 41.91
Ministry of Education 1 100 100
Academia 3 10 97 42.33 47.61
Student Counselling/Clinic 3 10 100 66.67 49.32
Supervision/Training 3 5 50 25.00 22.91
Consultancy 2 35 50 28.33 25.66
Other Government Agency (eg Police, Child and Family Services) 1 15 15.00
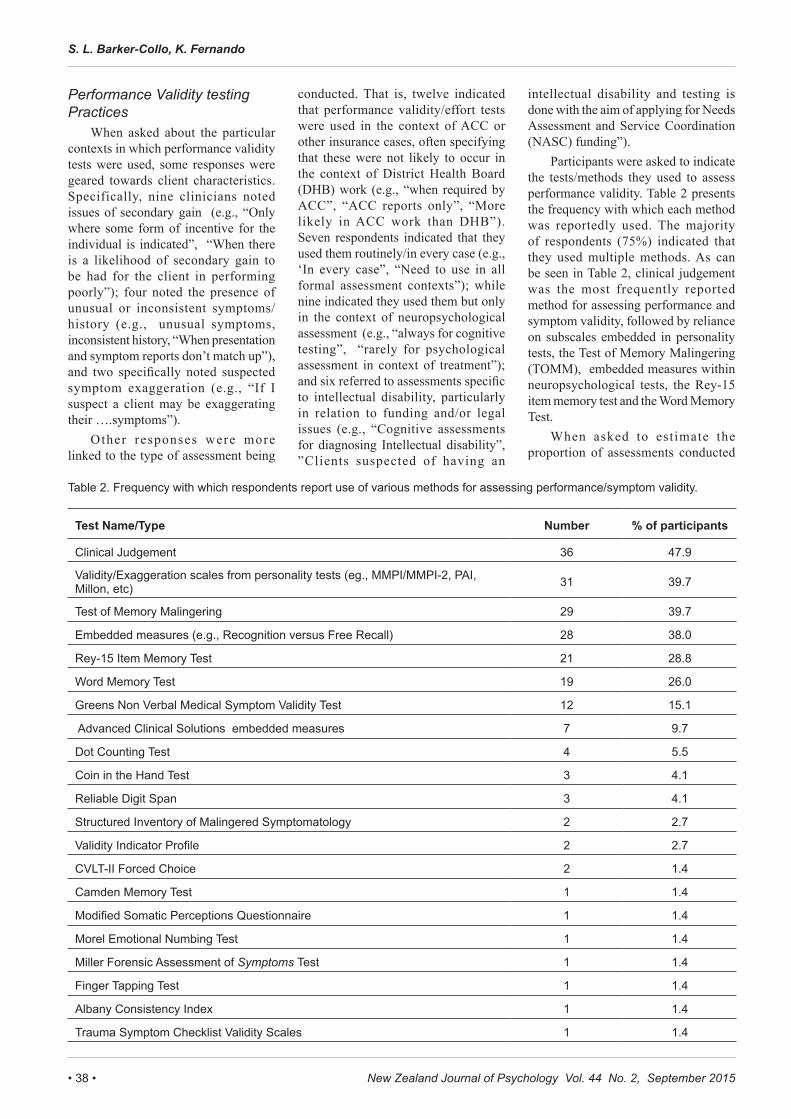
New Zealand Journal of Psychology Vol. 44 No. 2, September 2015• 38 •
S. L. Barker-Collo, K. Fernando
Performance Validity testing Practices
When asked about the particular contexts in which performance validity tests were used, some responses were geared towards client characteristics. Specifically, nine clinicians noted issues of secondary gain (e.g., “Only where some form of incentive for the individual is indicated”, “When there is a likelihood of secondary gain to be had for the client in performing poorly”); four noted the presence of unusual or inconsistent symptoms/history (e.g., unusual symptoms, inconsistent history, “When presentation and symptom reports don’t match up”), and two specifically noted suspected symptom exaggeration (e.g., “If I suspect a client may be exaggerating their ….symptoms”).
Other responses were more linked to the type of assessment being
conducted. That is, twelve indicated that performance validity/effort tests were used in the context of ACC or other insurance cases, often specifying that these were not likely to occur in the context of District Health Board (DHB) work (e.g., “when required by ACC”, “ACC reports only”, “More likely in ACC work than DHB”). Seven respondents indicated that they used them routinely/in every case (e.g., ‘In every case”, “Need to use in all formal assessment contexts”); while nine indicated they used them but only in the context of neuropsychological assessment (e.g., “always for cognitive testing”, “rarely for psychological assessment in context of treatment”); and six referred to assessments specific to intellectual disability, particularly in relation to funding and/or legal issues (e.g., “Cognitive assessments for diagnosing Intellectual disability”, ”Clients suspected of having an
intellectual disability and testing is done with the aim of applying for Needs Assessment and Service Coordination (NASC) funding”).
Participants were asked to indicate the tests/methods they used to assess performance validity. Table 2 presents the frequency with which each method was reportedly used. The majority of respondents (75%) indicated that they used multiple methods. As can be seen in Table 2, clinical judgement was the most frequently reported method for assessing performance and symptom validity, followed by reliance on subscales embedded in personality tests, the Test of Memory Malingering (TOMM), embedded measures within neuropsychological tests, the Rey-15 item memory test and the Word Memory Test.
When asked to estimate the proportion of assessments conducted
Table 2. Frequency with which respondents report use of various methods for assessing performance/symptom validity.
Test Name/Type Number % of participants
Clinical Judgement 36 47.9
Validity/Exaggeration scales from personality tests (eg., MMPI/MMPI-2, PAI, Millon, etc) 31 39.7
Test of Memory Malingering 29 39.7
Embedded measures (e.g., Recognition versus Free Recall) 28 38.0
Rey-15 Item Memory Test 21 28.8
Word Memory Test 19 26.0
Greens Non Verbal Medical Symptom Validity Test 12 15.1
Advanced Clinical Solutions embedded measures 7 9.7
Dot Counting Test 4 5.5
Coin in the Hand Test 3 4.1
Reliable Digit Span 3 4.1
Structured Inventory of Malingered Symptomatology 2 2.7
Validity Indicator Profile 2 2.7
CVLT-II Forced Choice 2 1.4
Camden Memory Test 1 1.4
Modified Somatic Perceptions Questionnaire 1 1.4
Morel Emotional Numbing Test 1 1.4
Miller Forensic Assessment of Symptoms Test 1 1.4
Finger Tapping Test 1 1.4
Albany Consistency Index 1 1.4
Trauma Symptom Checklist Validity Scales 1 1.4
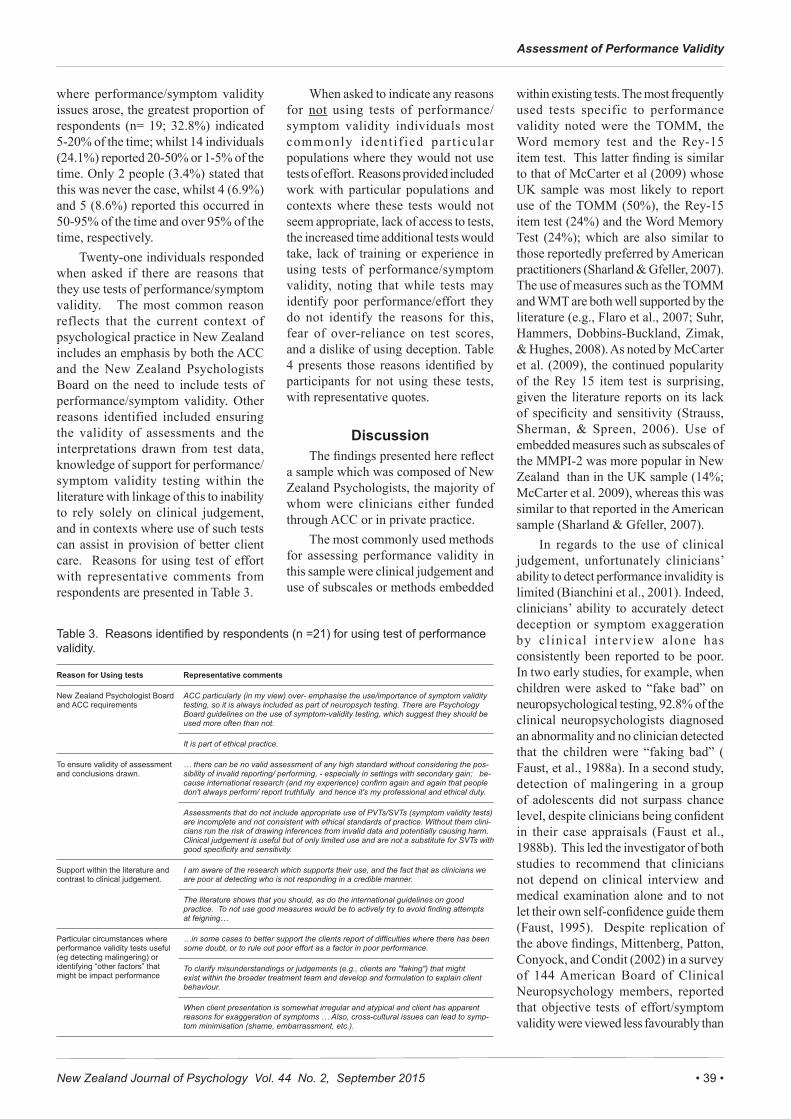
• 39 •New Zealand Journal of Psychology Vol. 44 No. 2, September 2015
Assessment of Performance Validity
where performance/symptom validity issues arose, the greatest proportion of respondents (n= 19; 32.8%) indicated 5-20% of the time; whilst 14 individuals (24.1%) reported 20-50% or 1-5% of the time. Only 2 people (3.4%) stated that this was never the case, whilst 4 (6.9%) and 5 (8.6%) reported this occurred in 50-95% of the time and over 95% of the time, respectively.
Twenty-one individuals responded when asked if there are reasons that they use tests of performance/symptom validity. The most common reason reflects that the current context of psychological practice in New Zealand includes an emphasis by both the ACC and the New Zealand Psychologists Board on the need to include tests of performance/symptom validity. Other reasons identified included ensuring the validity of assessments and the interpretations drawn from test data, knowledge of support for performance/symptom validity testing within the literature with linkage of this to inability to rely solely on clinical judgement, and in contexts where use of such tests can assist in provision of better client care. Reasons for using test of effort with representative comments from respondents are presented in Table 3.
When asked to indicate any reasons for not using tests of performance/symptom validity individuals most commonly identif ied part icular populations where they would not use tests of effort. Reasons provided included work with particular populations and contexts where these tests would not seem appropriate, lack of access to tests, the increased time additional tests would take, lack of training or experience in using tests of performance/symptom validity, noting that while tests may identify poor performance/effort they do not identify the reasons for this, fear of over-reliance on test scores, and a dislike of using deception. Table 4 presents those reasons identified by participants for not using these tests, with representative quotes.
DiscussionThe findings presented here reflect
a sample which was composed of New Zealand Psychologists, the majority of whom were clinicians either funded through ACC or in private practice.
The most commonly used methods for assessing performance validity in this sample were clinical judgement and use of subscales or methods embedded
within existing tests. The most frequently used tests specific to performance validity noted were the TOMM, the Word memory test and the Rey-15 item test. This latter finding is similar to that of McCarter et al (2009) whose UK sample was most likely to report use of the TOMM (50%), the Rey-15 item test (24%) and the Word Memory Test (24%); which are also similar to those reportedly preferred by American practitioners (Sharland & Gfeller, 2007). The use of measures such as the TOMM and WMT are both well supported by the literature (e.g., Flaro et al., 2007; Suhr, Hammers, Dobbins-Buckland, Zimak, & Hughes, 2008). As noted by McCarter et al. (2009), the continued popularity of the Rey 15 item test is surprising, given the literature reports on its lack of specificity and sensitivity (Strauss, Sherman, & Spreen, 2006). Use of embedded measures such as subscales of the MMPI-2 was more popular in New Zealand than in the UK sample (14%; McCarter et al. 2009), whereas this was similar to that reported in the American sample (Sharland & Gfeller, 2007).
In regards to the use of clinical judgement, unfortunately clinicians’ ability to detect performance invalidity is limited (Bianchini et al., 2001). Indeed, clinicians’ ability to accurately detect deception or symptom exaggeration by clinical interview alone has consistently been reported to be poor. In two early studies, for example, when children were asked to “fake bad” on neuropsychological testing, 92.8% of the clinical neuropsychologists diagnosed an abnormality and no clinician detected that the children were “faking bad” ( Faust, et al., 1988a). In a second study, detection of malingering in a group of adolescents did not surpass chance level, despite clinicians being confident in their case appraisals (Faust et al., 1988b). This led the investigator of both studies to recommend that clinicians not depend on clinical interview and medical examination alone and to not let their own self-confidence guide them (Faust, 1995). Despite replication of the above findings, Mittenberg, Patton, Conyock, and Condit (2002) in a survey of 144 American Board of Clinical Neuropsychology members, reported that objective tests of effort/symptom validity were viewed less favourably than
Table 3. Reasons identified by respondents (n =21) for using test of performance validity.
Reason for Using tests Representative comments
New Zealand Psychologist Board and ACC requirements
ACC particularly (in my view) over- emphasise the use/importance of symptom validity testing, so it is always included as part of neuropsych testing. There are Psychology Board guidelines on the use of symptom-validity testing, which suggest they should be used more often than not.
It is part of ethical practice.
To ensure validity of assessment and conclusions drawn.
… there can be no valid assessment of any high standard without considering the pos-sibility of invalid reporting/ performing, - especially in settings with secondary gain; be-cause international research (and my experience) confirm again and again that people don't always perform/ report truthfully and hence it's my professional and ethical duty.
Assessments that do not include appropriate use of PVTs/SVTs (symptom validity tests) are incomplete and not consistent with ethical standards of practice. Without them clini-cians run the risk of drawing inferences from invalid data and potentially causing harm. Clinical judgement is useful but of only limited use and are not a substitute for SVTs with good specificity and sensitivity.
Support within the literature and contrast to clinical judgement.
I am aware of the research which supports their use, and the fact that as clinicians we are poor at detecting who is not responding in a credible manner.
The literature shows that you should, as do the international guidelines on good practice. To not use good measures would be to actively try to avoid finding attempts at feigning…
Particular circumstances where performance validity tests useful (eg detecting malingering) or identifying “other factors” that might be impact performance
…in some cases to better support the clients report of difficulties where there has been some doubt, or to rule out poor effort as a factor in poor performance.
To clarify misunderstandings or judgements (e.g., clients are "faking") that might exist within the broader treatment team and develop and formulation to explain client behaviour.
When client presentation is somewhat irregular and atypical and client has apparent reasons for exaggeration of symptoms … Also, cross-cultural issues can lead to symp-tom minimisation (shame, embarrassment, etc.).

New Zealand Journal of Psychology Vol. 44 No. 2, September 2015• 40 •
S. L. Barker-Collo, K. Fernando
Reason for Not Using tests Representative comments
Work with populations where these are either not available or not seen to be useful
Children developmentally do not have a concept of manipulating the assessment un-less they have been taught by an adult... There are also problems about the validity of using performance/ symptom validity tests on children as they are validated using adult populations.
Where the person obviously has an intellectual disability and has a good history to show that he or she would meet criteria even if he or she was engaged in reduced effort or symptom exaggeration
For a client turning up for treatment, say for depression, it would be rather odd to say that I am questioning the validity of what they are telling me…
…where someone is getting a np assessment because of a relatively neurological prob-lem, in my experience they are rarely faking bad and are not keen to have dementia, ms or whatever it may be.
Work in particular assess-ment contexts where perfor-mance validity tests would not be used
Generally for psychological issues. Generally not outside working for statutory organ-isations (E.g., ACC) or other professional bodies (e.g., Insurance claims).
Inappropriate to setting - private practice work, Inappropriate given presenting problem, Inappropriate given patient presenting as "well”
not required in general, as there is little incentive for (my) clients to fake good or bad, compared to those where there is possible imprisonment or financial pay off depending on assessment outcome
not useful in most contexts
Lack of access to or avail-ability of tests
I went to a training seminar to look at use of symptom validity scales with self-report by parents of children's symptoms and there was apparently nothing developed like that.
Lack of availability of test materials, ESPECIALLY computer scoring packages…
Unavailable at workplace
I work in isolation, only psychologist in the service and we have almost no psychometric tests, I'm also new to adult work in the service.
Time it adds to an assess-ment
Impact on time required for assessment, especially the WMT and TOMM. Normally time does not allow much in the way of formal, psychometric assessment and I am quite dependent on client report.
They add time to your assessment and its not clear how sensitive and specific they are in a NZ context
Lack of experience/training in the area
I have identified this as an important area to look at just have not had the time to really research it well
I wasn't trained in these originally and they have not been a standard workplace policy in previous organisations I have worked for.
Not enough training in using these tools, worry about misinterpretation of results by others
The tests identify poor performance/effort but not the reasons for this.
There are many reasons why people perform "poorly" on psychometric tests. These are not captured by the instruments themselves. Tests of symptom validity are essentially instruments designed to invalidate human experience. As a Clinical Psychologist, I have no interest in furthering this cynical pursuit.
Multiple reasons for failure- not necessarily indicating malingering (i.e. specificity). 'Good' performance not necessarily indicating poor effort (i.e. sensitivity). These tests are generally a poor substitute (in my view) for a good knowledge of the tests (and underlying neurological constructs) in detecting performance that does or does not fit with a neurological profile.
Fear of overreliance on test scores
Too much emphasis is placed on the these test scores alone, rather than analysis of the profile (including embedded measures) clinical interview, observations, other clinical reports etc.
Dislike use of deception I don't like to employ deception in my work with clients and I have not yet found any way that adequately deals with this for me
Table 4. Reasons identified by participants for not using tests of performance validity, with representative quotes.
use of judgements based on observation, discrepant clinical presentation, or unusual patterns of test scores. Recent studies in the area continue to support assertions that clinical judgments should not be used with any confidence (Samuel, & Mittenberg, 2005; Garb & Garb, 2005; Adetunji , et al. 2006). Indeed, the literature strongly supports recommendations from professional bodies (including the New Zealand
Psychologists’ Board) that clinicians should not rely on clinical interviews and judgement alone in the detection of symptom exaggeration (British Psychologists Society, 2009; Bush et al., 2005; New Zealand Psychologists Board, 2013). In the present study, whilst clinical judgement was the most commonly used method, in this context clinicians were able to select more than one method, and it is likely
that in reporting the using some level of clinical judgement in formulating a conclusion, this is likely to have occurred in conjunction with formal testing.
When asked about the proportion of assessments conducted where performance validity issues arose, only two individuals stated that this was never the case, with the majority (56.9%) reporting that this occurred in 5% to 50% of cases. In the literature, estimates of the prevalence of symptom exaggeration vary depending on the referral type, setting and diagnosis. For example, in a review of 11 studies Larrabee (2003) found reported prevalence of symptom exaggeration between 15% and 64%; whilst Chafetz (2008) found prevalence of symptom exaggeration between 46% and 60% in disability claimants; and Ardolf (2007) found probable or definite malingering in 54% of 105 criminal defendants referred for a neuropsychological assessment. In examining prevalence across populations, an American survey of 131 neuropsychologists (Mittenberg, 2002) reported a prevalence of symptom exaggeration of around 30% in personal injury, disability or workers’ compensation referrals and 20% in criminal referrals compared to 8% in medical or psychiatric referrals not involved in litigation or compensation.
In this s tudy, pract i t ioners’ decisions as to whether to utilize tests of performance validity within a particular assessment were made based upon client characteristics (i.e., issues of secondary gain, unusual or inconsistent symptoms/history, suspected symptom exaggeration) or the context of the assessment (i.e., in the context of ACC or other insurance cases, only in the context of neuropsychological assessment; for legal/funding issues related to intellectual disability). Similarly, when asked reasons for using tests of performance validity most participants in this study reported that this was due to ACC and the New Zealand Psychologists Board identifying this as good practice. Other reasons identified included ensuring the validity of assessments and the interpretations drawn from test data, knowing that the literature supports its use, and in order to improve client care.
• 41 •New Zealand Journal of Psychology Vol. 44 No. 2, September 2015
Assessment of Performance Validity
When asked to indicate any reasons for not using tests of performance/symptom validity, reasons provided inc luded work wi th par t icu lar populations and contexts where these tests would not seem appropriate. This is similar to reports that in the UK sample (McCarter et al., 2009), it was ‘universally accepted’ that there is little need for formal testing of symptom validity in clinical cases. In a Canadian study, 79% of clinicians reportedly tested for symptom validity “frequently”, though this high rate of test use likely reflects that the sample was obtained from the membership of the National Academy of Neuropsychologists (Slick Tan, Strauss, & Hultsch, 2004); rather than psychologists more generally as is the case here. The present findings are in contrast to the UK sample where 22%of respondents expressed concern about test reliability and likelihood of misclassification of genuine deficits as poor effort or malingering; an issue not raised in the present sample; potentially due to the growing literature available on the valid use of such tests.
Other reasons reported for not using tests of effort reflected more practical barriers, included lack of access to tests, the increased time additional tests would take, lack of training or experience in using tests of effort, noting that while tests may identify performance invalidity they do not identify the reasons for this, fear of over-reliance on test scores, and a dislike of using deception. Lack of time and availability/cost of measures were similarly reported in McCarter et al.’s (2009) UK study. It should be noted that very little additional time and no added cost is incurred when using embedded indictors. It must also be acknowledged that, in cases where performance invalidity is present, failure to include some indicator of validity in an assessment battery may mean a considerable amount of time has been spent on assessment where the findings are not useful. Harman (2002), in reflecting on Green et al.’s (2001) assertion that effort accounts for 50% of variance in neuropsychological assessment findings, stated that “it is difficult to argue that a variable explaining one half of a battery variance is a ‘wasteful’ preoccupation” (p.709).
The findings do suggest that there
is a need to provide clinicians with more training opportunities in the area, particularly for those who do not work primarily in neuropsychological assessment . The f indings a l so highlighting the fact that there are many causes of performance validity concerns, only one of which is malingering/poor effort. Whilst the literature indicates that the use of clinical judgement should not be the sole basis of judgements in regards to this, neither should test scores be the sole basis of assessment findings. Clinically, there is a need to tease out the contributing factors to identify why a person is underperforming/over-reporting symptoms in order that these can then be targeted in rehabilitation to assist the client with his/her recovery. Indeed, the finding of symptom exaggeration or poor effort in itself should not be seen as a total negation of the possibility of real issues that require clinical intervention.
ReferencesAccident Compensation Corporation (2013).
Guidelines for the Use of Psychometric Tests. Auckland, NZ: ACC.
A m e r i c a n A c a d e m y o f C l i n i c a l Neuropsychology. American Academy of Clinical Neuropsychology (AACN) practice guidelines for neuropsychological assessment and consultation. The Clinical Neuropsychologist 2007;21(2):209-31.
Adetunji, B.A., Biju, B., Mathews, M., Williams, A., Osinowo, T., & Oladinni, O. (2006). Detection and Management of Malingering in a Clinical Setting. Primary Psychiatry,13(1):61-69.
Ardolf, B.R., Denney, R. L., & Houston, C. M. (2007). Base rates of negative r e s p o n s e b i a s a n d m a l i n g e r e d neurocognitive dysfunction among criminal defendants referred for neuropsychological evaluation. The Clinical Neuropsychologist, 21(6), 899-916.
Berry D., & Nelson N. (2010) DSM-5 and Malingering: a Modest Proposal. Psychological Injury and Law, 3(4):295-303.
Bianchini K.J., Mathias, W. & Greve, K.W. (2001). Symptom validity testing: a critical review. Clinical Neuropsychology, 15(1):19-45.
British Psychological Society. Assessment of effort in clinical testing of cognitive functioning for adults, 2009.
Bush, S.S., Ruff, R., Troster, A., Barth, J.,
Koffler, S., Pliskin, N., et al. (2005). Symptom validity assessment: practice issues and medical necessity NAN policy & planning committee. Archives of Clinical Neuropsychology,20(4):419-26.
Chaftez, M., & Prentkowski, E. (2011). A case of malingering by proxy in a social security disability psychological consultative examination. Applied Neuropsychology, 18, 143-149.
Dandachi-Fitzgerald, B., Pronds, R.W.H.M., Peters, M.J.V., & Merckelbach, H. (2011). Cognitive underperformance and symptom over-reporting in a mixed psychiatric sample. The Clinical Neuropsychologist, 25, 812-828.
Faust, D. (1995). The detection of deception. Neurology Clinics, 13, 255-265.
Faust D, Guilmette, T. J., Hart, K., Artes, H.R., Fishbourne, F. J., & Davey, L. (1988a). Pediatric malingering: The capacity of children to fake believable deficits on neuropsychological testing. Journal of Consulting and Clinical Psychology, 56(4):578-82.
Faust D, & Hart, K., & Guilmette, T.J. (1988b). Neuropsychologists’ capacity to detect adolescent malingerers. Professional Psychology: Research and Practice, 19, 508-515
Flaro, L., Green, P., & Robertson, E. (2007). Word Memory Test failure 23 times higher in mild brain injury than in parents seeking custody: The power of external incentives, Brain Injury, 21(4), 373-383.
Garb, H.N., & Garb, H.N. (2005) Clinical judgment and decision making. Annual Review of Clinical Psychology, 1:67-89.
Green, P., Rohlingm M.L., Lees-Haley,P.R., & Allen, L.M. (2001). Effort has a greatereffect on test scores than severe brain injury in compensation claimants. Brain Injury, 15(12), 1045-1060.
Greve, K. W., Bianchini, K. J., & Ameduni, C.J. (2003). Use of a forced choice test of tactile discrimination in the evaluation of functional sensory loss: A report of 3 cases. Archives of Physical Medicine and Rehabilitation, 84(8), 1233-1236.
Greve, K. W., & Bianchini, K. J. (2004). Setting empirical cut-offs on psychometric indicators of negative response bias: A methodological commentary with recommendations. Archives of Clinical Neuropsychology, 19(4), 533-541.
Greve, K. W., Bianchini, K. J., & Doane, B.M. (2006). Classification accuracy of the test of memory malingering in traumatic brain injury: Results of a known-group analysis. Journal of Clinical and Experimental Neuropsychology, 28(7), 176-190.
New Zealand Journal of Psychology Vol. 44 No. 2, September 2015• 42 •
S. L. Barker-Collo, K. Fernando
Hartman, D.E. (2002). The unexpected lie is a lie worth fibbing: Neuropsychological malingering and the Word Memory Test. Archives of Clinical Neuropsychology, 17, 709-714.
Heaton, R.K., Smith, H.H., Lehman, R. A., & Vogt, A.T. (1987). Prospects for faking believable deficits on neuropsychological testing. Journal of Consulting and Clinical Psychology,46(5):892-900
Larabee, G.J. (2003). Detection of malingering using atypical performance patterns of standard neuropsychological tests. The Clinical Neuropsychologist, 17, 410-425.
Larabee, G. (2005). Assessment of malingering. In G.J. Larabee (Ed). Forensic neuropsychology: A scientific approach. (pp115-`58). New York: Oxford University press.
Larabee, G., (2007) Malingering, research designs, and base rates. In G. J. Larabee (Ed.), Assessment of malingered neuropsychological deficits (pp.3-13). Oxford, UK.: Oxford University press.
McCarter, R. J., Walton, N. H., Brooks, D. N., & Powell, G. E. (2009). Effort testing in contemporary UK neuropsychological practice. The Clinical Neuropsychologist, 23(6), 1050-1066.
Mittenberg, W., Patton, C., Canyock, E., & Condit, D. (2002). Base rates of malingering and symptom exaggeration. Journal of Clinical and Experimental Neuropsychology, 24, 1094-1102.
New Zealand Psychologists Board (2013). Guidelines for the Use of Psychometric Tests. Wellington NZ: New Zealand Psychologist’s Board.
Rosen J, Mulsant, B. H., Bruce, M. L., Mittal, V., & Fox, D/ (2004) Actors’ Portrayals of Depression to Test Interrater Reliability in Clinical Trials. The American Journal of Psychiatry, 161(10):1909-11.
Samuel, R.Z., & Mittenberg, W. (2005). D e t e r m i n a t i o n o f M a l i n g e r i n g in Disability Evaluations. Primary Psychiatry, 12(12):60-68.
Sharland, M. J., & Gfeller, J. D.(2007). A survey of neuropsychologists’ beliefs and practices with respect to the assessment of effort. Archives of Clinical Neuropsychology, 19(1), 43-51
Slick, D. J., Tan, J. E., Strauss, E. H., & Hultsch, D. F. (2004). Detecting malingering: A survey of expert’s p rac t ices . Archives o f Cl in ica l Neuropsychology, 19(4), 465-473.
S t rauss , E . , Sherman , E .M.S . , & Spreen, O.(2006). A compendium of neuropsychological tests. Oxford, UK: Oxford University Press.
Suhr, J., Hammers, D., Dobbins-Buckland, K., Zimak, E., & Hughes, C. (2008). The relationship of malingering test failures to self-reported symptoms and neuropsychological findings in adults referred fir ADHD evaluation. Archives of Clinical Neuropsychology, 23(5), 521-530.
Van Gorp, W. G., Humphrey, L. A., Kalechstein, A. L., Brumm, V.L., McMullen, W. J., Stoddard, M. A., et al (1999).How well do standard neuropsychological tests identify malingering? A preliminary analysis. Journal of Clinical and Experimental Neuropsychology, 21(2), 245-250.
Webb, J. W., Batchelor, J., Meares, S., Taylor, & Marsh, N. V. (2012). Effort test failure: Towards a predictive model. The Clinical Neuropsychologist, 26 (8), 1377-1396.
Address for Correspondence:Suzanne L Barker-Collo School of PsychologyThe University of Auckland, Tamaki CampusPrivate bag 92019AucklandNew [email protected]
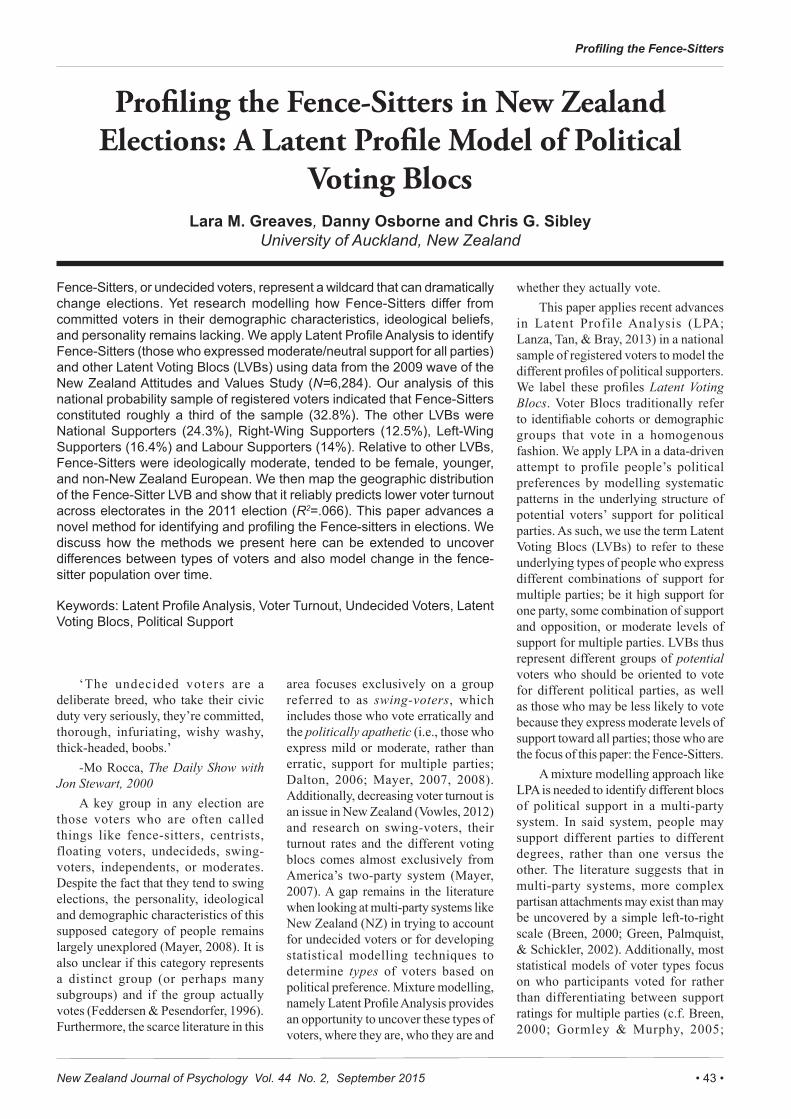
• 43 •New Zealand Journal of Psychology Vol. 44 No. 2, September 2015
Profiling the Fence-Sitters
Profiling the Fence-Sitters in New Zealand Elections: A Latent Profile Model of Political
Voting BlocsLara M. Greaves, Danny Osborne and Chris G. Sibley
University of Auckland, New Zealand
Fence-Sitters, or undecided voters, represent a wildcard that can dramatically change elections. Yet research modelling how Fence-Sitters differ from committed voters in their demographic characteristics, ideological beliefs, and personality remains lacking. We apply Latent Profile Analysis to identify Fence-Sitters (those who expressed moderate/neutral support for all parties) and other Latent Voting Blocs (LVBs) using data from the 2009 wave of the New Zealand Attitudes and Values Study (N=6,284). Our analysis of this national probability sample of registered voters indicated that Fence-Sitters constituted roughly a third of the sample (32.8%). The other LVBs were National Supporters (24.3%), Right-Wing Supporters (12.5%), Left-Wing Supporters (16.4%) and Labour Supporters (14%). Relative to other LVBs, Fence-Sitters were ideologically moderate, tended to be female, younger, and non-New Zealand European. We then map the geographic distribution of the Fence-Sitter LVB and show that it reliably predicts lower voter turnout across electorates in the 2011 election (R2=.066). This paper advances a novel method for identifying and profiling the Fence-sitters in elections. We discuss how the methods we present here can be extended to uncover differences between types of voters and also model change in the fence-sitter population over time.
Keywords: Latent Profile Analysis, Voter Turnout, Undecided Voters, Latent Voting Blocs, Political Support
‘The undecided voters are a deliberate breed, who take their civic duty very seriously, they’re committed, thorough, infuriating, wishy washy, thick-headed, boobs.’
-Mo Rocca, The Daily Show with Jon Stewart, 2000
A key group in any election are those voters who are often called things like fence-sitters, centrists, floating voters, undecideds, swing-voters, independents, or moderates. Despite the fact that they tend to swing elections, the personality, ideological and demographic characteristics of this supposed category of people remains largely unexplored (Mayer, 2008). It is also unclear if this category represents a distinct group (or perhaps many subgroups) and if the group actually votes (Feddersen & Pesendorfer, 1996). Furthermore, the scarce literature in this
area focuses exclusively on a group referred to as swing-voters, which includes those who vote erratically and the politically apathetic (i.e., those who express mild or moderate, rather than erratic, support for multiple parties; Dalton, 2006; Mayer, 2007, 2008). Additionally, decreasing voter turnout is an issue in New Zealand (Vowles, 2012) and research on swing-voters, their turnout rates and the different voting blocs comes almost exclusively from America’s two-party system (Mayer, 2007). A gap remains in the literature when looking at multi-party systems like New Zealand (NZ) in trying to account for undecided voters or for developing statistical modelling techniques to determine types of voters based on political preference. Mixture modelling, namely Latent Profile Analysis provides an opportunity to uncover these types of voters, where they are, who they are and
whether they actually vote.This paper applies recent advances
in Latent Profile Analysis (LPA; Lanza, Tan, & Bray, 2013) in a national sample of registered voters to model the different profiles of political supporters. We label these profiles Latent Voting Blocs. Voter Blocs traditionally refer to identifiable cohorts or demographic groups that vote in a homogenous fashion. We apply LPA in a data-driven attempt to profile people’s political preferences by modelling systematic patterns in the underlying structure of potential voters’ support for political parties. As such, we use the term Latent Voting Blocs (LVBs) to refer to these underlying types of people who express different combinations of support for multiple parties; be it high support for one party, some combination of support and opposition, or moderate levels of support for multiple parties. LVBs thus represent different groups of potential voters who should be oriented to vote for different political parties, as well as those who may be less likely to vote because they express moderate levels of support toward all parties; those who are the focus of this paper: the Fence-Sitters.
A mixture modelling approach like LPA is needed to identify different blocs of political support in a multi-party system. In said system, people may support different parties to different degrees, rather than one versus the other. The literature suggests that in multi-party systems, more complex partisan attachments may exist than may be uncovered by a simple left-to-right scale (Breen, 2000; Green, Palmquist, & Schickler, 2002). Additionally, most statistical models of voter types focus on who participants voted for rather than differentiating between support ratings for multiple parties (c.f. Breen, 2000; Gormley & Murphy, 2005;

New Zealand Journal of Psychology Vol. 44 No. 2, September 2015• 44 •
L. M. Greaves, D. Osborne, C. G. Sibley
Gormley & Murphy, 2008). Using the three-step distal approach for LPA, we then describe these profiles in terms of demographics, personality, and ideology; without having these covariates inform the model solution (Lanza, Tan, & Bray, 2013).
We then use the model to assess the extent to which differences in the proportion of the Fence-Sitter LVB across electorates predicts variation in voter turnout for the 2011 NZ election. The NZ electoral system is organized into 63 general and 7 Māori-specific electorates, or geographical areas of between 55,000 (in the case of some Māori electorates) and 70,000 people. This is a highly relevant, critical validity test as voter turnout has been declining in NZ over recent decades (Vowles, 2012). Thus, this is not only the first study applying LPA to Fence-Sitters, but is the first to illustrate how Fence-Sitters are distributed geographically and how this may affect turnout. We examine how the people belonging to the different LVBs differ in terms of gender, age, deprivation, education, employment, ethnicity, political ideology, and the Big-Six model of personality. Our analyses thus provide much needed information on who the Fence-Sitters are, where they are, and the extent to which profile membership predicts known rates of voter turnout.
Defining Fence-SittersThere is no single definition of the
term swing-voter. It is used to refer to voters who swing between parties, but can also describe voters who swing elections (Dalton, 2006; Mayer, 2008). Swing-voters can be thought of as two key groups: party switchers and political moderates (Dalton, 2006; Shaw, 2008). Party switchers are erratic voters—those who swing between parties election-to-election. However, this may include those who have a clear preference that changes by the next election (Dalton, 2006). The other component of Swing-Voters, sometimes called political moderates, show a lack of support for any party. As such, their vote choice may swing an election if they actually vote (Battaglini, Morton, & Palfrey, 2010; Dalton, 2006; Feddersen & Pesendorfer, 1996; Shaw, 2008). Research on this broader group of Fence-Sitters (versus
committed voters) has suggested that they tend to be less ideological, less informed, less educated, younger, poorer, and from minority ethnic groups (Battaglini, Morton, & Palfrey, 2010; Dalton, 2006; Feddersen & Pesendorfer, 1996).
In the most comprehensive study of swing-voters to date, Mayer (2008) analysed affective feeling thermometer ratings of presidential candidates from the 1972-2004 American National Election Studies. Mayer (2008) posited that there were not only presidential supporters and opponents, but also a group of fence sitters who “rather than seeing one party as the embodiment of all virtue and the other as the quintessence of vice, swing-voters are pulled—or repulsed—in both directions” (p. 2). Mayer’s (2007, 2008) main finding was that demographic differences across the years were trivial, but there were reliable ideological differences in that swing-voters tended to be ideologically moderate.
This paper employs LPA to model Fence-Sitters based on measures of political party support. We measured the extent to which participants supported 6 parties active in New Zealand’s Parliament during data collection on a 1 (strongly oppose) to 7 (strongly support) scale. Such a scale was used so that we could detect patterns of support, opposition or neutrality across a number of parties at a single point in time. The term Fence-Sitter is used because these voters are not necessarily swing-voters, centrists or political independents. Again, although definitions in the literature tend to vary we believe that swing voters may show preferences that differ across elections, centrists may favour moderate parties, and independents would likely favour no parties. Instead, Fence-Sitters sit on the metaphorical fence of political support: they express neutral levels of support for all parties.
Latent Profile Modelling of Voting Blocs
Latent Profile Analysis (LPA) is a type of mixture modelling that uses sets of responses to continuous variables to build latent/unobserved typologies or response profiles. LPA allows us to group together people across a number
of domains. To use a simple example, we could use LPA to identify the number of subgroups of people with various combinations of dimensions like height, weight and shoe size. LPA might give us common combinations like tall and heavy with big feet, and short and light with small feet, but also less common combinations like tall and heavy with small feet. If we just look at averages of each characteristic we might miss a key group, but LPA allows for a number of latent profiles of participants to emerge. In this case we are looking at Latent Voting Blocs that summarise several response patterns of support across political parties in an interpretable and theoretically sensible way (Lanza, Tan, & Bray, 2013).
LPA has been previously used in population health and medical research to identify at-risk groups and has recently been used in social psychology to identify different profiles of religious faiths, sexisms, and bicultural policy attitudes (Pickles et al., 1995; Sibley & Becker, 2012; Sibley & Liu, 2013; Wilson, Bulbulia, & Sibley, 2013). One notable example in political psychology used policy support items to identify six ideological profiles with LPA (Weber & Federico, 2013). Results showed people had different levels of endorsement for 19 policy issues including both economic and social issues. Six profiles were identified: consistent liberals, libertarians, social conservatives, moderates, consistent conservatives, and inconsistent liberals. Because these analyses were based on an LPA, the authors’ results went beyond traditional methods of simply categorising people as liberal or conservative based on a single dimension (Feldman & Johnston, 2009; Weber & Federico, 2013). This is particularly important, as two-party systems typically characterise voters as polar opposites with just independent voters in the centre. However, within two-party systems people may have different levels of support for parties. For example, someone could be high on support for both parties, low for both, high on one and low on the other or just apolitical. LPA provides a useful way to categorise different political support blocs, regardless of the system.
Previously, mixture models (of which LPA is one application) have

• 45 •New Zealand Journal of Psychology Vol. 44 No. 2, September 2015
Profiling the Fence-Sitters
been used to analyse legislative voting decisions for members of both the United Kingdom’s House of Commons and United States’ House of Representatives to uncover voting blocs of politicians (Hartigan, 2000; Spirling & Quinn, 2010). Although some research using mixture modelling has been completed in the US in relation to different ballot proposals, a few studies have been conducted in multi-party systems like the UK, Canada, and Ireland (Dubin & Gerber, 1992; Clarke & McCutcheon, 2009). To date, no studies have used LPA to identify Fence-Sitters, or differentiate them from other LVBs. Rather, mixture modelling has been used to identify key partisan and policy voting blocs (Breen, 2000; Clarke & McCutcheon, 2009; Gormley & Murphy, 2011; Gormley & Murphy, 2005; Vermunt, 2010).
What does this approach offer for our understanding of political party support? The analysis of different LVBs is particularly important in multi-party contexts because it can help uncover complex patterns of support for multiple parties. The risk is that we might miss a group or groups with specific low/high combinations of political support. Going back to the previous example, we might miss a group that deviates from what we would theorise – the group that is tall, heavy and has small feet – any group that has a novel combination of responses is a particularly interesting group to find and describe. Indeed, a key strength of LPA is its exploratory nature. In our research the analysis of different LVBs is particularly important as in multi-party contexts it can help uncover complex patterns of support for multiple parties. For example, in a multi-party system, one may be high in support for one party, or may also support the parties’ allies. Although NZ rejected a two-party First Past the Post (FPP) electoral system twenty years ago, there may still be older voters who oppose minor parties and opt for majority parties because they were socialised under a winner-takes-all system (Green, Palmquist, & Schickler, 2002; Osborne, Valentino, & Sears, 2011). Such an approach also provides the proportion of the population that are Fence-Sitters, which can be mapped on to any given area, as we know which electorate that participants vote (or, rather, do not vote)
in. This technique allows us to see if the proportion of Fence-Sitters in an area predicts voter turnout in that electorate.
Voter TurnoutVoter turnout is thought to decide
elections, as multi-million dollar campaigns in many democracies are developed to ‘get out the vote’ (Green & Gerber, 2008). NZ has had a world-leading legacy of high voter turnout which has faltered in recent years (Nagel, 1988; Vowles, 2012). Many researchers have attempted to identify the cause of this drop-off in voter turnout, both in NZ and around the world. The most common explanation posits that declining voter turnout follows a general drop-off in community and civic participation (Gerber & Green, 2000).
This may not be the case for committed voters, however. Indeed, decades-old research has shown that partisan voters are more engaged in politics and are more likely to vote than their non-partisan counterparts (Campbell, Converse, Miller, & Stokes, 1960; Verba, Nie, & Kim, 1978). Even in 1924, Merriam and Gosnell lamented that the greatest cause of non-voting is indifference. Downs (1957) proposed a rational choice theory of voter turnout, in that the effort associated with educating oneself and actually voting may not exceed the reward. Thus, for the disinterested citizen, voting may not hold an appeal. This leads to the question: do Fence-Sitters actually vote? Feddersen and Pesendorfer (1996) found that uninformed, indifferent voters preferred not to vote even when voting was costless. However, key questions remain about whether Fence-Sitters vote and what predicts being an uninformed/indifferent voter.
Demographic and Psychological Differences in Latent Voting Blocs
Exis t ing research on voter preferences examined demographic differences between voters, with a particular focus on age, Socio-Economic Status (SES), religion, and ethnicity (e.g., see Visser, 1994). Although the link between SES and voter preference has been decreasing over the years, it may remain in modern NZ politics;
given that ACT and National supporters tend to be more affluent (Katz, 2001; Mulgan, 1997). The only research exploring the SES of something close to Fence-Sitters has shown that American swing-voters in 2004 earned marginally less than Democrats, and far less than Republicans (Dimock, Clark, & Menasce Horowitz, 2008).
Education is another demographic variable that differentiates voter: liberals are generally more educated than conservatives, but the findings for Fence-Sitters are mixed (Carney, Jost, Gosling, & Potter, 2008). Some research suggests that Fence-Sitters may have lower levels of education (Dimock, Clark, & Menasce Horowitz, 2008; Mayer, 2008). Conversely, interviews with undecided voters have shown they may be just as educated and informed as others (Dalton, 2006; Mayer, 2008).. As the opening epigraph laments, undecided voters may be a highly deliberative group taking their time or they may not be thinking about politics. Existing research examining these distinct possibilities, however, remains unclear.
Gender and ethnicity are also important characteristics in NZ politics. Recent research in NZ has shown a modern-day gender gap wherein women vote for Labour at higher rates than National (Levine & Roberts, 2008). Additionally, a recent study found that women were more likely than men to support the Greens and Labour (Greaves, Osborne, Sengupta, Milojev, & Sibley, 2014). The three main ethnic minority groups in NZ are people from Māori, Pacific and Asian descent (Ministry of Social Development, 2010). While there is some research on Māori and Pacific voters, few studies have examined the preferences of Asian voters in NZ. It is thought that Māori tend to support the left because Labour has had a long running relationship with the Rātana Church (a Māori Anglican Church) and due to the long running economic inequality between New Zealand Europeans and Māori (Miller, 2010). It remains to be seen if Pacific Nations’ New Zealanders still strongly support Labour based on the immigration policies of the 1970s, and again, socio-economic inequality (Mulgan, 1997). Ideology
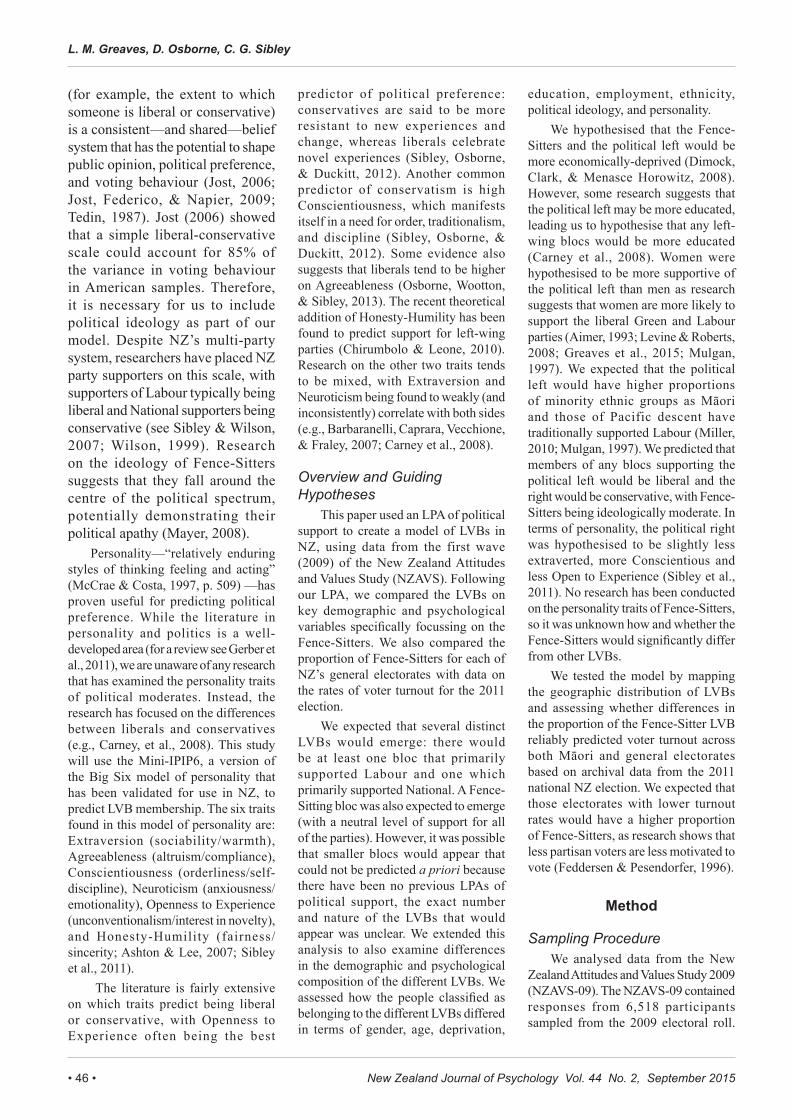
New Zealand Journal of Psychology Vol. 44 No. 2, September 2015• 46 •
L. M. Greaves, D. Osborne, C. G. Sibley
(for example, the extent to which someone is liberal or conservative) is a consistent—and shared—belief system that has the potential to shape public opinion, political preference, and voting behaviour (Jost, 2006; Jost, Federico, & Napier, 2009; Tedin, 1987). Jost (2006) showed that a simple liberal-conservative scale could account for 85% of the variance in voting behaviour in American samples. Therefore, it is necessary for us to include political ideology as part of our model. Despite NZ’s multi-party system, researchers have placed NZ party supporters on this scale, with supporters of Labour typically being liberal and National supporters being conservative (see Sibley & Wilson, 2007; Wilson, 1999). Research on the ideology of Fence-Sitters suggests that they fall around the centre of the political spectrum, potentially demonstrating their political apathy (Mayer, 2008).
Personality—“relatively enduring styles of thinking feeling and acting” (McCrae & Costa, 1997, p. 509) —has proven useful for predicting political preference. While the literature in personality and politics is a well-developed area (for a review see Gerber et al., 2011), we are unaware of any research that has examined the personality traits of political moderates. Instead, the research has focused on the differences between liberals and conservatives (e.g., Carney, et al., 2008). This study will use the Mini-IPIP6, a version of the Big Six model of personality that has been validated for use in NZ, to predict LVB membership. The six traits found in this model of personality are: Extraversion (sociability/warmth), Agreeableness (altruism/compliance), Conscientiousness (orderliness/self-discipline), Neuroticism (anxiousness/emotionality), Openness to Experience (unconventionalism/interest in novelty), and Honesty-Humility (fairness/sincerity; Ashton & Lee, 2007; Sibley et al., 2011).
The literature is fairly extensive on which traits predict being liberal or conservative, with Openness to Experience often being the best
predictor of political preference: conservatives are said to be more resistant to new experiences and change, whereas liberals celebrate novel experiences (Sibley, Osborne, & Duckitt, 2012). Another common predictor of conservatism is high Conscientiousness, which manifests itself in a need for order, traditionalism, and discipline (Sibley, Osborne, & Duckitt, 2012). Some evidence also suggests that liberals tend to be higher on Agreeableness (Osborne, Wootton, & Sibley, 2013). The recent theoretical addition of Honesty-Humility has been found to predict support for left-wing parties (Chirumbolo & Leone, 2010). Research on the other two traits tends to be mixed, with Extraversion and Neuroticism being found to weakly (and inconsistently) correlate with both sides (e.g., Barbaranelli, Caprara, Vecchione, & Fraley, 2007; Carney et al., 2008).
Overview and Guiding Hypotheses
This paper used an LPA of political support to create a model of LVBs in NZ, using data from the first wave (2009) of the New Zealand Attitudes and Values Study (NZAVS). Following our LPA, we compared the LVBs on key demographic and psychological variables specifically focussing on the Fence-Sitters. We also compared the proportion of Fence-Sitters for each of NZ’s general electorates with data on the rates of voter turnout for the 2011 election.
We expected that several distinct LVBs would emerge: there would be at least one bloc that primarily supported Labour and one which primarily supported National. A Fence-Sitting bloc was also expected to emerge (with a neutral level of support for all of the parties). However, it was possible that smaller blocs would appear that could not be predicted a priori because there have been no previous LPAs of political support, the exact number and nature of the LVBs that would appear was unclear. We extended this analysis to also examine differences in the demographic and psychological composition of the different LVBs. We assessed how the people classified as belonging to the different LVBs differed in terms of gender, age, deprivation,
education, employment, ethnicity, political ideology, and personality.
We hypothesised that the Fence-Sitters and the political left would be more economically-deprived (Dimock, Clark, & Menasce Horowitz, 2008). However, some research suggests that the political left may be more educated, leading us to hypothesise that any left-wing blocs would be more educated (Carney et al., 2008). Women were hypothesised to be more supportive of the political left than men as research suggests that women are more likely to support the liberal Green and Labour parties (Aimer, 1993; Levine & Roberts, 2008; Greaves et al., 2015; Mulgan, 1997). We expected that the political left would have higher proportions of minority ethnic groups as Māori and those of Pacific descent have traditionally supported Labour (Miller, 2010; Mulgan, 1997). We predicted that members of any blocs supporting the political left would be liberal and the right would be conservative, with Fence-Sitters being ideologically moderate. In terms of personality, the political right was hypothesised to be slightly less extraverted, more Conscientious and less Open to Experience (Sibley et al., 2011). No research has been conducted on the personality traits of Fence-Sitters, so it was unknown how and whether the Fence-Sitters would significantly differ from other LVBs.
We tested the model by mapping the geographic distribution of LVBs and assessing whether differences in the proportion of the Fence-Sitter LVB reliably predicted voter turnout across both Māori and general electorates based on archival data from the 2011 national NZ election. We expected that those electorates with lower turnout rates would have a higher proportion of Fence-Sitters, as research shows that less partisan voters are less motivated to vote (Feddersen & Pesendorfer, 1996).
Method
Sampling ProcedureWe analysed data from the New
Zealand Attitudes and Values Study 2009 (NZAVS-09). The NZAVS-09 contained responses from 6,518 participants sampled from the 2009 electoral roll.
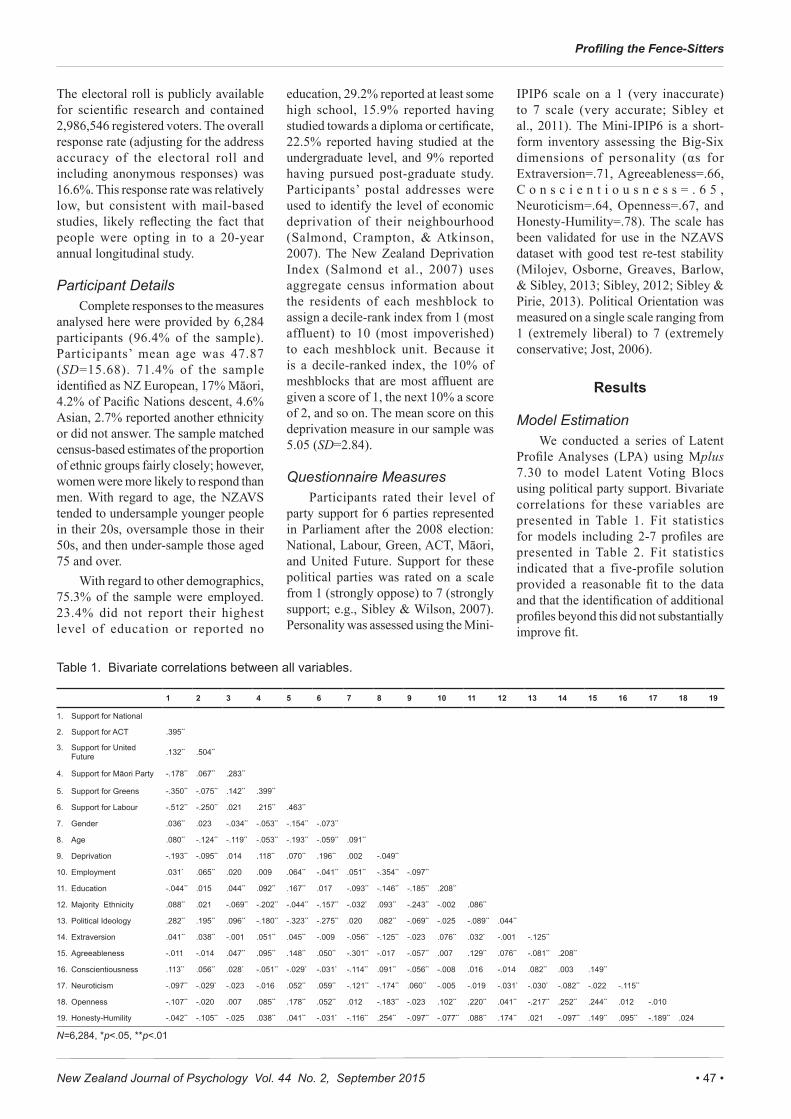
• 47 •New Zealand Journal of Psychology Vol. 44 No. 2, September 2015
Profiling the Fence-Sitters
The electoral roll is publicly available for scientific research and contained 2,986,546 registered voters. The overall response rate (adjusting for the address accuracy of the electoral roll and including anonymous responses) was 16.6%. This response rate was relatively low, but consistent with mail-based studies, likely reflecting the fact that people were opting in to a 20-year annual longitudinal study.
Participant DetailsComplete responses to the measures
analysed here were provided by 6,284 participants (96.4% of the sample). Participants’ mean age was 47.87 (SD=15.68). 71.4% of the sample identified as NZ European, 17% Māori, 4.2% of Pacific Nations descent, 4.6% Asian, 2.7% reported another ethnicity or did not answer. The sample matched census-based estimates of the proportion of ethnic groups fairly closely; however, women were more likely to respond than men. With regard to age, the NZAVS tended to undersample younger people in their 20s, oversample those in their 50s, and then under-sample those aged 75 and over.
With regard to other demographics, 75.3% of the sample were employed. 23.4% did not report their highest level of education or reported no
education, 29.2% reported at least some high school, 15.9% reported having studied towards a diploma or certificate, 22.5% reported having studied at the undergraduate level, and 9% reported having pursued post-graduate study. Participants’ postal addresses were used to identify the level of economic deprivation of their neighbourhood (Salmond, Crampton, & Atkinson, 2007). The New Zealand Deprivation Index (Salmond et al., 2007) uses aggregate census information about the residents of each meshblock to assign a decile-rank index from 1 (most affluent) to 10 (most impoverished) to each meshblock unit. Because it is a decile-ranked index, the 10% of meshblocks that are most affluent are given a score of 1, the next 10% a score of 2, and so on. The mean score on this deprivation measure in our sample was 5.05 (SD=2.84).
Questionnaire MeasuresParticipants rated their level of
party support for 6 parties represented in Parliament after the 2008 election: National, Labour, Green, ACT, Māori, and United Future. Support for these political parties was rated on a scale from 1 (strongly oppose) to 7 (strongly support; e.g., Sibley & Wilson, 2007). Personality was assessed using the Mini-
IPIP6 scale on a 1 (very inaccurate) to 7 scale (very accurate; Sibley et al., 2011). The Mini-IPIP6 is a short-form inventory assessing the Big-Six dimensions of personality (αs for Extraversion=.71, Agreeableness=.66, C o n s c i e n t i o u s n e s s = . 6 5 , Neuroticism=.64, Openness=.67, and Honesty-Humility=.78). The scale has been validated for use in the NZAVS dataset with good test re-test stability (Milojev, Osborne, Greaves, Barlow, & Sibley, 2013; Sibley, 2012; Sibley & Pirie, 2013). Political Orientation was measured on a single scale ranging from 1 (extremely liberal) to 7 (extremely conservative; Jost, 2006).
Results
Model EstimationWe conducted a series of Latent
Profile Analyses (LPA) using Mplus 7.30 to model Latent Voting Blocs using political party support. Bivariate correlations for these variables are presented in Table 1. Fit statistics for models including 2-7 profiles are presented in Table 2. Fit statistics indicated that a five-profile solution provided a reasonable fit to the data and that the identification of additional profiles beyond this did not substantially improve fit.
Table 1. Bivariate correlations between all variables.
1 2 3 4 5 6 7 8 9 10 11 12 13 14 15 16 17 18 19
1. Support for National
2. Support for ACT .395**
3. Support for United Future .132** .504**
4. Support for Māori Party -.178** .067** .283**
5. Support for Greens -.350** -.075** .142** .399**
6. Support for Labour -.512** -.250** .021 .215** .463**
7. Gender .036** .023 -.034** -.053** -.154** -.073**
8. Age .080** -.124** -.119** -.053** -.193** -.059** .091**
9. Deprivation -.193** -.095** .014 .118** .070** .196** .002 -.049**
10. Employment .031* .065** .020 .009 .064** -.041** .051** -.354** -.097**
11. Education -.044** .015 .044** .092** .167** .017 -.093** -.146** -.185** .208**
12. Majority Ethnicity .088** .021 -.069** -.202** -.044** -.157** -.032* .093** -.243** -.002 .086**
13. Political Ideology .282** .195** .096** -.180** -.323** -.275** .020 .082** -.069** -.025 -.089** .044**
14. Extraversion .041** .038** -.001 .051** .045** -.009 -.056** -.125** -.023 .076** .032* -.001 -.125**
15. Agreeableness -.011 -.014 .047** .095** .148** .050** -.301** -.017 -.057** .007 .129** .076** -.081** .208**
16. Conscientiousness .113** .056** .028* -.051** -.029* -.031* -.114** .091** -.056** -.008 .016 -.014 .082** .003 .149**
17. Neuroticism -.097** -.029* -.023 -.016 .052** .059** -.121** -.174** .060** -.005 -.019 -.031* -.030* -.082** -.022 -.115**
18. Openness -.107** -.020 .007 .085** .178** .052** .012 -.183** -.023 .102** .220** .041** -.217** .252** .244** .012 -.010
19. Honesty-Humility -.042** -.105** -.025 .038** .041** -.031* -.116** .254** -.097** -.077** .088** .174** .021 -.097** .149** .095** -.189** .024
N=6,284, *p<.05, **p<.01

New Zealand Journal of Psychology Vol. 44 No. 2, September 2015• 48 •
L. M. Greaves, D. Osborne, C. G. Sibley
We settled on a five-profile solution based on analysis of change in the various fit statistics, as well as interpretability (more profiles split ratings at points evenly along the distribution of all item ratings). The Bayesian Information Criterion (BIC), and the Akaike Information Criterion (AIC) statistics indicated that increase in model fit plateaued once five profiles were specified. The BIC, AIC, and the entropy for different model specifications are presented in Table 2. Entropy values range from 0 to 1.0, where a high value indicates a lower classification error and hence a better fitting model. An entropy value of closer to 1.0 indicates that there is a clear separation of classes, or in other words, that the model clearly separates the data into distinct profiles. So-called rules-of-thumb for what constitutes an acceptable entropy value tends to recommend values around or above .80 (Collins & Lanza, 2009). The entropy for our five-profile model approached this value and was .78, this indicating that our model performed fairly well in identifying profiles with a high likelihood of being distinct. The probability (averaged across participants) that a participant belonged to a given profile ranged from .80 to .89, indicating only a small average likelihood of misclassification.
Latent Voting BlocsMeans for the levels of support
for each party over the five identified LVBs are presented in Figure 1. The variable-specific entropy of support for each party is also reported in parentheses on the x-axis of Figure 1. These values provide an indicator of how informative each indicator (scale score) was for differentiating profiles (Asparouhov & Muthén, 2014). As reported, most of the party support items provided reasonably
equal contributions to the model, with the exception of support for the ACT party which provided more information that differentiated between profiles (in other words, the different profiles differed to a higher extent on this item, perhaps indicating polarised opinions on ACT).
Here, we define support as a score of around 5 or above, neutrality as between approximately a 3 and 5, and a low level of support as a score of 3 or below. Two blocs emerged on the
right of the political spectrum. One we labelled Right-Wing Supporters (12.5% of the sample). Participants in this LVB displayed a high level of support for both the National Party (M=6.01) and some support for its ally
ACT (M=4.90) but had a neutral level of support toward other parties. The other bloc on the political right, labelled National Party Supporters (24.3% of the sample), showed a high level of support National (M=5.49), but did not support ACT (M=1.80).
Two blocs also emerged on the political left. One bloc was labelled Left-Wing Supporters (16.4% of the sample) as they showed a high level of support for Labour (M=5.38), The Greens (M=5.41) and some support for The Māori Party (M=4.79), but low levels of support for the right-wing parties. The second LVB was called Labour Supporters (14% of the sample) as they expressed high levels of support for Labour (M=5.40) but less so the Greens (M=3.67). We also reliably detected the hypothesized Fence-Sitter profile, which constituted 32.8% of the sample. Members of the Fence-Sitter profile expressed moderate levels of support for all six parties (Mrange=3.65 to 4.72).
Demographic and Psychological Differences
After identifying an acceptable model, the extent to which the LVBs differed across demographics, ideology and personality was examined. This
Figure 1. Levels of mean political support for each party over LVBs. (Variable-specific entropy reported in parentheses for each indicator on the x-axis).
Table 1. Model fit for the different profile solutions of the LPA.
Profile Solution BIC AIC entropyTwo 134887.041 134758.872 .662Three 131834.427 131659.038 .774Four 130038.433 129815.823 .799Five 129324.624 129054.794 .782Six 128952.589 128635.538 .782Seven 128405.630 128041.359 .809
Note: BIC = Bayesian Information Criterion; AIC = Akaike Information Criterion.
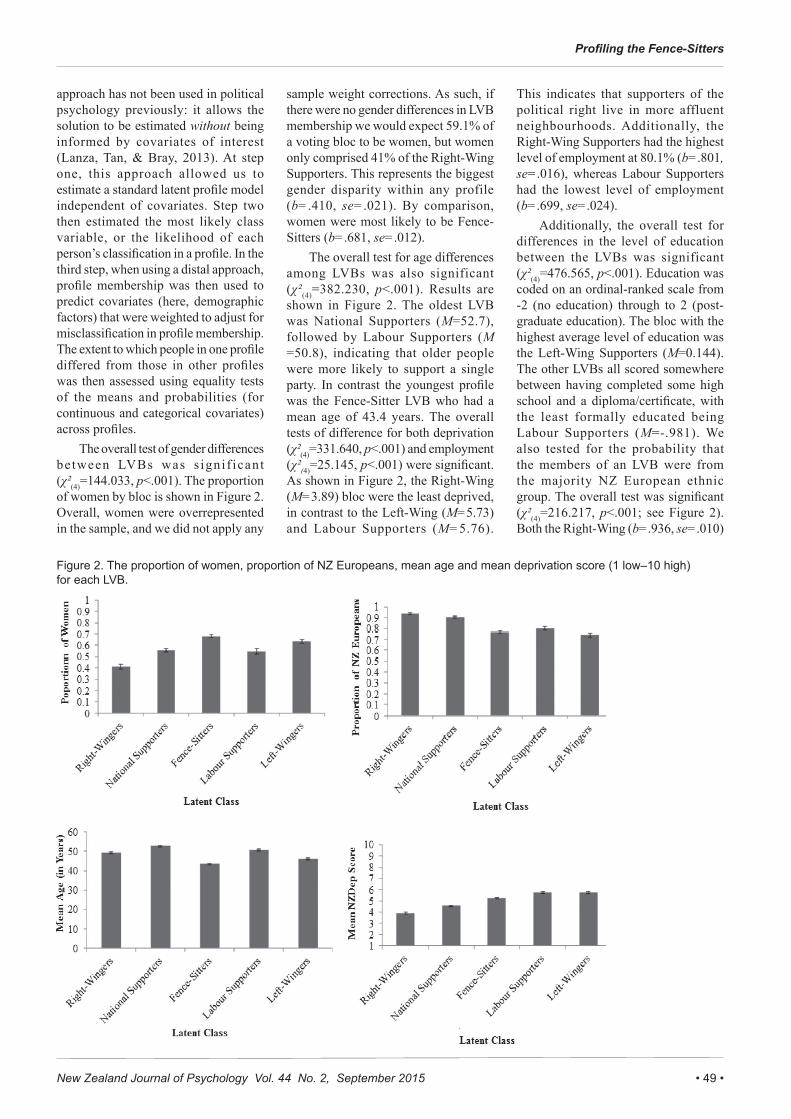
• 49 •New Zealand Journal of Psychology Vol. 44 No. 2, September 2015
Profiling the Fence-Sitters
approach has not been used in political psychology previously: it allows the solution to be estimated without being informed by covariates of interest (Lanza, Tan, & Bray, 2013). At step one, this approach allowed us to estimate a standard latent profile model independent of covariates. Step two then estimated the most likely class variable, or the likelihood of each person’s classification in a profile. In the third step, when using a distal approach, profile membership was then used to predict covariates (here, demographic factors) that were weighted to adjust for misclassification in profile membership. The extent to which people in one profile differed from those in other profiles was then assessed using equality tests of the means and probabilities (for continuous and categorical covariates) across profiles.
The overall test of gender differences between LVBs was s ignif icant (χ²(4)=144.033, p<.001). The proportion of women by bloc is shown in Figure 2. Overall, women were overrepresented in the sample, and we did not apply any
sample weight corrections. As such, if there were no gender differences in LVB membership we would expect 59.1% of a voting bloc to be women, but women only comprised 41% of the Right-Wing Supporters. This represents the biggest gender disparity within any profile (b=.410, se=.021). By comparison, women were most likely to be Fence-Sitters (b=.681, se=.012).
The overall test for age differences among LVBs was also significant (χ²(4)=382.230, p<.001). Results are shown in Figure 2. The oldest LVB was National Supporters (M=52.7), followed by Labour Supporters (M =50.8), indicating that older people were more likely to support a single party. In contrast the youngest profile was the Fence-Sitter LVB who had a mean age of 43.4 years. The overall tests of difference for both deprivation (χ²(4)=331.640, p<.001) and employment (χ²(4)=25.145, p<.001) were significant. As shown in Figure 2, the Right-Wing (M=3.89) bloc were the least deprived, in contrast to the Left-Wing (M=5.73) and Labour Supporters (M=5.76).
This indicates that supporters of the political right live in more affluent neighbourhoods. Additionally, the Right-Wing Supporters had the highest level of employment at 80.1% (b=.801, se=.016), whereas Labour Supporters had the lowest level of employment (b=.699, se=.024).
Additionally, the overall test for differences in the level of education between the LVBs was significant (χ²(4)=476.565, p<.001). Education was coded on an ordinal-ranked scale from -2 (no education) through to 2 (post-graduate education). The bloc with the highest average level of education was the Left-Wing Supporters (M=0.144). The other LVBs all scored somewhere between having completed some high school and a diploma/certificate, with the least formally educated being Labour Supporters (M=-.981). We also tested for the probability that the members of an LVB were from the majority NZ European ethnic group. The overall test was significant (χ²(4)=216.217, p<.001; see Figure 2). Both the Right-Wing (b=.936, se=.010)
Figure 2. The proportion of women, proportion of NZ Europeans, mean age and mean deprivation score (1 low–10 high) for each LVB.
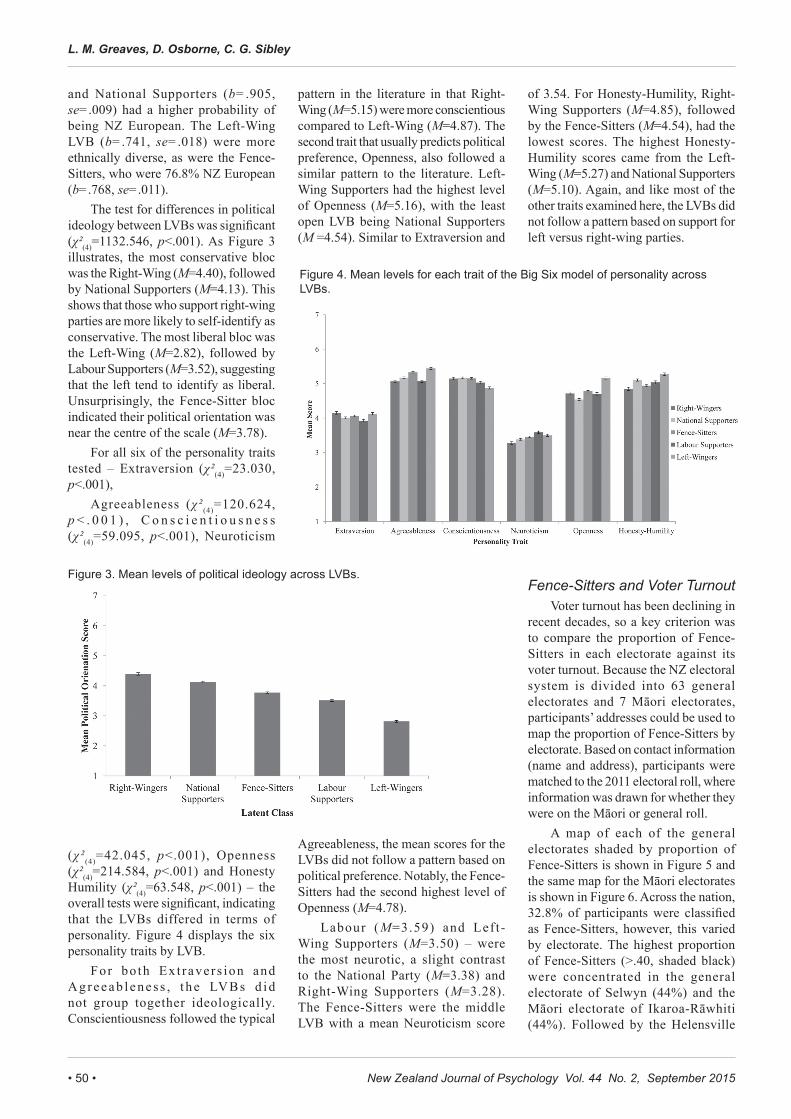
New Zealand Journal of Psychology Vol. 44 No. 2, September 2015• 50 •
L. M. Greaves, D. Osborne, C. G. Sibley
and National Supporters (b=.905, se=.009) had a higher probability of being NZ European. The Left-Wing LVB (b=.741, se=.018) were more ethnically diverse, as were the Fence-Sitters, who were 76.8% NZ European (b=.768, se=.011).
The test for differences in political ideology between LVBs was significant (χ²(4)=1132.546, p<.001). As Figure 3 illustrates, the most conservative bloc was the Right-Wing (M=4.40), followed by National Supporters (M=4.13). This shows that those who support right-wing parties are more likely to self-identify as conservative. The most liberal bloc was the Left-Wing (M=2.82), followed by Labour Supporters (M=3.52), suggesting that the left tend to identify as liberal. Unsurprisingly, the Fence-Sitter bloc indicated their political orientation was near the centre of the scale (M=3.78).
For all six of the personality traits tested – Extraversion (χ²(4)=23.030, p<.001),
Agreeableness (χ² (4)=120.624, p < . 0 0 1 ) , C o n s c i e n t i o u s n e s s (χ²(4)=59.095, p<.001), Neuroticism
(χ² (4)=42.045, p<.001), Openness (χ²(4)=214.584, p<.001) and Honesty Humility (χ²(4)=63.548, p<.001) – the overall tests were significant, indicating that the LVBs differed in terms of personality. Figure 4 displays the six personality traits by LVB.
For bo th Ext ravers ion and Agreeab l enes s , t he LVBs d id not group together ideologically. Conscientiousness followed the typical
pattern in the literature in that Right-Wing (M=5.15) were more conscientious compared to Left-Wing (M=4.87). The second trait that usually predicts political preference, Openness, also followed a similar pattern to the literature. Left-Wing Supporters had the highest level of Openness (M=5.16), with the least open LVB being National Supporters (M =4.54). Similar to Extraversion and
Agreeableness, the mean scores for the LVBs did not follow a pattern based on political preference. Notably, the Fence-Sitters had the second highest level of Openness (M=4.78).
Labour (M=3.59) and Left-Wing Supporters (M=3.50) – were the most neurotic, a slight contrast to the National Party (M=3.38) and Right-Wing Supporters (M=3.28). The Fence-Sitters were the middle LVB with a mean Neuroticism score
of 3.54. For Honesty-Humility, Right-Wing Supporters (M=4.85), followed by the Fence-Sitters (M=4.54), had the lowest scores. The highest Honesty-Humility scores came from the Left-Wing (M=5.27) and National Supporters (M=5.10). Again, and like most of the other traits examined here, the LVBs did not follow a pattern based on support for left versus right-wing parties.
Fence-Sitters and Voter TurnoutVoter turnout has been declining in
recent decades, so a key criterion was to compare the proportion of Fence-Sitters in each electorate against its voter turnout. Because the NZ electoral system is divided into 63 general electorates and 7 Māori electorates, participants’ addresses could be used to map the proportion of Fence-Sitters by electorate. Based on contact information (name and address), participants were matched to the 2011 electoral roll, where information was drawn for whether they were on the Māori or general roll.
A map of each of the general electorates shaded by proportion of Fence-Sitters is shown in Figure 5 and the same map for the Māori electorates is shown in Figure 6. Across the nation, 32.8% of participants were classified as Fence-Sitters, however, this varied by electorate. The highest proportion of Fence-Sitters (>.40, shaded black) were concentrated in the general electorate of Selwyn (44%) and the Māori electorate of Ikaroa-Rāwhiti (44%). Followed by the Helensville
Figure 3. Mean levels of political ideology across LVBs.
Figure 4. Mean levels for each trait of the Big Six model of personality across LVBs.

• 51 •New Zealand Journal of Psychology Vol. 44 No. 2, September 2015
Profiling the Fence-Sitters
(43%), Taupo (42%), Northcote (40%) and Botany (40%) general electorates. The general electorates with the smallest proportions (<.25, shaded white) of Fence-Sitters were Auckland Central (22%) and Mount Albert (22%). For the Māori electorates, Hauraki-Waikato had the lowest proportion of Fence-Sitters at 29%. Generally, the electorates with the highest and lowest proportion of Fence-Sitters did not geographically cluster.
To test the utility of the LPA in predicting voter turnout, we tested if the proportion of the Fence-Sitting LVB predicted voter turnout across
the electorates. The proportion of Fence-Sitters in each electorate was significantly, negatively correlated with voter turnout in an electorate (r=-.255, p=.033). We also ran an alternative version of the model with sample weighted correction for the gender bias. Results were comparable, for example the correlation between proportion of Fence-Sitters and voter turnout shifted to r=-.237, p=.030. A simple linear regression showed that the proportion of Fence-Sitters in an electorate explained 6.6% of the variance (p=.032) in that electorate’s voter turnout. Figure 7 shows the scatterplot and slope for proportion voter turnout by the proportion of Fence-Sitters. This confirmed that the proportion of Fence-Sitters in an electorate predicts voter turnout, and that LVBs derived from the LPA have utility in predicting voting behaviour.
DiscussionWe introduced and modelled
Latent Voting Blocs (LVBs) in a large national sample of registered NZ voters. LVBs refer to the underlying types of people who express different combinations of support for multiple political parties; be it high support for one party, some combination of support and opposition, or moderate levels of support for multiple parties. Five LVBs emerged and, as hypothesised, one was a Fence-Sitting LVB that rated all parties neutrally. This profile made up 32.8% of the sample, and when compared with other blocs, tended to be female, younger, non-NZ European, and ideologically centrist. Mapping LVB across electorates, we show that the proportion of Fence-Sitters in an electorate predicts the extent to which the population of a given electorate will vote. The proportion of Fence-Sitters in each region was negatively correlated with voter turnout and predicted 6.6% of the variance in voter turnout. Showing that a politically Fence-Sitting LVB constitutes a sizeable minority of the population and that areas with higher proportions of these Fence-Sitters tend to have lower voter turnout.
We identified four other LVBs that cover the range of political support in NZ. Two blocs on the political right emerged—National Party Supporters
and Right-Wing Supporters—and two on the political left—Labour Supporters and Left-Wing Supporters. Surprisingly, four LVBs emerged from the LPA to cover NZs political spectrum. This suggests that a simple left-right dimension may not be useful in categorising party support across multi-party systems. Moreover, differences in demographic and psychological variables across these profiles show that LVBs are comprised of different types of people, even though they are typically lumped together as ‘The Left’ or ‘The Right’.
Differences between Types of Voters
The profiles differed on key variables, suggesting that LVB members ‘look’ different, in terms of certain demographics, ideology and personality, across blocs. These differences occurred even between the two LVBs that would typically be combined as ‘The Left’ and between the two typically called ‘The Right.’ Although Left-Wing Supporters had a relatively high proportion of women and Right-Wing Supporters had the lowest, the Labour and National Supporter LVBs were comprised of a comparable proportion of women. Contrary to previous research (Dimock, Clark, & Menasce Horowitz, 2008), Fence-Sitters were more affluent than the political left. There were significant effects for both employment and deprivation, showing that National and Right-Wing Supporters were more likely to be employed and live in affluent neighbourhoods. Left-Wing Supporters were the most educated, although, Labour Supporters were the least educated.
Fence-Sitters were the youngest, suggesting these voters have either not had enough time to explore their political options, or are less invested in politics (e.g., Glenn & Grimes, 1968). The blocs with the oldest mean age were those that supported one party (Labour and National Supporter LVBs). Such a finding is consistent with the Impressionable Years Hypothesis which suggests that older people take longer than the young to adjust to political change (Osborne, Sears, & Valentino, 2011). The members of these older profiles came of age at a
Figure 5. Map showing the proportion of the Fence-Sitters across the 63 general electorates.
Figure 6. Map showing the proportion of the Fence-Sitters across the 7 Mäori electorates.

New
Zealand Journal of Psychology Vol. 44 N
o. 2, Septem
ber 2015• 52 •
L. M. G
reaves, D. O
sborne, C. G
. Sibley
Figure 7. Proportion voter turnout for the 2011 election for each electorate by the proportion of Fence-S
itters (Note that the
seven most extrem
e outliers were the seven M
aori electorates; estimation of the m
odel without these electorates slightly
improved the m
odel R2).

• 53 •New Zealand Journal of Psychology Vol. 44 No. 2, September 2015
time when NZ had a FPP system and only a limited number of parties could survive. Therefore, most of these older voters were either National or Labour supporters. As such, older voters may still think in terms of National versus Labour and ignore the array of minor parties.
Another difference between Fence-Sitters and other LVBs was that they had the lowest proportion of the majority NZ Europeans. It was hypothesised that those from the majority NZ European group would have higher rates of support for right-wing parties. This hypothesis was supported; the Right-Wing and National Supporters had the highest proportions of NZ Europeans. This suggests that NZ Europeans have a tendency to support National, whereas some also support ACT. However, our analyses grouped all participants who did not identify as NZ European into a single ‘minority’ group. This group is far from homogeneous and warrants further study particularly as the demographics of NZ continue to diversify.
As expected, the right-of-centre LVBs (Right-Wing and National Supporters) were more conservative, whereas the left-of-centre LVBs (Left-Wing and Labour Supporters) were more liberal. Also as predicted, Fence-Sitters were in the middle of the spectrum. This supports previous research showing that Fence-Sitters are ideologically moderate and provides further evidence of the utility of a simple liberal-conservative dimension for measuring simply ideology, even in multi-party systems (Jost, 2006). However, a limitation of this research is that although we label LVBs as “Left” or “Right” wing these labels are theoretical and independent of any measure of left to right ideology. Unfortunately, we did not have the data to explore how the LVBs varied across ideology on a left-to-right continuum. Research suggests that left/right alone or in combination with liberal/conservative may be a more relevant measure for the New Zealand’s complex, multi-party context as liberal/conservative could be taken to refer to one’s views on social issues, whereas left/right may refer to economic issues (Perry & Sibley, 2013; Wilson, 2004; Sibley & Wilson, 2007). Where, for example, the Right-Wing LVB (a
multiple party supporting LVB) versus the solely-National Supporting LVB might sit on a left to right continuum, i.e., who is ‘further to the right’ on this measure of ideology, remains to be seen.
Previous research has shown that the political right (versus left) are more Conscientious, Open to Experience, and to a lesser extent, more Extraverted (Sibley, Osborne, & Duckitt, 2012). Indeed, the blocs were different in terms of personality; however, these differences did not follow a simple left-to-right pattern. Whereas Right-Wing Supporters were the highest on Extraversion, Left-Wing Supporters were second highest, contrary to expectations. Similar results emerged for Openness, as Left-Wing Supporters were highest in Openness, followed by Fence-Sitters and Right-Wing Supporters. Our findings for Conscientiousness followed the standard trend in the literature of conservatives (National and Right-Wing Supporters) being higher on Conscientiousness than liberals (Labour and Left-Wing Supporters). Interestingly, differences in Neuroticism also emerged such that the LVBs of the political right were less neurotic than the left. It should be noted, however, that these were relatively small differences. An explanation could be that the emotional stability associated with low Neuroticism corresponds with conservatives’ preference for stability (Carney et al., 2008). This study also provided the first examination of the personality profiles of political Fence-Sitters. Fence-Sitters were not the highest or lowest LVB on any of the Big-Six traits. This suggests that Fence-Sitters do not have any particular traits which set them apart from committed partisans.
Fence-Sitters and Voter TurnoutIt seems that Fence-Sitters were
less likely to vote in the 2011 election. Although we did not analyse whether each participant in the NZAVS actually voted, the relationship between voter turnout and the proportion of Fence-Sitters in a given electorate suggests that this may be the case. Furthermore, the proportion of the other four LVBs by electorate had no relationship with voter enrolment or turnout. Such a finding demonstrates that profiles
produced from our LPA can predict outcomes like voter turnout. Previous American research has examined the differences between states in aggregated personality traits and voting preferences within a state (Rentfrow, 2010). For example, Rentfrow (2010) has mapped personality traits geographically and found that states with higher proportions of people with high Openness had more votes cast for the Democratic Party in the 2008 election. Here, instead of shading geographic areas by quintile based on a continuous dimension, we have taken a novel approach by dividing the potential voters in an electorate into latent profiles. We then geographically plotted the proportion of Fence-Sitters across each electorate (the only LVB predictive of voter turnout). Unlike research on personality dimensions, we did not find a pattern of geographical clustering for Fence-Sitters across electorates. Future research should examine the stability of profile membership over multiple political events to see if a region retains similar levels of Fence-Sitters over time or if this proportion changes based on the local relevance of policy issues.
Some readers may be wondering if the Fence-Sitter profile merely represents a methodological artifact of participants with a tendency to circle ‘neutral’ on our questionnaire. This is highly unlikely because firstly, the proportion of Fence-Sitters was predictive of voter turnout in our analysis of variation across electorates. This suggests that participants’ responses reflect meaningful variation rather than a methodological artifact. Secondly, if our Fence-Sitter LVB merely identified participants with a tendency to circle ‘neutral’, then this response tendency would be expected to also emerge across other scales. This was clearly not the case, as the Fence-Sitters diverged markedly from ‘neutral’ on dimensions of personality. For example, Fence-Sitters had a mean Neuroticism score of 3.5, but a mean Agreeableness score of 5.3.
Future ResearchAlthough we have emphasised
throughout this paper the usefulness of LPA in a multi-party system, this technique may also be useful in other electoral systems. For example, in a two-
New Zealand Journal of Psychology Vol. 44 No. 2, September 2015• 54 •
L. M. Greaves, D. Osborne, C. G. Sibley
party context like the US, there would undoubtedly be strongly partisan profiles as we found here. However, there could be blocs that weakly support or oppose both parties or are decidedly neutral across parties (Fence-Sitters). LPA could help uncover LVBs of political support across many different contexts and party systems. While Weber and Federico (2013) have looked at similar issues using LPA, this research could be extended by looking at classes of LVBs over support for the ratings of both the Republican and Democratic parties beyond a single dimension. Although it is likely that a two-party system would not have the same complexity in patterns of support as a multi-party system, it would nevertheless be useful to identify Fence-Sitters and examine their characteristics. Likewise, examining potential differences in voter turnout across geographical areas would provide important information for Get-Out-The-Vote campaigns.
The data reported here were collected as part of an ongoing longitudinal study, as such, one area of interest we wish to explore in the future is how LVB membership may change over time. Namely, how the Fence-Sitter profile may change across time and elections. The way to model this longitudinally is though a statistical method called Latent Transition Analysis (LTA). LTA is the longitudinal extension of Latent Profile Analysis. Rather than looking at a profile at one period, LTA looks at ‘latent statuses’ across these times points (Collins & Lanza, 2009). Researchers estimate latent status membership probabilities at each time point – or the proportion of individuals in each profile at each time point. Then one estimates the transition probability, or the probability of moving from one latent status to another at the next time point. Demographic and other variables can be used via logistic regression to predict not only the latent status probability at a given time point, but also the transition probability (Lanza, Patrick, & Maggs, 2010). Meaning that researchers can see which variables predict participants moving from one profile to another over time. Looking at Fence-Sitters using LTA would mean we could see not only if the size of the profile changes with the political
climate, but also what predicts people moving into or out of the profile. For example, we could see if younger people move out of this profile when they age, or if this is a cohort effect. Basically, it would allow us to see which variables predict the Fence-Sitters becoming more partisan.
Concluding Comments Fence-Sit ters have been
given a wide variety of labels—from undecideds to floating voters—and these single labels have referred to a wide variety of groups (e.g., swing-voters, the politically-apathetic, etc.). Our analysis shows that Fence-Sitters reflect a voting bloc that rated all political parties neutrally and constitute roughly a third (32.8%) of the NZ population. Fence-Sitters tended to be ideological centrists, women, ethnic minorities, and were younger than the other LVBs. The proportion of this group living in an electorate also negatively predicted voter turnout. LPA allowed us to advance a new method for uncovering types of voters, which is especially important in multi-party systems such as NZ. That said, we encourage the use of LPA in any system with two or more parties. Utilising LPA and the three-step distal approach allowed us to not only identify the Fence-Sitters, but to answer contentious questions about the variables that predict political apathy and, ultimately, voter turnout.
ReferencesAimer, P. (1993). Was there a gender gap
in New Zealand in 1990? In H. Catt & E. McLeay (Eds.), Women and Politics in New Zealand. Wellington: Victoria University Press.
Ashton, M. C., & Lee, K. (2007). Empirical, theoretical, and practical advantages of the HEXACO model of personality structure. Personality and Social Psychology Review, 11(2), 150-166.
Asparouhov, T., & Muthén, B. (2014). Variable-specific entropy contribution. Retrieved from http://www.statmodel.com/download/UnivariateEntropy.pdf
Barbaranelli, C., Caprara, G. V., Vecchione, M., & Fraley, C. R. (2007). Voters’ personality traits in presidential elections. Personality and Individual Differences, 42(7), 1199-1208.
Battaglini, M., Morton, R. B., & Palfrey, T. R. (2010). The swing voter’s curse in the laboratory. The Review of Economic Studies, 77(1), 61-89.
Blais, A., & Achen, C. H. (2010). Taking civic duty seriously: Political theory and voter turnout. Unpublished Manuscript: Princeton, NJ.
Breen, R. (2000). Why is support for extreme parties underestimated by surveys? A latent class analysis. British Journal of Political Science, 30(2), 375-382.
Campbell, A., Converse, P. E., Miller, W. E., & Stokes, D. E. (1960). The American voter. New York: Wiley & Sons.
Caprara, G. V., Schwartz, S., Capanna, C., Vecchione, M., & Barbaranelli, C. (2006). Personality and politics: Values, traits, and political choice. Political Psychology, 27(1), 1-28.
Carney, D. R., Jost, J. T., Gosling, S. D., & Potter, J. (2008). The secret lives of liberals and conservatives: Personality profiles, interaction styles, and the things they leave behind. Political Psychology, 29(6), 807-840.
Chirumbolo, A., & Leone, L. (2010). Personality and politics: The role of the HEXACO model of personality in predicting ideology and voting. Personality and Individual Differences, 49(1), 43-48.
Clarke, H. D., & McCutcheon, A. L. (2009). The dynamics of party identification reconsidered. Public Opinion Quarterly, 73(4), 704-728.
Collins, L. M., & Lanza, S. T. (2009). Latent class and latent transition analysis: with applications in the social, behavioral, and health sciences. Hoboken, NJ: Wiley.
Dalton, P. D. (2006). Swing voting: Understanding late deciders in late modernity. Cresskill, NJ: Hampton Press Inc.
Dimock, M., Clark, A., & Menasce Horowitz, J. (2008). Campaign dynamics and the swing vote in the 2004 election. In W. G. Mayer (Ed.), The Swing Voter in American Politics. Washington, D.C.: Brookings Institution Press.
Downs, A. (1957). An economic theory of democracy. New York: Harper Collins.
Dubin, J. A., & Gerber, E. R. (1992). Patterns of voting on ballot propositions: A mixture model of voter types. California Institute of Technology, Working Paper No. 795.
Feddersen, T. J., & Pesendorfer, W. (1996). The swing voter’s curse. The American Economic Review, 86(3), 408-424.
Feldman, S., & Johnston, C. (2009). Understanding political ideology:

• 55 •New Zealand Journal of Psychology Vol. 44 No. 2, September 2015
Profiling the Fence-Sitters
the necessity of a multi-dimensional conceptualization. Paper presented at the APSA conference, Toronto.
Gerber, A. S., & Green, D. P. (2000). The effects of canvassing, telephone calls, and direct mail on voter turnout: A field experiment. American Political Science Review, 94(3), 653-663.
Gerber, A. S., Huber, G. A., Doherty, D., & Dowling, C. M. (2011). The big five personality traits in the political arena. Annual Review of Political Science, 14, 265-287.
Glenn, N. D., & Grimes, M. (1968). Aging, voting, and political interest. American Sociological Review, 33(4), 563-575.
Gomez, B. T., Hansford, T. G., & Krause, G. A. (2007). The Republicans should pray for rain: Weather, turnout, and voting in US presidential elections. Journal of Politics, 69(3), 649-663.
Gormley, I. C., & Murphy, T. B. (2005). Exploring heterogeneity in irish voting data: A mixture modelling approach [Technical Report 05/09]. Department of Statistics, Trinity College Dublin.
Gormley, I. C., & Murphy, T. B. (2008). Mixture of experts modelling with social science applications. Journal of Computational and Graphical Statistics, 19(2), 332-353.
Greaves, L. M., Cowie, L., Fraser, G., Muriwai, E., Huang, Y., Milojev, P., Osborne, D., Sibley, C. G., Zdrenka, M., Bulbulia, J., Wilson, M. S., Liu, J. H., & Clouston, A. (2015). Regional differences and similarities in the personality of New Zealanders. New Zealand Journal of Psychology, 44, 4-16.
Greaves, L. M., Osborne, D., Sengupta, N. K., Milojev, P., & Sibley, C. G. (2014). Politics and post-colonial ideology: Historical Negation and Symbolic Exclusion predict political party preference. New Zealand Journal of Psychology, 43, 39-54.
Green, D. P., & Gerber, A. S. (2008). Get out the vote: How to increase voter turnout. 2nd ed. Washington, D.C.: Brookings Institution Press.
Green, D. P., Palmquist, B., & Schickler, E. (2002). Partisan hearts and minds. New Haven, CT: Yale University Press.
Hagenaars, J. A., & McCutcheon, A. L. (2002). Applied Latent Class Analysis. UK: Cambridge University Press.
Hansford, T. G., & Gomez, B. T. (2010). Estimating the electoral effects of voter turnout. American Political Science Review, 104(2), 268-288.
Hartigan, J. A. (2000). Bloc voting in the United States senate. Journal of Classification, 17(1), 29-49.
Jost, J. T. (2006). The end of the end of ideology. American Psychologist, 61(7), 651-570.
Jost, J. T., Federico, C. M., & Napier, J. L. (2009). Political ideology: Its structure, functions, and elective affinities. Annual Review of Psychology, 60, 307-337.
Katz, R. S. (2001). Are cleavages frozen in English-speaking democracies? In L. Karvonen & S. Kuhle (Eds.), Party systems and voter alignments revisited. London: Routledge.
Lanza, S. T., Patrick, M. E., & Maggs, J. L. (2010). Latent transition analysis: Benefits of a latent variable approach to modeling transitions in substance use. Journal of drug issues, 40(1), 93-120.
Lanza, S. T., Tan, X., & Bray, B. C. (2013). Latent class analysis with distal outcomes: A flexible model-based approach. Structural Equation Modelling: A Multidisciplinary Journal, 20(1), 1-26.
Levine, S., & Roberts, N. S. (Eds.). (2008). Key to victory: The New Zealand general election of 2008. Wellington: Victoria University Press.
Mayer, W. G. (Ed.). (2008). The swing voter in American politics. Washington, D.C.: Brookings institution press.
Mayer, W. G. (2007). The swing voter in American presidential elections. American Politics Research, 35(3), 358-388.
McCrae, R. R., & Costa, P. T. (1997). Personality trait structure as a human universal. American Psychologist, 52(5), 509.
Merriam, C. E., & Gosnell, H. F. (1924). Non-voting: Causes and methods of control. University of Chicago Press.
Miller, R. (Ed.). (2010). New Zealand government and politics (5th ed.). Melbourne: Oxford University Press.
Milojev, P., Osborne, D., Greaves, L. M., Barlow, F. K., & Sibley, C. G. (2013). The mini-IPIP6: Tiny yet highly stable markers of big six personality. Journal of Research in Personality, 47(6), 936-944.
Ministry of Social Development. (2010). The Social Report. Wellington: Ministry of Social Development.
Mulgan, R. G. (1997). Politics in New Zealand (2nd ed.). Auckland: Auckland University Press.
Mulgan, R. G., & Aimer, P. (2004). Politics in New Zealand (3rd ed.). Auckland: Auckland University Press.
Nagel, J. H. (1988). Voter turnout in New Zealand general elections, 1928-1988. Political Science, 40(2), 16-38.
New Zealand Electoral Commission. (2011). 2011 general election – Of f ic ia l resu l t . Retr ieved f rom http://www.electionresults.govt.nz/electionresults_2011/
New Zealand Parliament. (2013). Electorate profiles. Retrieved from http://www.parliament.nz/en-nz/mpp/electorates/.
Stewart, J. (Producer), & O’Neil, C. (Director). (2000, Nov. 6). The Daily Show with Jon Stewart. [Television Show]. New York: Comedy Central.
Osborne, D., Sears, D. O., & Valentino, N. A. (2011). The end of the solidly democratic South: The impressionable‐years hypothesis. Political Psychology, 32(1), 81-108.
Osborne, D., & Sibley, C. G. (2012). Does personality matter? Openness correlates with vote choice, but particularly for politically sophisticated voters. Journal of Research in Personality, 46, 743-751.
Osborne, D., *Wootton, L. W., & Sibley, C. G. (2013). Are liberals agreeable or not? politeness and compassion differentially predict political conservatism via distinct ideologies. Social Psychology, 44, 354-360.
Perry, R., & Sibley, C. G. (2013). A Dual-Process Motivational Model of Social and Economic Policy Attitudes. Analyses of Social Issues and Public Policy, 13(1), 262-285.
Pickles, A. P., Bolton, H., Macdonald, H., Bailey, A., Le Couteur, A., Sim, C. H., & Rutter, M. (1995). Latent-class analysis of recurrence risks for complex phenotypes with selection and measurement error: a twin and family history study of autism. American Journal of Human Genetics, 57(3), 717-726.
Rentfrow, P. J. (2010). Statewide differences in personality: toward a psychological geography of the United States. American Psychologist, 65(6), 548-558.
Rentfrow, P. J., Jost, J. T., Gosling, S. D., & Potter, J. (2009). Statewide differences in personality predict voting patterns in 1996–2004 US presidential elections. In J. T. Jost, A. C. Kay, & H. Thorisdottir Social and Psychological Bases of Ideology and System Justification (pp. 314-349). Oxford: Oxford University Press.
Salmond, C. E., Crampton, P., & Atkinson, J. (2007). NZDep2006 index of deprivation. Wellington, New Zealand: Department of Public Health, University of Otago.
Shaw, D. R. (2008). Swing voting and US presidential elections. In W. G. Mayer (Ed.), The Swing Voter in American Politics. Washington, D.C.: Brookings Institution Press.
New Zealand Journal of Psychology Vol. 44 No. 2, September 2015• 56 •
L. M. Greaves, D. Osborne, C. G. Sibley
Sibley, C. G. (2012). The mini-IPIP6: Item response theory analysis of a short measure of the big-six factors of personality in New Zealand. New Zealand Journal of Psychology, 4, 21-31.
Sibley, C. G., & Becker, J. C. (2012). On the nature of sexist ambivalence: Profiling ambivalent and univalent sexists. European Journal of Social Psychology, 42(5), 589-601.
Sibley, C. G., & Liu, J. H. (2013). Relocating attitudes as components of representational profiles: Mapping the epidemiology of bicultural policy attitudes using latent class analysis. European Journal of Social Psychology, 43(2), 160-174.
Sibley, C. G., Luyten, N., Purnomo, M., Mobberley, A., Wootton, L. W., Hammond, M. D., Sengupta, N. K., Perry, R., West-Newman, T., Wilson, M., McLellan, L., Hoverd, W. J., & Robertson, A. (2011). The mini-IPIP6: Validation and extension of a short measure of the big-six factors of personality in New Zealand. New Zealand Journal of Psychology, 4, 142-159.
Sibley, C. G., Osborne, D., & Duckitt, J. (2012). Personality and political orientation: meta-analysis and test of a threat-constraint model. Journal of Research in Personality, 46, 664-677.
Sibley, C. G., & Pirie, D. J. (2013). Personality in New Zealand: Scale norms and demographic differences in the Mini-IPIP6. New Zealand Journal of Psychology, 42, 13-30.
Sibley, C. G., & Wilson, M. S. (2007). Political attitudes and the ideology of equality: Differentiating support for liberal and conservative political parties in New Zealand. New Zealand Journal of Psychology, 36, 72.
Spirling, A., & Quinn, K. (2010). Identifying intraparty voting blocs in the UK House of Commons. Journal of the American Statistical Association, 105(49), 447-457.
Tedin, K. L. (1987). Political ideology and the vote. Research in Micropolitics, 2(1), 63-94.
Verba, S., Nie, N. H., & Kim, J. (1978). Participation and political equality: A seven-nation comparison. Cambridge: Cambridge University Press.
Vermunt, J. K. (2010). Latent class modelling with covariates: Two improved three-step approaches. Political Analysis, 18(4), 450-469.
Visser, M. (1994). The psychology of voting action on the psychological origins of electoral research, 1939-1964. Journal of the History of the Behavioral Sciences, 30(1), 43-52.
Vowles, J. (1993). Gender and electoral behaviour in New Zealand: Findings from the present and the past. Political Science, 45(1), 122-138.
Vowles, J. (2012). Down, Down, Down: Turnout in New Zealand from 1946 to the 2011 Election. Paper presented at the Annual Conference of the New Zealand Political Studies Association, Wellington.
Weber, C. R., & Federico, C. M. (2013). Moral foundations and heterogeneity in ideological preferences. Political Psychology, 34(1), 107-126.
Wilson, M. S. (1999) . The Social Representational Theory of Symbolic Politics (PhD diss.). University of Victoria, Wellington.
Wilson, M. S. (2004). Values and political ideology: Rokeach’s two-value model in a proportional representation environment. New Zealand Journal of Psychology, 33(3), 155-162.
Wilson, M. S., Bulbulia, J., & Sibley, C. G. (2014). Differences and similarities in religious and paranormal beliefs: a typology of distinct faith signatures. Religion, Brain and Behavior, 4, 104-126.
Acknowledgements: This manuscript is based on Lara
Greaves’ honors thesis supervised by Chris Sibley. This research was supported by a Templeton World Charity Foundation Grant (ID: 0077). Lara Greaves was supported by Te Whare Kura special funding during the preparation of this manuscript. The funders had no role in study design, data collection and analysis, decision to publish, or preparation of the manuscript. As per the NZAVS data access statement, a copy of the anonymous data reported in each NZAVS publication is available from CS upon request from appropriately qualified researchers. Such data will be provided with the explicit understanding that it is used solely for the purposes of replicating or otherwise checking the validity of analyses reported in scientific papers analyzing NZAVS data. Mplus syntax for the models reported here is available on the NZAVS website upon acceptance (http://www.psych.auckland.ac.nz/uoa/NZAVS).
Corresponding author:Lara M. GreavesSchool of PsychologyUniversity of AucklandPrivate Bag 92019,Auckland,New Zealand.Email: [email protected]
• 57 •New Zealand Journal of Psychology Vol. 44 No. 2, September 2015
Bullying in New Zealand
Incidence of Bullying and Victimisation among Adolescents in New Zealand
Moja Kljakovic, Caroline Hunt University of Sydney, Australia
Paul E. Jose Victoria University of Wellington, New Zealand
It has been established that bullying and victimisation have negative outcomes for those involved. However, this problem has received little research attention in New Zealand samples, particularly with longitudinal designs. The incidence of four types bullying was assessed in a large adolescent New Zealand sample including; traditional bullying inside the school, bullying outside the school, bullying via text message and bullying via the internet. The same categorisation of victimisation was also assessed. The overall rates of bullying and victimisation appeared elevated relative to international samples but traditional school-based bullying was more frequent than text or internet bullying. No gender differences were found. Differences for ethnic group differences were found only for specific types of bullying, with Māori students reporting more traditional school and text bullying, and more text-based victimisation than other ethnic groups.
Keywords: bullying, victimization, New Zealand, adolescents
Bullying and victimisation are highly prevalent among young people, and both bullies and victims exhibit negative outcomes (Stassen Berger, 2007). Adolescents are greatly involved in bullying and experience particularly adverse outcomes in comparison with children (Kim & Leventhal, 2008; Simon-Davies, 2011). Furthermore bullying phenomena are under-researched in New Zealand samples. This paper aims to describe the nature of bullying and victimisation in a large sample of New Zealand adolescents and compare the findings to results from international samples. Four types of bullying will be assessed: traditional bullying inside the school, traditional bullying outside the school, cyber bullying via text message and cyber bullying via the internet. The same four types of victimisation will also be assessed.
An indication of the world-wide prevalence of bullying and victimisation can be drawn from a number of large community-based studies. For example, Craig et al. (2009) used the Health Behaviour in School-aged Children (HBSC) survey to measure self-reported bullying and victimisation in children
aged 11, 13 and 15 years in 40 countries worldwide (N = 202,056). New Zealand did not take part in this survey. Respondents were asked how often they had bullied others or had been bullied by others in the past two months. Response options included ‘never’, ‘once or twice’, ‘2 or 3 times a month’, ‘about once a week’, or ‘several times a week’. Those who reported being bullied at least ‘2 or 3 times a month’ and did not report bullying others at least ‘2 or 3 times a month’ were considered victims. Those who reported bullying others at least ‘2 or 3 times a month’ and did not report being victimized by others at least ‘2 or 3 times a month’ were considered bullied. If individuals reported being both bullied and victimised ‘2 or 3 times a month’ or more they were classified as bully/victims. Collectively, 10.7 % of the sample reported bullying others, 12.6 % were victims and 3.6 % were bully/victims. The prevalence of being involved in bullying (as a bully, victim or bully/victim) varied greatly between the countries surveyed with estimates ranging from 8.6% to 45.2% in boys, and 4.8% to 35.8% in girls (Craig et al., 2009). The lowest rates of involvement in bullying for both boys and girls were reported from Sweden, and the highest
rates of involvement for both boys and girls were reported from Lithuania (Craig et al., 2009).
Prevalence data based on large samples of school students have reported consistent rates of bullying and victimisation, despite the use of different response options. Nansel, Overpeck, Pilla, Ruan, Simons-Morton & Scheidt (2001) surveyed 11-16 year old students in the US (N=15,686) and found that in the past school term 8.8% of students reporting bullying others at least ‘once a week’, 10.6% reported bullying others ‘sometimes’ and 25% reported bullying others ‘once or twice’. In terms of victimisation, 8.4% of students reported being victimised at least ‘once a week’, 8.5% reported being bullied by others ‘sometimes’ and 24.2% reported being bullied by others ‘once or twice’. Fleming and Jacobsen (2009) used the Global School-based Student Health Survey (GSHS) to explore the prevalence of victimization of 13-15 year olds from 19 low-middle income countries (N=104,614). They found that 34.2% of respondents reported being victimised on at least one day in the past month. Of that group, 55.6% had been victimized 1 or 2 days and 19.7% had been victimised 3–5 days in the past month. Similar results were found in Venezuela with 37.0% of males and 27.0% of female adolescents reported having been the victims of bullying at least once within the past 30 days (Muula, Herring, Siziya & Rudatsikira, 2009).
When broader definitions are used, prevalence rates are higher. For example, in a sample of 25 schools from around the UK that included 4700 children, 75% reported being victims of bullying at some stage during the school year (Glover, Gough, Johnson, & Cartwright, 2000). Collectively, these studies illustrate that the period over which bullying is measured affects
New Zealand Journal of Psychology Vol. 44 No. 2, September 2015• 58 •
M. Kljakovic, C. Hunt, P. E. Jose
the number of students who report being bullied. However, it is also clear from these studies that bullying is a distressingly common phenomenon amongst adolescent samples.
Different Types of Bullying and Victimisation
Another factor that affects the reported rates of bullying is the different types of bullying behaviours that are measured. For example, Seals and Young (2003) looked at the prevalence of physical bullying, threats of harm, name calling, mean teasing and exclusion as different measures of bullying. Respondents were asked to report whether these occurred ‘never’, ‘sometimes’ or ‘often’ in the past school year. Name calling was the most common form of bullying with 36.7% of respondents reporting that this happened to them ‘sometimes’ and 13.5% reporting that it happened ‘often’.
Another way that the incidence of bullying can vary is the means through which it occurs. For example, cyber bullying (i.e., bullying via the internet, phone or other electronic media) appears to differ in certain ways from traditional forms of face-to-face bullying. Data from the 2005/2006 Health Behaviour in School aged Children (HBSC) survey showed that 20.8% of the adolescents surveyed reported that they had bullied others at least once in the last 2 months physically, 53.6% using verbal bullying, 51.4% using relational, and 13.6% using cyber methods (Wang, Iannotti & Nansel, 2009).
Bullying Incidence by AgeDespite these difficulties with the
measurement, age trends show a clear pattern with bullying and victimisation most common in late childhood, peaking at approximately 12 years of age with the transition to high school, and then declining thereafter. For example, Pelligrini and Long (2002) examined the transition period from primary school to high school using a sample of 11 to14 year olds, and they confirmed that rates of bullying increased with the transition between schools and then decreased thereafter. They reasoned that this peak occurred at this time due to a desire to establish social dominance in high school among a new cohort of peers.
They also showed that victimisation consistently declined over time after this peak, an effect that appears to be consistent worldwide. Again using data from the Health Behaviour in School-aged Children (HBSC) study, victimisation was found to decrease across the 11 to15 year span across 28 countries (Due et al., 2005).
Not only does bullying decrease with age, it also appears to be decreasing over time. Molcho et al. (2009) looked at prevalence trends for rates of bullying in over 20 countries. They found that in general, bullying has decreased over time from 1993 to 2006.
Incidence by GenderRates of bullying and victimisation
also appear to differ by gender. Generally, traditional bullying appears to be more common in male samples than female samples (Barboza, Schiamberg, Oehmke, Korzeniewski, Post & Heraux, 2009; Li, 2006). It is also often found that although bullies are most often boys, both males and females tend to be victims (Rodkin & Berger, 2008). However, some argue that this difference may be due to the fact that males engage in more obvious, physical aggression whereas females engage in relational aggression, which is less observable (Craig, 1998; Olweus, 1991).
Research pertaining to the gender differences in rates of cyber bullying is still in its infancy; however, it appears to yield a different pattern to that observed in traditional bullying and victimisation. Some evidence indicates cyber bullying is more prevalent amongst males (Li, 2006; Wang et al., 2009); whereas, some evidence suggests it is equally likely in both genders (Beckman, Hagquist & Hellström, 2013). Cyber victimisation on the other hand, generally appears to be more prevalent amongst females (Beckman et al., 2013; Kowalksi & Limber, 2007; Wang et al., 2009).
Gender differences in cyber bullying and victimisation may become more evident when different media (e.g., text message, email, chat room, etc.) are explored. Slonje and Smith (2008) explored the nature of different types of cyber bullying in a sample of adolescents (mean age 15.3 years) in Sweden. Overall, it appeared that there were few gender differences between
rates of cyber victimisation. However, boys tended to cyber bully more than girls, girls were more often victims of email bullying than boys, and boys were more likely to bully via text message than girls.
Incidence by EthnicityBullying research often indicates
that there are differences between the rates of bullying and victimisation by different ethnic groups within the same country. For example, within North American communities, Hispanic adolescents appear to bully others more frequently than African American or Caucasian individuals (Nansel et al., 2001). African American adolescents are significantly less victimised than Hispanic or Caucasian adolescents (Nansel et al., 2001; Spriggs, Iannotti, Nansel & Haynie, 2007). Additionally, Spriggs et al. (2007) found that for Caucasian and Hispanic students, school satisfaction and school performance were negatively associated with bullying and victimisation; whereas, school factors were unrelated to bullying or victimisation for African American students. Conversely, Seals and Young (2003) have found no differences between rates of bullying and victimisation of African American and Caucasian students. However, there were significant differences between the samples of Seals and Young’s (2003) and Nansel et al. (2001) which may account for the observed differences. Seals and Young’s (2003) sample was much smaller (N = 454) than that of Nansel et al. (2001; N = 15,686), Nansel et al. (2001) achieved an 83% participation result as opposed to 40% (Seals & Young, 2003). Seals and Young’s (2003) sample was primarily comprised of African American individuals (79%) and although Nansel et al. (2001) oversampled both African American and Hispanic individuals in their sample, it is unclear from their study exactly how the sample was distributed. Despite these observations, it is unclear whether it is minority status, socio-economic status or some other factor relating to ethnicity that is causing these differences.
A number of studies in the U.S. have found a higher prevalence of victimisation in Asian students compared to ethnic majority students

• 59 •New Zealand Journal of Psychology Vol. 44 No. 2, September 2015
Bullying in New Zealand
(Juvonen, Graham & Schuster, 2003; Mouttapa, Valenta, Gallaher, Rohrbach & Unger, 2004; Zhou, Peverly, Xin, Huang & Wang, 2003). However, it is unclear whether Asian students in these cases are victims because of their ethnicity per se or because of ethnic minority status, or again because of some other factor.
Further research alludes that in some cases it may be minority status that plays a role in different rates of bullying and victimisation observed between different ethnic groups. For example, in a sample of adolescents from the Netherlands, Vervoort, Scholte and Overbeek (2010) found that, after controlling for the ethnic composition of school class, non-Western ethnic minorities were victimised less and they did not differ from the ethnic majority in their rates of peer reported bullying. Ethnic composition of the school classes appeared to moderate the relationship between ethnicity and bullying in that ethnic minorities appeared to bully more in ethnically diverse classes. Australian and British research indicates that children are most likely to be the victims of bullying from those in their own ethnic group as opposed to those outside of it (Nguy & Hunt, 2004; Eslea & Mukhtar, 2000).
Other factors, such as measurement tools and level of assimilation may also play a role in the relationship between bullying and victimisation within ethnic minority groups. For example, Sawyer, Bradshaw and O’Brennan (2008) found that higher rates of victimisation were reported by ethnic minorities when a behaviour-based measure was used as opposed to a definition-based measure. Yu, Huang, Schwalberg, Overpeck and Kogan (2003) showed that children who spoke languages other than English at home were at a greater risk of being victims of bullying than their solely English speaking peers. They attributed this difference to levels of assimilation of immigrants based on the degree to which English was spoken at home. They also considered the role of psychosocial, school, or parental risk factors and found that those who speak languages other than English are at increased risk of feeling vulnerable, excluded and lacking confidence (Yu et al., 2003).
The New Zealand ContextThe international literature shows
that bullying and victimisation are universally experienced, although the rates may differ according to factors such as country, gender, domain of bullying and ethnicity. It is important to understand these factors more fully in New Zealand, and thereby help to ascertain the risk and protective factors specific to bullying in this country.
Some (e.g., Petrie, 2012) have claimed that New Zealand has some of the highest rates of bullying in the developed world. However, as outlined above, varying measurement of bullying may account for differences in reported rates of bullying. For example, New Zealand studies tend to measure any experience of having been bullied during the past year, whereas many other studies require a more frequent experience of bullying to meet criteria, which will inevitably result in a lower percentage reported. Within New Zealand, Carroll-Lind and Kearney (2004) found that 63% of their sample (N = 1480) reported being bullied at some stage in the past school year and of those bullied, 8% were bullied ‘about once a week’. However, this study included both children and adolescents.
Using a sample of 2066 New Zealand adolescents, Adair, Dixon, Moore and Sutherland (2000) used two measures to ascertain the incidence of bullying behaviours. They found that 58% of the sample reported being bullied in the past year according to the participants’ own definitions of the phenomena; whereas, 75% reported having been a victim of at least one of the listed bullying behaviours. Additionally, 44% reported being perpetrators of bullying in the past year according to their own definition.
In a more recent online survey, similar prevalence statistics were found (Marsh, McGee, Nada-Raja & Williams, 2010). Of 1169 15-year-old students, 47% reported having been bullied sometimes or often. Eleven percent of this sample also reported being victims of text bullying, and those involved in text bullying (either as a bully or a victim) were significantly more likely to be involved in other, non-text forms of bullying (Marsh, et al., 2010).
In a sample (N = 821) encompassing 15-16 year olds from 107 New Zealand schools (approximately a quarter of the schools in New Zealand at the time), Nairn and Smith (2002) found that 45% of the sample reported having ever been bullied at their current school. Of those bullied, 31% reported being bullied sometimes and 12% reported being bullied often (Nairn & Smith, 2002).
Using a more selective cut off, Deny et al. (2014) examined the prevalence of bullying and victimisation, once a week or more over the past year, in the 2007 cohort of the Youth2000 survey series. This comprised 9107 adolescents from 96 high-schools across New Zealand. Of the sample, 6.1% of students reported being victims of bullying once a week or more, and 5% reported bullying others once a week or more.
In regard to bullying via text message only, Raskauskas (2010) reported that 43% of their sample had experienced at least one incident of text-bullying, with 23% of the sample experiencing this form of bullying more frequently. The majority of victims of text-bullying also reported to be victims of traditional bullying. Students who were victims of both text message and traditional bullying reported more depressive symptoms than those who experienced traditional bullying only and those not involved in bullying.
Two large birth cohort studies exist that have explored factors relating to bullying and victimisation in New Zealand samples. Gibb, Horwood and Fergusson (2011) followed a birth cohort from birth to 30 years of age in Christchurch, New Zealand. Gibb et al. (2011) found that those who bullied or were victims at any time between the ages of 7 and 15 years had higher rates of later self-reported mental health difficulties and adjustment problems at 16-30 years of age. Caspi et al. (2002) looked at genetic factors relating to aggression in male participants involved in the Dunedin multidisciplinary study, a birth cohort that continues to follow individuals born in Dunedin, between 1972 and 1973. They found that boys in this sample who had low monoamine oxidase A (MAO-A) due to a specific genetic allele in combination with low nurturance were at increased risk of being bullies or aggressive-victims.

New Zealand Journal of Psychology Vol. 44 No. 2, September 2015• 60 •
M. Kljakovic, C. Hunt, P. E. Jose
Sixty percent of this group had been convicted for violent offence by the age of 26 whereas only 4% of boys with low MAO-A and high parental nurturance suffered the same fate. Thus it appears that the children’s home environment influenced whether this gene would be expressed as aggressive tendencies or not.
Coggana, Bennett, Hooper and Dickinson (2003) also explore the outcomes of bullying and victimisation in a New Zealand sample. Their cross sectional study looked at the effects of chronic bullying on over 3000 adolescents in New Zealand. They reported that victims had lower self-esteem, suffered more from depression, stress and hopelessness, and were more likely to think about and attempt self-harm and suicide than non-victims.
Given that prevalence estimates of bullying and victimisation vary between different New Zealand samples and different ethnicities, and have been based on varying definitions and measurement periods, it is important to further investigate the extent of the problem in New Zealand. While there is a growing international literature on the correlates of involvement in bullying, New Zealand has a unique multicultural society that differs from other countries on a number of factors (Ward & Masgoret, 2008). As such, bullying and victimisation may present differently. It is clear that bullying and victimisation have negative outcomes for New Zealanders (Coggana et al., 2003; Gibb et al., 2011) and the first step in developing interventions is to clarify the nature of the phenomena so that it can be effectively targeted. As such, the present study aimed to determine the current state of bullying and victimisation in terms of prevalence, and the effects of age, gender, ethnicity and type of bullying in a large representative sample of New Zealand adolescents.
To address the aforementioned issues, rates of bullying and victimisation in this New Zealand sample were compared to international samples and differing measurement approaches were considered when interpreting the results. Age, ethnicity and gender patterns were considered and compared to international samples where possible. This study also uniquely explored both
cyber and traditional forms of bullying and victimisation.
MethodThe current study involved the use
of data from the Youth Connectedness Project (YCP). The YCP used a mixed-method, cross-lagged longitudinal design, involving the collection of quantitative and qualitative data from three cohorts of youth starting at ages 10, 12, and 14, over three successive years. Ethical approval for the project was granted by the Victoria University of Wellington Human Ethics Committee. Readers can obtain further information about the YCP from http://www.vuw.ac.nz/youthconnectedness/ index.aspx.
Measures and ProcedureStudents were administered self-
report surveys on lap-top computers at each of the three time points. The survey included 369 questions in total; however, students rarely had to answer all of them due to branching and skipping within the survey. Eleven items asked about the frequency of bullying and victimization in the previous month and were preceded by the following definition of bullying: “Bullying includes any behaviour that is done to try and hurt another person’s feelings or body.” Bullying and victimisation items were measured on a 5-point Likert scale. Response options were: Never (1), 1 to 3 times (2), 4 to 6 times (3), 7 or more times (4), and Almost daily/daily (5). The bullying items are reproduced in Appendix 1.
When asked about ethnicity, students were provided with the following definition “Every person is part of an ethnic group, sometimes two or more ethnic groups. Some names of ethnic groups are: Samoan, Chinese, Māori, Tongan, New Zealand European.” Students were then asked to indicate the ethnic group or groups (“tick all that apply”) to which they belonged. A purposeful overrepresentation of Māori participants was effected in this sample. The aim of this was to obtain a sufficient number of Māori participants so that this group could be examined in detail in future analyses of the YCP data.
ParticipantsIn yea r one (2006) , 2 ,174
participants were recruited from 78 schools throughout the North Island of New Zealand. A roughly equal number of males and females were obtained for the sample (52% females, 48% males). Participants attended schools from a number of geographical areas in the North Island, including Wellington, Kapiti Coast, Wairarapa, Horowhenua, Taranaki, Hawke’s Bay, and Auckland. By the third point of measurement, due to attrition, the number of participants had dropped to 1,774. Data analyses were conducted on individuals who participated in the survey at all three time points. A previous statistical analysis comparing those who participated at all three time points with those who had dropped out revealed that the latter group reported significantly lower levels of future orientation and life satisfaction at T1 than those individuals who had completed all three time points (Jose, Ryan & Pryor, 2012). Males and students from lower decile schools were also less likely to complete all three time points (Jose et al., 2012). A school’s decile rating gives an indication of the proportion of its students who reside in low socio-economic communities. According to the New Zealand Ministry of Education, “Decile 1 schools are the 10% of schools with the highest proportion of students from low socio-economic communities, whereas decile 10 schools are the 10% of schools with the lowest proportion of these students” (Ministry of Education, 2014).
Statistical AnalysesThe data were analysed using SPSS
18.0. An analysis of variance (ANOVA) was conducted to determine the size and significance of group differences. For the group comparisons, bullying and victimisation mean item scores were treated as continuous variables.
ResultsStudents came from schools that
represented the entire range of school deciles (range 1 to 10). The average school decile in the present study was 5.2, which approximated the average for the entire country. In the first year, 52% of respondents identified
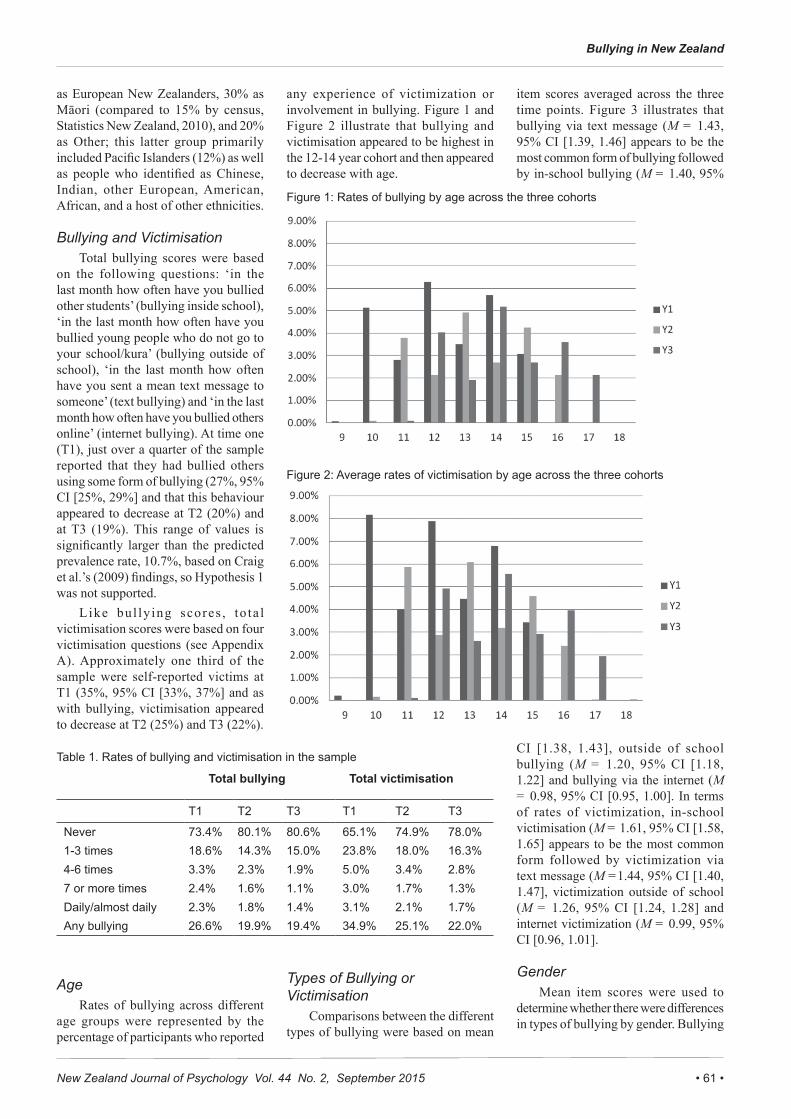
• 61 •New Zealand Journal of Psychology Vol. 44 No. 2, September 2015
Bullying in New Zealand
Table 1. Rates of bullying and victimisation in the sample
Total bullying Total victimisation
T1 T2 T3 T1 T2 T3
Never 73.4% 80.1% 80.6% 65.1% 74.9% 78.0%1-3 times 18.6% 14.3% 15.0% 23.8% 18.0% 16.3%4-6 times 3.3% 2.3% 1.9% 5.0% 3.4% 2.8%7 or more times 2.4% 1.6% 1.1% 3.0% 1.7% 1.3%Daily/almost daily 2.3% 1.8% 1.4% 3.1% 2.1% 1.7%Any bullying 26.6% 19.9% 19.4% 34.9% 25.1% 22.0%
as European New Zealanders, 30% as Māori (compared to 15% by census, Statistics New Zealand, 2010), and 20% as Other; this latter group primarily included Pacific Islanders (12%) as well as people who identified as Chinese, Indian, other European, American, African, and a host of other ethnicities.
Bullying and VictimisationTotal bullying scores were based
on the following questions: ‘in the last month how often have you bullied other students’ (bullying inside school), ‘in the last month how often have you bullied young people who do not go to your school/kura’ (bullying outside of school), ‘in the last month how often have you sent a mean text message to someone’ (text bullying) and ‘in the last month how often have you bullied others online’ (internet bullying). At time one (T1), just over a quarter of the sample reported that they had bullied others using some form of bullying (27%, 95% CI [25%, 29%] and that this behaviour appeared to decrease at T2 (20%) and at T3 (19%). This range of values is significantly larger than the predicted prevalence rate, 10.7%, based on Craig et al.’s (2009) findings, so Hypothesis 1 was not supported.
Like bul ly ing scores , to ta l victimisation scores were based on four victimisation questions (see Appendix A). Approximately one third of the sample were self-reported victims at T1 (35%, 95% CI [33%, 37%] and as with bullying, victimisation appeared to decrease at T2 (25%) and T3 (22%).
Age Rates of bullying across different
age groups were represented by the percentage of participants who reported
any experience of victimization or involvement in bullying. Figure 1 and Figure 2 illustrate that bullying and victimisation appeared to be highest in the 12-14 year cohort and then appeared to decrease with age.
Types of Bullying or Victimisation
Comparisons between the different types of bullying were based on mean
item scores averaged across the three time points. Figure 3 illustrates that bullying via text message (M = 1.43, 95% CI [1.39, 1.46] appears to be the most common form of bullying followed by in-school bullying (M = 1.40, 95%
CI [1.38, 1.43], outside of school bullying (M = 1.20, 95% CI [1.18, 1.22] and bullying via the internet (M = 0.98, 95% CI [0.95, 1.00]. In terms of rates of victimization, in-school victimisation (M = 1.61, 95% CI [1.58, 1.65] appears to be the most common form followed by victimization via text message (M =1.44, 95% CI [1.40, 1.47], victimization outside of school (M = 1.26, 95% CI [1.24, 1.28] and internet victimization (M = 0.99, 95% CI [0.96, 1.01].
GenderMean item scores were used to
determine whether there were differences in types of bullying by gender. Bullying
Figure 1: Rates of bullying by age across the three cohorts
Figure 2: Average rates of victimisation by age across the three cohorts

New Zealand Journal of Psychology Vol. 44 No. 2, September 2015• 62 •
M. Kljakovic, C. Hunt, P. E. Jose
and victimisation rates were averaged across the three time points. ‘Total’ scores indicate the average of the four different types.
Tables 2 and 3 illustrate the mean scores for each form of bullying and victimisation by male and female participants. A significant difference between males and females on total rates of bullying was found in an ANOVA analysis, F(1, 1544) = 3.816, p = 0.05). Some gender differences were noted for particular types of bullying. In particular, the ANOVA revealed that males engaged in significantly more bullying inside school than females, F(1, 1771) = 18.845, p < 0.001), and males also engaged in significantly more bullying outside school than females (F(1) = 4.835, p = 0.03). On the other
hand, no significant differences were found in the rates of text (F(1) = 0.816, p = 0.37) or internet (F(1) = 2.240, p = 0.14) bullying between males and females.
In regard to victimisation, no significant difference was identified between males and females on total rates of victimisation, F(1, 1544) = 2.630, p = 0.11). Nevertheless, males were victimised significantly more than females inside the school environment, (F(1) = 5.929, p = 0.02). But no significant gender differences were found in the rates of victimisation outside of school (F(1) = 0.766, p= 0.38), text victimisation (F(1) = 0.765, p= 0.38), or internet victimisation (F(1) = 0.441, p= 0.51).
EthnicityAn ANOVA analysis revealed
that overall there were no significant differences between the three ethnic categories in relation to average rates of bullying (F(2, 1540) = 1.569, p = 0.21). The mean rate of bullying for the NZ European sample was 1.03 (SD = 0.62), Māori was 1.08 (SD = 0.65) and Other was 1.09 (SD = .65). The analysis also confirmed that overall there were no significant differences between the three ethnic categories in relation to average rates of victimisation (F(2, 1540) = 2.071, p = 0.13). The mean rate of victimisation for the NZ European sample was 1.07 (SD = 0.65), Māori was 1.14 (SD = 0.69) and Other was 1.14 (SD = .70).
Figure 4 illustrates the average scores for the different types of bullying amongst the three ethnic categories. ANOVA revealed that there were significant differences between the three ethnic categories in relation to average rates of bullying inside the school (F(2) = 22.26, p < 0.001), bullying outside of school (F(2) = 24.10, p < 0.001) and bullying via text message (F(2) = 26.69, p < 0.001). Across each of these three types of bullying, those who identified as Māori engaged in the highest average rate of bullying, followed by those who identified as “other” and lastly by those who identified as New Zealand European. These differences remained when school decile was included as a covariate. There was no significant difference between the three ethnic categories in the average rates of internet bullying (F(2) = 0.142, p = 0.87).
Figure 5 indicates that overall there was little variability in the rates of victimisation between the three ethnic categories. An ANOVA analysis revealed a significant difference between the average ratings of victimisation via text message (F(2) = 14.736, p<0.001). Those who identify as Māori were victimised most, followed by those who identified as “other”, and those who identified as New Zealand European were victimised least. Again, these differences remained when school decile was included as a covariate. There were no significant differences in the rates of victimisation between the three ethnic categories in terms of victimisation inside the school (F(2) =
Table 2. Average rates of bullying by gender and type of bullying
Male Female TotalMean SD Mean SD Mean SD
School bullying 1.47 0.00 1.35 0.00 1.41 0.00
Bullying outside of school 1.22 0.46 1.18 0.38 1.20 0.42
Text bullying 1.41 0.84 1.44 0.79 1.43 0.81
Internet bullying 1.00 0.59 0.96 0.51 0.98 0.55
Total bullying 1.09 0.63 1.02 0.64 1.05 0.63
Table 3. Average rates of victimisation by gender and type of victimisation
Male Female TotalMean SD Mean SD Mean SD
School victimisation 1.66 0.76 1.57 0.72 1.61 0.74
Victimisation outside of school 1.27 0.53 1.25 0.44 1.26 0.48
Text victimisation 1.42 0.81 1.45 0.74 1.44 0.78
Internet victimisation 1.00 0.59 0.98 0.54 0.99 0.56
Total victimisation 1.13 0.65 1.08 0.68 1.10 0.67
Figure 3: Frequency of bullying and victimisation by type

• 63 •New Zealand Journal of Psychology Vol. 44 No. 2, September 2015
Bullying in New Zealand
0.043, p =0.958), victimisation outside of school (F(2) = 2.902, p = 0.055), or internet victimisation (F(2) = 0.449, p = 0.639).
DiscussionA growing international literature
demonstrates that the experience of bullying is a common problem, with incidences varying in regards to a number of factors, including age, gender, ethnicity and bullying type. The present study adds to this body of literature through its focus on the correlates of bullying and victimisation amongst New Zealand adolescents. This study’s findings are largely comparable to international data; however, some key differences emerged, including the prevalence of traditional victimisation, the prevalence and nature of different forms of cyber aggression, and the rates of bullying in regard to this ethnically unique sample in New Zealand.
In our sample, the average rate of reported engagement in bullying for year one (26.5%), was more than double the average rate of bullying (10.7%) reported by Craig et al. (2009) from the Health Behaviour in School-aged Children (HBSC) study. Although the rate in our New Zealand sample was higher than that reported by Craig et al. (2009), these rates might be comparable when the differing inclusion criteria between the two studies are considered. Craig et al. (2009) only classified individuals as bullies if they were also not victims and if they bullied others at least twice per month, whereas; inclusion criteria for the present study included individuals who bullied at least once per month, regardless of their victim status. Unfortunately, Craig et al. do not identify the mean rates of bullying specifically by each country surveyed. Instead, they give the rates of involvement in any form of bullying
(as a bully, a victim or a bully-victim) for each gender by country. As such it is difficult to compare New Zealand to other countries of similar size or demographic to assess whether in fact bullying rates are unexpectedly high. However, setting aside the measurement differences between the two surveys, New Zealand appears to have higher rates of bullying involvement relative to Northern and Western European countries (range 4.8 to 27.1%), but lower rates than Eastern European countries (range 8.9 to 45.2%).
Reported victimisation in the current sample appears to be elevated relative to the international data. The rate of reported victimisation of our sample in year one (34.9%) is very similar to that reported by Fleming and Jacobsen (2009; 34.2%) using the Global School-based Student Health Survey (GSHS), however, both of these figures are high in comparison to other international research (Craig et al., 2009; 12.6%). Fleming and Jacobsen (2009) used a very similar indicator of victimisation to the current study (self-reported victimisation on at least one day in the past month) but employed samples from lower to middle income countries. Since New Zealand is a high-income country, it is possible that the different rates of victimisation could be influenced by the difference in socioeconomic status.
Although rates of bullying and victimisation appear to be high in this sample in comparison with other countries worldwide, it is unclear why this might be the case. The reasons behind these differences require further delineation so that intervention programmes can be appropriately adapted for the New Zealand context. For example, comparing the intervention programmes or policies pertaining to bullying in the countries surveyed may account for some of the difference in prevalence rates.
Although many studies differentiate between cyberbullying and traditional bullying, few explore the subtypes of cyberbullying such as bullying over the internet or bullying via text messaging. The use of this distinction in the present data highlighted some important differences from previous New Zealand research in several
Figure 4: Mean frequencies of different types of bullying by three ethnic categories
Figure 5: Average frequencies of different types of victimisation by three ethnic categories

New Zealand Journal of Psychology Vol. 44 No. 2, September 2015• 64 •
M. Kljakovic, C. Hunt, P. E. Jose
regards. In the current sample, reported engagement in bullying with text messaging was the most popular means of bullying, followed by bullying inside school, bullying outside of school, and lastly, internet bullying. Although both Wang et al. (2009) and Li (2006) found that traditional bullying was more common than cyberbullying, they did not differentiate between different forms of cyber aggression.
In other countries, traditional victimisation has been reported to be more common than cyber victimisation (Li, 2006). However, in the present study, in-school victimisation was the most common form followed by text victimisation, victimisation outside of school, and lastly internet victimisation. Few previous studies have differentiated between the different types of cyber victimisation, which may explain the unique findings in our sample. We suggest that it is important to distinguish among different forms of cyber aggression because they seem to occur at different rates, and they may also have differential outcomes.
In regard to gender and age trends in bullying and victimisation, the current sample appears to follow similar patterns to those reported in other New Zealand samples and other countries. In line with other research (Due et al., 2005; Pelligrini & Long, 2002), bullying and victimisation decreased with age after the transition to high school. Also in line with previous research, traditional bullying was more common in males than females (Barboza et al., 2009; Li, 2006). In-school victimisation was also more common in males than females, but there were no differences between the genders for victimisation outside of school.
Gender differences in regard to cyberbullying and victimisation are not clear-cut in the literature. Some evidence indicates cyberbullying is more prevalent amongst males (Li, 2006; Wang et al., 2009), whereas, some suggests it is equally likely in the two genders (Beckman et al., 2013). The present study supports the ‘no difference’ finding in the literature as no difference was found between males and females for internet or text bullying. No difference was found between males and females in the rates of text or internet
victimisation, which differs from previous literature in which females are more likely to be cyber victims than males (Beckman et al., 2013; Kowalksi & Limber, 2007; Wang et al., 2009). When different forms of cyber victimisation are explored, the pattern is slightly different. Where the current study found no gender differences in text messaging or email victimization, Slonje and Smith (2008) found that females were more often victims of email bullying (but had similar levels of text message victimisation) than males. It should be pointed out, however, that Slonje and Smith’s (2008) measure of email bullying differed from the present broader measure of internet bullying, and hence, this discrepancy may explain the difference.
Māori individuals were purposefully oversampled in this sample such that there were large enough numbers so that bullying and victimisation rates amongst this group could be effectively assessed. When the rates of the four different types of bullying and victimisation were averaged, no differences were found between Māori individuals, New Zealand European participants, and those categorised as ‘Other’ ethnicity. However, differences between ethnic groups were noted when the subtypes of bullying and victimisation were considered. In regard to bullying others, Māori individuals reported engaging in more bullying inside school, outside school, and text bullying than New Zealand Europeans or ‘other’ ethnicities. No differences were found in the rates of internet bullying. In regard to victimisation, Māori individuals reported more text victimisation than ‘Others’ or New Zealand Europeans. No other differences across the ethnic groups in rates of victimisation either on the internet, inside of school or outside of school were identified.
It is difficult to compare these ethnic group findings with international studies, as it is unclear whether higher or lower rates may be observed in a certain group due to their majority or minority status, or some specific factor related to their ethnicity such as degree of acculturation, socio economic status, religious affiliation, etc. In terms of ethnic group research, much of this work compares ethnic groups within
the U.S. (Nansel et al., 2001; Seals &Young, 2003; Spriggs et al., 2007), for example, Caucasian Americans with Hispanic Americans. It is possible that marginalised ethnic minorities such as Hispanic youth in the U.S. and Māori youth in New Zealand share sufficient commonalities to allow a comparison, but at this juncture insufficient data has been collected worldwide to permit such analyses.
New Zealand is unique in that it is a multicultural society with a high percentage of recent immigrants (i.e., one in five New Zealanders were born overseas; Department of Labour, 2009). It has a bicultural history, formed with the signing of the treaty of Waitangi between the British immigrants and Māori natives in 1840 (Lyons, Madden, Chamberlain, & Carr, 2011). European immigrants have been the majority cultural group in New Zealand since the mid-1850s, however, most New Zealanders strongly endorse multiculturalism and the divide between cultural groups within New Zealand is less than in other Western countries (Ward & Masgoret, 2008). If there is a small divide between cultural groups within New Zealand, the observed inter-ethnic group differences must exist for some other reason such as discrepancy in privilege between different ethnic groups or some other factor or combination of factors. The effects remain when accounting for school decile, therefore, socio-economic status may not be the explaining factor; however, this measure may not be sensitive enough to fully account for the complexity of socio-economic disparity. As with much of the previous literature pertaining to ethnicity and bullying (Nansel et al., 2001; Seals & Young, 2003; Spriggs et al., 2007), the results do not conclusively account for the observed differences between ethnic groups. Further research is needed to determine whether these differences are due to minority status, contextual variables such as school composition, or some other factor.
LimitationsCol l ec t ive ly, t hese r e su l t s
contribute to the existing body of literature pertaining both to New Zealand and international research.

• 65 •New Zealand Journal of Psychology Vol. 44 No. 2, September 2015
Bullying in New Zealand
However, some limitations within this research should be noted. As mentioned above, methodological differences in the time frame of measurement used for bullying behaviour and in the phrasing of questions pertaining to bullying behaviour may have impacted self-reported rates of bullying and victimisation, and thus may account for some of the observed differences in prevalence rates. The present research experiences the same limitation as it does not align with the majority of research in terms of the measurement period used. Different approaches to the measurement of bullying and victimisation including self report, peer nomination, teacher nomination or behavioural observation, also limit the comparability of results. Little cosensus exists about which approach is best; however, it is largely agreed that rates of bullying and victimisation vary according to measurment methods (Cole, Cornell & Sheras, 2006; Griffin & Gross, 2004; Swyer et al., 2008). Bullying research would benefit from consensus among researchers in their approach to assessment.
One commonly reported issue with self report is that individuals may under-report the prevalence of bullying or victimisation in which they are involved (Solberg & Olweus, 2003). Although anonymity was preserved in this study and this was emphasised to students, it is unclear whether the levels reported do in fact represent the true levels of student involvement in bullying and victimisation. Using multiple measures of bullying and vicitmisation, such as peer report and self report, may have lead to more reliable results but this was not achievable within the scope of this study.
Although large and in many ways representative of New Zealand adolescents, the sample was drawn only from schools throughout the North island of New Zealand. As such it may not provide a good representation of adolescents living in the South island of New Zealand and cannot be taken to represent New Zealand as a whole.
ConclusionsDespite the above limitations,
this study adds to existent literature pertaining to bullying and victimisation
internationally and provides a much needed overview of the state of bullying and victimisation within a New Zealand sample. The sample used also had a number of methodological strengths including the number of different schools sampled within New Zealand with a range of school deciles, the large sample size, and the longitudinal design.
The results indicate that rates of both bullying and victimisation may be elevated compared to international samples and therefore higher than expected. Differing rates of bullying and victimisation were found across the different types of these phenomena, with both bullying and victimisation via text messaging being more common than anticipated. Gender and age trends in bullying and victimisation were comparable to international research; however, differences were noted in regard to cyberbullying and victimisation with no differences being found between the two genders. Ethnicity showed no overall difference for average rates of bullying and victimisation, but when the differing types were explored; Māori individuals engaged in more bullying inside school, outside school, and text bullying and were subjected to more text victimisation than New Zealand Europeans or ‘other’ ethnicities.
If the rates are accurate, they indicate that bullying is a significant issue for New Zealand adolescents and bullying in New Zealand may present somewhat differently than in other countries. Consequently, more research is needed to specifically understand New Zealand adolescents. As such, intervention programmes within New Zealand may need to be adapted to cater specifically to the needs of Māori students such that this problematic behaviour can be ameliorated.
ReferencesAdair, V. A., Dixon, R. S., Moore, D. W.,
& Sutherland, C. M. (2000). Ask your mother not to make yummy sandwiches: Bullying in New Zealand secondary schools. New Zealand Journal of Educational Studies, 35, 207-221.
Barboza, G. E., Schiamberg, L. B., Oehmke, J., Korzeniewski, S. J., Post, L. A., & Heraux, C. G. (2009). Individual characteristics and the multiple contexts of adolescent bullying: An ecological
perspective. Journal of Youth and Adolescence 38, 101–121. DOI: 10.1007/s10964-008-9271-1.
Beckman, L., Hagquist, C., & Hellström, L. (2013). Discrepant gender patterns for cyberbullying and traditional bullying: An analysis of Swedish adolescent data. Computers in Human Behavior, 29, 1896–1903. DOI:10.1016/j.chb.2013.03.010.
Carroll-Lind, J., & Kearney, A. (2004). Bullying: What do students say? Kairaranga, 5, 19-24.
Caspi, A., McClay, J., Moffitt, T. E., Mill, J., Martin, J., Craig, I. W., Taylor, A., & Poulton, R. (2002). Role of genotype in the cycle of violence in maltreated children. Science, 297, 851–854. DOI: DOI: 10.1126/science.1072290.
Coggana, C., Bennett, S., Hooper, R., & Dickinson, P. (2003). Association between bullying and mental health status in New Zealand adolescents. International Journal of Mental Health Promotion, 5, 16-22. DOI: 10.1080/14623730.2003.9721892.
Cole, J. C. M., Cornell, D. G., & Sheras, P. (2006). Identification of school Bullies by survey methods. Professional School Counseling, 9, 305-313.
Craig, W. M. (1998). The relationship among bullying, victimization, depression, anxiety and aggression in elementary school children. Personality and Individual Differences, 24, 123-130. DOI: 10.1016/S0191-8869(97)00145-1.
Craig, W. M., Harel-Fisch, Y., Fogel-Grinvald, H., Dostaler, S., Hetland, J., Simons-Morton, B. et al. (2009). A cross-national profile of bullying and victimization among adolescents in 40 countries. International Journal of Public Health, 54, S1–S9. DOI: 10.1007/s00038-009-5413-9.
Denny, S., Peterson, E. R., Stuart, J., Utter, J., Bullen, P., Fleming, T., Ameratunga, S., Clark, T., & Milfont, T. (2014): Bystander intervention, bullying, and victimization: A multilevel analysis of New Zealand high schools. Journal of School Violence, 0, 1-28. DOI: 10.1080/15388220.2014.910470.
Department of Labour. (2009). Migration Trends and Outlook 2007/08. Department of Labour, New Zealand. Retrieved from: http://www.immigration.govt.nz/migrant/general/generalinformation/research/trendsstatisticsandsummaries.htm on June 25, 2013.
Due, P., Holstein, B. E., Lynch, J., Diderichesen, F., Gabhain, S. N., Scheidt, P., Currie, C., & The Health Behaviour in School-aged Children Bullying Working Group. (2005). Bullying and symptoms among school-aged children:

New Zealand Journal of Psychology Vol. 44 No. 2, September 2015• 66 •
M. Kljakovic, C. Hunt, P. E. Jose
International comparative cross-sectional study in 28 countries. European Journal of Public Health, 15, 128–132. DOI: http://dx.doi.org/10.1093/eurpub/cki105.
Eslea, M., & Mukhtar, K. (2000). Bullying and racism among Asian schoolchildren in Britain. Educational Research, 42, 207-217. DOI: 10.1080/001318800363845.
Fleming, L. C., & Jacobsen, K. H. (2009). Bullying among middle-school students in low and middle income countries. Health Promotion International, 25, 73-84. DOI: 10.1093/heapro/dap046.
Gibb, S. J., Horwood, L. J., & Fergusson, D. M. (2011). Bullying victimization/perpetration in childhood and later adjustment: Findings from a 30-year longitudinal study. Journal of Aggression, Conflict and Peace Research, 3, 82-88. DOI: http://dx.doi.org/10.1108/17596591111132891.
Glover, D., Gough, G., Johnson, M., & Cartwright, N. (2000). Bullying in 25 secondary schools: Incidence, impact and intervention. Educational Research, 42, 141 – 156. DOI: 10.1080/001318800363782.
Griffin, R. S., & Gross, A. M. (2004). Childhood bullying: Current empirical findings and future directions for research. Aggression and Violent Behavior, 9, 379-400. DOI: 10.1016/S1359-1789(03)00033-8.
Jose, P. E., Ryan, N., & Pryor, J. (2012). Does social connectedness promote a greater sense of well-being in adolescence over time? Journal of Research on Adolescence, 22(2), 235-251. DOI: 10.1111/j.1532-7795.2012.00783.x.
Juvonen, J., Graham, S., & Schuster, M. A. (2003). Bullying among young adolescents: The strong, the weak, and the troubled. Pediatrics, 112, 1231 – 1237. DOI: 10.1542/peds.112.6.1231.
Kim, Y. S., & Leventhal, B. (2008). Bullying and suicide. A review. International Journal of Adolescent Medicine and Health, 20, 133-54.
Kowalski, R. M., & Limber, S. P. (2007). Electronic bullying among middle school students. Journal of Adolescent Health, 41, S22–S30. DOI: 10.1016/j.jadohealth.2007.08.017.
Li, Q. (2006). Cyberbullying in schools: A research of gender differences. School Psychology International, 27, 157-170. DOI: 10.1177/0143034306064547.
Lyons, A. C., Madden, H., Chamberlain, K., & Carr, S. (2011). ‘It’s not really us discriminating against immigrants, it’s more telling people how to fit in’: Constructing the nation in immigration talk in New Zealand. Journal of
Community & Applied Social Psychology, 21, 14-27. DOI: 10.1002/casp.1051.
Marsh, L., McGee, R., Nada-Raja, S., & Williams, S. (2010). Brief report: Text bullying and traditional bullying among New Zealand secondary school students. Journal of Adolescence, 33, 237–240. DOI: 10.1016/j.adolescence.2009.06.001.
Ministry of Education. (2014). School decile ratings. Retrieved from: http://www.minedu.govt.nz/Parents/AllAges/EducationInNZ/SchoolsInNewZealand/SchoolDecileRatings.aspx on February 04, 2014.
Molcho, M., Craig, W., Due, P., Pickett, W., Harel-Fisch, Y., Overpeck, M., & the HBSC Bullying Writing Group. (2009). Cross-national time trends in bullying behaviour 1994–2006: Findings from Europe and North America. International Journal of Public Health, 54, S225–S234. DOI 10.1007/s00038-009-5414-8.
Mouttapa, M., Valente, T., Gallaher, P., Rohrbach, L. A., & Unger, J. B. (2004). Social network predictors of bullying and victimization. Adolescence, 39, 315-335.
Muula, A. S., Herring, P., Siziya, S., & Rudatsikira, E. (2009). Bullying victimization and physical fighting among Venezuelan adolescents in Barinas: Results from the Global School-Based Health Survey 2003. Italian Journal of Pediatrics, 35, 38-42. DOI: 10.1186/1824-7288-35-38.
Nairn, K., & Smith, A. B. (2002). Secondary school students’experiences of bullying at school and their suggestions for dealing with it. Childrenz Issues, 6, 16-22.
Nansel, T. R., Overpeck, M., Pilla, R. S., Ruan, W. J., Simons-Morton, B., & Scheidt, P. (2001). Bullying behaviors among U.S. youth: Prevalence and association with psychosocial adjustment. Journal of the American Medical Association, 285, 2094-2100. DOI: 10.1001/jama.285.16.2094.
Nguy, L., & Hunt, C. J. (2004). Ethnicity and bullying: A study of Australian high-school students. Educational and Child Psychology, 21, 78-94.
Olweus, D. (1991). Bully/victim problems among school children: Basic facts and effects of a school-based intervention program. In D. Pepler & K. Rubin (Eds.), The development and treatment of childhood aggression (pp. 411-448). Hillsdale, NJ: Erlbaum.
Pellegrini, A. D., & Long, J. D. (2002). A longitudinal study of bullying, dominance, and victimization during the transition from primary school through secondary school. British Journal of Developmental Psychology, 20, 259–280. DOI: 10.1348/026151002166442.
Petrie, K. (2012) Student peer bullying: A brief overview of the problem and some associated myths. TEACH Journal of Christian Education, 3, 4-9.
Raskauskas, J. (2010). Text-bullying: A s s o c i a t i o n s w i t h t r a d i t i o n a l bul ly ing and depress ion among New Zealand adolescents. Journal of School Violence, 9, 74–97. DOI: 10.1080/15388220903185605.
Rodkin, P. C., & Berger, C. (2008). Who bullies whom? Social status asymmetries by victim gender. International Journal of Behavioral Development, 32, 473–485. DOI: 10.1177/0165025408093667.
Sawyer, A. L., Bradshaw, C. P., & O’Brennan, L. M. (2008). Examining ethnic, gender, and developmental differences in the way children report being a victim of “bullying” on self-report measures. Journal of Adolescent Health, 43, 106–114. DOI: 10.1016/j.jadohealth.2007.12.011.
Seals, D., & Young, J. (2003). Bullying and victimization: Prevalence and relationship to gender, grade level, ethnicity, self-esteem, and depression. Adolescence, 38, 735 – 747.
Simon-Davies, J. (2011). Suicide in Australia. ACT: Department of Parliamentary Services.
Slonje, R., & Smith, P. K. (2008). Cyberbullying: Another main type of bullying? Scandinavian Journal of Psychology, 49, 147–154. DOI: 10.1111/j.1467-9450.2007.00611.x.
Solberg, M. E., & Olweus, D. (2003). Prevalence est imation of school bullying with the Olweus bully/victim questionnaire. Aggressive Behvaior, 29, 239-268. DOI: 10.1002/ab.10047.
Spriggs, A. L., Iannotti, R. J., Nansel, T. R., & Haynie, D. L. (2007). Adolescent bullying involvement and perceived family, peer and school relations: Commonalities and differences across race/ethnicity. Journal of Adolescent Health, 41, 283–293. DOI: 10.1016/j.jadohealth.2007.04.009.
Stassen Berger, K. (2007). Update on bullying at school: Science forgotten? Developmental Review, 27, 90–126. DOI: 10.1016/j.dr.2006.08.002.
Statistics New Zealand. (2010). National ethnic population projections: 2006 (base) – 2026 update. National Ethnic Population Projections. Retrieved from: http://www.stats.govt.nz/browse_for_stats/population/estimates_and_projections/NationalEthnicPopulationProjections_HOTP2006-26/Commentary.aspx on March 20, 2014.
Vervoort, M. H. M., Scholte, R. H. J., &
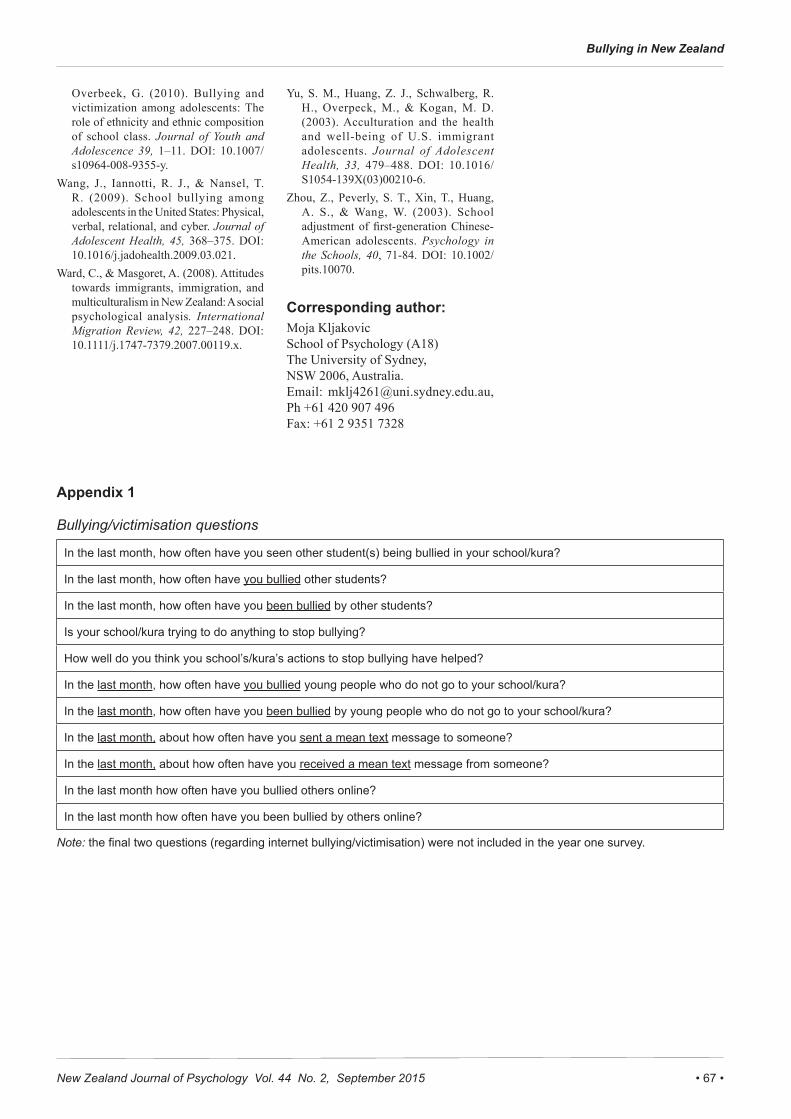
• 67 •New Zealand Journal of Psychology Vol. 44 No. 2, September 2015
Bullying in New Zealand
Overbeek, G. (2010). Bullying and victimization among adolescents: The role of ethnicity and ethnic composition of school class. Journal of Youth and Adolescence 39, 1–11. DOI: 10.1007/s10964-008-9355-y.
Wang, J., Iannotti, R. J., & Nansel, T. R. (2009). School bullying among adolescents in the United States: Physical, verbal, relational, and cyber. Journal of Adolescent Health, 45, 368–375. DOI: 10.1016/j.jadohealth.2009.03.021.
Ward, C., & Masgoret, A. (2008). Attitudes towards immigrants, immigration, and multiculturalism in New Zealand: A social psychological analysis. International Migration Review, 42, 227–248. DOI: 10.1111/j.1747-7379.2007.00119.x.
Yu, S. M., Huang, Z. J., Schwalberg, R. H., Overpeck, M., & Kogan, M. D. (2003). Acculturation and the health and well-being of U.S. immigrant adolescents. Journal of Adolescent Health, 33, 479–488. DOI: 10.1016/S1054-139X(03)00210-6.
Zhou, Z., Peverly, S. T., Xin, T., Huang, A. S., & Wang, W. (2003). School adjustment of first-generation Chinese-American adolescents. Psychology in the Schools, 40, 71-84. DOI: 10.1002/pits.10070.
Corresponding author: Moja KljakovicSchool of Psychology (A18)The University of Sydney, NSW 2006, Australia. Email: [email protected], Ph +61 420 907 496 Fax: +61 2 9351 7328
Appendix 1
Bullying/victimisation questions
In the last month, how often have you seen other student(s) being bullied in your school/kura?
In the last month, how often have you bullied other students?
In the last month, how often have you been bullied by other students?
Is your school/kura trying to do anything to stop bullying?
How well do you think you school’s/kura’s actions to stop bullying have helped?
In the last month, how often have you bullied young people who do not go to your school/kura?
In the last month, how often have you been bullied by young people who do not go to your school/kura?
In the last month, about how often have you sent a mean text message to someone?
In the last month, about how often have you received a mean text message from someone?
In the last month how often have you bullied others online?
In the last month how often have you been bullied by others online?
Note: the final two questions (regarding internet bullying/victimisation) were not included in the year one survey.
New Zealand Journal of Psychology Vol. 44 No. 2, September 2015• 68 •
K. H. Lemmon, V. A. Green
Using video self-modeling and the peer group to increase the social skills of a preschool child
Kristy Haslam Lemmon, Vanessa A. Green Victoria University of Wellington, New Zealand
The development of social skills in the preschool years is paramount to the development of later social, academic and behavioural competence. Children who exhibit social skills deficits may require specialised support to develop functional social behaviours. Video self-modeling (VSM) has been shown to be an effective form of social skills intervention with certain populations. This study examined the effects of a video self-modeling social skills intervention on a preschooler who was behaving in a disruptive and aggressive manner with his peers. Peer participants were employed to augment the effects of the VSM intervention. Results suggest that the VSM intervention had a beneficial effect on the participant’s positive social interactions with peers. The results are discussed in light of the implications for children with externalizing behaviours.
Keywords: video self-modeling, peers, positive social interactions, social skills
The development of social skills in the preschool years is considered crucial to the development of later social, academic and behavioural competence (Brown, Odom, & Conroy, 2001; McCabe & Altamura, 2011). However, achieving positive social relationships in preschool is a complex process which seems to require - at a minimum - age-appropriate language, and the the effective management of negative emotions. However, there are also a host of specific skills that may be required. In particular, children might need to know how to interact with peers by engaging in positive communications and behaviours that not only enhance the play, but increase the likelihood of positive interactions continuing. For example, children might need to learn how to accept invitations and initiate activities. However, perhaps most importantly they might need to know how to sustain positive interactions with peers by engaging in positive communications and cooperating with others. This positive behaviour includes sharing, taking turns and negotiating with others to manage disagreements and conflicts (Elliot, Roach, & Beddow, 2008; Girolametto & Weitzman, 2007). While all children require some support from caregivers and teachers to develop
positive social relationships with peers, there are some children who struggle to achieve a desirable level of social skill and may require specialised support (Elliot et al., 2008; Guralnick, 1993).
There are numerous causal factors for poor social skills development in young children, including language and developmental delays, behavioural disorders (Walker, Ramsey, & Gresham, 2004) and autism spectrum disorder (Koegel, Koegel, Hurley, & Frea, 1992; Wang & Spillane, 2009). As deficits in social skills can lead to poor academic performance, problem behaviour (Brown et al., 2001; January, Casey, & Paulson, 2011; O’Shaughnessy, Lane, Gresham, & Beebe-Frankenberger, 2002) and peer rejection (Ladd, 1990; Walker et al., 2004), early intervention is critical (Elliot et al., 2008).
The goals of social skills intervention should typically be to increase positive peer interactions, reduce or eliminate problem behaviours, and to achieve generalisation and maintenance of skills acquired. January et al. (2011) found that social skills training is most effective when it is implemented in preschool or kindergarten. Preschools are natural settings for social skills interventions because preschool education emphasises social development rather than academic
achievement.One potentially effective method of
intervention for social skill development has been the use of video modeling (VM) and video self-modeling (VSM). These approaches have their origins in Bandura’s theory of social learning (Bandura, 1977) and are considered to be both time and cost-effective. The video models performing the appropriate behaviours are ideally similar in age, gender, and ethnicity to the target child. In the case of VSM, the target child him- or herself is used to depict the target behaviour (Dowrick, 1999) These approaches are considered relatively unobtrusive ways to teach desired behaviour or reduce undesired behaviour (Ballard & Crooks, 1984; Kehle, Bray, Margiano, Theodore, & Zhou, 2002; Keller & Carlson, 1974). VM and VSM have been employed successfully as social skills interventions with preschoolers with autism spectrum disorders (e.g., Buggey, 2012; Buggey, Hoomes, Sherberger, & Williams, 2011; D’Ateno, Mangiapanello, & Taylor, 2003; Litras, Moore, & Anderson, 2010). For example, Litras et al. (2010) employed VSM to increase the social behaviour of a 3.5 year old with autism and limited social skills. There were increases across all three targeted social behaviours.
While VSM has been found to be a successful intervention with preschool age children with and without ASD, according to a review by Buggey and Ogle (2012) relatively little research has been conducted on the effectiveness of either VSM or VM with preschool children who exhibit problem behaviours, such as aggression toward peers. In one study, Green et al. (2013) used VM with four preschoolers with the aim of increasing their positive peer interactions. The two children who were shy and withdrawn showed increased positive peer interactions. However, the children who were disruptive and

• 69 •New Zealand Journal of Psychology Vol. 44 No. 2, September 2015
Using Video Self-Modeling
aggressive toward their peers showed variable effects. Furthermore, Clark et al. (1993) used a VSM intervention with six preschoolers who had been diagnosed with oppositional defiant disorder. They found that there were no effects of reduced aggression or increased compliance rates. These findings indicate that further research is needed to determine if VSM can be used effectively with preschoolers with externalizing behaviours (Buggey & Ogle, 2012).
In light of the importance of peer interactions in early childhood to assist in the development of social skills, some interventions have incorporated peers as intervention agents or confederates (Elliot & Gresham, 1993; Mathur & Rutherford, 1991). The inclusion of peers has been been found to be very effective at increasing social interaction rates in target children (Elliot & Gresham, 1993; Hendrickson, Strain, Tremblay, & Shores, 1982), as well as promoting positive social changes in isolated children (Strain, 1984), aggressive children (Strain, Shores, & Kerr, 1976) and students with ASD (Laushey & Heflin, 2000; Owen-DeSchryver, Carr, Cale & Blakeley-Smith, 2008). These interventions are considered to be more effective than teacher-mediated interventions, because peers might provide more immediate and natural reinforcement in social situations (Elliot et al., 2008; Mathur & Rutherford, 1991).
Therefore, one way to enhance the effectiveness of VSM and VM with preschoolers who are exhibiting problem behaviour is to make more use of the peer group. However, to date relatively little research on the combined use of VM/VSM and peers as confederates or intervention agents has been conducted. Sansosti and Powell-Smith (2008) used a VM intervention to increase the social communication skills of three boys aged 6 to 10 years (M = 8 years, 6 months) with diagnoses of autism spectrum disorder or pervasive developmental disorder. They found that while the VM package was effective, modifications were needed. In particular, for two of the boys, joining-in behaviour was observed to increase dramatically after peer confederates were included in the programme. Prior to the use of peer
confederates, the two boys had been using their new social communication skills appropriately, but their attempts were either refused or ignored. When peers were prompted to reciprocate to the target children’s joining-in behaviours, their rates improved. This study highlighted an important factor when implementing social skills interventions. In particular, as noted by Strain, Odom and McConnell (1984) it is not realistic to teach social skills in an unnatural context (e.g., in a one-to-one adult-directed teaching format) and expect successful implementation in a natural context. Therefore, it seems that although both VSM and VM have been shown to be effective social skills interventions for behaviours such as social initiations (Buggey, Hoomes, Sherberger & Williams, 2011) the incorporation of peers as participants may help facilitate the success of the intervention. This would be particularly relevant for those children who may have already established a negative peer reputation as a result of their externalizing behaviours.
This study examined the effects of a VSM intervention with a peer confederate component on a preschool child with a history of problem behaviours in the classroom with the aim to increase positive social interactions with peers. VSM interventions are based on the principles of social learning theory and therefore it is anticipated that upon viewing the video clips of himself seemingly initiating play with peers, engaging in positive communications and sustaining this play that the target child would independently engage in these positive social interactions with peers. The reinforcement in this situation was presumed to be the inclusion of a peer group both on the videos and during the viewing of the videos and verbal praise for engaging in these positive interactions. Repeated viewings of the video clips were intended to serve as opportunites to rehearse and practice the concepts being demonstrated and therefore was considered a useful way to increase the liklihood of the behaviours being performed by the target child. Furthermore, once the child started to engage in the positive interactions, a cycle of reciprocity is perhaps more likely to unfold.
The specific research question was whether a VSM social skills intervention, combined with the use of peer participants, would improve the social interactions of a preschooler with problem behaviours? To address this question, six video vignettes of the participant and peer confederates were created that depicted the participant successfully using three key social skills and the peer confederates responding positively to his attempts. The three sets of vignettes (i.e., two per social skill) were shown sequentially to the participant and peer confederates and data were collected on the participant’s use of the specific social skills depicted in the videos.
Method
Ethical approval and informed consent
The relevant university ethics committee approved the study and school, parental and teacher consent were obtained for the participant. In addition, although the participant was unable to provide consent due to his age, he seemed to give his assent to participate in the VSM activities as evidenced by his willingness to accompany the researcher and watch the videos.
ParticipantThe participant, Tyler (pseudonym)
was a male, aged 4 years 9 months. He was a native English speaker and had been attending his current preschool for 6 months at the time of the study. An interview with the participant’s mother revealed that a significant medical procedure in infancy had resulted in motor and speech delays between 2 and 4 years of age, for which he received therapy. According to the parent, a recent assessment of his speech and motor development by a speech-language therapist indicated that he was now within the normal range and no longer met criteria for specialised support. However, the parent and head teacher expressed concerns about Tyler’s social communication skills. They also reported that he had difficulty playing cooperatively with other children and had not developed any friendships at the centre, despite attending for the past
New Zealand Journal of Psychology Vol. 44 No. 2, September 2015• 70 •
K. H. Lemmon, V. A. Green
6 months. In addition, the head teacher had concerns about his aggressive and defiant behaviour. The teacher reported that there were usually several instances a week in which Tyler engaged in aggressive behaviour towards peers and staff.
Prior to starting the baseline observations, Tyler’s teacher completed the Social Skills Improvement System Behavior Rating Scales-Teacher (SSIS; Gresham & Elliot, 2008). The SSIS is a norm-referenced scale that includes four major scales: social skills, behavior problems, autism spectrum and academic competence. While the SSIS is technically sound and has strong internal reliability, there are concerns with the autism spectrum subscale and that key behavioural disturbances are not well-represented (Doll & Jones, 2010; Lee-Farmer & Meikamp, 2010). Therefore, the scores in the autism spectrum and problem behaviour scales were interpreted with caution. Tyler scored in the 2nd percentile for Social Skills (Standard Score = 67) and in the 78th percentile (Standard Score = 113) for Problem Behaviors on the SSIS. He also scored in the “above average” range for the autism spectrum scale, indicating that he did not appear to meet the cut-off for having autism spectrum disorder.
In addition, the teacher completed the communication and socialization domains, and the maladaptive behaviour index of the Vineland Adaptive Behavior Scales, second edition (Vineland-II; Sparrow, Cicchetti, & Balla, 2005). The Vineland-II is an adaptive behaviour measure designed to assess the personal, social, and behavioural functioning of individuals with and without disabilities from birth to adulthood (Gerhardt & Mayville, 2010) Tyler’s scores on the communication subdomains varied, with his receptive and written communication scores in the moderately high to high levels and his expressive communication score in the low level. Therefore, although his standard score and percentile rank fell within the “adequate” range on the communication subdomain, when the individual subdomain scores are considered, his communication score represent a skewed profile. His socialization subdomain scores were rated as low to moderately low, resulting
in a standard score of 68 and percentile rank of 2, which is considered to represent a mild deficit. Tyler’s score on the maladaptive behaviour index was “average”, although he showed elevated levels for both externalizing and internalising behaviours.
In summary, Tyler was selected as the participant in this study due to the concerns expressed about his behaviour in the preschool setting. Particularly, the aggressive behaviours the preschool teacher’s were seeing multiple times per week and his lack of friendship/social skills. These concerns were further evident in his scores on the Vineland-II and the SSIS.
Setting and PersonnelObservational data of the particpant
were collected at his preschool, which was located in an urban centre in New Zealand. The student-teacher ratios throughout the sessions ranged from 9:1 to 6:1. Sessions ran Monday through Friday from 8:30 am to 3:30 pm and consisted of multiple structured and unstructured activity times. During unstructured activity times, children were able to choose between a number of craft, science, pretend and outdoor activities and had the opportunity to move between them freely. There was also a morning tea and lunchtime in each session during which all of the children ate together at the same time around a large mat. The study was implemented by a Master of Educational Psychology student (first author). An independent observer was present during a third of the observations to collect inter-observer agreement data and to conduct procedural integrity checks.
Dependent VariablesThree dependent variables were
defined based on the social skills literature and from three hours of pre-baseline observations of the participant. Given that the aim of the intervention was to improve the participant’s positive social interactions with peers, three key social skills were targeted: (a) inviting others to play, (b) engaging in positive communications, and (c) sustaining interactions with peers. The definitions for these dependent variables were partially derived from definitions used in the Litras et al. (2010) study. The
first was making an invitation to play (MIP) and was defined as the target child using one or more intelligible phrases while positioned within one metre of a peer to express his desire to play. An example of this behaviour in the preschool setting was: Tyler is shooting hoops. Another child walks up to the hoop and Tyler says, “Want a turn?” A non-example of what this would look like in the preschool setting is: Tyler is building towers of blocks and then knocking them down. He sees another child is watching. He builds a tower and knocks it down while looking at the child, but doesn’t interact. The child then moves away.
The second dependent variable was positive communication (PC) and was defined as the target child making an intelligible vocal utterance clearly directed toward a peer, as evidenced by use of their name, body orientation focused towards them, or an attention-seeking gesture such as arm tapping or pointing. PC included making statements, asking questions, acknowledging a verbal statement by another with a head nod or saying “Hmm,” answering a question, responding with a related comment about observable objects or an event within an ongoing activity, and confirming or clarifying a question or comment, such as saying, “What did you say?”. An example of this behaviour in a preschool setting is: Tyler is riding a bike and comes upon another child riding a scooter. Tyler says, “Watch out!” as he passes the child on the scooter. Non-examples of PC included vocal utterances the child makes while playing with objects or walking around that are directed to no one in particular or are repetitive in nature, such as humming. Also, utterances that are angry or defiant are not examples of PC.
The final dependent variable was sustained social interaction (SI) and was defined as the target child being engaged or interacting with another person. SI included self-initiated interactions or other interactions in a play activity, such as cooperative play, imaginative play, physical play, or playing with musical instruments to create a shared song or rhythm. An example of SI in a preschool setting is: Tyler is working with another child to build a marble
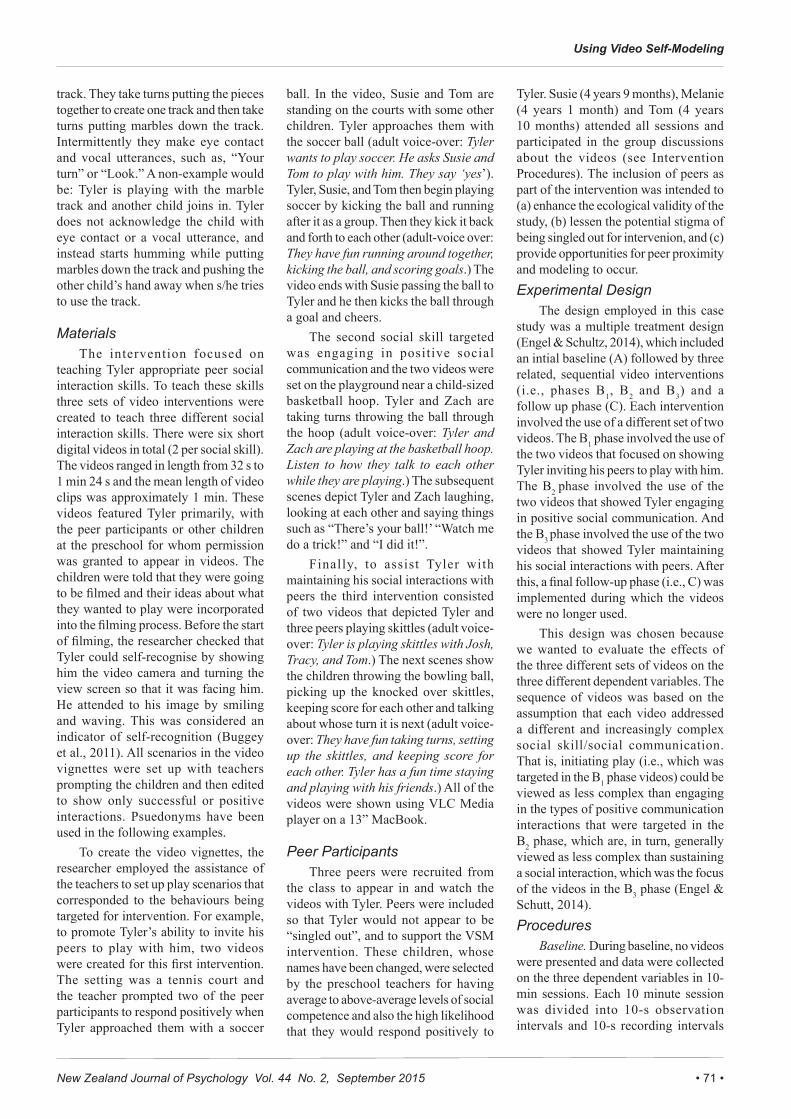
• 71 •New Zealand Journal of Psychology Vol. 44 No. 2, September 2015
Using Video Self-Modeling
track. They take turns putting the pieces together to create one track and then take turns putting marbles down the track. Intermittently they make eye contact and vocal utterances, such as, “Your turn” or “Look.” A non-example would be: Tyler is playing with the marble track and another child joins in. Tyler does not acknowledge the child with eye contact or a vocal utterance, and instead starts humming while putting marbles down the track and pushing the other child’s hand away when s/he tries to use the track.
Materials The intervention focused on
teaching Tyler appropriate peer social interaction skills. To teach these skills three sets of video interventions were created to teach three different social interaction skills. There were six short digital videos in total (2 per social skill). The videos ranged in length from 32 s to 1 min 24 s and the mean length of video clips was approximately 1 min. These videos featured Tyler primarily, with the peer participants or other children at the preschool for whom permission was granted to appear in videos. The children were told that they were going to be filmed and their ideas about what they wanted to play were incorporated into the filming process. Before the start of filming, the researcher checked that Tyler could self-recognise by showing him the video camera and turning the view screen so that it was facing him. He attended to his image by smiling and waving. This was considered an indicator of self-recognition (Buggey et al., 2011). All scenarios in the video vignettes were set up with teachers prompting the children and then edited to show only successful or positive interactions. Psuedonyms have been used in the following examples.
To create the video vignettes, the researcher employed the assistance of the teachers to set up play scenarios that corresponded to the behaviours being targeted for intervention. For example, to promote Tyler’s ability to invite his peers to play with him, two videos were created for this first intervention. The setting was a tennis court and the teacher prompted two of the peer participants to respond positively when Tyler approached them with a soccer
ball. In the video, Susie and Tom are standing on the courts with some other children. Tyler approaches them with the soccer ball (adult voice-over: Tyler wants to play soccer. He asks Susie and Tom to play with him. They say ‘yes’). Tyler, Susie, and Tom then begin playing soccer by kicking the ball and running after it as a group. Then they kick it back and forth to each other (adult-voice over: They have fun running around together, kicking the ball, and scoring goals.) The video ends with Susie passing the ball to Tyler and he then kicks the ball through a goal and cheers.
The second social skill targeted was engaging in positive social communication and the two videos were set on the playground near a child-sized basketball hoop. Tyler and Zach are taking turns throwing the ball through the hoop (adult voice-over: Tyler and Zach are playing at the basketball hoop. Listen to how they talk to each other while they are playing.) The subsequent scenes depict Tyler and Zach laughing, looking at each other and saying things such as “There’s your ball!’ “Watch me do a trick!” and “I did it!”.
Finally, to assist Tyler with maintaining his social interactions with peers the third intervention consisted of two videos that depicted Tyler and three peers playing skittles (adult voice-over: Tyler is playing skittles with Josh, Tracy, and Tom.) The next scenes show the children throwing the bowling ball, picking up the knocked over skittles, keeping score for each other and talking about whose turn it is next (adult voice-over: They have fun taking turns, setting up the skittles, and keeping score for each other. Tyler has a fun time staying and playing with his friends.) All of the videos were shown using VLC Media player on a 13” MacBook.
Peer ParticipantsThree peers were recruited from
the class to appear in and watch the videos with Tyler. Peers were included so that Tyler would not appear to be “singled out”, and to support the VSM intervention. These children, whose names have been changed, were selected by the preschool teachers for having average to above-average levels of social competence and also the high likelihood that they would respond positively to
Tyler. Susie (4 years 9 months), Melanie (4 years 1 month) and Tom (4 years 10 months) attended all sessions and participated in the group discussions about the videos (see Intervention Procedures). The inclusion of peers as part of the intervention was intended to (a) enhance the ecological validity of the study, (b) lessen the potential stigma of being singled out for intervenion, and (c) provide opportunities for peer proximity and modeling to occur.Experimental Design
The design employed in this case study was a multiple treatment design (Engel & Schultz, 2014), which included an intial baseline (A) followed by three related, sequential video interventions (i.e., phases B1, B2 and B3) and a follow up phase (C). Each intervention involved the use of a different set of two videos. The B1 phase involved the use of the two videos that focused on showing Tyler inviting his peers to play with him. The B2 phase involved the use of the two videos that showed Tyler engaging in positive social communication. And the B3 phase involved the use of the two videos that showed Tyler maintaining his social interactions with peers. After this, a final follow-up phase (i.e., C) was implemented during which the videos were no longer used.
This design was chosen because we wanted to evaluate the effects of the three different sets of videos on the three different dependent variables. The sequence of videos was based on the assumption that each video addressed a different and increasingly complex social skill/social communication. That is, initiating play (i.e., which was targeted in the B1 phase videos) could be viewed as less complex than engaging in the types of positive communication interactions that were targeted in the B2 phase, which are, in turn, generally viewed as less complex than sustaining a social interaction, which was the focus of the videos in the B3 phase (Engel & Schutt, 2014). Procedures
Baseline. During baseline, no videos were presented and data were collected on the three dependent variables in 10-min sessions. Each 10 minute session was divided into 10-s observation intervals and 10-s recording intervals
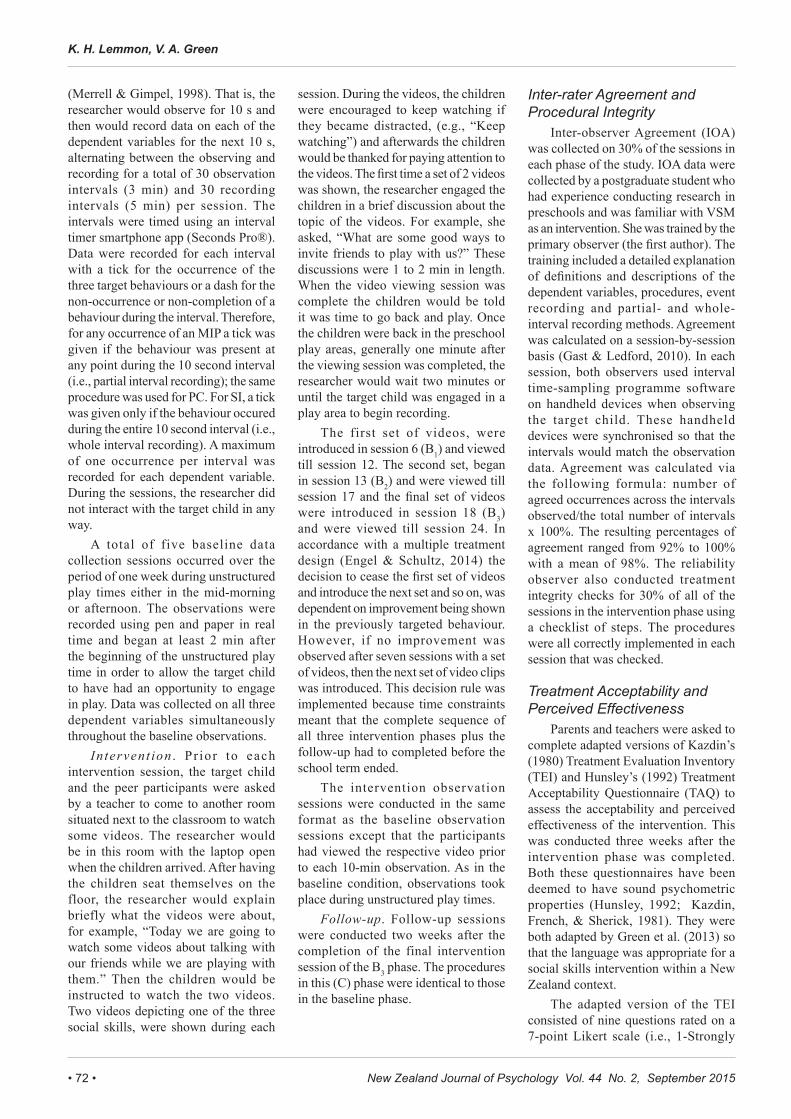
New Zealand Journal of Psychology Vol. 44 No. 2, September 2015• 72 •
K. H. Lemmon, V. A. Green
(Merrell & Gimpel, 1998). That is, the researcher would observe for 10 s and then would record data on each of the dependent variables for the next 10 s, alternating between the observing and recording for a total of 30 observation intervals (3 min) and 30 recording intervals (5 min) per session. The intervals were timed using an interval timer smartphone app (Seconds Pro®). Data were recorded for each interval with a tick for the occurrence of the three target behaviours or a dash for the non-occurrence or non-completion of a behaviour during the interval. Therefore, for any occurrence of an MIP a tick was given if the behaviour was present at any point during the 10 second interval (i.e., partial interval recording); the same procedure was used for PC. For SI, a tick was given only if the behaviour occured during the entire 10 second interval (i.e., whole interval recording). A maximum of one occurrence per interval was recorded for each dependent variable. During the sessions, the researcher did not interact with the target child in any way.
A total of five baseline data collection sessions occurred over the period of one week during unstructured play times either in the mid-morning or afternoon. The observations were recorded using pen and paper in real time and began at least 2 min after the beginning of the unstructured play time in order to allow the target child to have had an opportunity to engage in play. Data was collected on all three dependent variables simultaneously throughout the baseline observations.
In tervent ion . Pr ior to each intervention session, the target child and the peer participants were asked by a teacher to come to another room situated next to the classroom to watch some videos. The researcher would be in this room with the laptop open when the children arrived. After having the children seat themselves on the floor, the researcher would explain briefly what the videos were about, for example, “Today we are going to watch some videos about talking with our friends while we are playing with them.” Then the children would be instructed to watch the two videos. Two videos depicting one of the three social skills, were shown during each
session. During the videos, the children were encouraged to keep watching if they became distracted, (e.g., “Keep watching”) and afterwards the children would be thanked for paying attention to the videos. The first time a set of 2 videos was shown, the researcher engaged the children in a brief discussion about the topic of the videos. For example, she asked, “What are some good ways to invite friends to play with us?” These discussions were 1 to 2 min in length. When the video viewing session was complete the children would be told it was time to go back and play. Once the children were back in the preschool play areas, generally one minute after the viewing session was completed, the researcher would wait two minutes or until the target child was engaged in a play area to begin recording.
The first set of videos, were introduced in session 6 (B1) and viewed till session 12. The second set, began in session 13 (B2) and were viewed till session 17 and the final set of videos were introduced in session 18 (B3) and were viewed till session 24. In accordance with a multiple treatment design (Engel & Schultz, 2014) the decision to cease the first set of videos and introduce the next set and so on, was dependent on improvement being shown in the previously targeted behaviour. However, if no improvement was observed after seven sessions with a set of videos, then the next set of video clips was introduced. This decision rule was implemented because time constraints meant that the complete sequence of all three intervention phases plus the follow-up had to completed before the school term ended.
The intervention observation sessions were conducted in the same format as the baseline observation sessions except that the participants had viewed the respective video prior to each 10-min observation. As in the baseline condition, observations took place during unstructured play times.
Follow-up. Follow-up sessions were conducted two weeks after the completion of the final intervention session of the B3 phase. The procedures in this (C) phase were identical to those in the baseline phase.
Inter-rater Agreement and Procedural Integrity
Inter-observer Agreement (IOA) was collected on 30% of the sessions in each phase of the study. IOA data were collected by a postgraduate student who had experience conducting research in preschools and was familiar with VSM as an intervention. She was trained by the primary observer (the first author). The training included a detailed explanation of definitions and descriptions of the dependent variables, procedures, event recording and partial- and whole-interval recording methods. Agreement was calculated on a session-by-session basis (Gast & Ledford, 2010). In each session, both observers used interval time-sampling programme software on handheld devices when observing the target child. These handheld devices were synchronised so that the intervals would match the observation data. Agreement was calculated via the following formula: number of agreed occurrences across the intervals observed/the total number of intervals x 100%. The resulting percentages of agreement ranged from 92% to 100% with a mean of 98%. The reliability observer also conducted treatment integrity checks for 30% of all of the sessions in the intervention phase using a checklist of steps. The procedures were all correctly implemented in each session that was checked.
Treatment Acceptability and Perceived Effectiveness
Parents and teachers were asked to complete adapted versions of Kazdin’s (1980) Treatment Evaluation Inventory (TEI) and Hunsley’s (1992) Treatment Acceptability Questionnaire (TAQ) to assess the acceptability and perceived effectiveness of the intervention. This was conducted three weeks after the intervention phase was completed. Both these questionnaires have been deemed to have sound psychometric properties (Hunsley, 1992; Kazdin, French, & Sherick, 1981). They were both adapted by Green et al. (2013) so that the language was appropriate for a social skills intervention within a New Zealand context.
The adapted version of the TEI consisted of nine questions rated on a 7-point Likert scale (i.e., 1-Strongly
• 73 •New Zealand Journal of Psychology Vol. 44 No. 2, September 2015
Using Video Self-Modeling
Disagree to 7-Strongly Agree). For example, “I have noticed a change in my child’s social skills”. The adapted version of the TAQ had four questions for parents and five for teachers. For example, “How acceptable was the social skills programme used in the preschool?” (1-Very Unacceptable to 7-Very Acceptable) and “How ethical was the social skills programme used in the preschool?” (1-Unethical to 7-Ethical). There was also an open-ended question which asked for any comments about the intervention or the child’s social behaviour.
Results
Baseline and InterventionFigure 1 shows the percentage
of intervals in which MIP behaviour was observed during each session of the study and it is evident that during baseline Tyler did not exhibit any MIP behaviour. With the introduction of the first video intervention there was a slight increase during the first session and again during the 5th session. However, MIP remained at low levels throughout all the intervention phases. Despite these low overall levels it is important to note that of the 18 intervention sessions, Tyler had 10 sessions in which he did initiate play with peers at least one time, which was markedly different behaviour to what was displayed during baseline. Anecdotal comments from the teacher indicated that Tyler was approaching peers more than he had before and using functional strategies to get their attention, gain entry, or invite someone to play with him. Tyler’s method of initiating play interactions was varied, particularly as according to his teacher, Tyler did not use the same phrases that were depicted in the video. The range of phrases he was using could have been as a result of participating in the short group discussions. These were conducted upon the first viewing of the B1 videos and may have also contributed to this success, as the researcher did ask the children to give examples of how they could initiate play with others and discussed some simple scenarios. This indicates that including peers in the sessions was effective for not only modeling social behaviour and
providing proximity to peers, but also in extending the behaviour.
As can be seen in Figure 2, Tyler ’s positive communications during baseline ranged from 0% to 18%. With the introduction of the first intervention videos there was an
unexpected spike in the percentage of positive communications, however they dropped back to between 5% and 22% of intervals for the remainder of the first intervention phase. During the second set of videos that focused specifically on positive social communication (B2), there was an overall increase in the percentage of intervals in which PC occurred (the range was from 10% to 40%). PC continued to increase throughout the remainder of the study. During this phase there was anecdotal
evidence of some improvement in Tyler’s status among his peers. For example, one of the peer participants and another boy had been actively seeking Tyler out for play and were telling the teachers and others and they were “Tyler’s friends.”
As with the previous two dependent variables, Tyler’s ability to sustain interactions with his peers was low during baseline (between 0 and 10% of the intervals). However, when the first set of videos were introduced (B1) there was a spike in the percentage of intervals where he had been able to maintain social interactions with peers and also some evidence of SI during the second set of videos (B2). The third set of videos that focused specifically on maintaining social interactions (B3)
Figure 1. Percentage of intervals with an occurrence of Making an Invitation to Play within each session
Figure 2. Percentage of intervals with an occurrence of Positive Communication within each session

New Zealand Journal of Psychology Vol. 44 No. 2, September 2015• 74 •
K. H. Lemmon, V. A. Green
were introduced during session 18, because it was evident that Tyler’s PC had shown steady improvement. The percentage of intervals in which he had sustained interactions with peers ranged from 30% to 60% over the course of this intervention. The field notes show
that in the 22nd session, Tyler was playing with four other children at the woodworking table. During this session he shared tools and toys with ease and he continually made the others laugh by the way he was playing with the toys and tools at the table. During the middle of this session, a teacher came and called all of the children away except Tyler.
It was interesting to note that, i), his scores would have been even higher for this session (as they were already the highest they had been for PC and SI since the initial spike) and ii), that when the children left, Tyler did not remain at the table, but went in search of others
to play with. Follow-up data was collected
three weeks after the end of the 3rd intervention. In these sessions, the conditions were identical to those during the baseline and intervention phases, however the video interventions were not re-introduced. The results from
Figures 1 and 2 in particular, indicate that Tyler was not only maintaining the gains he had achieved at the end of the 3rd intervention phase, but was continuing to show improvement in his positive communications and sustained interactions. The field notes show that during the final session he approached a boy playing in the sandpit and joined in the boy’s game of burying his truck. The boys had a good deal of discussion about their play and it was clear to the researcher and the teacher supervising the outdoor area at the time that Tyler was responding well to his peers, even when at times it seemed that he was confused or frustrated by their responses to him. Tyler was observed by his teacher to be playing with the other children more than he had been before the start of the intervention and to be interacting in more meaningful, positive ways.
Treatment Acceptability and Perceived Effectiveness
Results from the TEI (Table 1) suggested that the parents and teachers believed that Tyler had learned and benefitted from participating in the intervention. The TAQ data showed that the intervention was considered to be highly ethical and effective. The individual scores for the four positively worded questions were all within the 5-7 range (acceptable to very acceptable range).
Table 1. Mean and Standard Deviation Scores from the Treatment Evaluation Inventory
Parent and Teacher Responses Combined
Question X(N = 3)
SD
1. Child now plays appropriately 4.67 0.58
2. Child can apply what he learnt 4.33 0.58
3. There has been a change in this social skills 5.33 0.58
4. Child looked forward to the programme 3.33 1.15
5. Child gained new information about how to play with other children 4.67 0.58
6. I am glad that the child participated in the programme 6.00 0.00
7. I anticipate that child will react differently in social situations 5.00 1.00
8. Child seemed to enjoy the programme 4.33 2.08
9. Child found the programme interesting 5.00 1.00
Figure 3. Percentage of intervals with an occurrence of Sustained Interaction within each session

• 75 •New Zealand Journal of Psychology Vol. 44 No. 2, September 2015
Using Video Self-Modeling
DiscussionThis study examined the effects
of a VSM intervention aided by the inclusion of peer confederates on the social skills of a preschooler who exhibited externalizing behaviours. It was hypothesized that the VSM intervention would be more likely to be successful by including peers in the viewing sessions. The results showed that although there was a steady and positive increase in the dependent variables from baseline to follow-up, there was some variation throughout the intervention. The initial increases in all three dependent variables upon the showing of the first intervention are somewhat similar to the findings in the Litras et al. (2010) study, in that the target social skills all increased upon the very first viewing of the video clips. Also, the first two dependent variables in the Litras et al. study were “greetings” and “invitations”, and showed variation throughout the study similar to the MIP variable in the current study. Part of the reason for this could be that there is less opportunity for greetings and initiating play during sessions and more opportunities for communication, interaction, and responding.
One of the prime advantages of conducting a social skills intervention in a preschool setting is the possibility of “spill-over effects”. When peers are encouraged to interact with target children, their behaviours may influence untrained peers to interact more frequently and in similar ways with the target children (Kohler & Fowler, 1985). This was the case in studies conducted by Cooke and Apolloni (1976) and Owen-DeSchryver et al. (2008). In the latter study, a small group of peers were trained to socially interact with children with autism. The intervention increased the initiations of both the trained peers and the children with autism. However, the researchers noted that untrained peers also showed increased initiations as a result of the intervention. Kohler and Fowler (1985) surmise this “spill-over” effect may occur because the social behaviours of young children are interdependent. That is, modifying the behaviour of one child should have an effect on the peers who interact with this child. These effects were observed anecdotally about one week after the
intervention phase of the current study was introduced. It was noted throughout the intervention, by the teacher that the peer participants were more likely to be receptive to Tyler’s play initiations and more tolerant of his social difficulties than they had been previously, and more than other peers in general. This seemed to encourage other peers to interact with Tyler in a positive way.
At certain times, each of the peer participants were observed encouraging other peers to include Tyler or to tolerate his aggressive and/or disruptive behaviours. This was particularly important for addressing Tyler’s social behaviours with his peers. When there has been a history of negative behaviours, such as aggression or non-responsiveness toward peers, Strain et al. (1984) have stated that the target child may have difficulty eliciting positive responses to his or her newly learned social skills. In these cases, they recommend that the intervention take place with the peer group. Walker and Irving (1998) concur, stating that including the peer group in a preschool social skills intervention is vital to overcoming the barrier of negative peer perceptions and promoting successful social interact ions. Using peer participants in this case seems to have been helpful in influencing Tyler’s peers to be more accepting of him. Of course, this was only observed anecdotally, and formal data collection on such behaviours would be more indicative of these effects. In future studies these interactions could be formally measured possibly through teacher observations of approaches and interactions initiated by peers toward the target child.
Thus the inclusion of peers as part of the intervention may have added to the success of this study. It appears that this type of intervention, specifically including peers in VSM videos and viewing sessions, has not been conducted before with this age group. Although peer training and buddy systems have been conducted with preschoolers (e.g., Kohler, Greteman, Raschke, & Highnam, 2007; Laushey & Heflin, 2000), these studies did not employ VSM. In the current study, peer participants, along with the target child, were made to feel that they were all equal participants in the intervention.
At no point did the peers indicate that the intervention was directed toward Tyler specifically, even though he was featured prominently in the video clips. Tyler’s enjoyment of spending time with the small group to watch the video clips was evident in the way that he smiled and laughed with his peers as they walked to the viewing room together to view the video clips.
Bandura (1977) postulated that the best way to ensure a child attends to a model is to have the model be as similar to the target child as possible. In VSM, the target child is depicted as competent in these target behaviours, which should not only enhance motivation and attention, but also foster a belief in the individual’s self-efficacy (Bellini & Akullian, 2007). This appeared to be the case for Tyler. He was very motivated to watch the videos and his enthusiasm for the content of the videos was evident in his expressions and positive vocal statements about his performance in the videos.
Measur ing and conduc t ing interventions on social skills is inherently complex due to the reciprocal nature and inter-relatedness of social behaviours (Tremblay, Strain, Hendrickson, & Shores, 1981). Although this study was designed with three dependent variables that were functionally similar yet also different (Gast & Ledford, 2010), the interaction of the three variables was evident in the results obtained. Initiating play, communicating positively with peers, and sustaining social interactions, are all separate behaviours, however, a change in one is very likely to bring about a change in the others. For example, the day that Tyler asked Melanie to play soccer and Melanie agreed, a number of communicative and interactive behaviours took place as a result of the very first behaviour, causing an elevation to all behaviours. If Tyler had been unsuccessful in his attempts to initiate play, initially his results might have conformed to the multiple treatment design quite neatly. However, without the reinforcing experiences of having peers agree to play and then communicating and interacting with him, he probably would not have continued making attempts. So while, the data did not conform perfectly to the multiple treatment design, it did

New Zealand Journal of Psychology Vol. 44 No. 2, September 2015• 76 •
K. H. Lemmon, V. A. Green
show that Tyler was exhibiting increases in his social behaviour and that he was experiencing natural reinforcement as a result.
There is also a distinct possibility that the VSM intervention including peer discussions had a positive effect on Tyler’s language ability, which in turn may have helped to reduce his aggressive behaviour and improve his positive behaviour and social interactions with peers. Viewing his successful verbal interactions on screen and verbally interacting with his peers may have reinforced his skills and increased his sense of confidence and self-efficacy. There is some evidence in the literature that demonstrates the positive impact that video self modeling can have on language development. In particular Whitlow and Buggey (2003) used VSM to effectively improve a preschool child’s language delay. However, additional replications of the current study are required including pre and post language assessments to more accurately determine the possible link between a reduction in behavioural problems and possible improvements in pragmatic language.
The social validity of this study was evident in the positive responses from the parent and teachers to the TEI and the TAQ. However, there were some limitations to this preliminary study that should be considered. First, as it is case study it cannot be generalized to other children or locations, however case studies are useful for testing hypotheses about the conditions necessary for successful interventions. Another limitation was that by employing a multiple treatment design it is difficult to eliminate carry-over effects (Engel & Schultz, 2014). For example, all three behaviours showed a spike after the first viewing of the first set of videos. Although typically the behaviours targeted for intervention should be functionally independent, the current design was implemented in part because social behaviours are inter-related. It follows that an intervention targeting one particular skill will possibly effect a change in the related social skills (Elliot & Gresham, 1993). Therefore it was not surprising that when Tyler initiated play with a peer that his communication and social interaction scores also went up. It
is also plausible that it was a cumulative effect of all three sets of videos that resulted in Tyler’s overall improvement as it provided him with a complete set of inter-related skills.
Another limitation with the design is that is not possible to rule out maturation as a possible confounding variable in this intervention, as the preschool years are a time of intense cognitive and social-emotional development (Engel & Schultz, 2014; McCabe & Altamura, 2011). Tyler’s teachers and the author all noticed that Tyler’s language improved during the time of the intervention and follow-up phases. He was also observed to gain greater control over his emotions as he was having less angry outbursts, all of which may have been due to the intervention and his increased opportunities to engage with and learn from his peers.
Another limitation was that the peer participants did not seem to like watching the same videos more than twice and were vocal in their discontent. Tyler seemed very happy to watch the videos repeatedly, most likely because he was featured prominently in each video. Even though the peer participants were also featured in the videos, they did not seem as interested. Their complaints distracted from the video viewing at times, although they were prompted to keep watching. So while their participation most likely augmented the effects of the VSM intervention, there were some complications with their involvement as well.
Future research could include the use of an explicit, tangible reinforcer (e.g., a sticker) for watching the videos, to encourage the peer participants to watch the same videos more than three or four times without complaining. In addition, it would have been useful to include post-intervention assessments to further confirm that the study did in fact have a meaningful effect on the participant’s social behaviour, and that his problem behaviours were reduced. Finally, it is recommended that sociometric assessments be employed in addition to the standardised assessments used in this study. While it was helpful to see and hear anecdotally that the participant’s relations with his peers showed improvement, sociometric assessments would have provided a
stronger indication of improvement.Addressing the social skills deficits
in preschoolers is highly important to their overall development. The preschool years are an ideal time to address such deficits as preschools provide curricula and settings that are likely to support and foster social skills improvement (Green et al., 2013). The results of this study show that VSM combined with the use of peer participants appeared to be somewhat effective at increasing social behaviours in a preschooler who exhibited aggressive and disruptive behaviours towards his peers and teaching staff.
ReferencesBallard, K. D., & Crooks, T. J. (1984).
Videotape modeling for preschool children with low levels of social interaction and low peer involvement in play. Journal of Abnormal Child Psychology, 12(1), 95-110.
Bandura, A. (1977). Social learning theory. Englewood Cliffs, NJ: Prentice Hall.
Bellini, S. & Akullian, J. (2007). A meta-analysis of video modeling and video self-modeling interventions for children and adolescents with autism spectrum disorders. Exceptional Children, 73(3), 264-287.
Brown, W. H., Odom, S. L., & Conroy, M. A. (2001). An intervention hierarchy for promoting young children’s peer interactions in natural environments. Topics in Early Childhood Special Education, 21(3), 162-175.
Buggey, T. (2012). Effectiveness of video self-modeling to promote social initiations by 3-year-olds with autism spectrum disorders. Focus on Autism and Other Developmental Disabilities, 27(2), 102-110.
Buggey, T. Hoomes, G., Sherberger, M. E., & Williams, S. (2011). Facilitating social initiations of preschoolers with autism spectrum disorders using video self-modeling. Focus on Autism and Other Developmental Disabilities, 26(1), 25-36.
Buggey, T., & Ogle, L. (2012). Video self-modeling. Psychology in the Schools, 49(1), 52-70.
Clark, E., Beck, D., Sloane, H., Jenson, W., Bowen, J., Goldsmith, D. & Kehle, T. (1993). Self-modeling with preschoolers: Is it different? School Psychology International, 14(1), 83-89.
Cooke, T. P., & Apolloni, T. (1976). Developing positive social-emotional behaviors: A study of training and
• 77 •New Zealand Journal of Psychology Vol. 44 No. 2, September 2015
Using Video Self-Modeling
generalization effects. Journal of Applied Behavior Analysis, 9(1), 65-78.
D’Ateno, P., Mangiapanello, K., & Taylor, B. A. (2003). Using video modeling to teach complex play sequences to a preschooler with autism. Journal of Positive Behavior Interventions, 5(1), 5-11.
Doll, B., & Jones, K. (2010). Review of the social skills improvement system rating scales. In R. A. Spies, J. F., Carlson, & K. F. Geisinger (Eds.), The 18th Mental Measurements Yearbook (pp. 561-565). Lincoln, NE: Buros Institute of Mental Measurements.
Dowrick, P. W. (1999). A review of self modeling and related interventions. Applied and Preventive Psychology, 8(1), 23-39.
Engel, R. J. & Schutt, R. K. (2014). Fundamentals of social work research (2nd ed.). Thousand Oaks, CA: Sage Publication Inc.
Elliot, S. N., & Gresham, F. M. (1993). Social skills interventions for children. Behavior Modification, 17(3), 287-313.
Elliot, S. N., Roach, A. T., & Beddow III, P. A. (2008). Best practices in preschool social skills training. In A. Thomas & J. Grimes (Eds.), Best practices in school psychology V (pp. 1531-1546). Bethesda, MA: National Association of School Psychology.
Gerhardt, P.F., & Mayville, E. (2010). Assessment of social skills and social competence in learners with autism spectrum disorders. In D. W. Nangle, D. J. Hansen. C. A. Erdley, & P.J. Norton (Eds.) Practioner’s guide to empirically based measures of social skills (pp. 193-206). New York: Springer.
Gast, D., & Ledford, J. (2010). Multiple baseline and multiple probe designs. In D. Gast & J. Ledford (Eds.), Single subject research methodology in behavioral sciences (pp. 276-328). New York, NY: Routledge.
Girolametto, L., & Weitzman, E. (2007). Promoting peer interaction skills: Professional development for early childhood educators and preschool teachers. Topics in Language Disorders, 27(2), 93-110.
Green, V. A., Drysdale, H., Boelema, T., Smart, E., van der Meer, L., Achmadi, D., … Lancioni, G. (2013). Use of video modeling to increase positive peer interactions of four preschool children with social skills difficulties. Education and Treatment of Children, 36(2), 59-85.
Gresham, F. M., & Elliot, S. N. (2008). Social Skills Improvement Rating System: Rating Scales. Bloomington, MN: Pearson Assessments.
Guralnick, M. J. (1993). Developmentally appropriate practice in the assessment and intervention of children’s peer relations. Topics in Early Childhood Special Education, 13(3), 344-371.
Hendrickson, J. M., Strain, P. S., Tremblay, A., & Shores, R. E. (1982). Interactions of behaviorally handicapped children: Functional effects of peer social initiations. Behavior Modification, 6(3), 323-353.
Hunsley, J. (1992). Development of the treatment acceptability questionnaire. Journal of Psychopathology and Behavioral Assessment, 14(1), 55-64.
January, A. M., Casey, R. J., & Paulson, D. (2011). A meta-analysis of classroom-wide interventions to build social skills: Do they work? School Psychology Review, 40(2), 242-256.
Kazdin, A. E. (1980). Acceptability of alternative treatments for deviant child behavior. Journal of Applied Behavior Analysis, 13(2), 259-273.
Kazdin, A E., French, N. H., & Sherick, R. B. (1981). Acceptability of alternative treatments for children: Evaluation by inpatient children, parents, and staff. Journal of Consulting and Clinical Psychology, 49(6), 900-907.
Kehle, T. J., Bray, M. A., Margiano, S. G., Theodore, L. A., & Zhou, Z. (2002). Self-modeling as an effective intervention for students with serious emotional disturbance: Are we modifying children’s memories? Psychology in the Schools, 39(2), 203-207.
Keller, M. F., & Carlson, P. M. (1974). The use of symbolic modeling to promote social skills in preschool children with low levels of social responsiveness. Child Development, 45(4), 912-917.
Koegel, L. K., Koegel, R. L., Hurley, C. & Frea, W. D. (1992). Improving social skills and disruptive behavior in children with autism through self-management. Journal of Applied Behavior Analysis, 25(2), 341-353.
Kohler, F. W., & Fowler, S. A. (1985). Training prosocial behaviors in young children: An analysis of reciprocity with untrained peers. Journal of Applied Behavior Analysis, 18(3), 187-200.
Kohler, F. W., Greteman, C., Raschke, D., & Highnam, C. (2007). Using a buddy skills package to increase the social interaction between a preschooler with autism and her peers. Topics in Early Childhood Special Education, 27(3), 155-163.
Ladd, G. W. (1990). Having friends, keeping friends, making friends, and being liked by peers in the classroom: Predictors of children’s early school adjustment? Child
Development, 61(4), 1081-1100.Laushey, K. M., & Heflin, L. J. (2000).
Enhancing social skills of kindergarten children with autism through the training of multiple peers as tutors. Journal of Autism and Developmental Disorders, 30(3), 183-193.
Lee-Farmer, J., & Meikamp, J. (2010). Review of the social skills improvement system rating scales. In R.A. Spies, K.F. Geisinger, & J.F. Carlson (Eds.), The 18th Mental Measurements Yearbook. Lincoln, NE: Buros Institute of Mental Measurements.
Litras, S., Moore, D. W., & Anderson, A. (2010). Using video self-modelled social stories to teach social skills to a young child with autism. Autism Research and Treatment. doi: 10.1155/2010/834979
Mathur, S. R., & Rutherford, R. B. (1991). Peer-mediated interventions promoting social skills of children and youth with behavioral disorders. Education and Treatment of Children, 14(3), 227-242.
McCabe, P. C., & Altamura, M. (2011). Empirically valid strategies to improve social and emotional competence of preschool children. Psychology in the Schools, 48(5), 513-540.
Merrell, K. W., & Gimpel, G. A. (1998). Social skills of children and adolescents: Conceptualization, assessment, and treatment. Mahwah, NJ: Lawrence Erlbaum Associates.
O’Shaughnessy, T. E., Lane, K. L., Gresham, F. M., & Beebe-Frankenberger, M. E. (2002). Students with or at risk for learning and emotional-behavioral difficulties. In K. L. Lane, F. M. Gresham, & T. E. O’Shaughnessy (Eds.), Interventions for children with or at risk for emotional and behavioral disorders (pp. 3-17). Boston, MA: Allyn & Bacon.
Owen-DeSchryver, J. S., Carr, E. G., Cale, S. I., & Blakeley-Smith, A. (2008). Promoting social interactions between students with autism spectrum disorders and their peers in inclusive school settings. Focus on Autism and Other Developmental Disabilities, 23(1), 15-28.
Sansosti, F. J., & Powell-Smith, K. A. (2008). Using computer-presented social stories and video models to increase the social communication skills of children with high-functioning autism spectrum disorders. Journal of Positive Behavior Interventions, 10(3), 162-178.
Sparrow, S. S., Cicchetti, D., & Balla, D. A. (2005). Vineland Adaptive Behavior Scales (2nd ed.). San Antonio, TX: Pearson.
Strain, P.S. (1984). Social behavior patterns of nonhandicapped and developmentally
New Zealand Journal of Psychology Vol. 44 No. 2, September 2015• 78 •
K. H. Lemmon, V. A. Green
disabled friend pairs in mainstream preschools. Analysis and Intervention in Developmental Disabilities, 4(1), 15–28.
Strain, P. S., Odom, S. L., & McConnell, S. (1984). Promoting social reciprocity of exceptional children: Identification, target behavior selection, and intervention. Remedial and Special Education, 5(1), 21-28.
Strain, P. S., Shores, R. E., & Kerr, M. M. (1976). An experimental analysis of “spill-over” effects on social interaction among behaviorally handicapped preschool children. Journal of Applied Behavior Analysis, 9(1), 31–40.
Tremblay, A., Strain, P. S., Hendrickson, J. M., & Shores, R. E. (1981). Social interactions of normal preschool children: Using normative data for subject and target behavior selection. Behavior Modification, 5(2), 237-253.
Walker, S. & Irving, K. (1998). The effect of perceived social status on preschool children’s evaluations of behaviour. Journal of Australian Research in Early Childhood Education, 1, 94-103.
Walker, H. M., Ramsey, E., & Gresham, F. M. (2004). Anti-social behavior in school: Evidence-based practices (2nd ed.). Belmont, CA: Wadsworth/Thompson Learning.
Wang, P., & Spillane, A. (2009). Evidence-based social skills interventions for children with autism: A meta-analysis. Education and Training in Developmental Disabilities, 44(3), 318-342.
Whitlow, C. K., & Buggey, T. (2003). Video self-modelling: an effective intervention for a preschooler with language delays. Journal of Research in Special Educational Needs 3(1)
Acknowledgements:We are grateful to the parents,
teachers and children who participated in this project. This article is based on a Master of Educational Psychology research project completed by the first author. We thank Emmy Smart for her assistance with data collection; Jeff Sigafoos for his helpful comments on the manuscript and Eduardo Villatore for his technical support. We would also like to thank Susie Harcourt and Katie Allan for their editorial assistance.
Corresponding author:Vanessa A. Green, PhD School of Education, Victoria University of Wellington, Karori Campus, P. O. Box 17-310, Wellington, New Zealand. E-mail: [email protected] Phone: +64 4 463 9574 Fax: +64 4 463 9521

• 79 •New Zealand Journal of Psychology Vol. 44 No. 2, September 2015
Mahi Oranga
Developing Mahi Oranga: A Culturally Responsive Measure of Māori Occupational
Stress and WellbeingLisa Stewart Māramatanga Consultants Ltd, Auckland, New Zealand
Dianne Gardner School of Psychology, Massey University, Auckland
This research developed a culturally responsive measure of occupational stress for Māori staff called Mahi Oranga. With a focus on Māori working in the Aotearoa New Zealand Health sector, and following consultation with 13 Māori participants in the sector, the questionnaire was developed and made available online for respondents to complete. The data from 108 respondents indicated that as workplace constraints, role overload and interpersonal conflict increased, Māori staff reported using more coping strategies to deal with those demands. With greater reported use of coping strategies, perceptions of individual and job-related strain decreased, and as individual strain increased, so too did job-related strain. Respondents working in urban work settings reported higher job-related strain than their rural counterparts, and those working in a kaupapa Māori environment reported higher levels of cultural safety, more organisational constraints, more role overload, and more interpersonal conflict, but also reported using more coping strategies than their counterparts working in a mainstream environment. The present research adds to the limited research about occupational stress among Māori, and reveals that while Māori staff experience occupational stress in some of the same ways as their non-Māori counterparts, they also experience it in uniquely different ways as well.
Keywords: Māori, health sector, stress, wellbeing
IntroductionVery little Aotearoa New Zealand
research has been published on occupational stress among Māori. The most direct and comprehensive published research on occupational stress was conducted by Sisley and Waititi (1997) with Māori working in the tertiary education sector. Victoria Simon (2004) did some pilot research with Māori nurses, which identified high levels of occupational stress related to work overload and cultural safety, however few details of those findings have yet been published. Also in the health and disability sector, but not directly related to occupational stress, was research conducted by Ratima et al. (2007) for the Ministry of Health about recruitment and retention issues for Māori staff.
Key findings from Sisley and Waititi’s (1997) and Ratima et al’s.
(2007) research provided context for the development of Mahi Oranga, the measure of factors related to occupational stress that was the focus of the present research. In particular, the existing research revealed that many Māori experience occupational stress in different ways from non-Māori, especially in relation to experiences of institutional racism. Such experiences usually arise from the conflict between Māori cultural values, Pākehā western beliefs, and the values of the mainstream, government-established education and health systems. Such experiences can result in a lack of cultural safety for Māori health practitioners as well as clients.
Cultural safety is defined as “the effective psychological education and practice as applied to a person, family or group from another culture, and as determined by that person, family or group” (New Zealand Psychologists
Board, 2011, p.15). Furthermore, unsafe cultural practice “comprises any action which diminishes, demeans or disempowers the cultural identity and wellbeing of an individual, family or group” (New Zealand Psychologists Board, 2011, p. 15). Cultural safety has been formally recognised in the health and disability sector in Aotearoa New Zealand since 1992, and its focus is the experience of the client or patient, and whether a service provided is respectful of and allows dignity to that client or patient. From a Māori health worker focus, cultural safety also includes the experience of interactions with their non-Māori colleagues.
Other stressors for Māori staff revealed by Sisley and Waititi’s (1997) and Ratima et al’s. (2007) research include job descriptions and remuneration that do not adequately reflect the differing nature of work for Māori and non-Māori staff. For instance, many Māori staff hold dual obligations and accountabilities to their iwi (tribe) and employer, and are formally or informally tasked with providing advice on tikanga Māori (Māori customs and protocols) and te reo Māori (the Māori language) in addition to their other duties. The aims and aspirations of many Māori in the workplace can include making a difference to and being a role model for Māori, but low numbers of Māori staff in many sectors result in higher workloads for existing Māori staff, often due to the lack of or low levels of Māori cultural competence of non-Māori staff along with a lack of or limited access to cultural competency training for non-Māori staff. Māori staff may also lack access to cultural support or supervision, and feel isolated from other Māori staff in the workplace. On a positive note, Sisley and Waititi’s (1997) and Ratima
New Zealand Journal of Psychology Vol. 44 No. 2, September 2015• 80 •
L. Stewart, D. Gardner
et al’s. (2007) research indicated that some Māori staff were optimistic about their work because they felt they were making a positive contribution to advancing Māori clients’ needs, they felt nurtured and sustained by working with Māori colleagues and students, and their whānau (family) gave them the strength to continue. Since little published research exists about occupational stress and wellbeing for Māori, the aims of the present research were twofold. In Phase 1, the first author consulted with Māori working in the health and disability sector. The primary aim of the consultation phase was to establish whether there would be support for, or a need at ‘flax roots’ level within the health and disability sector for a Māori-specific measure of occupational stress and healthy work. Secondary aims of this first phase were to ensure the resulting measure (Mahi Oranga) would have cultural and practical validity with Māori health and disability sector employees, be designed to meet the needs of those employees, and have support for the development and piloting phases. Phase 2 aimed to work towards a better understanding of occupational stress and wellbeing for Māori working in the health and disability sector by developing a culturally responsive and valid measure.
Phase 1: Consultation with Māori
MethodParticipants were 13 Māori urban
health and disability sector employees. Three participants were male and ten were female. The work environments of the participants included three from urban kaupapa Māori, eight from urban mainstream, and two from rural kaupapa Māori. In this context, mainstream refers to government established health institutions that provide services to all ethnicities within the Aotearoa New Zealand community, as opposed to kaupapa Māori health services which specialise in providing services to the Māori community in a culturally responsive way. The thirteen participants self-identified (according to the job title displayed on their business card) as belonging to either
the nursing (3 participants), mental health (6 participants), community health (2 participants), or Māori Health Promotion (2 participants) disciplines. Participants were recruited through the researcher’s personal, whānau and professional networks.
Participants were interviewed individually. A brief background to the topic of occupational stress was provided, and included an overview of the need to consider organisational factors, personality (individual difference) factors, and coping strategies. The potential need for a measure which incorporated the Māori model of health and wellbeing, Te Whare Tapa Whā, to contribute information to better enable management to deal with occupational stress was discussed, including possibilities of raising awareness of the financial, organisational, and human costs of maintaining the status quo.
Data was collected by means of semi-structured interviews. Interview questions explored the potential value of research into occupational stress and wellbeing for Māori health professionals, the proposed development of a self-report measure, and potential uses for the measure. Each issue was explored in detail. A feedback report was provided to all participants once interviews had been completed.
Data were analysed using the six phases of Braun and Clarke’s (2006) method of thematic analysis, which include: familiarisation with the data; generating initial codes; searching for themes; reviewing themes; defining and naming themes; and producing the report.
ResultsFour themes emerged. The first was
around the motivations or aspirations of Māori health and disability sector employees, as regards improving health outcomes for tangata whaiora (Māori people seeking positive health outcomes). Participants felt a strong need to reduce health disparities for Māori, and to improve services. A second theme related to occupational stress. Participants identified the high levels of work demands, such as demands intrinsic to the job (especially
the isolation and travel demands of rural work); the need for professional development (lack of management skills, non- Māori colleagues’ lack of cultural competence); the nature of work in the sector (leadership issues, the expectation that Māori health professions will deal with ‘anything Māori’); and relationships at work (conflict with colleagues, expectations of clients and their whānau, unrealistic work expectations). Participants reported experiencing institutional racism, lack of recognition, workplace support, and lack of appropriate cultural or professional supervision. Stress, burnout and high rates of turnover among Māori staff were key negative outcomes of high work demands. The third theme concerned ways to create healthy workplaces. Key issues raised were the need for educating stakeholders (including policymakers, management, non-Māori colleagues, and Māori staff) about the different ways in which Māori and non-Māori experience occupational stress, the need for Māori leadership in the sector, the need for culturally responsive models and measures, and the opportunity to help Māori increase their self-awareness of occupational stress issues for themselves and others. Organisational change was also highlighted in terms of the need for organisational accountability, workforce development, and attention to Māori involvement in organisations. The fourth and final theme concerned practical issues related to developing Mahi Oranga. Key points were the need for brevity and ease of completion, quantitative and qualitative information, equal representation of Te Whare Tapa Whā quadrants, and the inclusion of kupu Māori (Māori words). Specific questions were also suggested.
DiscussionMany of the occupational stress
issues for these Māori health practitioners were similar to those reported in Sisley and Waititi’s (1997) research. Examples include the aspirations of Māori staff to provide appropriate services to Māori end users (either students or patients) to improve educational or health outcomes; institutional racism and lack of cultural safety, and lack of recognition and

• 81 •New Zealand Journal of Psychology Vol. 44 No. 2, September 2015
Mahi Oranga
appropriate remuneration for Māori cultural competencies. There were also similarities with Ratima et al’s. (2007) findings in terms of low levels of Māori cultural competence among non-Māori staff, insufficient access to Māori cultural support and/or supervision, and institutionalised racism.
Māori who are working in the health and disability sector experience some aspects of occupational stress in the same way as non-Māori, although the impact on Māori may be more acute because they are under-represented in the workforce, while Māori remain over-represented in the health statistics. Stressors which are widely experienced include budgetary constraints resulting in staffing constraints and high workloads, unrealistic job expectations, lack of management skills and a lack of appropriate professional development. In addition, some aspects of work such as emergency department nursing, isolation and travel in the rural sector, and the negative outcomes of stress for individuals and organisations were also common for all health and disability sector employees.
However, Māor i s t a ff a l so exper ience occupat ional s t ress in different ways from non-Māori. Differences include institutional racism and lack of cultural safety, and a failure of non-Māori to value Māori cultural competencies. In many instances, Māori employees are often expected to deal with ‘Māori’ issues, perhaps in part because their non-Māori colleagues lack the cultural competence or desire to do so. Finally, the expectations of whānau, hapu and iwi, along with tribalism, were Māori-specific issues that contribute to differing experiences of occupational stress.
Together these findings provide evidence not only that Māori experience occupational stress differently from their non-Māori colleagues, but of ways in which those experiences differ. There is clearly a need for further research into occupational stress and wellbeing among Māori staff, and Mahi Oranga was developed as a further step to explore Māori perspectives of workplace health and wellbeing. Mahi Oranga was also developed to address the need identified by the Māori
health practitioners consulted for a culturally responsive and valid measure of occupational stress and wellbeing for Māori working in the health and disability sector.
Phase 2: Development of Mahi Oranga
Consultation in Phase 1 identified the need for appropriate and valid measures of occupational health and wellbeing. Four steps were undertaken. The first was to find an appropriate theoretical occupational stress framework, the second was to incorporate an established model of Māori health and wellbeing, the third was to develop items, and the fourth was an initial study of item validity and reliability.
One well-established theoretical occupational stress framework which is comprehensive, incorporates individual and situational factors, and allows for both negative and positive outcomes is the transactional model of Lazarus and Folkman (1984). This model formed the basis for the present study. Three components are important in the model: demands, processes and outcomes. Demands (potential stressors) require effort to address them, and are appraised in terms of whether sufficient resources are available to deal with them. Processes refers to coping, the cognitive affective and behavioural strategies used to address demands. Short-term outcomes include the immediate emotions or actions in response to a demand, while long-term outcomes include wellbeing or distress. What distinguished the transactional model of occupational stress is the inclusion of appraisal and coping as mediating processes, as well as the focus on dynamic, ongoing interactions
between person and environment.The present study focused on
three domains that aligned with the transactional model: demands (workplace characteristics), resources (coping strategies), and strain outcomes. In order to ensure that Mahi Oranga would be culturally responsive, two approaches were taken to integrate a Māori focus with the transactional model. The first was to ensure that Te Whare Tapa Whā, a well-recognised model of Māori health and wellbeing, was included within Mahi Oranga, and the second was to focus item development on specific aspects of Te Whare Tapa Whā.
Te Whare Tapa Whā is a model of Māori health in which four essential components of health are symbolised by the four walls of a house: taha wairua (the spiritual side); taha hinengaro (the thoughts and feelings side); taha tinana (the physical side); and taha whānau (the extended family side) (Durie, 1998). All four quadrants are necessary for strength and balance, although Durie (1998) asserts that Māori generally feel that taha wairua is the most essential requirement for health.
In developing Hua Oranga , which is a Māori measure of general mental health, Kingi and Durie (2000) developed a Māori Outcomes Dimension Framework (MODF), so that the key aspects of wairua, hinengaro, tinana, and whānau could be captured. This framework appeared flexible enough for use outside the general mental health context that it had originally been developed for, and was therefore used to guide item development for Mahi Oranga. Table 1 shows how components of the MODF framework align with the four quadrants or walls
Table 1: Māori Outcome Dimension Framework (MODF) (Kingi & Durie, 2000, p. 34).
Wairua Hinengaro Tinana Whānau
dignity, respect motivation mobility/pain communication
cultural identity cognition/behaviour opportunity for enhanced health
relationships
personal contentment management of emotions, thinking
mind and body links mutuality (reciprocity)
Spirituality (non-physical experience)
understanding physical health status social participation
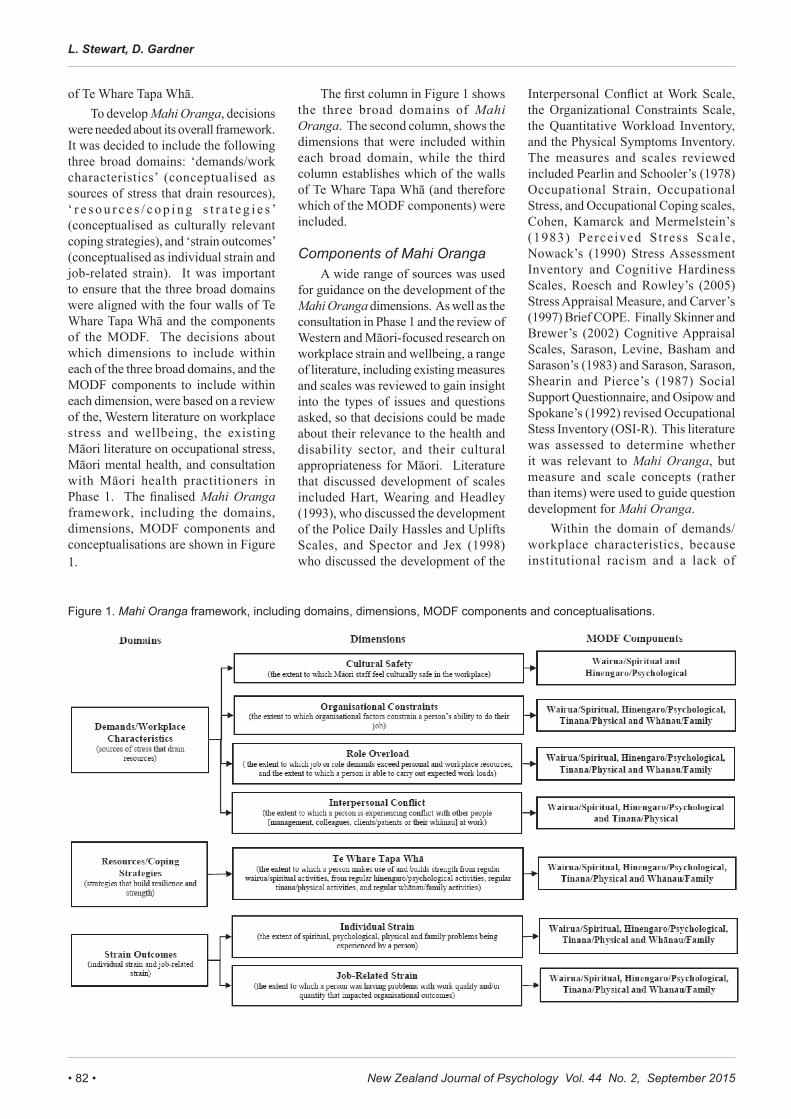
New Zealand Journal of Psychology Vol. 44 No. 2, September 2015• 82 •
L. Stewart, D. Gardner
of Te Whare Tapa Whā.To develop Mahi Oranga, decisions
were needed about its overall framework. It was decided to include the following three broad domains: ‘demands/work characteristics’ (conceptualised as sources of stress that drain resources), ‘ r e s o u r c e s / c o p i n g s t r a t e g i e s ’ (conceptualised as culturally relevant coping strategies), and ‘strain outcomes’ (conceptualised as individual strain and job-related strain). It was important to ensure that the three broad domains were aligned with the four walls of Te Whare Tapa Whā and the components of the MODF. The decisions about which dimensions to include within each of the three broad domains, and the MODF components to include within each dimension, were based on a review of the, Western literature on workplace stress and wellbeing, the existing Māori literature on occupational stress, Māori mental health, and consultation with Māori health practitioners in Phase 1. The finalised Mahi Oranga framework, including the domains, dimensions, MODF components and conceptualisations are shown in Figure 1.
The first column in Figure 1 shows the three broad domains of Mahi Oranga. The second column, shows the dimensions that were included within each broad domain, while the third column establishes which of the walls of Te Whare Tapa Whā (and therefore which of the MODF components) were included.
Components of Mahi OrangaA wide range of sources was used
for guidance on the development of the Mahi Oranga dimensions. As well as the consultation in Phase 1 and the review of Western and Māori-focused research on workplace strain and wellbeing, a range of literature, including existing measures and scales was reviewed to gain insight into the types of issues and questions asked, so that decisions could be made about their relevance to the health and disability sector, and their cultural appropriateness for Māori. Literature that discussed development of scales included Hart, Wearing and Headley (1993), who discussed the development of the Police Daily Hassles and Uplifts Scales, and Spector and Jex (1998) who discussed the development of the
Interpersonal Conflict at Work Scale, the Organizational Constraints Scale, the Quantitative Workload Inventory, and the Physical Symptoms Inventory. The measures and scales reviewed included Pearlin and Schooler’s (1978) Occupational Strain, Occupational Stress, and Occupational Coping scales, Cohen, Kamarck and Mermelstein’s (1983) Perceived Stress Scale , Nowack’s (1990) Stress Assessment Inventory and Cognitive Hardiness Scales, Roesch and Rowley’s (2005) Stress Appraisal Measure, and Carver’s (1997) Brief COPE. Finally Skinner and Brewer’s (2002) Cognitive Appraisal Scales, Sarason, Levine, Basham and Sarason’s (1983) and Sarason, Sarason, Shearin and Pierce’s (1987) Social Support Questionnaire, and Osipow and Spokane’s (1992) revised Occupational Stess Inventory (OSI-R). This literature was assessed to determine whether it was relevant to Mahi Oranga, but measure and scale concepts (rather than items) were used to guide question development for Mahi Oranga.
Within the domain of demands/workplace characteristics, because institutional racism and a lack of
Figure 1. Mahi Oranga framework, including domains, dimensions, MODF components and conceptualisations.

• 83 •New Zealand Journal of Psychology Vol. 44 No. 2, September 2015
Mahi Oranga
Figure 1. Mahi Oranga framework, including domains, dimensions, MODF components and conceptualisations.
cultural safety featured so strongly in the Māori literature and the consultation in Phase 1, it was decided to include a dimension called cultural safety (New Zealand Psychologists Board, 2011; Nursing Council of New Zealand, 2005). The dimension organisational constraints was included based on Phase 1 consultation and the work of Cooper and Marshall (1976). The dimension role overload was included as it has been widely recognised as a work demand (e.g. Jamal, 1984; Moore & Cooper, 1996; Simon, 2004), along with the dimension interpersonal conflict, also recognised as a key source of occupational stress (Bentley etal., 2009; Cooper & Marshall, 1976; Foster, Mackie & Barnett, 2004); McKenna, Smith, Poole & Coverdale, 2003).
For resources/coping strategies, it was decided to include dimensions reflecting the four quadrants of Te Whare Tapa Whā (wairua, hinengaro, t inana, whānau). The Personal Resources Questionnaire (PRQ) of the OSI-R includes the concepts of ‘recreation’, ‘self-care’, ’social support’, and ‘rational/cognitive coping’, which appeared compatible with Te Whare Tapa Whā and culturally appropriate for Mahi Oranga. The conceptualisation of this Te Whare Tapa Whā dimension was developed to mean the extent to which a person makes use of and builds strength from regular wairua/spiritual, from regular hinengaro/psychological activities, regular tinana/physical activities, and regular whānau/family activities.
For strain outcomes, the broader literature as well as the Personal Strain Questionnaire (PSQ) of the OSI-R suggested two dimensions: individual strain (the extent of spiritual, psychological, physical and family problems being experienced by the individual) and job-related strain (the extent to which a person is having problems with work quality and/or quantity that impacts organisational outcomes). In this case, organisational outcomes refers to, but is not limited to, constructs such as job performance, o r g a n i s a t i o n a l c o m m i t m e n t , organisational citizenship behaviours, turnover, and absenteeism.
Having decided on seven domains to include in Mahi Oranga, it was
important to then ensure that items for each domain were focussed on Māori-specific aspects of occupational wellbeing. MODF components were the focus when developing the items, so decisions needed to be made about which MODF components should be included in each dimension. Within the ‘demands/work characteristics’ domain, for the dimensions of ‘role overload’ and ‘role conflict’, all four components of the MODF were considered to be affected by demands/work characteristics, and were included. For ‘interpersonal conflict’, only the wairua, hinengaro and tinana components of the MODF were included as the whānau component was regarded as an implicit component affected by interpersonal conflict. For ‘cultural safety’, only the wairua and hinengaro components of the MODF were included. With respect to the tinana and whānau MODF components of the ‘cultural safety’ dimension, feedback from the first author’s consultation with Māori health professionals as well as personal experience indicated that cultural safety predominantly impacts the wairua and hinengaro quadrants of Te Whare Tapa Whā. It was therefore decided not to include the tinana and whānau MODF components in the ‘cultural safety’ dimension. Within the ‘resources/coping strategies’ domain, all four MODF components were included. Within the ‘strain outcomes’ domain, for the dimensions of ‘individual strain’ and ‘job-related strain’ all four MODF components were included. These dimension and MODF components decisions and inclusions are presented in Figure 1.
MethodItems to measure each of the
MODF components in each of the seven dimensions were developed through an iterative process of consultation. As a first step, a table was developed indicating the main areas (domains and dimensions) as set out in Figure 1 and this was sent out to those Phase 1 participants who had indicated interest in contributing to the project. Participants were invited to suggest questions to include in Mahi Oranga for each dimension. These were then compiled into the survey, and further items were developed as required to ensure
each dimension was comprehensively covered. A wide range of literature and published scales was assessed to determine relevance. Measure and scale concepts (rather than items) were used to guide item development for Mahi Oranga. When developing the items, Māori cultural perspectives and kupu Māori (Māori words) were incorporated as necessary. The completed Mahi Oranga survey was then distributed to a wider range of participants as outlined below.
ProcedurePotent ia l par t ic ipants were
identified through the first author’s personal whānau, snowball contacts from participants in Phase 1, and contact with Māori health organisations identified through an internet search. Potential participants were sent an email containing a link to an online version of Mahi Oranga, an invitation to participate, and an invitation to forward the email to other Māori health professionals who might be interested in participating.
RespondentsThere were 180 respondents who
provided usable data. Of these, 50 completed only the demographics section of Mahi Oranga and were excluded from any analysis. A further 22 completed the demographic and part of the demands/workplace characteristics sections but not the resources/coping strategies and strain outcomes sections of Mahi Oranga, so were excluded from the quantitative analysis, leaving 108 respondents. The majority of respondents were female, aged between 40 – 59 years. The age range of respondents was 20 – 29 years to 70+ years. There was a much higher proportion of respondents from an urban work setting than from a rural work setting, and a slightly higher proportion of respondents from a kaupapa Māori work environment than from a mainstream environment. There were approximately equal numbers of respondents from the kaupapa Māori and mainstream work environments in the urban setting, but the rural work setting was under-represented in the sample (Table 2).
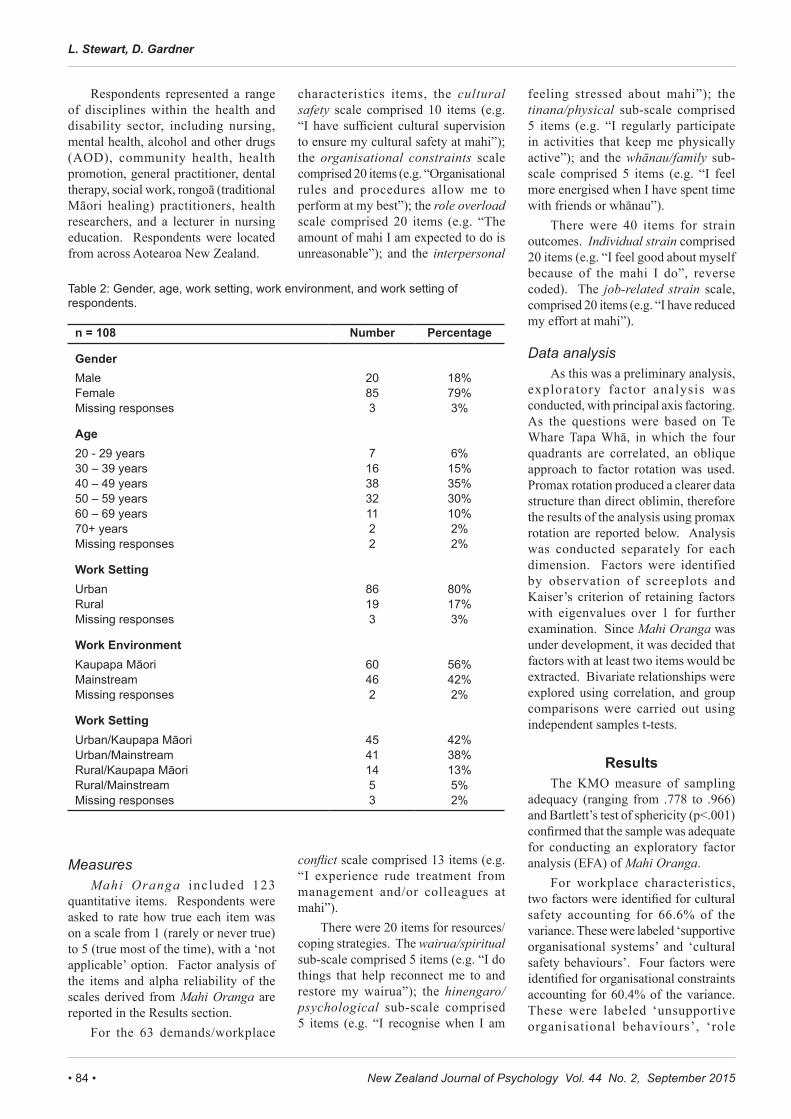
New Zealand Journal of Psychology Vol. 44 No. 2, September 2015• 84 •
L. Stewart, D. Gardner
Respondents represented a range of disciplines within the health and disability sector, including nursing, mental health, alcohol and other drugs (AOD), community health, health promotion, general practitioner, dental therapy, social work, rongoā (traditional Māori healing) practitioners, health researchers, and a lecturer in nursing education. Respondents were located from across Aotearoa New Zealand.
MeasuresMahi Oranga included 123
quantitative items. Respondents were asked to rate how true each item was on a scale from 1 (rarely or never true) to 5 (true most of the time), with a ‘not applicable’ option. Factor analysis of the items and alpha reliability of the scales derived from Mahi Oranga are reported in the Results section.
For the 63 demands/workplace
characteristics items, the cultural safety scale comprised 10 items (e.g. “I have sufficient cultural supervision to ensure my cultural safety at mahi”); the organisational constraints scale comprised 20 items (e.g. “Organisational rules and procedures allow me to perform at my best”); the role overload scale comprised 20 items (e.g. “The amount of mahi I am expected to do is unreasonable”); and the interpersonal
conflict scale comprised 13 items (e.g. “I experience rude treatment from management and/or colleagues at mahi”).
There were 20 items for resources/coping strategies. The wairua/spiritual sub-scale comprised 5 items (e.g. “I do things that help reconnect me to and restore my wairua”); the hinengaro/psychological sub-scale comprised 5 items (e.g. “I recognise when I am
feeling stressed about mahi”); the tinana/physical sub-scale comprised 5 items (e.g. “I regularly participate in activities that keep me physically active”); and the whānau/family sub-scale comprised 5 items (e.g. “I feel more energised when I have spent time with friends or whānau”).
There were 40 items for strain outcomes. Individual strain comprised 20 items (e.g. “I feel good about myself because of the mahi I do”, reverse coded). The job-related strain scale, comprised 20 items (e.g. “I have reduced my effort at mahi”).
Data analysisAs this was a preliminary analysis,
exploratory factor analysis was conducted, with principal axis factoring. As the questions were based on Te Whare Tapa Whā, in which the four quadrants are correlated, an oblique approach to factor rotation was used. Promax rotation produced a clearer data structure than direct oblimin, therefore the results of the analysis using promax rotation are reported below. Analysis was conducted separately for each dimension. Factors were identified by observation of screeplots and Kaiser’s criterion of retaining factors with eigenvalues over 1 for further examination. Since Mahi Oranga was under development, it was decided that factors with at least two items would be extracted. Bivariate relationships were explored using correlation, and group comparisons were carried out using independent samples t-tests.
ResultsThe KMO measure of sampling
adequacy (ranging from .778 to .966) and Bartlett’s test of sphericity (p<.001) confirmed that the sample was adequate for conducting an exploratory factor analysis (EFA) of Mahi Oranga.
For workplace characteristics, two factors were identified for cultural safety accounting for 66.6% of the variance. These were labeled ‘supportive organisational systems’ and ‘cultural safety behaviours’. Four factors were identified for organisational constraints accounting for 60.4% of the variance. These were labeled ‘unsupportive organisational behaviours’, ‘role
Table 2: Gender, age, work setting, work environment, and work setting of respondents.
n = 108 Number Percentage
GenderMale 20 18%Female 85 79%Missing responses 3 3%
Age20 - 29 years 7 6%30 – 39 years 16 15%40 – 49 years 38 35%50 – 59 years 32 30%60 – 69 years 11 10%70+ years 2 2%Missing responses 2 2%
Work SettingUrban 86 80%Rural 19 17%Missing responses 3 3%
Work EnvironmentKaupapa Māori 60 56%Mainstream 46 42%Missing responses 2 2%
Work SettingUrban/Kaupapa Māori 45 42%Urban/Mainstream 41 38%Rural/Kaupapa Māori 14 13%Rural/Mainstream 5 5%Missing responses 3 2%

• 85 •New Zealand Journal of Psychology Vol. 44 No. 2, September 2015
Mahi Oranga
ambiguity’, ‘work environment’, and ‘perceived quality of management’. Five factors measuring role overload accounting for 70.5% of the variance were labeled ‘work overload’, ‘lack of workplace social support’, ‘lack of organisational systems’, ‘lack of physical safety’, and ‘work-life balance’. Three factors measuring interpersonal conflict accounting for 61.6 % of the variance were labeled ‘disrespect from peers or clients’, ‘disrespect from management’, and ‘lack of trust’. For coping strategies,
the five factors measuring Te Whare Tapa Whā accounting for 65.7% of the variance were labeled ‘hinengaro’, ‘whānau support – peers and family’, ‘wairua support’, ‘tinana support – management’, and ‘tinana – own behaviours’. For strain outcomes, the
five factors measuring individual strain accounting for 71.8% of the variance were labeled ‘hinengaro strain’, ‘wairua strain’, ‘whānau strain from isolation’, ‘whānau strain from conflict’, and ‘tinana strain’; and there was a single factor that measured job-related strain which accounted for 96.1% of the variance.
The number of items, percentage of variance explained and coefficient alpha scores for factor analysed scales and sub-scales are presented in Table 3.
Building the scalesF a c t o r a n a l y s i s i d e n t i f i e d
24 subscales (Table 3). Given the constraints of sample size, further analysis explored the seven main Mahi Oranga dimensions (Table 4) rather than the sub-scales identified from factor
analysis. This more detailed analysis based on the sub-scales awaits further research. Scales were computed as the means of items.
Scales were checked for normality and outliers. For the seven Mahi Oranga scales, the Kolmogorov-Smirnov scores indicated that the interpersonal conflict, individual strain, and job-related strain scales were not normally distributed. There were two outliers on the interpersonal conflict scale, with a mean of 3.23 and 5% trimmed mean very similar at 3.24, so the two cases involved were retained. There were six outliers on the individual strain scale, with a mean of 1.90 and 5% trimmed mean of 1.86, so all cases were retained. There were two outliers and one extreme case on the job-related strain scale, with a mean of 1.46 and 5% trimmed mean of 1.39. The extreme case was investigated further, and the respondent’s response pattern along with qualitative comments indicated they were experiencing high levels of work demands and individual strain. Given the case concerned was genuine, and since the mean and 5% trimmed mean were still similar, all cases were retained in the analysis.
Bivariate correlationsThere were no s ign i f i can t
correlations between age and any of the seven Mahi Oranga scales (Table 4). There were moderate to strong positive correlations among the workplace characteristics scales. Respondents reporting higher levels of organisational constraints also reported higher levels of overload and conflict. Higher levels of cultural safety were related to reporting greater use of coping strategies and less job-related strain, but also, unexpectedly, to perceptions of more organisational constraints, more role overload and more role conflict. Individual strain was not related to cultural safety and other work characteristics but was related to participants reporting less use of coping strategies. Job-related strain was related to less cultural safety, indicating that as cultural safety increased for Māori staff, there was less job-related strain. Job-related strain was also related to less reported use of coping strategies. However, job-related strain was also related to lower, not higher, levels of organisational constraints, role
Table 3: Mahi Oranga scale statistics.
Scale domain, dimension and subscale label No. of Items Percentage of variance
explainedCoefficient
α
Demands/Workplace CharacteristicsCultural Safety 10 .91Supportive Organisational Systems 5 54.9% .88Cultural Safety Behaviours 5 11.7% .86Organisational Constraints 13 .85Unsupportive Organisational Behaviours 5 35.4% .84Role Ambiguity 3 10.4% .74Work Environment 3 7.6% .64Perceived Quality of Management 2 7.0% .63Role Overload 19 .84Work Overload 4 27.5% .86Lack of Workplace Social Support 6 22.8% .85Lack of Organisational Systems 3 9.0% .69Lack of Physical Safety 4 5.9% .69Work-Life Balance 2 5.3% .91Interpersonal Conflict 8 .85Disrespect from Peers or Clients 4 40.4% 83Disrespect from Management 2 12.7% .64Lack of Trust 2 8.5% .66Resources/Coping StrategiesTe Whare Tapa Whā 15 .84Hinengaro 4 34.6% .72Whānau Support – Peers and Family 3 11.0% .77Wairua Support 3 7.3% .73Tinana Support – Management 3 7.1% .75Tinana – Own Behaviours 2 5.7% .70Strain OutcomesIndividual Strain 19 .92Hinengaro Strain 7 41.7% .97Wairua Strain 3 10.5% .88Whānau Strain from Isolation 4 8.1% .84Whānau Strain from Conflict 3 6.4% .66Tinana Strain 2 5.1% .77Job-Related Strain 20 96.1% .93
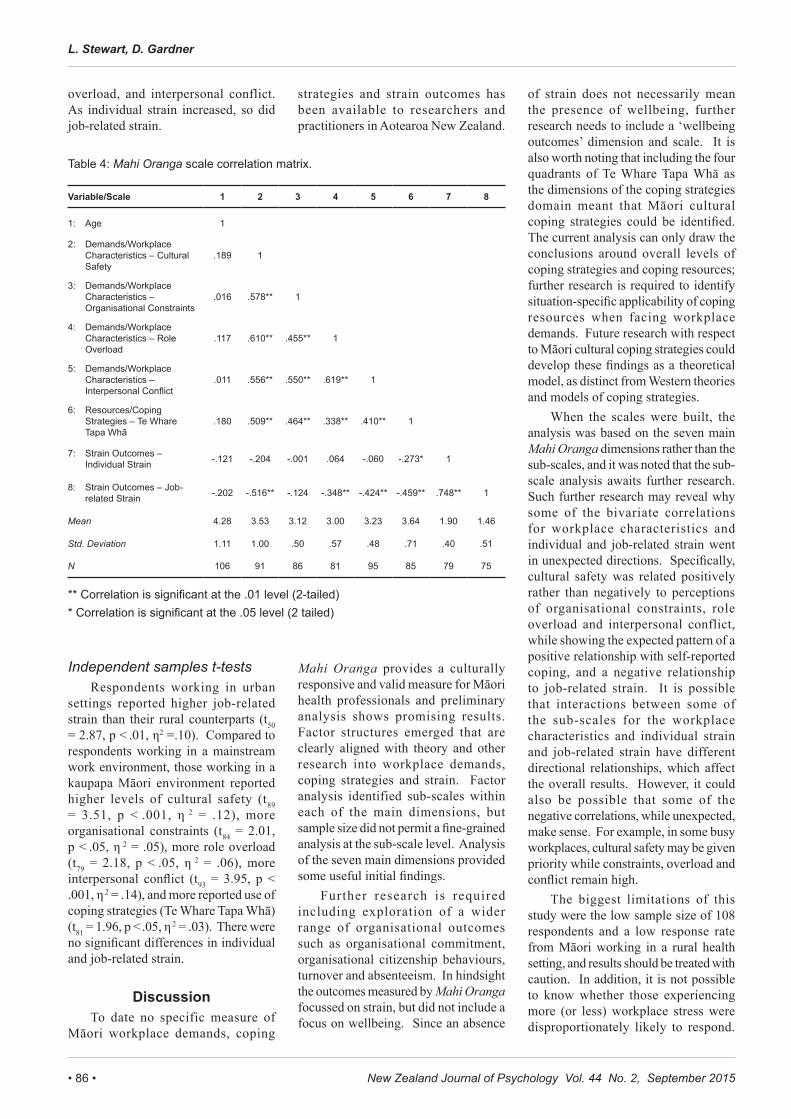
New Zealand Journal of Psychology Vol. 44 No. 2, September 2015• 86 •
L. Stewart, D. Gardner
overload, and interpersonal conflict. As individual strain increased, so did job-related strain.
Independent samples t-testsRespondents working in urban
settings reported higher job-related strain than their rural counterparts (t50 = 2.87, p < .01, η2 =.10). Compared to respondents working in a mainstream work environment, those working in a kaupapa Māori environment reported higher levels of cultural safety (t89 = 3.51, p < .001, η 2 = .12), more organisational constraints (t84 = 2.01, p < .05, η 2 = .05), more role overload (t79 = 2.18, p < .05, η 2 = .06), more interpersonal conflict (t93 = 3.95, p < .001, η 2 = .14), and more reported use of coping strategies (Te Whare Tapa Whā) (t81 = 1.96, p < .05, η 2 = .03). There were no significant differences in individual and job-related strain.
DiscussionTo date no specific measure of
Māori workplace demands, coping
strategies and strain outcomes has been available to researchers and practitioners in Aotearoa New Zealand.
Mahi Oranga provides a culturally responsive and valid measure for Māori health professionals and preliminary analysis shows promising results. Factor structures emerged that are clearly aligned with theory and other research into workplace demands, coping strategies and strain. Factor analysis identified sub-scales within each of the main dimensions, but sample size did not permit a fine-grained analysis at the sub-scale level. Analysis of the seven main dimensions provided some useful initial findings.
Further research is required including exploration of a wider range of organisational outcomes such as organisational commitment, organisational citizenship behaviours, turnover and absenteeism. In hindsight the outcomes measured by Mahi Oranga focussed on strain, but did not include a focus on wellbeing. Since an absence
of strain does not necessarily mean the presence of wellbeing, further research needs to include a ‘wellbeing outcomes’ dimension and scale. It is also worth noting that including the four quadrants of Te Whare Tapa Whā as the dimensions of the coping strategies domain meant that Māori cultural coping strategies could be identified. The current analysis can only draw the conclusions around overall levels of coping strategies and coping resources; further research is required to identify situation-specific applicability of coping resources when facing workplace demands. Future research with respect to Māori cultural coping strategies could develop these findings as a theoretical model, as distinct from Western theories and models of coping strategies.
When the scales were built, the analysis was based on the seven main Mahi Oranga dimensions rather than the sub-scales, and it was noted that the sub-scale analysis awaits further research. Such further research may reveal why some of the bivariate correlations for workplace characteristics and individual and job-related strain went in unexpected directions. Specifically, cultural safety was related positively rather than negatively to perceptions of organisational constraints, role overload and interpersonal conflict, while showing the expected pattern of a positive relationship with self-reported coping, and a negative relationship to job-related strain. It is possible that interactions between some of the sub-scales for the workplace characteristics and individual strain and job-related strain have different directional relationships, which affect the overall results. However, it could also be possible that some of the negative correlations, while unexpected, make sense. For example, in some busy workplaces, cultural safety may be given priority while constraints, overload and conflict remain high.
The biggest limitations of this study were the low sample size of 108 respondents and a low response rate from Māori working in a rural health setting, and results should be treated with caution. In addition, it is not possible to know whether those experiencing more (or less) workplace stress were disproportionately likely to respond.
Table 4: Mahi Oranga scale correlation matrix.
Variable/Scale 1 2 3 4 5 6 7 8
1: Age 1
2: Demands/Workplace Characteristics – Cultural Safety
.189 1
3: Demands/Workplace Characteristics – Organisational Constraints
.016 .578** 1
4: Demands/Workplace Characteristics – Role Overload
.117 .610** .455** 1
5: Demands/Workplace Characteristics – Interpersonal Conflict
.011 .556** .550** .619** 1
6: Resources/Coping Strategies – Te Whare Tapa Whā
.180 .509** .464** .338** .410** 1
7: Strain Outcomes – Individual Strain -.121 -.204 -.001 .064 -.060 -.273* 1
8: Strain Outcomes – Job-related Strain -.202 -.516** -.124 -.348** -.424** -.459** .748** 1
Mean 4.28 3.53 3.12 3.00 3.23 3.64 1.90 1.46
Std. Deviation 1.11 1.00 .50 .57 .48 .71 .40 .51
N 106 91 86 81 95 85 79 75
** Correlation is significant at the .01 level (2-tailed) * Correlation is significant at the .05 level (2 tailed)

• 87 •New Zealand Journal of Psychology Vol. 44 No. 2, September 2015
Mahi Oranga
Participants were predominantly female, so further exploration of gender differences within the dimensions of Mahi Oranga is required. The results may not be generalisable outside the public sector where government policy requires consideration of the principles of the Treaty of Waitangi. In terms of the aims of this research, all of the scales have good internal consistency, but more work needs to be done to examine the internal consistency of the sub-scales that fell below the .7 threshold. Further development work also needs to examine test-retest reliability. To some extent, cultural (face) validity has been achieved, although content validity, especially with the job-related strain scale, needs more work. Construct validity (convergent and discriminant) was not assessed during the course of the present research, so will require further research and development. Other forms of criterion-related validity will need to be established when Mahi Oranga begins to be used in practice. Given the small sample size, it was not considered appropriate to attempt to establish norm reference data for the various roles of Māori working in the health and disability workforce (based on job title descriptions), so that will require further research and development.
Implications for practiceGiven that the scale is in the early
stages of development, results need to be treated with caution. However, some of these results still highlight important implications for practice. For example, there were strong positive relationships among organisational constraints, role overload and interpersonal conflict, indicating that as one increased, so did the others, and all were related to perceptions of strain. These unsurprising results highlight the importance of organisations reducing or minimising workplace demands that are within their control in order to reduce strain outcomes for their staff. Management should take a proactive approach to stress management by reducing those workplace demands that can be reduced or minimised.
In addition, as reported use of coping strategies increased, strain decreased. Although causation cannot be established in this study, it is plausible
that use of coping strategies can reduce strain, and this highlights the need for individuals to develop and use a range of coping strategies, and for organisations to do their part in providing awareness and access to culturally responsive services to help staff develop, maintain and use effective coping strategies.
As constraints, overload and conflict increased, respondents reported using more coping strategies. While this is reassuring, it provides support for the need for organisations to reduce workplace demands where possible, as well as for individuals and organisations to take responsibility for developing and maintaining a range of culturally responsive coping strategies.
More research needs to be done to find out whether urban settings are indeed more problematic in terms of job-related strain for Māori staff, and what impact this might have on workplace productivity, job performance and outcomes for Māori seeking health services in urban areas. Additional work is also needed to establish what mainstream health providers could do to bring levels of perceived cultural safety up to those reported by respondents working in a kaupapa Māori environment.
The higher levels of organisational cons t r a in t s i n kaupapa Māor i environments could indicate that these health providers are having to do more with less funding than their mainstream counterparts. This finding appears to lend weight to the past Associate Minister of Health, the Honourable Tariana Turia, championing the need for further government funding for the Māori health and disability sector workforce in order to increase capacity and capability within that workforce (Māori health workforce funding, 2008, May 23). The higher role overload for respondents in a kaupapa Māori environment is likely to be related to the nature of the way that Māori health workers work to provide effective outcomes for Māori clients and communities. This speaks to the (perhaps) different motivations of Māori health workers, and especially those in a kaupapa Māori environment for whom there may be a strong organisational culture of achieving better health outcomes for Māori clients and patients
and the wider Māori community. This finding aligns with those reported by Ratima et al. (2007) in terms of Māori staff wanting to make a contribution Māori health, working with Māori people and making a difference to their iwi/hapu and being a role model for Māori.
Managers and leaders within kaupapa Māori environments may need to raise their awareness that interpersonal conflict is potentially higher there for Māori staff and gain the skills and ability to deal effectively with such conflict. Some of the sources of interpersonal conflict in kaupapa Māori environments could be related to Māori expectations regarding levels of manaakitanga (caring and showing respect for others) and whakawhanaungatanga (relationship building) to support and sustain them, when in fact issues such as iwi/hapū conflict and tribalism may give rise to higher levels of interpersonal conflict.
Finally, the finding that respondents working in a mainstream environment reported having fewer coping strategies than their kaupapa Māori counterparts may reflect the lower access to cultural supervision and Māori peer support in mainstream environments, highlighting the importance of cultural safety in the workplace. Management in mainstream health environments need to be aware that providing a range of workplace supports for their staff, especially culturally responsive supports, will increase Māori health workers ability to cope with the workplace demands they face.
ConclusionOccupational stress and wellbeing
for Māori working in the Aotearoa New Zealand health and disability sector have to date received little research attention. According to the Ministry of Health (2006) Māori are under-represented in the health and disability workforce, but health disparities for Māori in the wider population persist. The question is, how can Māori patients or clients receive the best possible health services if our Māori health workforce are experiencing high levels of occupational stress? The present research reveals that while Māori staff experience occupational stress in some of the same ways as their non-Māori counterparts, they also
New Zealand Journal of Psychology Vol. 44 No. 2, September 2015• 88 •
L. Stewart, D. Gardner
experience it in uniquely different ways as well. In developing Mahi Oranga, it is hoped that the challenges faced by Māori staff in the health and disability sector become more widely known about and acknowledged so that action can be taken to address those challenges. In addition, Mahi Oranga could be a very useful tool for organisations to identify the challenges specific to their organisation, but also to identify what they are doing well.
ReferencesBentley, T., Catley, B., Cooper-Thomas,
H., Gardner, D., O’Driscoll, M. P., & Trenberth, L. (2009). Understanding stress and bullying in New Zealand workplaces: Final report to OH&S Steering Committee. Auckland: Massey University/The University of Auckland/The University of Waikato/Birkbeck University of London. Retrieved from http://www.massey.ac.nz/massey/fms//Massey%20News/2010/04/docs/Bentley-et-al-report.pdf.
Carver, C. S. (1997). You want to measure coping but your protocol’s too long: Consider the Brief COPE. International Journal of Behavioral Medicine, 4(1), 92-100.
Cohen, S., Kamarck, T., & Mermelstein, R. (1983). A global measure of perceived stress. Journal of Health and Social Behavior, 24(4), 385-396.
Cooper, C. L., & Marshall, J. (1976). Occupational sources of stress: A review of the literature relating to coronary heart disease and mental ill health. Journal of Occupational Psychology, 49(1), 11-28. doi: 10.1111/j.2044-8325.1976.tb00325.x
Durie, M. (1998). Waiora: Māori health and development (2nd ed.). Auckland, New Zealand: Oxford University Press.
Foster, B., Mackie, B., & Barnett, N. (2004). Bullying in the health sector: A study of bullying of nursing students. New Zealand Journal of Employment Relations, 29(2), 67-83.
Hart, P., Wearing, A., & Headley, B. (1993). Assessing police work experiences: Development of the police daily hassles and uplifts scales. Journal of Criminal Justice, 21(6), 553-572. doi: 10.1016/0047-2352(93)90043-M.
Jamal, M. (1984). Job stress and job performance controversy: An empirical assessment. Organizational Behavior and Human Performance, 33(1), 1-21. doi: 10.1016/0030-5073(84)90009-6
Kingi, T., & Durie, M. (2000). “Hua Oranga”: A Māori measure of mental health outcomes. Palmerston North, New Zealand: Te Pūmanawa Hauora, School of Māori Studies, Massey University.
Lazarus, R., & Folkman, S. (1984). Stress, appraisal and coping. New York, NY: Springer Publishing Company.
Maori health workforce funding. (2008, May 23). Scoop Independent News. Retrieved from http://www.scoop.co.nz/stories/PA0805/S00450.htm.
McKenna, B.G., Smith, N. A., Poole, S. J., & Coverdale, J. H. (2003). Horizontal violence: Experiences of Registered Nurses in their first year of practice. Journal of Advanced Nursing, 42(1), 90-96. doi: 10.1046/j.1365-2648.2003.02583.x
Ministry of Health. (2006). Whakatātaka tuarua: Māori health action plan 2006-2011. Wellington, New Zealand: Ministry of Health.
Moore, K. A., & Cooper, C. L. (1996). Stress in mental health professionals: A theoretical overview. International Journal of Social Psychiatry, 42(2), 82-89. doi: 10.1177/002076409604200202
New Zealand Psychologists Board. (2011). Cultural competencies: For psychologists registered under the Health Practitioners Competence Assurance Act (2003) and those seeking to become registered. Wellington, New Zealand: Author.
Nowack, K. M. (1990). Initial development of an inventory to assess stress and health risk. American Journal of Health Promotion, 4(3), 173-180.
Nursing Council of New Zealand. (2005). Guidelines for cultural safety, the Treaty of Waitangi, and Maori health in nursing education and practice. Retrieved from http://www.nursingcouncil.org.nz/download/97/cultural-safety09.pdf.
Osipow, S., & Spokane, A. (1992). Occupational Stress Inventory manual: Research version . Odessa, FL: Psychological Assessment Resources Inc.
Pearlin, L. I., & Schooler, C. (1978). The structure of coping. Journal of Health and Social Behavior, 19(1), 2-21.
Ratima, M., Brown, R., Garrett, N., Wikaire, E., Ngawati, R., Aspin, E., & Potaka, U. (2007). Rauringa raupa: Recrutiment and retention of Māori in the Health and Disability workforce. Auckland, New Zealand: Taupua Waiora, Faculty of Health and Environmental Sciences, AUT University.
Roesch, S. C., & Rowley, A. A. (2005). E v a l u a t i n g a n d d e v e l o p i n g a multidimensional, dispositional measure or appraisal. Journal of Personality Assessment, 85(2), 188-196.
Sarason, I. G., Levine, H. M., Basham, R, B., & Sarason, B. R. (1983). Assessing social support: The Social Support Questionnaire. Journal of Personality and Social Psychology, 44(1), 127-139. doi: 10.1037/0022-3514.44.1.127.
Sarason, I. G., Sarason, B, R., Shearin, E N., & Pierce, G. R. (1987). A brief measure of social support: Practical and theoretical implications. Journal of Social and Personal Relationships, 4(4), 497-510. doi: 10.1177/0265407587044007.
Simon, V. (2004). A snapshot of Maori nurses’ health and safety issues. Kai Tiaki: Nursing New Zealand. Downloaded from http://www.thefreelibrary.com/_/print/PrintArticle.aspx?id=125648502.
Sisley, R., & Waititi, D. (1997). Te pikaunga-mahi me te kohukihuki (Workload and stress): A national survey of Maori ASTE Te Hau Takitini o Aotearoa members. Association of Staff in Tertiary Education, Wellington, New Zealand: New Zealand Council for Educational Research.
Skinner, N., & Brewer, N. (2002). The dynamics of threat and challenge appraisals prior to stressful achievement events. Journal of Personality and Social Psychology, 83(3), 678-692.
Spector, P., & Jex, S. (1998). Development of four self-report measures of job stressors and strain: Interpersonal Conflict at Work Scale, Organizational Constraints Scale, Quantitative Workload Inventory, and Physical Symptoms Inventory. Journal of Occupational Health Psychology, 3(4), 356-367.
Address for correspondenceDr Dianne GardnerSchool of PsychologyMassey University ManawatuPalmerston North 4442New ZealandWork phone: 64 6 356 9099 x 43441Email: [email protected]

• 89 •New Zealand Journal of Psychology Vol. 44 No. 2, September 2015
Migrant Personality
The Migrant Personality Revisited: Individual Differences and International Mobility Intentions
Aidan S. Tabor, Taciano L. Milfont, Colleen Ward Victoria University, Wellington
Why do some people self-select migration while so many others stay? In a sample of 205 adults born and currently living in New Zealand, 38.5% were planning to move abroad. Using logistical regression techniques, it was found that higher persistence, openness to experience as well as previous experience living internationally all increased the chances that a participant was planning to move abroad. Higher agreeableness and conscientiousness lowered the odds of a move. Men who were lower in emotional stability were more likely to want to leave, but the same effect was not found for women.
Keywords: emigration, personality, immigration, Big Five, New Zealand
W h a t d r i v e s i n t e r n a t i o n a l migration? Many theoretical models trying to answer this question focus on financial causes of international migration (Boyle, 2009; Sjastaad, 1962; Stark & Taylor, 1989; Todaro, 1969). Perhaps this focus on financial causes of migration is due to the fact that the majority of research into international migration decision-making examines people coming from poorer countries to more affluent countries, for example Philippines-USA migration, Niue-New Zealand migration and West African-Netherlands migration (Connell, 2008; De Jong, Root, Gardner, Fawcett, & Abad, 1986; Hamer, 2008). In contrast, research into the phenomenon of people leaving first world countries is much rarer (Benson & O’Reilly, 2009; Dashefsky, DeAmicis, Laserwitz, & Tabory, 1992; Stone & Stubbs, 2007; Tabor & Milfont, 2011; van Dalen & Henkens, 2007). To understand self-selected migration in all its diverse forms, further exploration of the migration decisions of people living in first world countries is needed.
One case of migration from a first world country is New Zealand, where emigration is quite common. Most OECD countries have less than 10% of their highly skilled citizens living abroad, but New Zealand is ranked first (along with Ireland) at 24.2% (Dumont & Lemaitre, 2004). For a country of just over 4 million people, having
as many as a million citizens living abroad is a startling notion (Statistics New Zealand, 2012). Historically, there have been several prolonged periods of negative net migration (more people leaving than arriving), the most recent of which occurred in 2011/2012 (Labour & Immigration Research Centre, 2013).
A former British colony, New Zealand is a relatively safe, scenic country with low unemployment (Fairweather & Swaffield, 2001; MacPherson, 2013; United Nations Office Drugs and Crime, 2012). So why would many leave? Previous research has connected this high outward mobility with several cultural factors, primarily the acceptance of an overseas experience as a rite of passage for young New Zealanders (Haverig & Roberts, 2011; Wilson, 2006; Wilson, Fisher, & Moore, 2009). Another facilitating factor in the outflow of New Zealanders was the Trans-Tasman Travel Arrangement of 1973, which gave New Zealand citizens the right to live and work in Australia indefinitely (Smith, 2012). As of 2006, 16.1% of prime working age New Zealanders (aged 25-54) were actually working in Australia (Haig, 2010). New Zealand is much smaller in terms of both population and land compared to countries such as the USA or Canada, and therefore the sudden loss of workers, friends and relatives is keenly felt (Ongley & Pearson, 1995).
The question remains, why do some living in affluent countries choose to go and others stay?
While financial causes may explain international migration from poorer to richer nations, individual differences are more likely to explain international migration for those already living in relatively rich countries. Bonka Boneva and Irene Frieze, who pioneered the concept of a migrant personality, wrote that “unfavorable economies in the country of origin, emigration and immigration policies, network support in the receiving country, and other environmental factors create the conditions for wanting to leave, but desires to do so are based on the personality of those who make the choice” (Boneva & Frieze, 2001, p. 478).
Though Boneva and Frieze termed their work ‘migrant personality’ the actual topic of their studies was motivational differences such as work centrality, rather than personality characteristics per se. We contend that personality characteristics and motivational differences should be tested together for their relationship to migration intentions.
Personality characteristics as predictors of migration intention
Previous studies have linked a number of Big Five factors to both migration intention and behaviour. Compared to those who remained in New Zealand, those who moved abroad when they were over the age of 18 were higher in well-being and social potency, both of which are related to extraversion (Tellegen & Waller, 2008), as well as being lower in stress reaction and aggression, traditionalism, harm avoidance, and control (related t o c o n s c i e n t i o u s n e s s ) . T h u s , extraversion and conscientiousness seem related to migration propensity.

New Zealand Journal of Psychology Vol. 44 No. 2, September 2015• 90 •
A. S. Tabor, T. L. Milfont, C. Ward
H1: Conscientiousness will predict decreased migration intention, and H2: Extraversion will predict increased migration intention.
As there is a tendency for migrants to seek new experiences in their destination (Tabor, 2010; Tabor & Milfont, 2011), openness to experience should strongly predict migration intention. Indeed, openness to experience influenced migration in a series of studies by Otto and Dalbert (2012), who found that openness to experience was related to willingness to relocate for a job among unemployed individuals. Jokela (2009) used longitudinal data from 3,760 adults finding that openness and extraversion predicted increased within state (short distance) mobility, but when these were controlled for agreeableness also predicted migration. Similarly, in a study of three small islands off the coast of Italy, differences in Big Five personality traits were found between leavers and stayers (Camperio Ciani, Capiluppi, Veronese, & Sartori, 2006). The researchers reported that of the more than 200 emigrants from the islands sampled, the leavers were more extraverted and open to experience than those who chose to stay on the islands. This lends support to the notion that openness is key in mobility, and therefore relevant to international migration decision-making. H3: Openness to experience will predict increased migration intention, and H4: Agreeableness will predict decreased migration intention.
Emotional stability has also been linked to migration in a longitudinal twin study conducted in Finland and Sweden (Silventoinen et al., 2008). The male migrants were less emotionally stable and less extraverted compared to non-migrants, but the same was not true for women. H5: Gender will moderate the relationship between emotional stability and intention to migrate. Persistence
Given the thirst for adventure, it is somewhat surprising to note that persistence and patience are also likely characteristics of migrants. In a study of online forums for migrants to New Zealand, participants “explicitly acknowledged the amount of fortitude and perseverance needed to successfully make it through the migration process”
(Tabor & Milfont, 2011, p. 825). High achieving Pacific emigrants were also significantly higher in patience than those who did not migrate (Gibson & McKenzie, 2011). Indeed, the effect of patience was roughly twice as strong as risk-seeking. Possibly due to the long-term nature of the migration decision process for many migrants, the ability and will to persist is an important characteristic. Thus, this trait might also be necessary when planning to migrate. H6: Persistence will predict increased migration intention.
Motivational differences Work and family centrality.
Family centrality is the tendency to place family at the centre of one’s life and priorities, whereas work centrality places career at the centre of one’s priorities (Frieze, et al., 2004; Misra, Ghosh, & Kanungo, 1990). These variables are independent, since placing a high value on family does not necessarily mean someone will place low value on their work. In studies with university students in Eastern Europe, high work centrality and low family centrality were related to intention to migrate (Frieze, et al., 2004), and the same results were found for university students’ intentions to internally migrate within the USA (Frieze, Hansen, & Boneva, 2006). High work centrality is therefore predicted to strongly increase intention to migrate. H7: High work centrality will predict increased migration intention.
In sum, the role of individual differences in international migration decision-making has been proposed, but only tested on a limited basis, and frequently with university student samples. Additionally, no single study has explored all Big Five traits, and the relevant facet of persistence, along with the more traditional migrant personality characteristics of work-centrality for their relative predictive abilities. The present study aims to conduct an omnibus test of individual difference factors that have been demonstrated as relevant to predicting migration intentions and test them in the context of New Zealand adults’ decision making on international migration.
Method
SampleThe present study was part of
a larger project investigating New Zealanders who were planning to leave as well as those who had no intention of leaving. Of the 854 people who began the online migration survey, 700 completed enough of the questions to be included (82%), but 495 of them were born outside of New Zealand and were therefore excluded from this analysis. The final sample had 205 New Zealand-born participants who were currently residing in New Zealand (86 males and 117 females). The average age was 31.54 (SD=12.35, range 18-74 years), most were currently in a committed relationship (56%) and only 26.2% had children. Most were well educated: 40% had a bachelor’s degree, 15.9% held a technical certification, 7.2% honours or master’s degree and 2.6% held doctorates. When asked as an open-ended question, ethnic groups were reported as follows: 62% New Zealand European/Pakeha, 10.9% British/other European, 4.2% Maori, 2.6% Asian, .5% South Asian, 3.9% mixed heritage, .5% Latino/Hispanic, 12.7% Kiwi/New Zealander, and 13 people did not report any ethnic group.
Seventy-nine participants (38.5%) were currently considering or planning on moving internationally. Of those who were planning to leave, only 11.4% planned to do so within the next year, 45.6% intended to leave between 1-3 years from now, and 25% planned to leave 3 or more years from now. The largest group (50.7%) had been considering migration for the past 1-3 years, another 34.3% had considered migration for more than 3 years, and a few had been considering it for less than a year (14.9%). Most (55.7%) planned to remain abroad for more than 5 years or indefinitely. Australia (35.4%), USA (22.8%), UK (17.7%) and Canada (8%) were the most common destinations.
InstrumentsBig Five Personality dimensions.
The Ten Item Personality Inventory was used to measure the Big Five with two items for each of the dimensions (Gosling, Rentfrow, & Swann, 2003). Items were rated on a 7-point scale
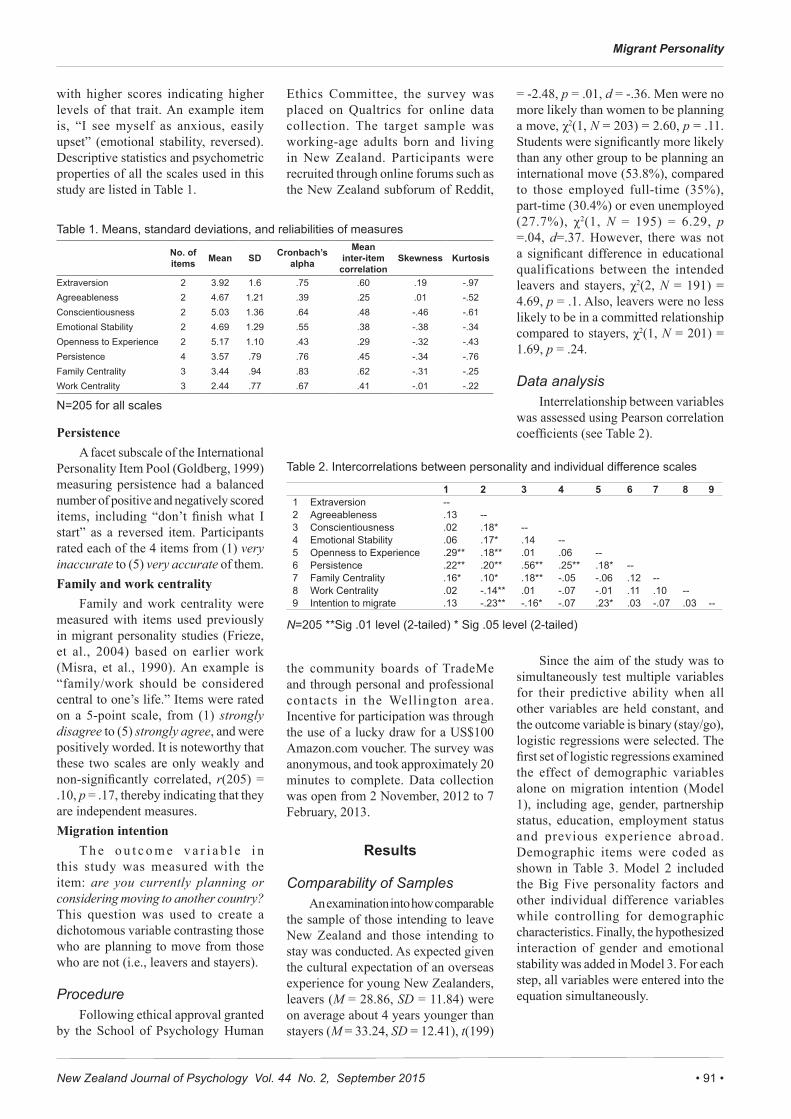
• 91 •New Zealand Journal of Psychology Vol. 44 No. 2, September 2015
Migrant Personality
with higher scores indicating higher levels of that trait. An example item is, “I see myself as anxious, easily upset” (emotional stability, reversed). Descriptive statistics and psychometric properties of all the scales used in this study are listed in Table 1.
PersistenceA facet subscale of the International
Personality Item Pool (Goldberg, 1999) measuring persistence had a balanced number of positive and negatively scored items, including “don’t finish what I start” as a reversed item. Participants rated each of the 4 items from (1) very inaccurate to (5) very accurate of them.Family and work centrality
Family and work centrality were measured with items used previously in migrant personality studies (Frieze, et al., 2004) based on earlier work (Misra, et al., 1990). An example is “family/work should be considered central to one’s life.” Items were rated on a 5-point scale, from (1) strongly disagree to (5) strongly agree, and were positively worded. It is noteworthy that these two scales are only weakly and non-significantly correlated, r(205) = .10, p = .17, thereby indicating that they are independent measures.Migration intention
T h e o u t c o m e v a r i a b l e i n this study was measured with the item: are you currently planning or considering moving to another country? This question was used to create a dichotomous variable contrasting those who are planning to move from those who are not (i.e., leavers and stayers).
ProcedureFollowing ethical approval granted
by the School of Psychology Human
Ethics Committee, the survey was placed on Qualtrics for online data collection. The target sample was working-age adults born and living in New Zealand. Participants were recruited through online forums such as the New Zealand subforum of Reddit,
the community boards of TradeMe and through personal and professional contacts in the Wellington area. Incentive for participation was through the use of a lucky draw for a US$100 Amazon.com voucher. The survey was anonymous, and took approximately 20 minutes to complete. Data collection was open from 2 November, 2012 to 7 February, 2013.
Results
Comparability of SamplesAn examination into how comparable
the sample of those intending to leave New Zealand and those intending to stay was conducted. As expected given the cultural expectation of an overseas experience for young New Zealanders, leavers (M = 28.86, SD = 11.84) were on average about 4 years younger than stayers (M = 33.24, SD = 12.41), t(199)
= -2.48, p = .01, d = -.36. Men were no more likely than women to be planning a move, χ2(1, N = 203) = 2.60, p = .11. Students were significantly more likely than any other group to be planning an international move (53.8%), compared to those employed full-time (35%), part-time (30.4%) or even unemployed (27.7%), χ2(1, N = 195) = 6.29, p =.04, d=.37. However, there was not a significant difference in educational qualifications between the intended leavers and stayers, χ2(2, N = 191) = 4.69, p = .1. Also, leavers were no less likely to be in a committed relationship compared to stayers, χ2(1, N = 201) = 1.69, p = .24.
Data analysisInterrelationship between variables
was assessed using Pearson correlation coefficients (see Table 2).
Since the aim of the study was to simultaneously test multiple variables for their predictive ability when all other variables are held constant, and the outcome variable is binary (stay/go), logistic regressions were selected. The first set of logistic regressions examined the effect of demographic variables alone on migration intention (Model 1), including age, gender, partnership status, education, employment status and previous experience abroad. Demographic items were coded as shown in Table 3. Model 2 included the Big Five personality factors and other individual difference variables while controlling for demographic characteristics. Finally, the hypothesized interaction of gender and emotional stability was added in Model 3. For each step, all variables were entered into the equation simultaneously.
Table 1. Means, standard deviations, and reliabilities of measures
No. of items Mean SD Cronbach’s
alpha
Mean inter-item
correlationSkewness Kurtosis
Extraversion 2 3.92 1.6 .75 .60 .19 -.97Agreeableness 2 4.67 1.21 .39 .25 .01 -.52Conscientiousness 2 5.03 1.36 .64 .48 -.46 -.61Emotional Stability 2 4.69 1.29 .55 .38 -.38 -.34Openness to Experience 2 5.17 1.10 .43 .29 -.32 -.43Persistence 4 3.57 .79 .76 .45 -.34 -.76Family Centrality 3 3.44 .94 .83 .62 -.31 -.25Work Centrality 3 2.44 .77 .67 .41 -.01 -.22
N=205 for all scales
Table 2. Intercorrelations between personality and individual difference scales
1 2 3 4 5 6 7 8 91 Extraversion --2 Agreeableness .13 --3 Conscientiousness .02 .18* --4 Emotional Stability .06 .17* .14 --5 Openness to Experience .29** .18** .01 .06 --6 Persistence .22** .20** .56** .25** .18* --7 Family Centrality .16* .10* .18** -.05 -.06 .12 --8 Work Centrality .02 -.14** .01 -.07 -.01 .11 .10 --9 Intention to migrate .13 -.23** -.16* -.07 .23* .03 -.07 .03 --
N=205 **Sig .01 level (2-tailed) * Sig .05 level (2-tailed)
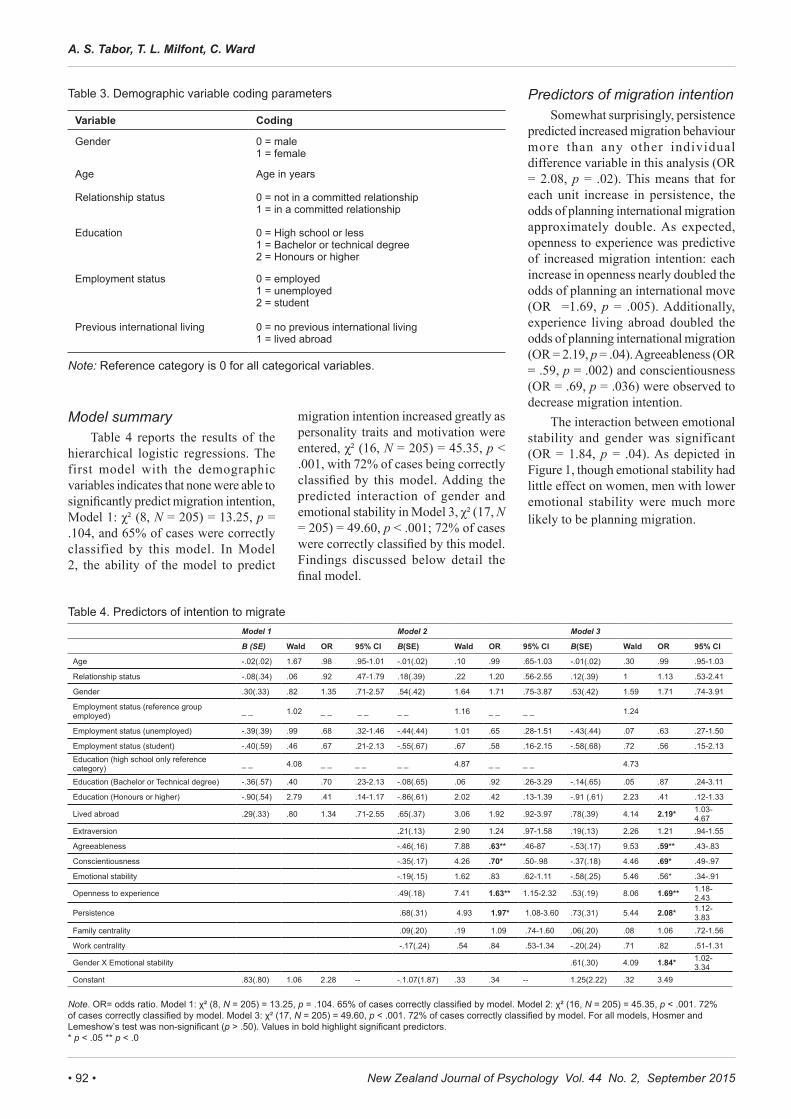
New Zealand Journal of Psychology Vol. 44 No. 2, September 2015• 92 •
A. S. Tabor, T. L. Milfont, C. Ward
Model summaryTable 4 reports the results of the
hierarchical logistic regressions. The first model with the demographic variables indicates that none were able to significantly predict migration intention, Model 1: χ² (8, N = 205) = 13.25, p = .104, and 65% of cases were correctly classified by this model. In Model 2, the ability of the model to predict
migration intention increased greatly as personality traits and motivation were entered, χ² (16, N = 205) = 45.35, p < .001, with 72% of cases being correctly classified by this model. Adding the predicted interaction of gender and emotional stability in Model 3, χ² (17, N = 205) = 49.60, p < .001; 72% of cases were correctly classified by this model. Findings discussed below detail the final model.
Predictors of migration intention Somewhat surprisingly, persistence
predicted increased migration behaviour more than any other individual difference variable in this analysis (OR = 2.08, p = .02). This means that for each unit increase in persistence, the odds of planning international migration approximately double. As expected, openness to experience was predictive of increased migration intention: each increase in openness nearly doubled the odds of planning an international move (OR =1.69, p = .005). Additionally, experience living abroad doubled the odds of planning international migration (OR = 2.19, p = .04). Agreeableness (OR = .59, p = .002) and conscientiousness (OR = .69, p = .036) were observed to decrease migration intention.
The interaction between emotional stability and gender was significant (OR = 1.84, p = .04). As depicted in Figure 1, though emotional stability had little effect on women, men with lower emotional stability were much more likely to be planning migration.
Table 3. Demographic variable coding parameters
Variable Coding
Gender 0 = male1 = female
Age Age in years
Relationship status 0 = not in a committed relationship 1 = in a committed relationship
Education 0 = High school or less1 = Bachelor or technical degree2 = Honours or higher
Employment status 0 = employed1 = unemployed2 = student
Previous international living 0 = no previous international living1 = lived abroad
Note: Reference category is 0 for all categorical variables.
Table 4. Predictors of intention to migrate Model 1 Model 2 Model 3
B (SE) Wald OR 95% CI B(SE) Wald OR 95% CI B(SE) Wald OR 95% CI
Age -.02(.02) 1.67 .98 .95-1.01 -.01(.02) .10 .99 .65-1.03 -.01(.02) .30 .99 .95-1.03
Relationship status -.08(.34) .06 .92 .47-1.79 .18(.39) .22 1.20 .56-2.55 .12(.39) 1 1.13 .53-2.41
Gender .30(.33) .82 1.35 .71-2.57 .54(.42) 1.64 1.71 .75-3.87 .53(.42) 1.59 1.71 .74-3.91
Employment status (reference group employed) _ _ 1.02 _ _ _ _ _ _ 1.16 _ _ _ _ 1.24
Employment status (unemployed) -.39(.39) .99 .68 .32-1.46 -.44(.44) 1.01 .65 .28-1.51 -.43(.44) .07 .63 .27-1.50
Employment status (student) -.40(.59) .46 .67 .21-2.13 -.55(.67) .67 .58 .16-2.15 -.58(.68) .72 .56 .15-2.13
Education (high school only reference category) _ _ 4.08 _ _ _ _ _ _ 4.87 _ _ _ _ 4.73
Education (Bachelor or Technical degree) -.36(.57) .40 .70 .23-2.13 -.08(.65) .06 .92 .26-3.29 -.14(.65) .05 .87 .24-3.11
Education (Honours or higher) -.90(.54) 2.79 .41 .14-1.17 -.86(.61) 2.02 .42 .13-1.39 -.91 (.61) 2.23 .41 .12-1.33
Lived abroad .29(.33) .80 1.34 .71-2.55 .65(.37) 3.06 1.92 .92-3.97 .78(.39) 4.14 2.19* 1.03-4.67
Extraversion .21(.13) 2.90 1.24 .97-1.58 .19(.13) 2.26 1.21 .94-1.55
Agreeableness -.46(.16) 7.88 .63** .46-87 -.53(.17) 9.53 .59** .43-.83
Conscientiousness -.35(.17) 4.26 .70* .50-.98 -.37(.18) 4.46 .69* .49-.97
Emotional stability -.19(.15) 1.62 .83 .62-1.11 -.58(.25) 5.46 .56* .34-.91
Openness to experience .49(.18) 7.41 1.63** 1.15-2.32 .53(.19) 8.06 1.69** 1.18-2.43
Persistence .68(.31) 4.93 1.97* 1.08-3.60 .73(.31) 5.44 2.08* 1.12-3.83
Family centrality .09(.20) .19 1.09 .74-1.60 .06(.20) .08 1.06 .72-1.56
Work centrality -.17(.24) .54 .84 .53-1.34 -.20(.24) .71 .82 .51-1.31
Gender X Emotional stability .61(.30) 4.09 1.84* 1.02-3.34
Constant .83(.80) 1.06 2.28 -- -.1.07(1.87) .33 .34 -- 1.25(2.22) .32 3.49
Note. OR= odds ratio. Model 1: χ² (8, N = 205) = 13.25, p = .104. 65% of cases correctly classified by model. Model 2: χ² (16, N = 205) = 45.35, p < .001. 72% of cases correctly classified by model. Model 3: χ² (17, N = 205) = 49.60, p < .001. 72% of cases correctly classified by model. For all models, Hosmer and Lemeshow’s test was non-significant (p > .50). Values in bold highlight significant predictors.* p < .05 ** p < .0

• 93 •New Zealand Journal of Psychology Vol. 44 No. 2, September 2015
Migrant Personality
DiscussionThis study supports the overall
view that personality traits influence international voluntary migration. What personality traits predict migration intention? Confirming previous research, the odds someone is considering or planning international migration are increased if they are more open to experience (Jokela, 2009) or persistent (Gibson & McKenzie, 2011; Tabor & Milfont, 2011). People are less likely to leave if they are highly agreeable or contentious.
The roots of migration desireSelf-selected migration is, by its
very nature, a function of individual differences. The desire to live in another country often starts very early in life and must be sustained over a period of years until the circumstances are ripe for departure (Tabor, 2014; Yijälä & Jasinskaja-Lahti, 2010). Only two previous studies had reported persistence or patience as important personality characteristics of migrants (Gibson & McKenzie, 2011; Tabor & Milfont, 2011). After including all considered individual differences in the model predicting migration intention, persistence was a strong predictor of migration, doubling the odds that a person was planning to migrate for each increase in persistence. But why is persistence so important in the decision? The items on the persistence scale focused on goals, overcoming
obstacles, and completing tasks. In and of themselves, these are not related to migration. However, if combined with a desire to live abroad, they would be highly important for a successful move. The migration process is complex and stressful, thus anyone who was not able to persist through difficulties would likely be eliminated in the early stages. It is likely that many people in a society have a passing thought of moving abroad, but what sets apart those who dream and those who migrate is perseverance toward the goal.
Persistence also helps explain low mobility levels, which has perplexed and frustrated researchers (Arango, 2000; van Dalen & Henkens, 2012b). If persistence is essentially a requirement of migration, and it is normally distributed in the population, only the most persistent would be able to complete the process. Given that only a minority of those with high persistence as a trait would want to migrate, this brings clarity to the problem of understanding why so few move even when economic conditions are ripe for departure. This finding also helps to explain how migrants endure delays of up to 13 years for approval in some countries (Jasinskaja-Lahti & Yijälä, 2011).
It is interesting to note just how long persistence has been considered a trait of migrants to New Zealand. A 1932 article claimed early arrivals had “grit, perseverance and faith” (The Dominion of New Zealand, quoted in
Wolfe, 2012, p. 30). This concept of grit has modern traction. In their paper on the subject, Duckworth, Peterson, Matthews and Kelly (2007) wrote “the gritty individual not only finishes the tasks at hand but pursues a given aim over years” (p. 1089). The success or failure of an endeavour, be it migration or any other real life achievement, is dependent on many factors, but it is clear that persisting over time is an essential requirement. These migrants would also have this personality trait as a resource during their acculturation, which is important because perseverance has been linked to resiliency (Casanova, 2012).
Like international studies of long distance moves (Camperio Ciani, et al., 2006; Jokela, 2009), leavers are also more open to experience. McCrae (1987) wrote that closed people were “more comfortable with the familiar and have little incentive to try the new” (1987, p. 1259), whereas open people “are adventurous, bored by familiar sights, and stifled by routine” (McCrae & Costa, 1997, p. 825). These sentiments are clearly at play in the decision to move internationally, and the present study lends support for the importance of openness to experience in self-selected migration. This may also explain why previous international living increased the chances of planning another move abroad, as these open individuals continue to seek new experiences.
People who were more agreeable and conscientious were also less likely to be planning an international move. In one study, agreeableness was also found to predict decreased migration (Jokela, 2009), however there was no significant relationship with conscientiousness in their study. There was a mean group difference in conscientiousness in an Italian study (Camperio Ciani, et al., 2006; Ciani & Capiluppi, 2011), with migrants having significantly lower conscientiousness than stayers. It is possible that very agreeable and conscientious people are more content, and therefore less likely to focus on negative evaluations of their present environment that can lead to a desire to move (van Dalen & Henkens, 2012b). This negative evaluation, and perhaps unsettled feeling may also explain why,
Figure 1. Interaction of gender and emotional stability on migration intention

New Zealand Journal of Psychology Vol. 44 No. 2, September 2015• 94 •
A. S. Tabor, T. L. Milfont, C. Ward
as reported in a Scandinavian study (Silventoinen, et al., 2008), men who were less emotionally stable were more likely to be planning a departure. It may also be the case that agreeable people form stronger emotional attachments which in turn may make them less inclined to leave close associates (Marusic, Kamenov, & Jelic, 2011; Polek, Van Oudenhoven, & Berge, 2011).
Unlike Boneva and Frieze’s earlier findings (Frieze, et al., 2004), work centrality and family centrality had no significant impact on migration intention. This may have been because we sampled from adult, rather than predominantly university student populations. This demonstrates the need to sample from diverse populations beyond university settings to capture the full spectrum of personality characteristics of migrants.
Limitations and further researchCross-sectional studies are always
limited when the topic of research is essentially a process. It has been well established that migration intention and behaviour are not perfectly correlated (De Jong, Root, Gardner, Fawcett, & Abad, 1986; van Dalen & Henkens, 2012a). However the intention to migrate is effectively the first step in the process, and therefore deserves careful study. Additional studies that take a longitudinal perspective, following the example of Russia-Finnish migration research (Jasinskaja-Lahti & Yijälä, 2011; Mähönen & Jasinskaja-Lahti, 2013; Yijälä & Jasinskaja-Lahti, 2010), are needed. Additionally, because financial issues are so often discussed as pivotal in the migration decision, socio-economic status and relative deprivation would be useful to consider in further research.
It is clear that personality factors influence who self-selects migration and who does not. This study has reaffirmed the role of persistence and openness to experience as important traits linked to migration, and challenges researchers to consider the impact of individual differences as critical aspects of immigration above and beyond economic considerations.
ReferencesArango, J. (2000). Explaining migration:
A critical view. International Social Science Journal, 52(165), 283-296. doi: 10.1111/1468-2451.00259
Benson, M. C., & O’Reilly, K. (2009). Migration and the search for a better way of life: a critical exploration of lifestyle migration. The Sociological Review, 57(4), 608-625. doi: 10.1111/j.1467-954X.2009.01864.x
Boneva, B. S., & Frieze, I. H. (2001). Toward a concept of a migrant personality. Journal of Social Issues, 57(3), 477-491. doi: 10.1111/0022-4537.00224
Boyle, P. (2009). Migration. In K. Rob & T. Nigel (Eds.), International Encyclopedia of Human Geography (pp. 96-107). Oxford: Elsevier.
Camperio Ciani, A., Capiluppi, C., Veronese, A., & Sartori, G. (2006). The adaptive value of personality differences revealed by small island population dynamics. European Journal of Personality, 21(1), 3-22. doi: 10.1002/per.595
Casanova, S. (2012). The stigmatization and resilience of a female indigenous Mexican immigrant. Hispanic Journal of Behavioral Sciences, 34(3), 375-403. doi: 10.1177/0739986312449584
Ciani, A. C., & Capiluppi, C. (2011). Gene flow by selective emigration as a possible cause for personality differences between small islands and mainland populations. European Journal of Personality, 25(1), 53-64. doi: 10.1002/per.774
Connell, J. (2008). Niue: Embracing a culture of migration. Journal of Ethnic and Migration Studies, 34(6), 1021-1040.
Dashefsky, A., DeAmicis, J., Laserwitz, B., & Tabory, E. (1992). Americans abroad: A comparative study of emigrants from the United States. New York: Plenum Press.
De Jong, G. F., Root, B. D., Gardner, R. W., Fawcett, J. T., & Abad, R. G. (1986). Migration intentions and behavior: Decision making in a rural Philippine province. Population and Environment, 8(1-2), 41-62. doi: 10.1007/BF01263016
Duckworth, A. L., Peterson, C., Matthews, M. D., & Kelly, D. R. (2007). Grit: Perseverance and passion for long-term goals. Journal of Personality and Social Psychology, 92(6), 1087-1101. doi: 10.1037/0022-3514.92.6.1087
Dumont, J.-C., & Lemaitre, G. (2004). Counting immigrants and expatriates in OECD countries: A new perspective (Vol. Social, Employment and Migration Working Papers): OECD.
Fairweather, J. R., & Swaffield, S. R. (2001). Visitor Experiences of Kaikoura, New Zealand: An interpretative study using photographs of landscapes and Q method. Tourism Management, 22(3), 219-228. doi: http://dx.doi.org/10.1016/S0261-5177(00)00061-3
Frieze, I. H., Boneva, B. S., Sarlija, N., Horvat, J., Ferligoj, A., Kogovsek, T., . . . Jarosova, E. (2004). Psychological differences in stayers and leavers: Emigration desires in Central and Eastern European university students. European Psychologist, 9(1), 15-23. doi: 10.1027/1016-9040.9.1.15
Gibson, J., & McKenzie, D. (2011). The microeconomic determinants of emigration and return migration of the best and brightest: Evidence from the Pacific. Journal of Development Economics, 95(1), 18-29. doi: 10.1016/j.jdeveco.2009.11.002
Goldberg, L. R. (1999). A broad-bandwidth, public domain, personality inventory measuring the lower-level facets of several five-factor models. In I. Mervielde, F. Deary, F. De Fruyt & F. Ostendorf (Eds.), Personality psychology in Europe (Vol. 7, pp. 7-28). Tilberg, The Netherlands: Tilberg University Press.
Gosling, S., Rentfrow, P., & Swann, W. (2003). A very brief measure of the Big-Five personality domains. Journal of Research in Personality, 37, 504-528. doi: 10.1016/S0092-6566(03)00046-1
Haig, R. (2010). Working across the ditch: New Zealanders working in Australia. Wellington: Department of Labour.
Hamer, M. C. (2008). Migration patterns and influence of support networks: A case study of West Africans in the Netherlands. Gender, Technology and Development, 12(3), 347-364. doi: 10.1177/097185240901200304
Haverig, A., & Roberts, S. (2011). The New Zealand OE as governance through freedom: rethinking ‘the apex of freedom’. Journal of Youth Studies, 14(5), 587-603. doi: 10.1080/13676261.2011.565042
Jasinskaja-Lahti, I., & Yijälä, A. (2011). The model of pre-acculturative stress-A pre-migration study of potential migrants from Russia to Finland. International Journal of Intercultural Relations, 35(4), 499-510. doi: 10.1016/j.ijintrel.2010.11.003
Jokela, M. (2009). Personality predicts migration within and between U.S. states. Journal of Research in Personality, 43(1), 79-83. doi: 10.1016/j.jrp.2008.09.005
Labour & Immigration Research Centre. (2013). Migration trends and outlook 2011/2012. Wellington: Ministry of Business, Innovation and Employment.

• 95 •New Zealand Journal of Psychology Vol. 44 No. 2, September 2015
Migrant Personality
MacPherson, L. (2013). Household labour force survey: September 2013 quarter. Wellington: Statistics New Zealand.
Mähönen, T. A., & Jasinskaja-Lahti, I. (2013). Acculturation expectations and experiences as predictors of ethnic migrants’ psychological well-being. Journal of Cross-Cultural Psychology, 44(5), 786-806. doi: 10.1177/0022022112466699
Marusic, I., Kamenov, Z., & Jelic, M. (2011). Personality and attachment to friends. Drustvena Istrazivanja, 20(4), 1119-1137. doi: 10.1002/ per.515
McCrae, R. R. (1987). Creativity, divergent thinking, and openness to experience. Journal of Personality and Social Psychology, 52, 1258-1265.
McCrae, R. R., & Costa, P. T. J. (1997). Conceptions and correlates of opennes to experience. In R. Hogan, J. A. Johnson & S. R. Briggs (Eds.), Handbook of personality psychology. San Diego: Academic Press.
Misra, S., Ghosh, R., & Kanungo, R. N. (1990). Measurement of family involvement: A cross-national study of managers. Journal of Cross-Cultural Psychology, 21(2), 232-248.
Ongley, P., & Pearson, D. (1995). Post-1945 international migration: New Zealand, Australia and Canada compared. International Migration Review, 29(3), 765-793.
O t to , K . , & Da lbe r t , C . ( 2012 ) . Individual differences in job-related relocation readiness: The impact of personality dispositions and social orientations. Career Development International, 17(2), 168-186. doi: 10.1108/13620431211225340
Polek, E., Van Oudenhoven, J. P., & Berge, J. M. F. T. (2011). Evidence for a “Migrant Personality”: Attachment Styles of Poles in Poland and Polish Immigrants in the Netherlands. Journal of Immigrant & Refugee Studies, 9(4), 311-326. doi: 10.1080/15562948.2011.616163
Silventoinen, K., Hammar, N., Hedlund, E., Koskenvuo, M., Rönnemaa, T., & Kaprio, J. (2008). Selective international migration by social position, health behaviour and personality. The European Journal of Public Health, 18(2), 150-155. doi: 10.1093/eurpub/ckm052
Sjastaad, L. A. (1962). The costs and returns of human migration. Journal of Political Economy, 70, 80-93.
Smith, P. M. (2012). Australia and New Zealand - Common culture - updated 13-Jul-12. Te Ara - The encyclopedia of New Zealand Retrieved 8 March, 2013, from http://www.teara.govt.nz/en/australia-and-new-zealand/page-5
Stark, O., & Taylor, J. E. (1989). Relative deprivation and international migration. Demography, 26(1), 1-14.
Statistics New Zealand. (2012). At least 1 million New Zealanders live overseas. Population mythbusters Retrieved March 12, 2013, from http://www.stats.govt.nz/browse_for_stats/population/mythbusters/1mill ion-kiwis-l ive-overseas.aspx
Stone, I., & Stubbs, C. (2007). Enterprising expatriates: Lifestyle migration and entrepreneurship in rural southern Europe. Entrepreneurship and Regional Development, 19(5), 433-450. doi: 10.1080/08985620701552389
Tabor, A. S. (2010). A framework for voluntary migration: Understanding modern British migration to New Zealand. Masters Thesis, Victoria University of Wellington, Wellington, New Zealand.
Tabor, A. S. (2014). International migration-decision making: The peculiar case of New Zealand. PhD, Victoria University of Wellington, Wellington, New Zealand.
Tabor, A. S., & Milfont, T. L. (2011). Migration change model: Exploring the process of migration on a psychological leve l . In ternat ional Journal o f Intercultural Relations, 35 (6), 818-832. doi: 10.1016/j.ijintrel.2010.11.013
Tellegen, A., & Waller, N. G. (2008). Exploring personality through test construction: Development of the multidimensional personality questionnaire. In G. J. Boyle, G. Matthews & D. H. Saklofske (Eds.), The sage handbook of personality theory and assessment (Vol. 2 Personality measurement and testing). Thousand Oaks, CA: Sage.
Todaro, M. P. (1969). A model of labor migration and urban unemployment in less developed countries. American Economic Review, 59(1), 138-148.
United Nations Office Drugs and Crime. (2012). Global study on homicide 2011. New York: United Nations.
van Dalen, H. P., & Henkens, K. (2007). Longing for the good life: Understanding emigration from a high-income country. Population and Development Review, 33(1), 37-66. doi: 10.1111/j.1728-4457.2007.00158.x
van Dalen, H. P., & Henkens, K. (2012a). Explaining emigration intentions and behaviour in the Netherlands, 2005–10. Population Studies, 1-17. doi: 10.1080/00324728.2012.725135
van Dalen, H. P., & Henkens, K. (2012b). Explaining low international labour mobi l i ty : the role of networks , personality, and perceived labour market opportunities. Population Space and Place, 18(1), 31-44. doi: 10.1002/psp.642
Wilson, J. (2006). ‘Unpacking’ the OE: An exploration of the New Zealand ‘Overseas experience’ (Doctoral thesis). Christchurch: Lincoln University.
Wilson, J., Fisher, D., & Moore, K. (2009). The OE goes ‘home’: Cultural aspects of a working holiday experience. Tourist Studies, 9(1), 3-21. doi: 10.1177/1468797609360590
Wolfe, R. (2012). Shaping New Zealand’s identity: The role of tourism publicity. In P. Alsop, G. Stewart & D. Bamford (Eds.), Selling the dream: The art of early New Zealand tourism. Nelson, New Zealand: Craig Potton Publishing.
Yijälä, A., & Jasinskaja-Lahti, I. (2010). Pre-migration acculturation attitudes among potential ethnic migrants from Russia to Finland. International Journal of Intercultural Relations, 34(4), 326-339. doi: 10.1016/j.ijintrel.2009.09.002


