19
January 7, 2013 Volume 5 Number 1
January 7, 2013 Volume 5 Number 1

January 7, 2013 - 2 - KEY INDICATORS 2
• …could put “fiscal cliff” joy in the rearview mirror and begin focusing on earnings season. • Turning to Teaching: Folks once destined for Wall Street are taking up teaching as a
profession, as The New York Times reports… Four years after the financial crisis, Wall Street hiring has remained weak, and many college graduates have searched for jobs and even careers in other fields. In the last several years, hundreds of such would-be finance professionals and management consultants have taken their high-powered ambitions and spreadsheet modeling skills to the classroom. http://nyti.ms/Xk94AS
• Make that COD: The Wall Street Journal reports on governments in Spain and their growing piles of unpaid invoices… Nuria Jarque's company has maintained water-treatment plants in Spain for 25 years, but lately she is being forced to act like a lender of last resort. Local governments across the country, facing a steep drop in revenue and largely unable to borrow from banks or financial markets, have been paying Ms. Jarque and other suppliers of goods and services months behind schedule. http://on.wsj.com/Vm330z
• These Folks Do Have Cash: Another story in The Wall Street Journal discusses Chinese travelers and suitcases of cash… Amid a rush of newly affluent Chinese eager to move money out of China, U.S. and Canadian border officials are seizing large amounts of cash tucked into wallets, purses and suitcases at airports across North America. Officials at Canada's two busiest airports…seized around 12.9 million Canadian dollars ($13 million) in undeclared cash from Chinese nationals from April 2011 through early June 2012… http://on.wsj.com/VZ2XuU
• Reports this Week: Consumer Credit (Tue).
THE MARKETS WE GREET THIS WEEK…
January 7, 2013 - 3 - KEY INDICATORS 3
US EQUITIES FINANCIAL
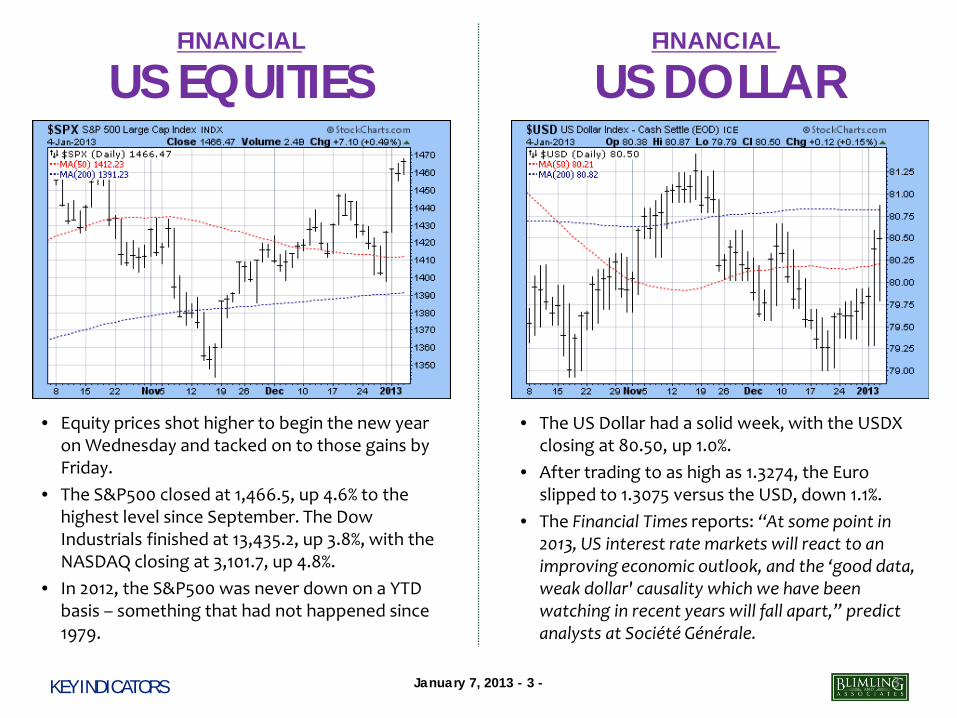
• Equity prices shot higher to begin the new year on Wednesday and tacked on to those gains by Friday.
• The S&P500 closed at 1,466.5, up 4.6% to the highest level since September. The Dow Industrials finished at 13,435.2, up 3.8%, with the NASDAQ closing at 3,101.7, up 4.8%.
• In 2012, the S&P500 was never down on a YTD basis – something that had not happened since 1979.
• The US Dollar had a solid week, with the USDX closing at 80.50, up 1.0%.
• After trading to as high as 1.3274, the Euro slipped to 1.3075 versus the USD, down 1.1%.
• The Financial Times reports: “At some point in 2013, US interest rate markets will react to an improving economic outlook, and the ‘good data, weak dollar' causality which we have been watching in recent years will fall apart,” predict analysts at Société Générale.
FINANCIAL
US DOLLAR
January 7, 2013 - 4 - KEY INDICATORS 4
CHINA EQUITIES FINANCIAL FINANCIAL
VOLATILITY
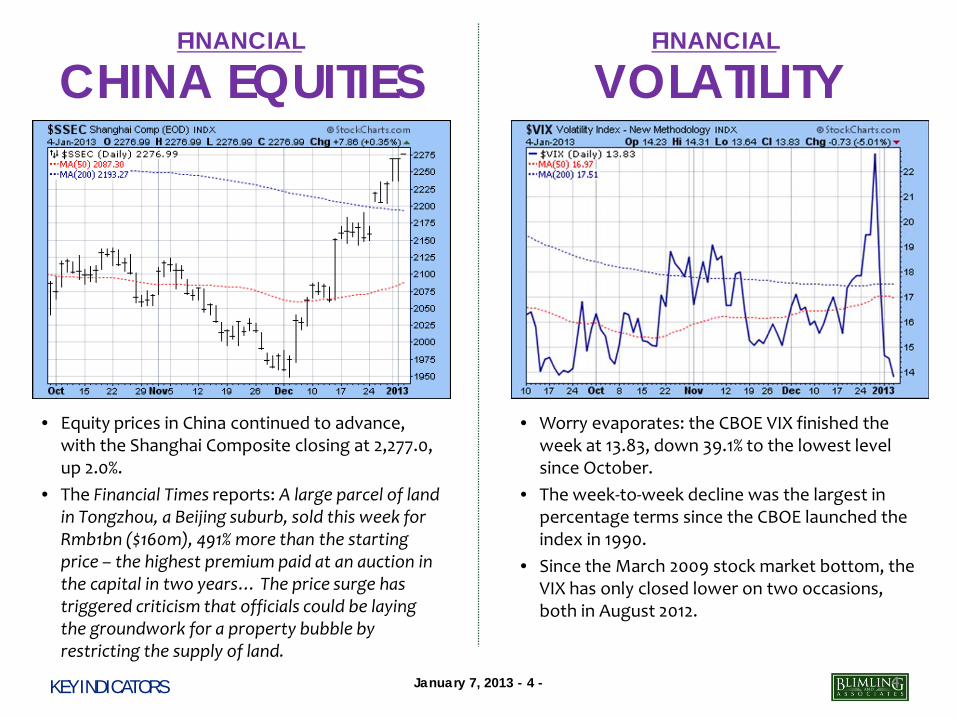
• Equity prices in China continued to advance, with the Shanghai Composite closing at 2,277.0, up 2.0%.
• The Financial Times reports: A large parcel of land in Tongzhou, a Beijing suburb, sold this week for Rmb1bn ($160m), 491% more than the starting price – the highest premium paid at an auction in the capital in two years… The price surge has triggered criticism that officials could be laying the groundwork for a property bubble by restricting the supply of land.
• Worry evaporates: the CBOE VIX finished the week at 13.83, down 39.1% to the lowest level since October.
• The week-to-week decline was the largest in percentage terms since the CBOE launched the index in 1990.
• Since the March 2009 stock market bottom, the VIX has only closed lower on two occasions, both in August 2012.

January 7, 2013 - 5 - KEY INDICATORS 5
• Gold prices lost ground, with nearby futures closing at $1,648.90 per ounce, down 0.6% to the lowest level since August. Silver: $29.95 per ounce, down 0.5%.
• The Financial Times reports: Opinion is split on the outlook for gold this year. Many technical analysts are expecting more range trading in 2013, while others agree that central bank demand and the continued monetary easing among leading countries will put a floor to the gold price…
• Initial jobless claims increased during the week ending December 2, with the Department of Labor reporting 372,000 filings, up 10,0000 versus the week prior but down 3,000 year-over-year.
• Reuters reports: Planned layoffs at U.S. firms fell in December for the first time in four months, while the overall job-cut total in 2012 was the lowest since 1997, a report showed on Thursday.
FINANCIAL
GOLD MACRO
JOBLESS CLAIMS
325,000
350,000
375,000
400,000
425,000
450,000
7-Jan 11-Feb 17-Mar 21-Apr 26-May 30-Jun 4-Aug 8-Sep 13-Oct 17-Nov 22-Dec
WEEKLY UNEMPLOYMENT INITIAL CLAIMS
Source: US Department of Labor
January 7, 2013 - 6 - KEY INDICATORS 6
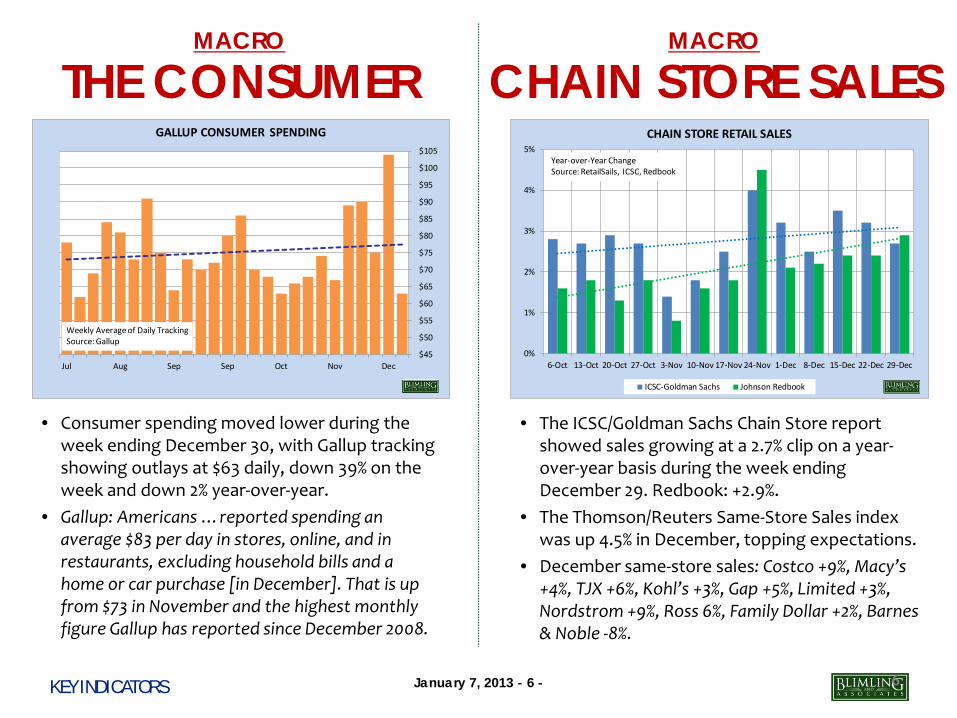
• Consumer spending moved lower during the week ending December 30, with Gallup tracking showing outlays at $63 daily, down 39% on the week and down 2% year-over-year.
• Gallup: Americans …reported spending an average $83 per day in stores, online, and in restaurants, excluding household bills and a home or car purchase [in December]. That is up from $73 in November and the highest monthly figure Gallup has reported since December 2008.
• The ICSC/Goldman Sachs Chain Store report showed sales growing at a 2.7% clip on a year-over-year basis during the week ending December 29. Redbook: +2.9%.
• The Thomson/Reuters Same-Store Sales index was up 4.5% in December, topping expectations.
• December same-store sales: Costco +9%, Macy’s +4%, TJX +6%, Kohl’s +3%, Gap +5%, Limited +3%, Nordstrom +9%, Ross 6%, Family Dollar +2%, Barnes & Noble -8%.
MACRO
THE CONSUMER CHAIN STORE SALES MACRO
$45
$50
$55
$60
$65
$70
$75
$80
$85
$90
$95
$100
$105
Jul Aug Sep Sep Oct Nov Dec
GALLUP CONSUMER SPENDING
Weekly Average of Daily TrackingSource: Gallup
0%
1%
2%
3%
4%
5%
6-Oct 13-Oct 20-Oct 27-Oct 3-Nov 10-Nov 17-Nov 24-Nov 1-Dec 8-Dec 15-Dec 22-Dec 29-Dec
CHAIN STORE RETAIL SALES
ICSC-Goldman Sachs Johnson Redbook
Year-over-Year ChangeSource: RetailSails, ICSC, Redbook

January 7, 2013 - 7 - KEY INDICATORS 7
• Individual investors were are still, on balance, bullish, but by a narrower margin. Nevertheless, the streak with net positive sentiment now extends to six weeks.
• For the week ending January 2, the AAII survey showed 39% bullish (down from 44%), 25% neutral (unchanged) and 36% bearish (up from 30%).
• SentimenTrader shows the “Smart Money” 38% confident in rally, with “Dumb Money” at 50%.
• December made it 26 of the past 27 months with the US economy adding jobs, as the Department of Labor showed 155,000 more people employed. That was down from +360,0000 and +223,000 in December 2011.
• Unemployment rate held steady at 7.8%. • Average workweek was unchanged at 34.5
hours. • Gallup: underemployment at 17.1%
MACRO
BULL/BEAR EMPLOYMENT MACRO
15%
20%
25%
30%
35%
40%
45%
50%
55%
60%
65%
Oct Nov Dec
AAII INVESTOR SENTIMENT SURVEY
Bullish Bearish
Source: American Association of Individual Investors
January 7, 2013 - 8 - KEY INDICATORS 8
CONSTRUCTION MACRO
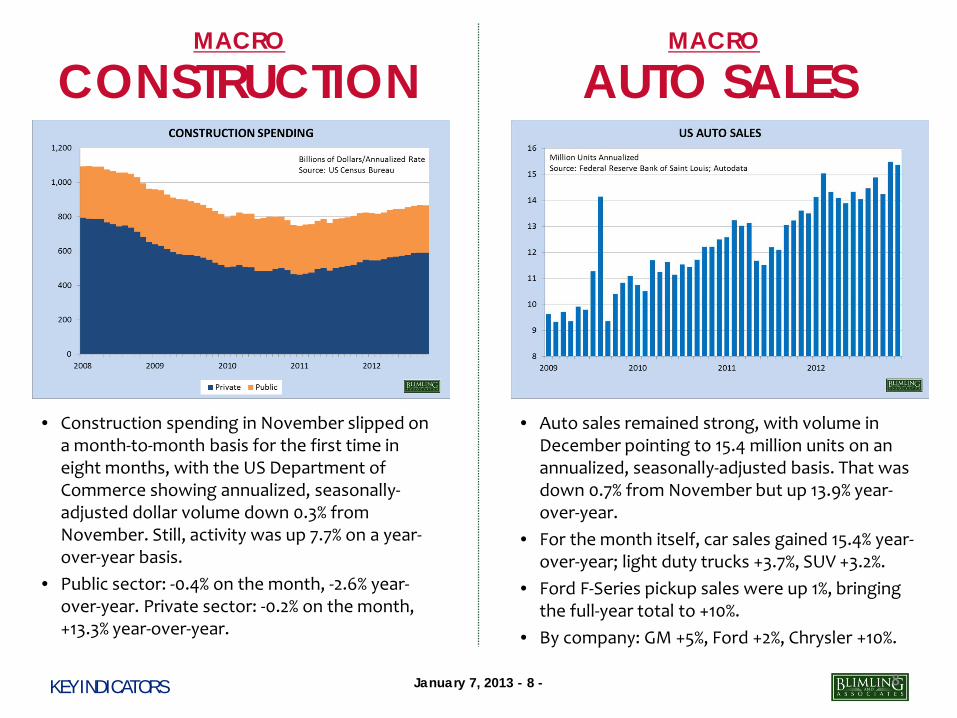
• Construction spending in November slipped on a month-to-month basis for the first time in eight months, with the US Department of Commerce showing annualized, seasonally-adjusted dollar volume down 0.3% from November. Still, activity was up 7.7% on a year-over-year basis.
• Public sector: -0.4% on the month, -2.6% year-over-year. Private sector: -0.2% on the month, +13.3% year-over-year.
• Auto sales remained strong, with volume in December pointing to 15.4 million units on an annualized, seasonally-adjusted basis. That was down 0.7% from November but up 13.9% year-over-year.
• For the month itself, car sales gained 15.4% year-over-year; light duty trucks +3.7%, SUV +3.2%.
• Ford F-Series pickup sales were up 1%, bringing the full-year total to +10%.
• By company: GM +5%, Ford +2%, Chrysler +10%.
MACRO
AUTO SALES
January 7, 2013 - 9 - KEY INDICATORS 9
US PMI MACRO
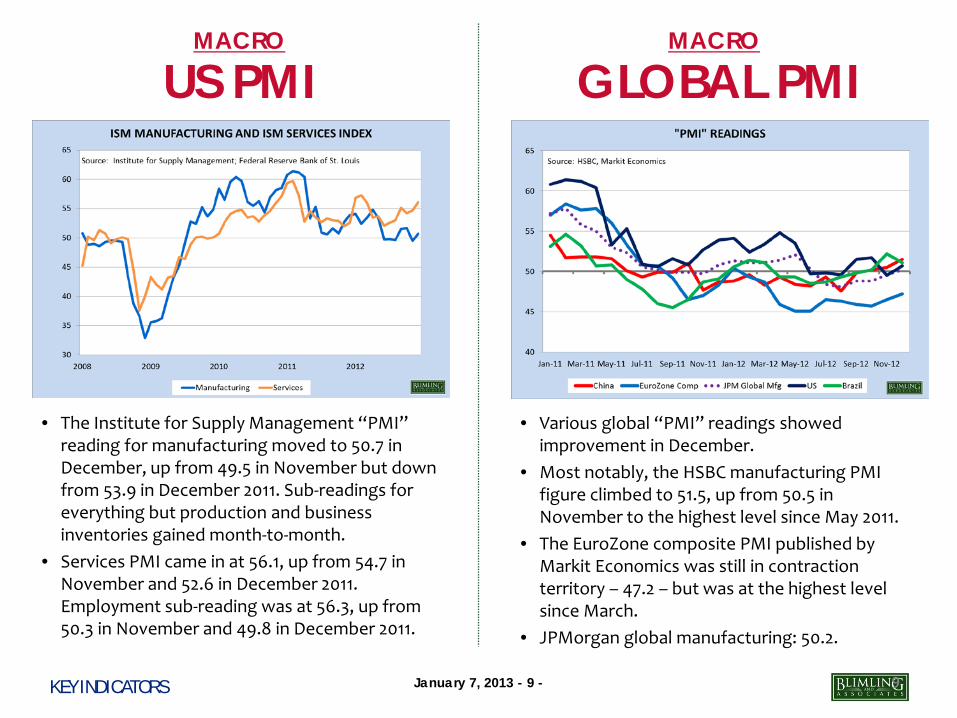
• The Institute for Supply Management “PMI” reading for manufacturing moved to 50.7 in December, up from 49.5 in November but down from 53.9 in December 2011. Sub-readings for everything but production and business inventories gained month-to-month.
• Services PMI came in at 56.1, up from 54.7 in November and 52.6 in December 2011. Employment sub-reading was at 56.3, up from 50.3 in November and 49.8 in December 2011.
• Various global “PMI” readings showed improvement in December.
• Most notably, the HSBC manufacturing PMI figure climbed to 51.5, up from 50.5 in November to the highest level since May 2011.
• The EuroZone composite PMI published by Markit Economics was still in contraction territory – 47.2 – but was at the highest level since March.
• JPMorgan global manufacturing: 50.2.
MACRO
GLOBAL PMI
January 7, 2013 - 10 - KEY INDICATORS 10
NEW ZEALAND WEATHER COMMODITIES
GASOLINE
$1.500
$2.000
$2.500
$3.000
$3.500
$4.000
$4.500
Jan Feb Mar Apr May Jun Jul Aug Sep Oct Nov Dec
US UNLEADED GASOLINE
2012 2011 2010
US Dollars Per GallonSource: DOE/EIA
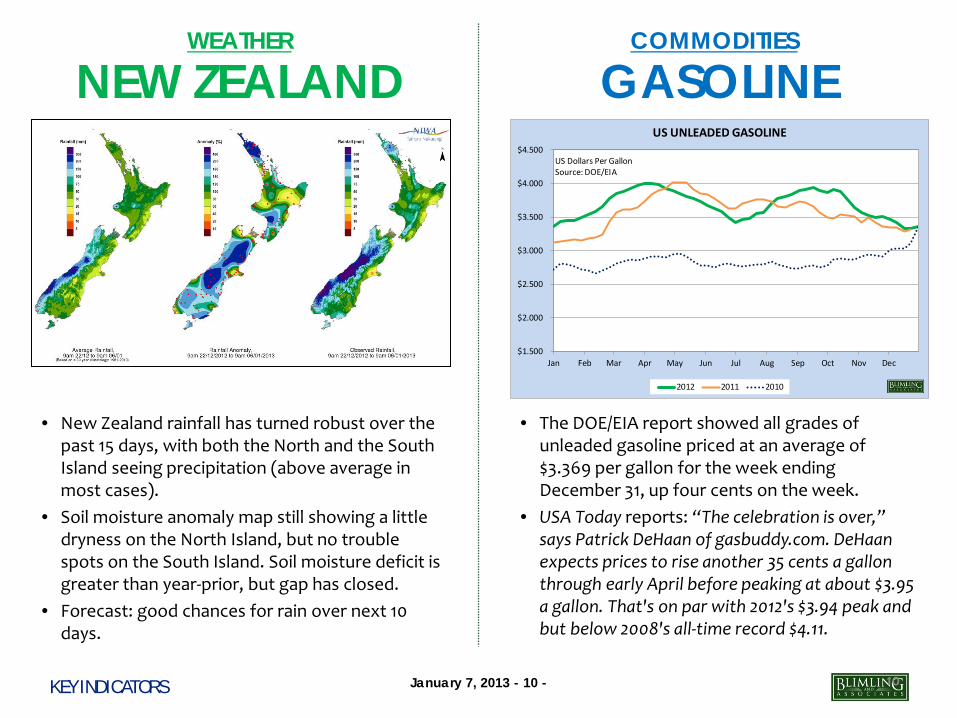
• New Zealand rainfall has turned robust over the past 15 days, with both the North and the South Island seeing precipitation (above average in most cases).
• Soil moisture anomaly map still showing a little dryness on the North Island, but no trouble spots on the South Island. Soil moisture deficit is greater than year-prior, but gap has closed.
• Forecast: good chances for rain over next 10 days.
• The DOE/EIA report showed all grades of unleaded gasoline priced at an average of $3.369 per gallon for the week ending December 31, up four cents on the week.
• USA Today reports: “The celebration is over,” says Patrick DeHaan of gasbuddy.com. DeHaan expects prices to rise another 35 cents a gallon through early April before peaking at about $3.95 a gallon. That's on par with 2012's $3.94 peak and but below 2008's all-time record $4.11.
January 7, 2013 - 11 - KEY INDICATORS 11
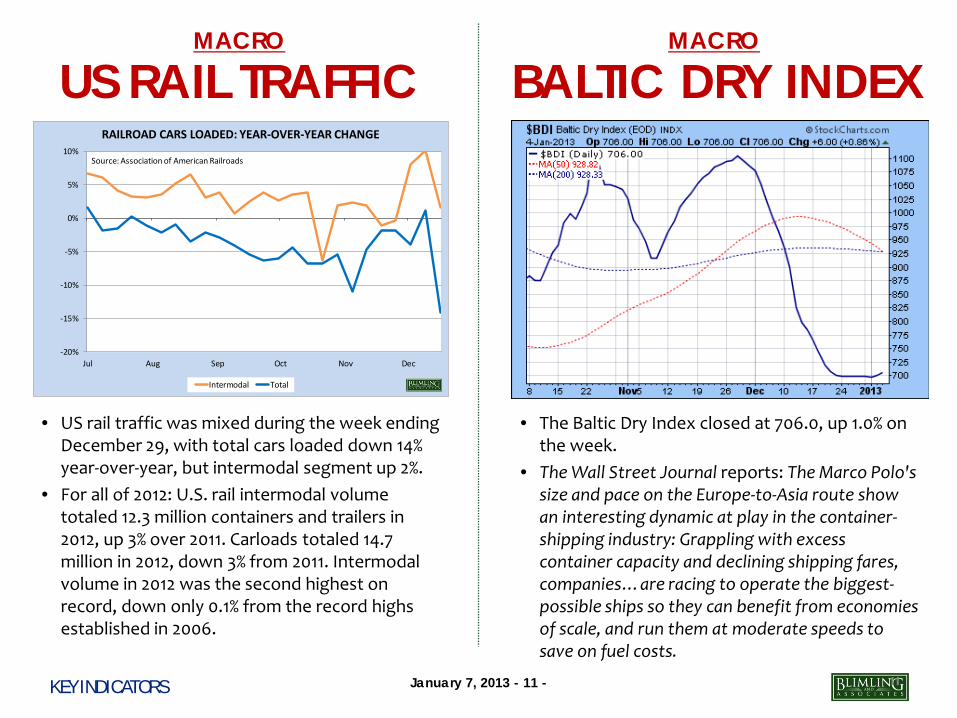
• US rail traffic was mixed during the week ending December 29, with total cars loaded down 14% year-over-year, but intermodal segment up 2%.
• For all of 2012: U.S. rail intermodal volume totaled 12.3 million containers and trailers in 2012, up 3% over 2011. Carloads totaled 14.7 million in 2012, down 3% from 2011. Intermodal volume in 2012 was the second highest on record, down only 0.1% from the record highs established in 2006.
• The Baltic Dry Index closed at 706.0, up 1.0% on the week.
• The Wall Street Journal reports: The Marco Polo's size and pace on the Europe-to-Asia route show an interesting dynamic at play in the container-shipping industry: Grappling with excess container capacity and declining shipping fares, companies…are racing to operate the biggest-possible ships so they can benefit from economies of scale, and run them at moderate speeds to save on fuel costs.
MACRO
US RAIL TRAFFIC BALTIC DRY INDEX MACRO
-20%
-15%
-10%
-5%
0%
5%
10%
Jul Aug Sep Oct Nov Dec
RAILROAD CARS LOADED: YEAR-OVER-YEAR CHANGE
Intermodal Total
Source: Association of American Railroads
January 7, 2013 - 12 - KEY INDICATORS 12
SLAUGHTER DAIRY
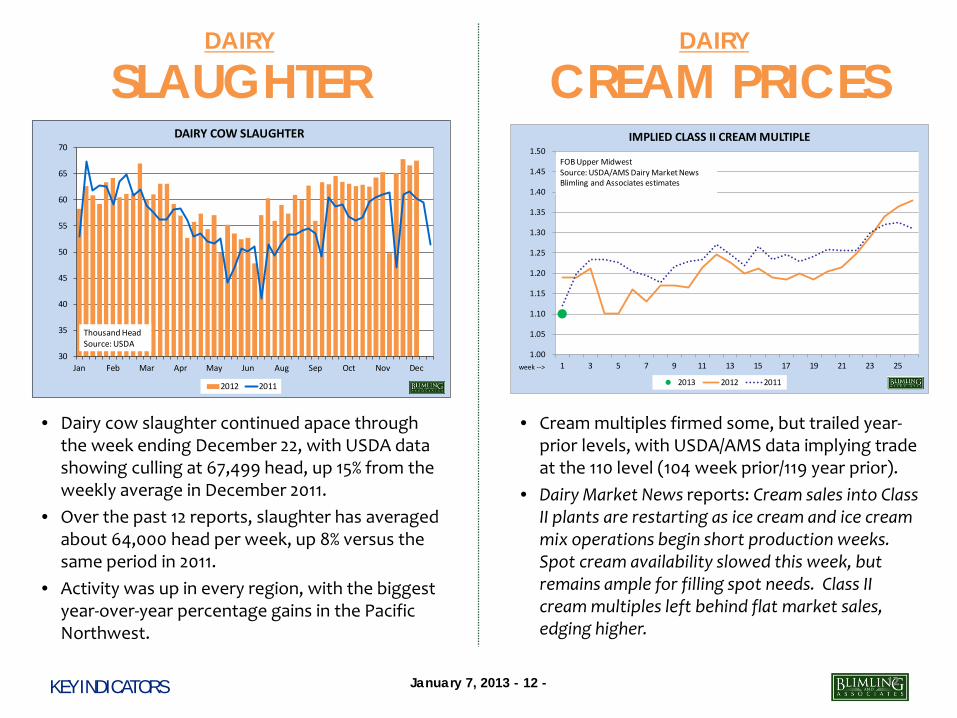
• Dairy cow slaughter continued apace through the week ending December 22, with USDA data showing culling at 67,499 head, up 15% from the weekly average in December 2011.
• Over the past 12 reports, slaughter has averaged about 64,000 head per week, up 8% versus the same period in 2011.
• Activity was up in every region, with the biggest year-over-year percentage gains in the Pacific Northwest.
• Cream multiples firmed some, but trailed year-prior levels, with USDA/AMS data implying trade at the 110 level (104 week prior/119 year prior).
• Dairy Market News reports: Cream sales into Class II plants are restarting as ice cream and ice cream mix operations begin short production weeks. Spot cream availability slowed this week, but remains ample for filling spot needs. Class II cream multiples left behind flat market sales, edging higher.
DAIRY
CREAM PRICES
1.00
1.05
1.10
1.15
1.20
1.25
1.30
1.35
1.40
1.45
1.50
1 3 5 7 9 11 13 15 17 19 21 23 25
IMPLIED CLASS II CREAM MULTIPLE
2013 2012 2011
FOB Upper MidwestSource: USDA/AMS Dairy Market NewsBlimling and Associates estimates
week -->30
35
40
45
50
55
60
65
70
Jan Feb Mar Apr May Jun Aug Sep Oct Nov Dec
DAIRY COW SLAUGHTER
2012 2011
Thousand HeadSource: USDA
January 7, 2013 - 13 - KEY INDICATORS 13
CRUDE OIL COMMODITIES
1,000,000
1,020,000
1,040,000
1,060,000
1,080,000
1,100,000
1,120,000
1,140,000
1,160,000
Jan Feb Mar Apr May Jun Jul Aug Sep Oct Nov Dec
CRUDE OIL AND PETROLEUM PRODUCT STOCKS
2012 2011 2010
Source: DOE/EIAThousand BarrelsExcludes SPR
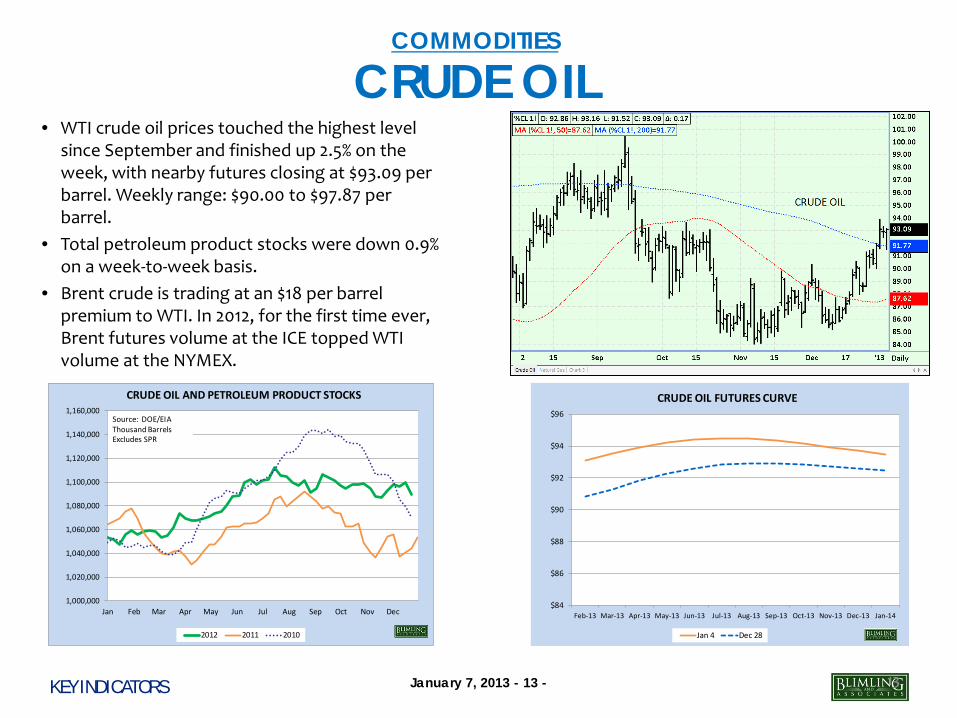
• WTI crude oil prices touched the highest level since September and finished up 2.5% on the week, with nearby futures closing at $93.09 per barrel. Weekly range: $90.00 to $97.87 per barrel.
• Total petroleum product stocks were down 0.9% on a week-to-week basis.
• Brent crude is trading at an $18 per barrel premium to WTI. In 2012, for the first time ever, Brent futures volume at the ICE topped WTI volume at the NYMEX.
$84
$86
$88
$90
$92
$94
$96
Feb-13 Mar-13 Apr-13 May-13 Jun-13 Jul-13 Aug-13 Sep-13 Oct-13 Nov-13 Dec-13 Jan-14
CRUDE OIL FUTURES CURVE
Jan 4 Dec 28

January 7, 2013 - 14 - KEY INDICATORS 14
NATURAL GAS COMMODITIES
• Natural gas prices slumped to multi-month lows before recovering some…but still finished the week lower.
• Nearby futures closed at $3.287 per mmbtu, down 5.2%, after trading in a range between $3.050 and $3.481.
• Inventories declined 3.7% in the latest weekly accounting, more than -3.2% average over the previous five years.
• The Baker Hughes “rig count” showed a gain of eight natural gas operations on the week.
1000
1500
2000
2500
3000
3500
4000
4500
Jan Feb Mar Apr May Jun Jul Aug Sep Oct Nov Dec
NATURAL GAS WORKING STORAGE
2012 2011 2010
Billion Cubic FeedSource: US DOE/EIA
$3.00
$3.20
$3.40
$3.60
$3.80
$4.00
$4.20
Feb-13 Mar-13 Apr-13 May-13 Jun-13 Jul-13 Aug-13 Sep-13 Oct-13 Nov-13 Dec-13 Jan-14
NATURAL GAS FUTURES CURVE
Jan 4 Dec 28
January 7, 2013 - 15 - KEY INDICATORS 15
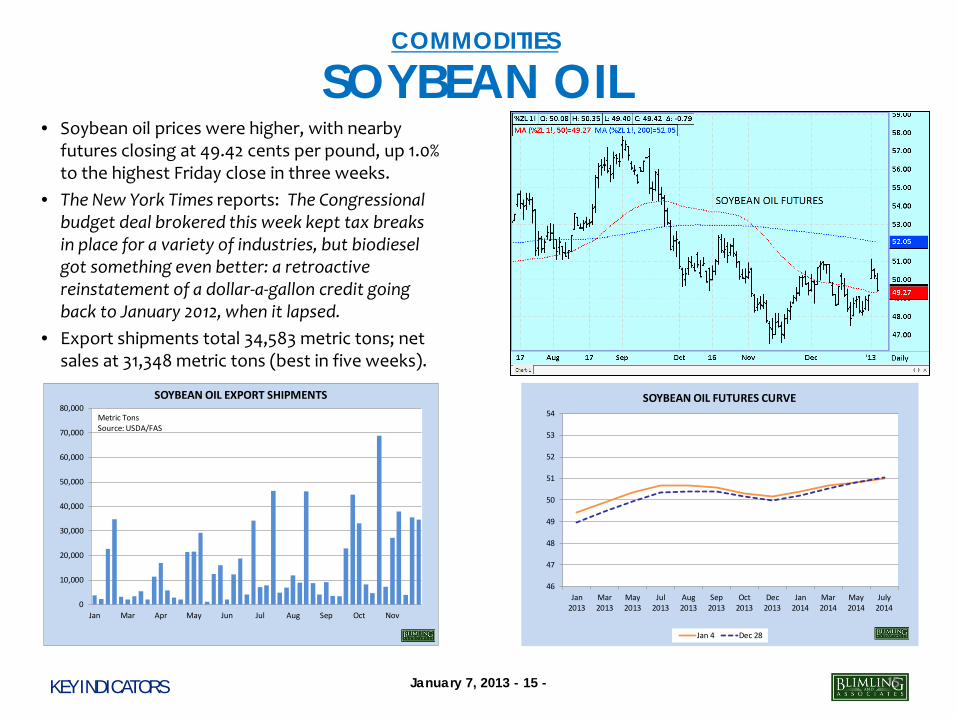
• Soybean oil prices were higher, with nearby futures closing at 49.42 cents per pound, up 1.0% to the highest Friday close in three weeks.
• The New York Times reports: The Congressional budget deal brokered this week kept tax breaks in place for a variety of industries, but biodiesel got something even better: a retroactive reinstatement of a dollar-a-gallon credit going back to January 2012, when it lapsed.
• Export shipments total 34,583 metric tons; net sales at 31,348 metric tons (best in five weeks).
SOYBEAN OIL COMMODITIES
46
47
48
49
50
51
52
53
54
Jan2013
Mar2013
May2013
Jul2013
Aug2013
Sep2013
Oct2013
Dec2013
Jan2014
Mar2014
May2014
July2014
SOYBEAN OIL FUTURES CURVE
Jan 4 Dec 28
0
10,000
20,000
30,000
40,000
50,000
60,000
70,000
80,000
Jan Mar Apr May Jun Jul Aug Sep Oct Nov
SOYBEAN OIL EXPORT SHIPMENTS
Metric TonsSource: USDA/FAS

January 7, 2013 - 16 - KEY INDICATORS 16
• Corn prices continued to sink, with nearby futures closing at $6.8025 per bushel, down 2.0%, after trading between $5.7950 and $7.0725. Low took market to a level not seen since the week ending June 21.
• Export demand remains an issue, with the latest weekly figures showing shipments at 205,269 metric tons and net sales at 49,136 metric tons.
• Speculators continue to take flight, with the CFTC COT report showing the managed money net long position down another 8%.
CORN COMMODITIES
$5.50
$5.75
$6.00
$6.25
$6.50
$6.75
$7.00
$7.25
$7.50
$7.75
$8.00
Mar 13 May 13 Jul 13 Sep 13 Dec 13 Mar 14 May 14 Jul 14 Sep 14 Dec 14 Mar 15 May 15
CORN FUTURES CURVE
Jan 4 Dec 28
0
50,000
100,000
150,000
200,000
250,000
300,000
350,000
Jan-12 Mar-12 May-12 Jul-12 Sep-12 Nov-12
CORN: NET "MANAGED MONEY" POSITION
Source: CFTC Disaggregated COTPositive Number Indicates Long

January 7, 2013 - 17 - KEY INDICATORS 17
• As the spot cheddar cheese market found its footing , Class III milk futures prices bounced around – and ultimately not changing much on the week.
• January through December 2013 contracts closed at an average of $18.42 per hundredweight, down a penny; January through June closed at $18.40, unchanged, with July through December at $18.44, down two cents.
• The CFTC COT report showed speculators slightly increasing their net short position.
COMMODITIES
CLASS III MILK
$17.00
$17.50
$18.00
$18.50
$19.00
$19.50
$20.00
Jan Feb Mar Apr May Jun Jul Aug Sep Oct Nov Dec
CLASS III MILK FUTURES CURVE
Jan 4 Dec 28
-6,000
-5,000
-4,000
-3,000
-2,000
-1,000
0
1,000
2,000
Jan-12 Mar-12 May-12 Jul-12 Aug-12 Oct-12 Dec-12
CLASS III MILK: NET SPECULATIVE POSITION
Source: CFTC+ is net long; - is net short

January 7, 2013 - 18 - KEY INDICATORS 18
• The sugar market faltered, with “world” futures prices at 18.86 cents per pound at settlement Friday, down 3% on the week.
• Published reports cited sluggish demand, better supply and a stronger US Dollar as contributing to the sugar market’s woes.
• Nearby cocoa futures closed at $2,224 per metric ton, down 1% on the week.
• Coffee prices were higher, with nearby futures closing at $1.4685 per pound, up 1%.
COMMODITIES
SOFTS
January 7, 2013 - 19 - KEY INDICATORS 19
Firm established to help clients find over-
the-counter risk management
solutions.
Facilitates transactions with Wells Fargo Bank.
Works with clients at each stage in the marketing chain, offering access to liquidity in several product lines and
combinations.
Detailed understanding of client needs and
dedication to finding structures satisfying those imperatives.
Licensed commodity broker introducing
business to ADM Investor Services.
Trading desk staffed with experienced
professionals.
Expert order handling in thinly traded
markets.
Premier order execution on Globex via industry-leading
OAK Desktop trading platform or using
dedicated resources on the CME Group trading
floor.
Competitive rates.
Research, consulting and risk management
strategy firm.
Subscription service includes numerous,
popular reports covering all aspects of
the dairy markets – globally.
Price forecasts and analysis across
multiple markets.
Staff with relevant, applicable experience.
Strategic, long-term engagements with
clients.
Highly-detailed, highly-specialized projects.
MADISON, WISCONSIN 608-249-5030
Phil Plourd [email protected] Mark Morningstar [email protected] Dallas Sipes Chapman [email protected] Lori Strong [email protected] Theresa Rutz [email protected] Katelyn Morningstar [email protected] Nicole Torborg [email protected] Katie Behnke [email protected]
MOUNTAIN TOP, PENNSYLVANIA 608-249-6727
Bill Curley [email protected]
OMAHA, NEBRASKA 608-249-7873
Duane Banderob [email protected]
JAMESTOWN, CALIFORNIA 608-249-7897
Tiffany LaMendola [email protected]
©2013 BLIMLING AND ASSOCIATES, INC.
5201 East Terrace Drive • Suite 280 • Madison, WI 53718 This information is carefully compiled but not guaranteed to be complete or free from error, nor does it constitute a solicitation to buy or sell futures/options contracts. Past performance is not
indicative of future results This has been prepared for the exclusive use of clients. Redistribution and reproduction in part
or in whole without written permission is strictly prohibited.


