NATIONAL COOPERATIVE HIGHWAY RESEARCH PROGRAM NCHRP REPORT 500 Volume 6: A Guide for Addressing Run-Off-Road Collisions Guidance for Implementation of the AASHTO Strategic Highway Safety Plan VOLUME 6
Transcript
NATIONALCOOPERATIVE HIGHWAYRESEARCH PROGRAMNCHRP
REPORT 500
Volume 6: A Guide for Addressing Run-Off-Road Collisions
Guidance for Implementation of theAASHTO Strategic Highway Safety Plan
VOLUME 6
TRANSPORTATION RESEARCH BOARD EXECUTIVE COMMITTEE 2003 (Membership as of March 2003)
OFFICERSChair: Genevieve Giuliano, Director and Professor, School of Policy, Planning, and Development, University of Southern California,
Los AngelesVice Chair: Michael S. Townes, Executive Director, Transportation District Commission of Hampton Roads, Hampton, VA Executive Director: Robert E. Skinner, Jr., Transportation Research Board
MEMBERSMICHAEL W. BEHRENS, Executive Director, Texas DOTJOSEPH H. BOARDMAN, Commissioner, New York State DOTSARAH C. CAMPBELL, President, TransManagement, Inc., Washington, DCE. DEAN CARLSON, Secretary of Transportation, Kansas DOTJOANNE F. CASEY, President, Intermodal Association of North AmericaJAMES C. CODELL III, Secretary, Kentucky Transportation CabinetJOHN L. CRAIG, Director, Nebraska Department of RoadsBERNARD S. GROSECLOSE, JR., President and CEO, South Carolina State Ports AuthoritySUSAN HANSON, Landry University Professor of Geography, Graduate School of Geography, Clark UniversityLESTER A. HOEL, L. A. Lacy Distinguished Professor, Department of Civil Engineering, University of VirginiaHENRY L. HUNGERBEELER, Director, Missouri DOTADIB K. KANAFANI, Cahill Professor and Chairman, Department of Civil and Environmental Engineering, University of California
at Berkeley RONALD F. KIRBY, Director of Transportation Planning, Metropolitan Washington Council of GovernmentsHERBERT S. LEVINSON, Principal, Herbert S. Levinson Transportation Consultant, New Haven, CTMICHAEL D. MEYER, Professor, School of Civil and Environmental Engineering, Georgia Institute of TechnologyJEFF P. MORALES, Director of Transportation, California DOTKAM MOVASSAGHI, Secretary of Transportation, Louisiana Department of Transportation and DevelopmentCAROL A. MURRAY, Commissioner, New Hampshire DOTDAVID PLAVIN, President, Airports Council International, Washington, DCJOHN REBENSDORF, Vice President, Network and Service Planning, Union Pacific Railroad Co., Omaha, NECATHERINE L. ROSS, Executive Director, Georgia Regional Transportation AgencyJOHN M. SAMUELS, Senior Vice President-Operations Planning & Support, Norfolk Southern Corporation, Norfolk, VAPAUL P. SKOUTELAS, CEO, Port Authority of Allegheny County, Pittsburgh, PAMARTIN WACHS, Director, Institute of Transportation Studies, University of California at BerkeleyMICHAEL W. WICKHAM, Chairman and CEO, Roadway Express, Inc., Akron, OH
MIKE ACOTT, President, National Asphalt Pavement Association (ex officio)MARION C. BLAKEY, Federal Aviation Administrator, U.S.DOT (ex officio)REBECCA M. BREWSTER, President and CEO, American Transportation Research Institute, Atlanta, GA (ex officio)THOMAS H. COLLINS (Adm., U.S. Coast Guard), Commandant, U.S. Coast Guard (ex officio)JENNIFER L. DORN, Federal Transit Administrator, U.S.DOT (ex officio)ELLEN G. ENGLEMAN, Research and Special Programs Administrator, U.S.DOT (ex officio)ROBERT B. FLOWERS (Lt. Gen., U.S. Army), Chief of Engineers and Commander, U.S. Army Corps of Engineers (ex officio)HAROLD K. FORSEN, Foreign Secretary, National Academy of Engineering (ex officio)EDWARD R. HAMBERGER, President and CEO, Association of American Railroads (ex officio)JOHN C. HORSLEY, Executive Director, American Association of State Highway and Transportation Officials (ex officio)MICHAEL P. JACKSON, Deputy Secretary of Transportation, U.S.DOT (ex officio)ROGER L. KING, Chief Applications Technologist, National Aeronautics and Space Administration (ex officio)ROBERT S. KIRK, Director, Office of Advanced Automotive Technologies, U.S. Department of Energy (ex officio)RICK KOWALEWSKI, Acting Director, Bureau of Transportation Statistics, U.S.DOT (ex officio)WILLIAM W. MILLAR, President, American Public Transportation Association (ex officio) MARY E. PETERS, Federal Highway Administrator, U.S.DOT (ex officio)SUZANNE RUDZINSKI, Director, Office of Transportation and Air Quality, U.S. Environmental Protection Agency (ex officio)JEFFREY W. RUNGE, National Highway Traffic Safety Administrator, U.S.DOT (ex officio)ALLAN RUTTER, Federal Railroad Administrator, U.S.DOT (ex officio)ANNETTE M. SANDBERG, Deputy Administrator, Federal Motor Carrier Safety Administration, U.S.DOT (ex officio)WILLIAM G. SCHUBERT, Maritime Administrator, U.S.DOT (ex officio)
NATIONAL COOPERATIVE HIGHWAY RESEARCH PROGRAM
Transportation Research Board Executive Committee Subcommittee for NCHRPGENEVIEVE GIULIANO, University of Southern California,
Los Angeles (Chair)E. DEAN CARLSON, Kansas DOTLESTER A. HOEL, University of VirginiaJOHN C. HORSLEY, American Association of State Highway and
Transportation Officials
MARY E. PETERS, Federal Highway Administration ROBERT E. SKINNER, JR., Transportation Research BoardMICHAEL S. TOWNES, Transportation District Commission
of Hampton Roads, Hampton, VA
NATIONAL COOPERATIVE HIGHWAY RESEARCH PROGRAM
NCHRP REPORT 500
SUBJECT AREAS
Safety and Human Performance
Guidance for Implementation of the AASHTO Strategic Highway Safety Plan
Volume 6: A Guide for AddressingRun-Off-Road Collisions
TIMOTHY R. NEUMAN
CH2M HILL
Chicago, IL
RONALD PFEFER
Maron Engineering, Ltd.
Zikhron Yaacov, Israel
KEVIN L. SLACK
KELLY KENNEDY HARDY
CH2M HILL
Herndon, VA
FORREST COUNCIL
BMI
Chapel Hill, NC
HUGH MCGEE
LEANNE PROTHE
KIMBERLY ECCLES
BMI
Vienna, VA
T R A N S P O R T A T I O N R E S E A R C H B O A R DWASHINGTON, D.C.
2003www.TRB.org
Research Sponsored by the American Association of State Highway and Transportation Officials in Cooperation with the Federal Highway Administration
NATIONAL COOPERATIVE HIGHWAY RESEARCH PROGRAM
Systematic, well-designed research provides the most effectiveapproach to the solution of many problems facing highwayadministrators and engineers. Often, highway problems are of localinterest and can best be studied by highway departmentsindividually or in cooperation with their state universities andothers. However, the accelerating growth of highway transportationdevelops increasingly complex problems of wide interest tohighway authorities. These problems are best studied through acoordinated program of cooperative research.
In recognition of these needs, the highway administrators of theAmerican Association of State Highway and TransportationOfficials initiated in 1962 an objective national highway researchprogram employing modern scientific techniques. This program issupported on a continuing basis by funds from participatingmember states of the Association and it receives the full cooperationand support of the Federal Highway Administration, United StatesDepartment of Transportation.
The Transportation Research Board of the National Academieswas requested by the Association to administer the researchprogram because of the Board’s recognized objectivity andunderstanding of modern research practices. The Board is uniquelysuited for this purpose as it maintains an extensive committeestructure from which authorities on any highway transportationsubject may be drawn; it possesses avenues of communications andcooperation with federal, state and local governmental agencies,universities, and industry; its relationship to the National ResearchCouncil is an insurance of objectivity; it maintains a full-timeresearch correlation staff of specialists in highway transportationmatters to bring the findings of research directly to those who are ina position to use them.
The program is developed on the basis of research needsidentified by chief administrators of the highway and transportationdepartments and by committees of AASHTO. Each year, specificareas of research needs to be included in the program are proposedto the National Research Council and the Board by the AmericanAssociation of State Highway and Transportation Officials.Research projects to fulfill these needs are defined by the Board, andqualified research agencies are selected from those that havesubmitted proposals. Administration and surveillance of researchcontracts are the responsibilities of the National Research Counciland the Transportation Research Board.
The needs for highway research are many, and the NationalCooperative Highway Research Program can make significantcontributions to the solution of highway transportation problems ofmutual concern to many responsible groups. The program,however, is intended to complement rather than to substitute for orduplicate other highway research programs.
Note: The Transportation Research Board of the National Academies, theNational Research Council, the Federal Highway Administration, the AmericanAssociation of State Highway and Transportation Officials, and the individualstates participating in the National Cooperative Highway Research Program donot endorse products or manufacturers. Trade or manufacturers’ names appearherein solely because they are considered essential to the object of this report.
Published reports of the
NATIONAL COOPERATIVE HIGHWAY RESEARCH PROGRAM
are available from:
Transportation Research BoardBusiness Office500 Fifth Street, NWWashington, DC 20001
The project that is the subject of this report was a part of the National Cooperative
Highway Research Program conducted by the Transportation Research Board with the
approval of the Governing Board of the National Research Council. Such approval
reflects the Governing Board’s judgment that the program concerned is of national
importance and appropriate with respect to both the purposes and resources of the
National Research Council.
The members of the technical committee selected to monitor this project and to review
this report were chosen for recognized scholarly competence and with due
consideration for the balance of disciplines appropriate to the project. The opinions and
conclusions expressed or implied are those of the research agency that performed the
research, and, while they have been accepted as appropriate by the technical committee,
they are not necessarily those of the Transportation Research Board, the National
Research Council, the American Association of State Highway and Transportation
Officials, or the Federal Highway Administration, U.S. Department of Transportation.
Each report is reviewed and accepted for publication by the technical committee
according to procedures established and monitored by the Transportation Research
Board Executive Committee and the Governing Board of the National Research
Council.
The National Academy of Sciences is a private, nonprofit, self-perpetuating society of distinguished schol-ars engaged in scientific and engineering research, dedicated to the furtherance of science and technology and to their use for the general welfare. On the authority of the charter granted to it by the Congress in 1863, the Academy has a mandate that requires it to advise the federal government on scientific and techni-cal matters. Dr. Bruce M. Alberts is president of the National Academy of Sciences.
The National Academy of Engineering was established in 1964, under the charter of the National Acad-emy of Sciences, as a parallel organization of outstanding engineers. It is autonomous in its administration and in the selection of its members, sharing with the National Academy of Sciences the responsibility for advising the federal government. The National Academy of Engineering also sponsors engineering programs aimed at meeting national needs, encourages education and research, and recognizes the superior achieve-ments of engineers. Dr. William A. Wulf is president of the National Academy of Engineering.
The Institute of Medicine was established in 1970 by the National Academy of Sciences to secure the services of eminent members of appropriate professions in the examination of policy matters pertaining to the health of the public. The Institute acts under the responsibility given to the National Academy of Sciences by its congressional charter to be an adviser to the federal government and, on its own initiative, to identify issues of medical care, research, and education. Dr. Harvey V. Fineberg is president of the Institute of Medicine.
The National Research Council was organized by the National Academy of Sciences in 1916 to associate the broad community of science and technology with the Academy’s purposes of furthering knowledge and advising the federal government. Functioning in accordance with general policies determined by the Acad-emy, the Council has become the principal operating agency of both the National Academy of Sciences and the National Academy of Engineering in providing services to the government, the public, and the scientific and engineering communities. The Council is administered jointly by both the Academies and the Institute of Medicine. Dr. Bruce M. Alberts and Dr. William A. Wulf are chair and vice chair, respectively, of the National Research Council.
The Transportation Research Board is a division of the National Research Council, which serves the National Academy of Sciences and the National Academy of Engineering. The Board’s mission is to promote innovation and progress in transportation by stimulating and conducting research, facilitating the dissemination of information, and encouraging the implementation of research results. The Board’s varied activities annually engage more than 4,000 engineers, scientists, and other transportation researchers and practitioners from the public and private sectors and academia, all of whom contribute their expertise in the public interest. The program is supported by state transportation departments, federal agencies including the component administrations of the U.S. Department of Transportation, and other organizations and individuals interested in the development of transportation. www.TRB.org
www.national-academies.org
COOPERATIVE RESEARCH PROGRAMS STAFF FOR NCHRP REPORT 500
ROBERT J. REILLY, Director, Cooperative Research ProgramsCRAWFORD F. JENCKS, NCHRP ManagerCHARLES W. NIESSNER, Senior Program OfficerEILEEN P. DELANEY, Managing EditorBETH HATCH, Assistant EditorANDREA BRIERE, Associate Editor
NCHRP PROJECT G17-18(3) PANELField of Traffic—Area of Safety
THOMAS E. BRYER, Camp Hill, PA (Chair)LEANNA DEPUE, Central Missouri State UniversityADELE DERBY, Alexandria, VABARBARA HARSHA, Governors Highway Safety Association, Washington, DCBRUCE IBARGUEN, Maine DOTMARGARET “MEG” MOORE, Texas DOTKIM F. NYSTROM, Nystrom Consulting, Gold River, CAPETER F. “PETE” RUSCH, FHWARUDY UMBS, FHWAANTHONY D. WYATT, North Carolina DOTJESSE BLATT, NHTSA Liaison RepresentativeRAY KRAMMES, FHWA Liaison RepresentativeKEN KOBETSKY, AASHTO Liaison RepresentativeRICHARD PAIN, TRB Liaison Representative
The goal of the AASHTO Strategic Highway Safety Plan is to reduce annual high-way fatalities by 5,000 to 7,000. This goal can be achieved through the widespreadapplication of low-cost, proven countermeasures that reduce the number of crashes onthe nation’s highways. This sixth volume of NCHRP Report 500: Guidance for Imple-mentation of the AASHTO Strategic Highway Safety Plan provides strategies that canbe employed to reduce the number run-off-road collisions. The report will be of par-ticular interest to safety practitioners with responsibility for implementing programs toreduce injuries and fatalities on the highway system.
In 1998, AASHTO approved its Strategic Highway Safety Plan, which was devel-oped by the AASHTO Standing Committee for Highway Traffic Safety with the assis-tance of the Federal Highway Administration, the National Highway Traffic SafetyAdministration, and the Transportation Research Board Committee on TransportationSafety Management. The plan includes strategies in 22 key emphasis areas that affecthighway safety. The plan’s goal is to reduce the annual number of highway deaths by5,000 to 7,000. Each of the 22 emphasis areas includes strategies and an outline of whatis needed to implement each strategy.
NCHRP Project 17-18(3) is developing a series of guides to assist state and localagencies in reducing injuries and fatalities in targeted areas. The guides correspond tothe emphasis areas outlined in the AASHTO Strategic Highway Safety Plan. Eachguide includes a brief introduction, a general description of the problem, the strate-gies/countermeasures to address the problem, and a model implementation process.
This is the sixth volume of NCHRP Report 500: Guidance for Implementationof the AASHTO Strategic Highway Safety Plan, a series in which relevant informa-tion is assembled into single concise volumes, each pertaining to specific types ofhighway crashes (e.g., run-off-road, head-on) or contributing factors (e.g., aggressivedriving). An expanded version of each volume, with additional reference materialand links to other information sources, is available on the AASHTO Web site athttp://transportation1.org/safetyplan. Future volumes of the report will be publishedand linked to the Web site as they are completed.
While each volume includes countermeasures for dealing with particular crashemphasis areas, NCHRP Report 501: Integrated Management Process to Reduce High-way Injuries and Fatalities Statewide provides an overall framework for coordinatinga safety program. The integrated management process comprises the necessary stepsfor advancing from crash data to integrated action plans. The process includes method-ologies to aid the practitioner in problem identification, resource optimization, and per-formance measurements. Together, the management process and the guides provide acomprehensive set of tools for managing a coordinated highway safety program.
This series of six implementation guides was developed under NCHRP Project 17-18(3). Theproject was managed by CH2M HILL. The co-principal investigators were Ron Pfefer ofMaron Engineering and Kevin Slack of CH2M HILL. Timothy Neuman of CH2M HILLserved as the overall project director for the CH2M HILL team. Kelly Kennedy Hardy, also ofCH2M HILL, participated in development of the guides.
This phase of the project involved the development of guide books addressing six differentemphasis areas of AASHTO’s Strategic Highway Safety Plan. The project team was organizedaround the specialized technical content contained in each guide. The CH2M HILL teamincluded nationally recognized experts from many organizations. The following team ofexperts, selected based on their knowledge and expertise in a particular emphasis area, servedas lead authors for each of the guides.
• Forrest Council of BMI led the development of “A Guide for Addressing Run-Off-RoadCollisions”
• Doug Harwood of Midwest Research Institute led the development of “A Guide forAddressing Unsignalized Intersection Collisions”
• Hugh McGee of BMI led the development of “A Guide for Addressing Head-On Collisions”
• Richard Raub of Northwestern University Center for Public Safety led the development of“A Guide for Addressing Aggressive-Driving Collisions”
• Patricia Waller led the development of “A Guide for Addressing Collisions Involving Un-licensed Drivers and Drivers with Suspended or Revoked Licenses”
• Charlie Zegeer and Kevin Lacy of University of North Carolina Highway Safety ResearchCenter led the development of “A Guide for Addressing Collisions Involving Trees in Haz-ardous Locations”
Development of the guides utilized the resources and expertise of many professionals fromaround the country and overseas. Through research, workshops, and actual demonstration ofthe guides by agencies, the resulting document represents best practices in each emphasis area.The project team is grateful to the following list of people and their agencies for their input onthe guides and their support of the project:
American Association ofState Highway and Transportation OfficialsTony Kane
California Department ofMotor VehiclesDave DeYoung
California Department ofTransportationRoy Peterson
City of Lubbock, TexasJeryl Hart
City of Winston-Salem,North CarolinaStan Polanis
ConsultantTerry Witkowski
Craven County, NorthCarolina, Sheriff’s OfficeJames BradleyRichard Woods
CTTERStephen Blake
Dallas Trees and ParksFoundationMike Bradshaw
Delaware State PoliceMark CollenderBarbara Conley
Durham Police DepartmentJames R. ClearyTeen Ennis
Federal HighwayAdministrationBeth AlicandriCraig K. AllredNick ArtimovichJoe BaredJoshua GrzegorzewskiMichael HalladayCarl HaydenHari KallaMartha KapitanovNak Joo KimKristine LeiphartLiana LiuLeonard MeczkowskiRichard PowersHarry W. Taylor
Federal HighwayAdministration—EasternFederal LandsKen Atkins
Federal HighwayAdministration—MidwestResource CenterPatrick Hasson
Federal HighwayAdministration—SouthernResource CenterK. Lynn BerryMary Jane DalugeJulian FrankEric Worrell
Florida Department ofTransportationBrian BlanchardPatrick A. BradyBilly HattawayLisa HelmsJim Mills
Georgia Institute ofTechnologyKaren Dixon
Insurance Institute forHighway SafetyRichard Retting
Iowa Department ofTransportationDave LittleTom Welch
Kansas Department ofTransportationJim BrewerRon Seitz
Kentucky Department ofHighwaysSimon Cornett
Lee County, Florida,Sheriff’s OfficeDennis Brooks Jerry Cantrell
Lockhart, Texas, PoliceDepartmentCharles L. Bethel
Maine Department ofTransportationGerry AudibertRobert LaRoche
Maryland Motor VehicleAdministrationJane Valenzia
Maryland State HighwayAdministrationKen BriggsCurt ChildressManu Shah
Michigan Department ofTransportationKurt KundeAndy Zeigler
Michigan Governor’s OfficeChad Canfield
Michigan State PoliceDepartmentMike Nof
Mid-America ResearchJohn Lacey
Minnesota Department ofPublic SafetyJoseph Bowler
Minnesota Department ofTransportationScott BradleyRon EricksonLoren Hill
Mississippi Department ofTransportationJohn B. PickeringJohn ReeseJim Willis
Missouri Department ofTransportationSteve McDonald
National Association ofCounty EngineersTony Giancolo
National Highway TrafficSafety AdministrationRichard Compton
ACKNOWLEDGMENTS
ACKNOWLEDGMENTS
National TransportationSafety BoardGeorge Black
New Bern, North Carolina,Police DepartmentTodd ConwayJames E. Owens
New Jersey Department ofTransportationJohn Spedding
New York State Departmentof TransportationJonathan BrayRobert LimogesDavid C. Woodin
Ohio Department ofTransportationLarry Sutherland
Oregon Department ofTransportationJeff GreinerChris MonsereVivian Payne
Palm Beach County,Florida, Sheriff’s OfficeCapt. Steven Withrow
Santa Barbara, California,Police Department/TrafficSafetyDavid Whitham
Scenic AmericaMeg Maguire
Smithville, Texas, PoliceDepartmentLee Nusbaum
South Carolina Departmentof TransportationWilliam BloomTerecia Wilson
Texas Department ofTransportationPaul FrerichDarren McDaniel
Texas TransportationInstituteDean Iberson
Town of Chapel Hill, NorthCarolinaKumar Neppalli
Transportation ResearchBoardAnn Brach
Utah Department ofTransportationSterling Davis
Washington StateDepartment ofTransportationJohn C. Milton
Washington State PatrolJohn BatisteTim Quenzer
WestatNeil Lerner
West Virginia Departmentof TransportationRay Lewis
Wisconsin Department ofTransportationPeter Amakobe
Worcester Polytechnic InstituteMalcolm Ray
A Guide for Addressing Run-Off-Road Collisions
The authors wish to express their thanks to Hugh McGee and Leanne Prothe of BMI for theirmany written and verbal contributions to the guide, particularly for their preparation of thesection on skid-resistant pavement, and Kimberly Eccles of BMI for her assistance in theselection, identification, and acquisition of graphics for the final draft.
ACKNOWLEDGMENTS
I-1
SECTION I
Summary
IntroductionThe American Association of State Highway and Transportation Officials’s (AASHTO’s)Strategic Highway Safety Plan identified 22 goals to pursue in order to significantly reducehighway crash fatalities. One of the plan’s hallmarks is to comprehensively approach safetyproblems. The range of strategies available in the guides will ultimately cover variousaspects of the road user, the highway, the vehicle, the environment, and the managementsystem. The guides strongly encourage the user to develop a program to tackle a particularemphasis area from each perspective in a coordinated manner. To facilitate this, theelectronic form of the material uses hypertext links to enable seamless integration of variousapproaches to a given problem. As more guides are developed for other emphasis areas, theextent and usefulness of this integration will become ever more apparent.
AASHTO’s overall goal is to move away from independent activities of engineers, lawenforcement, educators, judges, and other highway safety specialists and to move towardcoordinated efforts. The implementation process outlined in the series of guides promotesforming working groups and alliances that represent all of the elements of the safety system.In this formation, highway safety specialists can draw upon their combined expertise toreach the bottom-line goal of targeted reduction of crashes and fatalities associated with aparticular emphasis area.
Goal 15 in the Strategic Highway Safety Plan is Keeping Vehicles on the Roadway, and Goal 16is Minimizing the Consequences of Leaving the Road. Subsequently, three emphasis areasevolved from these two goals:
• Run-off-road (ROR) crashes, • Head-on crashes, and• Crashes with trees in hazardous locations.
The common solution to these emphasis areas is to keep the vehicle in the proper lane. Whilethis solution will not eliminate crashes with other vehicles, pedestrians, bicyclists, and trainsthat may be in the path of the vehicle, it will eliminate many fatalities caused when a vehiclestrays from the lane onto the roadside or into oncoming traffic. This section deals with RORcrashes.
ROR crashes involve vehicles that leave the travel lane and encroach onto the shoulder andbeyond and hit one or more of any number of natural or artificial objects, such as bridgewalls, poles, embankments, guardrails, parked vehicles, and trees. (Because trees are themost abundant objects along the road, they are treated as a separate emphasis area.) RORcrashes usually involve only a single vehicle, although an ROR vehicle hitting a parkedvehicle could be considered a multivehicle crash. An ROR crash, which typically consists ofa vehicle encroaching onto the right shoulder and roadside, can also occur on the median
side where the highway is separated or on the opposite side when the vehicle crosses theopposing lanes of a nondivided highway.
Reducing the likelihood that a vehicle will leave the roadway through roadway design (e.g.,flattening curves or installing shoulder rumble strips) prevents deaths and injuries resultingfrom ROR crashes. When an errant vehicle does encroach on the roadside, fatalities andinjuries can be reduced if an agency either can minimize the likelihood of the vehiclecrashing into an object (e.g., through object removal) or overturning (e.g., sideslopeflattening) or can reduce the severity of the crash (e.g., by installing breakaway devices).
Objectives of the Emphasis AreaTo reduce the number of ROR fatality crashes, the objectives should be to
• Keep vehicles from encroaching on the roadside, • Minimize the likelihood of crashing or overturning if the vehicle travels off the shoulder,
and• Reduce the severity of the crash.
Explanation of ObjectivesThe ideal objective of good design is to keep the vehicle in the travel lane. For vehicles thatdo cross the outside edge of pavement, a related objective is to enable the driver to safelyrecover on the shoulder before encountering the roadside. Motorists do not purposely moveonto the shoulder unless they need to pull over to slow or stop their vehicle. However,errant vehicles will cross over onto the shoulder, with many proceeding onto the roadside,resulting in an ROR crash. The reasons for such errant events are varied and includeavoiding a vehicle, object, or animal in the travel lane; inattentive driving due to distraction,fatigue, sleep, or drugs; the effects of weather on pavement conditions; and traveling too fastthrough a curve or down a grade. There are also a number of roadway design factors thatcan increase the probability that a driver error will become an ROR crash (e.g., travel lanesthat are too narrow, substandard curves, and unforgiving shoulders and roadsides).Strategies can be applied to deal with the ROR crashes caused by these factors.
If the motorist travels onto the roadside, the probability of a crash occurring depends uponthe roadside features, such as the presence and location of fixed objects, shoulder edgedropoff, sideslopes, ditches, and trees. If the roadside is fairly flat without objects and thesoil can support the vehicle tires, then the probability of a serious crash is minimal (indeed,in many cases the motorist may fully recover and no ROR crash is reported). Conversely,where the roadside is populated with a continuous line of different types of objects andfeatures, the sideslope is too steep for the vehicle to recover or if the soil produces “vehicletripping,” then the probability of a serious crash is high. Therefore, there are strategiesdirected at reducing the number and density of possibly hazardous roadside features thatwould contribute to the likelihood of an ROR crash given a roadside encroachment.
The final objective, reducing the severity of the crash, can be met by changes in the design ofthe roadside features (e.g., making roadside hardware more forgiving or modifyingsideslopes to prevent rollovers) and by changes in the vehicle (e.g., better restraint systems
SECTION I—SUMMARY
I-2
SECTION I—SUMMARY
or improved side protection) or by increased occupant use of available restraints. Whileincreased use of restraints would probably provide the greatest benefit, the emphasis in thisdiscussion is on roadway-related improvements.
Exhibit I-1 lists objectives and related strategies for reducing the consequences of RORcrashes. Details of these strategies are covered in the following narrative. It should be notedthat this is not a comprehensive list of all possible strategies to reduce ROR crashes. Forexample, roadway design or rehabilitation strategies such as building wide lanes or addinglane width on entire systems or subsystems or using positive guidance principals in newroadway design can clearly affect ROR crashes. However, these strategies are most likelyemployed in the design phase for new facilities or rehabilitation of long sections of roadwaysand are often high-cost improvements. AASHTO chose to concentrate efforts in this guide
I-3
EXHIBIT I-1Emphasis Area Objectives and Strategies
Objectives Strategies
15.1 A—Keep vehicles from encroaching on the roadside
15.1 B—Minimize the likelihood of crashing into an object or overturning if the vehicle travels off the shoulder
15.1.C—Reduce the severity of the crash
* An explanation of (E) and (P) appears on page V-3.
15.1 A1—Install shoulder rumble strips
15.1 A2—Install edgeline “profile marking,” edgeline rumble strips ormodified shoulder rumble strips on section with narrow or no pavedshoulders
15.1 A3—Install midlane rumble strips
15.1 A4—Provide enhanced shoulder or in-lane delineation and marking forsharp curves
15.1 A5—Provide improved highway geometry for horizontal curves
15.1 A6—Provide enhanced pavement markings
15.1 A7—Provide skid-resistant pavement surfaces
15.1 A8—Apply shoulder treatments
• Eliminate shoulder drop-offs (E)*
• Widen and/or pave shoulders (P)*
15.1 B1—Design safer slopes and ditches to prevent rollovers (see“Improving Roadsides,” page V-36)
15.1 B2—Remove/relocate objects in hazardous locations (see “ImprovingRoadsides,” page V-36)
15.1 B3—Delineate trees or utility poles with retroreflective tape
15.1 C1—Improve design of roadside hardware (e.g., light poles, signs,bridge rails) (see “Improving Roadsides,” page V-36)
15.1 C2—Improve design and application of barrier and attenuation systems(see “Improving Roadsides,” page V-36)
on lower-cost strategies that can be implemented quickly; these strategies can also beapplied to “spots” on the roadway (e.g., lane widening on hazardous curves). With fewexceptions, it is these lower-cost, quickly implementable strategies that are covered below.
Target of the ObjectivesThe first objective addresses ways to communicate with the driver. However, there are otherstrategies for fulfilling this objective that target highway design features that couldcontribute to a crash (e.g., shoulder drop-offs and pavements with low skid resistance). Thesecond objective employs strategies that focus on the highway, with more concentrationdevoted to nonfreeway facilities, especially to higher-speed rural roads. Higher-designfacilities such as freeways have fairly wide shoulders and more forgiving, wider clear zones.Features within the clear zone are shielded from traffic by barriers and crash attenuationdevices. On the other hand, there is an extensive system of mostly two-lane rural high-speedroadways that do not have these features. Crash data analyses show that this rural two-lanesystem is particularly vulnerable to ROR crashes and should be targeted for appropriatemeasures. Some of the same strategies appropriate for these two-lane, rural, high-speedroads can also be implemented on suburban and urban streets and on freeways. Vehicledesign, restraint features and usage, and design of roadside features and roadside geometryare all valid targets for the third objective, reducing the severity of ROR crashes. Finally,another approach to comprehensively address ROR safety problems is to replace theindependent activities of engineers, law enforcement personnel, educators, judges, and otherhighway safety specialists with cooperative efforts, an approach reiterated in this guide.
SECTION I—SUMMARY
I-4
II-1
SECTION II
Introduction
The American Association of State Highway and Transportation Officials’s (AASHTO’s)Strategic Highway Safety Plan identified 22 goals to pursue in order to significantly reducehighway crash fatalities. One of the plan’s hallmarks is to comprehensively approach safetyproblems. Goal 15 in the Strategic Highway Safety Plan is Keeping Vehicles on the Roadway,and Goal 16 is Minimizing the Consequences of Leaving the Road. Subsequently, three emphasisareas evolved from these two goals:
• Run-off-road (ROR) crashes, • Head-on crashes, and• Crashes with trees in hazardous locations.
The common solution to these goal areas is to keep the vehicle in the proper lane. While thismay not eliminate crashes with other vehicles, pedestrians, bicyclists, or trains, it wouldeliminate many fatalities that result when a vehicle strays from the lane onto the roadside orinto oncoming traffic.
This emphasis area deals with ROR crashes associated with vehicles that leave the travellane, encroach onto the shoulder and beyond, and hit one or more of any number of naturalor artificial objects, such as bridge walls, poles, embankments, guardrails, parked vehicles, ortrees. (Because trees are the most abundant objects along the road, they are treated as aseparate emphasis area.)
ROR crashes usually involve only a single vehicle, although a ROR vehicle hitting a parkedvehicle could be considered a multivehicle crash. A ROR crash, which consists of a vehicleencroaching onto the right shoulder and roadside, can also occur on the median side wherethe highway is separated or on the opposite side when the vehicle crosses the opposing lanesof a nondivided highway.
Reducing the likelihood that a vehicle will leave the roadway through roadway design (e.g.,flattening curves or installing shoulder rumble strips) can prevent deaths and injuriesresulting from ROR crashes. When an errant vehicle does encroach on the roadside, fatalitiesand injuries can be reduced if an agency can either (a) minimize the likelihood of the vehiclecrashing into an object (e.g., through object removal or relocation) or overturning (e.g.,through sideslope flattening or improved ditch design) or (b) reduce the severity of the crash(e.g., installing breakaway devices).
AASHTO’s overall goal is to move away from independent activities of engineers, lawenforcement, educators, judges, and other highway safety specialists and toward coordinatedefforts. The implementation process outlined in the guides promotes forming workinggroups and alliances that represent all of the elements of the safety system. In this formation,highway safety specialists can draw upon their combined expertise to reach the bottom-linegoal of targeted reduction of crashes and fatalities associated with a particular emphasisarea.
III-1
SECTION III
The Type of Problem Being Addressed
General Description of the Problem
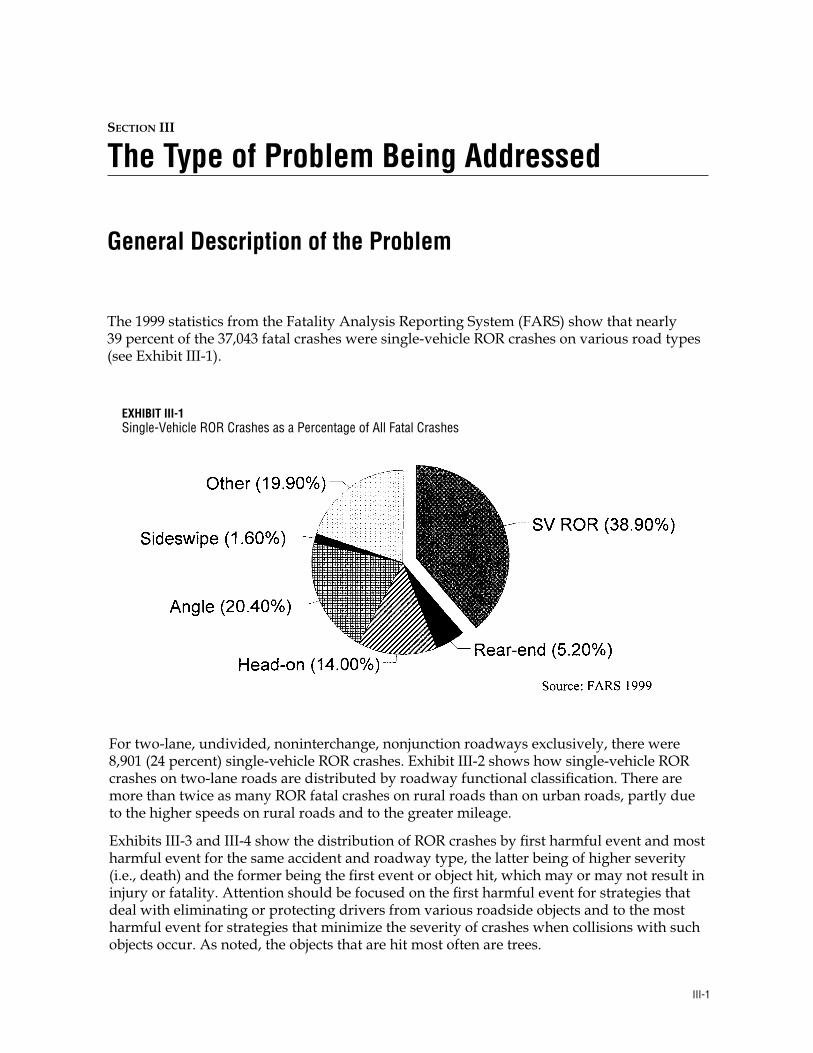
The 1999 statistics from the Fatality Analysis Reporting System (FARS) show that nearly39 percent of the 37,043 fatal crashes were single-vehicle ROR crashes on various road types(see Exhibit III-1).
EXHIBIT III-1Single-Vehicle ROR Crashes as a Percentage of All Fatal Crashes
For two-lane, undivided, noninterchange, nonjunction roadways exclusively, there were8,901 (24 percent) single-vehicle ROR crashes. Exhibit III-2 shows how single-vehicle RORcrashes on two-lane roads are distributed by roadway functional classification. There aremore than twice as many ROR fatal crashes on rural roads than on urban roads, partly dueto the higher speeds on rural roads and to the greater mileage.
Exhibits III-3 and III-4 show the distribution of ROR crashes by first harmful event and mostharmful event for the same accident and roadway type, the latter being of higher severity(i.e., death) and the former being the first event or object hit, which may or may not result ininjury or fatality. Attention should be focused on the first harmful event for strategies thatdeal with eliminating or protecting drivers from various roadside objects and to the mostharmful event for strategies that minimize the severity of crashes when collisions with suchobjects occur. As noted, the objects that are hit most often are trees.
SECTION III—THE TYPE OF PROBLEM BEING ADDRESSED
III-2
EXHIBIT III-2Distribution of Single-Vehicle ROR Fatalities on Two-Lane, Undivided, Noninterchange, Nonjunction Roads byHighway Type (Source: 1999 FARS Data)
SECTION III—THE TYPE OF PROBLEM BEING ADDRESSED
III-3
EXHIBIT III-3Distribution of Single-Vehicle ROR Fatalities for Two-Lane, Undivided, Noninterchange, Nonjunction Roads by FirstHarmful Event (Source: 1999 FARS Data)
Specific Attributes of the ProblemWhile vehicles are more likely to leave the roadway along curves, most ROR fatalities on allroads and on two-lane rural roads are on tangent sections, as shown in Exhibit III-5. For allroads, 42 percent of the 1999 ROR fatal crashes were on curves and 58 percent on tangents.For two-lane rural roads, the percentage of ROR fatal crashes on curves increased to50 percent. The fact that more crashes occur on tangents for all roads most likely reflects thefact that most road sections are tangent. However, it is clear that both tangents and curveshave significant problems and warrant treatment. As seen below, strategies are suggestedfor both curve and tangent sections.
SECTION III—THE TYPE OF PROBLEM BEING ADDRESSED
III-4
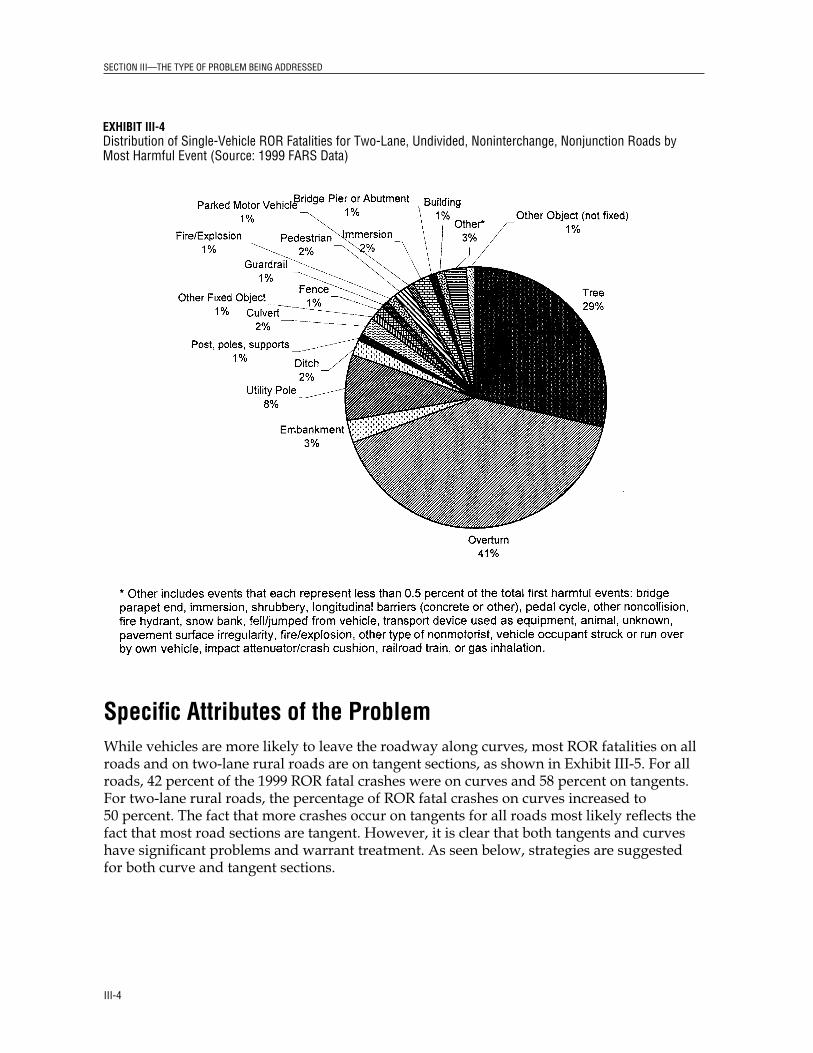
EXHIBIT III-4Distribution of Single-Vehicle ROR Fatalities for Two-Lane, Undivided, Noninterchange, Nonjunction Roads byMost Harmful Event (Source: 1999 FARS Data)
SECTION III—THE TYPE OF PROBLEM BEING ADDRESSED
As would be expected, roadside features cause the most damage in a ROR crash. FARS datafor all roadway classes indicate that the most harmful event is most likely to be an overturn(42.1 percent of 1999 ROR single-vehicle fatalities), an impact with a tree (25.4 percent), animpact with a utility pole (7.2 percent), or an impact with a ditch or embankment(4.9 percent). Most other roadside objects (e.g., culverts, posts, or guardrails) are the mostharmful event in 2 percent or less of the fatalities. For two-lane rural roads, the percentagesfor most harmful event are similar—an overturn (44.5 percent of 1999 ROR single-vehiclefatalities), an impact with a tree (28.7 percent), an impact with a utility pole (8.0 percent), oran impact with a ditch or embankment (5.0 percent). As all of these features are eithernecessary elements of the roadway, commonly found along the roadside, or both, strategiesare needed to protect the vehicle and its occupants when it has failed to remain on theroadway.
III-5
EXHIBIT III-5Distribution of Single-Vehicle ROR Crashes between Tangent and Curved Sections
Single-Vehicle ROR Crashes on All Roads
42%
58%
Curves
Tangents
Single-Vehicle ROR Crashes on Two-Lane Rural Roads
50%50%
IV-1
SECTION IV
Index of Strategies by ImplementationTimeframe and Relative Cost
Exhibit IV-1 provides a classification of strategies according to the expected timeframe andrelative cost for this emphasis area. In several cases, the implementation time will bedependent upon such factors as the agency’s procedures, the length of roadway involved,the need for additional right-of-way, and the need to follow environmental impactprocesses. The range of costs may also vary for some of these strategies because of many ofthe same factors. Placement in the table below is meant to reflect the most common expectedapplication of the strategy.
EXHIBIT IV-1Classification of Strategies According to Expected Timeframe and Relative Cost
Relative Cost to Implement and Operate
Timeframe for Moderate to Implementation Strategy Low Moderate High High
15.1 B3—Remove/relocate objects in ✓hazardous locationsa
Medium (1–2 15.1 A7—Provide skid-resistant ✓(years) pavements
15.1 A8—Eliminate shoulder drop-offb ✓
15.1 B1—Provide shoulder treatmentsc ✓or four-lane sections at key locations*
15.1 B2—Design safer slopes and ditches ✓
15.1 C1—Improve roadside hardware ✓
15.1 C2—Improve barrier and attenuation ✓systems
(continued on next page)
SECTION IV—INDEX OF STRATEGIES BY IMPLEMENTATION TIMEFRAME AND RELATIVE COST
IV-2
EXHIBIT IV-1 (Continued)Classification of Strategies According to Expected Timeframe and Relative Cost
Relative Cost to Implement and Operate
Timeframe for Moderate to Implementation Strategy Low Moderate High High
Long (>2 years) 15.1 A5—Improve horizontal curve ✓geometryd
a Removal/relocation of some objects (e.g., bridge abutments and drainage structures) can be costly, dependingupon the object. It is assumed here, however, that most objects will be small appurtenances.b The action could be done in a short timeframe. However, it is assumed to be done at little extra cost as part ofa regular repaving program.c The classification of shoulder treatments and safer slopes and ditches as moderate-cost or moderate-to-high-cost treatments assumes that no additional right-of-way is needed. If right-of-way is needed, the cost could behigh and the time required would be long. d Although the AASHTO Strategic Highway Safety Plan is focused upon relatively low-cost, short-term strategies,there are some higher-cost strategies such as curve flattening that have potential for such significanteffectiveness that they have been included. Curve flattening would primarily be applicable in rehabilitation,resurfacing, and restoration (3R) and reconstruction projects that have been programmed outside the context ofthe AASHTO plan initiative.
V-1
SECTION V
Description of Strategies
Objectives The objectives for reducing the number of ROR fatality crashes are to
• Keep vehicles from encroaching on the roadside, • Minimize the likelihood of crashing or overturning if the vehicle travels off the shoulder,
and• Reduce the severity of crashes that occur.
The ideal objective of good roadway design is to keep the vehicle in the travel lane. Asecondary but related objective for a vehicle that inadvertently crosses the edgeline is toallow it to recover safely before going beyond the shoulder (if present) or back onto theroadside. Motorists will not purposely move onto the shoulder unless they need to pull overto slow or stop their vehicle. However, errant vehicles will cross over onto the shoulder andthen the roadside, ending in an ROR crash. The reasons for inadvertent roadsideencroachments are varied and include avoiding a vehicle, object, or animal in the travel lane;inattentive driving due to distraction, fatigue, sleep, or drugs; the effects of weather onpavement conditions; and traveling too fast through a curve. Several roadway design factorscan also increase the probability that a driver error will become an ROR crash: travel lanesthat are too narrow, substandard curves, and unforgiving shoulders and roadsides. Specificstrategies can be applied to deal with ROR crashes caused by these factors. If a motoristtravels onto the roadside, the probability of a crash depends to some extent on the speed ofthe vehicle and the driver’s experience and capabilities. However, for normal travel onhigher-speed roads, the crash probability, and primarily its severity, depends more uponroadside features, such as the presence and location of fixed objects, shoulder drop-off,sideslopes, ditches, and trees. If the roadside is fairly flat without objects and the soil cansupport the vehicle tires, the probability of a serious crash is minimal (and in many cases thedriver fully recovers and there is no reported ROR crash). Conversely, when there is acontinuous line of different types of objects and features or when the soil produces “vehicletripping,” the probability of a serious crash is high. Therefore, there are strategies directed atreducing the number and density of possible hazardous roadside features or the proximityof these features to the traveled way.
The final objective, reducing the severity of the crash, can be met by changes in the design ofroadside features (e.g., making roadside hardware more forgiving or modifying sideslopesto prevent rollovers) and by changes in the vehicle (e.g., better restraint systems or improvedside protection) or by increased occupant use of available restraints. A combination ofstrategies appears appropriate, with increased use of restraints providing the greatestbenefit. This discussion focuses on roadway-related improvements.
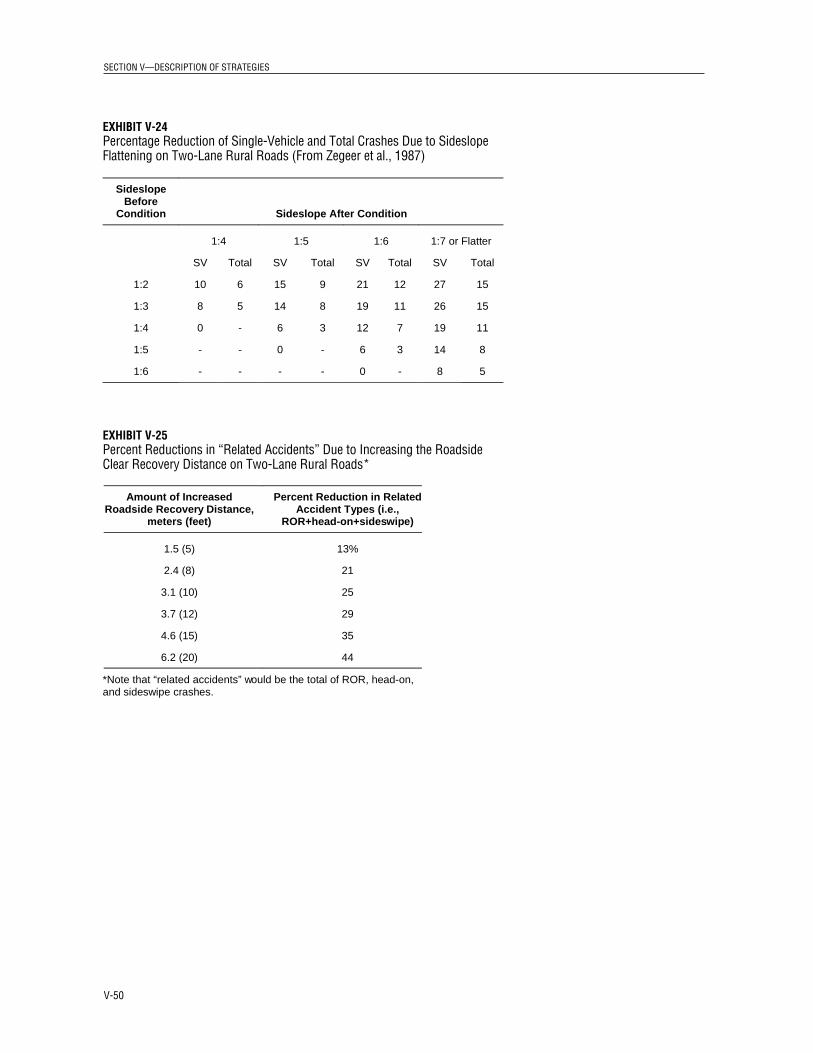
Exhibit V-1 lists the objectives and several related strategies to reduce the consequences ofROR crashes. Details of these strategies are covered below. This is not a comprehensivelisting of all possible strategies to reduce ROR crashes. For example, roadway design orrehabilitation strategies (such as building wide lanes or adding lane width on entire systems
SECTION V—DESCRIPTION OF STRATEGIES
V-2
or subsystems) or the use of positive guidance principles in new roadway design can clearlyaffect ROR crashes. However, these strategies are most likely used in the design phase fornew facilities or rehabilitation of long sections of roadways and are often high-costimprovements. AASHTO has chosen to concentrate efforts in this guide on lower-coststrategies that can be implemented relatively quickly, including strategies that can beapplied to “spots” on the roadway (e.g., lane widening on hazardous curves). With fewexceptions, it is these lower-cost, quickly implementable strategies that are covered below.
EXHIBIT V-1Emphasis Area Objectives and Strategies
Objectives Strategies
15.1 A—Keep vehicles from encroaching on the roadside
15.1 B—Minimize the likelihood of crashing into an object or overturning if the vehicle travels beyond the edge of the shoulder
15.1 C—Reduce the severityof the crash
Note: The following page explains (T), (E), and (P) demarcations.
15.1 A1—Install shoulder rumble strips (T)
15.1 A2—Install edgeline “profile marking,” edgeline rumble strips ormodified shoulder rumble strips on section with narrow or no pavedshoulders (E)
15.1 A3—Install midlane rumble strips (E)
15.1 A4—Provide enhanced shoulder or in-lane delineation andmarking for sharp curves (P/T/E)
15.1 A5—Provide improved highway geometry for horizontal curves (P)
15.1 A6—Provide enhanced pavement markings (T)
15.1 A7—Provide skid-resistant pavement surfaces
15.1 A8—Apply shoulder treatments
• Eliminate shoulder drop-offs (E)
• Widen and/or pave shoulders (P)
15.1 B1—Design safer slopes and ditches to prevent rollovers (see“Improving Roadsides,” page V-36) (P)
15.1 C2—Improve design and application of barrier and attenuationsystems (see “Improving Roadsides,” page V-36) (T)
Types of StrategiesThe strategies in this ROR guide were identified from a number of sources, including theliterature, contact with state and local agencies throughout the United States, and federalprograms. Some of the strategies are widely used, while others are primarily anexperimental idea of a single individual or agency. Some have been subjected to
SECTION V—DESCRIPTION OF STRATEGIES
well-designed evaluations to prove their effectiveness. However, it was found that manystrategies, including some that are widely used, have not been adequately evaluated.
The implication of the widely varying experience with these strategies, as well as of therange of knowledge about their effectiveness, is that the reader should be prepared toexercise caution in many cases before adopting a particular strategy for implementation. Tohelp the reader, the strategies have been classified into three types, each identified by aletter:
• Tried (T)—Those strategies that have been implemented in a number of locations andthat may even be accepted as standards or standard approaches, but for which therehave not been found valid evaluations. These strategies—while in frequent, or evengeneral, use—should be applied with caution, carefully considering the attributes citedin the guide and relating them to the specific conditions for which they are beingconsidered. Implementation can proceed with some degree of assurance that there is notlikely to be a negative impact on safety and very likely to be a positive one. It is intendedthat as the experiences of implementation of these strategies continue under theAASHTO Strategic Highway Safety Plan initiative, appropriate evaluations will beconducted so that effectiveness information can be accumulated to provide betterestimating power for the user and the strategy can be upgraded to a “proven” (P) one.
• Experimental (E)—Those strategies that have been suggested and that at least oneagency has considered sufficiently promising to try on a small scale in at least onelocation. These strategies should only be considered after the others have proven not tobe appropriate or feasible. Even where they are considered, their implementation shouldinitially occur using a very controlled and limited pilot study that includes a properlydesigned evaluation component. Only after careful testing and evaluations show thestrategy to be effective should broader implementation be considered. It is intended thatas the experiences of such pilot tests are accumulated from various state and localagencies, the aggregate experience can be used to further detail the attributes of this typeof strategy so that it can be upgraded to a “proven” (P) one.
• Proven (P)—Those strategies that have been used in one or more locations and for whichproperly designed evaluations have been conducted that show it to be effective. Thesestrategies may be employed with a good degree of confidence, but any application canlead to results that vary significantly from those found in previous evaluations. Theattributes of the strategies that are provided will help the user judge which strategy isthe most appropriate for the particular situation.
Targeting the ObjectivesThe first objective, keeping vehicles on the roadway, addresses various means ofcommunicating with the driver. However, other strategies for fulfilling this objective targethighway design features that could contribute to a crash (e.g., shoulder drop-offs andpavement with low skid resistance).
The second objective, minimizing the likelihood of an ROR crash given an encroachment,uses strategies that focus on the highway, with more concentration devoted to nonfreewayfacilities and especially to higher-speed rural roads. Higher-design facilities such asfreeways typically have fairly wide shoulders and more forgiving, wider clear zones.
V-3
Features within the clear zone are shielded from traffic by barriers and crash attenuationdevices. However, there is an extensive system of mostly two-lane, rural, high-speedroadways that do not have these features. The crash data presented earlier show that thissystem is particularly vulnerable to ROR crashes and should be targeted for appropriatemeasures. Vehicle design, restraint features and usage, and design of roadside features areall valid targets associated with the third objective, reducing the severity of ROR crashes.
The largest part of the ROR crash problem is on two-lane, rural, high-speed roads. Therefore,most of the emphasis in the following discussion of strategies is oriented to this road class.This is not to imply that there is no ROR problem on suburban or urban streets. Many of thestrategies included in this guide could be implemented on such roadways, since manysuburban roadways have “near-rural” designs. However, the strategy may well be restrictedon these streets and roads by restricted right-of-way and preexisting roadside conditions(e.g., curbs and sidewalks, utility poles adjacent to the travel lane, and bicycle paths) thatwill prevent implementation of strategies oriented to the “shoulder” or “roadside.” Theurban safety engineer will have to rely on strategies related to keeping the driver in thetravel lane (e.g., enhanced pavement markings, roadside delineation, and skid-resistantpavement).
There are also many miles of rural two-lane roads that carry significant traffic at fairly highspeeds that are also characterized by very limited rights-of-way. These conditions limit therange of strategy choices. Some experimental strategies (see definition above) have beenincluded that are oriented to these types of roadways (e.g., profile marking, edgeline rumblestrips, modified rumble strips for narrow shoulders, various pavement markings athorizontal curves, and the delineation of utility poles and trees). These same strategies mightbe considered for urban and suburban streets. As is emphasized below, these strategies areconsidered experimental, since no valid effectiveness evaluations have been found. The usershould not substitute these strategies for the “proven” strategies when the latter can beimplemented.
Related Strategies for Creating a Truly ComprehensiveApproachThe strategies listed above and described in detail below are those considered unique to thisemphasis area. However, to create a truly comprehensive approach to the highway safetyproblems associated with this emphasis area, five types of related strategies should beincluded as candidates in any program planning process:
• Public Information and Education (PI&E) Programs—Many highway safety programscan be effectively enhanced with a properly designed PI&E campaign. The traditionalemphasis with PI&E campaigns in highway safety is to reach an audience across anentire jurisdiction or a significant part of it. However, there may be a reason to focus aPI&E campaign on a location-specific problem. While this is a relatively untriedapproach, as compared with areawide campaigns, use of roadside signs and otherexperimental methods may be tried on a pilot basis.
Within this guide, where the application of PI&E campaigns is deemed appropriate, it isusually in support of some other strategy. In such a case, the description for that strategywill suggest this possibility (see the attribute area for each strategy entitled “Associated
SECTION V—DESCRIPTION OF STRATEGIES
V-4
SECTION V—DESCRIPTION OF STRATEGIES
Needs”). In some cases, specialized PI&E campaigns are deemed unique for theemphasis area and are detailed in the guide. In the future, additional guides mayexclusively address the details regarding PI&E strategy design and implementation.
• Enforcement of Traffic Laws—Well-designed and -operated law enforcement programscan have a significant effect on highway safety. It is well established, for instance, that aneffective way to reduce crashes (and their severity) is to have jurisdictionwide programsthat enforce an effective law against driving under the influence (DUI) or drivingwithout seat belts. When that law is vigorously enforced with well-trained officers, thefrequency and severity of highway crashes can be significantly reduced. This should bean important element in any comprehensive highway safety program.
Enforcement programs, by nature, are conducted at specific locations. The effect (e.g.,lower speeds, greater use of seat belts, and reduced impaired driving) may occur at ornear the specific location where the enforcement is applied. This effect can often beenhanced by coordinating the effort with an appropriate PI&E program. However, inmany cases (e.g., speeding and seat belt usage), the impact is areawide orjurisdictionwide. The effect can be either positive (i.e., the desired reductions occur overa greater part of the system) or negative (i.e., the problem moves to another location asroad users move to new routes where enforcement is not applied). Where it is not clearhow the enforcement effort may impact behavior or where an innovative and untriedmethod could be used, a pilot program is recommended. Within this guide, where theapplication of enforcement programs is deemed appropriate, it is often in support ofsome other strategy. Many of those strategies may be targeted at either a whole systemor a specific location. In such cases, the description for that strategy will suggest thispossibility (see the attribute area for each strategy entitled “Associated Needs for, or inRelation to, Support Services”). In some cases, where an enforcement program is deemedunique for the emphasis area, the strategy will be detailed. As additional guides arecompleted, they may detail the design and implementation of enforcement strategies.
• Strategies to Improve Emergency Medical and Trauma System Services—Treatment ofinjured parties at highway crashes can significantly impact the level of severity and lengthof time during which an individual spends treatment. This is especially true when itcomes to timely and appropriate treatment of severely injured persons. Thus, a basic partof a highway safety infrastructure is a well-based and comprehensive emergency careprogram. While the types of strategies included here are often thought of as simplysupport services, they can be critical to the success of a comprehensive highway safetyprogram. Therefore, an effort should be made to determine whether there are improve-ments that can be made to this aspect of the system, especially for programs focused uponlocation-specific (e.g., corridors) or area-specific (e.g., rural areas) issues. Additional guidesmay detail the design and implementation of emergency medical system strategies.
• Strategies Directed at Improving the Safety Management System—The management ofthe highway safety system is foundational to success. There should be a soundorganizational structure, as well as infrastructure of laws, policies, etc., to monitor,control, direct, and administer a comprehensive approach to highway safety. Acomprehensive program should not be limited to one jurisdiction, such as a statedepartment of transportation (DOT). Local agencies often must deal with most of theroad system and its related safety problems and are more familiar with its problems.Additional guides may detail the design and implementation of strategies for improvingsafety management systems.
V-5
• Strategies that Are Detailed in Other Emphasis Area Guides—Any program targeted atthe safety problem covered in this emphasis area should be created having given dueconsideration to the inclusion of other applicable strategies covered in the followingguides:
– Trees in Hazardous Locations,– Head-On Crashes,– Utility Pole Crashes (work in progress), and– Crashes on Horizontal Curves (work in progress).
Objective 15.1 A—Keep Vehicles from Encroaching on theRoadside
Shoulder rumble strips are crosswisegrooves in the road shoulder (Exhibit V2).States have developed various designdimensions, but generally they are about 0.5inches deep, spaced about 7 inches apart,and cut in groups of four or five. They canbe rolled into hot asphalt or concrete as it islaid, or they can be milled in later. Vehicletires passing over shoulder rumble stripsproduce a sudden rumbling sound andcause the vehicle to vibrate, thereby alertinginattentive, drowsy, or sleeping drivers ofencroachment on the shoulder and possiblyonto the roadside. Rumble strips have beenused primarily on expressways and freeways, although some states install them on two-lanerural roads with a high number of single-vehicle crashes.
Many agencies have long used rumble strips on the roadway itself to alert drivers tounexpected or particularly important features ahead. Cross-lane rumble strips arecommonly used in advance of stop signs on rural highways or in advance of constructionzones. While the application of rumble strips on the shoulder is relatively new as an RORsafety strategy, there is considerable experience and information on design and construction,operational qualities, and the performance of shoulder rumble strips on freeways. Thus, thisstrategy is “proven”1 for such freeways. Due to the current use in some states, but lack ofeffectiveness information, shoulder rumble strips are considered a “tried” strategy for two-lane roads.
Additional details concerning current practice with rumble strips can be found on theFederal Highway Administration’s (FHWA’s) “Rumble Strip Community of Practice” Web
SECTION V—DESCRIPTION OF STRATEGIES
V-6
EXHIBIT V-2Shoulder Rumble Strips
1 See explanation of ratings on page V-3.
SECTION V—DESCRIPTION OF STRATEGIES
page at the following address: http://safety.fhwa.dot.gov/programs/rumble.htm. This siteprovides definitions of types of rumble strips used, detailed construction drawings,effectiveness estimates, and interviews with users and other experts, among otherinformation. Information and details describing, for example, the three major types ofrumble strips (milled, rolled [or formed], and raised) are given on the FHWA Web page.
Shoulder rumble strips are compatible with other strategies designed to reduce thelikelihood or severity of roadside encroachments and can sometimes be implemented in thesame project effort with appropriate planning at little or no additional cost (e.g., inclusion ofrumble strips in safety-based shoulder reconstruction or curve-flattening efforts).
V-7
EXHIBIT V-3Strategy Attributes for Shoulder Rumble Strips
Technical Attributes
Target
Expected Effectiveness
Drivers of errant vehicles, using sound and sensation to directly alert the individual ofencroachment or pending encroachment.
On freeways, shoulder rumble strips have proven to be a very effective way to warndrivers that they are leaving or are about to leave the road. According to FHWA,several studies have estimated that rumble strips can reduce the rate of ROR crashesby 20 to 50 percent. Further statistics regarding effectiveness for specific programsare documented below. However, these crash reduction statistics apply to freeways.
While this strategy is currently implemented on nonfreeways by a number ofjurisdictions, there is little information on the safety effectiveness of shoulder rumblestrips on these roads. Further evaluation is clearly needed. Care should be taken inextrapolating freeway application experience to the two-lane highway system. On onehand, the rumble strips could be less effective since freeway design provides theerrant driver with a wider clear zone in which to recover after hitting the strip. On manytwo-lane roads, the clear zone—often just a shoulder—is much more limited. In suchcases, the driver has little opportunity to recover even when given a warning.However, rumble strips could be more effective on two-lane roads for basically thesame reason: since two-lane roads have much less clear zone and much morehazardous roadsides (less breakaway objects, more severe sideslopes, objects closerto roadway), a higher proportion of excursions from the travel lane may becomecrashes. Moreover, the quality of the roadway alignment is generally worse on two-lane versus freeway facilities, and hence the need for such warning to keep drivers onthe road is greater. Similarly, most freeways commonly include full 12-foot lanes, whilethere are many high-speed two-lane rural highways with lane widths as narrow as 10feet. Thus, if the shoulder rumble strips are effective, they could prevent more crashesper excursion. While it is not possible to determine which set of assumptions iscorrect, shoulder rumble strips should produce measurable benefits somewhatconsistent with those demonstrated in studies for freeways. In the absence of suchinformation, the following studies provide effectiveness estimates for shoulder rumblestrips on freeways and expressways.
The New York State Thruway Authority (NYSTA) installed continuous milled-inshoulder rumble strips on all four shoulders of 485 roadway miles of thruway between1992 and 1993. In its before/after evaluation, NYSTA used accident data provided bythe state police assigned specifically to the toll road system. One year of before data(1991) and 1 year of after data (1997) were used for the study (Exhibit V-4). Onlysingle-vehicle ROR crashes with certain “causes” were selected for the study because“it was believed that these specific run-off-road crashes were indicative of those thatcould be mitigated by the use of continuous shoulder rumble strips and correcting the
(continued on next page)
SECTION V—DESCRIPTION OF STRATEGIES
V-8
EXHIBIT V-3 (Continued)Strategy Attributes for Shoulder Rumble Strips
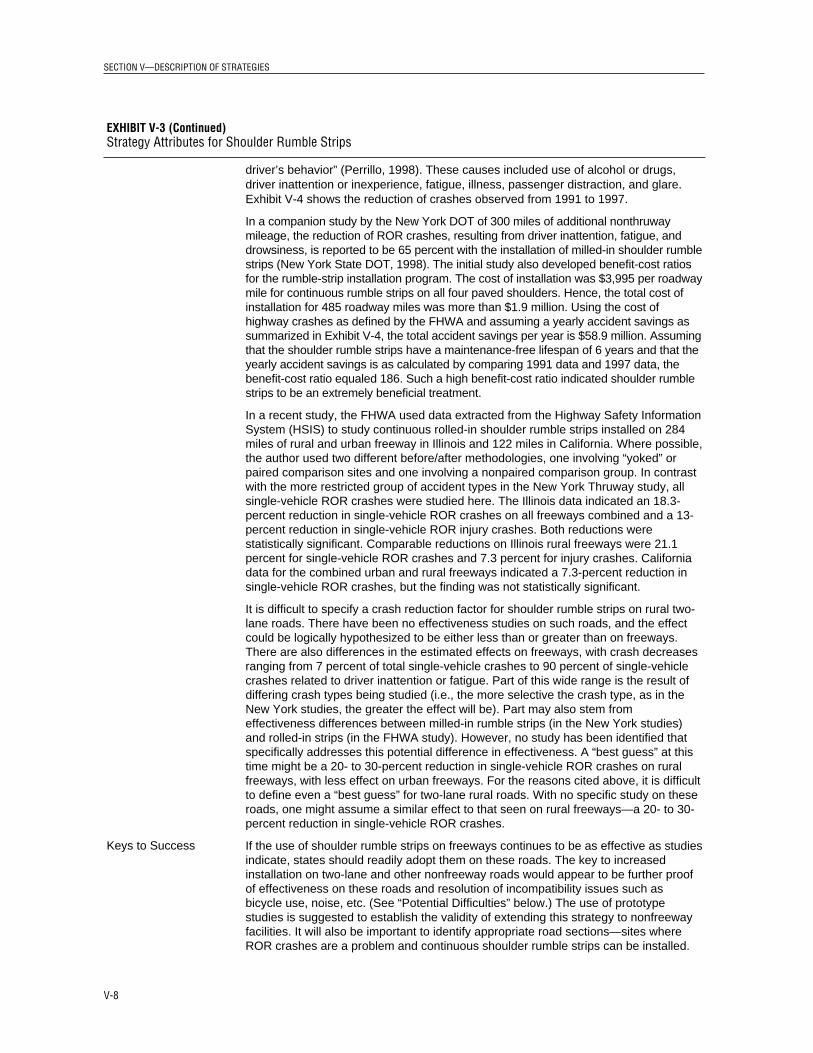
Keys to Success
driver’s behavior” (Perrillo, 1998). These causes included use of alcohol or drugs,driver inattention or inexperience, fatigue, illness, passenger distraction, and glare.Exhibit V-4 shows the reduction of crashes observed from 1991 to 1997.
In a companion study by the New York DOT of 300 miles of additional nonthruwaymileage, the reduction of ROR crashes, resulting from driver inattention, fatigue, anddrowsiness, is reported to be 65 percent with the installation of milled-in shoulder rumblestrips (New York State DOT, 1998). The initial study also developed benefit-cost ratiosfor the rumble-strip installation program. The cost of installation was $3,995 per roadwaymile for continuous rumble strips on all four paved shoulders. Hence, the total cost ofinstallation for 485 roadway miles was more than $1.9 million. Using the cost ofhighway crashes as defined by the FHWA and assuming a yearly accident savings assummarized in Exhibit V-4, the total accident savings per year is $58.9 million. Assumingthat the shoulder rumble strips have a maintenance-free lifespan of 6 years and that theyearly accident savings is as calculated by comparing 1991 data and 1997 data, thebenefit-cost ratio equaled 186. Such a high benefit-cost ratio indicated shoulder rumblestrips to be an extremely beneficial treatment.
In a recent study, the FHWA used data extracted from the Highway Safety InformationSystem (HSIS) to study continuous rolled-in shoulder rumble strips installed on 284miles of rural and urban freeway in Illinois and 122 miles in California. Where possible,the author used two different before/after methodologies, one involving “yoked” orpaired comparison sites and one involving a nonpaired comparison group. In contrastwith the more restricted group of accident types in the New York Thruway study, allsingle-vehicle ROR crashes were studied here. The Illinois data indicated an 18.3-percent reduction in single-vehicle ROR crashes on all freeways combined and a 13-percent reduction in single-vehicle ROR injury crashes. Both reductions werestatistically significant. Comparable reductions on Illinois rural freeways were 21.1percent for single-vehicle ROR crashes and 7.3 percent for injury crashes. Californiadata for the combined urban and rural freeways indicated a 7.3-percent reduction insingle-vehicle ROR crashes, but the finding was not statistically significant.
It is difficult to specify a crash reduction factor for shoulder rumble strips on rural two-lane roads. There have been no effectiveness studies on such roads, and the effectcould be logically hypothesized to be either less than or greater than on freeways.There are also differences in the estimated effects on freeways, with crash decreasesranging from 7 percent of total single-vehicle crashes to 90 percent of single-vehiclecrashes related to driver inattention or fatigue. Part of this wide range is the result ofdiffering crash types being studied (i.e., the more selective the crash type, as in theNew York studies, the greater the effect will be). Part may also stem fromeffectiveness differences between milled-in rumble strips (in the New York studies)and rolled-in strips (in the FHWA study). However, no study has been identified thatspecifically addresses this potential difference in effectiveness. A “best guess” at thistime might be a 20- to 30-percent reduction in single-vehicle ROR crashes on ruralfreeways, with less effect on urban freeways. For the reasons cited above, it is difficultto define even a “best guess” for two-lane rural roads. With no specific study on theseroads, one might assume a similar effect to that seen on rural freeways—a 20- to 30-percent reduction in single-vehicle ROR crashes.
If the use of shoulder rumble strips on freeways continues to be as effective as studiesindicate, states should readily adopt them on these roads. The key to increasedinstallation on two-lane and other nonfreeway roads would appear to be further proofof effectiveness on these roads and resolution of incompatibility issues such asbicycle use, noise, etc. (See “Potential Difficulties” below.) The use of prototypestudies is suggested to establish the validity of extending this strategy to nonfreewayfacilities. It will also be important to identify appropriate road sections—sites whereROR crashes are a problem and continuous shoulder rumble strips can be installed.
SECTION V—DESCRIPTION OF STRATEGIES
V-9
EXHIBIT V-3 (Continued)Strategy Attributes for Shoulder Rumble Strips
Potential Difficulties
Incompatibilities may exist between shoulder rumble strips and bicycle use. Since thetransportation community encourages increased bicycle use, this may become aserious issue. In a recent Draft Technical Advisory on Roadway Shoulder RumbleStrips, FHWA has noted its full support of AASHTO’s position, as stated in the 1999AASHTO Guide for the Development of Bicycle Facilities, that
Rumble strips or raised pavement markers . . . are not recommended whereshoulders are used by bicyclists unless there is a minimum clear path of 0.3 m (1 foot) from the rumble strip to the traveled way, 1.2 m (4 feet) from the rumble stripto the outside edge of paved shoulder, or 1.5 m (5 feet) to adjacent guardrail, curbor other obstacle. (Draft Technical Advisory on Roadway Shoulder Rumble Strips)
In that same advisory, the FHWA describes current state efforts to develop bicycle-friendly rumble strip programs and stresses the need for states to regularly sweepshoulders to remove debris where rumble strips and bicycles coincide in order to allowthe bicyclists to use the outer rather than inner part of the paved shoulder.
It is also noted that the Association of Pedestrian and Bicycle Professionals (APBP)has commented on these guidelines (see http://www.apbp.org/). Key suggestions forlocations with bike traffic include only using rumble strips on two-lane roads wherethere is a significant, demonstrated crash problem (rather than a systemwideapproach), minimizing the depth of the cut to 3/8 inch, preferably retaining 8 feet ofclear paved shoulder outside the rumble strip, installing the strip at or under theedgeline rather than leaving the 1-foot “no man’s land” between the edgeline andrumble strip, using 12-inch-wide strips with gaps, and no installation of rumble stripswhere there will be 4 feet or less of clear paved shoulder after installation without“overwhelming justification” and without warning signs to bicyclists.
In its early use of rumble strips, Pennsylvania would only use raised (edgeline) rumblestrips where there was at least 4 feet of paved shoulder in order to accommodatebicycle use. The state required a minimum of 4 feet of paved shoulder for shoulderrumble strips and preferred 6 to 8 feet. Because of these concerns, Pennsylvania hasdeveloped a design to make shoulder rumble strips “bicycle-tolerable.” Working for thePennsylvania DOT, the Pennsylvania Transportation Institute researched alternativedesigns to alert motorists without being disruptive to bicyclists. The resulting design,which is used on shoulders at least 6 feet wide, is a 3 ⁄8-inch-deep cut that is 5 incheswide with a 7-inch space between cuts. The rumble strips begin 6 inches off the edgeof the pavement. The Transportation Institute also recommended a similar pattern,except with a 6-inch space between cuts for lower-speed roads. Research inPennsylvania continues on an appropriate design for roadways with narrowershoulders (2 to 4 feet). (See Appendix 1 for detailed drawings.) Due to similarconcerns, California DOT (Caltrans) tested the vibration, noise, and subjective comfortlevels of 11 different rumble strip configurations using passenger cars, trucks,volunteer bicyclists and State Highway Patrol motorcyclists. Based upon acombination of results from the different tests, Caltrans adopted new standard rolled-in and milled-in rumble-strip designs for routes with bicycle usage. Where the shoulderis less than 5 feet wide, the policy allows for the use of raised/inverted profilethermoplastic traffic strips as the edgeline. See Exhibit V-5.
Note that a similar raised edgeline design was modified in Great Britain due to bicycleand motorcycle concerns. The raised ribs in the final design are approximately 1/4 inchhigh. Details can be found at http://www.roads.dft.gov.uk/roadnetwork/ditm/tal/signs/02 95/index.htm. Of course, discouraging bicycle use on roadways prone to RORcrashes may be the appropriate thing to do (or providing safer, separated bicyclefacilities within the same general corridor). To the extent that shoulder rumble strips
(continued on next page)
SECTION V—DESCRIPTION OF STRATEGIES
V-10
EXHIBIT V-3 (Continued)Strategy Attributes for Shoulder Rumble Strips
Appropriate Measures and Data
would be used in a site-specific versus systemwide basis, this apparent conflict may bemanageable. At least one state noted that motorcyclists may not be able to recover aswell from riding along a rumble strip as from a normal paved shoulder. However, testingby Caltrans involving a very small sample of four state highway patrol motorcyclistsindicated that the motorcyclists had no problems traversing any of the designs tested.
Other potential pitfalls include complications with snow removal, shouldermaintenance requirements, and noise. With respect to adverse weather, ice and snowcan collect in rumble strips. When the trapped water freezes, icy conditions mayoccur. However, the drainage designed for shoulders, as well as the speed,turbulence, and vibrations from passing vehicles, tends to knock the ice from therumble strips. Continuous shoulder rumble strips also have proven to be an asset totruck drivers during inclement weather. The shoulder rumble strips aid in determiningthe edge of the roadway when low visibility makes it difficult to see painted roadwayedges and markings. (Note, however, that North Carolina has found that theraised/inverted profile edgelines do not tolerate snowplowing.)
With respect to maintenance, Pennsylvania has not noted any additional maintenancerequired for the rumble strips installed on interstates with shoulders in good condition.Neither Massachusetts nor New York has noted any degradation over the past 3years. Indeed, in some user states, rumble strips have been shown to help snowplowsfind the edge of the travel lanes. While some states have expressed a concern thatthe installation of rumble strips might lead to pavement deterioration, the FHWA“Rumble Strip Community of Practice” Web page indicates that this does not occurwith proper installation. Finally, with respect to degradation, Kansas is changing itsrumble strip policy, which allowed rolled-in strips, to one requiring milled-in strips. Thischange is due to Kansas’s observation that rolled-in strips have a tendency to “healover” and reduce effectiveness over time.
There have been reports of noise complaints where shoulder rumble strips have beeninstalled. New installations should acknowledge this concern and make provisionswhere necessary. Implementing a program of rumble strips systemwide shouldconsider local sensitivities to maintain support for such a program.
Finally, there is not a crash-proven rumble strip design for two-lane roads withoutpaved shoulders or with very narrow paved shoulders (e.g., 2 feet wide). This is asignificant problem for some state agencies and many county and local agencieswhere most or all two-lane roads do not have paved shoulders. It is possible that theeffectiveness of shoulder rumble strips may well be lessened from freewayexperience, by poor or narrow shoulders that exist on many two-lane highways, sothat even an “alerted” motorist might not be able to safely recover. However, given thenumbers of such miles in the United States, there is clearly a need to test somepotential designs. (See sections below concerning possible experimental strategies.)
Process measures of program effectiveness would include the number of miles ofroad or the number of hazardous locations where rumble strips are installed.
Impact measures include the number of ROR crashes reduced at these locations andthe changes in total crashes. If possible, the impact measure should include potential“crash migration” (i.e., crashes occurring on downstream sections where rumble stripshave not been applied, but where drowsy drivers may still be on the road) effects onadjacent roadways.
The advent of low-cost vehicle-sensing and recording devices might allow for the useof a surrogate measure based upon the number of encroachments onto the shoulderover a specific section of road (e.g., a curve). In addition to process and crash data,the agency should also collect information on acceptance by the public and bybicyclists and on any adverse noise problems for adjacent properties.
SECTION V—DESCRIPTION OF STRATEGIES
V-11
EXHIBIT V-3 (Continued)Strategy Attributes for Shoulder Rumble Strips
Associated Needs
Organizational and Institutional Attributes
Organizational, Institutional, and Policy Issues
Issues Affecting Implementation Time
Costs Involved
Training and Other Personnel Needs
There have been a few reports of people who mistook the sounds produced by therumble strips as car trouble. A public information or education campaign, as well asstandard installation, should eliminate such misinterpretations. However, currentmoves to standardized use on freeways may provide the most effective public training.
First, if the agency does not have a design policy for rumble strips that can beretrofitted to shoulders, one may need to be developed. Additionally, a policyregarding the types of two-lane road sections where placement is acceptable may benecessary. While many states have established specific design and placementpolicies for shoulder rumble strips on freeways and other access-controlled facilities,specific criteria for two-lane or other nonfreeway roads were much more limited. Forexample, Minnesota policy states that “Rumble strips can also be placed on theshoulders of two-lane roads at the discretion of the District.” Since 1991, the KansasDOT has had a policy requiring shoulder rumble strips to be included on allreconstruction or new construction projects with a full width (8- to 10-foot) shoulder.Such strips were also required if full-width shoulders were being overlaid with aminimum of 1 inch of asphalt. This policy primarily pertains to freeways andexpressways since few two-lane rural roads have full-width shoulders. However,Kansas is installing the rumble strips on its “Super-Two” sections—sections with 12-foot lanes and full-width shoulders. Finally, rolled-in strips on asphalt pavements tendto deform over time, thus reducing the size of the cuts and lessening theireffectiveness. Due to these problems with “healing” rolled-in strips, Kansas is nowconsidering a revision of this policy, which would mandate milled-in rumble strips.Review of freeway-related policies from Connecticut, New Hampshire, New Jersey,Massachusetts, Maine, and Minnesota indicate that factors to be considered in suchpolicies include bicycle accommodation/routes, minimum shoulder width whereallowable, offset from edgeline, placement on or near bridge decks, use atintersections, speed limits, and other factors. Second, while this strategy isimplemented by the state DOT, there is a clear need for the inclusion of bicycletransportation offices or groups to be involved early in the planning process fortreatment of nonfreeways.
Shoulder rumble strip programs can be implemented quickly, certainly within a year ofan agency deciding to proceed. They can be implemented as components of both newconstruction and rehabilitation projects.
Due to increased installation and technological advances, the cost of continuousshoulder rumble strips has decreased over the years. For instance, in 1990, the NewYork DOT reported paying $6.18 per linear meter compared with $0.49 per linearmeter in 1998. Specific cost of installation on the New York Thruway was reported tobe $3,995 per roadway mile for rumble strips on all four shoulders. The cost includesmilling in the rumble strips, sweeping and discarding excess asphalt, and maintainingand protecting traffic. The Pennsylvania DOT reports an average cost of $0.25 perfoot or $2,640 per mile for the installation of milled-in rumble strips on the shoulderson both sides of two-lane roads. Incremental costs would be even less for rumblestrips being implemented concurrently with reconstruction or resurfacing of a highway.
There appear to be no special personnel needs for implementing this strategy. Eitheragency personnel or contractors could do the installation. The need for training willdepend on whether the agency has been using retrofitted rumble strips on freeways orother roadways. If not, either agency personnel or contractor personnel will need to betrained in proper installation techniques.
(continued on next page)
SECTION V—DESCRIPTION OF STRATEGIES
V-12
EXHIBIT V-3 (Continued)Strategy Attributes for Shoulder Rumble Strips
Legislative Needs
Other Key Attributes
There do not appear to be any special legislative needs.
One benefit of shoulder rumble strips is that, unlike other safety measures whoseeffectiveness may decrease over time as their “novelty” wears off, rumble stripsprimarily affect only drowsy or other inattentive drivers. Concern has been expressedthat if fatigue-related crashes are prevented on one section of roadway, the problemmay be transferred to another section. While the FHWA attempted to examine thisissue, no data have been found to support or dispel the theory. Such a possibility maybe reduced by public education urging fatigued drivers (particularly those who rideover the rumble strips and recover their vehicle from running off the road) to stop andrest before continuing.
EXHIBIT V-4Before and After Data for Selected Single-Vehicle ROR Crashes on the New York Thruway (Source: New York State Police)
Information on Agencies or Organizations Currently Implementing this Strategy
Almost all states have experience with shoulder rumble strips on interstates and otherfreeways. Some states are beginning to use them on two-lane roads. For example, asdescribed in Appendix 2, Maryland has installed shoulder rumble strips on a limitednumber of miles of two-lane highways. Pennsylvania is currently installing “edgelinerumble strips” on the edgelines of two-lane roads with 4-foot shoulders (see Appendix 1). Asnoted above, Pennsylvania, California, and Colorado DOTs have developed a “bicycle-tolerable” rumble strip for use on such roads. As described in Appendix 3, Kansas iscurrently changing its rumble strip policy to move to milled-in strips only and has usedshoulder rumble strips on limited sections of “Super Two” roadways (i.e., two-lane roadswith wider lanes and full shoulders).
Strategy 15.1 A2—Rumble Strips for Roads with Narrow or Unpaved Shoulders(Experimental Treatment)Most agencies require fairly wide paved shoulders before rumble strips will be installed (e.g.,at least 4 feet in Pennsylvania, and 6 to 8 feet preferably in Pennsylvania and other states).However, state and local agencies are often faced with locations having high ROR crashesand either no paved shoulder or a very limited paved shoulder. In many cases, these roadsare also characterized by lower average daily traffic (ADT) and limited right-of-way. Thus,widening and paving a shoulder for use with rumble strips may not be a viable option.
Three experimental2 treatments that might be considered include a milled-in “edgeline”rumble strip design placed on the edgeline (see Exhibit V-6), the above-notedraised/inverted profile thermoplastic profile marker (edgeline) that was tested by Californiafor use on shoulders of less than 5 feet in width, and a modified “standard” rumble stripdesign for use on narrow shoulders (e.g., 2-foot paved shoulders).
EXHIBIT V-6Typical Drawing Detail for Milled Edgeline Rumble Strips for Noninterstateand Nonexpressway Use on Roadways (Source: Pennsylvania DOT)
North Carolina tested the raised/inverted profile marking on a limited sample of about 40 to50 miles of two-lane rural U.S. routes, but has not completed any effectiveness evaluation(Appendix 4). Pennsylvania is pilot testing the milled-in edgeline rumble strip on sectionswith 4-foot paved shoulders and hopes to move to narrower shoulders in the future. Sincethis design is on the edgeline, it could be tested on roadways with no paved shoulders. Asshown in Exhibit V-6 above, the Pennsylvania milled-in design is approximately 7 inches
2 See explanation of ratings on page V-3.
SECTION V—DESCRIPTION OF STRATEGIES
V-14
apart, 5 inches wide, 0.25 inches deep, and the width of the edgeline (see Appendix 1 forcontact information).
North Carolina has also initiated a test program on a 9-mile section of rural two-lanehighway with narrow (i.e., 2-foot) paved shoulders. The rumble strip design being used is amodification of the “standard” milled-in design used in North Carolina. The 7-inch-widemilled cuts are 5/8 inches deep, are separated by 5 inches of unmilled pavement, and extend12 inches out from the edgeline (Appendix 4).
A major potential problem with the raised/inverted profile edgeline is durability in areaswhere snowplowing is done. North Carolina has experienced this problem in its pilot testand is no longer using this design in areas where snowfall is expected. Local residents havealso complained of noise problems. The potential problems with the milled-in design forshoulders would be the same—possible (but not proven) complications with snow removal,shoulder maintenance requirements, and noise. If bicyclists regularly use these roads withnarrow shoulders, the same concerns would exist.
Finally, these treatments have either not been tested or are being pilot tested at this point.They should not be used in place of other nonexperimental treatments and should be pilottested and evaluated before widespread use. The effectiveness of these designs is unknownand may be well be lessened from the estimates in the previous section, since these sectionshave poor or narrow shoulders where even an “alerted” motorist might not be able to safelyrecover. However, given the number of miles of such roads in the United States where RORcrashes do occur, pilot testing of these designs is clearly warranted.
Strategy 15.1 A3—Midlane Rumble Strips (Experimental Treatment)Midlane rumble strips are an experimental3 treatment that might be pilot tested on roadwayswith no shoulders or narrow paved shoulders. (This treatment is untested at this point,should not be used in place of other nonexperimental treatments, and should be pilot testedand evaluated before widespread use.) Midlane rumble strips appear similar to shoulderrumble strips—crosswise grooves in the pavement, perhaps 0.5 inch deep, spaced about4 inches apart, and cut in groups of four or five, but installed in the center of the travel laneversus on the edge of the shoulder. They can be rolled into hot asphalt or concrete as it islaid, or they can be milled in later. Details of shoulder rumble strips that could be consideredfor use midlane can be found on the FHWA rumble strip Web site athttp://safety.fhwa.dot.gov/programs/rumble.htm.
Midlane rumble strips have the same intent as shoulder rumble strips. When the drivertracks a path leading to an encroachment on the roadside, the rumble strip acts on the insidetire (as opposed to the outside tire for shoulder rumble strips) to alert the driver. Unlikeshoulder rumble strips, midlane rumble strips would be compatible with bicycle use, butmay be incompatible with motorcycle use. In addition, there is fear among some designersand safety engineers that the strip in the center of the lane may become an additional driverdistraction. Since midlane rumble strips should also affect head-on crashes, they might beconsidered at locations with both an ROR and a head-on crash problem.
3 See explanation of ratings on page V-3.
SECTION V—DESCRIPTION OF STRATEGIES
The major potential difficulty with this strategy would be public acceptance, particularlywith motorcyclists. The California DOT had four police motorcyclists test steering andrecovery capabilities on 11 different shoulder rumble strip configurations and found noproblems. However, further testing by nonprofessional riders is needed. Midlane stripscould have other adverse effects, including potential snow removal problems, additionallane maintenance costs, and noise. Snow removal and maintenance problems have not beenfound to be a major issue for shoulder rumbles strips (see discussion in “PotentialDifficulties” for shoulder rumble strips in Exhibit V-3).
Clearly this is a new, experimental intervention that will give a different look and feel to theroadway. Thus, a public information/education program is necessary to explain the benefitsof the treatment, and public and motorcycle groups should be included in early planningactivities.
In summary, while there are potential problems with this experimental treatment, ifsuccessfully tested, evaluated, and documented, it could provide a new tool for preventingROR crashes on roadways where shoulder rumble strips cannot be installed, and thetreatment might provide additional benefits in terms of reduction of head-on crashes.
Strategy 15.1 A4—Enhanced Delineation of Sharp CurvesGeneral Description
ROR crash risk on rural two-lane roads increases withdegree of curvature. Given the knowledge that sharpercurves result in more shoulder encroachments andcrashes and given that the flattening of the curve may betoo costly, the concept here is to provide drivers with aclear picture of the sharpness of the curve prior to curveentry, to “warn” drivers of the hazardous situation, or tocause drivers to decrease their speed prior to entering thecurve (Exhibit V-7). The first and second could be donethrough improved shoulder delineation (e.g., chevrons orhigh-intensity chevrons, large arrow signs, or delineatorson guardrails); by improved curve warning signs (e.g.,warning signs with flashing beacons); or innovative on-pavement markings (e.g., warning arrows on thepavement prior to the curve). The speed-reductiontreatment would also involve innovative pavementmarkings that create a sense of “danger” (e.g., transverselines with decreasing spacing or edgelines that give theappearance of a narrowing lane width). As a last resort,one state installed transverse rumble strips on thetraveled way prior to the hazardous curve.
The goal is to produce a delineation system “that will produce uniform speeds andplacement throughout the curve. It will negate the need for excessive braking in the curve,and the absence of a change in speed within the curve is a prime indication that the driverhas correctly perceived road curvature. Also, it will minimize encroachments on thecenterline and edgeline and thereby leave most of the vehicles driving in the center of thelane” (Jennings and Demetsky, 1983).
V-15
EXHIBIT V-7Enhanced Delineation of Sharp Curves
SECTION V—DESCRIPTION OF STRATEGIES
V-16
Strategy Attributes
As noted, this strategy involves some type of delineation or pavement marking aimed atproviding precurve information or warning to the driver. The proposed treatments are low-cost, currently available devices and markings. Since the speed of a vehicle entering a curveis related to the speed of the vehicle before the curve, it is important to reduce speed ontangent sections prior to the curve. All treatments suggested here are oriented to that goal.Speed reduction should result from better driver judgment, from driver recognition of andreaction to a well-designed and effective warning, or from driver reaction to a “heighteneddanger” situation (e.g., pavement markings that create the optical illusion of accelerationeven at a constant speed).
As noted below, the shoulder delineation treatments are considered “proven”4 strategies interms of crash reduction, while the on-pavement treatments, aimed at warning the driver orincreasing the visible level of hazard, have been “tried” by states, but are not considered“proven” in terms of crash reductions. This series of treatments is compatible with otherROR and head-on crash treatments and should not adversely affect other road users such asbicyclists or motorcyclists.
4 See explanation of ratings on page V-3.
EXHIBIT V-8Strategy Attributes for Delineation of Sharp Curves
Technical Attributes
Target
Expected Effectiveness
Drivers of vehicles entering potentially hazardous curves.
At least limited evaluations of all three types of devices have been conducted. Basedon these studies, well-placed shoulder delineators are a proven crash-reducingstrategy, at least for roads with average or higher designs. The on-pavementtreatments aimed at warning the driver or providing an increased sense of hazardhave been evaluated in terms of speed reduction, but not crash reduction. Thepositive findings with respect to speed reductions would place these treatments in the“tried” category.
In a very well-designed early study of post-mounted delineators on rural two-lanecurves, Foody and Taylor (1966) found them to reduce ROR crashes by 15 percent. Ina more recent nonaccident study, the “curve following behavior” of drivers was studiedbefore and after rural, two-lane curves were treated with different combinations ofchevron signs, post-mounted delineation, and raised pavement markings. Vehiclespeed and the placement of the vehicle in the lane were measured at 46 sites inGeorgia and 5 in New Mexico. The results for nighttime hours show that vehiclesmoved away from the centerline when chevrons were used (i.e., closer to theedgeline) and even farther away when raised pavement markers were used. Whenpost-mounted delineators were used, vehicle placement on right curves shifted towardthe centerline (Zador et al., 1987).
Contrasting findings for raised reflector posts were found in a Swedish study byKallberg (1993). (Note that this study was not restricted to posts on curves.) Theauthor concluded that “reflector posts on narrow, curvy, and hilly roads cansignificantly increase driving speeds and accidents in darkness.” Specifically, reflectorposts increased accidents on roads with relatively low geometric standards and 50-mph posted speed limits. Although the specific effects of reflector posts on the lateral
SECTION V—DESCRIPTION OF STRATEGIES
V-17
EXHIBIT V-8 (Continued)Strategy Attributes for Delineation of Sharp Curves
position remain unclear, it is clear that the shift in lateral position (if there is asignificant shift) is toward the edge of the road. This before and after study with controlsites was conducted on roadway segments in Finland. The counterintuitive findingsare supported by the human factors concept of selective visual degradation. Thistheory explains that reflector posts do not improve the driver’s ability to detectpotential hazards but do improve the driver’s ability for orientation tasks. This mayreduce the frequency of ROR collisions, but it also may increase speeds and thereforeincrease the severity of those ROR crashes that do occur. With respect to warningmessages placed on the pavement, the Insurance Institute for Highway Safety (IIHS)conducted a study for a single, very sharp curve (~90°) on a suburban two-lanesecondary road in Northern Virginia with a posted speed limit of 35 mph (Retting andFarmer, 1998). The pavement marking consisted of the word “SLOW” in 8-foot-highwhite letters, a white 8-foot-high left curve arrow, and an 18-inch-wide white lineperpendicular to the road at the beginning and end of the text/symbol. Results werebased on before/after changes in mean speed, 90th-percentile speed, and percentageof vehicles exceeding 35 mph, 40 mph, and 45 mph, as compared with similar datafrom a nearby comparison curve that was not treated. The pavement marking wasassociated with a decrease in vehicle speed of 6 percent overall and 7 percent duringdaytime and late night periods.
The same pavement marking was used in a 1999 study at six sites in Pennsylvania(Retting, 1999). A before/after study of effects on vehicle speeds showed that thesepavement markings had little effect on the average speed and the 85th-percentilespeed. However, the 95th-percentile speed was reduced significantly. This year, themarking will be implemented at 200 sites statewide, and IIHS will again evaluate theeffect.
Evaluations of markings on the pavement to slow drivers by heightening “apparentdanger” have been conducted for a number of years both in the United States andinternationally. In a 1979 study for the Ohio DOT, the effects of yellow-bar pavementmarkings installed perpendicular to the direction of travel were studied. There were“reported reductions in traffic speeds, most notably high speeds” resulting from thepavement markings installed prior to curves (Retting and Farmer, 1998). In asomewhat limited 1980 before/after study of one particularly hazardous curve on arural two-lane road in Meade County, Kentucky, the treatment involved transverselines of reflective tape in an ever-tightening pattern designed to slow a vehicle from 55mph to 35 mph before entering the curve. The pattern consisted of 30 stripes with atotal pattern length of 810 feet, designed to give the illusion of acceleration unless thedriver slowed down. Daytime mean speeds decreased from 41.3 mph to 33.9 mphimmediately after installation. The mean speed increased slightly to 34.9 mph 6months after installation. Nighttime mean speeds decreased from 40.5 mph to 35.1mph immediately after installation and increased to 39.1 mph 6 months later. Averagecrashes per year decreased from 7.7 in the preceding 6 years to three crashes theyear after installation. An estimated benefit-cost ratio of 45.9 was calculated, and theauthors concluded that the treatment was more effective than signs alone and shouldbe used at other curves where excessive speed is an accident factor (Agent, 1980). Ina more recent study of “optical speed bars” at approaches to workzones, Meyer(2001) examined the issue of whether the decrease in speed from transverse stripingwas due to the perceptual effects of “increasing speed” with a pattern of stripes withgradually decreasing spacing or simply from the “warning” given. The authorexamined changes in speed as a free-flowing vehicle passed through three adjacentpatterns when entering the work zone. The first pattern of transverse stripes were
(continued on next page)
SECTION V—DESCRIPTION OF STRATEGIES
V-18
EXHIBIT V-8 (Continued)Strategy Attributes for Delineation of Sharp Curves
Keys to Success
Potential Difficulties
equally spaced, the second had ever-decreasing spacing, and the third were muchwider stripes further apart. The data indicated speed reductions of 2 to 3 mph in themean and 85th-percentile speeds for each of the patterns. The authors concluded thatthere was both “perceptual” and “warning” effects present. They drew no conclusionsconcerning which pattern was more effective. No crash data were analyzed. (Theeffects could differ between curves and work zones due to the driver’s judgment of“hazard” related to each.)
In the earlier noted 1999 study of hazardous curve sites in Pennsylvania, transversestriping giving the illusion of acceleration was studied at several sites (Retting, 1999).Unlike the pavement arrow described above, the before/after study showed that thesepavement markings had little effect on the average, 85th-percentile, or 95th-percentilespeeds.
Other pavement markings designed to increase the “apparent danger” of the curvaturehave also been evaluated, but not for rural, two-lane curve situations. In a 1998 studyof three urban exit ramps in Virginia and one ramp in New York, an experimentalpavement-marking scheme was investigated. The treatment narrowed the apparentlane width of the entry to the ramp curve and the ramp curve itself by using a gradualinward taper of existing edgeline or exit gore pavement markings. Studies of vehiclespeeds at three of the four ramps indicated that the proportion of passenger vehiclesexceeding the posted speed limit by more than 10 mph decreased 20 to 30 percentwhile speeds at the control site and upstream site remained the same or increased.Similar or slightly larger decreases in the percentage of large trucks exceeding theposted advisory speed by more than 5 mph were also found at the three sites wherethe equipment differentiated trucks from other vehicles (Retting et al., 2000).
Finally, in the Netherlands and other European countries, an experimental use ofedgelines has been tried on curves on narrow, low-volume roads where no edgelinewas used in the past (Steyvers and Waard, 1997). Both a solid edgeline and a dashededgeline caused vehicles to move away from the roadway edge when compared witha completely unmarked curve and with a curve with only a centerline. Driving speedswere slightly higher with the edgelines than with no lines, but slightly lower than whena centerline only was present. No crash analysis was conducted. Whileexperimentation with such markings deserves further testing for these low-volumeroads, current Manual of Uniform Traffic Control Devices (MUTCD) guidelines shouldbe taken into consideration. In summary, there are few studies of the accident-relatedeffects of these innovative treatments. Based upon the only crash studies available,post-mounted delineators might be expected to reduce ROR accidents on curves byapproximately 15 percent. There is some question concerning the cost-effectivenessof continuous use of such devices on narrow, hilly, curvy roads with lower designstandards. While warning symbols on the pavement prior to the curve, pavementmarkings “narrowing” the lane, and some transverse markings have been shown toreduce either mean speed or 95th-percentile speeds, there are no sound accident-based studies available. Thus, there continues to be a need for well-designedbefore/after pilot evaluations of crash experience, particularly for the pavement arrowand transverse striping treatments. The ongoing work in Pennsylvania should providedata on the arrow treatment.
The development of design standards, based upon sound evaluation studies of theseinnovative markings, will be important. The ability of interested states to have accessto evaluations in other states will be important to achieve acceptance.
If these treatments are targeted to curves with actual or expected safety problems,there appear to be few potential difficulties. The Pennsylvania study of the initialtransverse-bar sites noted some motorists driving on the shoulder to avoid the lines.
SECTION V—DESCRIPTION OF STRATEGIES
EXHIBIT V-8 (Continued)Strategy Attributes for Delineation of Sharp Curves
Appropriate Measures and Data
Associated Needs Services
Organizational and Institutional Attributes
Organizational, Institutional, and Policy Issues
This could be a problem with unpaved shoulders (but it is less likely to occur withoutpaved shoulders) and if the vehicle makes a sudden avoidance maneuver withoutreducing speed (which, again, may not be likely to occur). Pennsylvania also notedthat some drivers (presumably commuters) would drive across the centerline or ontothe shoulders to avoid transverse rumble strips. Further observations of trafficbehavior at treatment sites are needed to determine whether these are true problems.An attribute of these special treatments is their uniqueness and hence high level ofnotice by drivers. Overuse of these treatments could lead to them losing thisuniqueness and ultimate effectiveness. A final possible difficulty could includemaintaining the pavement markings over time, given that they are being crossed by alltraffic.
In the evaluation of these delineation programs, process measures would include thenumber of hazardous curves treated.
Impact measures involve comparison of crash frequencies or rates (with the studyappropriately designed) for the period before and after modifications. A usefulsurrogate measure is the change in speed for vehicles entering selected curves. Theadvent of low-cost vehicle-sensing and recording devices might also allow for the useof a surrogate measure based upon the number of encroachments onto the shoulderover a specific section of road (e.g., a curve). Sufficient data/information will beneeded to target these treatments to the correct location. The expert system softwarenoted in “Personnel and Other Training Needs” below will help in this effort.
The transverse strips and the pavement arrow are new treatments, and a relativelymodest public information effort may be helpful in garnering support for the effort. Ifevidence is found that a significant proportion of motorists do drive on the shoulder toavoid the transverse lines (see “Potential Difficulties” above) and if this is found to bea safety problem, then a more significant public education effort will be needed for thistreatment.
These strategies will be implemented by state and local roadway agencies, and itdoes not appear that extra coordination with other agencies or groups is needed. Ifthese treatments prove effective and are accepted by states for implementation, bothspecific design policies and placement policies will be needed. There are two differentapproaches in selecting delineators for a curve—local practice/policy and the MUTCD.Some of the “newer” pavement markings may have to be approved for use by FHWAas an experimental marking and then eventually adopted as an acceptable device forthe MUTCD. However, until a standard is adopted, engineers should consider theeffects of implementation inconsistencies on violating driver expectancies.
Jennings and Demetsky (1983) investigated the three post-mounted delineatorsystems used in Virginia (chevron, special striped delineator [on post], and reflector ona post) for their effectiveness in controlling ROR crashes and to recommend astandard policy regarding use of the system. The resulting simplified policy states thatfor moderate curves (less than 7 degrees) where delineation is necessary, standarddelineation should be used as recommended in the MUTCD. If the curve is greaterthan 7 degrees, chevrons give better delineation information and the spacing shouldbe 2 to 3 times MUTCD recommendation. Other policy-related advice on delineationselection and placement can be found in expert system software developed byZwahlen and Schnell (1995). (See “Training and Other Personnel Needs” below.)
(continued on next page)
V-19
SECTION V—DESCRIPTION OF STRATEGIES
V-20
Information on Agencies or Organizations Currently Implementing this Strategy. As noted inthe Effectiveness section, various states (e.g., Ohio, Virginia, Pennsylvania, Kentucky, andNew York) have implemented limited installations of delineation and warning systems oncurves. As documented in Appendix 1, the most recent of these is Pennsylvania, which isimplementing and testing an innovative “pavement arrow” treatment on curve approaches.
Strategy 15.1 A5—Improved Highway Geometry for Horizontal CurvesGeneral Description
Both ROR and head-on crashes are 1.5 to 4 times more likely to occur on curves than ontangents (Glennon et al., 1985). Zegeer et al. (1992) found that ROR crashes accounted forapproximately 57 percent of the total crashes on a sample of over 11,000 curves on two-lanerural roads. While many of the other strategies in this section (e.g., rumble strips, shouldertreatments, wider clear zones, and skid-resistant pavement) would have equal or greatereffectiveness on curves, crash reductions on curves can also be realized through tailoredprograms. Specifically, flattening curves (i.e., increasing the curve radius on two-lane ruralroadways) has been found by Zegeer et al. to result in total curve crash reductions of up to80 percent (i.e., flattening a 30-degree curve to 5 degrees). Thus, this strategy has been“proven”5 to reduce crashes. Given the size of these potential reductions, an agency shouldclearly consider this as a treatment alternative for locations with significant ROR problems ifright-of-way and funding are available. Since some head-on crashes are the result of vehicles
EXHIBIT V-8 (Continued)Strategy Attributes for Delineation of Sharp Curves
Issues Affecting Implementation Time
Costs Involved
Training and Other Personnel Needs
Legislative Needs
Other Key Attributes
None identified.
Since these devices are relatively inexpensive and standard, they could beimplemented very quickly.
The cost of the arrow pavement marker is about $2,000 per site (both directions)according to Pennsylvania’s experience. Cost figures are not available for the othertreatments. However, many states already use chevrons and other delineators incertain locations and may have cost figures of their own.
There appear to be no special personnel needs for implementing this strategy. Eitheragency personnel or contractors would do the installation.
Since there are various low-cost devices available to the engineer, there is need forsome guidance on treatment design and placement. Zwahlen and Schnell (1995)developed a PC-based expert system software package that helps the designerchoose an appropriate treatment and place the devices for maximum effect. Thisexpert system considers devices such as flexible post delineators, object markers,and various size chevrons.
None identified.
5 See explanation of ratings on page V-3.
SECTION V—DESCRIPTION OF STRATEGIES
leaving the lane onto the shoulder area and then “overcorrecting” such that they cross intothe opposing lane of travel and strike an oncoming vehicle, this treatment will also affecthead-on crashes.
Flattening of curves involves reconstructing a road section and changing the alignment. Thisstrategy is among the higher-cost alternatives of those considered. Reconstruction may alsoentail the environmental process and will often include right-of-way acquisition, both ofwhich require substantial time. Therefore, curve flattening will usually be outside thetimeframe adopted for the AASHTO Strategic Highway Safety Plan. However, the strategyis included here since it can result in significant crash savings, which is based uponextensive research. Curve flattening is compatible with other ROR strategies such asshoulder or midlane rumble strips, enhanced delineation, wider shoulders, and roadsideimprovements. These complementary modifications, when implemented together, can resultin lower costs than if they were instituted at separate times.
V-21
EXHIBIT V-9Strategy Attributes for Improved Highway Geometry for Horizontal Curves
Technical Attributes
Target
Expected Effectiveness
While the treatment will target hazardous or potentially hazardous curves, the ultimatetarget is a vehicle that runs off the roadway on these curves.
Research by Zegeer et al. concerning this proven strategy provides estimates of theeffect of curve flattening for various degrees of curve on two-lane rural roads (assum-ing that the central angle remains constant, and therefore the less-sharp treated curvewill be longer and will “replace” some tangent in the initial layout). While more detailedestimates based upon type of curve (isolated versus nonisolated) and central angle(10 to 50 degrees) can be found in the full report, Exhibit V-10 indicates ranges of esti-mated percent reduction in total crashes for such treatments. For example, flattening a30-degree curve to 10 degrees is predicted to reduce total crashes on the section by61 to 67 percent. As noted in a recent review of this study and others, in work relatedto development of accident modification factors (AMFs) for use with FHWA’s Interac-tive Highway Safety Design Model (Harwood et al., 2000), the estimates provided bythis cross-sectional modeling effort would be expected to be less accurate than resultsfrom well-conducted before/after studies of actual curve flattening efforts. However, inthe absence of such before/after studies in the literature, these results were acceptedby the AMF expert panel.
As noted below, curve flattening along two-lane roads may be combined with othersafety strategies, including lane and shoulder widening, to provide an additional safetybenefit. Indeed, in the process of realigning a curve, the agency would simultaneouslyprovide a new roadside, which itself could provide a positive contribution to safety.Exhibit V-10 summarizes the reductions possible. For instance, assume a 20-footroadway (with two 10-foot lanes) is to be widened to 22 feet of paved surface with 8-foot gravel shoulders. Exhibit V-11 indicates that these improvements would reducecurve accidents by 5 percent (due to lane widening of 1 foot per side) and 24 percent(due to widening unpaved shoulders by 8 feet per side). Note that the 5-percent and24-percent accident reduction values cannot merely be added numerically.
In summary, improving the geometry of horizontal curves can lead to significant crashreductions. These reductions change with the amount of curve flattening or widening,as shown in Exhibits V-10 and V-11. It is noted that these reductions are related to
(continued on next page)
SECTION V—DESCRIPTION OF STRATEGIES
V-22
EXHIBIT V-9 (Continued)Strategy Attributes for Improved Highway Geometry for Horizontal Curves
Keys to Success
Potential Difficulties
Appropriate Measures and Data
AssociatedNeeds
Organizational and Institutional Attributes
Organizational, Institutional, and Policy Issues
Issues Affecting Implementation Time
Costs Involved
Training and Other Personnel Needs
Legislative Needs
percentages of total crashes, rather than just to ROR crashes. While these treatmentsclearly affect ROR crashes, specific percentages for this subset are not presented inthe study. The authors have noted that since curve flattening and widening affectsalmost all crash types, percent reduction in total crashes were considered to be themost appropriate measure.
Since this is a relatively expensive treatment, one of the keys to success would appearto be targeting higher-hazard curves. Since ROR crashes increase with degree ofcurve, the targeting could be based primarily on prior crash history, curve degree,ADT, and speed limit.
As noted above, the estimated effects of this treatment may be inflated due to the factthat they are not based on before/after studies. If the implementing agency “expects”effects this large for a given site or project and after-treatment experience is lower, theagency might curtail similar future efforts. However, given the size of the predictedeffects, even if the true effects are much lower (e.g., half as high), this will still remainone of the most effective treatments for ROR crashes on curves.
In estimates of program implementation effectiveness, appropriate process measureswould include the number or proportion of “hazardous” curves that are flattened (per-haps categorized by the change in curvature).
The impact measure would be the number of total crashes reduced in the roadwaysection replaced by the new design.
Targeting will require data on crash frequencies, degree of curve, length of curve,speed limit, and ADT. The factor most likely missing from computerized state files isthe degree of curve.
None identified. This is a standard treatment requiring no additional public information(except as part of any required environmental study).
This strategy will be implemented by the state DOT or local roadway agency, and itdoes not appear that coordination with other agencies will be needed. (The exceptionwould be coordination with environmental agencies if new right-of-way were required.)Since curve flattening is a standard treatment, it would appear that new policy efforts arenot required.
However, a slightly different “institutional safety philosophy” may be needed here incomparison with other strategies in this guide. Given the higher cost of this treatment(but coupled with the higher potential payoff), the agency must be prepared to imple-ment more than just low-cost improvements.
Given that the treatment will require some form of design and reconstruction and willusually require purchase of additional right-of-way (and thus involve the environmentalprocess), this treatment period will be relatively long.
Costs will depend on the amount of reconstruction necessary and on whether addi-tional right-of-way is required. In general, this is one of the higher-cost strategies rec-ommended. It is also one of the most beneficial.
There appear to be no special personnel or training needs for implementing this strat-egy, given that it involves “standard” reconstruction efforts.
None identified.
SECTION V—DESCRIPTION OF STRATEGIES
V-23
EXHIBIT V-9 (Continued)Strategy Attributes for Improved Highway Geometry for Horizontal Curves
Other Key Attributes
Since curve flattening would require significant reconstruction, it would be very easy tocombine this treatment with lane widening and shoulder improvement treatmentsnoted elsewhere. In addition, it should provide some benefit for bicyclists using theshoulders since it reduces the number of vehicles that leave their lane.
Original Degree of Curve New Degree of Curve
Percent Reduction in Total
30 25 15-17
20 31-33
15 46-50
10 61-67
5 78-83
25 20 17-20
15 35-40
10 53-60
5 72-80
20 15 20-25
10 41-50
5 64-75
15 10 24-33
5 50-66
3 63-79
10 5 28-49
3 42-69
EXHIBIT V-10Percentage Reduction in Total Crashes on Two-Lane Rural Roads Due to Curve Flattening (Based on Zegeer et al., 1992)
Strategy 15.1 A6—Enhanced Pavement Markings at Appropriate LocationsGeneral Description
The focus of this strategy is the provision for better on-pavement “guidance” to drivers atlocations where they might leave the roadway. This would be done through such alternativetreatments as higher contrast or wider markings or raised pavement markers (RPMs) versusthe standard pavement markings that would be used at other locations where the ROR riskis lower. (Note that this strategy relates to enhanced markings, often at spot locations, ratherthan to the installation of standard centerline and edgeline markings where no markingshave existed in the past. The consensus of the literature on “standard” markings as reportedin NCHRP Report 440 (Fitzpatrick et al., 2000) is that they are recommended for roadways withany substantial traffic volumes. Warrants for and details of standard centerline and edgelinemarkings can be found in the MUTCD (FHWA, 1988), and supplemental guidelines onimplementation can be found in the Roadway Delineation Practices Handbook (Migletz, 1994).
Strategy Attributes
The goal of the strategy is to mark the roadway more clearly so that drivers will use theinformation to stay in their lanes and not merely to maintain or increase their speed. Thespecific markings to be used are low-cost, readily available materials.
As will be seen below, there remains conflicting evidence concerning the crash-relatedeffectiveness of these devices. Thus, they are considered to be in the “tried”6 category ofstrategies. If truly effective, these treatments appear to be compatible with other ROR andhead-on treatments and should not adversely affect other road users such as bicyclists ormotorcyclists.
Total Amount of Lane or Shoulder Widening Percent Accident Reductions
EXHIBIT V-11Percentage Reduction in Total Crashes on Two-Lane Rural Roads Due to Shoulder Widening (Based on Zegeer et al., 1992)
6 See explanation of ratings on page V-3.
SECTION V—DESCRIPTION OF STRATEGIES
V-25
EXHIBIT V-12Strategy Attributes for Better Pavement Markings at Appropriate Locations
Technical Attributes
Target
Expected Effectiveness
Drivers of vehicles who might leave the roadway because of inability to see the edgeof the pavement in the roadway section ahead.
Enhanced lane markings are an appropriate treatment if it is assumed that driversleave the roadway because they cannot see the pavement edge in the downstreamroadway sections. While some driver guidance is needed in such cases, the questionis: How much should be added without changing the roadway geometry or theroadside design? Since some evaluations have raised questions about the overalleffect of enhanced markings and RPMs, these features are considered a “tried”strategy at this time.
For example, past research (Pendleton, 1996) and research being conducted byBellomo-McGee, Inc., for NCHRP indicate a lack of significant effect or even apossible increase in crashes on some locations. This could be because drivers tend todrive faster when presented with a clearer delineation of the lane edge. Note,however, that evaluations of such treatments reflect studies of projects involvingdelineation that was implemented in conjunction with resurfacing. What is not clear iswhether speeds increase because of simultaneous resurfacing and remarking orbecause improved markings were added without alignment or shoulder treatments.
A review of earlier studies on wider edgelines in NCHRP Report 440 noted that, in general, the effectiveness of 8-inch edgelines to reduce ROR crashes is“questionable.” The study recommends that they be used only on roads with 12-footlanes, unpaved shoulders and ADT between 2,000 and 5,000 vehicles per day. Incontrast, a 1988 study by the New York DOT indicated that sections of curving two-lane rural roads with new 8-inch edgelines resulted in higher crash reductions thansimilar sections with new 4-inch edgelines. The study indicated greater safety effectsfor total crashes (a 10-percent decrease for the wider edgelines versus a 5-percentincrease for standard edgelines); for injury crashes (15-percent decrease versus 10-percent decrease, respectively); and for fixed-object crashes (33-percent decreaseversus 17-percent decrease, respectively). The study appears to have controlled forthe regression to the mean bias by choosing both sets of experimental and controlsites from a listing of high-crash locations. It is not clear whether the choice was maderandomly.
Effectiveness studies of RPMs have been conducted by states in before/afteranalyses of treatments at high-hazard locations. (It should be noted that accuratelyevaluating a treatment at a high-crash location is difficult because of the “regression tothe mean” phenomenon. Whether the following studies controlled for such potentialbiases is unknown.) In southern New Jersey, RPMs have been used on two separateroutes, both two-lane rural highways totaling 53.5 miles. The total project cost was$122,730 (1985 dollars). Using data from 2 years before and 1 year after, there was astatistically significant reduction in various types of nighttime accidents including total,injury, head-on, fixed object, overturn, and between intersection accidents. Thecalculated benefit-cost ratio was 19.89 (State of New Jersey, 1986).
In northern New Jersey, RPMs were installed on six routes (over 126 miles), generallyrural two-lane roads. The total project cost was $314,242 (1985 dollars). Again, usingdata from 2 years before and 1 year after, there was a statistically significant reductionin various nighttime crashes including total, injury, property damage, overturn, head-on, fixed object, and between intersection crashes. The calculated benefit-cost ratiowas 15.45 (State of New Jersey, 1986).
(continued on next page)
SECTION V—DESCRIPTION OF STRATEGIES
V-26
EXHIBIT V-12 (Continued)Strategy Attributes for Better Pavement Markings at Appropriate Locations
Key to Success
Potential Difficulties
Appropriate Measures and Data
For projects with fewer than 800 markers, state forces (not independent contractors,as above) do the installation. For six different route sections totaling 47.8 miles, theconstruction cost was $151,493. Analysis results show a statistically significantreduction in accidents in every nighttime accident category (total, fatal, injury, propertydamage, head-on, fixed object, wet surface, and between intersections). The benefit-cost ratio was 25.51.
In Ohio, marker studies were conducted at 184 locations that had high accident ratesprior to 1977, including horizontal curves, narrow bridges, stop approaches, andinterchanges. Over 3,200 accidents at marker locations were analyzed 1 year beforeand 1 year after. The results show a 9.2-percent reduction in accidents and a 14.9-percent decrease in injuries. Markers were determined to be effective in all types ofdriving conditions, including nighttime (5.3-percent reduction) and adverse weatherconditions (5.5-percent reduction in crashes at the same time precipitation increasedby 10.6 percent). The study concluded that “a dollar spent on raised reflective highwaymarkers in Ohio has returned $6.50 in savings due to accident reduction.” As of 1981,nearly 700,000 RPMs were installed in Ohio (The Ohio Underwriter, 1981).
In a 1997 report, the New York State DOT concluded from prior evaluations thatraised snowplowable pavement markers (RSPMs) can reduce “guidance-relatedaccidents” (fixed-object collisions, ROR, and encroachment) by approximately 19percent if selectively applied at locations having high percentages of such crashes. (Itis not clear from the report whether the regression-to-the-mean bias has beenaccounted for.) Based upon an evaluation of 1992 data and a review of studies fromother states, the DOT further concluded that RSPMs should not be appliedsystemwide, since they are somewhat costly and would have no effect or a possiblenegative effect on crashes at such nonspecific locations.
In summary, the effectiveness of RPMs as a general “systemwide” treatment appearsquestionable. The effectiveness of RPMs at high-hazard sites may also be less clearthan first thought. This is not to say they should not be tried. Their relatively low costargues for experimentation. However, at this point, it is not possible to specify a crashreduction factor for these devices. Clearly, well-designed before/after studies ofeffectiveness at such sites are needed—studies that account for the “regression-to-the-mean” bias. Thus, although this treatment may be effective in reducing crashes,careful targeting, monitoring, and evaluation are needed.
Similarly, the effectiveness of wider edgelines is also difficult to specify based uponpast studies. While the NCHRP Report 440 review found wider edgelines“questionable” in general, the New York State DOT study indicated thatimplementation on high-crash sites on two-lane roads might result in a 10- to 15-percent decrease in ROR crashes.
Based upon the effectiveness studies, the key to success is the targeted application ofthis treatment to sites where more guidance is needed for the driver, but wherevehicle speeds will not be increased to unsafe levels.
A potential difficulty with RPMs is the damage to the reflector or possible dislodging ofthe reflector during snow plowing. However, these concerns have lessened due to thecreation of plowable RPMs. Another potential pitfall is nontargeted or erroneouslytargeted application of the devices on high-speed two-lane roads. This could result inadverse safety effects, which might negatively affect opinions about the treatment andtherefore keep it from being implemented where needed.
In agency evaluations of implementation effectiveness, process measures would includethe number of hazardous curves treated and the type of treatment applied.
The 1999 statistics from FARS show that for two-lane, undivided, noninterchange, nonjunctionroadways, 11 percent of single-vehicle ROR fatal crashes occur on wet roadways, with 3percent more occurring on roadways with snow, slush, or ice (Exhibit V-13). Accidents on wetpavements are often related to the skid resistance of the pavement. It can also happen that thepavement friction available under dry roadway conditions will be significantly less thanspecified for the roadway and assumed in establishing design criteria (e.g., superelevation on
V-27
EXHIBIT V-12 (Continued)Strategy Attributes for Better Pavement Markings at Appropriate Locations
Associated Needs
Organizational and Institutional Attributes
Organizational, Institutional, and Policy Issues
Issues Affecting Implementation Time
Costs Involved
Training and Other Personnel Needs
Legislative Needs
Other Key Attributes
None identified.
Impact measures would involve before/after changes in crash frequencies or rates (withthe study appropriately designed) and changes in speed from before to after treatment.
It would also appear that data are needed to better target the treatment, targeting tosites where additional visual guidance is needed, but where speeds are less likely tobe increased. This is a difficult task. It may be aided by use of video logs and conductof safety audit types of studies.
No new public information efforts appear to be needed since this is a publiclyaccepted treatment on other roads. (Efforts to train the public to use them correctly—i.e., not to increase speed—are not expected to be effective).
This strategy could be implemented by the state DOT or a local roads agency, and itdoes not appear that additional cooperative efforts with other agencies are needed.The only exception might be if the enhanced delineation led to increased speeds. Inthis case, targeted speed enforcement could be needed.
After effectiveness is established and targeting methods are developed, a design andplacement policy is needed to facilitate implementation, along with AASHTO supportand guidance.
Since these devices are relatively inexpensive and are standard devices, they couldbe implemented in a very short timeframe.
An old cost figure states that Ohio’s average cost is $14.71 per unit for 35,000 units. A1997 New York DOT report indicates that an RSPM (which is more expensive than astandard RPM) costs approximately $25–30 to install and $6–8 each 3 years forreflector replacement. Installation was found to increase the cost of delineation fromapproximately $2,000 to $5,300 per mile. However, states have most likely developedtheir own cost estimates, since these treatments are being widely used.
There appear to be no special personnel or training needs for implementing thisstrategy. The installation would be done by either agency personnel or contractorsand indeed is already being done in most state agencies.
None identified.
curves). This can also lead to crashes. However, the major problem appears to be with wetpavement crashes.
A vehicle will skid during braking and maneuvering when frictional demand exceeds thefriction force that can be developed at the tire-road interface. While this can happen on drypavements at high speeds, friction force is greatly reduced by a wet pavement surface. Infact, a water film thickness of 0.002 inches reduces the tire pavement friction by 20 to30 percent of the dry surface friction. Therefore, countermeasures should seek to increase thefriction force at the tire-road interface and reduce water on the pavement surface. Thecoefficient of friction is most influenced by speed. However, many additional factors affectskid resistance, including the age of the pavement, pavement structural condition, trafficvolume, road surface type and texture, aggregates used, pavement mix characteristics, tireconditions, and presence of surface water.
There has been a large amount of research funded by the FHWA, AASHTO, and pavementassociations concerning designing better pavements—pavements which are more durableand more cost-effective (e.g., the FHWA/AASHTO Strategy Highway Research Program).The FHWA has issued a series of pavement-related technical advisories on such issues asneeded changes in surface finishing of Portlandcement concrete pavements for increased safety(FHWA, 1996). An important parameter in allthis work is pavement skid resistance, perhapsthe major safety-related factor along withpavement drainage design. However, most ofthis research and implementation effort isoriented toward policy or systemwide changesin new pavements or repaving efforts. Whilethe best safety-related pavement designpossible should be used in all paving efforts,the details of pavement design are beyond thescope of this guide.
Instead, this section will concentrate onimprovements that can be made to sites thathave, or are expected to experience, skidding-related ROR crashes. These usually involveimprovements to increase skid resistance(higher friction factor). Such improvementsshould have high initial skid resistance, durability to retain skid resistance with time andtraffic, and minimum decrease in skid resistance with increasing speed. Countermeasures toimprove skid resistance include asphalt mixture (type and gradation of aggregate as well asasphalt content), pavement overlays on both concrete or asphalt pavements, and pavementgrooving. Water can also build up on pavement surfaces due to tire rutting, an inadequatecrown, and poor shoulder maintenance. These problems can also cause skidding crashes andshould be treated when present. While there is only limited research on such site-specificprograms (see below), the results of this research coupled with the results of research on thegeneral effectiveness of decreasing skidding would place this in the “proven”7 category.
SECTION V—DESCRIPTION OF STRATEGIES
V-28
Ice2%
Wet11%
Other1%
Snow or Slush1%
Dry85%
EXHIBIT V-13Distribution of Single-Vehicle ROR Fatalities for Two-Lane, Undivided, Noninterchange, NonjunctionRoads by Roadway Condition (Source: 1999 FARS)
7 See explanation of ratings on page V-3.
SECTION V—DESCRIPTION OF STRATEGIES
V-29
EXHIBIT V-14Strategy Attributes for Skid-Resistant Pavement Surfaces
Technical Attributes
Target
Expected Effectiveness
Keys to Success
Potential Difficulties
Treatment will target locations where skidding is determined to be a problem, in wet ordry conditions. The ultimate target, however, is a vehicle involved in a crash due toskidding, usually on wet pavement. With respect to ROR or head-on crashes, thetarget vehicle is one that runs (skids) off the road due to insufficient skid resistance orbecomes involved in a head-on crash either by skidding into the opposing lane or bycrossing into the opposing lane after an over-correction from an initial ROR maneuvercaused by insufficient skid resistance.
There are many different specific countermeasures that may be implemented toimprove skid resistance. This may include changes to the pavement aggregates,adding overlays, or adding texture to the pavement surface. The effectiveness of thecountermeasure not only depends on that measure selected, but also will vary withrespect to location, traffic volume, rainfall propensity, road geometry, temperature,pavement structure, etc.
The New York State DOT has implemented a program that identifies sites statewidethat have a low skid resistance and treats them with overlays or microsurfacing as partof the maintenance program. A site is eligible for treatment if its 2-year wet accidentproportion is 50 percent higher than the average wet accident proportion for roads inthe same county. Between 1995 and 1997, 36 sites were treated on Long Island,resulting in a reduction of more than 800 annually recurring wet road accidents. Theseresults and others within the state support earlier findings that treatment of wet roadaccident locations result in reductions of 50 percent for wet road accidents and 20percent for total accidents. While the reductions in ROR or head-on crashes cannot beextracted from the data at this time, it appears that reductions in these types would beat least the same as for total crashes.
While these results could be subject to some regression-to-the-mean bias, the NewYork staff has found that untreated sites continue to stay on the listing until treated inmany cases—an indication that these reductions are clearly not totally due toregression. The New York State DOT is planning a more refined data analysis toaccount for possible biases in these effectiveness estimates. Based on the currentknowledge, this identification/treatment strategy would be classified as “proven.”
Monitoring the skid resistance of pavement requires incremental checks of pavementconditions. Evaluation must identify ruts and the occurrence of polishing. Recentresearch (Galal et al., 1999) has suggested that the surface should be restoredbetween 5 and 10 years in order to retain surface friction, but the life span is affectedby site characteristics such as traffic volume.
In addition, spot- or section-related skid accident reduction programs will be clearlymost successful if targeted well. The New York State DOT program noted aboveprovides a methodology for such targeting. In addition, in a 1980 Technical Advisory,the FHWA provided a detailed description of a “Skid Accident Reduction Program,”including not only details of various treatments, but also the use of crashes and rainfalldata in targeting the treatments.
Skid resistance changes over time. This requires a dynamic program and strongcommitment. As noted in the preceding section, it also requires good “targeting.” Whenselecting sites for skid resistance programs, it is important to somehow control for theamount of wet-pavement exposure. This will help decrease the identification of sites thathave a high wet-accident proportion or that rate simply because of high wet-weather
(continued on next page)
Information on Current Knowledge Regarding Agencies or Organizations that AreImplementing This Strategy
Many states have an ongoing program aimed at the systematic monitoring of pavements,including measurement of skid numbers. As described in Appendix 5, New York State DOThas established SKARP to incorporate safety into pavement maintenance. The program wasestablished to address problems with inadequate pavement friction. Using a systematicapproach, over 100 statewide sites are identified annually and further tested and possiblytreated. The treatments include resurfacing and microsurfacing.
SECTION V—DESCRIPTION OF STRATEGIES
V-30
EXHIBIT V-14 (Continued)Strategy Attributes for Skid-Resistant Pavement Surfaces
Appropriate Measures and Data
Associated Needs
Organizational and Institutional Attributes
Organizational, Institutional, and Policy Issues
Issues Affecting Implementation Time
Costs Involved
Training and Other Personnel Needs
Legislative Needs
Other Key Attributes
None identified.
exposure with no real pavement-friction problems. Unfortunately, it is difficult orimpossible for an agency to develop good wet-pavement crash rates per vehicle milefor all roadway sections due to the lack of good wet-weather exposure data for allsites. Such data would require both good rainfall data for all potential sites and goodmeasures of traffic volume during wet and dry weather. In its Skid Accident ReductionProgram (SKARP), the New York State DOT uses a surrogate for such detailed data.The DOT compares the proportion of wet-weather crashes at each site with theproportion for similar roads in the same county. The assumption here is that rainfall(and thus wet-pavement exposure) would be similar across a county, a reasonableassumption.
Data are needed on traffic crashes by roadway condition. In addition, measures oftraffic exposure that identify and reflect both dry and wet periods are needed. Finally,measurements of road friction and pavement water retention should be documentedboth before and after implementation of a strategy.
None required. Relatively unnoticed by the public.
Implement by state DOT; no coordination required. Policy may be needed in order todetermine the most appropriate pavement aggregate statewide and at special locations.Additionally, guidelines may be needed to highlight when pavement groove cuts shouldbe considered. These countermeasures may also require cooperation within an agency,especially if these types of safety treatments are to be tied to routine maintenance.
Depends upon the treatment. Grooving can be done quickly, but overlays requiremore time. Nevertheless, all strategies being suggested should have shortimplementation periods.
Highly variable depending upon the specific treatment. The New York State DOTestimates that its resurfacing/microsurfacing projects are approximately 0.5 mileslong, with an average treatment cost of approximately $20,000 per lane mile (1995dollars).
No special personnel needs for implementing this strategy. Either agency personnel orcontractors could do installation.
If a vehicle that has intentionally or unintentionally left its lane and entered the shoulderarea is allowed to safely recover, ROR crashes can be reduced. The probability of such a saferecovery is increased if the errant vehicle is provided with a wider and smoother area inwhich to initiate such a recovery and if the recovery is not impeded by a pavementirregularity that causes the driver to either fail to re-enter the lane or to enter it at such anangle that the vehicle crosses into the opposing lane. Shoulder treatments that promote saferecovery include shoulder widening, shoulder paving, and the reduction of pavementedgedrops (i.e., differences in lane pavement and shoulder surface heights, whether pavedor not). While each strategy could be covered separately, the effectiveness is related, and theactual treatment can often be completed as a “package” during roadway resurfacing. Notethat these same shoulder treatments, particularly shoulder paving and correcting edgedrops,can reduce head-on crashes. These treatments enable the vehicle’s recovery to be made in amore controlled fashion and at a less sharp angle, thereby reducing the chances that therecovering vehicle will over-correct into the opposing lane.
Strategy Attributes
While the nature of the widening and paving treatments is self-evident, there arealternatives to the treatment of edgedrops(Exhibit V-15). Edgedrops can result fromrepaving, where material is added to the lanebut not to the adjacent shoulder, or fromweather or vehicle-caused “erosion” ofunpaved shoulders. In their discussion ofpossible treatments, Humphreys and Parham(1994) noted that the best treatment is toalways retain the lane and shoulder heightsat the same level. This is often difficult due torepaving practices and unpaved shouldersthat deteriorate. They then noted that anexcellent alternative for both paved andunpaved shoulders is adding a 45-degreefillet at the lane/pavement edge: a wedge ofpavement that would allow the vehicle tosafely return to the roadway. This wedge (or a 45-degree beveled edge) can be added duringrepaving by attaching a device known as a “moulding shoe” to modern paving equipment.
Based upon current research concerning crash-related effectiveness, shoulder paving andwidening are considered “proven” strategies, while edgedrop treatments are considered“experimental.”8 These shoulder treatments are compatible with other ROR treatments.Paving shoulders can be accompanied by shoulder rumble strips, and paving and wideningshoulders should make the shoulders more compatible with bicycle use.
V-31
EXHIBIT V-15Example of an Edgedrop
8 See explanation of ratings on page V-3.
SECTION V—DESCRIPTION OF STRATEGIES
V-32
EXHIBIT V-16Strategy Attributes for Shoulder Treatments
Technical Attributes
Target
Expected Effectiveness
The targets of this package of strategies are vehicles that stray from their lanes ontothe shoulder area. The ultimate targets are the drivers of these vehicles, who arebeing provided with an opportunity for a safe recovery.
Even though there have been numerous studies of both shoulder widening and pavingand limited studies of pavement edgedrop elimination, there is still some uncertaintyabout the true effect of such treatments. A recent unpublished literature review byHauer (2000) demonstrated this uncertainty, noting some studies of shoulderwidening/paving that indicated effects as large as 30- to 40-percent reductions andother studies that indicated no effect or even a possible increase in crashes for certainADT levels. (If true, such an increase could be attributed to increased speeds resultingfrom shoulder improvements without changes in curvature or other factors.) The majorshortcoming in the large body of research is that most findings are not based on well-conducted before/after studies where shoulders have actually been improved in thefield. Instead, most are “cross-sectional” studies, in which different segments of roadswith different shoulder characteristics are used in statistical models that estimate theeffect of a change in width by changes in model output. However, based on the bestavailable research, shoulder widening and paving would be considered “proven”strategies. Even though their safety benefits would appear to be “obvious,” strategiesrelated to edgedrop elimination would have to be considered “experimental,” since noresearch into effectiveness is available.
With respect to shoulder widening and paving, in a recent FHWA effort related todetermining AMFs for use with the Interactive Highway Safety Design Model(Harwood et al., 2000), a panel of experts attempted to develop a best estimate ofshoulder treatment effectiveness based on a review of a number of researchstudies. Their estimate of effectiveness of shoulder widening on two-lane rural roadsis shown in Exhibit V-17. Here, the base shoulder is a 6-foot-wide paved shoulder,and the AMFs shown for different ADTs are relative to this base shoulder. Forexample, a roadway with 500 vehicles per day and a 2-foot shoulder would beexpected to have 30 percent more “related crashes” than the same road with a 6-foot shoulder (i.e., an AMF of 1.3). In like fashion, a two-lane rural road with 2,000vehicles per day and an 8-foot shoulder would be expected to have 13 percentfewer related crashes than the same road with a 6-foot shoulder (i.e., an AMF of0.87). Note that these reductions are not for total crashes, but for “related crashes,”which include single-vehicle ROR, multivehicle opposite-direction (i.e., head-onsand opposing sideswipes), and multivehicle same-direction sideswipe crashes. Toobtain the percentage reductions in total crashes, these AMFs would be multipliedby the percentage of total crashes they represent (typically, 35 percent for two-lanerural highways).
In the same study, the panel also defined AMFs for turf, composite, and stabilizedgravel shoulders relative to the paved shoulder of the same width. As shown in ExhibitV-18, these effects change with shoulder type and shoulder width. For example, for an8-foot width, turf shoulders are expected to experience 11 percent more “relatedcrashes.”
Much less is known about the effectiveness of edgedrop treatments, since it is difficultto specifically define the percentage of ROR or head-on crashes, which is the result of“overcorrection” by vehicles that run off the road first. Whatever that percentage,Humphreys and Parham (1994) concluded that a 45-degree-angle asphalt fillet at thelane edge would virtually eliminate this type of crash, even in cases where theshoulder is unpaved and suffers subsequent erosion damage.
SECTION V—DESCRIPTION OF STRATEGIES
V-33
EXHIBIT V-16 (Continued)Strategy Attributes for Shoulder Treatments
Keys to Success
Potential Difficulties
Appropriate Measures and Data
Associated Needs
Organizational and Institutional Attributes
Organizational, Institutional, and Policy Issues
Issues Affecting Implementation Time
Costs Involved
As with other ROR treatments, keys to success will include treatment targeting, suchthat funds are used as efficiently as possible. Targeting them to higher-speed roadswith high ROR crash frequencies and rates could enhance all three strategies.Implementation of the edgedrop treatments will be enhanced by the identification of“champion” states that have implemented edgedrop treatments as a standard part oftheir repaving efforts and have found the treatments to be both low cost and effective.If an edge-fillet program is to be implemented, an additional key to success will be thedevelopment of an inclusive pavement specification and the necessary equipmentmodifications.
While not evaluated extensively, it appears that the edge fillet or other edgedroptreatments would not have significant potential difficulties unless the use of thistreatment resulted in less maintenance of unpaved shoulders.
However, if wider paved shoulders are added to high-speed roads with poor alignmentand hazardous roadsides, they possibly could lead to an increase in vehicle speedsand total crash frequency and severity. Thus, careful targeting and monitoring isneeded.
In the evaluation of strategy implementation effectiveness, process measures wouldinclude the number of road miles or number of hazardous locations where theseshoulder treatments are installed, as well as the type of installation. Impact measureswill include the number and rate of ROR (and head-on) crashes reduced at theselocations. However, due to possible adverse effects, changes in total crashes alsoshould be studied.
Data on ROR crashes would be needed to target the shoulder widening/pavingtreatment. If the state decided to use only the pavement edge treatment at selectedlocations (rather than as a standard add-on to resurfacing activities), criteria wouldneed to be developed to define those critical locations, and data (e.g., crash oredgedrop inventory) would be needed to identify the locations. In addition, as notedabove, since the edge-fillet treatment has not been evaluated, if a state were toimplement the wedge, it is critical that the necessary treatment location, crash, androadway inventory data on possible confounding factors be collected.
Since these are somewhat “standard” treatments, there does not appear to be acritical need for public information or education efforts.
This strategy can be implemented by the state DOT or local roadway agency, and itwould appear that there is no need for cooperative efforts with other agencies. Sincethese are “standard” treatments in general, no significant policy action appearsneeded other than a possible design policy for the pavement edge fillet.
Unless shoulder widening requires additional right-of-way, these treatments can beimplemented in a relatively short timeframe. While all three would involve retrofits toexisting pavements, it seems that the most opportune time to implement them wouldbe in conjunction with repaving efforts.
Shoulder widening costs would depend on whether new right-of-way is required andwhether extensive roadside moderation is needed. Shoulder pavement costs shouldbe similar to lane pavement costs and depend on how much shoulder stabilization isrequired.
(continued on next page)
SECTION V—DESCRIPTION OF STRATEGIES
V-34
EXHIBIT V-16 (Continued)Strategy Attributes for Shoulder Treatments
Training and Other Personnel Needs
Legislative Needs
Other Key Attributes
None identified.
Humphreys and Parham (1994) note that the cost of adding a pavement edge filletwhen resurfacing a roadway is very low—perhaps 1 to 2 percent of the typicalresurfacing cost.
There would appear to be no special personnel needs for implementing thesestrategies, since they are similar to other paving/construction activities. The only newtraining needed would be for paving forces (whether state or contract) that wouldplace the pavement edge fillet.
None identified.
EXHIBIT V-17Accident Modification Factor for Paved Shoulder Width (Relative to 6-Foot Paved Shoulder) on Two-Lane RuralHighways (Source: Harwood et al., 2000)
SECTION V—DESCRIPTION OF STRATEGIES
Information on Agencies or Organizations Currently Implementing this Strategy
Almost all states have some experience with widening and paving shoulders. The only stateidentified with a current policy regarding a pavement edge “wedge” is Kansas. The KansasDOT has had a policy for more than a decade requiring that a pavement edge “wedge” beinstalled at the edge of pavement during 1-R (repaving) projects. Somewhat different fromthe 45-degree fillet of paving material described above, Kansas requires a wedge with aslope equaling the shoulder slope constructed of either rock, earth, or recycled asphalt. Rockis the most often used material. In all cases, the wedge material is compacted according tospecifications.
Objective 15.1 B—Minimize the Likelihood of Crashing into an Object or Overturning if the Vehicle Travels Off the Shoulder
Strategy 15.1 B1—Design Safer Slopes and Ditches to Prevent RolloversThis strategy has been covered below with closely related strategies under the sectionentitled Combined Strategy: Improving Roadsides.
Strategy 15.1 B2—Remove/Relocate Objects in Hazardous Locations This strategy has been covered below with closely related strategies under the sectionentitled Combined Strategy: Improving Roadsides.
Strategy 15.1 B3—Delineation of Roadside Objects (Experimental Treatment)This strategy has been covered below with closely related strategies under the sectionentitled Combined Strategy: Improving Roadsides.
V-35
S h o u ld e r W id th ( f t ) P a v e d G r a v e l C o m p o s i te T u r f
0 1 .0 0 1 .0 0 1 .0 0 1 .0 0
1 1 .0 0 1 .0 0 1 .0 1 1 .0 1
2 1 .0 0 1 .0 1 1 .0 2 1 .0 3
3 1 .0 0 1 .0 1 1 .0 2 1 .0 4
4 1 .0 0 1 .0 1 1 .0 3 1 .0 5
6 1 .0 0 1 .0 2 1 .0 4 1 .0 8
8 1 .0 0 1 .0 2 1 .0 6 1 .1 1
1 0 1 .0 0 1 .0 3 1 .0 7 1 .1 4
S h o u ld e r T y p e
EXHIBIT V-18Accident Modification Factor for Shoulder Type on Two-Lane Rural Highways (Source: Harwood et al., 2000)
Objective 15.1 C—Reduce the Severity of the Crash
Strategy 15.1 C1—Improve Design of Roadside Hardware (e.g., Bridge Rails) This strategy has been covered below with closely related strategies under the sectionentitled Combined Strategy: Improving Roadsides.
Strategy 15.1 C2—Improve Design and Application of Barrier and AttenuationSystems This strategy has been covered below with closely related strategies under the sectionentitled Combined Strategy: Improving Roadsides.
Combined Strategy: Improving RoadsidesThe section includes strategies aimed at both minimizing the likelihood of a crash oroverturning, if a vehicle travels off the shoulder and onto the roadside, and minimizing theseverity of the crashes that do occur on the roadside. Because this strategy has multiplepossible components that are covered in detail in other documents, the following narrativewill be more general than the preceding sections. The reader should also refer to theAASHTO Roadside Design Guide for a detailed discussion of this strategy area.
General DescriptionThe series of strategies covered first in this guide are related to keeping the vehicle fromencroaching onto the shoulder—keeping the vehicle in its lane (e.g., shoulder rumblestrips). The second set of strategies describing shoulder treatments is related tominimizing ROR crash likelihood by allowing the errant vehicle to safely recover to thetravel lane. The set of strategies covered in this final section are related to the roadside—the area outside the shoulder. Each strategy is aimed at meeting one or both of thefollowing goals:
• Minimize the likelihood of crashing into an object or overturning if the vehicle travelsbeyond the edge of the paved (or unpaved) shoulder.
• Reduce the severity of the crash if an impact occurs.
Improvements to the roadside can meet both goals by providing a traversable “clear zone,”which (a) is free of highway hardware and unsafe natural objects (e.g., trees); (b) protects theobjects that cannot be removed (e.g., crash attenuators in front of hazardous utility poles,guardrails protecting steep sideslopes); or (c) makes objects that cannot be removed lesssevere to the striking vehicle (e.g., breakaway signs and utility poles). In addition, the well-designed clear zone will
• Be of sufficient width that most vehicles that leave the road do not exceed its limits, • Have up and down slopes that do not cause vehicle rollovers, and • Possess soil characteristics that do not lead to vehicle tripping and thus rollovers.
SECTION V—DESCRIPTION OF STRATEGIES
V-36
SECTION V—DESCRIPTION OF STRATEGIES
Strategy AttributesStrategies that are directed at roadside design range from very costly to relativelyinexpensive. The former include purchasing new right-of-way, building wider and saferclear zones where limited zones now exist, and clearing and grading clear zones on right-of-way already owned. Less costly (but not inexpensive) strategies may include replacingnonbreakaway or outdated roadside hardware (e.g., guardrail ends, culverts) with newertechnology at selected locations, burying utility lines, or relocating utility poles. Thequestion for the agency then becomes one of how to spend limited roadside safety dollars inthe most cost-efficient manner. That is, what should be targeted, and how?
FARS data for all roadway classes shown in Exhibit V-19 indicate that the most harmfulevent in a nonintersection ROR crash is most likely to be an overturn (42 percent of 1999ROR single-vehicle fatalities), an impact with a tree (26 percent), an impact with a utilitypole (7 percent), or an impact with a ditch or embankment (5 percent). Most other roadsideobjects (e.g., culverts, posts, and guardrails) are found to be the most harmful event in 2percent or less of the fatalities. FARS data shown earlier in Exhibit III-4 indicated that ontwo-lane rural roads, the most harmful event in a nonintersection ROR crash is most likely tobe an overturn (41 percent of 1999 ROR single-vehicle fatalities), an impact with a tree (29percent), an impact with a utility pole (8 percent), or an impact with a ditch or embankment(5 percent). Again, most other roadside objects (e.g., culverts, posts, and guardrails) arefound to be the most harmful event in less than 2 percent of the fatalities. These areessentially the same percentages of most harmful events found when all single-vehicle RORfatalities are examined, regardless of roadway class, as shown in Exhibit V-19. This is notsurprising when one considers that approximately two-thirds of the total ROR fatalityproblem is on two-lane roads.
Rural and urban interstate roads (which experience approximately 18 percent of the RORfatalities) exhibit a slightly different pattern, since the roadsides on interstates are built to amuch higher standard. “Overturn” is much more prevalent as the most harmful event(59 percent); guardrails and concrete traffic barriers are slightly more prevalent (6 percentand 2 percent, respectively); ditch and embankments are slightly less prevalent (3 percent);and utility pole impacts are virtually eliminated. Somewhat surprisingly, while lessprevalent, trees are still the most harmful event in interstate ROR fatal crashes in 13 percentof the cases.
Because of the importance of tree impacts on all roads and utility pole impacts on two-laneroads, they have been designated as separate emphasis areas with separate guides. For thatreason, this section will not concentrate on these areas in terms of specific treatmentstrategies.
Rollover ReductionIf one were concerned with addressing a significant proportion of ROR fatalities withroadside treatments other than those aimed at trees and utility poles, the above data wouldpoint to concentration on treatments that lessen rollovers. The issue is complex, in thatroadway and roadside design are only one of many factors affecting rollovers. Importantfactors not under the control of the roadway engineer include driver control factors (e.g.,speed control or steering or braking during attempted recovery) and vehicle factors (e.g., thehigher rollover propensity of SUVs and pickups). In addition, treatments aimed at rollover
V-37
prevention are, in general, expensive. They either involve the development and deploymentof new roadside hardware to replace outdated installations that might produce vehiclerollovers (e.g., replacing outdated guardrail ends) or, more often, widening and flatteningroadside slopes. There is also some initial evidence that certain soils may cause rollovers onsideslopes that are otherwise safe. Given the size of the problem, and the severity ofrollovers, the effort and expense is often warranted.
Because of the significance of the rollover problem, the FHWA initiated a major researcheffort in this area. While the results of that program will not be available until 2003, theinitial phase of the effort—the experimental design of the research, which details the natureof the problem and possible avenues of research—has been completed (see Harkey et al.,2000). The roadside design features most likely to affect rollover include the sideslope(particularly fill slopes), ditch design, the nature of the soil on the slope, and the design ofroadside hardware that might lead to rollovers (e.g., poorly designed guardrail ends).Unfortunately, little is known at this point concerning how soil types (or possibletreatments) might affect rollover.
SECTION V—DESCRIPTION OF STRATEGIES
V-38
Overturn42%
Ditch and Embankment5%
Tree26%
Other barrier4%
Guardrail2%
Bridge Pier/Abutment/Rail/End
2%
Pedestrian/Bicyclist3%
Parked Motor Vehicle2%
Fire/Explosion/Immersion3%
Other Barrier1%
Sign and Light Supports2%
Utility Pole7%
Fence1%
EXHIBIT V-19Most Harmful Events for All 1999 Fatal Single-Vehicle ROR Crashes on All Roadway Classes
With respect to roadside hardware, the 1999 FARS data also indicate that, when a rolloveroccurs as a “subsequent event,” the first thing struck is a ditch or embankment inapproximately 31 percent of the cases (Exhibit V-20). Other “first-struck” objects includetrees (14 percent of the fatal crashes with subsequent rollovers), guardrail (11 percent),culverts (7 percent), utility poles (6 percent), and sign posts (3 percent). There is no one typeof roadside hardware that is related to a large proportion of subsequent fatal rollovers: theroadside embankment and ditch design are the major problem. The fact that 11 percent of
SECTION V—DESCRIPTION OF STRATEGIES
the fatal subsequent rollovers follow impacts with guardrails does not mean that theguardrails are poorly designed or substandard. Some of these rollovers could have occurredafter the vehicle struck the rail and either passed over or through it. Alternatively, thecrashes could have occurred when the vehicle rebounded from the rail, “struck” somethingelse, and subsequently overturned. In addition, these statistics concern only the smallpercentage of crashes that result in a fatality and do not imply that 11 percent of all guardrailimpacts result in rollovers. At most, these percentages suggest that there is not currently aguardrail design that will eliminate rollover under every set of operating conditions. Whileimprovements in hardware is a worthwhile goal, the most effective rollover-reductionprogram will result from concentrating on “earth factors” and would involve widening andflattening sideslopes (particularly fill slopes) and making improvements to ditches. A relateddesign issue concerning whether current standards that recommend a “length of need” for aguardrail are sufficient for today’s conditions is currently under study by the FHWA—thatis, whether the guardrail extends back far enough from the “hazard” to prevent vehiclesfrom entering an unsafe sideslope or other hazardous condition.
V-39
EXHIBIT V-20Percentage of Subsequent Rollovers Related to Various “First Struck” Objects
The AASHTO Roadside Design Guide (2002) provides guidance concerning the recommendedclear zone distance for given cut or fill slopes, design speed, and design ADT (Exhibits V21and V-22). The guide also presents adjustment figures based on horizontal curvature. Asnoted in the recent NCHRP Report 440 (Fitzpatrick et al., 2000), “The guidance curvesprovided [in the Roadside Design Guide] are based on limited empirical data that was thenextrapolated to provide data for a wide range of roadside conditions; therefore, thenumbers obtained from these curves represent a ‘reasonable measure’ of the degree ofsafety suggested for a particular roadway.” Attempts are continually being made to updateand improve these data. NCHRP Project 17-11, “Determination of Safe/Cost EffectiveRoadside Slopes and Associated Clear Distances,” is aimed at increasing the understandingof roadside encroachment distances (i.e., the distance a vehicle strays from the travel lane)and rollover occurrence on roadside slopes.
Additional rollover (and other ROR) crash reduction could come from improved designs ofroadside ditches. While the AASHTO Roadside Design Guide includes preferred foreslopesand backslopes for basic ditch configurations, these configurations are primarily seen oninterstates and other higher-order roads and are often very different from the ditches ontwo-lane rural roads. Designs have not yet been developed to grade common two-laneshoulder-ditch combinations to reduce the chances of rollover and of vehicle encroachmentacross the ditch. Thus, based on today’s knowledge, the best “rollover-prevention” programwill be related to flattening and widening side slopes, particularly fill slopes.
In summary, based on research evidence to date, the set of strategies related to rollover (andROR crash) reduction through changes in the “vertical” component of the sideslope (i.e., thedegree and length or slope and related ditch design) would be considered “proven”9
strategies.
V-41
Fill Slopes Cut Slopes
Design Speed Design ADT
1:6 or Flatter 1:5 to 1:4 1:3 1:3 1:4 to 1:5
1:6 or Flatter
60 km/h or less
Under 750 750-1500 1500-6000 Over 6000
2.0-3.0 3.0-3.5 3.5-4.5 4.5-5.0
2.0-3.0 3.5-4.5 4.5-5.0 5.0-5.5
b b b b
2.0-3.0 3.0-3.5 3.5-4.5 4.5-5.0
2.0-3.0 3.0-3.5 3.5-4.5 4.5-5.0
2.0-3.0 3.0-3.5 3.5-4.5 4.5-5.0
70-80 km/h
Under 750 750-1500 1500-6000 Over 6000
3.0-3.5 4.5-5.0 5.0-5.5 6.0-6.5
3.5-4.5 5.0-6.0 6.0-8.0 7.5-8.5
b b b b
2.5-3.0 3.0-3.5 3.5-4.5 4.5-5.0
2.5-3.0 3.5-4.5 4.5-5.0 5.5-6.0
3.0-3.5 4.5-5.0 5.0-5.5 6.0-6.5
90km/h Under 750 750-1500 1500-6000 Over 6000
3.5-4.5 5.0-5.5 6.0-6.5 6.5-7.5
4.5-5.5 6.0-7.5 7.5-9.0
8.0-10.0 a
b b b b
2.5-3.0 3.0-3.5 4.5-5.0 5.0-5.5
3.0-3.5 4.5-5.0 5.0-5.5 6.0-6.5
3.0-3.5 5.0-5.5 6.0-6.5 6.5-7.5
100 km/h Under 750 750-1500 1500-6000 Over 6000
5.0-5.5 6.0-7.5 8.0-9.0
9.0-10.0 a
6.0-7.5 8.0-10.0 a
10.0-12.0 a 11.0-13.5 a
b b b b
3.0-3.5 3.5-4.5 4.5-5.5 6.0-6.5
3.5-4.5 5.0-5.5 5.5-6.5 7.5-8.0
4.5-5.0 6.0-6.5 7.5-8.0 8.0-8.5
110 km/h Under 750 750-1500 1500-6000 Over 6000
5.5-6.0 7.5-8.0
8.5-10.0 a 9.0-10.5 a
6.0-8.0 8.5-11.0 a
10.5-13.0 a 11.5-14.0 a
b b b b
3.0-3.5 3.5-5.0 5.0-6.0 6.5-7.5
4.5-5.0 5.5-6.0 6.5-7.5 8.0-9.0
4.5-4.9 6.0-6.5 8.0-8.5 8.5-9.0
a Where a site-specific investigation indicates a high probability of continuing accidents or such occurrences areindicated by accident history, the designer may provide clear zone distances greater than 30 feet as indicated. Clear zones may be limited to 30 feet for practicality and to provide a consistent roadway template if previous experience with similar projects or designs indicates satisfactory performance.
b Since recovery is less likely on the unshielded, traversable 1:3 slopes, fixed objects should not be present in the vicinity of the toe of these slopes. Recovery of high-speed vehicles that encroach beyond the edge of shoulder may be expected to occur beyond the toe of slope. Determination of the width of the recovery area at the toe of slope should take into consideration right-of-way availability, environmental concerns, economic factors, safety needs, and accident histories. Also, the distance between the edge of the travel lane and the beginning of the 1:3 slope should influence the recovery area provided at the toe of slope.
EXHIBIT V-22Clear Zone Distances (in Feet from Edge of Driving Lane) (Source: AASHTO Roadside Design Guide, 2002)
9 See explanation of ratings on page V-3.
Widening Clear Zones Reducing rollover crashes is primarily accomplished by improvements to sideslopes andditches. These are both components of the “clear zone”—the recovery area provided tovehicles that leave the roadway. In addition to modifying these “vertical” components of theclear zone, additional crash and fatality savings can be realized by modifying the width ofthe zone. The wider the object-free recovery area provided, the more likely an errant vehiclewill either safely return to the travel lanes or stop on the roadside without a reportable crash.The width of the zone is normally set by either natural objects (e.g., trees, rock outcrops,embankments), or by roadside hardware (e.g., guardrails).
The question then becomes how wide to make the zone. While conventional wisdom (andthe Roadside Design Guide) implies that a “safe clear zone width” on higher-speed roads isapproximately 30 feet, there is no single width that defines maximum safety. Indeed, theguidance on clear zone width provided in the Roadside Design Guide is based on factorsincluding design speed of the roadway, design ADT, the prevailing sideslope, andcurvature. In general, the wider the better, up to some limit beyond which no significantnumber of vehicles will encroach.
Crash research provides a variety of approaches to answering the question of how wide aclear zone should be. For example, using crash, inventory, and ADT data from two states tostudy median widths (which act as “clear zones” for these freeways and other divided roads),Knuiman et al. (1993) found that accident rates continued to decrease as median widthsincreased up to about 80 feet. The effect was seen for head-on/opposite direction sideswipecrashes, as expected. A similar effect was also found for single- and multiple-vehicle crashes.
A 1995 study for the Texas DOT used a benefit-cost approach to establish guidelines for clearzone on suburban high-speed roadways with curb and gutter (Fambro et al., 1995). Basedupon crash and roadside data and the ROADSIDE computer model, an appropriate andcost-beneficial clear zone width requirement was determined for such sections. “High-speed” was defined as a section with posted speed limits of 50 or 55 mph. The study focusedon situations in which growth in traffic volume and frequency of turning movementsnecessitate the widening of an existing two-lane highway to four or more lanes. For thisstudy, the baseline minimum clear zone width used in the calculation was approximately 10feet. That is, even with added lanes, the existing right-of-way would allow at least 3.0 meters(10 feet) of clear zone. Based upon an incremental benefit-cost analysis for variouscombinations of baseline clear zone width, ADT, roadside hazard rating, and unit right-of-way acquisition cost, the study found the following in general:
• It is not cost-beneficial to purchase 5 feet or less of additional right-of-way (given anexisting minimum clear zone of 10 feet), since the relatively high fixed cost for relocationof utility poles is still present even for the relatively modest safety benefits seen withthese small right-of-way acquisitions.
• For unit right-of-way acquisition costs greater than $4 per square foot, it is not cost-beneficial to provide additional clear zone width through the purchase of additionalright-of-way.
• For roadways with a low roadside hazard rating, it is not cost-beneficial to provideadditional clear zone width beyond the existing baseline clear zone width of 10 feet or more.
SECTION V—DESCRIPTION OF STRATEGIES
V-42
SECTION V—DESCRIPTION OF STRATEGIES
These findings are for suburban roads rather than rural roads, and the fatality costs used inthe calculations were $500,000. Higher fatality costs such as those used today would changethese break-even points.
In summary, the determination of an optimum clear zone width may best be answered insome type of economic analysis—comparing the cost of widening the zone with the savingsin crashes (along with other costs and benefits). Savings in crashes will be a function of thenumber of vehicles that leave the roadway (which is strongly related to ADT, alignment, andvehicle speeds); how far they encroach onto the roadside (a function of exit angle, speed, anddriver braking and steering); and the nature of the object that will be struck at the far edge ofthe clear zone. In short, this is a complex prediction problem.
An economic analysis program has been developed to aid the user in this effort: theROADSIDE computer program. Details of the program are found in the AASHTO RoadsideDesign Guide. A revised and improved version of this program (the Roadside Safety AnalysisProgram, or RSAP) is expected to be completed by the end of 2002 under NCHRP Project 22-9(Sicking et al., 2003). In addition, both these programs are based on limited data concerningthe critical factors of roadside encroachment rates and extents; AASHTO is currentlyupdating these data as part of the work in NCHRP Project 17-11, being conducted by theTexas Transportation Institute.
The wider the clear zone, the safer it will be. While additional guidance on widths andslopes and economic analysis techniques should be developed within the next 1 to 5 years,the best current guidance on widths and slopes is in the AASHTO Roadside Design Guide.Based on the current research concerning crash-related effectiveness, strategies aimed atwidening the clearzone are considered to have “proven” effectiveness.10
Improving Roadside Hardware and Natural ObjectsThe clear zone concept requires that no objects that can result in crashes be located in thezone. However, some objects must be located near the traveled way for a variety of reasons.These include hardware or objects related to traffic guidance or control (e.g., signs, somelighting supports); protection of more hazardous objects or situations (e.g., guardrails ormedian barriers); roadway design requirements (e.g., culverts); and traditional right-of-wayuses (e.g., utility poles, mail boxes). Regardless of the reason, the best treatment for allobjects is to remove them from the zone. If this cannot be done, alternative strategies includethe following:
• Relocating the objects either farther from the traffic flow or to less hazardous locations(e.g., relocating utility poles from the outside to the inside of horizontal curves).
• Shielding or replacing “harder” objects with less hazardous breakaway devices (e.g., useof breakaway luminaire supports, or use of crash cushions in front of hazardousimmovable objects).
The AASHTO Roadside Design Guide includes detailed discussion of this overall “forgivingroadside” strategy, along with design specifications, placement information and crash test
V-43
10 See explanation of ratings on page V-3.
results for a large number of roadside hardware devices. The guide also includes criteria foruse in determining which of the many alternative hardware types should be chosen for aspecific application.
A final strategy for improving roadside hardware involves replacing less forgiving, olderhardware with newer designs. The Roadside Design Guide is also a useful reference in thiscontext, since it provides effectiveness information on both older and newer hardwaredesigns. For example, there is a detailed discussion of the Breakaway Cable Terminal (BCT)guardrail end, including problems that have been experienced due to improper installation(e.g., a lack of critical “flare” from the roadway). The guide presents information on a seriesof possible replacement terminals, including the Modified Eccentric Loader Terminal(MELT) and others. The guide does not include information on older guardrail terminaldesigns such as blunt or turned-down ends. The clear implication is that these designs aremuch less safe than newer designs and should be replaced.
The Roadside Design Guide provides general direction for a number of different types ofhardware regarding when an older, outdated piece of hardware should be replaced: “Thisdevice should no longer be used on new installations for higher volumes and speeds, andshould be upgraded as required by the state’s policies and practices during rehabilitationprojects or as needed during maintenance operations.” More detailed guidance is given forroadside barriers. The primary criterion is whether the older barrier meets current structuralguidelines (based primarily on crash test results) or whether it meets current design andlocation guidelines (e.g., too short to protect the hazard or too close to the hazard, basedupon barrier deflection characteristics).
In a limited number of cases, the FHWA required that states upgrade older hardware. Themost recent example involves the BCT and MELT guardrail terminals. The FHWA andAASHTO agreed to use only terminals that pass new crash test standards in newconstruction and rehabilitation projects as of October 1, 1998. Since neither the BCT norMELT passed the new standards, neither can be used in new construction or reconstructionprojects. Unfortunately, as will be seen in the later Effectiveness section, most of theupgrading guidance cannot be based on accident studies, since almost none exist. Instead, itis based solely on crash test results. For more information on barriers and other safetydevices that have been approved by the FHWA for use on National Highway System roads,see http://safety.fhwa.dot.gov/fourthlevel/pro res road nchrp350.htm.
In summary, based upon current crash-related research, the relocation of “hard” objectsfarther from the roadway or their replacement with more forgiving designs (e.g., breakawaydesigns) are considered “proven”11 strategies to reduce roadside harm. As will be seenbelow, the replacement of older “approved” barrier terminal designs with newer designswould be considered a “tried” strategy at this time, since sufficient real-world crash datahave not been accumulated to move it into the “proven” category.
Delineation of Roadside Objects (Experimental Treatment)The above described strategies for reducing roadside crash risk and severity have beenevaluated to some extend either through crash testing or crash-based evaluations. At least
SECTION V—DESCRIPTION OF STRATEGIES
V-44
11 See explanation of ratings on page V-3.
SECTION V—DESCRIPTION OF STRATEGIES
two states are currently pilot testing a low-cost experimental 12 strategy where roadside objectsare delineated so that they are more visible to drivers at night. Pennsylvania is testing thisstrategy at sites with high ROR utility-pole and tree-related crash frequencies (particularly atnight) where it was not feasible to remove or relocate the object either due to budgetconstraints or due to the object being on private property. The tree or utility pole is markedwith a 4-inch round of reflective tape. (One round is used on each tree and each utility pole,except for poles at intersections where two rounds are used.) The treatment is being tested in11 districts in over 50 counties. (See Appendix 1 for contact information.)
In the Iowa DOT pilot test, crash-prone utility poles that cannot be relocated or removedare being marked with a single band of 6-inch white reflective tape. Iowa identifiedcorridors with high numbers of utility pole impacts from a statewide analysis and foundthat two 5- to 10-block corridors were in one city. One of the corridors was a four-lanestreet with higher speeds. The other included a 90-degree “bend” in the middle of thesection. The Iowa DOT worked with the city (which owned the utility) in this effort. (SeeAppendix 6 for contact information.) They are now beginning to expand the pilot test toDOT districts.
The hypothesis is that such treatments could (a) provide additional guidance cues to thedriver so that he or she is more likely to stay on the roadway (in the case of the regularlyspaced utility poles); (b) make the hazard more visible (which might provide further“incentive” for staying on the roadway); or (c) provide “safer escape route” information tothose vehicles that do leave the roadway (assuming the driver has time to react and tocontrol the vehicle after leaving the roadway).
Pennsylvania has found that the utility pole tape can become detached and slide down thepole within a year in some cases. Iowa used an additional special adhesive to increase thelife of the tape. Neither state has conducted what it considers to be a good evaluation of theutility pole tape, and so the utility pole tape’s effectiveness is unknown. Therefore, thetreatment must be considered experimental. It is unknown whether the additional visualinput to the driver provided by these markings is beneficial or confusing. This should not beused in place of other nonexperimental treatment and should be pilot tested and evaluatedbefore widespread use in any jurisdiction. (Note that these experimental strategies are notcovered in Exhibit V-23.)
Targeting Roadside ImprovementsGiven the large number of miles of roadside and the expense of several of the importantstrategies (e.g., sideslope flattening or clear zone widening), it is important to target thevarious roadside improvement strategies to sites where they will be most beneficial.Targeting can be done in a number of ways, including the following:
• Using existing ROR crash data.
• Using computer programs like ROADSIDE and RSAP, which predict roadside crashesbased upon roadway, roadside, and traffic descriptors.
V-45
12 See explanation of ratings on page V-3.
• Correcting a “corridor” based upon the fact that the hardware or clear zones do not meetcurrent agency standards. For example, Washington State uses this third approach, alongwith more traditional “high-hazard location” treatments.
Initial location of potential treatment sites might be accomplished using programs thatstates currently use to identify hazardous sections of roads. These programs could bemodified to focus on ROR crashes. These initial candidates might be further examined bycomparing ROR rates at these sites with overall ROR rates on similar highway classes (e.g.,two-lane rural roads). Care must be taken to avoid selection bias resulting from regressionto the mean.
Since the ROR crashes being targeted here are those occurring on “problem” roadsides,further office-based examination of potential sites might then be accomplished by review ofagency photologs or videologs for these sites. Lastly, since the final decision concerningtreatment alternatives and final implementation should be based upon cost-effectiveness, theROADSIDE or RSAP program could be used to examine the benefits and costs ofalternatives. A study of sideslope flattening in Washington State (Allaire et al., 1996)concluded that the use of benefit-cost analyses of roadside safety improvements should beincluded in all types of highway construction projects to better identify how best to useroadside safety funds.
Other innovative targeting schemes could be used if an agency has some form of roadsideinventory or roadside hardware inventory. In this case, the inventory data could be eitherused alone or combined with the crash data to target treatment locations. For example, if aninventory of guardrail terminals exists or can be collected from “windshield surveys” orphoto/videologs, an agency could target terminal upgrading efforts to designs known tohave problems if installed improperly (e.g., the BCT device). Colorado has an inventory ofcertain classes of hardware and has attempted to develop such procedures.
Compatibility with Other StrategiesAll roadside improvement strategies would appear to be compatible with other RORstrategies aimed at keeping the vehicle on the roadway. The roadside improvementstrategies are aimed at vehicles that leave the roadway even in the presence of othertreatments. In addition, since these strategies affect areas outside the shoulders, they arecompatible with bicycle and other uses. Widening existing clear zones, through the removalof trees, is perhaps both the most effective and the most problematic (it is problematic whenthere is opposition to removal of trees alongside roadways). The reader is referred toVolume 3 of this report for a full discussion on this potential conflict.
SECTION V—DESCRIPTION OF STRATEGIES
V-46
EXHIBIT V-23Strategy Attributes for Roadside Improvements
Technical Attributes
Target
Expected Effectiveness
The targets for roadside improvement treatments are vehicles that leave the roadway,including those that return to the roadway out of control due to poor roadside design.However, the primary focus would be vehicles that strike objects on the roadside oroverturn.
Three strategy areas have been covered for roadside improvements—rolloverreduction due to flattening sideslopes, single-vehicle crash reduction due to flattening
SECTION V—DESCRIPTION OF STRATEGIES
V-47
EXHIBIT V-23 (Continued)Strategy Attributes for Roadside Improvements
and widening sideslopes, and single-vehicle crash reduction and crash-severityreduction related to improvements in roadside hardware (e.g., replacing olderhardware designs with newer designs). Historically, most roadside design androadside hardware design improvements have been based on crash testing andrecently on computer simulation. Due to the difficulty in collecting the necessaryroadside inventory data to conduct a well-designed, accident-based study, few suchstudies exist. Thus, crash-based estimates of effectiveness are limited. Based uponthese limited studies, the first two sets of strategies relating to sideslope and clearzone improvements are considered “proven” strategies. The replacement of older(approved) hardware with newer designs would be considered “tried” but not “proven”at this point due to the lack of crash-related evaluations. The following narrativedescribes some of the more important studies.
Zegeer, et al. (1987) examined the effects of sideslope on both rollover crashes andtotal single-vehicle crashes. They used field-measured crash, sideslope, crosssection, and traffic data from approximately 1,800 miles on rural two-lane roads inthree states. The rollover data were limited, making analysis of individual slopecategories difficult. However, the authors found that rollover rates were significantlyhigher on slopes of 1�4 or steeper as compared with slopes of 1�5 or flatter. That is,in terms of rollover crashes, the 1�4 slopes were similar to the steeper 1�3 and 1�2slopes. While the Roadway Design Guide would indicate the need for guardrailprotection for 1�2 slopes, it would not for 1�3 slopes. The latter are generallyconsidered to be “traversable – nonrecoverable,” indicating that the vehicle would beexpected to either stop on such a slope or continue to the bottom of the slope withoutoverturning.
Based upon the same study (and a much larger sample size), it is concluded thatsingle-vehicle ROR crashes (which include, but are not limited to, rollovers) can besignificantly reduced by flattening existing sideslopes to 1�4 or flatter. As shown inExhibit V-24, the estimated reduction in single-vehicle ROR crashes on two-lane ruralroads ranges up to approximately 27 percent (i.e., for flattening a 1�2 slope to 1�7 orflatter). Because ROR crashes are a major component of total crashes on two-lanerural roads, and because flatter and safer sideslopes can decrease some head-on andsideswipe crashes due to safer recoveries, the corresponding decrease in totalcrashes for this example is an estimated 15 percent. These estimates are made underthe assumption that the clear zone width stays the same and that the resultingsideslope is relatively free of rigid objects.
The Washington State DOT funded a study by Allaire et al. (1996) to determinewhether past sideslope flattening projects had reduced ROR collision frequencies andseverities. Unlike other studies, the authors were able to conduct a before/after studyof the effects of slope flattening based upon a detailed review of 60 3R projectsimplemented in 1986–1991. Each of these 60 projects called for sideslope flattening inat least some portion of the project. The authors were not able to develop benefitestimates for specific degrees of flattening (e.g., flattening a 1�3 slope to 1�6) due toinsufficient data on the precise “before” conditions. However, they were able toexamine the before-to-after reductions in crashes by severity level for the treatedsections and to compare these changes with a series of “control” changes. Thesecomparisons included comparisons of actual ROR collision rate per mile (by severitylevel) in the after period with predicted after rates corrected for “other improvements”such as object removal and clear zone widening; predicted after rates based on theexperience of the entire 3R project length, much of which did not include slopeflattening; and predicted after rates based on changes in the statewide rate for similar
(continued on next page)
SECTION V—DESCRIPTION OF STRATEGIES
V-48
EXHIBIT V-23 (Continued)Strategy Attributes for Roadside Improvements
Keys to Success
Potential Difficulties
roads during the same time period. In almost all cases, a statistically significant benefitof slope flattening was found. The percent reduction in ROR collision rates varied bycomparison and by injury severity class from approximately 3 to 50 percent. Basedupon examination of the tables, the estimated “median” reduction in ROR crash rate isapproximately 25 to 45 percent.
Zegeer et al. (1987) also estimated the effects of clear zone widening on two-lane ruralroads. If the existing recovery area measured from the edgeline is less than 10 to 15 feet,Exhibit V-25 presents the expected percentage reduction in “related crashes” (i.e., ROR,head-on, and sideswipe) due to clear zone widening by a given amount. For example,widening by 10 feet is predicted to result in a 25-percent reduction in these crashes.
With respect to removing roadside hardware from the clear zone or relocating it fartherfrom the travel way, a study by Zegeer et al. (1990) developed the effectivenessestimates shown in Exhibit V-26 for two-lane rural roads. As can be seen, forexample, moving culvert headwalls from 5 to 15 feet from the roadway would result inan expected 40-percent reduction in culvert headwall collisions on two-lane ruralroads. Placing guardrails an additional 5 feet from the roadway would be expected toreduce the corresponding guardrail accidents by 53 percent. These estimates arebased upon the assumptions that removal of a specific object leaves a wider clearzone and that other potentially hazardous objects do not remain at the same distancefrom the roadway. For example, if the culverts are at the edge of a row of large trees,then it is likely that culvert crashes will only be replaced by additional tree crashes.
The third strategy noted above involves the upgrading of existing roadside hardware.In a recent study, Ray (2000) examined the possible effects of upgrading guardrailterminals (e.g., BCT and MELT designs) to a newer design (the ET-2000) that doespass upgraded crash test standards. The author examined both past accident-basedstudies of the older designs in five states and recent data on the older and newerdesigns in three states. He used data from both police-reported and nonreported(maintenance) cases where available. He concluded that while the samples weresmall and the results varied greatly across the studies, he could detect no statisticallysignificant difference in injury severity among the three designs for properly installedterminals. The author stressed the need for proper installation, since there is evidencethat the BCT device was not installed properly (i.e., improper flare and offset from thetravel lane) in a significant number of cases. And some data in earlier studies indicatethat these improper installations are more hazardous (Morena and Schroeder, 1994;Agent and Pigman, 1991). Thus, one might expect an improvement from upgradingimproperly installed BCT devices, for example.
Keys to success would include accurate targeting; appropriate levels of funding (sincemost of these strategies can be relatively high cost); and a cooperative programamong all agency divisions that can affect the roadside crash problem when a high-crash site is identified (e.g., traffic or safety engineering); during construction orreconstruction (e.g., roadway design division); or during normal maintenanceoperations (e.g., roadway maintenance forces). Appropriate targeting and analysis willrequire the development and regular use of methods for identifying sites with RORcrash problems related to the roadside.
As noted above, simple clearing and grading to create small additions to the clearzone (e.g., 5 to 10 feet) on steeper sideslopes (e.g., 1�3 or 1�4) under high-speedconditions may not prove to be effective, since the vehicles entering the roadside maycontinue, due to the effect of the slope, to either overturn or traverse the clear zoneand strike objects at its far edge. The other potential pitfall could be public reaction totree cutting without appropriate public education, as well as coordination withenvironmental and other public groups.
SECTION V—DESCRIPTION OF STRATEGIES
V-49
EXHIBIT V-23 (Continued)Strategy Attributes for Roadside Improvements
Appropriate Measures and Data
Associated Needs
Organizational and Institutional Attributes
Organizational, Institutional, and Policy Issues
Issues Affecting Implementation Time
Costs Involved
Training and Other Personnel Needs
Legislative Needs
Other Key Attributes
None identified.
The most appropriate measures will depend upon the strategy implemented, butwould include process measures such as miles of roadside treated, number and typeof hazardous objects removed or relocated, and number and type of older devicesupgraded.
Impact measures must include both crash frequency or rate and crash severity, sincesome strategies will be successful even if only severity is affected.
Since targeting and site analysis appear to be keys to success, data needs wouldinclude accident, roadway and roadside inventory, and traffic data of sufficientaccuracy and detail. The data most often missing are for the roadside inventory.
As noted above, since tree clearing is a major component of some of these strategies,and since the public can view such tree removal negatively, there is a need for publicinformation before tree-related strategies are employed. See Volume 3 of this reportfor more information.
While the primary agency would be the highway agency responsible for the right-of-way, certain strategies would clearly require participation of other agencies and publicand private groups (e.g., strategies involving tree removal or utility pole relocation orremoval). (See note on the need for a cooperative, multiagency program under “Keysto Success” above.) Since cooperation among various governmental and privategroups is necessary if tree clearing is anticipated, see the more detailed discussion inVolume 3 of this report.
An organizational safety philosophy is needed that includes willingness to implementmore than just low-cost improvements to optimize results. Many of these strategiesare higher-cost strategies, but offer higher potential payoff.
The timeframe required will depend on the strategy chosen. It could be relatively shortfor treatments such as replacing older hardware at a specific location, but much longerif applied to an entire corridor or route system or if the treatment involved new right-of-way acquisition.
Costs of these strategies can vary widely depending on the strategy chosen. Factorsinclude whether new right-of-way is required or whether the treatment can beimplemented as part of other rehabilitation or original construction efforts.
Since most of these strategies are being implemented by many state highwayagencies as part of construction or rehabilitation, there would appear to be no specialpersonnel or training needs for implementing these strategies.
None identified.
SECTION V—DESCRIPTION OF STRATEGIES
V-50
Amount of Increased Roadside Recovery Distance,
meters (feet)
Percent Reduction in Related Accident Types (i.e.,
ROR+head-on+sideswipe)
1.5 (5) 13%
2.4 (8) 21
3.1 (10) 25
3.7 (12) 29
4.6 (15) 35
6.2 (20) 44
*Note that “related accidents” would be the total of ROR, head-on, and sideswipe crashes.
EXHIBIT V-25Percent Reductions in “Related Accidents” Due to Increasing the Roadside Clear Recovery Distance on Two-Lane Rural Roads*
Sideslope Before
Condition Sideslope After Condition
1:4 1:5 1:6 1:7 or Flatter
SV Total SV Total SV Total SV Total
1:2 10 6 15 9 21 12 27 15
1:3 8 5 14 8 19 11 26 15
1:4 0 - 6 3 12 7 19 11
1:5 - - 0 - 6 3 14 8
1:6 - - - - 0 - 8 5
EXHIBIT V-24Percentage Reduction of Single-Vehicle and Total Crashes Due to SideslopeFlattening on Two-Lane Rural Roads (From Zegeer et al., 1987)
SECTION V—DESCRIPTION OF STRATEGIES
Information on Agencies or Organizations Currently Implementing this StrategyMany state and local agencies implement clear zone policies for roadway construction. Someare implementing programs aimed at improving the clear zone, including programs focusedupon flattening roadside slopes. Examples include the Washington State DOT 3R program,Washington’s utility pole relocation program (which will be covered in an upcomingvolume of this report), and Pennsylvania’s tree removal program (see Volume 3 of thisreport). As required by FHWA, all states are using newer guardrail end terminal designs innew construction and reconstruction, and other hardware is often upgraded in majorreconstruction projects. No states have been identified that are currently replacing olderhardware on a systemwide basis. Finally, the Pennsylvania DOT is exploring the use ofsingle-faced concrete barriers (instead of guardrail) in urban/suburban locations where theright-of-way is restricted and there is no option to relocate utility poles or to improvesideslopes.
V-51
Increase in Obstacle Distance in meters (feet)
Mailboxes, Culverts, and Signs (%)
Guardrails (%)
Fences/Gates (%)
0.9 (3) 14 36 20
1.5 (5) 23 53 30
2.4 (8) 34 70 44
3.1 (10) 40 78 52
4.0 (13) N.F. N.F. N.F.
4.6 (15) N.F. N.F. N.F.
Notes:N.F. = generally not feasible to relocate obstacles to specified distance.The table is only appropriate for obstacle distance of 30 feet or less and only on two-lane roadways.
EXHIBIT V-26Percent Reductions in Specific Types of Obstacle Accidents Due to Clearing/Relocating Obstacles Farther from the Roadway (Zegeer et al., 1990)
VI-1
SECTION VI
Guidance for Implementation of the AASHTOStrategic Highway Safety Plan
Outline for a Model Implementation ProcessExhibit VI-1 gives an overview of an 11-step model process for implementing a program ofstrategies for any given emphasis area of the AASHTO Strategic Highway Safety Plan. Aftera short introduction, each of the steps is outlined in further detail.
EXHIBIT VI-1
AAS HT O Strategic High wa y Sa fety PlanMo de l Implem entation Process
SECTION VI—GUIDANCE FOR IMPLEMENTATION OF THE AASHTO STRATEGIC HIGHWAY SAFETY PLAN
VI-2
Purpose of the Model ProcessThe process described in this section is provided as a model rather than a standard. Manyusers of this guide will already be working within a process established by their agency orworking group. It is not suggested that their process be modified to conform to this one.However, the model process may provide a useful checklist. For those not having a standardprocess to follow, it is recommended that the model process be used to help establish anappropriate one for their initiative. Not all steps in the model process need to be performed atthe level of detail indicated in the outlines below. The degree of detail and the amount of workrequired to complete some of these steps will vary widely, depending upon the situation.
It is important to understand that the process being presented here is assumed to be conductedonly as a part of a broader, strategic-level safety management process. The details of thatprocess, and its relation to this one, may be found in a companion guide. (The companionguide is a work in progress at this writing. When it is available, it will be posted online athttp://transportation1.org/safetyplan.)
Overview of the Model ProcessThe process (see Exhibit VI-1, above) must be started at top levels in the lead agency’sorganization. This would, for example, include the CEO, DOT secretary, or chief engineer, as appropriate. Here, decisions will have been made to focus the agency’s attention andresources on specific safety problems based upon the particular conditions and characteristicsof the organization’s roadway system. This is usually, but not always, documented as aresult of the strategic-level process mentioned above. It often is publicized in the form of a“highway safety plan.” Examples of what states produce include Wisconsin DOT’s StrategicHighway Safety Plan (see Appendix A) and Iowa’s Safety Plan (available at http://www.iowasms.org/toolbox.htm).
Once a “high-level” decision has been made to proceed with a particular emphasis area, thefirst step is to describe, in as much detail as possible, the problem that has been identified inthe high-level analysis. The additional detail helps confirm to management that the problemidentified in the strategic-level analysis is real and significant and that it is possible to dosomething about it. The added detail that this step provides to the understanding of theproblem will also play an important part in identifying alternative approaches for dealingwith it.
Step 1 should produce endorsement and commitments from management to proceed, atleast through a planning process. With such an endorsement, it is then necessary to identifythe stakeholders and define their role in the effort (Step 2). It is important at this step to identify a range of participants in the process who will be able to help formulate acomprehensive approach to the problem. The group will want to consider how it can drawupon potential actions directed at
• Driver behavior (legislation, enforcement, education, and licensing),• Engineering,
SECTION VI—GUIDANCE FOR IMPLEMENTATION OF THE AASHTO STRATEGIC HIGHWAY SAFETY PLAN
• Emergency medical systems, and• System management.
With the establishment of a working group, it is then possible to finalize an understandingof the nature and limitations of what needs to be done in the form of a set of programpolicies, guidelines, and specifications (Steps 3 and 4). An important aspect of this isestablishing targets for crash reduction in the particular emphasis area (Step 3). Identifyingstakeholders, defining their roles, and forming guidelines and policies are all elements ofwhat is often referred to as “chartering the team.” In many cases, and in particular whereonly one or two agencies are to be involved and the issues are not complex, it may bepossible to complete Steps 1 through 4 concurrently.
Having received management endorsement and chartered a project team—the foundationfor the work—it is now possible to proceed with project planning. The first step in this phase(Step 5 in the overall process) is to identify alternative strategies for addressing the safetyproblems that have been identified while remaining faithful to the conditions established inSteps 2 through 4.
With the alternative strategies sufficiently defined, they must be evaluated against oneanother (Step 6) and as groups of compatible strategies (i.e., a total program). The results of the evaluation will form the recommended plan. The plan is normally submitted to theappropriate levels of management for review and input, resulting ultimately in a decision onwhether and how to proceed (Step 7). Once the working group has been given approval toproceed, along with any further guidelines that may have come from management, thegroup can develop a detailed plan of action (Step 8). This is sometimes referred to as an“implementation” or “business” plan.
Plan implementation is covered in Steps 9 and 10. There often are underlying activitiesthat must take place prior to implementing the action plan to form a foundation for whatneeds to be done (Step 9). This usually involves creating the organizational, operational,and physical infrastructure needed to succeed. The major step (Step 10) in this processinvolves doing what was planned. This step will in most cases require the greatestresource commitment of the agency. An important aspect of implementation involvesmaintaining appropriate records of costs and effectiveness to allow the plan to beevaluated after-the-fact.
Evaluating the program, after it is underway, is an important activity that is oftenoverlooked. Management has the right to require information about costs, resources, andeffectiveness. It is also likely that management will request that the development teamprovide recommendations about whether the program should be continued and, if so, whatrevisions should be made. Note that management will be deciding on the future for anysingle emphasis area in the context of the entire range of possible uses of the agency’sresources. Step 11 involves activities that will give the desired information to managementfor each emphasis area.
To summarize, the implementation of a program of strategies for an emphasis area can becharacterized as an 11-step process. The steps in the process correspond closely to a 4-phaseapproach commonly followed by many transportation agencies:
VI-3
• Endorsement and chartering of the team and project (Steps 1 through 4),• Project planning (Steps 5 through 8),• Plan implementation (Steps 9 and 10), and• Plan evaluation (Step 11).
Details about each step follow. The Web-based version of this description is accompanied bya set of supplementary material to enhance and illustrate the points.
The model process is intended to provide a framework for those who need it. It is notintended to be a how-to manual. There are other documents that provide extensive detail regarding how to conduct this type of process. Some general ones are covered inAppendix B and Appendix C. Others, which relate to specific aspects of the process, arereferenced within the specific sections to which they apply.
SECTION VI—GUIDANCE FOR IMPLEMENTATION OF THE AASHTO STRATEGIC HIGHWAY SAFETY PLAN
VI-4
SECTION VI—GUIDANCE FOR IMPLEMENTATION OF THE AASHTO STRATEGIC HIGHWAY SAFETY PLAN
Implementation Step 1: Identify and Define the Problem
General DescriptionProgram development begins with gathering data and creating and analyzing information.The implementation process being described in this guide is one that will be done in thecontext of a larger strategic process. It is expected that this guide will be used when thestrategic process, or a project-level analysis, has identified a potentially significant problemin this emphasis area.
Data analyses done at the strategic level normally are done with a limited amount of detail.They are usually the top layer in a “drill-down” process. Therefore, while those previousanalyses should be reviewed and used as appropriate, it will often be the case that furtherstudies are needed to completely define the issues.
It is also often the case that a core technical working group will have been formed by the lead agency to direct and carry out the process. This group can conduct the analysesrequired in this step, but should seek, as soon as possible, to involve any other stakeholderswho may desire to provide input to this process. Step 2 deals further with the organizationof the working group.
The objectives of this first step are as follows:
1. Confirm that a problem exists in this emphasis area.
2. Detail the characteristics of the problem to allow identification of likely approachesfor eliminating or reducing it.
3. Confirm with management, given the new information, that the planning andimplementation process should proceed.
The objectives will entail locating the best available data and analyzing them to highlighteither geographic concentrations of the problem or over-representation of the problemwithin the population being studied.
Identification of existing problems is a responsive approach. This can be complemented by aproactive approach that seeks to identify potentially hazardous conditions or populations.
For the responsive type of analyses, one generally begins with basic crash records that aremaintained by agencies within the jurisdiction. This is usually combined, where feasible,with other safety data maintained by one or more agencies. The other data could include
• Roadway inventory,
• Driver records (enforcement, licensing, courts), or
• Emergency medical service and trauma center data.
To have the desired level of impact on highway safety, it is important to consider thehighway system as a whole. Where multiple jurisdictions are responsible for various partsof the system, they should all be included in the analysis, wherever possible. The bestexample of this is a state plan for highway safety that includes consideration of the extensive
VI-5
mileage administered by local agencies. To accomplish problem identification in this mannerwill require a cooperative, coordinated process. For further discussion on the problemidentification process, see Appendix D and the further references contained therein.
In some cases, very limited data are available for a portion of the roads in the jurisdiction.This can occur for a local road maintained by a state or with a local agency that has verylimited resources for maintaining major databases. Lack of data is a serious limitation to thisprocess, but must be dealt with. It may be that for a specific study, special data collectionefforts can be included as part of the project funding. While crash records may be maintainedfor most of the roads in the system, the level of detail, such as good location information,may be quite limited. It is useful to draw upon local knowledge to supplement data,including
• Local law enforcement,
• State district and maintenance engineers,
• Local engineering staff, and
• Local residents and road users.
These sources of information may provide useful insights for identifying hazardouslocations. In addition, local transportation agencies may be able to provide supplementarydata from their archives. Finally, some of the proactive approaches mentioned below may beused where good records are not available.
Maximum effectiveness often calls for going beyond data in the files to include specialsupplemental data collected on crashes, behavioral data, site inventories, and citizen input.Analyses should reflect the use of statistical methods that are currently recognized as validwithin the profession.
Proactive elements could include
• Changes to policies, design guides, design criteria, and specifications based uponresearch and experience;
• Retrofitting existing sites or highway elements to conform to updated criteria (perhapswith an appropriate priority scheme);
• Taking advantage of lessons learned from previous projects;
• Road safety audits, including on-site visits;
• Safety management based on roadway inventories;
• Input from police officers and road users; and
• Input from experts through such programs as the NHTSA traffic records assessmentteam.
The result of this step is normally a report that includes tables and graphs that clearlydemonstrate the types of problems and detail some of their key characteristics. Such reports
SECTION VI—GUIDANCE FOR IMPLEMENTATION OF THE AASHTO STRATEGIC HIGHWAY SAFETY PLAN
VI-6
SECTION VI—GUIDANCE FOR IMPLEMENTATION OF THE AASHTO STRATEGIC HIGHWAY SAFETY PLAN
VI-7
should be presented in a manner to allow top management to quickly grasp the key findingsand help them decide which of the emphasis areas should be pursued further, and at whatlevel of funding. However, the report must also document the detailed work that has beendone, so that those who do the later stages of work will have the necessary background.
Specific Elements1. Define the scope of the analysis
1.1. All crashes in the entire jurisdiction1.2. A subset of crash types (whose characteristics suggest they are treatable, using
strategies from the emphasis area)1.3. A portion of the jurisdiction1.4. A portion of the population (whose attributes suggest they are treatable using
strategies from the emphasis area)2. Define safety measures to be used for responsive analyses
2.1. Crash measures2.1.1. Frequency (all crashes or by crash type)2.1.2. Measures of exposure2.1.3. Decide on role of frequency versus rates
2.3. Other measures2.3.1. Citizen complaints2.3.2. Marks or damage on roadway and appurtenances, as well as crash
debris3. Define measures for proactive analyses
3.1. Comparison with updated and changed policies, design guides, designcriteria, and specifications
3.2. Conditions related to lessons learned from previous projects3.3. Hazard indices or risk analyses calculated using data from roadway
inventories to input to risk-based models 3.4. Input from police officers and road users
4. Collect data4.1. Data on record (e.g., crash records, roadway inventory, medical data, driver-
licensing data, citations, other)4.2. Field data (e.g., supplementary crash and inventory data, behavioral
observations, operational data)4.3. Use of road safety audits, or adaptations
5. Analyze data5.1. Data plots (charts, tables, and maps) to identify possible patterns, and
concentrations (See Appendixes Y, Z and AA for examples of what somestates are doing)
5.2. Statistical analysis (high-hazard locations, over-representation of contributingcircumstances, crash types, conditions, and populations)
5.3. Use expertise, through road safety audits or program assessment teams5.4. Focus upon key attributes for which action is feasible:
5.4.1. Factors potentially contributing to the problems5.4.2. Specific populations contributing to, and affected by, the problems5.4.3. Those parts of the system contributing to a large portion of the
problem6. Report results and receive approval to pursue solutions to identified problems (approvals
being sought here are primarily a confirmation of the need to proceed and likely levels of resourcesrequired)
6.1. Sort problems by type6.1.1. Portion of the total problem6.1.2. Vehicle, highway/environment, enforcement, education, other
driver actions, emergency medical system, legislation, and systemmanagement
6.1.3. According to applicable funding programs6.1.4. According to political jurisdictions
6.2. Preliminary listing of the types of strategies that might be applicable6.3. Order-of-magnitude estimates of time and cost to prepare implementation
plan6.4. Listing of agencies that should be involved, and their potential roles
(including an outline of the organizational framework intended for theworking group). Go to Step 2 for more on this.
SECTION VI—GUIDANCE FOR IMPLEMENTATION OF THE AASHTO STRATEGIC HIGHWAY SAFETY PLAN
VI-8
SECTION VI—GUIDANCE FOR IMPLEMENTATION OF THE AASHTO STRATEGIC HIGHWAY SAFETY PLAN
VI-9
Implementation Step 2: Recruit Appropriate Participants forthe Program
General DescriptionA critical early step in the implementation process is to engage all the stakeholders that maybe encompassed within the scope of the planned program. The stakeholders may be fromoutside agencies (e.g., state patrol, county governments, or citizen groups). One criterion forparticipation is if the agency or individual will help ensure a comprehensive view of theproblem and potential strategies for its resolution. If there is an existing structure (e.g., a StateSafety Management System Committee) of stakeholders for conducting strategic planning, itis important to relate to this, and build on it, for addressing the detailed considerations ofthe particular emphasis area.
There may be some situations within the emphasis area for which no other stakeholders maybe involved other than the lead agency and the road users. However, in most cases, carefulconsideration of the issues will reveal a number of potential stakeholders to possibly beinvolved. Furthermore, it is usually the case that a potential program will proceed better inthe organizational and institutional setting if a high-level “champion” is found in the leadagency to support the effort and act as a key liaison with other stakeholders.
Stakeholders should already have been identified in the previous step, at least at a level to allow decision makers to know whose cooperation is needed, and what their potentiallevel of involvement might be. During this step, the lead agency should contact the keyindividuals in each of the external agencies to elicit their participation and cooperation. Thiswill require identifying the right office or organizational unit, and the appropriate people ineach case. It will include providing them with a brief overview document and outlining for them the type of involvement envisioned. This may typically involve developinginteragency agreements. The participation and cooperation of each agency should besecured to ensure program success.
Lists of appropriate candidates for the stakeholder groups are recorded in Appendix K. Inaddition, reference may be made to the NHTSA document at http://www.nhtsa.dot.gov/safecommunities/SAFE%20COMM%20Html/index.html, which provides guidance onbuilding coalitions.
Specific Elements1. Identify internal “champions” for the program2. Identify the suitable contact in each of the agencies or private organizations who is
appropriate to participate in the program3. Develop a brief document that helps sell the program and the contact’s role in it by
3.1. Defining the problem3.2. Outlining possible solutions3.3. Aligning the agency or group mission by resolving the problem3.4. Emphasizing the importance the agency has to the success of the effort
SECTION VI—GUIDANCE FOR IMPLEMENTATION OF THE AASHTO STRATEGIC HIGHWAY SAFETY PLAN
VI-10
3.5. Outlining the organizational framework for the working group and otherstakeholders cooperating on this effort
3.6. Outlining the rest of the process in which agency staff or group members arebeing asked to participate
3.7. Outlining the nature of commitments desired from the agency or group forthe program
3.8. Establishing program management responsibilities, including communicationprotocols, agency roles, and responsibilities
3.9. Listing the purpose for an initial meeting4. Meet with the appropriate representative
4.1. Identify the key individual(s) in the agency or group whose approval isneeded to get the desired cooperation
4.2. Clarify any questions or concepts4.3. Outline the next steps to get the agency or group onboard and participating
5. Establish an organizational framework for the group5.1. Roles5.2. Responsibilities
SECTION VI—GUIDANCE FOR IMPLEMENTATION OF THE AASHTO STRATEGIC HIGHWAY SAFETY PLAN
General DescriptionThe AASHTO Strategic Highway Safety Plan established a national goal of saving 5,000 to7,000 lives annually by the year 2003 to 2005. Some states have established statewide goalsfor the reduction of fatalities or crashes of a certain degree of severity. Establishing anexplicit goal for crash reduction can place an agency “on the spot,” but it usually providesan impetus to action and builds a support for funding programs for its achievement.Therefore, it is desirable to establish, within each emphasis area, one or more crash reductiontargets.
These may be dictated by strategic-level planning for the agency, or it may be left to thestakeholders to determine. (The summary of the Wisconsin DOT Highway Safety Plan inAppendix A has more information.) For example, Pennsylvania adopted a goal of 10 percentreduction in fatalities by 2002,1 while California established a goal of 40 percent reduction in fatalities and 15 percent reduction in injury crashes, as well as a 10 percent reduction inwork zone crashes, in 1 year.2 At the municipal level, Toledo, Ohio, is cited by the U.S.Conference of Mayors as having an exemplary program. This included establishing specificcrash reduction goals (http://www.usmayors.org/uscm/uscm projects_services/health/traffic/best_traffic initiative_toledo.htm). When working within an emphasis area, it may bedesirable to specify certain types of crashes, as well as the severity level, being targeted.
There are a few key considerations for establishing a quantitative goal. The stakeholdersshould achieve consensus on this issue. The goal should be challenging, but achievable. Itsfeasibility depends in part on available funding, the timeframe in which the goal is to beachieved, the degree of complexity of the program, and the degree of controversy the programmay experience. To a certain extent, the quantification of the goal will be an iterative process.If the effort is directed at a particular location, then this becomes a relatively straightforwardaction.
Specific Elements1. Identify the type of crashes to be targeted
1.1. Subset of all crash types1.2. Level of severity
2. Identify existing statewide or other potentially related crash reduction goals3. Conduct a process with stakeholders to arrive at a consensus on a crash reduction goal
3.1. Identify key considerations3.2. Identify past goals used in the jurisdiction3.3. Identify what other jurisdictions are using as crash reduction goals3.4. Use consensus-seeking methods, as needed
VI-11
1 Draft State Highway Safety Plan, State of Pennsylvania, July 22, 19992 Operations Program Business Plan, FY 1999/2000, State of California, Caltrans, July 1999
Implementation Step 4: Develop Program Policies,Guidelines, and Specifications
General DescriptionA foundation and framework are needed for solving the identified safety problems. Theimplementation process will need to be guided and evaluated according to a set of goals,objectives, and related performance measures. These will formalize what the intended resultis and how success will be measured. The overlying crash reduction goal, established in Step 3, will provide the context for the more specific goals established in this step. The goals, objectives, and performance measures will be used much later to evaluate what isimplemented. Therefore, they should be jointly outlined at this point and agreed to by all program stakeholders. It is important to recognize that evaluating any actions is animportant part of the process. Even though evaluation is not finished until some time afterthe strategies have been implemented, it begins at this step.
The elements of this step may be simpler for a specific project or location than for acomprehensive program. However, even in the simpler case, policies, guidelines, andspecifications are usually needed. Furthermore, some programs or projects may require thatsome guidelines or specifications be in the form of limits on directions taken and types ofstrategies considered acceptable.
Specific Elements1. Identify high-level policy actions required and implement them (legislative and
administrative)2. Develop goals, objectives, and performance measures to guide the program and use for
assessing its effect2.1. Hold joint meetings of stakeholders2.2. Use consensus-seeking methods2.3. Carefully define terms and measures2.4. Develop report documenting results and validate them
3. Identify specifications or constraints to be used throughout the project3.1. Budget constraints3.2. Time constraints3.3. Personnel training3.4. Capacity to install or construct3.5. Types of strategies not to be considered or that must be included3.6. Other
SECTION VI—GUIDANCE FOR IMPLEMENTATION OF THE AASHTO STRATEGIC HIGHWAY SAFETY PLAN
VI-12
SECTION VI—GUIDANCE FOR IMPLEMENTATION OF THE AASHTO STRATEGIC HIGHWAY SAFETY PLAN
Implementation Step 5: Develop Alternative Approaches toAddressing the Problem
General DescriptionHaving defined the problem and established a foundation, the next step is to find ways toaddress the identified problems. If the problem identification stage has been done effectively(see Appendix D for further details on identifying road safety problems), the characteristicsof the problems should suggest one or more alternative ways for dealing with the problem.It is important that a full range of options be considered, drawing from areas dealing withenforcement, engineering, education, emergency medical services, and system managementactions.
Alternative strategies should be sought for both location-specific and systemic problems thathave been identified. Location-specific strategies should pertain equally well to addressinghigh-hazard locations and to solving safety problems identified within projects that arebeing studied for reasons other than safety.
Where site-specific strategies are being considered, visits to selected sites may be in order ifdetailed data and pictures are not available. In some cases, the emphasis area guides willprovide tables that help connect the attributes of the problem with one or more appropriatestrategies to use as countermeasures.
Strategies should also be considered for application on a systemic basis. Examples include
1. Low-cost improvements targeted at problems that have been identified as significant inthe overall highway safety picture, but not concentrated in a given location.
2. Action focused upon a specific driver population, but carried out throughout thejurisdiction.
3. Response to a change in policy, including modified design standards.
4. Response to a change in law, such as adoption of a new definition for DUI.
In some cases, a strategy may be considered that is relatively untried or is an innovativevariation from past approaches to treatment of a similar problem. Special care is needed toensure that such strategies are found to be sound enough to implement on a wide-scalebasis. Rather than ignoring this type of candidate strategy in favor of the more “tried-and-proven” approaches, consideration should be given to including a pilot-test component tothe strategy.
The primary purpose of this guide is to provide a set of strategies to consider for eliminatingor lessening the particular road safety problem upon which the user is focusing. As pointedout in the first step of this process, the identification of the problem, and the selection ofstrategies, is a complex step that will be different for each case. Therefore, it is not feasible to provide a “formula” to follow. However, guidelines are available. There are a number oftexts to which the reader can refer. Some of these are listed in Appendix B and Appendix D.
VI-13
In addition, the tables referenced in Appendix G provide examples for linking identifiedproblems with candidate strategies.
The second part of this step is to assemble sets of strategies into alternative “programpackages.” Some strategies are complementary to others, while some are more effectivewhen combined with others. In addition, some strategies are mutually exclusive. Finally,strategies may be needed to address roads across multiple jurisdictions. For instance, apackage of strategies may need to address both the state and local highway system to havethe desired level of impact. The result of this part of the activity will be a set of alternative“program packages” for the emphasis area.
It may be desirable to prepare a technical memorandum at the end of this step. It woulddocument the results, both for input into the next step and for internal reviews. The latter islikely to occur, since this is the point at which specific actions are being seriously considered.
Specific Elements1. Review problem characteristics and compare them with individual strategies,
considering both their objectives and their attributes1.1. Road-user behavior (law enforcement, licensing, adjudication)1.2. Engineering1.3. Emergency medical services1.4. System management elements
2. Select individual strategies that do the following:2.1. Address the problem2.2. Are within the policies and constraints established2.3. Are likely to help achieve the goals and objectives established for the program
3. Assemble individual strategies into alternative program packages expected to optimizeachievement of goals and objectives
3.1. Cumulative effect to achieve crash reduction goal3.2. Eliminate strategies that can be identified as inappropriate, or likely to be
ineffective, even at this early stage of planning4. Summarize the plan in a technical memorandum, describing attributes of individual
strategies, how they will be combined, and why they are likely to meet the establishedgoals and objectives
SECTION VI—GUIDANCE FOR IMPLEMENTATION OF THE AASHTO STRATEGIC HIGHWAY SAFETY PLAN
VI-14
SECTION VI—GUIDANCE FOR IMPLEMENTATION OF THE AASHTO STRATEGIC HIGHWAY SAFETY PLAN
Implementation Step 6: Evaluate Alternatives and Select a Plan
General Description
This step is needed to arrive at a logical basis for prioritizing and selecting among thealternative strategies or program packages that have been developed. There are severalactivities that need to be performed. One proposed list is shown in Appendix P.
The process involves making estimates for each of the established performance measures forthe program and comparing them, both individually and in total. To do this in a quantitativemanner requires some basis for estimating the effectiveness of each strategy. Where solidevidence has been found on effectiveness, it has been presented for each strategy in theguide. In some cases, agencies have a set of crash reduction factors that are used to arrive ateffectiveness estimates. Where a high degree of uncertainty exists, it is wise to use sensitivityanalyses to test the validity of any conclusions that may be made regarding which is the beststrategy or set of strategies to use. Further discussion of this may be found in Appendix O.
Cost-benefit and cost-effectiveness analyses are usually used to help identify inefficient orinappropriate strategies, as well as to establish priorities. For further definition of the twoterms, see Appendix Q. For a comparison of the two techniques, see Appendix S. Aspects offeasibility, other than economic, must also be considered at this point. An excellent set ofreferences is provided within online benefit-cost guides:
• One is under development at the following site, maintained by the American Society ofCivil Engineers: http://ceenve.calpoly.edu/sullivan/cutep/cutep_bc_outline_main.htm
• The other is Guide to Benefit-Cost Analysis in Transport Canada, September 1994,http://www.tc.gc.ca/finance/bca/en/TOC_e.htm. An overall summary of thisdocument is given in Appendix V.
In some cases, a strategy or program may look promising, but no evidence may be availableas to its likely effectiveness. This would be especially true for innovative methods or use ofemerging technologies. In such cases, it may be advisable to plan a pilot study to arrive at aminimum level of confidence in its effectiveness, before large-scale investment is made or alarge segment of the public is involved in something untested.
It is at this stage of detailed analysis that the crash reduction goals, set in Step 3, may berevisited, with the possibility of modification.
It is important that this step be conducted with the full participation of the stakeholders. If theprevious steps were followed, the working group will have the appropriate representation.Technical assistance from more than one discipline may be necessary to go through more complex issues. Group consensus will be important on areas such as estimates ofeffectiveness, as well as the rating and ranking of alternatives. Techniques are available toassist in arriving at consensus. For example, see the following Web site for an overview:http://web.mit.edu/publicdisputes/practices/cbh ch1.html.
VI-15
Specific Elements1. Assess feasibility
1.1. Human resources1.2. Special constraints1.3. Legislative requirements1.4. Other1.5. This is often done in a qualitative way, to narrow the list of choices to be
studied in more detail (see, for example, Appendix BB)2. Estimate values for each of the performance measures for each strategy and plan
2.1. Estimate costs and impacts 2.1.1. Consider guidelines provided in the detailed description of strategies
in this material2.1.2. Adjust as necessary to reflect local knowledge or practice 2.1.3. Where a plan or program is being considered that includes more than
one strategy, combine individual estimates 2.2. Prepare results for cost-benefit and/or cost-effectiveness analyses2.3. Summarize the estimates in both disaggregate (by individual strategy) and
aggregate (total for the program) form3. Conduct a cost-benefit and/or cost-effectiveness analysis to identify inefficient, as well as
dominant, strategies and programs and to establish a priority for the alternatives3.1. Test for dominance (both lower cost and higher effectiveness than others)3.2. Estimate relative cost-benefit and/or cost-effectiveness3.3. Test productivity
4. Develop a report that documents the effort, summarizing the alternatives considered and presenting a preferred program, as devised by the working group (for suggestionson a report of a benefit-cost analysis, see Appendix U).
4.1. Designed for high-level decision makers, as well as technical personnel whowould be involved in the implementation
4.2. Extensive use of graphics and layout techniques to facilitate understandingand capture interest
4.3. Recommendations regarding meeting or altering the crash reduction goalsestablished in Step 3.
SECTION VI—GUIDANCE FOR IMPLEMENTATION OF THE AASHTO STRATEGIC HIGHWAY SAFETY PLAN
VI-16
SECTION VI—GUIDANCE FOR IMPLEMENTATION OF THE AASHTO STRATEGIC HIGHWAY SAFETY PLAN
Implementation Step 7: Submit Recommendations for Actionby Top Management
General Description The working group has completed the important planning tasks and must now submit theresults and conclusions to those who will make the decision on whether to proceed further.Top management, at this step, will primarily be determining if an investment will be madein this area. As a result, the plan will not only be considered on the basis of its merits forsolving the particular problems identified in this emphasis area (say, vis-à-vis otherapproaches that could be taken to deal with the specific problems identified), but also itsrelative value in relation to investments in other aspects of the road safety program.
This aspect of the process involves using the best available communication skills toadequately inform top management. The degree of effort and extent of use of media shouldbe proportionate to the size and complexity of the problem being addressed, as well as thedegree to which there is competition for funds.
The material that is submitted should receive careful review by those with knowledge inreport design and layout. In addition, today’s technology allows for the development ofautomated presentations, using animation and multimedia in a cost-effective manner.Therefore, programs involving significant investments that are competing strongly forimplementation resources should be backed by such supplementary means forcommunicating efficiently and effectively with top management.
Specific Elements1. Submit recommendations for action by management
1.1. “Go/no-go” decision1.2. Reconsideration of policies, guidelines, and specifications (see Step 3)1.3. Modification of the plan to accommodate any revisions to the program
framework made by the decision makers2. Working group to make presentations to decision makers and other groups, as needed
and requested3. Working group to provide technical assistance with the review of the plan, as requested
3.1. Availability to answer questions and provide further detail3.2. Assistance in conducting formal assessments
VI-17
Implementation Step 8: Develop a Plan of Action
General DescriptionAt this stage, the working group will usually detail the program that has been selected forimplementation. This step translates the program into an action plan, with all the detailsneeded by both decision makers, who will have to commit to the investment of resources,and those charged with carrying it out. The effort involves defining resource requirements,organizational and institutional arrangements needed, schedules, etc. This is usually done inthe form of a business plan, or plan of action. An example of a plan developed by a localcommunity is shown in Appendix X.
An evaluation plan should be designed at this point. It is an important part of the plan. Thisis something that should be in place before Step 9 is finished. It is not acceptable to wait untilafter the program is completed to begin designing an evaluation of it. This is because dataare needed about conditions before the program starts, to allow comparison with conditionsduring its operation and after its completion. It also should be designed at this point, toachieve consensus among the stakeholders on what constitutes “success.” The evaluation isused to determine just how well things were carried out and what effect the program had.Knowing this helps maintain the validity of what is being done, encourages future supportfrom management, and provides good intelligence on how to proceed after the program iscompleted. For further details on performing evaluations, see Appendix L, Appendix M, andAppendix W.
The plan of action should be developed jointly with the involvement of all desiredparticipants in the program. It should be completed to the detail necessary to receive formalapproval of each agency during the next step. The degree of detail and complexity requiredfor this step will be a function of the size and scope of the program, as well as the number ofindependent agencies involved.
Specific Elements 1. Translation of the selected program into key resource requirements
1.1. Agencies from which cooperation and coordination is required1.2. Funding1.3. Personnel1.4. Data and information1.5. Time1.6. Equipment1.7. Materials1.8. Training1.9. Legislation
2. Define organizational and institutional framework for implementing the program2.1. Include high-level oversight group2.2. Provide for involvement in planning at working levels2.3. Provide mechanisms for resolution of issues that may arise and disagreements
that may occur2.4. Secure human and financial resources required
SECTION VI—GUIDANCE FOR IMPLEMENTATION OF THE AASHTO STRATEGIC HIGHWAY SAFETY PLAN
VI-18
SECTION VI—GUIDANCE FOR IMPLEMENTATION OF THE AASHTO STRATEGIC HIGHWAY SAFETY PLAN
3. Detail a program evaluation plan3.1. Goals and objectives3.2. Process measures3.3. Performance measures
3.3.1. Short-term, including surrogates, to allow early reporting of results3.3.2. Long-term
3.4. Type of evaluation3.5. Data needed3.6. Personnel needed3.7. Budget and time estimates
4. Definition of tasks to conduct the work4.1. Develop diagram of tasks (e.g., PERT chart)4.2. Develop schedule (e.g., Gantt chart)4.3. For each task, define
4.3.1. Inputs4.3.2. Outputs4.3.3. Resource requirements4.3.4. Agency roles4.3.5. Sequence and dependency of tasks
5. Develop detailed budget5.1. By task5.2. Separate by source and agency/office (i.e., cost center)
6. Produce program action plan, or business plan document
VI-19
Implementation Step 9: Establish Foundations forImplementing the Program
General DescriptionOnce approved, some “groundwork” is often necessary to establish a foundation forcarrying out the selected program. This is somewhat similar to what was done in Step 4. Itmust now be done in greater detail and scope for the specific program being implemented.As in Step 4, specific policies and guidelines must be developed, organizational andinstitutional arrangements must be initiated, and an infrastructure must be created for theprogram. The business plan or action plan provides the basis (Step 7) for this. Once again,the degree of complexity required will vary with the scope and size of the program, as wellas the number of agencies involved.
Specific Elements1. Refine policies and guidelines (from Step 4)2. Effect required legislation or regulations3. Allocate budget4. Reorganize implementation working group5. Develop program infrastructure
5.1. Facilities and equipment for program staff5.2. Information systems5.3. Communications5.4. Assignment of personnel5.5. Administrative systems (monitoring and reporting)
6. Set up program assessment system6.1. Define/refine/revise performance and process measures6.2. Establish data collection and reporting protocols6.3. Develop data collection and reporting instruments6.4. Measure baseline conditions
SECTION VI—GUIDANCE FOR IMPLEMENTATION OF THE AASHTO STRATEGIC HIGHWAY SAFETY PLAN
VI-20
SECTION VI—GUIDANCE FOR IMPLEMENTATION OF THE AASHTO STRATEGIC HIGHWAY SAFETY PLAN
Implementation Step 10: Carry Out the Action Plan
General DescriptionConditions have been established to allow the program to be started. The activities ofimplementation may be divided into activities associated with field preparation forwhatever actions are planned and the actual field implementation of the plan. The activitiescan involve design and development of program actions, actual construction or installationof program elements, training, and the actual operation of the program. This step alsoincludes monitoring for the purpose of maintaining control and carrying out mid- and post-program evaluation of the effort.
Specific Elements1. Conduct detailed design of program elements
1.1. Physical design elements1.2. PI&E materials1.3. Enforcement protocols1.4. Etc.
2. Conduct program training3. Develop and acquire program materials4. Develop and acquire program equipment5. Conduct pilot tests of untested strategies, as needed6. Program operation
6.1. Conduct program “kickoff”6.2. Carry out monitoring and management of ongoing operation
6.2.1 Periodic measurement (process and performance measures)6.2.2 Adjustments as required
6.3 Perform interim and final reporting
VI-21
Implementation Step 11: Assess and Transition the Program
General DescriptionThe AASHTO Strategic Highway Safety Plan includes improvement in highway safetymanagement. A key element of that is the conduct of properly designed programevaluations. The program evaluation will have been first designed in Step 8, which occursprior to any field implementation. For details on designing an evaluation, please refer toStep 8. For an example of how the New Zealand Transport Authority takes this step as animportant part of the process, see Appendix N.
The program will usually have a specified operational period. An evaluation of both theprocess and performance will have begun prior to the start of implementation. It may alsocontinue during the course of the implementation, and it will be completed after theoperational period of the program.
The overall effectiveness of the effort should be measured to determine if the investmentwas worthwhile and to guide top management on how to proceed into the post-program period. This often means that there is a need to quickly measure programeffectiveness in order to provide a preliminary idea of the success or need for immediatemodification. This will be particularly important early in development of the AASHTOStrategic Highway Safety Plan, as agencies learn what works best. Therefore, surrogates forsafety impact may have to be used to arrive at early/interim conclusions. These usuallyinclude behavioral measures. This particular need for interim surrogate measures should bedealt with when the evaluation is designed, back in Step 8. However, a certain period,usually a minimum of a couple of years, will be required to properly measure theeffectiveness and draw valid conclusions about programs designed to reduce highwayfatalities when using direct safety performance measures.
The results of the work is usually reported back to those who authorized it and thestakeholders, as well as any others in management who will be involved in determining thefuture of the program. Decisions must be made on how to continue or expand the effort, if atall. If a program is to be continued or expanded (as in the case of a pilot study), the results ofits assessment may suggest modifications. In some cases, a decision may be needed toremove what has been placed in the highway environment as part of the program because ofa negative impact being measured. Even a “permanent” installation (e.g., rumble strips)requires a decision regarding investment for future maintenance if it is to continue to beeffective.
Finally, the results of the evaluation using performance measures should be fed back into aknowledge base to improve future estimates of effectiveness.
Specific Elements1. Analysis
1.1 Summarize assessment data reported during the course of the program1.2 Analyze both process and performance measures (both quantitative and
qualitative)
SECTION VI—GUIDANCE FOR IMPLEMENTATION OF THE AASHTO STRATEGIC HIGHWAY SAFETY PLAN
VI-22
SECTION VI—GUIDANCE FOR IMPLEMENTATION OF THE AASHTO STRATEGIC HIGHWAY SAFETY PLAN
1.3 Evaluate the degree to which goals and objectives were achieved (usingperformance measures)
1.4 Estimate costs (especially vis-à-vis pre-implementation estimates)1.5 Document anecdotal material that may provide insight for improving future
programs and implementation efforts1.6 Conduct and document debriefing sessions with persons involved in the
program (including anecdotal evidence of effectiveness and recommendedrevisions)
2. Report results3. Decide how to transition the program
3.1 Stop3.2 Continue as is3.3 Continue with revisions3.4 Expand as is3.5 Expand with revisions3.6 Reverse some actions
4. Document data for creating or updating database of effectiveness estimates
VI-23
SECTION VII
Key References
AASHTO. Roadside Design Guide, 3rd Edition. Washington, D.C. (More information can be foundat http://www.transportation.org/publications/bookstore.nsf/Home?OpenForm). 2002.
Agent, K. R. “Transverse Pavement Markings for Speed Control and Accident Reduction(Abridgement).” Transportation Research Record 773, Transportation Research Board of theNational Academies, Washington, D.C. 1980.
Agent, K. R., and J. G. Pigman. Performance of Guardrail End Treatments in Traffic Accidents.Research Report KTC-91-1, Kentucky Transportation Center, University of Kentucky,Lexington, Kentucky. 1991.
Allaire, C., D. Ahner, M. Abarca, P. Adgar, and S. Long. Relationship Between Side SlopeConditions and Collision Records in Washington State. Final Report, WA-RD 425.1, WashingtonState Department of Transportation, Olympia, Washington. 1996.
Black, G. W., Jr., and L. E. Jackson. “Pavement Surface Water Phenomena and TrafficSafety.” ITE Journal, pp. 32-37, February 2000.
Bray, J. Memo on “Skid Accident Reduction Program,” NYSDOT. 2001.
Bucko, T. R., and A. Khorashadi. Evaluation of Milled-In Rumble Strips, Rolled-In Rumble Stripsand Audible Edge Stripe. Office of Transportation Safety and Research, California Departmentof Transportation. 2001.
Fambro, D. B., R. L. Nowlin, S. P. Warren, K. A. Lienau, J. M. Mounce, R. P. Bligh, K. K. Mak,and H. E. Ross. Geometric Design Guidelines for Suburban High-Speed Curb and Gutter Roadways.Texas Transportation Institute, Texas A&M University, College Station, Texas. 1995.
FHWA. “Skid Accident Reduction Program.” FHWA Technical Advisory T 5040.17,December 23, 1980 (see http://www.fhwa.dot.gov/legsregs/directives/techadvs/t504017.htm).
FHWA. HSIS Summary Report: Safety Evaluation of Rolled- In Continuous Shoulder Rumble StripsInstalled on Freeways. Washington, D.C. FHWA-RD-00-32. 1999.
FHWA. Surface Finishing of Portland Cement Concrete Pavement—Final Report FHWA-SA-96-068, Tire Pavement Noise and Safety Performance, May 1996. FHWA Policy Memorandum,Office of Engineering, November 12, 1996 (see http://wwwcf.fhwa.dot.gov/legsregs/directives/policy/sa_96_06.htm).
FHWA. Manual on Uniform Traffic Control Devices. Washington, D.C. 1988.
VII-1
SECTION VII—KEY REFERENCES
VII-2
Fitzpatrick, K., K. Balke, D. W. Harwood, and I. B. Anderson. NCHRP Report 440: AccidentMitigation Guide for Congested Rural Two-Lane Highways. Transportation Research Board ofthe National Academies, Washington, D.C. 2000.
Foody, T. J., and W. C. Taylor. Curve Delineation and Accidents. Ohio Department ofHighways, Bureau of Traffic. Columbus, Ohio. 1966.
Galal, A. A., R. Al-Mahrooqui, and R. Taha. Measurement, Analysis, Evaluation and Restorationof Skid Resistance on the Streets of Muscat. Transportation Research Board of the NationalAcademies, TRB 78th Annual Meeting Preprint CD-ROM, paper #991343. 1999.
Glennon, J. C., T. R. Newman, and J. E. Leisch. Safety and Operational Considerations for Design ofRural Highway Curves, FHWA/RD-86/035. FHWA, U.S. Department of Transportation. 1985.
Griffith, M. S. Safety Evaluation of Continuous Shoulder Rumble Strips Installed on Freeways.Federal Highway Administration. Reference number: TRB No. 990162. 1999.
Harkey, D. L., F. M. Council, K. Digges, A. Eskandarian, W. W. Hunter, and K. K. Eccles.Effects of Highway Design on Rollover—Experimental Design. Federal Highway Administration,Washington, D.C. Unpublished report. 2000. Available from primary author [email protected].
Harwood, D. W. NCHRP Synthesis of Highway Practice 191: Use of Rumble Strips to EnhanceSafety. Transportation Research Board of the National Academies. 1993.
Harwood, D. W., F. M. Council, E. Hauer, W. E. Hughes, and A. Vogt. Prediction of theExpected Safety Performance of Rural Two-Lane Highways, FHWA-RD-99-207, Federal HighwayAdministration. 2000.
Hatcher, C. W. “Grooving Streets and Highways Can Help Stop Skid Crashes.” TrafficEngineering. 1974.
Hauer, E. Review of Literature Concerning the Safety Effects of Roadway and Intersection Factors.Unpublished. 2000. http://members.home.net/hauer/Pubs/02[1].Shoulderwidth.pdf.
Humphreys, J. B., and J. A. Parham. The Elimination or Mitigation of Hazards Associated withPavement Edge Drop-Offs During Roadway Resurfacing. AAA Foundation for Traffic Safety,Washington, D.C. 1994.
Jennings, B. E., and M. J. Demetsky. Evaluation of Curve Delineation Signs on Rural Highways.Virginia Highway and Transportation Research Council. 1983.
Kallberg, V. “Reflector Posts—Signs or Danger?” Transportation Research Record 1403.Transportation Research Board of the National Academies, Washington, D.C. 1993.
Knuiman, M. W., F. M. Council, and D. W. Reinfurt. “The Association of Median Width andHighway Accident Rates.” Transportation Research Record 1401. Transportation ResearchBoard of the National Academies, Washington, D.C. 1993.
Ligon, C. M., E. D. Carter, D. B. Joost, and W. W. Wolman. Effects of Shoulder TexturedTreatments on Safety. Federal Highway Administration, Washington, D.C. FHWA/RD-85/027.1985.
Meyer, E. “A New Look at Optical Speed Bars.” ITE Journal. November 2001.
SECTION VII—KEY REFERENCES
Migletz, J., J. K. Fish, and J. L. Graham. Roadway Delineation Practices Handbook. FHWA-SA-93-001, Federal Highway Administration, Washington, D.C. 1994.
Morena, D. A., and L. S. Schroeder. Accident Analysis of the Michigan Breakaway Cable Terminals(BCT). Federal Highway Administration, Michigan Division, Washington, D.C. 1994.
New York State Department of Transportation. 1988 Annual Evaluation Report: Highway SafetyImprovement Program. 1988.
New York State Department of Transportation. Safe-Strips (Safety Shoulder Rumble Strips).April 1998.
New York State Department of Transportation. Raised Reflectorized SnowplowablePavement Markers: A Report to the Governor. 1997.
The Ohio Underwriter. “Research on Reflective Markers Indicates Savings of $6.50 for eachDollar Spent.” 1981.
Perrillo, K. The Effectiveness and Use of Continuous Shoulder Rumble Strips. Federal HighwayAdministration. 1998. http://safety.fhwa.dot.gov/rumblestrips/resources/rumblekp.htm .
Pendleton, O. Evaluation of Accident Analysis Methodology. Federal Highway Administration,Washington, D.C. FHWA RD-96-039. 1996.
Ray, M. H. “Safety Effectiveness of Upgrading Guardrail Terminals to NCHRP Report 350Standards.” Transportation Research Record 1720. Transportation Research Board of theNational Academies, Washington, D.C. 2000.
Retting, R. A. Personal correspondence from author concerning Pennsylvania curve markingexperiment. 1999.
Retting, R. A., and C. M. Farmer. “Use of Pavement Markings to Reduce Excessive TrafficSpeeds on Hazardous Curves,” ITE Journal. September 1998.
Retting, R. A., H. W. McGee, and C. M. Farmer. “Influence of Experimental PavementMarkings on Urban Freeway Exit-Ramp Traffic Speeds.” Transportation Research Record 1705,Transportation Research Board of the National Academies, Washington, D.C. 2000.
Sicking, D. L., K. K. Mak, and K. Zimmerman. NCHRP Report 492: Roadside Safety AnalysisProgram (RSAP)—Engineer’s Manual. Transportation Research Board of the NationalAcademies, Washington, D.C. 2003.
State of New Jersey. Annual Safety Report. Fiscal Year 1986.
Steyvers, F. and D. Waard. “Road Edge Delineation in Rural Areas: Effects on DrivingBehaviour,” Proceedings of the Human Factors and Ergonomics Society, HFES Europe ChapterAnnual Meeting, Haren, the Netherlands. 1997.
Torbic, D., L. Elefteriadou, M. El-Gindy. “Development of Rumble Strip Configurations thatAre More Bicycle Friendly.” Transportation Research Record 1773. Transportation ResearchBoard of the National Academies. 2001.
Zador, P., H. S. Stein, P. Wright, and J. Hall. “Effects of Chevrons, Post-MountedDelineators, and Raised Pavement Markers on Driver Behavior at Roadway Curves.”
VII-3
Transportation Research Record 1114, Transportation Research Board of the NationalAcademies. 1987.
Zegeer, C. V., J. R. Stewart, D. W. Reinfurt, F. M. Council, T. R. Newman, E. G. Hamilton, T.Miller, and W. W. Hunter. Cost Effective Geometric Improvements for Safety Upgrading ofHorizontal Curves—Final Report. Federal Highway Administration, Washington, D.C. 1990.
Zegeer, C. V., J. Hummer, D. Reinfurt, L. Herf, W. Hunter. Safety Effects of Cross-SectionDesign for Two-Lane Roads—Volumes I and II. Federal Highway Administration, Washington,D.C. FHWA-RD-87-008. 1987.
Zegeer, C. V., J. R. Stewart, F. M. Council, D. W. Reinfurt, and E. Hamilton. “Safety Effects ofGeometric Improvements on Horizontal Curves,” Transportation Research Record 1356.Transportation Research Board of the National Academies. 1992.
Zwahlen, H. T., and T. Schnell. “Knowledge-Based Personal Computer Software Package forApplying and Placing Curve Delineation Devices.” Transportation Research Record 1495.Transportation Research Board of the National Academies. Washington, D.C. 1995.
SECTION VII—KEY REFERENCES
VII-4
VIII-1
SECTION VIII
Glossary
Acronym or Term Meaning Comments
3R Rehabilitation, Resurfacing, and Refers to type of project that is Restoration intended to be less comprehen-
sive than complete reconstruction
AAA American Automobile Association
AAAM Association for the Advancementof Automotive Medicine
AAMVA American Association of Motor Vehicle Administrators
AASHTO American Association of State Highway and Transportation Officials
ADAT Aggressive Driving Apprehension Washington State PatrolTeam
ADT Average Daily Traffic
AG Aggressive Driving
AMA American Medical Association
AMF (or CMF) Accident Modification Factor Also may be referred to as Crash Modification Factor
ARTBA American Road and Transporta-tion Builders Association
ASCE American Society of Civil Engineers
AWS Accident Warning System
B/C Benefit-Cost Ratio
BCT Breakaway Cable Terminal End treatment for guardrail
CAE Computer Aided Engineering
CCS Collision Countermeasure System
CDL Commercial Driver’s License
CHSIM Comprehensive Highway Safety Recently changed name to TheImprovement Model Safety Analyst
CSD Context-Sensitive Design
DDC-ADD Defensive Driving Course—Attitudinal Dynamics of Driving
SECTION VIII—GLOSSARY
VIII-2
Acronym or Term Meaning Comments
DDSS Design Decision Support System
DES Detailed Engineering Studies
DMV Department of Motor Vehicles
DOT Department of Transportation
DUI/DWI Driving Under the Influence (of alcohol or drugs)/Driving While Impaired
DUS Driving Under Suspension (of driver’s license)
DWR Driving While Revoked
DWS Driving While Suspended
EM Electronic Monitoring
FARS Fatality Analysis Reporting Formerly referred to as Fatal System Accident Reporting System
FHWA Federal Highway Administration Division of the U.S. Department of Transportation
F+I Fatal Plus Injury (crash)
GHSA Governors Highway Safety Formerly NAGHSR (NationalAssociation Association of Governors’
Highway Safety Representatives)
Green Book AASHTO Policy on Geometric Design of Highways
H.A.D. Halt Aggressive Driving Lubbock, Texas
HAL High Accident Location
HCM Highway Capacity Manual TRB publication
HES Hazard Elimination Study
HO Head On (accident)
HOS Hours of Service For commercial vehicle drivers
HRR Highway Research Record TRB publication
HSIS Highway Safety Information System
HSM Highway Safety Manual
IES Illumination Engineering Society
IHSDM Interactive Highway Safety Design Model
IID Ignition Interlock Device
ISD Intersection Sight Distance
SECTION VIII—GLOSSARY
Acronym or Term Meaning Comments
ITE Institute of Transportation Engineers
LCCA Life Cycle Cost Analysis
MAB Medical Advisory Board State-level organization
MADD Mothers Against Drunk Driving
MUTCD Manual of Uniform Traffic FHWA publicationControl Devices
NCHRP National Cooperative Highway Research Program
NHI National Highway Institute FHWA training office
NHTSA National Highway Traffic Safety Division of the U.S. Department Administration of Transportation
NSC National Safety Council
NTSB National Transportation Safety Board
NYSTA New York State Thruway Authority
PCR Police Crash Report
PDO Property Damage Only (accident)
PI&E Public Information & Education
RDG Roadside Design Guide AASHTO publication
RID Remove Intoxicated Drivers Citizen group
ROR Run-Off-Road (accident)
ROW Right-of-Way
RPM Raised Pavement Marker
RSA Road Safety Audit
RSPM Raised Snowplowable Pavement Marker
SADD Students Against Destructive Decisions
SBPD Santa Barbara Police Department (California)
SHSP Strategic Highway Safety Plan
SKARP Skid Accident Reduction Program
SPF Safety Performance Function
SSD Stopping Sight Distance
SUV Sports Utility Vehicle
SV Single Vehicle (accident)
VIII-3
Acronym or Term Meaning Comments
TCD Traffic Control Device
TRB Transportation Research Board
TRR Transportation Research Record TRB Publication
TRRL Transport and Road United Kingdom organizationResearch Laboratory
TSIMS Transportation Safety Developed by AASHTOInformation Management System
TTI Texas Transportation Institute
TWLTL Two-Way, Left-Turn Lane
U/S/R Unlicensed/Suspended/Revoked Drivers without licenses, or whose licenses have been suspended or revoked
UVC Uniform Vehicle Code Model national traffic law
WSP Washington State Patrol
See also: Glossary of Transportation Terms onlinehttp://transweb.sjsu.edu/comglos2.htm#P
SECTION VIII—GLOSSARY
VIII-4
A-1
Appendixes
The following appendixes are not published in this report. However, they are availableonline at http://transportation1.org/safetyplan.
1 Description of Pennsylvania DOT Strategies for Reducing ROR Harm 2 Description of Maryland DOT Program for Shoulder Rumble Strips on Two-Lane Roads3 Description of Kansas DOT Policy Requiring Milled-In Rumble Strips4 Description of North Carolina DOT Experimental Programs with Edgeline Profile
Marking and Rumble Strips for Narrow Paved Shoulders 5 Description of New York DOT Skid Accident Reduction Program (SKARP) 6 Description of Iowa DOT Experimental Program to Delineate Hazardous Utility Poles
A Wisconsin Department of Transportation 2001 Strategic Highway Safety PlanB Resources for the Planning and Implementation of Highway Safety ProgramsC South African Road Safety ManualD Comments on Problem DefinitionE Issues Associated with Use of Safety Information in Highway Design: Role of Safety in
Decision MakingF Comprehensive Highway Safety Improvement ModelG Table Relating Candidate Strategies to Safety Data ElementsH What Is a Road Safety Audit?I Illustration of Regression to the MeanJ Fault Tree AnalysisK Lists of Potential StakeholdersL Conducting an EvaluationM Designs for a Program EvaluationN Joint Crash Reduction Programme: Outcome MonitoringO Estimating the Effectiveness of a Program During the Planning StagesP Key Activities for Evaluating Alternative ProgramQ Definitions of Cost-Benefit and Cost-EffectivenessR FHWA Policy on Life Cycle CostingS Comparisons of Benefit-Cost and Cost-Effectiveness AnalysisT Issues in Cost-Benefit and Cost-Effectiveness AnalysesU Transport Canada Recommended Structure for a Benefit-Cost Analysis ReportV Overall Summary of Benefit-Cost Analysis Guide from Transport CanadaW Program Evaluation—Its Purpose and NatureX Traffic Safety Plan for a Small DepartmentY Sample District-Level Crash Statistical SummaryZ Sample Intersection Crash SummariesAA Sample Intersection Collision DiagramBB Example Application of the Unsignalized Intersection Guide
Abbreviations used without definitions in TRB publications:
AASHO American Association of State Highway OfficialsAASHTO American Association of State Highway and Transportation OfficialsAPTA American Public Transportation AssociationASCE American Society of Civil EngineersASME American Society of Mechanical EngineersASTM American Society for Testing and MaterialsATA American Trucking AssociationsCTAA Community Transportation Association of AmericaCTBSSP Commercial Truck and Bus Safety Synthesis ProgramFAA Federal Aviation AdministrationFHWA Federal Highway AdministrationFMCSA Federal Motor Carrier Safety AdministrationFRA Federal Railroad AdministrationFTA Federal Transit AdministrationIEEE Institute of Electrical and Electronics EngineersITE Institute of Transportation EngineersNCHRP National Cooperative Highway Research ProgramNCTRP National Cooperative Transit Research and Development ProgramNHTSA National Highway Traffic Safety AdministrationNTSB National Transportation Safety BoardSAE Society of Automotive EngineersTCRP Transit Cooperative Research ProgramTRB Transportation Research BoardU.S.DOT United States Department of Transportation