50
Journal of Agricultural Extension and Rural Development Volume 8 Number 12 December 2016 ISSN 2141-2170 -2170

Journal of Agricultural
Extension and Rural
Development
Volume 8 Number 12 December 2016
ISSN 2141-2170
-2170

ABOUT JAERD The Journal of Agricultural Extension and Rural Development (JAERD) is published monthly (one volume per year) by Academic Journals.
Journal of Agricultural Extension and Rural Development (JAERD) is an open access journal that provides rapid publication (monthly) of articles in all areas of the subject such as Impact monitoring and evaluation system for farmer field schools, Metals in bio solids-amended soils, Nitrogenous fertilizer influence on quantity and quality values of balm, Effect of irrigation on consumptive use, water use efficiency and crop coefficient of sesame etc.
The Journal welcomes the submission of manuscripts that meet the general criteria of significance and scientific excellence. Papers will be published shortly after acceptance. All articles published in JAERD are peer-reviewed.
Contact Us
Editorial Office: [email protected]
Help Desk: [email protected]
Website: http://www.academicjournals.org/journal/JAERD
Submit manuscript online http://ms.academicjournals.me/

Editors
Dr. Kursat Demiryurek Ondokuz Mayıs University, Faculty of Agriculture, Department of Agricultural Economics, 55139, Samsun, Turkey.
Prof Theera Rukkwamsuk Kasetsart University Thailand.
Dr. Vincent Bado WARDA, Africa Rice Center Burkina Faso.
Dr. Tahseen Jafry Glasgow Caledonian University Cowcaddens Road, Glasgow Scotland UK, G4 OBA UK.
Dr. Daniel Temesgen Gelan Welaita Sodo University ,Ethiopia
Dr. Ayyanadar Arunachalam, Department of Forestry, North Eastern Regional Institute of Science & Technology, Nirjuli 791109, Arunachal Pradesh, India.
Dr. V. Basil Hans St Aloysius Evening College, Mangalore. # 720 Light House Hill, Mangalore – 575 005, Karnataka State. India.
Dr. Farhad Mirzaei Department of Animal Production Management , Animal Science Research Institute of Iran Dr. Ijaz Ashraf Institute of Agri. Extension and Rural Development, University of Agriculture, Faisalabad-Pakistan

Editorial Board
Dr. Vasudeo P. Zamabare South Dakota School of Mines and Technology (SDSMT) USA.
Dr. Jurislav Babic,
University of Osijek, Faculty of Food Technology F. Kuhaca 20, 31000 Osijek Croatia.
Dr. Ghousia Begum Indian Institute of Chemical Technology (IICT) India.
Dr Olufemi Martins Adesope University of Port Harcourt, Port Harcourt, Nigeria.
Dr. A.H.M.Mahbubur Rahman Rajshahi University Bangladesh.
Dr. Ben Odoemena IFAD Nigeria.
Dr. D.Puthira Prathap Sugarcane Breeding Institute (Indian Council of Agricultural Research) India.
Dr. Mohammad Sadegh Allahyari Islamic Azad University, Rasht Branch Iran.
Dr. Mohamed A. Eltawil Kafrelsheikh University Egypt.
Dr Henry de-Graft Acquah University of Cape Coast Applied Statistics Ghana.
Prof. Stanley Marshall Makuza Umutara Polytechnic Zimbabwe.
Dr. Franklin Peter Simtowe International Crops Research Institute for the semi-arid Tropics (ICRISAT) Malawi.
Dr. Hossein Azadi Centre for Development Studies, Faculty of Spatial Sciences, University of Groningen The Netherlands. Dr Neena Singla Punjab Agricultural University Department of Zoology College of Basic Sciences and Humanities India.
Dr. Emana Getu Degaga Addis Ababa University Ethiopia.
Dr. Younes Rezaee Danesh Department of Plant Protection, Faculty of Agriculture Urmia University, Urmia- Iran.
Dr. Zahra Arzjani Faculty of Geography, Islamic Azad University Branch of Tehran Central, Tehran Iran.
Dr Hossein Aliabadi Farahani Islamic Azad University Shahriar (Shahr-e-Qods) Beranch, Agricultural Department Iran.
Dr. Shikui DONG Environmental School, Beijing Normal University China. Dr. Babar Shahbaz University of Agriculture, Faisalabad and Sustainable Development Policy Instiutute Islamabad Pakistan. Dr. H. M. Chandrashekar Institute of Development Studies, University of Mysore, Manasagangotri Mysore 570 006, Karnataka State India.
Dr. Kassahun Embaye Institution: Institute of Biodiversity Conservation (IBC) Ethiopia.
Dr. Hasan Kalyoncu University of Süleyman Demirel, Faculty of Science and Art, Department of Biology TURKEY.

International Journal of Medicine and Medical Sciences
Journal of Agricultural Extension and Rural Development
Table of Contents: Volume 8 Number 12 December 2016
ARTICLES
Making the demand driven extensions services systems work through decentralised structures: Prospects for the future extension service delivery in Malawi 240 Charles McPhery Masangano, Hastings Chiwasa, Daimon K. Kambewa, Mayamiko Kakwera, Masautso Chimombo, Marriam Matita and Wisdom Gausi Informal transfer of information among vegetable growers in Khartoum State, Sudan 250 Osman A. Badri Logit analysis of factors affecting adoption of improved bread wheat (Triticum aestivum L.) variety: The case of Yilmana Densa District, West Gojam, Ethiopia 258 Laduber Wondale, Dessalegn Molla and Daniel Tilahun Farmers’ perception towards climate change and their adaptation measures in Dire Dawa Administration, Eastern Ethiopia 269 Alem Kidanu, Kibebew Kibret, Jemma Hajji, Muktar Mohammed and Yosef Ameha

Vol.x(x), pp. xxx-xxx, xx 2016
DOI: 10.5897/xxxxxxxxxxx
Articles Number: xxxxxxxxx
ISSN 2141-2170
Copyright ©2016
Author(s) retain the copyright of this article
http://www.academicjournals.org/JAERD
Journal of Agricultural Extension and Rural Development
Full Length Research Paper
Making the demand driven extensions services systems work through decentralised structures:
Prospects for the future extension service delivery in Malawi
Charles McPhery Masangano*, Hastings Chiwasa, Daimon K. Kambewa, Mayamiko Kakwera, Masautso Chimombo, Marriam Matita and Wisdom Gausi
Extension Department, Bunda College Campus, Lilongwe University of Agriculture and Natural Resources, Malawi.
Received 9 September, 2016; Accepted 3 November, 2016
Malawi adopted a pluralistic, demand-driven and decentralised agricultural extension system in 2000, following a political change from one party to a multiparty democratic system of government. This was followed by the introduction of a district agricultural extension services system (DAESS) as a way of facilitating the implementation of the pluralistic, demand-driven and decentralised agricultural extension policy. This study was conducted to assess the feasibility and status of implementation of DAESS. The study was conducted as an action research which involved an assessment of the status as well as implementation of the DAESS system. Stakeholder consultations revealed that DAESS is a very good extension system for promoting agricultural and rural development in Malawi considering its socio-political set-up. At the time of the study, the system had not been well established in two of the three districts and the action research activities demonstrated that the system can be established and works effectively in promoting agricultural development. There is need to conduct more sensitization and training of stakeholders for them to understand and effectively implement the system. Key words: Extension system, pluralistic extension, decentralised extension, demand-driven extension, extension policy, action research.
INTRODUCTION Agricultural extension is an indispensable component of agricultural development process. It is a catalyst for the development of agricultural systems. Benor and Baxter (1986) argued that „sustained high levels of agricultural
production and incomes are not possible without an effective agricultural extension service supported by agricultural research that is relevant to farmers‟ needs‟. The role of agricultural extension is actually increasing
*Corresponding author. E-mail: [email protected]. Tel: 265-888843785. Fax: 265-1-277364.
Author(s) agree that this article remain permanently open access under the terms of the Creative Commons Attribution
License 4.0 International License

and becoming more conspicuous now that the inherent diversity of farmers and farming systems requiring different and diverse services and approaches to address their needs and challenges are being recognized (Heemskerk and Davis, 2012; Wongtschowski et al., 2013). The roles have actually expanded from transfer of technologies to facilitation and from training to supporting learning by farmers as well as helping to create farmer groups that can deal with market issues (Davis, 2008). The type of stakeholders extension and advisory services are expected to serve has also expanded and become more diverse by including farmers as primary producers and all players in the value chains. As such agricultural extension services are under increasing pressure to become more effective, relevant, responsive to client needs and less costly (Swanson and Samy, 2002; World Bank, 2000). A proper institutional arrangement encompassing policies and regulatory frameworks as well as appropriate structures for enhancing effectiveness and efficiency of the extension system is a necessity. Minh et al. (2014) have discussed the crucial role that institutions play in influencing various actors including government, private extension service providers as well as farmers and other users‟ behaviour in the extension system. Oladele (2011) as well as Zwane and Chauke (2015) also emphasised the crucial role of policies and legal frameworks in enhancing extension effectiveness.
The socio-economic and political environment in some countries like Malawi has changed very significantly in the past two decades with major impacts on the agricultural sector. The major changes relate to the introduction of plural politics where multiparty democracies have now become the order of the day and the introduction of decentralised governance systems where deconcentration has become major characteristics. Shrinkage of public sector resources has on the other hand been a major factor contributing to the erosion of quality in the provision of extension services. One effect of these changes has been the need to make major changes in agricultural extension systems in such countries. Malawi as a country whose economy mainly depends on agriculture with smallholder farmers as part of the major players needs to have a well defined and robust agricultural extension system. Davis (2008) conducted an analysis of extension models practiced in sub-Saharan African countries and based on her analysis concluded that the future of extension services is going to be in pluralistic, demand-driven and participatory services. Conditions which led to the introduction of the district agricultural extension services system Agricultural extension in Malawi was first recorded in 1903 and since then, the country has implemented several extension systems. These include the coercive extension system and the master farmer system which
were implemented during the colonial era (Masangano and Mthinda, 2012; Mkandawire, 1987) followed by the progressive farmer system introduced immediately after independence in 1964 and the block extension system (BES) which was introduced in the early 1980s. The BES was a modification of the training and visit (T&V) system. Despite the evidence shown in the literature that T&V system of extension made impact in terms of increasing adoption of technologies and productivity (Hussain et al., 1994; Ilevbaoje, 2004; Amin and Stewart, 1994; Uzunlu, 1990), high implementation and maintenance costs led to its abandonment (Anderson et al., 2006). The BES was considered to be a very expensive system to maintain and it was abandoned in Malawi. Both the progressive farmer system and the BES were introduced at a time when Malawi was politically being governed under a one party system, that of the Malawi Congress Party. The BES, just like the other extension systems that existed before it, was characterized by top-down approaches, which emphasized national interests to the disadvantages of farmers‟ individual interests. As a top down system, BES worked very well under the one party system of governance which was predominantly authoritarian in nature and people were used to being told what to do by the government. This situation changed in the early 1990s when Malawi underwent some political changes.
Malawi changed its political system from one party autocratic governance system of the Malawi Congress Party to a multiparty democratic governance system in 1994. This governance system promoted democratic principles such as freedom of speech, freedom of choice and freedom of association. As part of the process to consolidate democracy and enhance public participation, the government decided to introduce decentralized governance system, whereby power was devolved to the districts and lower levels through a local government policy and its associated Act of 1998 (GoM, 1998a, GoM, 1998b). Decentralisation has been a major public sector reform that has been implemented since the early 1990s, when most African countries were transitioning from authoritarian to democratic regimes (Chasukwa et al., 2014). Decentralisation is a tool used by most governments for enhancing participation and sharing of power and responsibilities with actors at the bottom stratum of society (Hood, 1991; Osborne and Gaebler, 1992; Ostrom, 1973; Tambulasi, 2010). Local government structures were established as part of the decentralization process. The structures included the District Assembly (DA), which is supposed to be the policy making body of the district, the District Executive Committee (DEC), which is supposed to act as a technical advisory body of the DA and local committees under it. Below the DA are Area Development Committees (ADC), at the level of the Chiefs and Village Development Committees (VDC) at the level of Group Village Heads (GVH). These local government structures

do not go to the level of the Village Head (VH).
As the process of decentralization was taking its roots, Malawi also experienced a proliferation of private and non-governmental organizations (NGO) which were providing extension services. Most of the NGOs started as relief organizations that were set up to assist refugees from the Mozambique civil war in the 1980s. The refugees were repatriated when the war ended in Mozambique and the NGOs in Malawi transformed themselves from relief to development. One way to serve communities was by providing extension services using farmers or churches as conduits. Under these circumstances, the top-down extension system which was predominantly provided by the public sector was not suitable and the government introduced a new extension policy which promoted demand driven and pluralistic extension system (GoM, 2000). The main objectives of the policy were to encourage multiple players to complement the extension efforts of the government and to shift extension delivery from top-down to bottom-up delivery designed to respond to the needs of farmers on the ground. Pluralism was introduced in order to create a suitable environment for the participation of various extension providers including NGOs, farmer organizations (FOs) and the private sector in the provision of extension services. The principle of demand-driven extension services was introduced in accordance to the new political environment where people had various freedoms including freedom of choice, freedom of expression and freedom of association, while also responding to the diversity of needs that farmers were experiencing from a liberalised marketing system. Farmers had to be given the freedom to choose the type of extension services they wanted, especially considering also that they were operating in a liberalized marketing system where they made choices of the type of production systems according to market demands. Decentralized extension services were introduced to be in tandem with the decentralization process taking place where power was being devolved from the central level to lower levels closer to the farmer. Farmers had to have valued voices. The district agricultural extension services system Adoption of the policy was followed by the introduction of the District Agricultural Extension Services System (DAESS) in 2006 as a policy implementation guide (GoM, 2006). One of the major characteristics of DAESS was the establishment of district structures which included: the District Agriculture sub-Committee of the DA, the District Agricultural Extension Coordinating Committee (DAECC), the District Stakeholder Panel (DSP) and the Area Stakeholder Panel (ASP). The main functions of DAESS were fourfold, including: organizing farmer demands, organizing service providers‟ responses to
farmer demands, coordination of various stakeholders in extension service delivery and assisting the district assembly in sourcing funds for agricultural extension activities in the district. The composition, roles and responsibilities of the DAESS structures are briefly described. District agriculture sub-committee The District Agriculture Sub-committee is a sub-committee of the DA, composed of elected members of the assembly with the District Agricultural Development Officer (DADO) providing secretarial services. The committee is expected to receive and consolidate local agricultural development plans and submit them to the DA for approval. The committee is also expected to make policy recommendations to the DA regarding the governance and delivery of agricultural extension services in the district. The committee is further supposed to assist the DA in establishing local agricultural institutions for public participation, as well as assisting the DA in mobilizing resources for governance and agricultural development. The committee is supposed to ensure that there is equity in the provision of agricultural extension services in the district. Supervision, monitoring and evaluation of agricultural development activities in the district is supposed to be another key role of the sub-committee. District agricultural extension coordinating committee DAECC is a sub-committee of the DEC of the DA (GoM, 2006). The DAECC is composed of representatives of institutions that provide agricultural extension services including the office of the DADO, NGOs, private sector and farmer organizations. The overall responsibilities of the DAECC include: setting up standards for delivery of the services, developing codes of conduct and memorandum of understandings with stakeholders, registering service providers, planning agricultural extension services at district level, ensuring equity in service provision, coordinating provision of agricultural extension services at district level, harmonizing approaches in extension service provision and delivery and linking agriculture extension service providers and farmers to the DA among many others. District stakeholder panel DSP is a platform where farmers and extension service providers plan and coordinate their activities. It serves as a forum for dialogue between farmers and service providers where farmers are expected to present their

demands for extension services and the service providers plan on how to respond to such demands. It is supposed to be composed of representatives of various categories of farmers, farmer organizations and various agricultural and extension service providers at the district level. The DADO is expected to play a facilitating role in the DSP. Area stakeholder panel
The Area Stakeholder Panel (ASP) is a platform of farmers and stakeholders in agriculture development at traditional authority (TA) level. It is a sub-committee of the ADC with the sole purpose of linking the interests of farmers and those of the service providers. Members comprise representatives of different categories of farmers, farmer organizations and all actors in agricultural sector at area level. Some of the roles and responsibilities of the ASPs include; providing a forum for farmers to express their demands, consolidating and articulating farmer demands, ensuring that quality response is provided to farmer demands and coordinating agricultural development activities according to the demands coming from the communities.
According to the district agricultural extension services system implementation guide, the ASP is the lowest structure despite the fact that local government structures go as low as to the GVH level. Some extension workers have gone further to establish agricultural structures at lower level than the TA level. These include structures such as village agricultural committees (VACs) at GVH or VH levels as well as model villages at VH level. The study was therefore conducted in order to assess the effectiveness of DAESS in facilitating the provision of extension services in accordance to the demand-driven, pluralistic and decentralized extension policy to the smallholder farming communities in Kasungu, Mzimba and Rumphi districts. The establishment and implementation of DAESS has been problematic in some of the districts.
Study objectives
The main objectives of the study were to facilitate the establishment of the DAESS and assess its impact on provision of extension services. The specific objectives were as follows:
(1) To examine the status of implementation and performance of DAESS in promoting provision and delivery of extension services. (2) To establish DAESS structures at district and sub-district level in selected districts. (3) To operationalize DAESS structures at district and sub-district level in order to facilitate provision and delivery of extension services.
(4) To assess the effectiveness of DAESS structures in promoting the provision and delivery of extension services. METHODOLOGY The study was conducted using action research approach in Kasungu and Mzimba districts from April 2010 to December 2012 as part of an FAO/FICA project titled “Support to Agricultural Extension and Training Services Programme”. Additional data were collected through key informant interviews and focus group discussions in Rumphi district in July 2014. The action research involved community and contextual analysis, action planning, experimentation by implementing the action and evaluation of the activities implemented (Gausi, 2015; Hagmann et al., 1998). The rationale for using action research was to enable researchers to implement the actions whilst studying and learning the best practices for establishing effective District Agricultural Extension Services System. Community and contextual analysis Community and contextual analysis involved an ADD level meeting which was conducted by the researchers with staff from Kasungu and Mzuzu ADDs, Kasungu and Mzimba districts as well as staff from the four selected EPAs of Chipala and Kaluluma in Kasungu district and Emfeni and Luwerezi in Mzimba district as well as representatives from FAO/FICA project in April 2010. This meeting was conducted in order to identify the needs and problems associated with the implementation of the DAESS. The meeting discussed whether DAESS structures were established in the two districts and whether they were implementing the district agricultural extension services system. The meeting proposed to pilot-test the extension model in two EPAs in Kasungu district and two EPAs in Mzimba district. This was followed by action planning as described subsequently. Action planning The needs and problems identified in the meeting were validated and action plans were developed during stakeholder workshops which were conducted in Kasungu and Mzimba districts in June 2010. The people who participated in the workshops included representatives from the Ministry of Local Government, the Department of Agricultural Extension Services, local government and agricultural staff in the two districts, the NGOs as well as staff from other departments, local leaders and farmer representatives in the districts. A total of 46 people comprising 26 men and 20 women participated in the Kasungu District workshop and 37 people comprising 21 men and 16 women participated in the Mzimba District workshop. Experimentation and implementation The major activities which were conducted to implement the action plans were in the form of meetings at Area, Group and Village levels in the four selected EPAs (Table 1). The meetings were conducted with agricultural stakeholders, local leaders, and influential farmers. The meetings were conducted with the assistance of four Field Assistants, who were recruited and sent in the four EPAs for a period of one and half years to facilitate the implementation of the action plan. The meetings helped to establish the structures at the area level, GVH level and VH level through fact

Table 1. Meetings conducted to operationalize implementation of the DAESS system in Chipala, Emfeni, Kaluluma and Luwerezi EPAs.
Type of meeting Number of meetings Number of participants
Female Male Total
Area level 11 718 960 1,778
GVH level 126 1832 2066 3,898
Village level 901 8445 14440 22,885
Total 1038 10995 17466 28561
finding and sensitisation as well as follow ups.
The meetings were conducted in order to assess the existence of DAESS structures, encourage farming communities and their community leaders to establish the structures where they did not exist, elect leaders for the DAESS structures as well as to train and orient them of their roles and responsibilities in the DAESS structures. Follow up visits were also conducted to ensure planned activities for the DAESS structures were being implemented. The experiences drawn from the implementation of the activities were shared with staff and farmers including ASP committee members in 11 focus group discussions (FGD) in the four EPAs. Assessment of effectiveness of the structures Effectiveness of the methodology used to operationalize the DAESS structures was assessed using focus group discussions and key informant interviews (KII). The FGDs and KIIs were conducted in two phases. A total of 11 FGDs and 19 KIIs were conducted in the first phase in 2012 and 2013. These FGDs and KIIs were conducted in the four EPAs where activities to establish and operationalise the DAESS were carried out (Chipala and Kaluluma EPAs in Kasungu District as well as Emfeni and Luwerezi EPAs in Mzimba District). The participants in the FGDs included extension staff, ASP committee members and some farmers while participants in the KIIs were District Commissioners (DC) in the two districts, Directors of Planning Development (DPD), DADOs, TAs and Agricultural Extension Development Coordinators (AEDCs). Additional data was collected through phase two of FGDs and KIIs which were conducted from 13th to 21st July 2014 in Kasungu, Mzimba and Rumphi districts. Rumphi District was included in this phase because reports on DAESS showed that Rumphi was one of the districts which was very successful in establishing functional DAESS structures. The consultations were conducted with DADOs, and the district Farmers Union of Malawi (FUM) facilitators in each of the three districts, 12 district agricultural staff, 13 district farmers union leaders and district stakeholder panel members at district level. Similar consultations were conducted in one EPA in each of the three districts. The consultations at the EPA level were conducted with agricultural staff, farmers union leaders as well as ASP members. The selected EPAs were Mhuju in Rumphi District, Manyamula in Mzimba District and Chulu in Kasungu district. Consultations were also conducted with senior staff at the Department of Agricultural Extension Services (DAES).
STUDY FINDINGS
Ten year experiences in the implementation of DAESS
The consultations revealed that there was a general
agreement that DAESS is a good system for the implementation of agricultural extension services in Malawi. DAESS is a system which fits very well under the decentralization system as described in the decentralization policy and Local Government Act of 1998. DAESS provides a system of structures through which various extension approaches and methods can be implemented by various service providers in accordance to farmer demands. Using DAESS, implementation of extension activities by various service providers can be complimentary, harmonized, well coordinated and monitored.
However, the consultation meeting at ADD level and the district stakeholder workshops revealed that most of the Local Government structures existed at the district level while DAESS structures did not. Table 2 shows the status of Local Government and DAESS structures that existed in the two districts at the beginning of the study in 2010.
According to Table 2, Local Government structures which included the district development committee (DDC), DEC, ADC and VDC existed before implementation of the study and the status remained the same after the study. Similarly DAECC existed as a DAESS structure at district level in both districts before and after the study. However, DA and district agriculture sub-committees did not exist in the districts due to the fact that these structures were supposed to be composed of ward councillors who were not yet elected by the time of the study. DAESS structures which included DSPs and ASPs did not exist. Despite the fact that the DAECC structure existed, it was not fully operational in either of the two districts. DAECC as a structure was expected to plan and coordinate agricultural extension services; ensure equity in service provision; receive and provide feedback on service delivery; monitor and evaluate delivery of extension services; among many others. These functions were not being implemented in the two districts. Consultations at the level of the Department of Agricultural Extension Services (DAES) revealed that the observations made in the two districts were a common scenario in most of the districts in the country. Most of the districts did not have DSPs and ASPs while DAECC was a structure which was commonly found. The consultations also confirmed the fact that despite its

Table 2. Existence Local Government and DAESS Structures at District Level before and after Implementing the Study in Kasungu and Mzimba Districts.
Type of structure
Name of structure
Kasungu district Mzimba district Total
Before study
After study
Before study
After study
Before study
After study
Local government structures
DA 0 0 0 0 0 0
District Agriculture sub-committee 0 0 0 0 0 0
DDC 1 1 1 1 2 2
DEC 1 1 1 1 2 2
ADC 7 7 2 2 9 9
VDC 71 80 38 46 109 126
DAESS structures
DAECC 1 1 1 1 2 2
DSP 0 0 0 0 0 0
ASP 0 7 0 4 0 11
Source: Kasungu and Mzimba District Agricultural Offices, January 2012.
existence, DAECC was not fully operational in most districts.
The major challenge was that there was limited knowledge among stakeholders regarding the concept of DAESS. Results of the key informant interviews and focus group discussions revealed that most of the stakeholders including agriculture staff from the government, local government staff, private extension service providers including NGOs as well as farmers did not have adequate understanding of the concept of DAESS. Most stakeholders did not understand the system because they were not adequately sensitized. Most of the people consulted felt that most of the agricultural staff at district and field level did not have the technical know-how to guide the implementation of DAESS system. Instead of helping communities to establish the DAESS structures and encouraging them to establish forums which they can be using for expressing their demands, they continued to operate using the top-down approach. It was even reported that some field staff had stopped working with farmers arguing that they were waiting for farmers to come and demand services from them creating a situation where extension services became less readily available to farming communities.
Staff from the other departments of the Ministry of Agriculture thought that DAESS was a concept to be used by the Department of Agriculture Extension Services only. In other words, their perception was that DAESS was a DAES baby. They did not have adequate understanding of the role of DAESS neither did they attach any ownership to it. With this kind of conception, the other technical departments of the Ministry such as Animal Health and Livestock Development, Land Resources Conservation, or Crops tended to take their technical messages straight to farmers without using the established DAESS structures. This kind of perception was also common among other extension service
providers including private companies, farmer organizations and NGOs. The result was the delivery of messages that were not properly harmonized and coordinated and sometimes messages that conflicted with one another thereby confusing farmers. It was not uncommon to find two contradicting messages brought to the same farmer by two departments of the Ministry. One common example cited by the key informants was a message on conservation agriculture by the Department of Land Resources which encouraged farmers to use maize stalks for mulching while the Department of Animal Health and Livestock Development encouraged farmers to use the same stalks for animal feed and fodder. Such conflicting messages ended up confusing farmers.
On the other hand, Local Government staff and other stakeholders in the local government system perceived DAESS structures as having competing roles and responsibilities with those of local government structures. Farmers on the other hand did not understand the agricultural extension policy especially the principle of demand driven services. Most of the farmers did not demand such services because they did not know that they were supposed to do when in need of extension services. The other challenge was that whenever farmers had expressed their demands, appropriate responses for such demand were not being provided. This was further compounded by the lack of DAESS structures at the group village and village levels through which farmers could express their demands. The ASP covers a very wide area and most farmers were not able to access its services. In response to this and as part of the experimentation and implementation of activities in the research study, it was decided to introduce DAESS structures at the GVH and VH levels in the form of group village stakeholder panel (GVSPs) and village stakeholder panels (VSPs) Table 3. Apparently the focus group discussions and key informant interviews which

Table 3. Number of DAESS structures established at EPA level before and after implementation of action research.
Level Number of sensitization
meetings conducted Type of structure
Number of structures established before meetings
Number of structures established after meetings
TA (Area) 11 ASPs 0 11
GVH 126 GVSPs 0 126
VH 901 VSPs 0 834
VH 901 Model villages 19 67
were conducted in 2014 revealed that some EPA had started establishing village agricultural committees (VACs) and group village agricultural committees (GVACs) which played the same roles as the VSPs and GVSPs at village and group village levels respectively. Another structure promoted in the study was model villages. Model villages are villages with improved livelihoods of the people achieved through implementation of integrated interventions.
The results of the action research showed that sensitization meetings with various stakeholders including farmers supported with follow ups were very effective in promoting establishment of DAESS structures and generation of demands from farmers. Table 3 shows the number of structures established after conducting some sensitization meetings.
The sensitization meetings helped farmers and the rest of the rural communities to appreciate the importance of establishing the DAESS structures as well as to understand their roles and responsibilities. The perception that the roles and responsibilities of DAESS structures conflicted with those of local government structures was corrected by clarifying that DAESS structures were sub-committees of the local government structures aimed at promoting agricultural development which is part and parcel of the of the whole rural development process. The DAESS structures also offered an opportunity for collaboration and networking between different agricultural extension service providers. The need for more sensitization on DAESS was further emphasized by most of the stakeholders consulted through KII who indicated that most stakeholders did not have adequate understanding of the DAESS concept. A critical analysis of the responses obtained from the various stakeholders during the consultations reveals their lack of knowledge of the functions of the stakeholder panels. Apart from Rumphi where specific examples of farmer demands were cited, the other two districts were not able to do the same. When asked to provide suggestions for improving the activities of the stakeholder panels, the respondents emphasized the need for more training and sensitization on DAESS concept. Both the staff and leaders in Kasungu and Mzimba districts did not feel confident to implement DAESS activities and therefore demanded more training.
The establishment of structures at village and group
village level such as VACs or VSPs, model villages and GVACs or GVSPs was very essential because it created forums which were in close proximity and therefore readily accessible to farmers. This allowed farmers to participate in activities at such forums and this resulted in generation of farmer demands as shown in Table 4. The study demonstrated that sensitization meetings as well as creation of DAESS structures at area, group village and village levels helped to encourage farmers to start demanding for services (Table 4). Villages are the naturally and traditionally existing institutions in the Malawian agrarian communities and they are in most cases composed of blood and marriage relations. Members of the village are therefore more likely to have many things in common and therefore likely to be more willing to work together and support each other knowing that whatever benefits accrue from their working together are going to benefit them as blood relations. DAESS structures at the village level are therefore more effective in the implementation of agricultural extension activities.
Most respondents consulted at both the district level and DAES also expressed the need to establish a national stakeholder panel. They indicated that most of the extension service providers who operate at district or lower levels get their mandates from their headquarter offices at national level. Most of the activities they implement are planned at the national level offices and it is difficult to change such plans at the district level. This creates problems when the priorities identified through DAESS structures at district or lower levels differ from the priorities of the national level offices of the service providers. A national stakeholder panel where central offices of the service providers are represented would help to create an environment where the role of DAESS structures would be more appreciated. The national stakeholder panel would be a good forum for discussing priorities of both the DAESS structures and the central offices thereby providing good opportunity for harmonizing such priorities.
Table 4 also shows that farmers‟ demands were very diverse ranging from demands for services, such as credit and training, to demands for actual products, such as planting materials for various crops, livestock species and breeds as well as irrigation equipment. Nine of the sixteen types of demands made were responded to by various types of service providers. These ranged from

Table 4. Types of demands generated from farmers through the DAESS structures at area, group village and village levels
Types of demands generated by farmers
Whether responses to the demands were provided
Types of responses provided
Types of service providers that provided the responses
Chalimbana groundnut seeds Yes Provision of seed FAO/FICA Project, WVI, Plan International
Soya bean seeds Yes Provision of seed FAO/FICA Project, WVI, Plan International
Bean seeds No NA NA
Hybrid maize seed Yes Provision of seed FAO/FICA Project, WVI, Plan International
Improved cassava cultivars No NA NA
Potato seed No NA NA
Improved poultry breeds (both layers and broilers)
Yes Soft loans COYIDA
Improved Goat breeds No NA NA
Sheep No NA NA
Large white, pigs Yes Provision FAO/FICA Project, WVI, Plan International
Fish farming No NA NA
Treadle pumps Yes Provision of treadle pumps
FAO/FICA Project
Training on goat sheep and pig management (housing, record keeping, parasite and disease control)
Yes Training DAES and SSLPP
Training on how to use and maintain treadle pumps
Yes Training FAO/FICA Project
Training on chicken rearing No NA NA
Training on pond construction and fish feeding practices
Yes Training DAES and WVI
DAES which is a government department; non-governmental organizations which included
World Vision International (WVI), Plan International, Community Youth in Development Activities (COYIDA), Small Scale Livestock Promotion Programme (SSLPP) as well as a project implemented by the Food and Agricultural Organization (FAO) with support from the Flanders International Cooperation Agency (FICA).
Seven other demands could not be responded to by the service providers that existed at the time of the study. This demonstrates the value of involving many different service providers and the need for the service providers to be properly coordinated together in order to satisfy the diverse types of demands that farmers have in their communities. DAESS is a system which provides a good forum for such coordination.

The demand for planting materials and improved livestock breeds was expressed several times among the farming communities as shown in Table 4. Usage of high quality, improved seeds and livestock breeds has a very big impact on agricultural development. Malawi does not have a very good seed system for its crop and livestock sector. The formal seed sector is mostly engaged in producing and marketing seeds for hybrid crops such as maize. Planting materials for open pollinated crops such as legumes and tubers are mostly neglected and this creates a serious shortage of such seeds in the country. The problem is also very serious in the livestock sector where there is shortage of organized breeding programmes for most of the livestock species. This is the major reason for the high demand for such materials among the farmers consulted.
It was however noted that most of the farmers demanded inputs or physical items rather than actual extension services such as demonstrations, meetings, field days, etc. The only specific services demanded were for training associated with expected inputs and physical structures. This scenario is similar to the local government experiences where local communities tend to always demand physical structures such as school blocks, teachers houses and bridges. They rarely demand actual services such as health delivery or education delivery. In their eyes, development is mostly in terms of physical assets which they can see physically and not services. CONCLUSION AND RECOMMENDATIONS Well organized and effective agricultural extension services are a must for sustainable agricultural growth and development to be achieved. Such extension services usually constitute a number of approaches and methodologies provided according to the needs in particular situations. The extension services need to be provided under a particular extension system in order to ensure that they are properly managed and coordinated. Malawi has since the advent of multiparty politics chosen to follow an extension system which allows bottom up approaches where many service providers provide services in a decentralized system of governance after trying several top-down systems and approaches which were dominated by public service provision. In tandem with the multiparty democracy where emphasis is on giving power to the people, the extension services are demand-driven. Pluralistic, demand-driven and decentralized extension services need to be harmonized, standardized, properly coordinated and managed under a well defined system if the quality of such services is not to be compromised. DAESS is a system which is designed to promote harmonization, standardization, coordination and quality control of the agricultural extension and advisory services in Malawi. The results of
this study show that the system is effective but needs to be enhanced by formalizing the creation of additional structures at the village, group village and national level. The study has revealed the need to train and sensitize stakeholders in order to appreciate the system as well as to establish and start using it.
It is therefore recommended that the DAESS guideline be revised to include village, group village and national level structures. There is also need to provide additional and adequate sensitization on DAESS over and above the sensitization conducted when the system was first introduced. Sensitization sessions will help the stakeholders to understand the system and encourage them to use the system which will lead to the provision of well organized and effective extension services in the country. Conflict of Interests
The authors have not declared any conflict of interests. ACKNOWLEDGEMENTS
This work was made possible through the financial support from the Flanders International Cooperation Agency through “Support to Agricultural Extension and Training Services Programme (SAETS)” as well as “Integrating and Strengthening Capacity of Farmers into District Stakeholder Panels for Improved Agricultural Extension Service Delivery in Malawi”. REFERENCES Amin AH, Stewart BR (1994). Training and visit extension program
outcomes in Ninia Governorate. Egypt. J. Agric. Edu. 35(3):30-34. Anderson JR, Feder G, Ganguly S (2006). The rise and Fall of Training
and Visit Extension: An Asian Mini-drama with an African Epilogue. World Bank Policy Research Working Paper 3928. World Bank, Washington D.C. Available at https://openknowledge.worldbank.org/
Benor D, Baxter M (1984). Training and Visit System. World Bank, Washington D. C., U.S.A.
Chasukwa M, Chiweza AL, Chikapa-Jamali C (2014). Public Participation in Local Councils in Malawi in the Absence of Local Elected Representatives – Political Eliticism or Pluralism? J. Asian Afr. Stud. 49(6):705-720.
Davis KEW (2008). Extension in Sub-Saharan Africa: Overview and Assessment of Past and Current Models, and Future Prospects. J. Int. Agric. Ext. Edu. 15(3).
Gausi W (2015). Establishment of District Agricultural Extension Services System Structures in Selected Extension Planning Areas in Kasungu and Mzimba Districts. MSc Thesis, University of Malawi, Bunda College of Agriculture. Lilongwe, Malawi.
Government of Malawi (1998a). Local Government Act. Lilongwe, Malawi.
Government of Malawi (1998b). Malawi Decentralisation Policy. Lilongwe, Malawi.
GoM (Government of Malawi) (2000). Agricultural Extension in the New Millennium: Towards Pluralistic and Demand–driven Services, Policy Document. Ministry of Agriculture and Irrigation. Lilongwe, Malawi.
GoM (Government of Malawi) (2006). The District Agricultural Extension
Services System: Implementation Guide. Ministry of Agriculture and Food Security, Lilongwe, Malawi.
Hagmann J, Chuma E, Conolly M, Murwira K (1998). Client-Driven and Institutional Reform in Agricultural Extension: an Action Learning Experience from Zimbabwe. AgRen Network Paper No 78, Overseas Development Institute, London. Available at: http://www.fao.org/docrep/003/x7925M14.htm [accessed on 17/11/2015]
Heemskerk W, Davis K (2012). Pluralistic Extension Systems. In Agricultural Innovation Systems: An Investment Source Book. World Bank, Washington D.C., U.S.A.
Hussain SS, Byerlee D, Heisey PW (1994). Impacts of the training and visit system on farmers‟ knowledge and adoption of technology: Evidence from Pakistan. Agricultural Economics 10: 39 -47. Available at: ageconsearch.umn.edu/bitstream/173303/2/agec1994v010i001a004pdf [accessed on 9/05/2016]
Ilevbaoje IE (2004). Training and Visit System Flourishes in Nigeria. BerataInnen News 1/2004. Available at: www.ibs.ch/fileadmin/10_international/PDF/RDN/RDN/BN_1.04. [accessed on 9/05/16]
Masangano C, Mthinda C (2012). Pluralistic Extension System in Malawi. IPFRI Discussion paper 01171. International Food Policy Research Institute, Eastern and Sourthen African Regional Office.
Minh TT, Friederichsen R, Neef A, Hoffmann V (2014). Niche Action and System Harmonization for Institutional Change: Prospects for Demand-driven Agricultural Extension in Vietnam. J. Rural Stud. 36:273-284.
Mkandawire RM (1987). Extension and Peasantry: inroads on Master Farmers Systems to Block System approach: a search for appropriate strategy. J. Ext. Syst. 3(2):42-47.
Oladele O (2011). Features of Agricultural Extension Models and Policy
in Selected Sub-Saharan Africa Countries. J. Agric. Environ. Int. Dev. 105(1):35-44
Osborne D, Gaebler T (1992). Reinventing Government:How the Entrepreneurial Spirit is Transforming the Public Sector. New York: Penguin Group.
Ostrom V (1973). The Intellectual Crisis in American Public Administration. Alabama: Alabama University Press.
Swanson BE, Samy MM (2002). Decentralisation of Agricultural Extension Systems: Key Elements for Success. University of Illinois, Urbana-Champaign, Illinois USA.
Tambulasi RIC (2010). Reforming the Malawian Public Sector: Retrospectives and Prospectives, Dakar: CODESRIA.
Uzunlu V (1990). Assessing the impact of extension training and visit system on the transfer of wheat technology to farmers in Ankara, Turkey. Retrospective theses and dissertations. Paper 16947. Available at:http://lib.dr.iastate.edu/rtd [accessed on 10/5/16]
Wongtschowski M, Belt J, Heemskerk W, Kahan D (2013). The Business of Agricultural Business Services: Working with Smallholders in Africa. Royal Tropical Institute, Food and Agricultural Organisation and Agri-ProFocus, Netherlands.
World Bank (2000). Decentralising Agricultural Extension: Lessons for Good Practice. Agricultural Knowledge & Information Systems (AKIS), Washington DC. USA.
Zwane E, Chauke PK (2015). The Influence of Extension Policy in Extension Deliverables in the Agricultural Sector With Reference to the Sub-Saharan Africa. Int. J. Agric. Ext. 03(2):93 -100.

Vol.8(12), pp. 250-257, December 2016
DOI: 10.5897/JAERD2015.0695
Articles Number: 46CA52E61689
ISSN 2141-2170
Copyright ©2016
Author(s) retain the copyright of this article
http://www.academicjournals.org/JAERD
Journal of Agricultural Extension and Rural Development
Full Length Research Paper
Informal transfer of information among vegetable growers in Khartoum State, Sudan
Osman A. Badri
School of Rural Extension, Education and Development, Ahfad University for Women, Omdurman, Khartoum State, The Republic of Sudan.
Received 14 April, 2015; Accepted 11 August, 2015.
Informal transfer of information among vegetable growers in Khartoum State, Sudan was investigated through a cross-sectional survey with 120 growers from six typical vegetable production villages (20 growers from each each) in peri-urban Omdurman (2 villages) and Eastern Nile locality (4 villages). The focus was on inventor growers (72, 60%) employing their information, skills and experience exchange to improve and develop their production. Growers from each village were selected following the systematic random sampling technique on geographical basis. Field data was collected using questionnaires in face to face interviews for literacy reasons, in depth interviews and group discussions. Extension workers and researchers took part in the group discussions. The results showed that most of the growers (85%) had contacts with one or more other growers in a personal level. Most of them did not receive any extension information from the officials entrusted with this task. This led growers to develop their own system of information exchange. Vegetable production skills were learnt mostly from family members (81%) and they do not trust information delivered by extension. Growers mostly (90%) made consultation with other growers on their inventions. Cooperation between growers in minimal due to lack of time and communication. The majority of the inventor-growers did not transfer their own inventions to others. Key Words: Vegetables production in Khartoum State, technology, techniques and practices, information transfer, grower' inventions, communication and skills learning, cooperation and consultation.
INTRODUCTION Information in any agricultural system is one of the important components for solving problems and meeting needs of farmers. Farmers usually are in continuous search for new information from any source. This is related to confidence, long practical experience and knowledgeable farmers. The Sudanese grower proved to
be receptive and would utilize new information from research if properly presented to him. Further, he succeeded in overcoming major production problems with little or no help from research or any public services (Geneif, 1987).
This paper investigates the transfer and information
*E-mail: [email protected].
Author(s) agree that this article remain permanently open access under the terms of the Creative Commons Attribution
License 4.0 International License

exchange for improving vegetables' diffusion and adoption by growers and their craftsmanship. Learning is a focal issue. So this necessitates identifying and expanding the set mechanism of determinant information diffusion and adoption among farmers (Jones, 1992).
Vegetable production in Sudan has increased over the last twenty years. In 2008, vegetables were grown on more than 330,000 ha. Vegetables and fruit production comprises more than 12% of the total agricultural output compared to 21% contributed by grains, 15% by cotton and 9% by oil seeds in Sudan (Ahmed et al., 2013). Lack of introduction of more advanced agricultural technology, absence of research and extension services, marketing bottlenecks are characteristic features of this sector (Khalid, 2013). Problem statement Vegetable production has received little attention by the policy makers in Sudan. The growers have not received new information, advice and technology from the public institutions entrusted with this task. The high cost and availability of inputs have negative effect on profitability of production. In such a situation the growers have had no alternative but to depend on their own efforts to improve their production systems in a profitable way.
The role growers have played in their development has been ignored (GTZ, 1986). The agricultural research and extension policy do not consider the value of the farmers own informal system of technology transfer as useful means to overcome their production problems and have not been recognized and were completely ignored. On the other hand, social scientists did not conduct an in depth study how farmers do experiments, exchange information, techniques, practices and dissemination technology.
Richards offered a concrete suggestion for new ways of establishing a connection between farmer experiments and scientific experiments (Maat, 2015). The changes in English agriculture grouped by historians under the heading the agricultural revolution was brought about by farmers not scientists. If anything, the agricultural revolution stimulated the development of agricultural science, not other Way round (Richards, 1985). Agricultural systems were developed historically largely through the efforts of farmers and landowners (Garforth, 1987)
The agricultural sector in Sudan has deteriorated considerably during the last ten years'. Among the major reasons behind this deterioration were: Lack of sound programs and policies, lack of introduction of improved technological innovations, weak linkage between researchers and extension, high cost of production and low marketing prices (Ministry of Finance, 1998). Vegetable production is an important economic activity for growers in Khartoum State. It is a major source of
Badri 251 income and profit for many people. A dominant commercial attitude of the vegetable and fruit growers is reflected in their strongly money and profit oriented behavior (Geneif, 1987). The vegetable growers in Khartoum State achieve relatively low and falling yields which are generally very low compared to the existing potential (GTZ, 1986).
Production of vegetables in Khartoum State is faced by problems which include inadequate capital, shortage and high cost of inputs and skilled labor, weak formal research and development, fragmentation of land due to inheritance problems, lack of storage facilities, inefficient use of available resources and loss of profit to merchants and middlemen (Ministry of Agriculture, 1998; Badri, 1996; GTZ, 1986; 1987; Geneif, 1986). Further, the Sudanese grower proved to be receptive and would utilize new information from research if properly presented to him; he succeeded in overcoming major production problems with little or no help from research or any public services (Geneif, 1987). Despite this, the applied research done so far is not sufficient to formulate reliable extension recommendations for the growers.
Successful vegetable production requires a constantly changing mix of information (T Tq P) and inputs for the continuous changes facing this type of intensive commercialized production. The formal R&D services are not aware of the growers' own developed exchange of information and (T Tq P). This is the result of a weak linkage.
Very little is known about the mechanism of invention exchange and transfer of information among vegetable growers in Khartoum State. Therefore, the main objectives of this paper were to:
1. Explore the mechanisms that vegetable growers in Khartoum State follow in developing and disseminating their own invented T Tq P. 2. Explore whether the vegetable growers in Khartoum State do experiments, made useful contacts with other growers and the methods developed to exchange ideas and information to improve their production. 3. Identify the characteristics that affect growers' capacity in the exchange of information.
MATERIALS AND METHODS This study followed the cross-sectional survey design targeting vegetable growers in the six villages in Khartoum State (Four villages from the Eastern Nile Locality and two from Omdurman Locality). The six villages were selected purposively because they are typical and prominent vegetable production areas.
The study followed the systematic random sampling technique on geographical basis by selecting the first of each three growers along a survey line drawn on the field area until 20 growers were selected from each village.
The study opted to this procedure as it was difficult to access or creates a sampling frame. Further, the homogeneity in the targeted growers/villages encouraged using this procedure of sampling technique. Hence the study ended with a total sample of 120

252 J. Agric. Ext. Rural Dev. growers (20 from each of the six selected villages).
Filed data was collected through interview schedules (questionnaires) in face to face interview with the respondents, observation, in depth interviews and discussions with prominent typical growers, researchers, extension agents and the director of the Department of Horticulture/State Ministry of Agriculture. Researchers, extension agents and officials of the Ministry of Agriculture were not part of the primary sample from which field data was collected. They instead took part in the in depth group discussion as to enrich the information and avail opportunities to growers to explain their point of view. The interview schedule (questionnaire) was filled in face to face interviews technique for literacy reasons. It mainly concentrated on the major following issues: 1. Invention in vegetable production, 2. Transfer of information and T Tq P, 3. Consultation regarding vegetable production, 4. Cooperation in the inventions development process. Field data was descriptively analyzed to produce frequency and percentage tables. The study limitation The reliability of the study depends on the accuracy of the information provided by the growers, and in turn this is dependent on their memories: they kept no relevant written materials. The lack of information about the number and kinds of growers in all the villages, and their addresses, made it difficult to obtain a sampling frame. Hence the study was based on purposively selected vegetable production villages. As a result of the experience of the long time needed to accurately complete the interview schedule during the pre-test, the research was limited to 120 grower respondents.
Some of the respondents were reluctant to give information about their latest developed (T Tq P), and would only provide information about the practices developed. This is attributed to the intended benefits that would result from these inventions before they spread to the other growers. Their information was subject to a type of competition.
Although the growers' inventors (Gis) covered most aspects of vegetable production they included no post harvest technology. This may have been due to the high perishable nature of vegetables, the lack of storage facilities and the need for immediate cash acting to accelerate sales. It is also that the production phase was more amenable to invention than was marketing.
Finally, these inventions have increased the growers, exchange of basic information basic and knowledge available to develop other inventions, and so added to the stock of indigenous knowledge: as knowledge is both a product and a consumable in the process of invention and transfer of information.
RESULTS AND DISCUSSION
From the 120 growers only 72 (60%) were inventors upon whom the results and discussion will be based (Table 1). Amongst the inventor growers, only 30 (42%) had contacts with other vegetable growers as their one source of information, 38 (53%) had two contacts, with vegetable growers and extension workers or other officials, one grower had made three such contacts. The
growers who had no contacts at all with peer growers, extension workers or other officials regarding vegetable production accounted for 3 (4%) of the 72 inventors. All the contacts were stated to be personal: in this community contacts with other growers were only personal. This was- and is an important method of communication. Informal personal communication took place at social occasions when social networks could be used to exchange knowledge.
Vegetable production is a common concern shared by the growers in the villages under study, and presumably information about the problems encountered and the results of previous seasons were shared and ideas and plans for the coming season were discussed. The relationships through which the vegetable production idea was based on interpersonal contacts of informal information with trusted and experience peer growers.
The growers did raise and discuss with extension agents only problems related to chemical fertilizers and insecticides. They seemed to distinguish between sources of information and advice on the basis of who is good at what. The reason they stated was that the extension workers perceived these inventions to be 'wrong' and 'not useful' and were 'not scientific'. The growers, however, believed in practical results, the experience and information are exchanged with peer growers more than the recommendations of science. This seemed to give them confidence to proceed, and an assurance that reduced the chance of error and risk to the minimum. Hence, the growers had a high degree of confidence in the exchange of information with a limited number of peer growers, which was the basis for help with their decisions.
As source of information is concerned, 26 (36%) of the total 72 inventors had contacts with other vegetable growers (Table 2). Contacts with extension workers were reported by 3 (4%). Contacts with both vegetable growers and extension workers were counted for 35 (49%), while 3 (4%) were conducted with researchers and 2 (3%) with academicians. Those who had made no contact with any source were 3 (4%). The 35 joint contacts made with both vegetable growers and extension workers, involved extension workers on matters only concerning the purchase of improved/ imported seeds, chemical, fertilizer and insecticides. All together 61 (85%) respondents had contacts with other vegetable growers for the purpose of exchanging experience and gaining new information and ideas.
These helped their inventing and innovating to improve their production. The growers who had been visited by extension workers represent 35 (49%), and 37 (51%) were not visited during and prior to the fieldwork. However, the 35 visited said that these visits were not useful in any way (Table 3). It was the quality of the discussion of their problems with other vegetable growers, which had mattered.
In particular, problem identification and information,

Badri 253
Table 1. Total respondents by inventors and non-inventors.
Categories Frequency Percentage
Inventors 72 60
Non-Inventors 48 40
Total 120 100
Table 2. Frequency distribution and percentage of inventor growers by number of contacts.
Categories Frequency Percentage
1 contact 30 42
2 contacts 41 57
3 contacts 1 1
Total 72 100
Table 3. Frequency distribution and percentage of inventor growers by extension visits.
Categories Frequency Percentage
Visited 35 49
Not visited 37 51
Total 72 100
Table 4. Frequency distribution and percentage of inventor growers by source of information.
Categories Frequency Percentage
vegetable growers 26 36
Extension workers 3 4
Extension workers+vegetable growers 35 49
Researchers and academicians 5 7
No contacts 3 4
Total 72 100
which had directly contributed to the formulation of an idea, were most valued.
Growers mentioned that they had enough experience and were able to handle and manage their own production; they were more experienced and knowledgeable than the others; that everyone was "minding his own business"; and that their production problems and opportunities were of concern to no other person. One of the growers mentioned that he had better experience and more knowledge than the extension workers and the other educated in this field and he could teach them. The extension agent who was present did not comment. The responses indicate that the growers were proud of their knowledge, experience, exchange of
information, consultation with other peer growers which they considered superior to that of the extension agents. Only 5 (7%) growers had sought an opportunity to verify the steps they were going to follow (Table 4), or to obtain new information, 3 (4%) did so from researchers and 2 (3%) from academicians with whom they had family relations or other good relationships. The verification was for the purpose of avoiding any mistakes and risk that may occur, which leads to crop failure hence no income.
The use of local agricultural information, knowledge, experience, experimentation and husbandry skills accumulate initiatives of rural people in a specific location and over time, to develop their production systems. These initiatives cover a range of purposes, including

254 J. Agric. Ext. Rural Dev.
Table 5. Frequency distribution and percentage of inventor growers by source of learning vegetable production skills
Categories Frequency Percentage
Father and family members 63 88
Other vegetable growers 3 4
Own Observation 6 8
Total 72 100
Members
42%
Non-members
58%
Members Non-members
Figure 1. Membership of inventor growers in local organizations.
facilitating decision-making, adding to knowledge and enabling new information (T Tq P) and better practices to be developed. For different reasons, important available advice regarding cropping practice and plant protection are not widely covered to growers by the public agricultural services (Geneif, 1987). Learning skills Table 5 shows that the assumed sources of information and learnt vegetable growing skills were from father or close family members which represents most of the cases, while for marginal portions it was from other
vegetable growers, or from own observation and practical experience of work. Consultation and exchange of information with other growers contributed much to the ways decisions were taken in managing the production of their own holdings. Dissemination of the innovations Members of a local farmers' union were 30 (41.7%) of the inventors (Figure 1). The rest were not involved in membership of any local organization, they were sure that these organizations were not effective. Participation in active, local organizations can help to provide the

Badri 255
Table 6. Frequency distribution and percentage of inventor growers by consultation with others.
Categories Frequency Percentage
Minimal consultation 65 90.3
Full consultation 7 9.7
Total 72 100
Table 7. Frequency distribution and percentage of inventor growers by reasons for not cooperating with others in Implementing Inventions.
Categories Frequency Percentage
Short season, commitments 58 80.6
Variation in problems and needs 8 11.1
Competition reasons 6 8.3
Total 72 100
grower with new information and ideas, and keep him abreast of information about the latest technology and practices in vegetable production. This includes source of inputs at affordable prices. The transfer of something new (T Tq P) or information about it, from those who possess it to those who do not constitutes a process of inventive diffusion. It is a special type of communication.
Further, a grower who provides another grower with information about a new (T Tq P) is an important agent of change. We are concerned here with information about an invention which is disseminated by the grower who invented it. When information was disseminated, it was generally accepted and adopted by other growers since it solved a problem, and was relevant and suited the grower's knowledge, skills, budget and production conditions as mentioned by the growers in all the six villages during the field survey.
Inventors who made minimal consultation were 65 (90.3%), and had not engaged in much discussion of their inventive production activities with others (Table 6). Only 7 (9.7%), were largely dependent on the consultation they had made with others. This is despite the fact that the act of consultation with others, especially peer growers, is a characteristic which may influence the growers’ inventiveness. They were experimenters, enjoy high skills, confident and have been practicing vegetable production since they were at primary school.
Level of education was positively linked to the transfer of the growers’ information and their own inventions. All the inventors who transferred their inventions to others had a relatively higher level of formal education. The illiterate inventors were less willing to share their information and inventions. However, the inventors who transferred their own inventions accounted for 39% of the total 72 inventors. There was obviously some reluctance
to inform peer growers about their own inventions. This seemed to be for competition reasons, and to avoid responsibility for negative outcomes if the invention was less useful to other growers. Cooperation in developing new inventions Cooperation for the purpose of this section is defined as collaboration between the inventors in the processes of formulating testable ideas, experimenting and developing the invention. The simple exchange of information, or obtaining information from peer growers about production, is not considered as part of collaboration.
The vegetable growers gave no evidence of cooperating or exchange of information in developing new (T Tq P). Invention was an individual process. The growers worked alone from the stage of idea formulation to implementation. This finding is somewhat surprising. However, all the inventors responded negatively when asked if they had cooperated with any other grower in the actual development process and implementation of any of their own inventions. The reason for this, given by 58 (80.6%) inventors was because the growing season was very short and each grower was busy with his own work. They also considered that each individual knew his own holding and the conditions in which invention was practical, while 8 (11%) respondents stressed the different problems encountered and opportunities to be met, in relation to the different vegetable crops and cultural practices employed.
Only 6 (8%) respondents mentioned that they did not like the other growers to know or copy what they were doing, and emphasized the competition which exists (Table 7). It also became clear in informal group

256 J. Agric. Ext. Rural Dev.
Table 8. Frequency distribution and percentage of grower-inventors by reasons for not diffusing their own inventions (n=45).
Categories Frequency Percentage
Short season, commitments 25 56
Variation in problems and needs 14 31
Competition reasons 6 13
Total 45 100
discussions held with the growers in the six villages, that invention could become a sensitive issue if the cooperation in conducting a trial proved to be successful on the inventor's holding, but failed when implemented on the cooperator's holding. Who was going to be responsible for the failure? This question of responsibility emerged as a matter of great importance, and is a major explanation for the lack of cooperation among inventive vegetable growers.
The grower who loses his crop in a cooperative venture would blame the grower with whom he developed the invention for the failure to maintain his prestige. It would damage the reputation and relationships of the cooperating grower in the locality. The failure would also mean loss of invested capital and income and could be a catastrophe for the whole family. It could mean exposure to loss of part or all his land if a carryover loan was not secured. When the loan is secured it may take a very long time to repay, and this would expose him to live in poverty. Hence the growers wished to avoid this, and so worked alone at their inventions. Diffusion of the growers' inventions Diffusion in this study is defined as the transfer of the growers' own inventions to other peer growers. The inventors who did not transfer their own inventions to other growers were 45 (62.2%), of whom 14 gave as the reason the lack of collaboration between them and other growers. The most common reason, given by 25 growers was that other growers were always aware of what they were doing because they observed each others' activities (Table 8).
If successful they copied them and asked about the details. If they were interested in the invention, the inventor was willing to give details. If not, they did not ask. These seem to be part-active and part-passive diffusion. The other 6, of the 45 mentioned the competition was the main reason for not wishing to be more than slightly active in diffusing their own inventions. Competition could work as a factor to inhibit growers' cooperation in invention and transfer of information (dissemination). The rewards of successful invention are substantial and commercially oriented. It leads to extraordinary prices in the market for short periods of
time which means high returns and extra profits. When the new information and technology spread to other growers and villages the prices fall. It seems, from the evidence of this study, that there is no complementary interaction between competition and information exchange and inventions. Competition is a relatively new attitude, and was not traditional among vegetable growers. Recently the production objectives have changed. Currently, profit maximization and lower costs are the stimuli for growing vegetable crops and these inevitably have an influence through increasing competition on sharing information and the results of inventions, as stated by the growers in the in depth discussion.
Growers who did make efforts to transfer their own inventions to other growers accounted for 27 (37%). Again, however, collaboration was said to be restricted to only a small number of growers with whom they had mutual kinship relations. In some cases, technologies and practices were transferred only after the inventor had benefited from better prices and marketing, and when the information was rather old and being replaced by new ideas. Only one grower was really positive about the benefit to him. This was because he rented part of his land to sharecroppers and so was keen that they used the most efficient techniques and practices that gave the best results.
The main way in which their inventions were transferred was said by 22 respondents to be by their personal efforts. The other 5 mentioned that they did this partly by themselves and also through other vegetable growers. The particular value of this feedback is in the information it gives about the priorities, needs and demands of the vegetable growers. It could be useful to the research and extension services. Hence many of the growers were involved in continuous information setup experimentation and feedback generated by themselves. This continuing process had contributed to the development and transfer of their inventions and in turn, had improved to some extent their vegetable production systems.
From the feedback, the growers had learnt more effective ways of conducting trials, and how to improve the inventions they had developed or helped to introduce. The situation reported by the growers is of a more-or-less represents closed system in which information of

invention approach in the process of inventing. Other sources seem to be a major reason why the growers rely on their own resources and the success they have achieved has encouraged and created enthusiasm to continue to develop their own inventions. Equally, failures push the growers to experiment and invent. The outcome is an effective means of diffusion of information and inventions, which have contributed to improving their production systems almost entirely by their own efforts. Limitation of growers' inventions There is a lack of awareness and understanding by the scientists of the growers own experimentation, invention and transfer of information. This results in the isolation of the growers' inventions. All 10 extension workers in charge of the extension activities in the villages under study stated that they did not convey any of the growers' inventions to researchers or any other institution, and appeared not to understand what has been shown in this paper.
An explanation for these perceptions is, first, because inventions are rather slow and indirect in their transfer to other growers. Then it is only partial: 14 growers had introduced no new technology because they had received none from their peers or any other source. Second, and most important, the growers' inventions and information was not documented. It was kept in the memory and the only means of its spread was by word of mouth. This made it more difficult to pass the information to scientists, and so acted as a constraint. This is in accordance with Farmington and Martin (1997) who stressed that the transfer of information is constrained and error-prone since it has to be passed on orally and held in the heads of practitioners. Conclusion Vegetable production is a very important economic activity in Khartoum. This actually resulted in growers being no keen in transferring/sharing their new T Tq P with their peers until they reap the economic benefits of their invention which becomes commonly spread amongst growers with time. Inventor grower represents a considerable portion of vegetable growers. The contacts between them are mostly personal and were useful in disseminating information amongst growers who received less attention from the official extension and research institutions and accordingly growers lack both confidence and reliability in any information delivered to them by these institutions. The latter was the main motive behind growers establishing their own system of T Tq P information and experience exchange. Experimentation was a very important component of the development of new T Tq P. On the other hand, extension workers did
Badri 257 not convey any of the growers’ inventions to any other institution. Conflict of Interest The authors have not declared any conflict of interest. REFERENCES Ahmed M, Abdel R, Mohamed EH (2013). Impact of FFS on Farmer’s
Adoption of IPM Options for Onion: A case Study from Gezira State, Sudan. World J. Agric. Sci. 9 (1):38-44.
Badri O (1996). Invention, Inventiveness and Inventors in Vegetable Production in Khartoum State. The University of Reading, UK, ARED, Unpublished PhD thesis
Farmington J, Martin A (1997). Farmer Participatory Research: A Review of Concepts and Practices. ODI Discussion Paper 19, ISS No 260-7883.
Garforth C (1987). Technology Development: The Role of Research, Extension and Farmers. Agricultural Development & Rural Development Centre University of Reading. A Lecture given in the Faculty of Agriculture, University of Sana'a Yemen Arab Republic, 22
nd February.
Geneif AA (1986). Production of Horticultural Crops in the Sudan. In. GTZ: Masterplan For Fruits And Vegetables In Sudan, Ministry of Agriculture And Natural Resources.
Geneif AA (1987). Production of Horticultural Crops in the Sudan. In. GTZ: Masterplan For Fruits And Vegetables In Sudan, Ministry of Agriculture And Natural Resources.
GTZ (Gesellschaft für Technische Zusammenarbeit) (1986). Master plan for Fruits and Vegetables in Sudan. Volume 1, Main Report. Republic of the Sudan, Ministry of Agriculture and Natural Resources.
GTZ (Gesellschaft für Technische Zusammenarbeit) (1987). Master plan for Fruits and Vegetables in Sudan. Volume 3, Contributing papers. Republic of The Sudan, Ministry of Agriculture And Natural Resources.
Jones EG (1992). Innovation Diffusion and Decision – Making in Agriculture. Revista de Economia Agraria 47(3):353-369.
Khalid MMR (2013). Prospects for modernization of agriculture in Sudan with an emphasis to food security. Res. J. Agric. Sci. Rev. 2(2):39-50.
Maat H (2015). The history and future of agricultural experiments. NJAS – Vageningen J. Life Sci. 57(3-4). Technology and Interdisciplinary. Performance, Practices and experiments. Available at: http://www.sciencedirect.com/science/article/pii/
Ministry of Finance and Economic Planning (1998). The Four Year Salvation Recovery and Development Program. Republic of Sudan. Volume 2.
Richards P (1985). Indigenous Agricultural Revolution. Ecology and Food production in West Africa. Westview Press.

Vol.8(12), pp. 258-268, December 2016
DOI: 10.5897/JAERD2016.0768
Articles Number: 3E9DF0D61693
ISSN 2141-2170
Copyright ©2016
Author(s) retain the copyright of this article
http://www.academicjournals.org/JAERD
Journal of Agricultural Extension and Rural Development
Full Length Research Paper
Logit analysis of factors affecting adoption of improved bread wheat (Triticum aestivum L.) variety: The case of
Yilmana Densa District, West Gojam, Ethiopia
Laduber Wondale1*, Dessalegn Molla2 and Daniel Tilahun1
1Amhara Regional Agricultural Research Institute, P.O.Box, 527, Bahir Dar, Ethiopia.
2Bahir Dar University College of Agriculture and Environmental Sciences, P.O.Box, 5501, Bahir Dar, Ethiopia.
Received 28 January, 2016; Accepted 20 September, 2016
Yilmana Densa is one of the potential wheat growing District in West Gojam Zone, but the level of adoption is not studied for the last 15 years and a number of farmers are still using local varieties which are known for their low yield and disease susceptibility. Therefore, the purpose of this study was to identify potential factors affecting adoption of improved bread wheat variety, using the logistic regression (binary logit) analysis. A three stage (purposive for wheat growing kebeles, simple random sampling for sample kebeles and systematic random sampling for sample households) sampling procedure was employed to select the sample households. Finally, 120 sample respondents were selected from the sampling frame based on probability proportional to size (PPS) of wheat growers using systematic random sampling procedure. Secondary data (sampling frame, population, productivity etc) were collected from different sources. Quantitative data (farm income, farming experience, farm size, family size, etc), qualitative data (access to; credit, extension contact, input, field day etc) were also gathered. The result indicated that out of 21 identified explanatory variables, 11 of them had affected adoption significantly. Over all, of 120 sample respondents, only 35.83% (N=43) were found to be adopters of improved bread wheat varieties whereas 64.17% (N=77) of wheat growing farmers are being used local variety named Kubsa which was released before two decades and became susceptible to yellow rust and other foliar diseases. Institutional factors have been found overweighed than individual, economic and kebele (the lowest administration hierarchy in Ethiopia) level factors. The study revealed that giving due consideration for the significant variables would promote the adoption of improved bread wheat varieties. Furthermore, policy and development interventions should also be consolidated. The model result indicated that (the model chi-square value) the parameters indicated in the model taken together were significantly different from zero at less than 1 percent level of significance. The value of chi-square (×2 = 105.24) also indicated the goodness of fitted model. The chi-square goodness-of-fit test statistics of the model shows that the model fits the data with significance at 1% level. This shows that the independent variables are relevant in explaining the farmers’ decision to adopt improved bread wheat varieties. Key words: Adoption, bread wheat, logit model, Yilmana Densa.
INTRODUCTION Ethiopian economy is highly depending on the performance of the agriculture. The agricultural sector
accounts for 45 percent of national GDP, 83.9% of export earnings and 85% of employment opportunity
(CIA, 2010). In spite of tremendous efforts by the government, Ethiopia is still among the poorest developing countries with an annual average per capital income of US470 in 2013 (WDB, 2013). Despite its importance in the livelihood of the people and its potential, the sector has been dominated by smallholder subsistence production and traditional technologies are predominant. Hence, level of productivity in agriculture is very low due to, among others; low rate of the adoption of improved technologies (Bayissa, 2010). Ethiopia is the largest wheat producer in sub-Saharan Africa (MOA, 2011). Nationally, wheat ranks fourth in both total area coverage (1,627,647.16 ha) and production (3,434,706.122 ton). Among cereals, it is also the third in productivity which is 2.11ton/ha after maize and rice 3.05ton/ha and 2.89ton/ha, respectively (CSA, 2013). So far, the Amhara Regional Agricultural Research Institute (ARARI) has released a number of wheat varieties by its own and in collaboration with the national and/or international research institutes, but the productivity of wheat for the region is below the national average which is 1.78ton/ha as compared to 2.11 ton/ha of the nation (CSA, 2013). This is mainly due to, among others, lack of farmers participation in variety selection processes (have low contact with researchers), lack of system to follow on demand driven and problem oriented issues and this followed by low adoption. A lot of efforts have been done in the generation of improved varieties through the formation of Farmers Research Groups (FRGs), but generation of technology is not an end by itself, unless it reaches to the end users.
Even though the district has high potential (agro-ecologically) for wheat production, a number of farmers are still using the old varieties that have been released before two decades. These varieties are becoming highly susceptible to disease and their yield is also deteriorating from time to time (because of the rust problems). On one hand, there are many high yielding and disease resistant improved bread wheat varieties released by Amhara Regional Agricultural Research Institute (ARARI) and Ethiopian Institute of Agricultural Research (EIAR). On the other hand, farmers of the district are still growing old varieties and some reduce their plots allotted to wheat. Hence, factors affecting the adoption of improved bread wheat varieties were not systematically and empirically studied and recognized in the study district for the last fifteen years that led to an information gap. Econometric model A logistic adoption model was utilized to determine factors affecting the adoption of improved wheat
Wondale et al. 259 varieties. The dependent variable was dichotomous that took two values, 1 if the event occurred and 0 if it did not. Such relationship required the utilization of qualitative response models. In line with this, logit, probit and linear probability models were the likely options. Although Ordinary Least Squares (OLS) regression estimates can be computed for binary model, the error terms are likely to be hetroscedastic leading to inefficient parameter estimates. Consequently, hypothesis testing and construction of confidence interval becomes imprecise and confusing. Likewise, a linear probability model may produce predicted values outside the acceptable 0-1 value which abuse the basic belief of probability. To alleviate these problems and produce relevant empirical outcomes, the most widely used qualitative response models are logit and probit models (Amemiya, 1981).In this study the logit model based on cumulative logistic probability function were employed. According to (Green, 1991; and Gujarati, 1995), the choice between logit and probit models is largely a matter of convenience even though Maddala (1983) and Gujarati (1995) illustrated that the logistic and cumulative normal functions are very close in the mid-range, but the logistic function has slightly heavier tails than the cumulative normal function. That is the normal curve approaches the axis quicker than the logistic curve. Disregarding the minor differences between logit and probit models, Liao (1994) and Gujarati (1995) indicated that the probit and logit models are quite similar, so they usually produce predicted probabilities that are almost similar.
In accordance with (Pindyck and Rubinfeld, 1981; Green, 1991; Gujarati, 1995) the logit model is compu-tationally easier to use and leads itself to a meaningful interpretation than the other types.
This paper deals with the objective: 1. To identify potential factors affecting the adoption of improved bread wheat variety using logit analysis (binary logit) which is widely used for binary variables; and suggest possible recommendations? MATERIALS AND METHODS
The Amhara National Regional State (ANRS) is one of the major wheat growing regions of the country. According to Central Statistical Agency CSA (2013), the region shares 30.6% (498,192.03 ha) and 25.87% (888,568.58 ton) of the total area and production of the nation, respectively. West Amhara is the one among wheat potential zones of the region based on the central statistical agency data (CSA, 2013). One District which has profound potential for cereal production mainly wheat is Yilmana Densa. According to Yilmana Densa office of agriculture, annual crops of the district cover 54,501 ha and permanent crops about 1,202 ha annually.
*Corresponding author E-mail: [email protected].
Author(s) agree that this article remain permanently open access under the terms of the Creative Commons Attribution
License 4.0 International License

260 J. Agric. Ext. Rural Dev. Sampling design In this study, both qualitative and quantitative methods were employed. Qualitative method included semi structured and unstructured open ended group and individual interview including 6-9 people in depth interview in each kebeles (the lowest administration hierarchy in Ethiopia). Whereas quantitative method comprised surveys, and fixed response close ended structured interview schedule. Primary data (income, education, access to credit etc) and secondary data (number of wheat growing kebeles, number of wheat growing farmers, input distribution etc) were collected. Survey and focus group discussion were utilized to collect primary data and maps, records, reports and personal files were used for secondary data collection (published or unpublished). Sampling technique To constitute a sample, probability sampling technique was utilized to reduce or eliminate sampling bias and ensure equal probability of selection. Sampling procedure In the course of the study a three stage sampling technique was employed. At stage one; purposive selection of bread wheat growing Kebeles of the district using the secondary data on production and area coverage of bread wheat was undertaken. Stage two, out of identified bread wheat growing Kebeles of the district, three bread wheat growing Kebeles were randomly selected due to their similar production practices and agro ecology. Prior to selecting household heads to be considered in the sample, bread wheat grower household heads of each rural Kebeles were identified in collaboration with Kebele leaders, key informants and development agents of the respective Kebele. Moreover, the already recorded list of bread wheat growing households available at the selected Kebele offices has been utilized. At stage three, sample farm household heads were selected from the sampling frame based on probability proportional to size of wheat growers (PPS) using systematic random sampling procedure in each of three selected Kebeles. This is due to the presence of high communalities. Using farm-level data collected from a systematic random sample of 120 household heads selected based on probability proportional to size (PPS) of wheat growers using systematic random sampling procedure. Method of data collection The survey was administered and primary data was collected from sample household heads using a structured interview schedule. Before starting the actual data collection, the interview schedule was pre –tested enabling the modifications of some of the questions which were irrelevant to the current situation and out of context. Six enumerators (two per kebele) were trained in the context of the interview schedule, method of data collection and on the appropriate way to approach farmers. Primary data were collected from sample respondents through a structured interview schedule, which was intended to generate data on some personal, institutional, economic and demographic variables which are hypothesized to influence adoption decision of the households in the study. Frequent field visits were made before the actual survey to get general information of the targeted Kebele‟s. The interview schedule was pretested and 6 farm households outside the sample farmers were interviewed, at the rate of one farmer by each enumerator. Following pretesting, the second meeting was conducted with enumerators about the clarity of the interview
schedule, language, unexpected responses and additional response options. Following the necessary corrections, the final version of the interview schedule was arranged. Frequent supervision was made by the principal researcher to correct the likely errors on the spot. Secondary data were obtained from different sources like district office of agriculture, Ministry of Agriculture (MoA), Central Intelligence Agency (CIA), Central Statistical Agency (CSA) etc. Information from published and unpublished sources including maps was exploited in the study. Key informant interview Information gathering by key informant interview is as important as information gathered through formal interview schedule. Hence, groups which combined elders, religious leaders and familiar people in the village were purposively selected in each kebele and pair wise ranking was utilized to rank and prioritizing problems. Focus group discussion Focus Group discussions were conducted in 3 Kebeles. Each group comprised of 8 to 12 participants. The participants were selected randomly from the study area. In the study, dependent variables were dichotomous. Considering those farmers cultivated improved bread wheat seed and use recommended in organic fertilizer for two and more years as adopters and those not cultivating currently as non adopters. Finally the data were analyzed based on the interviewed sample respondents. In the study the logit model based on cumulative logistic probability function were employed. In line with, Maddala (1983), Green (1991), Gujarati (1995) the logistic distribution function for the adoption of bread wheat can be specified as:
(1) )1()1(
1i
i
i z
z
ze
e
eP
(1) Where Pi - is a probability of adoption of improved bread wheat variety for the ith farmer and it ranges from 0-1. P is the observed response of the ith farmer (i.e., the binary variable, P = 1 for a user,
P = 0 for a non user), ize -stands for the irrational numbers e to the
power of iz and iz - is a function of n- explanatory variables (Xi)
which is also expressed as:-
n
i
tiioi UXZ1
Z is underlying and unobserved stimulus index for the thi farmer, i
= 1, 2,…. n, are observations on variables for the adoption model, n being the number of explanatory variables in this study represents
22 independent variables, o = an intercept, i unknown
parameters to be estimated (Coefficients of ith independent variable),Xi = independent variable and can be either dummy or
continuous, i runs from 1-22, tU = unobserved disturbance term.
The slope tells how the log odds ratio in favor of adoption of bread wheat changes as independent variable change. If pi is the probability of adopting bread wheat then 1- pi represents the probability of not adopting it.

(2)
)1(11
i
i
z
z
e
ep
(2)
)1( i
i
z
z
e
e
)1(
1iz
e
Thus, the odds ratio can be written as
(3)
1
1
1i
i
i
z
z
z
ee
e
pi
pi
(3)
Therefore,
pi
pi
1is the odd ratio in favor of adopting improved
bread wheat. Likewise, it is the ratio of the probability that the farmer would adopt improved bread wheat to the probability that the farmer will not adopt. Eventually, taking the natural log of equation:
The log of odds ratio can be elucidated as;
Li =ln pi
pi
1= ln e
n
i
tiio UX1
(4) (4)
n
i
tiioi UXZ1
Where Li = is log of the odds ratio in favor of improved bread wheat adoption, which is not only linear in xi but also linear in the parameter. This model can be estimated using the iterative maximum likelihood (ML) estimation procedure. In reality, the significant explanatory variables do not have the same level of impact on the adoption decision of farmers. The relative effect of a given quantitative explanatory variable on the adoption decision is measured by examining adoption elasticity. The variables that were assumed to influence the adoption decision of improved bread
wheat were tested for multicollinearity. The parameters ( i ) of the
model were estimated utilizing the iterative maximum likelihood (ML) estimation method. The model was assessed for its goodness of fit by probing how well the model classifies the observed data. The result indicated that (the model chi-square value) the parameters indicated in the model taken together were significantly different from zero at less than 1% level of significance. The value of chi-square (×2 = 105.24) also indicated the goodness of fitted model (Table 3). This shows that the independent variables are relevant in explaining the farmers‟ decision to adopt improved bread wheat varieties.
An additional measure of goodness of fit in the logistic regression model has been detected as how much the observed value is correctly predicted. The fit is considered to be good if the overall correct prediction rate exceeds 50% (Callet, 1991, as cited in Abebaw, 2003). In other words, the observation is grouped as an adopter if the computed probability of adoption is greater than or equal to 0.5 (50%), as non adopters, otherwise. Accordingly, the result showed that about 92.2% non adopters, and 88.4% of the adopters were correctly predicted using the cut off value of 0.5. Overall, the model correctly predicted 88.4% of the sample cases (Table 4). Hence the model predicted both adopters and non adopters groups of improved bread wheat variety correctly.
Wondale et al. 261 Test of multicollinearity To analyze factors affecting adoption of improved bread wheat varieties, binary ligit model was utilized. Existence of multicollinearity among the continuous variables was checked and association among the dummy variables was verified before taking the selected variables in to the logit model. Problem of multicollinearity arises due to linear relationship among explanatory variables; result could not obtain unique estimates of all parameters (Gujarati, 1995). This leads to a very low t-ratio and wide confidence interval with large variance and standard error. Both continuous and dummy variables were checked for multicollinearity before run the logit model. Among different methods, variance inflation factor (VIF) for continuous explanatory and contingency coefficient (CC) for dummy variable was utilized. Based on Gujarati (1995) VIF could be specified as:
1
VIF (Xi) =
1-R2
Where: R2 is the multiple correlation coefficients between X i and other explanatory variables.
For each selected continuous explanatory variable, (Xi) was regressed on all other continuous explanatory variables; the coefficient of determination (Ri
2) was constructed for each variable. The larger value of Ri
2 the higher the value of VIF (Xi) causing higher collinearity in the variables (Xi). For continuous variables according to (Gujarati, 1995 cited in Mesfin 2005), if the value of VIF is 10 and above, the variables are said to be collinear (if the value of R2 is 1, it would result in higher VIF and causes perfect multicollinearity between the variables). Whereas for dummy variables according to Healy (1985) as cited in Paulos (2002), if the value of contingency coefficient is greater than 0.75, the variables are said to be collinear. Contingency coefficients were computed for dummy variables to detect the problem of multicollinearity).
C.C = x2
n + x2
Where: C.C = Contingency coefficient
n = Sample size
x2
= is the chi-square value of a variable
Where: C.C = Contingency coefficient, n = Sample size, x2 = is the chi-square value of a variable.
Heteroscedasticity test also conducted whether the error has constant variance. Prior to running the Logit model, the hypothesized explanatory variables were checked for the problem of linear association among the hypothesized variables (multicollinearity), which can cause the estimated regression coefficients having wrong signs and smaller t-ratios that might lead to wrong conclusions and heteroscedasticity test also conducted. One of the assumptions in regression analysis is that errors (ui), have a common (constant) variance σ2 .If the errors do not have a constant variance; we say they are heteroscedastic (Maddala, 1992). Yet, with the presence of heteroscedasticity the estimated parameters of a regression are consistent, though they are inefficient. In this study, heteroscedasticity was tested for all variables using maximum likelihood estimates (σ = 1.012). Hence, there was no serious problem of heteroscedasticity in the model. Thus, all the important variables were included in the analysis. Variance inflation factor (VIF) was used to check multicollinearity problem among continuous variables and contingency coefficient for discrete dummy variables. The binary logit model (regression) was estimated using maximum likelihood estimation procedure.

262 J. Agric. Ext. Rural Dev.
Table 1. Continuous and discrete dummy explanatory variables with their unit and expected sign
S/N Continuous explanatory variables Unit Hypothesis
1 AGHH Farmer‟s age Year + (-)
2 SIZELH Farm size ha -
3 FAMSME Household size/labour Count +
4 LIVSTNO Total livestock unit Count +
5 FARMEX Farming experience Year + (-)
6 DISDEVC Distance to nearest development centre Hours -
7 DISMARK Distance to market centre Hours -
8 OFFIN Off-farm income Birr +
9 ONFIN Farm income Birr +
10 DISROAD Distance to the main road Hour -
Discrete dummy variables
SEEDUSE Use of improved seed (Dependent variable) (1= user) 1/0
11 SEXHH Sex of the household head (1=male) 1/0 + (Male)
12 ACCRE Access to credit (1=yes) 1/0 +
13 EXTCO Extension contact (1=yes) 1/0 +
14 RESCO Research contact (1=yes) 1/0 +
15 LABORHRD Hired labour (1=yes) 1/0 +
16 ATTFD Attend field day (1=yes) 1/0 +
17 KNWYS Knowledge of improved wheat yield superiority (1=yes) 1/0 +
18 PARLEAD Participation social organization (1=yes) 1/0 +
19 RADIOOWN Ownership of radio (1=yes) 1/0 +
20 ACCINPUT Access to input supply (1=yes) 1/0 +
21 EDULEV Education (1=yes) 1/0 +
The larger the value of VIF the more collinear the variable Xi is. As a rule of thumb, if the VIF of a variable exceeds 10, there is a multicollinearity problem and if the value of contingency coefficient is greater than 0.75, the variables are said to be collinear. The VIF values are presented in Table 2. The result indicated that all variables have low values. Accordingly, they have been included for further analysis. Similarly, the values of contingency coefficient for the discrete dummy explanatory variables are below 0.75 (Table 3). Hence, all have been included for further analysis, because they have been found to be non linear. To detect whether the error term follows the normal distribution or not the normality test should be performed properly. A simple graphical device to study the shape of the probability density function of a random variable is the normal probability plot. We plot values of the residuals on the horizontal (X-axis) and the expected value of the variable on the vertical (Y-axis).If the variable is from the normal population, the normal probability plot will be approximately a straight line (Damodar, 2003). Variables and working hypothesis Dependent variable is dichotomous i.e. adopters are those respondents who cultivated one of the improved bread wheat varieties for two and more years and those who are not cultivating currently are considered as non adopters with the value 1 and 0 (1 for a user and zero otherwise). The twenty one independent variables are also listed (Table 1).
RESULTS AND DISCUSSION
Results of econometric model
Figure 1 show that the residuals are approximately normally distributed, because a straight line means the data are rational.
Factors affecting improved bread wheat adoption
Maximum likelihood estimates procedure was utilized to estimate the parameters of the variables that are expected to influence the adoption of improved bread wheat varieties (Table 4). In the model 10 potential continuous and 11 discrete dummy variables were entered. Out of the total of twenty one explanatory variables, 11 variables of which 6 were continuous and 5 were dummies found to be significantly influenced adoption of improved bread wheat varieties. As the model result portrays, the variable access to credit had positively and significantly influenced the likelihood of adoption of improved bread wheat at 1% level of

Wondale et al. 263
Table 2. Multicolliniarity test for continuous explanatory variables using (VIF).
Variables Colliniarity statistics
Tolerance VIF(1/1-R2)
AGEHH 0.110 9.075
SIZELH 0.915 1.093
FAMSME 0.781 1.280
LIVSTNO 0.801 1.249
FARMEX 0.109 9.167
DISDEVC 0.405 2.470
DISMARK 0.405 2.467
DISROAD 0.395 2.528
OFFI 0.860 1.162
ONFI 0.864 1.157
Computed from own survey result, 2014.
Table 3. Bivarate correlation analysis of multicollinearity for binary variables.
Variables SEXHH PAR
LEAD KWYS
EXT
CO
RES
CO
LABOR
HRD
ATT
FD
RADIO
OWN
ACC
INPUT
AC
CRE
EDUCATION
SEXHH 1 0.004 0.085 0.128 0.228 0.079 0.082 0.115 0.066 0.001 0.135
PARLEAD 1 0.053 0.088 0.009 0.044 0.048 0.100 0.056 0.109 0.194
KWYS 1 0.165 0.051 0.132 0.127 0.023 0.056 0 089 0.154
EXTCO 1 0.418 0.145 0.142 0.190 0.100 0.110 0.140
RESCO 1 0.265 0.311 0.096 0.078 0.064 0.279
LABORHRD 1 0.121 0.097 0.011 0.025 0.021
ATTFD 1 0.385 0.233 0.181 0.266
RADIOOWN 1 0.231 0.169 0.148
ACCINPUT 1 0.051 0.122
ACCRE 1 0.133
EDUCATION 1
Figure 1.Normality test using normal probability plot of logit model Computed from own survey, 2014.

264 J. Agric. Ext. Rural Dev.
Table 4. Maximum likelihood estimates of binary logit model.
Explanatory
variables
Coefficient
estimated Wald value
Sig.
level
Odds ratio
Exp(B)
AGEHH -0.223 1.924 0.165 0.800
PARLEAD 1.852*** 7.872 0.005 6.371
FARMEX 2.944* 3.199 0.074 18.988
EDULEV 0.404 0.870 0.351 1.498
SEXHH -1.415 0.056 0.813 0.243
FAMSME 0.245** 2.582 0.038 1.277
SIZELH 0.944** 4.435 0.035 2.569
DISMARK -1.239 0.763 0.383 0.290
DISROAD 4.572** 3.569 0.059 96.760
DISDEVC -1.479 0.461 0.497 0.228
LIVSTNO -0.659* 3.275 0.070 0.517
ACCINPUT 0.421*** 0.054 0.002 1.523
KNWYS 0.195 0.034 0.816 1.215
ACCRE 3.175*** 5.738 0.017 23.938
EXTCO 0.815 0.498 0.481 2.260
RESCO 2.328 1.111 0.292 10.253
ATTFD 0.542** 1.027 0.021 1.719
RADIOOWN -1.249 0.955 0.329 0.287
LABORHRD 2.633* 2.770 0.096 13.914
OFFIN 0.001 0.547 0.460 1.001
ONFIN 0.117*** 8.647 0.003 1.124
Constant -14.166 2.362 0.124 0.000
Computed from own survey result, 2014 -2 log likelihood 51.346 chi-square(x
2) 105.24***
Significance 0.000 Correct model prediction 90.8% Correct prediction of adopters 88.4% Correct prediction of non adopters 92.2% Exp (B): shows the predicted changes in odds for a unit increase in the predictor ***, ** and * represent level of significance at 1%, 5% and 10%, respectively.
significance. The result showed those farmers who had access to credit from formal organizations like Amhara Credit and Saving Institution (ACSI) have been found more participants in adoption than those who had not. Similar result was found by Feder et al. (1985) that credit is associated with the use of improved inputs. The study by Legesse (1992) revealed that positive and significant association of credit and use of improved inputs. This result is in line with Lelisa (1998) who studied determinants of fertilizer adoption, intensity and probability of its use that revealed access to credit is one determinant of fertilizer adoption and intensity of its use. Credit plays a significant role in enhancing the technology promotion. As anticipated, credit affects positively and significantly at (p<0.05). The odds ratio in favor of adopting improved bread wheat increased by a factor of 23.93 for adopters who had received credit. The result revealed that the availability of credit had increased adoption decision of the household head on improved
bread wheat positively and significantly. Participation of the household in leadership of social
organization assumes that farmers, who have some position in Kebeles and/or other social organizations, are expected to have a variety of information as they are closer to sources of information. As the model result depicts the variable access to participation of the household in leadership of social organization had positively and significantly influenced the likelihood of adoption of improved bread wheat at (p<0.05). The odds ratio in favor of adopting improved bread wheat increased by a factor of 6.37 per unit increase in participation. This study agreed with different findings, such as Dereje (2006) and Almaz (2008) that social participation positively and significantly influenced the probability of adoption.
Labor constraint of farmers can be surmounted through hired labor, especially during critical farm operations, like land preparation, weeding and harvesting. As expected, hired labor had a positive and significant relationship with

adoption of improved bred wheat varieties at (p< 0.1). The odd ratio of 13.91 for hired labor implies that other things being kept constant, the odds-ratio in favor of adopting improved varieties increases by a factor of 13.91 as a farmer‟ engagement in hired labor increases by one unit. This implies that farmers who have large engagement in hired labor have adopted improved bread wheat varieties than those who had lower engagement. As labor accessibility increases, adoption increases and correlate positively, based on the study by (Yishak, 2005). Participation on field day is one of the means of teaching and learning process of improved technologies. The result of Logit model shows that attend in field day was positively and significantly related to adoption of improved bread wheat variety at (p<0.05) (Table 4). The odd ratio of 1.719 attending in field days implies that other things being kept constant, the odds-ratio in favor of adopting improved varieties increases by a factor of 1.719 as a farmer‟ engagement in field days increases by one unit Those farmers who have an access to attend field day of improved bread wheat production fields are more likely to use improved bread wheat variety than those farmers who have no similar opportunity. The result indicates having formal information through field days increases the probability of adoption. This result is in line with Tesfaye et al. (2001). In field days, neighboring farmers will get an opportunity to observe how the new technology is practiced in the field. Access to input supply like improved bread wheat varieties, inorganic fertilizer etc. at the time of planting, increases farmers‟ use of improved bread wheat varieties. Conversely, if improved bread wheat varieties seed are not accessible at the time of planting, farmers will allocate their plot of land to other crops. As the model result depicts the variable access to input supply had positively and significantly influenced the likelihood of adoption of improved bread wheat at (p<0.01). The odds ratio in favor of adopting improved bread wheat increased by a factor of 1.523 per unit increase in access to input. Therefore, access to input had increased the probability of adoption of improved bread wheat and this result is in line with the hypothesis set forth. A study conducted by Bayissa (2010) revealed the positive relationship of adoption and improved variety.
Total on Farm income is the main source of capital to cover the costs of farm inputs and other household expenses. In this study the household farm income was estimated based on the sales of crop, livestock and livestock products. The major cash income for sample households in the study area is from sale of crop produce and livestock. The result of Logit model shows that having better farm income was positively and significantly related to adoption of improved bread wheat variety at (p<0.01) (Table 4). The odd ratio of 1.124 total on farm income implies that other things being kept constant, the odds-ratio in favor of adopting improved bread wheat varieties increases by a factor of 1.124 as a farmer‟s on farm income increases by one unit. The result was in line
Wondale et al. 265 with Degnet and Belay (2001) and Kidane, (2001) findings. Family size converted to man equivalent is considered as the total active family members who reside in the respondent‟s household. Large family size is assumed as an indicator of labor availability in the family. Large labor force in a family implies that the household may not need to hire more additional labor and the saved money due to use of own labor force will be used for purchasing farm inputs. This will increase household's probability of adoption of improved bread wheat varieties. The result of Logit model shows that family size was positively and significantly related to adoption of improved bread wheat variety at (p<0.05) (Table 4). The odd ratio of 1.277 family size implies that other things being kept constant, the odds-ratio in favor of adopting improved varieties increases by a factor of 1.277 as a farmer‟ family size increases by one unit.
As anticipated, farming experience had a positive and significant relationship at (p< 0.1). The odds-ratio of 18.988 for farming experience implies that other things being kept constant, the odds-ratio in favor of adopting improved varieties increases by a factor of 18.8 as a farmer‟ farming experience increases by one unit. This implies that farmers who have longer years of experience in farming have adopted improved bread wheat varieties than those who have the lower years of experience in farming. This may be due to relatively farmers who have longer years of experience may develop the confidence in handling the risk, skills in technology application. Different studies have agreed with this argument. For instance, Legesse (1992), Kidane (2001) and Melaku (2005) have described the positive relationship of farming experience with adoption
Land is perhaps the single most important resource, as it is a base for any economic activity especially in rural and agricultural sector. Farm size influences farmers' decision to use or generate new technologies. The result of binary logistic regression analysis indicated that size of land owned had influenced the household decision to adopt improved varieties significantly and positively at (p<0.05) as compared to farmers with small holdings. The decomposition result (Table 4) show as land holding increased by one unit the probability of participation in adoption of improved wheat increases by a factor of 2.569%.This result was not in conformity with the previously hypothesized variable, which stated size of land holding was expected to affect household decision to adopt bread wheat improved varieties negatively. This was mainly believed in that increasing the production and productivity of wheat depends on increased cropping intensity by using seed of improved wheat varieties, but it was found that instead of having small plot of land, farmers who have relatively large plot have been found that developed confidence to grow improved varieties, as they believed they can avert risks if at all happened through other alternative crops they grow to the extra plot they own. A farmer who has relatively large size of farm

266 J. Agric. Ext. Rural Dev.
Table 5. Sample households by use of improved bread wheat varieties.
Improved seed use
Non adopters
(N=77)
Adopters
(N=43)
Total sample
(N=120)
N % N % N %
Yes - - 43 35.83 120 100
No 77 64.17 - -
N = Number of respondents, Computed from own survey result, 2014.
land will not hesitate to try new ways of doing agricultural activities. This will motivate ones innovativeness.
The result of the study revealed that as livestock size of a household increased by 1 unit, adoption of improved bread wheat varieties would be decreased by a factor of 0.517 and this implies that when the households‟ livestock population of diversified animal increases, the households‟ aspiration to access and utilize improved bread wheat varieties decreases. The possible reason may be that the district farmers are known for fattening and delivering of bulls and sheep to the nearest town Adet, besides shipping to the regions‟ major town Bahir Dar. For this reason those who own large number of livestock found to be non adopters for improved bread wheat varieties as it requires intensive management (Table 5). The result was not inconformity with the previous hypothesis set forth. Those farmers who owned small number of tropical livestock unit had adopted improved bread wheat varieties at positively and significantly at (p<0.1). Conversely, Tesfaye et al. (2001) revealed the positive relationship of livestock holding and technology adoption in Yelma Dansa and Farta Districts of Northern Ethiopia. In addition, Birhanu (2002) indicated as livestock ownership increases adoption/intensity of adoption and correlate positively. Distance of household heads residence from all main roads was found to influence adoption decision of the household head positively and significantly at (p<0.1). This result was found to be in contrary to the hypothesis set earlier. One of the possible reasons may be due to those farmers residence near to all weather roads are involved in different income generating activities like fattening and petty trading, because they have an access to scan their environment for the current market to their bulls and proximity of their residence to easily freight their bulls to whole sellers or retailers shipment to urban and peri-urban areas.
Over all, of 120 sample respondents, only 35.83% (N=43) were found to be adopters of improved bread wheat varieties. Whereas 64.17% (N=77) of wheat growing farmers are not using improved variety which was released before two decades and became sus-ceptible to yellow rust and other foliar diseases. CONCLUSION AND RECOMMENDATIONS Agriculture is the main stay of Ethiopian economy and
hence, improving productivity to assure food security, reduce poverty and in turn attain food self sufficiency; utilizing agricultural input plays a vital role. Among others, improved variety took the lions share. Even if more than 85% of the country‟s population is engaged in agriculture, use of local varieties integrated with backward agronomic practices had put their figure print to produce low per unit area. To reverse the scenario, a lot of efforts have been made by the government. Accordingly, large numbers of improved bread wheat varieties have been released by national and/or regional research institutes in collaboration with international research centers, like CIMMYT, ICARDA, etc. But, the extension system to diffuse these varieties to the ultimate users is still lagging behind. In this regard, the study has explored the potential factors that affect the household decision to adopt or reject a given improved bread wheat variety in the study area. Strengthening the different types of participation in the social organization enhance adoption of improved bread wheat varieties like formation of Farmers Research and Extension Group (FREG) in each kebele and encouraging farmers to be membership in the FREG, even though all farmers cannot be elected in kebele administration, active participation in kebele meetings has paramount importance to scan what is going on currently in their environment. Beyond family labor, looking for additional laborer is crucial to apply the full package of the improved variety. Hence, an advice to improved wheat growers to hire labor is helpful in order to exploit the full potential of a given variety that might be lost due to lack of active man power.
Establishing and advocating different credit institutions at the community level have paramount importance to users of the improved varieties. In such a way that farmers will develop confidence to use improved bread wheat varieties as they can build confidence to purchase farm inputs to the amount as per the recommendation. Accessibility of input should get special attention. For this, collaboration will be demanding among actors in the sector, like BoA, research, seed enterprises (national and/or regional), private seed growers, seed unions, etc. Researchers, Regional, Zonal and District extension experts should organize field days at an appropriate time on the field to enable farmers attracted by the improved bread wheat varieties. This should not be one time activity; rather it should be performed every cropping season. It is crucial to utilize the experienced farmers to

demonstrate for those who are youngster. Technology adoption is by far successful through informal knowledge exchange among farmers themselves, because it has the power to convince each other better than the interference of outsiders. Extensive farming cannot be practical for smallholder farmers. Hence, intensive farming using highly productive crops like bread wheat to maximize output per unit area should be advocated to farmers. Training should be delivered to farmers to improve their saving culture, to diversify their on farm income, to sale their crops at an appropriate time, etc which enable them having better capital to utilize it as the need arises. Because, improved bread wheat varieties require intensive management and this requires readily available money to purchase input and to manage the farm plots properly and timely as much as possible. Moreover, active age family group has to be focused for intensive management of improved bread wheat varieties. Due consideration should be given to those farmers who are living far from main roads for the timely availability of inputs , as they have been found eager to use improved bread wheat varieties.. In addition, technical advice should also be extended to diversify their source of income through fattening and/or sale of milk and milk products since they have better feed source than along the road side residents.
To sum up, institutional factors have been found overweighed than demographic and economic factors. Accordingly, improved bread wheat varieties cannot be diffused with one organization and/or institution alone. In order for the varieties to reached the final users, an integrated activity among different stakeholders is crucial. Regional, zonal and district agriculture and extension offices should deliver timely inputs to at most appropriate location. Farmer‟s application of inorganic fertilizer below the recommended package was mainly due to poor research and extension linkage and also lack of financial capacity. Hence, establishment of financial institutions at Kebele level if not at district level, should be given due emphasis, besides strengthening extension service provision to enable farmers access the information and advice whenever they are in need. Participatory research through strengthening Farmers Research and Extension Group (FREG) to open the room for farmers which enable them to select varieties as per their preference criteria has to be given priority. Timely delivering the seed and inorganic fertilizer by itself cannot bring an expected output of a given variety, unless it is not coupled with frequent follow up from research and/or extension agents to enable them applying the correct package. The effort to get release disease resistant, early maturing and high yielding improved bread wheat varieties should be given special attention by national and/or regional research institutes. Construction of rural roads to enable remote farmer‟s access to input, credit and market centers has to get priority. Moreover, great emphasis should be given to establish these centers nearby their locality to reduce
Wondale et al. 267 their burden of long travel. The logit model was assessed for its goodness of fit by probing how well the model classifies the observed data. The result indicated that (the model chi-square value) the parameters indicated in the model taken together were significantly different from zero at less than 1 percent level of significance. The value of chi-square (×2 = 105.24) also indicated the goodness of fitted model. The chi-square goodness-of-fit test statistics of the model shows that the model fits the data with significance at 1% level. This shows that the independent variables are relevant in explaining the farmers‟ decision to adopt improved bread wheat varieties. Conflict of Interests The authors have not declared any conflict of interests.
ACKNOWLEDGEMENTS The authors gratefully acknowledge the significant contributions made by the district development agents and farmers. We would also like to thank the Adet Agricultural Research Center (AARC) for providing facilities while conducting the household surveys. The study was financially supported by the East African Agricultural Productivity Project (EAPP) and Adet Agricultural Research Center (AARC). REFERENCES Abebaw S (2003). Dimensions and Determinants of Food Security
among Rural Households in Eastern Ethiopia. A Master Thesis presented to the school of graduate studies of Alemaya University. 152 p.
Almaz G (2008). Adoption of Chickpea Technology Package in Add`a and Akaki Districts, Eastern shewa, Ethiopia. An M.Sc.Thesis, Haramaya University, Ethiopia.
Amemiya T (1981). Qualitative Response Models: A survey. J. Econ. Lit. 19:483-536
Bayissa G (2010). Adoption of Improved Sesame Varieties in Meisso District, West Hararghe Zone. An M.Sc.Thesis, Haramaya University, Ethiopia, 108p.
Birhanu B (2002). Analysis of Factors Affecting the Adoption of Cross-bred dairy Cows in Central High lands of Ethiopia. The Case of Degam and Girar Jarso Districts, North Shoa Zone, Ethiopia. An M.Sc.Thesis, Alemaya University, Ethiopia
Central Statistics Authority (CSA) (2013). The Federal Democratic Republic of Ethiopia Agriculture in Figures. Addis ababa.
Central Intelligence Agency (CIA) (2010). The Adoption of Agricultural Technologies. Mexico, D.F. CIMMYT.
Damodar NG (2003). Basic Econometrics, 4th edition, McGraw-Hill Higher Education, NewYork, 1002 p.
Degnet A, Belay K (2001). „Factors influencing adoption of high yielding maize varieties in South West Ethiopia: An Application of Logit Analysis‟, Quarterly Journal of International Agriculture. 2:149-167.
Dereje H (2006). Assessment of Farmers‟ Evaluation Criteria and Adoption of Improved Bread Wheat Varieties in Akaki, Central Ethiopia. An M.Sc.Thesis, Haramaya University, Ethiopia.
Feder G, Just RE, Zilberman D (1985). “Adoption of agricultural innovations in developing countries: A Survey”. Econ. Dev. Cult. Chang. 33:255-98.

268 J. Agric. Ext. Rural Dev. Green HW (1991). Economic Analysis. New York University, Macmillan
Publishing Company, New York.783p. Gujarati DN (1995). Basic Econometrics, 3
rd Edition, McGraw-Hill, Inc,
New York. 838p. Healy PM (1985). The Effect of Bonus Schemes on Accounting
Decisions. J. Account. Econ. 8(1-3):85-107. Kidane G (2001). Factors Influencing the Adoption of New Wheat and
Maize Varieties in Tigray, Ethiopia: The Case of Hawzien District. An M.Sc, Alemaya University, Ethiopia, 140p.
Legesse D (1992). Analysis of Factors Influencing Adoption and the Impact of Wheat and Maize Technologies In Aris Nagele,Ethiopia. An M.Sc. Thesis, Alemaya University, Ethiopia, 119p.
Lelisa C (1998). Determinants of Adoption And Intensity and Prfitabilty of Fertilizer Use. The Case of Ejere District. An M. Sc. Thesis, Addis Ababa University, Ethiopia, 75 p.
Liao TF (1994). Interpreting Probability Models: Logit, Probit and other Generalized Models. Sage University Paper series on Quantitative Application in the Social Sciences, California, 87 p.
Maddala GS (1983). Limited Dependent and Qualitative Variables in Econometrics. Cambridge University Press, Cambridge, MA 401p.
Maddala GS (1992). Introduction to Econometrics. 2nd
Edition. Macmillan Publishing Company, New York, 631 p.
Melaku G (2005). Adoption and Profitability of Kenyan Top Bar Hive Beekeeping Technology. Study in Ambasel District of Ethiopia. An M.Sc. Thesis, Haramaya University. Ethiopia.
Mesfin A (2005). Analysis of Factors Influencing Adoption of Triticale (X-Triticosecale Witmack) and Impact, the Case of Farta District. An M.Sc Thesis, Alemaya University, Ethiopia 112 p.
Ministry of Agriculture (MOA) (2011). Animal and Plant Health
Regulatory Directorate Crop Variety Register. Addis Ababa. Pindyck RS, Rubinfeld DL (1981). Econometric Models and Economic
Forecasts. 2nd Edition, McGraw Hill Book Co. New York, 627 p. Tesfaye Z, Girma T, Tanner D, Verkuijl H, Aklilu A, Mwangi W (2001).
Adoption of Improved Bread Wheat Varieties and Inorganic Fertilizer by Small Scale Farmers in Yelma Dansa and Farta Districts of Northern Ethiopia. Mexico, D.F. Ethiopian Agricultural Research Organization (EARO) and International Maize and Wheat Improvement Center (CIMMYT), 42 p.
World Bank (WDB) (2013). Development indicators, URL, http://web.worldbank.org accessed on 10 July, 2014.
Yishak G (2005). Determinants of Adoption of Improved Maize Technology in Damot Gale District, Wolaita, Ethiopia. An M.Sc Thesis, Haremaya University, Ethiopia.

Vol.8(12), pp. 269-283, December 2016
DOI: 10.5897/JAERD2016.0800
Articles Number: 685C8C561697
ISSN 2141-2170
Copyright ©2016
Author(s) retain the copyright of this article
http://www.academicjournals.org/JAERD
Journal of Agricultural Extension and Rural Development
Full Length Research Paper
Farmers’ perception towards climate change and their adaptation measures in Dire Dawa Administration,
Eastern Ethiopia
Alem Kidanu*1, Kibebew Kibret1, Jemma Hajji1, Muktar Mohammed1 and Yosef Ameha2
1College of Agriculture and Environmental Sciences, Haramaya University, P.O. Box 138, Dire Dawa, Ethiopia.
2Ethiopian Institute of Agricultural Research, P. O. Box, 2003, Addis Ababa, Ethiopia.
Received 30 June, 2016; Accepted 1 August, 2016
This study assessed farmers’ perception and adaptation options to climate change in six kebeles selected from different agro-ecological zones of Dire Dawa Administration, eastern Ethiopia. Data for the study were collected from 171 respondents selected through multi-stage sampling technique. Descriptive statistics were employed to assess climate change perception differentials among gender, social groups and institutional settings, while multinomial logit model (MNL) was used to identify factors influencing households’ climate change adaptation options. The results revealed an increment in annual (0.2-1.1°C/decade) and seasonal (0.5-1.4°C/decade) temperatures at all stations and the rate of an increment was found to be higher in the highland areas. Similarly, 76.0 and 81.9% of the interviewed farmers were aware of the change in annual and seasonal temperature respectively and their perception appears to be in accordance with the statistical record of these areas. Whereas, both the annual and seasonal precipitations were found to have no trend, except for one station at Dire Dawa where only annual and summer precipitations were found to have an increasing trend and Kulubi where a winter precipitation was found to have a decreasing trend. Farmers’ perception on the patterns of annual and meher precipitations were in line with the observed data at two stations (Kulubi and Dengego). On the other hand, the surveyed farm households in the study area perceived at least one aspect of climate change primarily through their life experience. The majority of farmers (81.87%) adapted to climate change stresses using the adaptation strategies such as soil and water conservation with or without agronomic practices like change in cropping time; crop type and variety and crop diversification. Results of the multinomial logit model showed that farm size, level of education of household head, agro-ecology, livestock owned, farm income and credit service significantly and positively influences one or a combination of climate change adaptation strategies identified by farmers. On the other hand, gender, age of the household head and non-farm income were found to influence the adaptation strategies pursued by farmers negatively and significantly. Therefore, an effort that enhances farmers’ education, farm and livestock productivity, and credit services in accordance with different agro-ecologies so as to create the capacity to adapt to climate induced stresses remain an important strategy that policy makers at all levels of the administration should consider. In addition, sex, age and non-farm income of the household should also be sought critically. Key words: Climate change, adaptation, perception, determinants, multinomial logit model.

270 J. Agric. Ext. Rural Dev. INTRODUCTION The Intergovernmental Panel on Climate Change (IPCC) in 2007 reported that there is a statistically significant increase in the global mean state of the climate or in its variance, and further increases are expected if carbon dioxide (CO2) and greenhouse gas (GHG) emissions are not controlled. Moreover, there is a general agreement that the earth’s climate is undergoing changes, and observations are consistent with scientific expectations regarding the increasing concentration of GHG in the atmosphere. On the other hand, human activities, such as burning of fossil fuels, deforestation, and/or poor natural resource management have changed the global climate resulting in an increased temperature and alter the amount, intensity and distribution of precipitation and sea level rising (IPCC, 2007).
Climate change has adversely affected the livelihood of people in developing countries where a large proportion of the population is heavily dependent on agriculture, and has exacerbated poverty, food insecurity and vulnerability of agro-pastoral community in sub-Saharan Africa (Bryan et al., 2009). Ethiopia, a country having dependent on the agricultural sector (accounts for about 52% of the GDP and 85% of the foreign exchange earnings, and employs about 80% of the population) (CSA, 2007) could be widely held as one of the most vulnerable countries to future climate change stresses (Conway and Schipper, 2011).
A recent mapping on vulnerability and poverty in Africa has ranked Ethiopia as one of the most vulnerable countries in the continent with the least adaptive capacity to climate change. Even though, the impact of climate change is not limited to the occurrence of drought (Lautze et al., 2003), Ethiopia has suffered from at least five major national drought since 1980, apart from numerous local drought all over the country (ILRI, 2006; ACCCA, 2010). In addition other important climate variables such as daily temperature, precipitation (type, frequency and intensity), wind, relative humidity and cloud are also changing, implying the multiple aftermath of the change in climate in the country.
Tadege (2007) indicated that, over the last decade an average minimum and maximum temperatures of the country have increased by around 0.25 and 0.1°C, respectively, and further it is expected that in the year 2050 mean temperature will increase by 1.7 to 2.1°C. Though, most climate models support this increase in temperature, there is contradictory ideas as to the change in precipitation, where both increase and decrease are forecasted depending on the model employed (Strzepek and Mccluskey, 2006). Accordingly, high variability in precipitation is observed in the country
over the past decade (Deressa et al., 2011). Hence, the change in climate is inevitable, at least in the near future, and Ethiopian farmers are now confronted with adapting this inevitable change in climate. Following IPCC (2001, 2007), adaptation to climate change refers to the adjustment in natural or human system in response to actual or expected climatic stimuli or their effect, which moderates harm or exploit beneficial opportunities. Adaptation could be effected at different scale such as, individual or farm level, and national and international level. Adaptation at farm level involves two stages: Perceiving the change in climate, and deciding whether to adapt or not, or which adaptation strategy to choose (Maddison, 2007). Moreover, Hassan and Nhemachena (2008), Deressa et al. (2008), Ishaya and Adaje (2008), Mutekwa (2009) and Oxfam (2010) indicated that, adaptation measures for climate change depend on the level of understanding of the issue and consequence, the degree of impact and technological capacity of farmers. They also indicated that, changing of planting (transplanting) dates, changing of crop type, soil moisture conservation practices, expanding of farm lands, crop diversification and farm income diversification (casual labor) are repeatedly reported as the adaptation options under small-scale and subsistence farmers.Even though farmers in the study area have a long history of responding to climate change stresses, there is a large deficit of information on the process of adaptation in developing world including Ethiopia (Smith and Pilifosova, 2001). However, though there are currently few research outputs in Ethiopia, almost all focused on highlands of Ethiopia with sufficient precipitation (Deressa et al., 2009; Tesso et al., 2012; Mulatu, 2013). Hence, there is a need to study the other part of the country with low laying topography and smaller amount of precipitation like Dire Dawa Administration which is characterized by agro-pastoral community with small average land holding that is highly degraded than the other parts in the country and follows a mixed crop-livestock production system. In addition, the Administration is also one of the food insecure areas with frequent need for emergency food aid (BoARD, 2009). Therefore, a study on farmers’ perception on climate change, their adaptation choices and the determinants of adaptation choices in the study area could supplement the current knowledge on perception and adaptation process in the country and could substantially contribute to plan development interventions in the Administration. Hence, the objectives of this study were to explore farmers’ perception on climate change; to identify adaptation options used by farmers in response to climate change, and to identify the determinants of adaptation options to climate change in the study area.
Corresponding author: [email protected].
Author(s) agree that this article remain permanently open access under the terms of the Creative Commons Attribution
License 4.0 International License

METHODS
Study area, sampling and data collection
The study was carried out in Dire Dawa Administration (DDA) which is astronomically located between 9° 27` to 9° 49` N and 41° 38`- 42° 19’ E longitude and found in the eastern part of Ethiopia 515 km away from the capital Addis Ababa and 330 km to the west of the republic of Djibouti (IDP, 2006). DDA is organized into 38 rural and 9 urban kebeles (Smallest administrative unit). It has a rugged and undulating mountainous topography ranging from 1000 to 2260 m asl with a total annual rainfall ranging between 410 to 850 mm and extreme temperature ranging from 14.5 to 34.6°C. The study area covers a total area of 1332.62 km2 and an estimated total population of 377,000 (CSA, 2007). Agriculture (both crop and livestock production) is the main stay of the economy in the study area. Subsistence mixed farming constitutes 93% of the total farm households in the study area.
For collecting primary data the study employed a multistage sampling technique to select sample farm household. In the first stage, out of the 38 kebeles in the Administration, six kebeles, of which four (Biyo-Awale, Adada, Legebira and Eja-Aneni) are selected from densely populated eastern Woinadega (area with altitude between 1500-2400 m. a. s. l and relatively colder and wetter) zone and two (Gedensar and Goleadeg) from sparsely populated western kola zone (area with altitude between 500-1500 m. a. s. l and are relatively drier and warmer IDP (2006)). were randomly selected to represent different attributes of the Administration with respect to agro-ecological differences, and agricultural production systems. In the second stage, a total of 171 farm households were
sampled randomly using probability proportional to the size (PPS) of the total households of each kebele. To select sample households from the selected kebeles, list of household heads has been used. Enumerators were trained for one day to familiarize them with the issues of data collection and the questionnaire was pretested.
Both primary and secondary data were collected from different sources. Primary data were collected using a structured questionnaire, whereas data on the physical, socio-economic and demographic variables of each kebele, and information on climate condition in the study area were gathered from secondary sources such as repots previous studies.
Data analysis
This study employed both qualitative and quantitative analysis techniques. The qualitative analyses used interpretations, comparisons and arguments. The quantitative analyses made use of both descriptive statistics and econometric techniques. Farmers’ perception analysis was subjected to descriptive statistics tools such as mean, frequency and percentages. In addition, probability distribution tests like independent t-test and chi-square test were used to test whether there is a statistically significant differences between the two groups (who perceive climate change and not) in terms of continuous and categorical variables, respectively.
Econometric analysis
The decision of whether to use any adaptation option or not could fall under the general framework of utility maximization (Komba and Muchapondwa, 2012). Consider a rational farmer who seeks to maximize the present value of expected benefits of production over a specified time horizon, and must choose among a set of j adaptation options. Farmer i decide to use j adaptation option if the perceived benefit from option j is greater than the utility from other options (say, k) depicted as:
Uij (βj Xi +εi) > Uik (βk Xi + εk), k j (1)
Kidanu et al. 271 Where Uij and Uik are the perceived utility by farmer i of adaptation options j and k, respectively; Xi is a vector of explanatory variables that influence the choice of the adaptation option; β j and βk are parameters to be estimated; and εj and εk are the error terms. Both multinomial logit (MNL) and multinomial probit (MNP) regression models estimate the effect of explanatory variables on a dependent variable involving multiple choices with unordered response categories (Deressa et al., 2008). However, due to computational simplicity, the MNL specification was used to model climate change adaptation behavior of farmers involving discrete dependent variables with multiple unordered choices (Deressa et al., 2009; Legesse et al., 2013; Tessema et al., 2013). Deressa et al. (2009) indicated that, the model is normally estimated using the iterative maximum likelihood estimation procedure, which yields unbiased, efficient and consistent parameter estimates.
To describe the MNL model, let y denote a random variable taking on the values (1, 2, . . ., J) where J is a positive integer, and let x denote a set of conditioning variables. In this case, y denotes adaptation options or categories and x represents the different household, institutional and environmental attributes affecting adaptation options. The question is how changes in the elements of x affect, keeping other factors constant, the response probabilities P(y = j|x), j = 1, 2… J. Since the probabilities must sum to unity, P(y = j|x) is determined ones we know the probabilities for j = 2... J.
Let x be a 1 x K vector with first element unity. Thus, the probability that household i with characteristic x choose adaptation option j is specified as follows:
( ) ( )
[ ∑ ( )
] (2)
Where P stands for probability, j stands for adaptation option, x for explanatory variables and βj = K x 1 coefficients, j = 1, 2. . , J.
The MNL, however, works under the assumption of the Independence of Irrelevant Alternatives (IIA). Following this assumption, the odds of any two outcomes are independent of the remaining outcomes available. Hence, omitting or adding outcomes should not affect the odds of the remaining outcomes (Long and Freese, 2001). It indicates that the probability of using a certain adaptation option by a given household needs to be independent from the probability of choosing another adaptation option (that is, Pj/Pk is independent of the remaining probabilities). Thus, before data analysis and presentation, the model has to be tested for the validity of the IIA assumptions, using the Hausman test as explained in Hassan and Nhemachena (2008) and Deressa et al. (2009).
The parameter estimates of the MNL model only show the direction of the relationship between the dependent and independent variables. Therefore, to determine the actual magnitude of change of probabilities, the marginal effect of the explanatory variables, the MNL equation has to be differentiated. Differentiating the equation of multinomial logit model with respect to the explanatory variable provides marginal effect of the explanatory variable (the probability of change in dependent variable with a unit change in the independent variable). This will be calculated as follows:
(3) The marginal effects or marginal probabilities are functions of the probability itself and measure the expected change in probability of a particular choice being made with respect to a unit change in an independent variable from the mean.
Moreover, the model will be tested for multicollinearity using the variance inflation factor (VIF) computed as follows:
)3(∂
∂∑
1
1
jk
J
j jjkj
k
j
PPXP

272 J. Agric. Ext. Rural Dev. Table 1. Explanatory variables hypothesized to affect farmers’ choice of climate change adaptation options in the study area.
Variable Definition Description Expected sign
Agro-ecology Local agro-ecology (kola and weynadega) Dummy, takes the value of 1 if kola and 0, otherwise ±
Sex Sex of the household head Dummy, takes the value of 1 if male and 0, otherwise ±
Age Age of the household head Continuous +
Education Educational status of household heads Dummy, takes the value1 if illiterate and 0, otherwise +
Family size Family size of the household Continuous +
Farm size Land holding per family Continuous +
Farm income Farm income Continuous +
Non-farm income Non-farm income Continuous +
Livestock Livestock holding in TLU Continuous +
Extension Access to extension service Dummy, takes the value of 1 if yes and 0, otherwise +
Credit Access to credit service Dummy, takes the value of 1 if yes and 0, otherwise +
Climate information Access to climate information Dummy, takes the value of 1 if yes and 0, otherwise +
jR=jVIF2
11 (4)
Where VIFj is variance inflation factor, Rj
2 is the coefficient of determination that results when one explanatory variable (j) is regressed against all other explanatory variables. By default, value of VIF greater than 10 is assumed to indicate model multicollinearity problem (Gujarati, 1995). Variable definition and working hypothesis
The dependent variable for MNL model used in this study was households’ choice of adaptation strategies against climate change stresses. The alternative climate change adaptation strategies include soil and water conservation (SWC) practice solely and SWC plus one agronomic practice, SWC plus two agronomic practices and SWC plus three agronomic practices. The agronomic practices include change in planting date, crop diversification and changing crop varieties). Farmers’ usually adopt more than one adaptation strategy at a time (Tessema et al., 2013). To apply MNL model, the dependent variable has to be defined in a way that ensures mutually exclusive outcomes. On the other hand, farmers’ choice of adaptation strategy is affected by the socio-economic characteristics, institutional, and agro-ecological setting of the households. Therefore, the hypothesized factors are discussed below and the description of each explanatory variable is given in Table 1.
The agro-ecology in which the household lives is expected to influence their choice of adaptation to climate change. In Ethiopia, areas categorized as kola (lowland, 500 to 1500 masl) are characterized by relatively hotter and drier climate whereas weynadega (middle land 1500 to 2500 masl.) and dega (highland, 2500 to 3500 m asl.) are wetter and cooler (Deressa et al., 2009). In this study, the sampled peasant associations fall under either kola or weynadega. Evidences revealed that farmers in drier and hotter climate are more likely to respond to climate change than farmers in cooler and wetter areas (Tesso et al., 2013). On the other hand, Deressa et al. (2009), Legesse et al. (2013) and Tessema et al. (2013) reported that farmers living in different agro-ecological settings have their own choice of adaptation methods. Deressa et al. (2009) observed that farming in the kola zone significantly increases the probability of soil and water conservation practices, compared to farming in weynadega. However, farming in kola significantly reduces the probability of using different crop
varieties, planting trees, and irrigation as compared to farming in weynadega. Hence, agro-ecology was hypothesized to have a positive or negative effect on household’s adoption decision on climate change adaptation options.
Male-headed households in Ethiopia have been considered to have access to information, agricultural inputs, institutions and other attributes. Hence, they have a significant and positive influence on adoption of climate change adaptation strategies (Deressa et al., 2009; Legesse et al., 2013). Similarly, female-headed households in Ethiopia in general and in Eastern Hararghe in particular are expected to be less likely to adapt due to their limited access to land, information, inputs and institutions as a result of traditional social barriers (Wilson and Getnet, 2011). In contrast, Nhemachena and Hassan (2007) noted that female-headed households are more likely to adopt climate change adaptation methods. The authors argued that most agricultural operation in Africa is performed by female farmers that might give the opportunity to perceive the impact of climate change. This study followed the former argument which indicated that male headed households were more likely to use adaptation methods as they have more access to resources and information.
Adaptation to climate change is obtained from experience accumulated over time (Mutekwa, 2009). Similarly, farmers with more years of farming experience are more capable of assessing the available technologies and making adaptation decisions (Gbetibouo, 2009). Moreover, Deressa et al. (2009) and Tesso et al. (2012) also indicated that age of the household has a positive and significant effect on adopting climate change adaptation options. Experienced farmers are more likely to use one or more climate change adaptation strategies (Maddison, 2006). Thus, in this study, age was expected to affect climate change adaptation options positively.
Since adaptation to climate change is a response for understanding the issue and its long term consequences. In this regard, education could influence the rate of technology adoption by improving awareness. The more a farmer is educated, the more likely he/she is to access information, perceive and adapt to climate change (Maddison, 2007). Hence, a positive relationship between level of education and adaptation decisions is expected. Deressa et al. (2008) indicated that positive and significant effect of education on adopting the climate change adaptation methods is observed in Ethiopia. Similarly, Maddison (2006) noted experienced farmers are more likely to perceive climate change, but educated farmers are more likely to respond by making at least one adaptation. Hence, education was hypothesized to have a positive influence on the farmers’ decision to adopt one or more climate change adaptation
options.
Increasing household income is reported to increase the probability of adopting climate change adaptations (Deressa et al., 2009; Lema and Mjule, 2009). This could be apparent that adaptation to climate change is capital intensive and hence increased income will encourage the investment capacity on adaptation options. Thus, this variable was hypothesized to have a positive influence on choice decision of the climate change adaptation options.
Taddesse (2011) and Tessema et al. (2013) showed that, farmers with large farm size have adopted one or a combination of climate change adaptation options as compared to the farmers with small land holdings. Moreover, Mulatu (2013) noted that households’ farm size is one of the most important factors that significantly affect farmers’ preferences for the adaptation strategies to climate change. Thus, farm size was hypothesized to have positive effect on adaptation to climate change.
Livestock is generally considered to be an asset that could be used either in the production process or be exchanged for cash or other productive assets. Deressa et al. (2009) and Taddesse (2011) also showed positive influence of livestock ownership on adoption of climate change adaptation options. Therefore, it was hypothesized that the livestock holdings of the household to affect climate change adaptation options positively.
Deressa et al. (2008) and Tesso et al. (2012) reported that access to credit has a positive and significant impact on the likelihood of using soil conservation, changing planting dates, and using irrigation. This result entails the important role of increased institutional support in promoting the use of adaptation options to reduce the negative impact of climate change. On the other hand, Legesse et al. (2013) and Tessema et al. (2013) noted insignificant effect of credit on the decision to adopt climate change adaptation options and even affecting negatively depending on the type of adaptation option. This study, however, hypothesized that there was a positive relationship between access to credit and climate change adaptation.
Extension services foster adaptation through enhancing farmers’ awareness of climate change and knowledge on adaptation measures (Falco et al., 2011; Nhemachena and Hassan, 2007). Deressa et al. (2008) also indicated that, access to extension showed positive and significant effect on adaptation of climate change. Similarly, Maddison (2006) reported that farmers who enjoy extension advice are likely to adapt climate change. Furthermore, he suggested that expansion of farmer training center and extension advice could hasten the effort to adapt climate change impacts. Hence, access to extension and climate information was hypothesized to have a positive relation with the household’s adoption decision on climate change adaptation options.
RESULTS AND DISCUSSION Farmers’ perception on temperature and precipitation trends, factors affecting farmers’ perception towards climate change, farmers’ perceived shocks and adaptation strategies, and determinants of climate change adaptation strategies are presented here. Farmers’ perception about temperature and precipitation trends There are differences among sample farmers on how they perceive changes in temperature (Table 2).
The results revealed that, regardless of agro-ecology,
Kidanu et al. 273
most farmers perceived an increasing trend of mean annual (76.0%) and summer season (79.5%) temperatures. In line with this, Deressa et al. (2011), Mengistu (2011), Taddesse (2011) and Tessema et al. (2013) reported that most of the farmers in Ethiopia are aware of the fact that temperature is increasing. On the other hand, a chi-square test indicates that, there was a significant (p<0.01) difference between farmers in their perception of annual, summer, and winter season temperature (Table 2).
Analysis of historical temperature data (1980-2014) from the nearby observatory stations revealed that both annual and seasonal temperatures in the study areas show an increasing trend (Table 3). As a result, mean annual temperature has increased by 0.7, 1.1, 0.7 and 0.2°C per decade, respectively, at Dire Dawa, Kulubi and Errer stations significantly but non- significantly in Dengego station. In general, an increasing trend in temperature has been observed both during summer and winter seasons in all stations. Similarly, it was revealed that, over the past decade, average minimum and maximum temperatures of the country have increased by around 0.25 and 0.1°C respectively. Further, it is expected that in the year 2050, mean temperature will increase by 1.7 to 2.1°C (Tadege, 2007). Farmers’ perception on seasonal and mean annual temperature changes (Table 2) has been supported with observed meteorological data (Table 3). The perception of farmers’ on the increasing trend of annual and summer temperature was agreed with observed data at all stations. However, it is not consistent with the temperature records during the winter season at Kulubi and Dengego stations.
Similarly, there are differences among farmers in how they perceive changes in precipitation pattern (Table 4). The result indicates that, 80.1 and 78.4% of the farmers perceive a decrease in the amount and total days of precipitation respectively over the last 20 to 30 years; whereas 1.8 and 3.5% of the farmers replied an increase in the amount and total days of precipitation respectively. On the other hand, 14.6 and 15.8% of the farmers indicated that, they did not see an increase or decrease in the amount and total days of precipitation, rather its variable. In line with this result, Deressa et al. (2011) indicated that, high variability in precipitation was observed in the country over the last decade. A chi-square test result also indicated that there was a significant (p<0.01) difference between farmers in their perception on the patterns of precipitation.
Here also, the analysis of historical precipitation data (1980-2014) from the nearby observatory stations revealed that both annual and seasonal precipitations in the study areas had no trend, except for Dire Dawa where only annual and summer (Main rain season) precipitations were found to have an increasing trend and Kulubi where a winter (Short rain season) precipitation was found to have a decreasing trend (Table 5). Farmers’ perception on seasonal and mean annual precipitation

274 J. Agric. Ext. Rural Dev. Table 2. Farmers’ perception (%) of annual and seasonal temperature trends in Dire Dawa, Ethiopia (N = 171).
Farmers’ perception
Annual Summer Winter
Increase No
change
Do not
know Increase Decrease
No change
Do not
know Increase Decrease
No change
Do not
Know
Not perceived 0 5 26 0 0 6 25 0 0 23 8
Perceived 130 0 10 136 4 0 0 69 71 0 0
Total 130 5 36 136 4 6 25 69 71 23 8
% 76.0 2.8 21.2 79.5 2.4 3.5 14.6 40.4 41.5 13.5 4.6
χ2 109.069*** 144.820*** 144.986***
***Statistical significance at 1% probability level.
Table 3. Trends of annual and seasonal temperatures at four stations in and around Dire Dawa administration.
Stations Annual Summer Winter
Mean Slope S Mean slope S Mean slope S
Dire Dawa 31.92 0.07 0.71*** 33,88 0.07 0.61*** 31.39 -0.09 -0.50***
Kulubi 21.85 0.11 0.60*** 22.90 0.13 0.62*** 21.86 014 0.58***
Dengego 23.78 0.02 0.11ns
24.4 0.05 0.41** 23.79 0.05 0.31**
Errer 37.27 0.07 0.43*** 34.48 0.09 0.50*** 30.61 -0.06 -0.40***
S, Spearman’s rho; slope, change in C/decade; ns, non-significant; ** and *** significant at 5 and 1% probability levels, respectively.
Table 4. Farmers’ perception (%) of precipitation pattern in Dire Dawa, Ethiopia (N = 171).
Variable
Change in amount of rain fall Change in time of rain fall
Increased Decreased The same Do not know
Increased Decreased The
same Do not know
Not-perceived 0 0 6 25 0 0 4 27
Perceived 3 137 0 0 6 134 0 0
Total 3 137 6 25 6 134 4 27
% 1.8 80.1 3.5 14.6 3.5 78.4 2.3 15.8
χ2 179.761*** 151.230***
***Statistical significance at 1% probability level.
Table 5. Trends of annual and seasonal rainfall totals in Dire Dawa and its surrounding, eastern Ethiopia for the period 1980-2014.
Stations Annual Summer Winter
Mean Slope S Mean Slope S Mean Slope S
Dire Dawa 614.8 3.28 0.19* 314.2 1.7 0.17* 194.5 0.11 0.01ns
Kulubi 985.8 -3.18 -0.14ns
644.4 2.8 0.10ns
245.5 -8.09 -0.36***
Dengego 775.5 6.7 0.20ns 613.9 4,7 0.18ns
180 0.79 0.06ns
S, Spearman’s rho; Slope (Sen’s slope) is the change (mm)/annual; ns is non-significant trend at 0.05 and 0.1 and ***, *significant trend at 1 and 10% probability levels, respectively.
patterns (Table 4) has been supported with observed meteorological data (Table 5). The perception of farmers’ on the patterns of annual and summer precipitations was in line with the observed data at two stations (Kulubi and Dengego). However, it is not consistent with precipitation
records of Dire Dawa station. This result is in line with the findings of Bewket and Conway (2007) and Ayalew et al. (2012) that reported the direction and magnitude of the trend in seasonal precipitation in Amhara regional state of Ethiopia varied from station to station.

Kidanu et al. 275
Table 6. Sample households’ characteristics for continuous variables.
Variable Perceived CC (N=140) Not perceived CC (N=31)
t-Value Mean (Std.) Mean (Std.)
Age 41.70 (8.53) 42.160 (12.26) 0.250ns
Family size 6.130 (2.07) 4.940 (1.22) -2.976*
Active labor force 3.685 (1.4) 3.024 (2.07) -2.427**
Farm land size (ha) 1.07 (0.6) 0.63 (0.35) -3.954***
Livestock owned (TLU) 6.52 (4.63) 4.13(2.26) -2.791***
On Farm income (birr) 21497.86 (8858.41) 12090.32 (4186.45) -5.762***
Non- farm income (birr) 2055.00 (4469.44) 4838.71 (5580.30) 2.993***
*, **, ***, significance at 10, 5 and 1% probability levels.
The major driving factors that influence rainfall patterns in Ethiopia are the southern oscillation index and the sea surface temperature (SST) over the tropical eastern Pacific Ocean (Seleshi and Zanke, 2004). However, within the regions of Ethiopia, precipitation is governed with elevation (Conway, 2000). Factors affecting farmers’ perception on climate change Although there are differences among farmers in how they perceive change in temperature and precipitation (Tables 2 and 3), 140 (81.87%) of the interviewed households were found to perceive change in climate variables whereas 31 (18.13%) of the remaining households do not perceive change. On the other hand, the result presented in Table 6 shows that the average age of the household head that perceived change in climate was 41.70 years while those who did not perceive were 42.16 years. Age is considered as a proxy to the farming experience of the household, which is likely to have a significant influence on perception of climate change. The independent samples t-test showed non-significant difference in average age between households who perceived change in climate and those who did not.
The result also shows that the average household size was higher for the households who perceived climate change (6.13 individuals per household) than their counterpart (4.94 persons per household) (Table 6). The difference in mean family size between households who perceived change in climate and those who did not perceive change was statistically significant (p<0.01). This indicates that household size can influence adaptation because of its association with labor endowment. It is argued that a larger household size enables the adoption of technologies by availing the necessary labour force in one hand (Croppenstedt et al., 2003) and additional income from extra labor invested in off/non-farm activities (Yirga, 2007). Similarly, Deressa et al. (2009) and Tesso et al. (2012) reported that farmers with strong financial capacity had increased perception of
climate change and respond to adapt its impact. The result presented in Table 6 also indicates that
households who perceive the existence of climate change have more number of economically active family members (3.685 persons per household), compared to the households who did not perceive climate change (3.024 persons per household) (Table 6). Moreover, the difference between the two groups was statistically significant (p<0.05). Increase in economically active family member might contribute to increased income of the family, resulted from non-farm engagements, which in turn improved financial capacity. Farmers with strong financial capacity had increased perception of climate change and respond to adapt its impact (Deressa et al., 2009; Tesso et al., 2012).
The result presented in Table 7 shows that, 55.6% of the interviewed households were illiterate and the rest (44.4%) were literate with a background ranging from reading and writing up to third cycle (grade 9-12). With regard to climate change perception, the chi-square test revealed that the difference between the illiterate and literate was statistically significant (p<0.01).
In this study, out of 171 respondents, 36 (21%) are female-headed while the rest 135 (79%) are male-headed households (Table 7). With regard to climate change perception, 88.15 and 58.33% of the respondents, respectively, in the male-headed and female-headed household had perceived the presence of climate change. The chi-square test also shows that the average difference between the two gender groups was statistically significant (p<0.01). This result supported the idea that male-headed households are often considered to be more likely to get information about climate change (Asfaw and Admassie, 2004).
Household wealth (land, livestock and income) highly influences adoption decisions of farmers (Deressa et al., 2009; Asfaw et al., 2011). Shortage of land is observed to be one of the major barriers in adaptation to climate change (Bryan et al., 2009; Maddison, 2007). The result in Table 6 revealed that, the mean farm size of those who perceived and did not perceived climate change was 1.067 and 0.625 ha, respectively. The independent
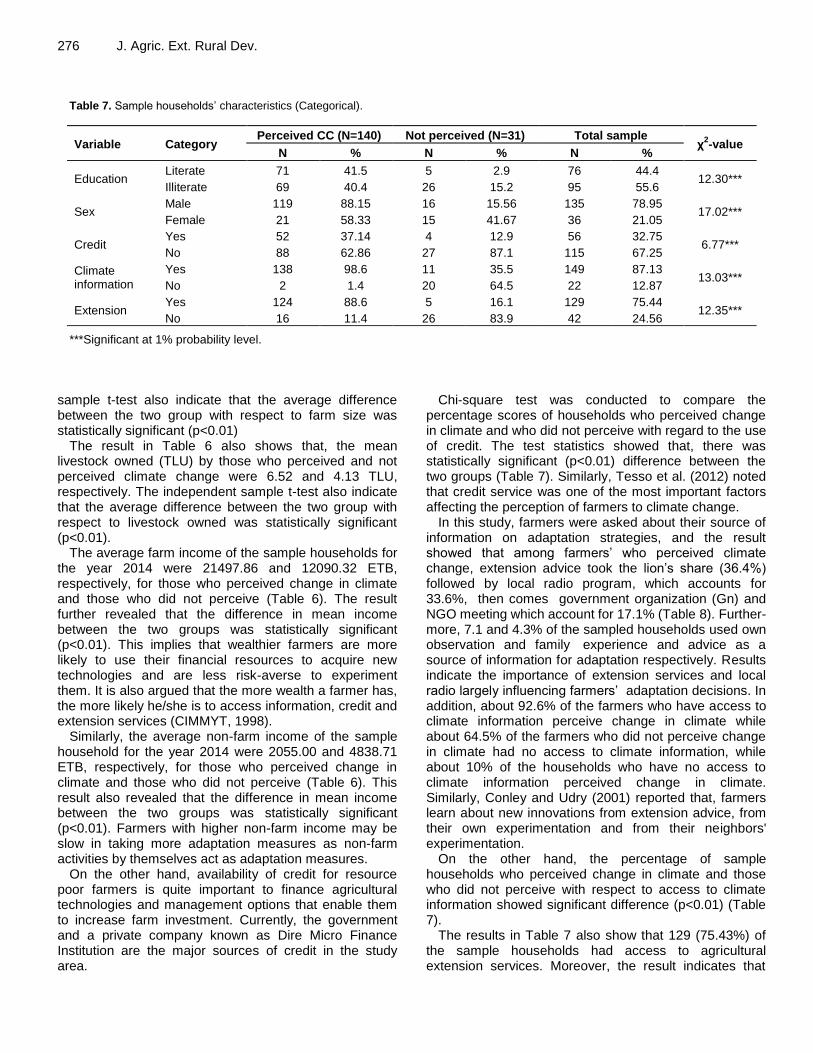
276 J. Agric. Ext. Rural Dev.
Table 7. Sample households’ characteristics (Categorical).
Variable Category Perceived CC (N=140) Not perceived (N=31) Total sample
χ2-value
N % N % N %
Education Literate 71 41.5 5 2.9 76 44.4
12.30*** Illiterate 69 40.4 26 15.2 95 55.6
Sex Male 119 88.15 16 15.56 135 78.95
17.02*** Female 21 58.33 15 41.67 36 21.05
Credit Yes 52 37.14 4 12.9 56 32.75
6.77*** No 88 62.86 27 87.1 115 67.25
Climate information
Yes 138 98.6 11 35.5 149 87.13 13.03***
No 2 1.4 20 64.5 22 12.87
Extension Yes 124 88.6 5 16.1 129 75.44
12.35*** No 16 11.4 26 83.9 42 24.56
***Significant at 1% probability level.
sample t-test also indicate that the average difference between the two group with respect to farm size was statistically significant (p<0.01)
The result in Table 6 also shows that, the mean livestock owned (TLU) by those who perceived and not perceived climate change were 6.52 and 4.13 TLU, respectively. The independent sample t-test also indicate that the average difference between the two group with respect to livestock owned was statistically significant (p<0.01).
The average farm income of the sample households for the year 2014 were 21497.86 and 12090.32 ETB, respectively, for those who perceived change in climate and those who did not perceive (Table 6). The result further revealed that the difference in mean income between the two groups was statistically significant (p<0.01). This implies that wealthier farmers are more likely to use their financial resources to acquire new technologies and are less risk-averse to experiment them. It is also argued that the more wealth a farmer has, the more likely he/she is to access information, credit and extension services (CIMMYT, 1998).
Similarly, the average non-farm income of the sample household for the year 2014 were 2055.00 and 4838.71 ETB, respectively, for those who perceived change in climate and those who did not perceive (Table 6). This result also revealed that the difference in mean income between the two groups was statistically significant (p<0.01). Farmers with higher non-farm income may be slow in taking more adaptation measures as non-farm activities by themselves act as adaptation measures.
On the other hand, availability of credit for resource poor farmers is quite important to finance agricultural technologies and management options that enable them to increase farm investment. Currently, the government and a private company known as Dire Micro Finance Institution are the major sources of credit in the study area.
Chi-square test was conducted to compare the percentage scores of households who perceived change in climate and who did not perceive with regard to the use of credit. The test statistics showed that, there was statistically significant (p<0.01) difference between the two groups (Table 7). Similarly, Tesso et al. (2012) noted that credit service was one of the most important factors affecting the perception of farmers to climate change.
In this study, farmers were asked about their source of information on adaptation strategies, and the result showed that among farmers’ who perceived climate change, extension advice took the lion’s share (36.4%) followed by local radio program, which accounts for 33.6%, then comes government organization (Gn) and NGO meeting which account for 17.1% (Table 8). Further-more, 7.1 and 4.3% of the sampled households used own observation and family experience and advice as a source of information for adaptation respectively. Results indicate the importance of extension services and local radio largely influencing farmers’ adaptation decisions. In addition, about 92.6% of the farmers who have access to climate information perceive change in climate while about 64.5% of the farmers who did not perceive change in climate had no access to climate information, while about 10% of the households who have no access to climate information perceived change in climate. Similarly, Conley and Udry (2001) reported that, farmers learn about new innovations from extension advice, from their own experimentation and from their neighbors' experimentation.
On the other hand, the percentage of sample households who perceived change in climate and those who did not perceive with respect to access to climate information showed significant difference (p<0.01) (Table 7).
The results in Table 7 also show that 129 (75.43%) of the sample households had access to agricultural extension services. Moreover, the result indicates that
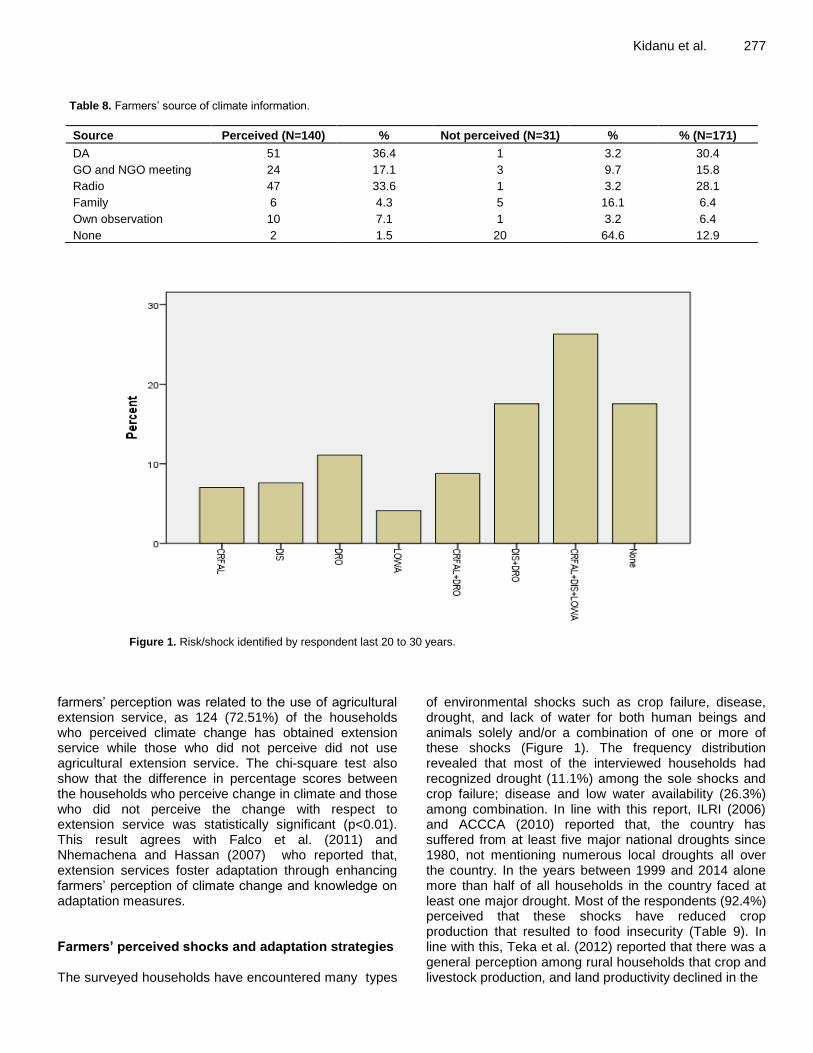
Kidanu et al. 277
Table 8. Farmers’ source of climate information.
Source Perceived (N=140) % Not perceived (N=31) % % (N=171)
DA 51 36.4 1 3.2 30.4
GO and NGO meeting 24 17.1 3 9.7 15.8
Radio 47 33.6 1 3.2 28.1
Family 6 4.3 5 16.1 6.4
Own observation 10 7.1 1 3.2 6.4
None 2 1.5 20 64.6 12.9
Figure 1. Risk/shock identified by respondent last 20 to 30 years.
farmers’ perception was related to the use of agricultural extension service, as 124 (72.51%) of the households who perceived climate change has obtained extension service while those who did not perceive did not use agricultural extension service. The chi-square test also show that the difference in percentage scores between the households who perceive change in climate and those who did not perceive the change with respect to extension service was statistically significant (p<0.01). This result agrees with Falco et al. (2011) and Nhemachena and Hassan (2007) who reported that, extension services foster adaptation through enhancing farmers’ perception of climate change and knowledge on adaptation measures. Farmers’ perceived shocks and adaptation strategies The surveyed households have encountered many types
of environmental shocks such as crop failure, disease, drought, and lack of water for both human beings and animals solely and/or a combination of one or more of these shocks (Figure 1). The frequency distribution revealed that most of the interviewed households had recognized drought (11.1%) among the sole shocks and crop failure; disease and low water availability (26.3%) among combination. In line with this report, ILRI (2006) and ACCCA (2010) reported that, the country has suffered from at least five major national droughts since 1980, not mentioning numerous local droughts all over the country. In the years between 1999 and 2014 alone more than half of all households in the country faced at least one major drought. Most of the respondents (92.4%) perceived that these shocks have reduced crop production that resulted to food insecurity (Table 9). In line with this, Teka et al. (2012) reported that there was a general perception among rural households that crop and livestock production, and land productivity declined in the

278 J. Agric. Ext. Rural Dev.
Table 9. Perceived effects of climate induced shocks in the study area.
Climate induced disaster Respondent
N=171 Percent
Crop productivity decline 158 92.4
Shortage of water for home/animal consumption 168 98.2
New pests (weeds and insects) 135 79.0
Loss of landrace cultivars 125 73.1
Figure 2. Copping strategies implemented by farmers in the study area.
last 20 years. Determinants of adaptation option The multinomial Logit model was run and outcomes are compared with the models’ base category which is ‘no-adaptation’ (Table 10). An important assumption of the MNL is Independence of Irrelevant Alternatives (IIA) and the model was tested using the Hausman test to see if it fulfills this assumption. The Hausman test supported that IIA is not violated with χ
2 ranging from -1.305 to 1.393 with
probabilities almost equal to 1.0. To make sure that the explanatory variables do not cause a multicollinearity problem, auxiliary regression was fitted and VIF was calculated. All the VIF values are less than 10 (1.17- 3.48) indicating the absence of severe multicollinearity. Hence, all the hypothesized continuous and categorical explanatory variables were included in the model.
The parameter estimates of the MNL model provide only the direction of the effect of the independent variables on the dependent variables, but not the magnitude of change of its probability. Thus, marginal effects which measure the expected change in probability of a particular choice being made with respect to a unit change in an independent variable are calculated and presented in Table 10.
The MNL analysis result shows that, farm size, education of the household head, agro-ecology, livestock ownership, farm income, climate information and credit service positively and significantly influence using one or a combination of climate change adaptation strategies identified by farmers. On the other hand, sex and age of the household head and non-farm income were found to influence the adaption strategies noted by farmers negatively. The above mentioned variables that signifi-cantly influence climate change adaptation options are discussed here under.

Sex of the household head As clearly indicated in Table 10, sex of the household head is one of the most important variable that significantly affect choice of climate change adaptation options. As can be seen from Table 10, being female headed household decreases the likelihood to use SWC solely, and SWC plus one agronomic practice as climate change adaptation strategies by 1.42 and 3.15%, respectively. This could be due to the fact that these strategies require labor and financial input than other strategies. This result goes with the argument that female-headed households in Ethiopia in general and in East Hararghe in particular are less likely to adapt due to their limited access to land, information, inputs and institutions as a result of traditional social barriers (Wilson and Getnet, 2011). Contrary to this result however, Nhemachena and Hassan (2007) found that female headed households are more likely to take up adaptation measures than male-headed households. On the other hand male headed households are reported to be more likely to get information about new technologies and involve in such business than female headed households (Asfaw and Admassie, 2004). Similarly, Deressa et al. (2009), Legesse et al. (2013) and Mulatu (2013) concluded that being male headed households increases significantly the ability and choice of households’ climate change coping strategies. Age of the household head Age of the household head, which is considered as a proxy indicator for farming experience, affects SWC adaptation strategy significantly and negatively. The result revealed that a unit increase in the age of the household head decreases the probability of adopting soil and water conservation practices by 3.2%. This might be related to the intensive labor requirement of soil and water conservation practices that might prohibit farmers’ from practicing it as they get older. In line with this result, Adesina and Baidu-Forson (1995) reported that more experienced or older farmers tend to be risk-averse and lag behind in adoption decisions. Whereas, Deressa et al. (2011) and Tesso et al. (2012) reported that age has a positive and significant influence on farmers’ adoption of less labour intensive adaptation strategies.
On the other hand, age of the household head was reported to have no effect on adopting climate change adaptation options by farmers in eastern Hararghe, Ethiopia (Legesse et al., 2013; Tessema et al., 2013). However, there is no final consensus on how age affects adoption decisions (Adesina and Baidu-Forson, 1995).
Education Education of the household head was found to have
Kidanu et al. 279 increased the probability of adopting climate change adaption options. The result showed that, education of a household head positively and significantly influences adoption of climate change adaptation options, and further indicated that, an increase in the level of education was associated with an increase in the adoption of SWC plus two agronomic practices as a climate change adaptation option by 0.12%. This might be because of the fact that farmers’ with higher education are likely to have more information on climate change, which in turn might promote the probability of adopting this adaptation strategy. Furthermore, education is likely to enhance farmers’ ability to receive, interpret and comprehend information needed to make innovative decisions in their farms (Maddison, 2007; Ndambiri et al., 2013). This result is in line with that of Deressa et al. (2009) and Tesso et al. (2012) who reported positive and significant effect of education on adopting climate change adaptation measures in Ethiopia. In contrast, Mulatu (2013) reported negative relationship between education and choice of adaptation options. Agro-ecology The result obtained from the multinomial logit Model indicated that farming in kola significantly increased the probability of using SWC solely and SWC plus one, two and three agronomic practices as adaptation options to climate change by 1.7, 6.06, 0.53 and 0.42%, respectively. In line with this, Deressa et al. (2009), Tesso et al. (2012) and Legesse et al. (2013) also found that farmers living in different agro ecology have different choices of adaptation options to climate change impact. The report further indicated that farming in kola increases the probability of using soil and water conservation and water harvesting practices as adaptation options, compared to dega or weynadega. On the other hand, farming in kola has been reported to significantly reduce the probability of diversifying crop varieties, planting trees, and irrigation by 21, 13 and 2.3%, respectively, compared with farming in weynadega (Deressa et al., 2009). The report further indicated that, farmers in drier and hotter climate are more likely to respond to climate change than farmers in cooler and wetter areas. Livestock holding
The total number of livestock owned by the household measured in TLU had a positive and significant influence on the adoption of diversified climate change adaptation options. The result indicated that the TLU possessed by a household significantly increased the probability of using SWC plus one, two, and three agronomic practices as adaptation options by .57, 2.28 and 0.12%, respectively. In line with this result,

280 J. Agric. Ext. Rural Dev.
Table 10. Parameter estimates of the multinomial logit climate change adaptation model on the determinants of strategies.
Parameter SWC SWC + 1AgPrac SWC + 2AgPrac SWC + 3AgPrac
Coef St.error ME Coef St.error ME Coef St.error ME Coef St.error ME
Sex -1.3940* .77578 -.01418 -1.7735* 1.0547 -.0315 -10.925 7.1391 -.00459 -25.918 857.33 -1.5e-06
Age -0.0767** 0.0358 -0.0222 -0.0122 0.0465 0.0063 -0.1183 0.1016 -0.0045 -0.0947 0.1334 0.00002
Family size 0.0590 0.2569 -0.0336 0.1309 0.3343 -0.0135 0.5842 0.5044 0.0199 0.6437 0.649 0.00001
Active labour -0.1667 0.4013 0.0367 -0.2460 0.4906 0.0137 -0.766 0.8469 -0.0229 -0.805 1.0848 -0.0001
Education 0.1212 0.3651 0.0215 0.4422 0.3859 0.0079 0.9334** 0.7157 0.0012 0.6341 0.8682 0.00004
Livestock -0.0238 0.1355 -0.0114 0.2652* 0.1558 0.0057 0.7738*** 0.2668 0.0228 0.8749*** 0.2906 0.0012
Farm income 4.57e-06 0.0001 -0.0002 0.0052*** 0.00013 0.0251 0.00132*** 0.00025 0.0085 0.0016*** 0.0003 0.0053
Non-farm income -0.0004*** 0.0001 0.0014 -0.00004 0.00013 0.00001 0.00051* 0.00029 0.0024 0.00075** 0.0003 0.0002
Credit 1.6319 1.3673 -0.0704 3.939*** 1.4181 0.124 6.9830*** 2.2087 0.0838 8.7481*** 2.684 0.0432
Farm size 1.5773 1.2773 .00300 1.5179 1.4153 .0131 7.1305* 4.0045 0.02813 7.5739* 4.3971 .0138
Agro-ecology 1.8333** 0.8559 0.01701 2.2908** 1.0463 0.0606 9.3244* 5.3760 0.0053 12.943** 5.9884 0.00422
Climate info 1.136** 0.420 0.0310 2.978** 0.033 0.0747 2.681** 0.043 0.1293 3.916** 0.025 0.1115
Slope -0.1153 0.7182 0.0044 -0.1858979 0.85274 0.0404 -1.17207 1.4316 -0.0495 -0.2032 2.0271 5.6e-07
Constant 6.8087 2.8268 -7.960228 3.8609 -27.9906 7.5726 -27.956 1235.64
Diagnosis
Base category No adaptation
Number of observations 171
LR chi-square (44) 336.1***
Log likelihood -99.1409
Pseudo R2 0.6290
Deressa et al. (2009) and Asfaw et al. (2011) reported that livestock ownership facilitate adoption of improved technologies. Livestock is generally considered to be an asset that could be used either in production process or be exchanged for cash or other productive asset, hence have a significant role in adopting suitable adaptation measure to combat climate change (Yirga, 2007). Farm income This variable had positive and significant influence
in adopting climate change adaptation options. The result revealed that increasing farm income increases the probability of using SWC plus one, two, and three agronomic practices as a climate change adaptation strategy by 2.51, 0.85 and 0.53%, respectively. The positive impact of farm income on climate change adaptation options could be associated to the fact that farmers with better financial capacity are more risk averse to crop production, have access to information and longer planning horizon (Deressa et al., 2008). Mulatu (2013) also showed that increase in farm income of the household increases the likelihood of adapting to climate change using soil
conservation, irrigation and livestock production. This could be apparent that adaptation to climate change is capital intensive and hence increased income would encourage the investment capacity on adaptation. Credit service Access to credit service also plays a positive role for farmers to adopt climate change adaptation options. The result revealed that increased access to credit is likely to increase the probability of the household to implement SWC plus one, two, and

three agronomic practices as climate change adaptation strategy by 12.4, 8.38 and 4.32% respectively. As is already known, implementing SWC and different agronomic practices are one of the most effective climate change adaptation strategies. However, it also requires capital investment, which most of ordinary households could not afford. Therefore, leveraging the cash shortage of households through credit might encourage farmers’ to engage in the above mentioned practices. Deressa et al. (2008, 2009) and Tesso et al. (2012) also noted that increase in credit access significantly enhanced the farmers’ choice of climate change adaptation strategies. In contrast, Tessema et al. (2013) reported that credit access has negative influence of the probability of using tree planting as climate change adaptation option. Farm size This variable had positive and significant influence in adopting climate change adaptation options. The result revealed that increasing farm size increased the probability of using SWC plus two and three agronomic practices as climate change adaptation strategy by 2.81 and 1.38% respectively. In line with this result, Taddesse (2011) and Tessema et al. (2013) also showed that farmers with large farm size have adopted one or a combination of climate change adaptation options as compared to the farmers with small land holdings. Moreover, Mulatu (2013) noted that households’ farm size is one of the most important factors that significantly affect farmers’ preferences for the adaptation strategies to climate change. Non-farm income This variable had negative and significant influence in adopting climate change adaptation options. The result revealed that increasing off/non-farm income decreased the probability of using SWC, SWC plus two and three agronomic practices as climate change adaptation strategy by 1.4, 0.24 and 0.02%, respectively. In line with this result, Tessema et al. (2013) showed that, off/non-farm income was found to have a negative relationship with adaptation by employing tree planting with other measures. The report further explained that, enterprise diversification or risk reduction effect of non-farm income which may reduce the importance of urgent adaptation measures. In other words, the existence of non-farm income serves as an adaptation measure by itself and may delay other responses. Climate information Access to climate information significantly increased the
Kidanu et al. 281 probability of using SWC, SWC plus one agronomic practice, SWC plus two agronomic practices, and SWC plus three agronomic practices, by 3.1, 7.5, 12.9 and 11.15%, respectively (Table 10). This result implies the important role of increased institutional support in promoting the use of climate change adaptation options to reduce the negative impact of climate change. This result is in line with the finding of Mulatu (2013) who showed that an increase in access to climate information increases farmers’ likelihood to prefer crop diversification and change in planting date as climate change adaptation options. Moreover, Deressa et al. (2009) noted that information on temperature and rainfall has a significant and positive impact on the probability of using different crop varieties by 17.6%. CONCLUSION AND RECOMMENDATIONS This study was carried out in Dire Dawa Administration, Eastern Ethiopia where 171 farm households were randomly selected for the study. Out of the interviewed households, 140 (81.87%) of the farm households observed at least one type of climate change over the last 20 years primarily based on their life experience. This study has tried to relate the trend of mean annual and seasonal temperature records with the perception of farmers’ at a local scale. The result showed that during the last half a century, annual and seasonal temperatures had significantly increased; with the varying magnitude and rate. The results revealed that, regardless of agro-ecological settings, most of the households had perceived an increasing trend of mean annual (77.2%) and summer season (81.2%) temperatures. Similarly, 82.5 and 80.1% of the households perceived a decrease in the amount and time of precipitation respectively over the last 20 to 30 years.
The result also indicated that most of the surveyed households in the Administration perceive drought as the major climatic hazard that threatens their livelihood. Moreover, due to climate change, they believed that water used for home or animal consumption has been constrained; crop productivity has been declining, loss of landrace cultivars as well as the appearance of new pests, were all challenging the food security. On the other hand, this households indicated that they undertake soil and water conservation solely, or in combination with crop diversification, change in crop type and change in planting date as adaptation options to counteract the negative impact of climate change.
As MNL model was fitted to proportion of household in different adaptation categories where the choices of adaptation to climate change is the dependent variable. Different socioeconomic, institutional and agro-ecological variables were hypothesized to influence adaptation decisions and were included in the model. The results from the MNL analysis indicate that sex and age of the

282 J. Agric. Ext. Rural Dev. household head, agro-ecology, farm size, education and climate information of the households head, farm and non-farm income, access to credit, and livestock ownership of the household were found to have significant impact on the choice of adaptation options that enable to combat climate change stresses. Based on the results of the study the following policy options are suggested.
1. Investing on education and technological packages that enhance farm income for the rural community can be sought as a policy options that will reduce the negative impact of climate change; 2. An effort that improves farmers’ awareness on better production techniques, climate change and access to credit, which enhance the capacity to adopt climate resilience adaptation options, is an important policy measure that should be considered, 3. Research and development has to be proactive and focus on developing/adapting crop/livestock varieties resistant to the expected climate variability and identify technology best fitted for each farm size, 4. Future policy options need to fine-tune sex, age and agro-ecological settings with climate change adaptation options/technologies. Conflict of Interests
The authors have not declared any conflict of interests.
ACKNOWLEDEMENT
The author would like to thank the Dire Dawa Administration for giving permission for this study and special thanks to Haramaya University for their financial and academic support. Finally, the authors would like to thank the anonymous reviewers for their valuable feedback which helped to improve this publication. REFERENCES
ACCCA (Advancing Capacity to Support Climate Change) (2010). Farm
level climate change perception and adaptation in drought prone areas of Tigray, Northern Ethiopia. Improving decision making capacity of smallholder farmers in response to climate risk adaptation in three drought prone districts of Tigray, northern Ethiopia, Vol. 3.
Adesina AA, Baidu J (1995). Farmers’ perceptions and adoption of new agricultural technology: evidence from analysis in Burkina Faso and Guinea, West Africa. Agric. Econ. 13:1-9.
Asfaw A, Admassie A (2004). The role of education on the adoption of chemical fertilizer under different socioeconomic environments in Ethiopia. Agric. Econ. 30:21-22.
Asfaw S, Shiferaw B, Simtowe F, Haile MG (2011). Agricultural technology adoption, seed access constraints and commercialization in Ethiopia. J. Dev. Agric. Econ. 3(9):436-447.
Ayalew D, Tesfaye K, Mamo G, Yitaferu B, Bayu W (2012). Variability of rainfall and its current trend in Amhara region, Ethiopia. Afr. J. Agric. Res. 7(10)1475-1486.
Bewket W, Conway D (2007). A note on the temporal and spatial
variability of rainfall in the drought prone Amhara region of Ethiopia. Int. J. Climatol. 27:1467-1477.
BOARD (Bureau of Agricultural and rural Development) (2009). Annual report. Dire Dawa.
Bryan E, Deressa TT, Gbetibouo GA, Ringler C (2009). Adaptation to climate change in Ethiopia and South Africa: options and constraints. Environ. Sci. Policy 12:413-426.
CIMMYT (1998). The adoption of agricultural technology: A Guide for Survey Design. CIMMYT, Mexico, DF.
Conley T, Udry C (2001). Social learning through networks: The adoption of new agricultural technologies in Ghana. Am. J. Agric. Econ. 83:668-673.
Conway D (2000). Some aspects of climate variability in the northeast Ethiopian highlands-Wollo and Tigray. SINET: Ethiop. J. Sci. 23(2):139-161.
Conway D, Schipper ELF (2011). Adaptation to climate change in Africa: challenges and opportunities identified from Ethiopia. Global Environ. Change 21:227-237.
Croppenstedt A, Demeke M, Meschi MM (2003). Technology adoption in the presence of constraints: the case of fertilizer demand in Ethiopia. Dev. Econ. 7(1):58-70.
CSA (Central Statistics Authority) (2007). The Federal Democratic Republic of Ethiopia Statistical abstract for 2003. CSA, Addis Ababa.
Deressa TT, Hassan RM, Ringler C (2008). Measuring Ethiopian farmers’ vulnerability to climate change across Regional States. IFPRI discussion paper 00806, October 2008.
Deressa TT, Hassan RM, Ringler C (2011). Perception of and adaptation to climate change by farmers in the Nile basin of Ethiopia. J. Agric. Sci. 149(1):23-31.
Deressa TT, Hassan RM, Ringler C, Alemu T, Yusuf M (2009).Determinants of farmers’ choice of adaptation methods to climate change in the Nile Basin of Ethiopia. Global Environ. Change 19(2)248-255.
Falco SD, Yesuf M, Kohlin G (2011). What adaptation to climate change? Evidence from the Nile Basin, Ethiopia. In: International conference on economics of adaptation to climate change in Low-Income countries. Ethiopian Development Research Institute and International Food Policy Research Institute, Washington, DC.
Fosu-Mensah BY, Vlek PL, MacCarthy DS (2012). Farmers’ perception and adaptation to climate change: a case study of Sekyedumase district in Ghana. Environ. Dev. Sustain. 14(4):495-505.
Gbetibouo GA (2009). Understanding farmers’ perceptions and adaptations to climate change and variability: The Case of the Limpopo Basin, South Africa (Trans: Division EaPT). IFPRI–wide Discussion Paper. International Food Policy Research Institute, South Africa.
Gujarati DN (1995). Basic econometrics. 3rd ed. McGraw-Hall, Inc.
534p. Hassan R, Nhemachena C (2008). Determinants of African farmers’
strategies for adapting to climate change: Multinomial choice analysis. Afr. J. Agric. 2(1):84-104.
IDP (Integrated Development Plan) (2006). Annual report. Dire Dawa. ILRI (International Livestock Research Institute) (2006). Mapping
climate vulnerability and poverty in Africa. Int. Livest. Res. Institute, Nairobi, Kenya.
IPCC (Intergovernmental Panel on Climate Change) (2007). Climate change 2007: Synthesis report. Contribution of Working Groups I, II and III to the Fourth Assessment Report of the Intergovernmental Panel on Climate Change. Core Writing Team, Pachauri RK. Reisinger A (eds.). IPCC, Geneva, Switzerland. 104p.
Ishaya S, Abaje IB (2008). Indigenous people’s perception on climate change and adaptation strategies in Jema’a local government area of Kaduna State, Nigeria. J. Geogr. Regional Plann. 1(8):138-143.
Komba C, Muchapondwa E (2012). Adaptation to climate change by smallholder farmers in Tanzania. Econ. Res. Southern Afr. (ERSA) working paper 299:5.
Lautze S, Aklilu Y, Raven-Roberts A, Young H, Kebede G, Leaning J (2003). Risk and vulnerability in Ethiopia: Learning from the past, responding to the present. Preparing for the future, Addis Ababa.
Legesse B, Ayele Y, Bewket W (2013). Smallholder farmers’ perceptions and adaptation to climate variability and climate change in Doba district, west Hararghe, Ethiopia. Asian J. Empirical Res.

3(3)251-265. Lema M, Majule AA (2009). Impacts of climate change, variability and
adaptation strategies on agriculture in semi arid areas of Tanzania: The case of Manyoni district in Singida region, Tanzania. Afr. J. Environ. Sci. Technol. 3(8):206-218.
Long JS, Freese J (2001). Regression Models for Categorical Dependent Variables Using Stata. A Stata Press Publication, STATA Corporation, College Station, Texas
Maddison D (2006). The perception and adaptation to climate change in Africa. CEEPA Discussion Paper No. 10, Centre Environ. Econ. Policy Afr. University of Pretoria.
Maddison D (2007). The perception of an adaptation to climate change in Africa. Policy research working paper. The World Bank, Dev. Res. Group, Sustain. Rural Urban Dev. Team, Pretoria, South Africa.
Mengistu DK (2011). Farmers’ perception and knowledge of climate change and their coping strategies to the related hazards: Case study from Adiha, central Tigray, Ethiopia. Agric. Sci. 2(2):138-145.
Mulatu ND (2013). Determinants of farmers' preference for adaptation strategies to climate change: evidence from north Shoa zone of Amhara region Ethiopia. MPRA (Munich Personal RePEc Archive) Paper No. (48753)
Mutekwa VT (2009). Climate change impacts and adaptation in the agricultural sector: the case of smallholder farmers in Zimbabwe. J. Sustain. Dev. Afr. 2(11):237-257.
Ndambiri HK, Ritho CN, Mbogoh SG (2013). An evaluation of farmers’ perceptions and adaptation to the effects of climate change in Kenya. Int. J. Food Agric. Econ. 1(1):75-96.Nhemachena C, Hassan R (2007). Micro level analysis of farmers’ adaptation to climate change in Southern Africa. IFPRI Discussion Paper 00714 August 2007.
Oxfam (2010). The rain doesn’t come on time any more: poverty, vulnerability and climate variability in Ethiopia. Edossa R, Givey SC, Castillo GE. 45p.
Sahu NC, Mishra D (2013). Analysis of perception and adaptability strategies of the farmers to climate change in Odisha, India. Apcbee Procedia 5:123-127.
Seleshi Y, Zanke U (2004). Recent changes in rainfall and rainy days in Ethiopia. Int. J. Climatol. 2(4):973-983.
Smith B, Pilifosova O (2001). Adaptation to climate change in the context of sustainable development and equity. Contribution of the Working Group to the Third Assessment Report of the Intergovernmental Panel on Climate Change. Cambridge University Press, Cambridge, UK. pp. 879-912.
Strzepek K, Mccluskey A (2006). District level hydro-climatic time series and scenario analysis to assess the impacts of climate change on regional water resources and agriculture in Africa. CEEPA Discussion Paper No. 13, Pretoria, South Africa.
Kidanu et al. 283 Taddesse T (2011). Farmers' perception and adaptation mechanisms to
climate change and variability: the case of La’ilay Maichew woreda, central Tigray, Ethiopia. An MSc Thesis Presented to the School of Graduate Studies of Haramaya University.
Tadege A (2007). Climate Change National Adaptation Program of Action (NAPA) of Ethiopia. NMS (National Meteorological Agency), Addis Ababa Federal Democratic Republic of Ethiopia Addis Ababa.
Teka K, Van RA, Poesen J, Welday Y, Deckers J (2012). Impact of climate change on small holder farming: A case of eastern Tigray, northern Ethiopia. Afr. Crop Sci. J. 20(2):337-347.
Tessema YA, Aweke CS, Endris GS (2013). Understanding the process of adaptation to climate change by small-holder farmers: the case of east Hararghe Zone, Ethiopia. Agric. Food Econ. 1:13.
Tesso G, Emana B, Ketema M (2012). Econometric analysis of local level perception, adaptation and coping strategies to climate change induced shocks in North Shewa, Ethiopia. Int. Res. J. Agric. Sci. Soil Sci. 2(8):347-363.
Wilson K, Getnet M (2011). Investigating how development interventions increase community level adaptive capacity in Ethiopia. In the New Voices, Different Perspectives: Proceedings of the Africa Adapt Climate Change Symposium 2011. Addis Ababa, Ethiopia.
Yirga CT (2007). The dynamics of soil degradation and incentives for optimal management in Central Highlands of Ethiopia. University of Pretoria, Pretoria, South Africa.

Journal of Agricultural
Extension and Rural
Development
Related Journals Published by Academic Journals
Journal of Plant Breeding and Crop Science
African Journal of Agricultural Research
Journal of Horticulture and Forestry
International Journal of Livestock Production
International Journal of Fisheries and Aquaculture
Journal of Development and Agricultural Economics


