27
SOUTH AFRICAN EXCHANGE TRADED PRODUCTS REVIEW VOLUME TWO 2018 SOUTH AFRICAS LEADING INDEPENDENT INVESTMENT PLATFORM ITRANSACT IS A LICENSED FINANCIAL SERVICES PROVIDER
SOUTH AFRICAN EXCHANGE TRADED PRODUCTS REVIEW
VOLUME TWO
2018
SOUTH AFRICAS LEADING INDEPENDENT INVESTMENT PLATFORM
ITRANSACT IS A LICENSED FINANCIAL SERVICES PROVIDER

CONTENTS
DOCUMENT PURPOSE 2
PART ONE: ITRANSACT ETF PORTFOLIO REPORT & PERFORMANCE 2
PART TWO: EXCHANGE TRADED FUND (ETF) PERFORMANCE 8
PART THREE: COMMODITY ETF AND EXCHANGE TRADED NOTE (ETN) PERFORMANCE 14
PART FOUR: FEES AND COSTS 15
PART FIVE: GENERAL ANALYSIS 16
PART SIX: ANALYST QUARTERLY COMMENTRY 19
PART SEVEN: EDUCATION 22
INTRODUCTION TO EXCHANGE TRADED PRODUCTS 22
HISTORY OF EXCHANGE TRADED PRODUCTS 22
DIFFERENT TYPES OF EXCHANGE TRADED PRODUCTS 23
THE DIFFERENCE BETWEEN ACTIVE FUND MANAGEMENT AND PASSIVE FUND MANAGEMENT 24
HOW COSTS DESTROY RETURNS 24
WHY ITRANSACT? 25
DISCLAIMER 26
CONTACT DETAILS 26

2
The purpose of this document is to help investors and professional financial advisors understand and use Exchange Traded Products (ETPs for short). ETPs are investment products and funds that are listed on the stock exchange just like a share. They are growing rapidly in popularity around the world, because they make investing simple and cost effective.
This document covers the basics of how ETPs work, their unique investment features, and how they fit into wealth creation strategies. It also covers how best to evaluate ETPs to identify the right products to fit most investment objectives allowing investors and advisors, big and small, to build institutional-calibre investment portfolios with management fees significantly lower than those typical of traditional unit trusts. High levels of transparency for both the holdings and the investment strategy help investors and advisors easily evaluate an ETP’s potential returns and risks.
DOCUMENT PURPOSE
Welcome to the world of Exchange Traded Products.
Justin Solms: Chief Investment Officer, Index Solutions
Sunstrike Capital, now rebranded to Index Solutions to better portray its core competency, is the appointed investment manager for the Itransact ETF portfolios, and is an independent partly owned subsidiary of Itransact.
Index Solutions was formed in 2012 to address the growing need for low cost investment products and solutions for the South African retail and institutional market by using proven quantitative investment methods based on low cost index-based investment solutions and strategies that are designed to deliver the best possible market-related returns, at the lowest possible cost.
PART ONE: ITRANSACT PORTFOLIO REPORT & PERFORMANCE

3
SAVINGS PORTFOLIOS 5 years* 3 years* 1 yearConservative Portfolio - 6.0 5.7Cautious Portfolio 5.5 4.4 2.8Moderate Portfolio 6.4 3.6 0.5Growth Portfolio 7.2 4.6 4.5
RETIREMENT ANNUITIES 5 years* 3 years* 1 yearConservative RA - - 5.4Cautious RA - 4.2 2.3Moderate RA - 4.8 2.4Growth RA - 5.0 4.6
UNIQUE PRODUCTS 5 years* 3 years* 1 yearInternational Portfolio ** ** **Satrix Moderate Portfolio ** ** **Satrix Moderate RA ** ** **
The table below shows the aggregated returns of our segregated savings and retirement annuity portfolios.
PORTFOLIO PERFORMANCE
*Annualised. Source: Index Solutions, 2018** Funds less than 1 year old
Investment Portfolios and Retirement Annuities: 3 year Annualised Total Returns to 31 March 20181
Source: Index Solutions, Profile Data FE Analytics, 2018
Sector: SA Multi Asset Income
Conservative Portfolio
Index: Consumer Price
Index: FTSE/JSE All Share
Growth RA
Sector: SA Multi Asset Low Equity
Index: FTSE/JSE Top 40
Moderate RA
Growth Portfolio
Cautious Portfolio
Cautious RA
Moderate Portfolio
Sector: SA Multi Asset High Equity
Sector: SA Equity General
SIPP and RA
Index
Fund Sector
1 All returns displayed are after all fund charges, but before platform administration and financial advice fees.

4
Over three years to March 2018 equity markets are once again under performing interest bearing assets with the JSE below inflation and the SA Equity General Sector delivering 2.2% per annum. It has been difficult time for investors in riskier assets. Over the long term equity markets are expected to beat inflation, however periods such as these do occur. The Conservative and
Cautious models are in the region of 1% below the Multi Asset Income and Low Equity Sectors respectively due to higher property and Inflation-Linked Bond exposures while the Growth and Moderate models have delivered returns above the SA Equity General and Multi Asset High Equity Sectors largely due to higher offshore exposure and lower costs.
The below tables show the make up of our portfolio’s returns over the year ended 31 March 2018. The green bars represent the proportional contribution of ETFs that added to returns while the red bars illustrate those ETFs responsible for diminishing returns. Each bar adds to, or subtracts from, the point where the previous bar left off, finally reaching the overall portfolio’s return in purple.
PERFORMANCE ATTRIBUTION
Cautious Portfolio
Portfolio ReturnNegative ContributionPositive Contribution
876543210
Newf
unds
TR
ACI
Newf
unds
ILB
IDiv
idend
Ar
istoc
rats
GIVIS
A
Stanli
b Pr
opert
ySy
gnia
US
Fees
Cauti
ous
Portfo
lio
Cautious RA
Portfolio ReturnNegative ContributionPositive Contribution
876543210
Newf
unds
ILB
I
Divide
nd
Arist
ocrat
sNe
wfun
ds
TRAC
I
GIVIS
A
Stanli
b Pr
opert
ySy
gnia
US Fe
es
Cauti
ous
RA
Conservative Portfolio
Portfolio ReturnNegative ContributionPositive Contribution
876543210
Newf
unds
TR
ACI
Newf
unds
ILB
I Fees
Cons
ervati
ve
Portfo
lio
Conservative RA
Portfolio ReturnNegative ContributionPositive Contribution
876543210
Newf
unds
TR
ACI
Newf
unds
ILB
I Stanli
b Pr
opert
y
Fees
Cons
ervati
ve
RA
The conservative portfolios, largely exposed to the interest bearing Newfunds TRACI delivered satisfactory returns without much contribution from the roughly 10% in property and equity.
The Cautious portfolios however, holding more in riskier assets, had their returns dampened by exposure to property and foreign markets over the past year.

5
Moderate RAModerate Portfolio
Portfolio ReturnNegative ContributionPositive Contribution
Portfolio ReturnNegative ContributionPositive Contribution
876543210
876543210
Divide
nd
Arist
ocrat
s
Divide
nd
Arist
ocrat
s
GIVIS
A
Newf
unds
ILB
I
Newf
unds
TR
ACI
Stanli
b Pr
opert
y Fees
Mode
rate
RANewf
unds
ILB
INe
wfun
ds
TRAC
I
GIVIS
A
Sygn
ia
US Stanli
b Pr
opert
y Fees
Mode
rate
Portfo
lio
Growth Portfolio
Portfolio ReturnNegative ContributionPositive Contribution
876543210
Satrix
Ind
ustria
ls
Divide
nd
Arist
ocrat
s
Satrix
Re
sourc
es
Satrix
Fin
ancia
ls
Stanli
b Pr
opert
y Fees
Grow
th
Portfo
lio
Growth RA
Portfolio ReturnNegative ContributionPositive Contribution
876543210
Satrix
Ind
ustria
ls
Divide
nd
Arist
ocrat
s
Newf
unds
ILB
I
Stanli
b Pr
opert
y Fees
Grow
th
RA
The Moderate RA, with constrained offshore exposure due to Regulation 28, faired better than the Moderate Portfolio which unconstrained, holds more US equity and less local equity. Despite the stronger rand, Industrials contributed positively to Growth portfolios thanks to Naspers and a retail revival. Financials also faired well over the past year boosting the Satrix Fini and Dividend Aristocrats.
Inflation jitters, fear of trade wars and tech troubles put an end to the smooth upward trajectory in US markets. This, paired with the rand’s rally saw offshore exposure contribute little to our portfolios over the past year.
Our rules based approach to asset allocation saw some changes made last year. The costs of these changes were outweighed by the positive contribution they made. These changes included the removal of the Newfunds GIVI (-7.5% over 1 yr), the addition of the Dividend Aristocrats (+9.1%), and the reduction of property exposure (-7.5%). Nonetheless, property has, and continues, to be a material holding across our portfolios. As the largest dampener on the past year’s returns, we turn to this subject below.

6
The latest data suggests that the South African economy has turned a corner. National accounts data for the fourth quarter of 2017 surprised on the upside, with a sharp quarter-on-quarter expansion driven by private consumption and fixed investment. In January, manufacturing output expanded for the fourth consecutive month, recording its sharpest increase since June 2016. Survey-based data for February was equally positive; there was a notable jump in the Standard Bank PMI and strong business confidence. Improved confidence in the economy among businesses largely reflected the political developments since Cyril
Ramaphosa took over as head of the ANC in December and subsequently replaced Jacob Zuma as president. Ramaphosa, who was sworn in on 15 February, has taken steps to change the direction of economic policy, including a cabinet reshuffling which saw the reappointment of Nhlanhla Nene as finance minister and a budget that will hike taxes to contain the bloated fiscal deficit and potentially help avert a credit rating downgrade.
- Focus Economics, March 2018
Since the start of 2018, the SA Listed Property Index (SAPY) has fallen around 20%, contributing negatively to our portfolio’s returns over the past year. This has largely been due to the following.
Resilient, Fortress, Nepi Rockcastle and Greenbay Properties (the Resilient stable) made up about 42% of the SAPY at the start of the year. Reports by 36 ONE and other asset managers brought into question insider trades, accounting practises and cross-shareholdings appearing to artificially inflate the income and Net Asset Value (NAV) of these entities. A dramatic decline in share prices followed leaving the Resilient stable now making up about 24% of the SAPY. Investigations are still under way however share prices have moved closer to the tangible NAV’s estimated by 36 ONE (36 ONE, Moneyweb, Inet BFA).
In addition to this, the SAPY’s offshore exposure had grown to around 40% in 2017 and the rand’s rally around Ramaphosa’s election negatively impacted this exposure. Our model maintains foreign and rand hedge exposure in a number of ways. Sentiment toward the rand may presently be positive but as it waxes and wanes over time our model evaluates it as a valuable holding for the long term.
Such declines in property and other risky assets have been seen before and are likely to happen again. The reason risky assets deliver higher returns over the long term is in compensation for the risk taken. Our portfolios offer a basket of market tracking indices, selected in such a way as to minimize risk through diversification, but not remove it, as this would remove the opportunity to make long term returns above the risk free interest rate.
SOUTH AFRICAN ECONOMIC OUTLOOK
LISTED PROPERTY

7
The sweet spot in which the global economy finds itself could quickly come to an end amid rising trade disputes between China and the United States. While the trade war appears to be circumscribed by these two countries for now, further anti-trade measures against economies with large trade surpluses against the U.S., particularly the European Union, remain a possibility. Should these fears materialize, the ongoing stellar global trade cycle could sharply slow, hitting economic growth worldwide. Moreover, central banks are adopting a more hawkish tone in response to reduced economic slack which is beginning to push up inflation. Less accommodative monetary policies by key central banks could tighten financial markets and add downward pressure to global economic growth. FocusEconomics panelists expect the global economy to grow 3.4% in 2018.
- Focus Economics, March 2018
GLOBAL ECONOMIC OUTLOOK
SOUTH AFRICAN ECONOMIC INDICATORS
ECONOMIC MEASURE RATE
GDP Growth 3.1%
Unemployment 26.7%
Inflation Rate 4.0%
Interest Rate 6.5%
Government Debit to GDP 53.1%
ZAR / USD 11.82Source: Trading Economics, March 2018

8
JSE All Share and Inflation: 5 years to 31 March 2018
Source: ProfileData. ProfileMedia. 2017
100%
80%
60%
40%
20%
0%
-20% May ’13 Sep Jan ’14 May Sep Jan ’15 May Sep Jan ’16 May Sep Jan ’17 May Sep Jan ’18
B
A
FTSE/JSE All Share TR in ZA (65.34%)
Consumer Price in ZA (28.21%)B
A
PART TWO: EXCHANGE TRADED FUND (ETF) PERFORMANCE
MARKET CAP WEIGHTED 5 years* 3 years* 1 year
Satrix SWIX 11.6 4.8 14.1
Stanlib SWIX 11.2 5.0 13.8
Satrix 40 10.5 5.3 13.1
NewFunds SWIX 40 10.1 3.7 11.2
RMB Ashburton Top 40 9.9 5.2 12.2
Stanlib Top 40 9.7 4.9 10.8
RMB Ashburton MidCap 9.2 3.8 1.6
CoreShares S&P SA Top 50 - - 14.6
Sygnia Itrix SWIX 40 ** ** **
Sygnia Itrix Top 40 ** ** ***Annualised. Source: ProfileData, ProfileMedia, 2017
** Funds less than 1 year old
The Shareholder Weighted Index (or SWIX), with larger exposure to Naspers, continues to beat the Top 40 over the past 5 years. However, over 1 year the Coreshares Top 50 performed best. It holds the 50 largest stocks on the JSE by market capitalisation yet caps exposure to any single company at a 10% maximum. This reduces single stock exposure at the top of the market and includes 10 of the larger Mid Cap stocks. As such it is a slightly more diversified ETF exhibiting less volatility than the Top 40 since listing.
Local equity ETFs

9
STYLE (SMART BETA) 5 years* 3 years* 1 year
NewFunds NewSA 8.9 3.1 17.0
Satrix DIVI 8.5 6.4 22.6
Satrix RAFI 8.3 5.9 12.3
NewFunds Equity Momentum 7.9 0.5 0.7
CoreShares Top 40 Equally Weighted 5.7 1.3 4.9
NewFunds S&P GIVI SA Top 50 2.9 -3.6 -7.5
NewFunds Shariah Top 40 0.7 -3.0 1.6
CoreShares S&P SA Dividend Aristocrats - 5.1 9.1
CoreShares S&P SA Low Volatility - 0.8 1.3
Ashburton Global 1200 Equity ** ** **
Satrix Quality South Africa ** ** **
SECTORS 5 years* 3 years* 1 year
Satrix FINI 14.3 5.5 27.4
Satrix INDI 14.2 6.2 10.8
NewFunds S&P GIVI SA Resources 7.8 16.6 -0.6
NewFunds S&P GIVI SA Industrials 6.5 -2.5 -14.3
NewFunds S&P GIVI SA Financials 4.0 -8.2 -0.2
Satrix RESI -2.7 -2.4 10.5
*Annualised. Source: ProfileData, ProfileMedia, 2018** Funds less than 1 year old
*Annualised. Source: ProfileData, ProfileMedia, 2018
The NewFunds NewSA is an ETF that weights the Top 40 JSE shares by B-BBEE rating as determined by the Department of Trade and Industry. Those scoring highly have a larger exposure, such as Naspers, Standard Bank and MTN, displacing other stocks such as Richemont, BHP Billiton and Anglo which are more prominent in the Top 40. It’s interesting to see the Satrix Divi clawing its way back up the performance table. It has been in and out of favour after 5 year periods of both outperformance and underperformance against the broader market.
Sentiment toward the financial sector rebounded strongly around Ramaphosa’s election in December 2017. Improving prospects for South Africa’s credit rating have a positive impact on the financial index which delivered the highest 5 year return to March 2018. The public discourse over expropriation without compensation (EWC) has raised concerns for banks who lend funds secured against property. Still in early stages; parliament have affirmed the issue will be explored without compromising food security or the South African economy. This will be an area to watch as the process unfolds.

10
SA property ETFs
SA PROPERTY ETFs 5 years* 3 years* 1 year
CoreShares PropTrax Ten 8.7 0.4 -9.1
Stanlib SA Property 7.3 -0.3 -7.5
CoreShares PropTrax SAPY 6.8 -0.6 -7.7
Satrix Property - - -7.6*Annualised. Source: ProfileData, ProfileMedia, 2018
** Funds less than 1 year old
South African listed property was heavy hit by reports coming out of the asset management industry questioning insider trades, accounting practises and complex cross shareholdings at Resilient, Nepi Rockcastle, Fortress and Greenbay properties (collectively ‘the Resilient stable’). The ensuing selloff erased more than half the value of these companies reducing them from over 40% of the SA Property Index to around 24% at present. Furthermore the strengthening of the rand hurt the index which has had growing international exposure over the years.
Sharp selloffs have been experienced in the past, such as during the taper tantrum and Finance Minister Nene’s firing. Despite this, listed property is still the best performing asset class2 over the past decade.
JSE SA Listed Property Index and Inflation: 5 years to 31 March 2018
Source: ProfileData. ProfileMedia. 2017
70%
60%
50%
40%
30%
20%
10%
0%
-10%
-20%
BA
FTSE/JSE SA Listed Property TR in ZA (31.29%)Consumer Price in ZA (28.21%)B
A May ’13 Sep Jan ’14 May Sep Jan ’15 May Sep Jan ’16 May Sep Jan ’17 May Sep Jan ’18
2 Measured against the JSE All Share, All Bond, cash, and MSCI World Index.

11
140%
120%
100%
80%
60%
40%
20%
0%
-20%
MSCI All Country World Index and Inflation: 5 years to 31 March 2018
MSCI AC World TR in ZA (99.16%)
Consumer Price in ZA (28.21%)B
A
Source: ProfileData. ProfileMedia. 2017
B
A
INTERNATIONAL ETFs 5 years* 3 years* 1 year
Sygnia Itrix MSCI USA 18.3 9.2 0.7
Sygnia Itrix MSCI World 15.3 7.2 0.7
Sygnia Itrix MSCI Japan 13.8 6.8 5.5
Sygnia Itrix Eurostoxx50 12.7 3.5 0.7
Sygnia Itrix FTSE100 9.3 2.3 -0.3
CoreShares S&P 500 - - -1.0
CoreShares S&P Global Property - - -7.5
Satrix MSCI World - - **
Satrix MSCI Emerging Markets - - -
Satrix S&P 500 - - **
Sygnia 4th Industrial Revolution - - **
Ashburton Global 1200 - - **
Cloud Atlas AMI Big50 - - **
Sygnia Itrix S&P 500 - - **
Sygnia Itrix Global Property - - ***Annualised. Source: ProfileData, ProfileMedia, 2018
** Funds less than 1 year old
After a long period of low volatility and upward trending prices, US markets declined in the last quarter amid concerns of trade wars, tech companies handling of user data and stronger inflation threatening faster interest
rate hikes by the Fed. Nonetheless, improving GDP growth and a rand which weakened 28% over the past 5 years have contributed to impressive returns from developed market indices.
International ETFs
May ’13 Sep Jan ’14 May Sep Jan ’15 May Sep Jan ’16 May Sep Jan ’17 May Sep Jan ’18
12
MULTI ASSET 5 years* 3 years* 1 year
NewFunds MAPPS Growth 9.0 4.4 11.1
NewFunds MAPPS Protect 7.3 5.0 9.7
INTEREST BEARING 5 years* 3 years* 1 year
NewFunds Govi 7.7 8.6 16.3
NewFunds TRACI 6.3 6.8 7.2
NewFunds ILBI 5.0 5.1 7.3
RMB Ashburton Inflation 4.8 4.9 6.1
CoreShares Preftrax 2.9 5.9 -5.1
Satrix ILBI - - 7.2*Annualised. Source: ProfileData, ProfileMedia, 2017
** Funds less than 1 year old
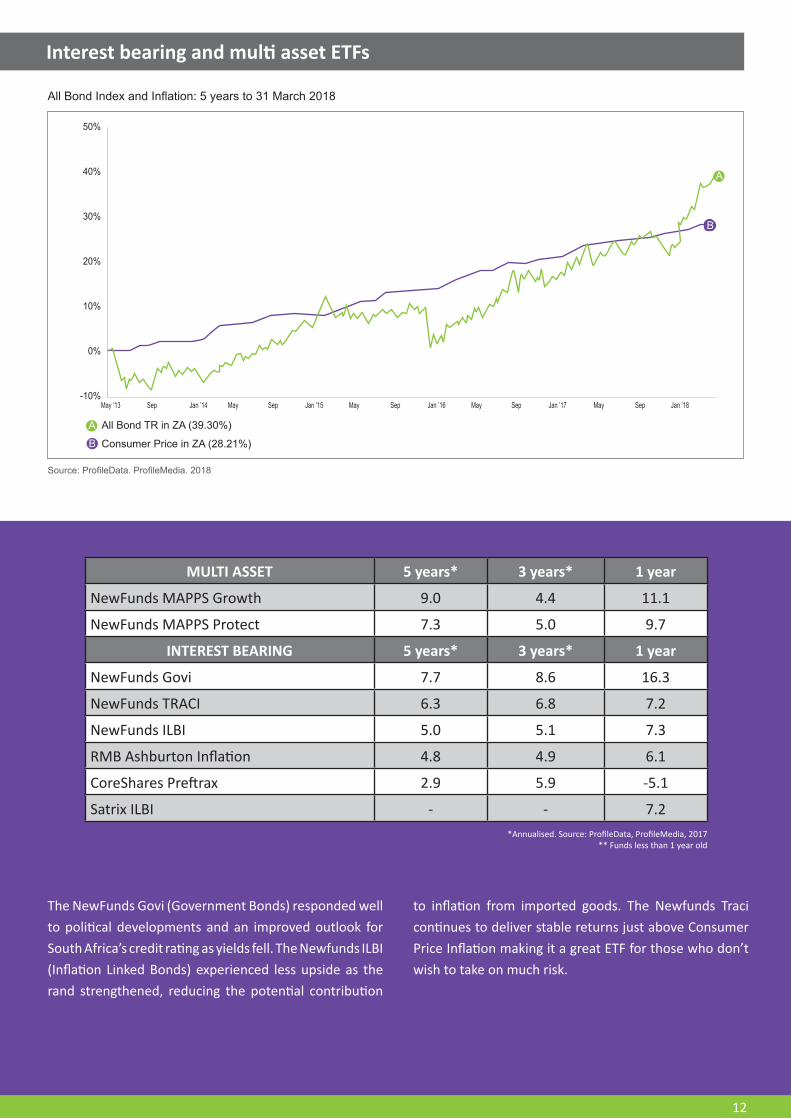
The NewFunds Govi (Government Bonds) responded well to political developments and an improved outlook for South Africa’s credit rating as yields fell. The Newfunds ILBI (Inflation Linked Bonds) experienced less upside as the rand strengthened, reducing the potential contribution
to inflation from imported goods. The Newfunds Traci continues to deliver stable returns just above Consumer Price Inflation making it a great ETF for those who don’t wish to take on much risk.
Interest bearing and multi asset ETFs
50%
40%
30%
20%
10%
0%
-10%
All Bond Index and Inflation: 5 years to 31 March 2018
All Bond TR in ZA (39.30%)
Consumer Price in ZA (28.21%)B
A
Source: ProfileData. ProfileMedia. 2018
B
A
May ’13 Sep Jan ’14 May Sep Jan ’15 May Sep Jan ’16 May Sep Jan ’17 May Sep Jan ’18

13
Source: ProfileData, ProfileMedia, 2018
Annualised ETF performance over five years to 31 March 2018
ETF
Index
Fund Sector
Sygnia Itrix MSCI USAIndex: MSCI World
Sygnia Itrix MSCI WorldSatrix FINISatrix INDI
Sygnia Itrix MSCI JapanSector: Global Equity General
Sygnia Itrix Eurostoxx50Satrix SWIX
Stanlib SWIXSector: SA Equity Financial
Satrix 40NewFunds SWIX 40
Index: FTSE/JSE All ShareRMB Ashburton Top 40
Index: FTSE/JSE Top 40Index: FTSE/JSE Mid Cap
Stanlib Top 40Sector: SA Equity Industrial
Sygnia Itrix FTSE100RMB Ashburton MidCap
NewFunds MAPPS GrowthNewFunds NewSA
CoreShares PropTrax TenSatrix DIVI
Satrix RAFINewFunds Equity Momentum
NewFunds S&P GIVI SA ResourcesNewFunds Govi
Sector: SA Equity GeneralNewFunds MAPPS Protect
Stanlib SA PropertySector: SA Multi Asset High Equity
Index: FTSE/JSE SA Listed PropertySector: SA Real Estate General
Sector: SA Multi Asset Int Bearing Variable TermSector: SA Multi Asset Low Equity
CoreShares PropTrax SAPYNewFunds S&P GIVI SA Industrials
NewFunds TRACISector: SA Equity Mid & Small Cap
CoreShares Top 40 Equally WeightedIndex: Consumer Price
NewFunds ILBIRMB Ashburton Inflation
NewFunds S&P GIVI SA FinancialsSector: SA Equity Resources
CoreShares PreftraxNewFunds S&P GIVI SA Top 50
NewFunds Shariah Top 40Satrix RESI
Eighty percent of ETFs beat consumer price inflation over the past 5 years to March 2018.

14
PART THREE: COMMODITY ETF AND EXCHANGE TRADED NOTE PERFORMANCE
Annualised performance over 5 years to 31 March 2018
The JSE has seen returns in line with the Emerging Markets index over the past 5 years while China has significantly outperformed. Commodity returns in general have disappointed investors with gold and silver failing to keep up with inflation. One of the main
distinctions between Exchange Traded Funds (ETFs) and Exchange Traded Notes (ETNs) on the JSE is that ETFs hold the underlying asset they track while ETNs often use derivative contracts to deliver the return of the underlying asset.
Source: ProfileData, iNet BFA, ProfileMedia, 2018
ETP
Index
DB MSCI China
Index: FTSE/JSE All Share
DB Emerging Markets
Standard Bank Palladium Linker
DB Africa Top 50
Index: Consumer Price
NewWave US Dollar
NewWave Euro
NewWave Pound
Standard Bank Copper
Standard Bank Gold Linker
ABSA NewGold ETF
Standard Bank Africa Commodity Basket
Standard Bank Africa Equity
Standard Bank Platinum Linker
NewWave Platinum
NewWave Silver
Standard Bank Silver Linker
Standard Bank Oil
Standard Bank Corn
Standard Bank Wheat

15
PART FOUR: FEES AND COSTS
ETF TOTAL EXPENSE RATIOS AS AT MARCH 2018
The below chart shows the Total Expense Ratio, a measure of investment fund charges, of ETFs against the ASISA sector averages. In this comparison ETFs have been removed from the sectors, and the weighted average cost of each sector is displayed in red. This has the effect of better approximating the average investor’s experience; by not giving too much weight to smaller funds with fewer investors. The polar difference in fees is clear from the below.
Source: ProfileData, ProfileMedia, 2018
ETF
Fund Sector
Sector: Global Equity GeneralSector: SA Multi Asset High Equity
Sector: SA Equity GeneralSector: SA Real Estate General
Sector: SA Multi Asset Int Bearing Variable TermSygnia Itrix MSCI USA
Sygnia Itrix MSCI JapanSygnia Itrix FTSE100
Sygnia Itrix Eurostoxx50RMB Ashburton MidCapSygnia Itrix MSCI World
CoreShares S&P SA Low VolatilityCoreShares PropTrax SAPY
NewFunds NewSACoreShares Preftrax
CoreShares PropTrax TenAshburton Global 1200 Equity
Satrix RAFIRMB Ashburton Inflation
Satrix SWIXSatrix INDI
Satrix RESISatrix 40
Satrix DIVISatrix FINI
NewFunds Equity MomentumStanlib SA Property
NewFunds SWIX 40NewFunds ILBI
Stanlib SWIXCoreShares Top 40 Equally Weighted
CoreShares S&P SA Dividend AristocratsStanlib Top 40
NewFunds GoviSatrix ILBI
NewFunds TRACINewFunds S&P GIVI SA ResourcesNewFunds S&P GIVI SA IndustrialsNewFunds S&P GIVI SA Financials
NewFunds S&P GIVI SA Top 50RMB Ashburton Top 40
NewFunds MAPPS ProtectNewFunds MAPPS GrowthNewFunds Shariah Top 40

16
Total expense ratio (ter) as a percentage of returns
1 YEAR AVERAGE ACTIVE EQUITY FUND RETURN3 5.76%
Average Equity Fund TER -1.49%
Return after fees 4.27%
Costs as a % of return 26%
1 YEAR AVERAGE ETF RETURN4 13.95%
Average ETF TER -0.46%
Return after fees 13.49%
Costs as a % of return 3%
Three percent of the average equity ETF’s return was spent in fees over the last year while 26% of the average active equity fund’s return went to fees. When returns are in the single digits, fees can be a significant slice of your return.
Over the long term the majority of active funds continue to underperform the market.
PART FIVE: GENERAL ANALYSIS
Percentage of active equity funds beating indices 5
Index 1 year 3 year 5 year 10 year
Index: FTSE/JSE All Share 15.2 9.0 16.3 28.2
Index: FTSE/JSE Mid Cap 65.5 19.5 18.3 2.8
Index: FTSE/JSE Top 40 10.9 9.0 18.3 42.3
3 “Average Active Equity Fund” comprises ASISA Sectors: SA General Equity, Large Cap, Mid and Small Cap. It excludes index funds.4 “Average ETF” includes all ETFs in the abovementioned sectors.5 “Active Equity Funds” comprise of ASISA Sectors: SA General Equity, Large Cap, Mid and Small Cap. It excludes index funds.
Source: ProfileData, Analyst Calculations
Source: ProfileData, ProfileMedia, 2018, analyst calculations

17
TOP 30 of 128 local equity funds over 5 years
Rank Fund TER 5yr Ann. Return
Percent of Funds
Beaten
1 Fairtree Equity Prescient A1 1.56 13.21
2 PSG Equity 1.73 12.56
3 Satrix SWIX 0.42 11.64 98%
4 Prescient Aylett Equity Prescient A1 1.18 11.4
5 Stanlib SWIX 0.33 11.2 97%
6 Investec Equity 1.15 11.11
7 Momentum Aluwani Top 25 1.16 11.1
8 Prescient ClucasGray Equity Prescient A1 1.06 10.8
9 Nedgroup Investments Entrepreneur 1.73 10.68
10 Prescient Mergence Equity Prescient A1 1.21 10.61
11 Mazi Capital Prime Equity 1.22 10.58
12 Satrix 40 0.38 10.47 91%
13 BCI 36ONE BCI Equity 1.51 10.42
14 Absa Prime Equity 1.18 10.33
15 Sanlam Truffle Sanlam Collective Investments General Equity 1.45 10.26
16.5 Prudential Equity 2.11 10.2
16.5 Nedgroup Investments Private Wealth Equity 1.12 10.2
18 Prescient Aeon Smart Multi-Factor Equity Prescient A1 0.68 10.17
19 Sanlam SIM Top Choice Equity A1 1.11 10.16
20 NewFunds SWIX 40 0.35 10.08 85%
21 Allan Gray Equity 2.12 10.06
22 Gryphon All Share Tracker 0.34 10.05
23 STANLIB Melville Douglas High Alpha 2.57 10
24 RMB Ashburton Top 40 0.16 9.93 82%
25 Marriott Dividend Growth 1.16 9.86
26 Momentum Real Growth Equity 1.75 9.8
27 Coronation Equity 1.13 9.75
28 Old Mutual Managed Alpha Equity 1.53 9.72
29 Stanlib Top 40 0.28 9.7 78%
30 Prudential Dividend Maximiser 2.07 9.66
Source: ProfileData, ProfileMedia, analyst calculations
ETFs

18
Top 10 of 32 global equity funds over 5 years
Rank Fund TER 5yr Ann. Return
Percent of Funds
Beaten
1 Sygnia Itrix MSCI USA 0.86 18.31 100%
2 Old Mutual Global Equity 2.09 17.89
3 Allan Gray Orbis Global Equity Feeder 1.86 17.6
4 Sygnia Itrix MSCI World 0.68 15.29 91%
5 Alexander Forbes Investments Global Equity Feeder Fund A in ZA 0.99 14.8
6 Discovery Global Value Equity Feeder A in ZA 2.04 14.62
7 Nedgroup Investments Global Equity Feeder 1.56 14.13
8 Absa Global Value Feeder 2.08 14.03
9 STANLIB Global Equity Feeder 1.99 14.01
10 Momentum International Equity Feeder 1.86 13.79
Top 10 of 27 SA property funds over 5 years
Rank Fund TER 5yr Ann. Return
Percent of Funds
Beaten
1 BCI Sesfikile BCI Property A1 1.28 11.45
2 Absa Property Equity 1.74 11.08
3 BCI Plexus Wealth BCI Property 1.23 10.57
4 Nedgroup Investments Property 1.16 9.22
5 CoreShares PropTrax Ten 0.54 8.67 85%
6 Coronation Property Equity 1.43 8.5
7 Catalyst Catalyst SA Property Equity Prescient 1.67 8.46
8.5 Old Mutual SA Quoted Property 1.45 8.31
8.5 Investec Property Equity 1.44 8.31
10 Discovery Flexible Property 1.43 8.14
Source: ProfileData, ProfileMedia, Analyst Calculations
Source: ProfileData, ProfileMedia, Analyst Calculations
While less diversified indices can be found at the extremes of performance, be that on top or bottom, well diversified broad market indices are often found beating the majority of actively managed funds that carry higher costs.

19
Persistency of active equity funds performance against all share index6 to 31 March 2018
1 year 3 year 5 year 10 year
Total number of Equity Funds with track record for the period 165 133 104 71
Equity Funds beating the index over all periods (cumulatively)7 30 4 2 1
Source: ProfileData,ProfileMedia, Analyst Calculations
Over the past decade, only 1 out of 71 equity funds has managed to consistently beat the JSE All Share index.
PART SIX: ANALYST QUARTERLY COMMENTRY
A raft of new listings in early 2018 will see new markets and indices coming to the JSE with the number of ETFs to choose from reaching 70 different funds. This quarter we explore those ETFs that bring something new to our market.
Coreshares S&P Global Dividend
Index Asset Class Launch Date Expected TER (%)
S&P Global Dividend Aristocrats (custom) Foreign Equity 22-Feb-18 0.6 - 0.7
The Coreshares Global Dividend is first dividend focused offshore ETF available on the JSE and is similar to the local Dividend Aristocrats ETF. It tracks an index made up of around 275 companies from the US, Europe, Canada and Asia with a history of maintaining or increasing dividends over 5 to 25 years depending on the region. Such companies often have reliable cash flows, lower debt levels, and disciplined management accountable to shareholders. The index returned 20.9% p.a. over 5 years in rands to 31 December 2017 (Coreshares, 2018).
Stanlib S&P 500 Info Tech
Index Asset Class Launch Date Expected TER (%)S&P 500 Information Technology Sector Foreign Equity 07-Mar-18 0.49
The Stanlib S&P 500 Info Tech offers sector specific exposure to around 70 Information Technology companies in the S&P 500. It differs from the Sygnia 4th Industrial Revolution ETF as it only invests in US companies in the S&P 500 IT sector. Being market cap weighted it has greater exposure to the larger tech businesses. Accordingly, it has almost 50% exposed to Apple, Microsoft, Facebook and Google. The index returned 20.1% p.a. in USD over 5 years to the end of March 2018 (Stanlib, us.spindices.com).
Ashburton World Government Bond & Stanlib Global Government Bond
Indices Asset Class Launch Date Expected TER (%)Citi World Government Bond Index (WGBI) Foreign Bonds 13-Mar-18 0.45
FTSE G7 Bond Index Foreign Bonds 14-Mar-18 0.54
6 “Active Equity Funds” comprise of ASISA Sectors: SA General Equity, Large Cap, Mid and Small Cap, excluding index funds.

20
The Ashburton and Stanlib Government Bond ETFs will bring foreign sovereign bond exposure to the JSE. Ashburton’s ETF will track the Citi World Government Bond Index (WGBI), made up of investment grade bonds from over 20 countries including the US, many European countries, Japan and even a small exposure to South Africa. Stanlib’s offering will track the FTSE G7 Index; exposed to Canada, France, Germany, Italy, Japan, the United Kingdom, and the United States. It is important to remember that although bonds are generally lower risk investments, investors will be exposed to currency movements which can be more volatile than the underlying assets themselves. In USD, the Citi WGBI returned 1.2% p.a. over 5 years, while the FTSE G7 Government bond index returned 1.0% p.a. over 5 years to March 2018 (Ashburton, Stanlib, ProfileData, iShares, 2018).
Stanlib Global REIT
Index Asset Class Launch Date Expected TER (%)FTSE EPRA/NAREIT Global REIT Index Foreign Property 14-Mar-18 0.48
The Stanlib Global REIT brings diversified global property to the JSE. It differs from the Coreshares Global Property by offering exposure to 293 Real Estate Investment Trusts (REITs) from developed and emerging economies as opposed to Coreshares offering the 40 largest developed market property companies. The index returned 5.1% p.a. in USD over 5 years to the end of March 2018 (Stanlib, FTSE Russell, 2018).
NewFunds Low Volatility
Index Asset Class Launch Date Expected TER (%)Absa Wits Risk-Controlled SA Low Vol Index SA Equity 26-Mar-18 0.5%
The NewFunds Low Volatility will comprise of 20 low volatility and low beta JSE stocks weighted by equal risk contribution. Empirical studies have found that stocks with lower volatility (less ups and downs) have historically tended to outperform in what’s been labelled the ‘low volatility anomaly’. This ETF contrasts with the Coreshares Low Volatility ETF which offers 40 low volatility JSE stocks. The index returned 9.3% p.a. over 5 years in rands to the end of January 2018 (ABSA Capital, 2018).
NewFunds Equity Value
Index Asset Class Launch Date Expected TER (%)Absa Wits Risk-Controlled SA Value Index SA Equity 26-Mar-18 0.5%
The NewFunds Equity Value is the first pure value ETF on the JSE offering 30 stocks with low Price Earnings (PE) and Price to Book (PB) multiples. According to Benjamin Graham, a mentor of Warren Buffett, such stocks offer the investor a ‘margin of safety’. The value factor has been widely found in a large number of studies to outperform over the long term however this approach can take many years to bear fruit. The index returned 7.8% p.a. over 5 years in rands to the end of January 2018 (ABSA Capital, 2018).
Satrix Nasdaq 100
Index Asset Class Launch Date Expected TER (%)Nasdaq 100 SA Equity 10-Apr-18 0.48%
The Satrix Nasdaq will offer exposure to 100 non-financial stocks listed on the Nasdaq exchange in New York. The index is known for being tech heavy with 57% exposed to the sector. The index returned 20.0% p.a. in USD over 5 years to the end of March 2018 (Satrix, ProfileData, 2018).
Cloud Atlas Real Estate ex-SA
Index Asset Class Launch Date Expected TER (%)AMI Real Estate ex-SA Index Foreign Property 20-Apr-18 0.75%
The Cloud Atlas AMI Real Estate ex-SA ETF will offer investors exposure to 13 listed property companies across the African continent excluding South Africa. Regions will include Egypt, Morocco, Botswana, Nigeria, and Mauritius. The index returned 2.8% in USD over 5 years to March 2018 (Cloud Atlas, 2018).
21
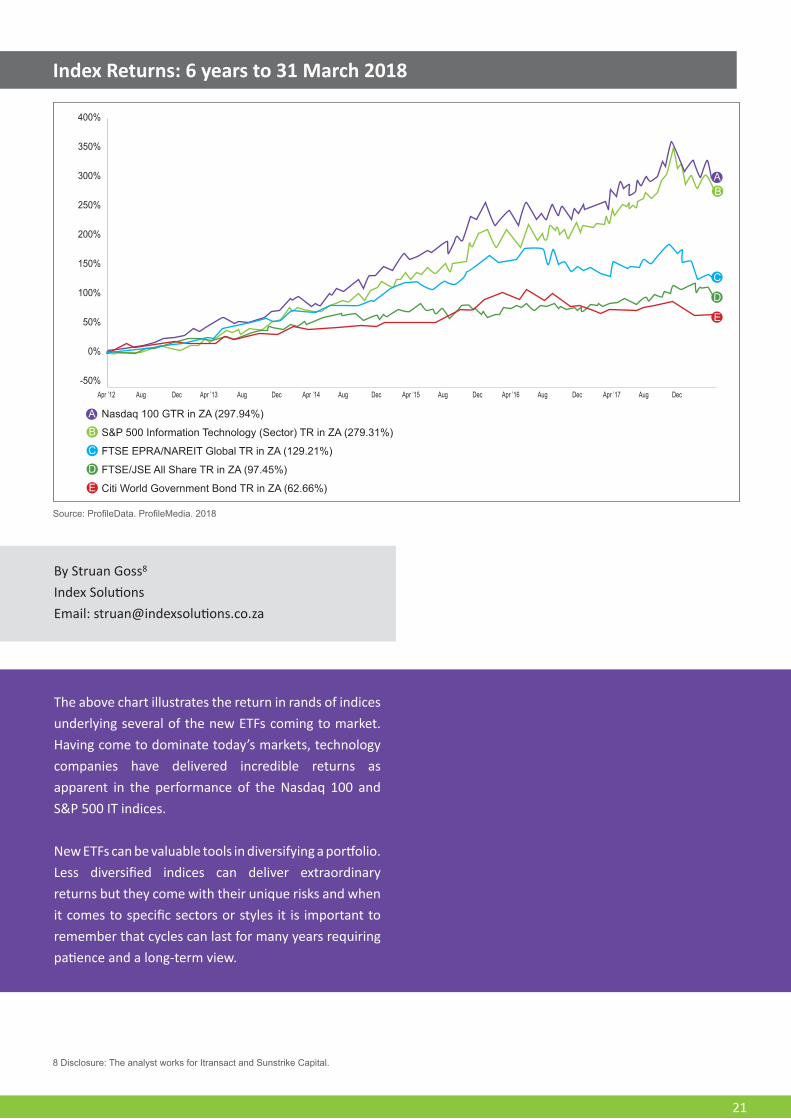
Index Returns: 6 years to 31 March 2018
The above chart illustrates the return in rands of indices underlying several of the new ETFs coming to market. Having come to dominate today’s markets, technology companies have delivered incredible returns as apparent in the performance of the Nasdaq 100 and S&P 500 IT indices.
New ETFs can be valuable tools in diversifying a portfolio. Less diversified indices can deliver extraordinary returns but they come with their unique risks and when it comes to specific sectors or styles it is important to remember that cycles can last for many years requiring patience and a long-term view.
400%
350%
300%
250%
200%
150%
100%
50%
0%
-50%
Source: ProfileData. ProfileMedia. 2018
B
C
D
E
A
Apr ’12 Aug Dec Apr ’13 Aug Dec Apr ’14 Aug Dec Apr ’15 Aug Dec Apr ’16 Aug Dec Apr ’17 Aug Dec
By Struan Goss8
Index SolutionsEmail: [email protected]
B
C
D
E
A Nasdaq 100 GTR in ZA (297.94%)
S&P 500 Information Technology (Sector) TR in ZA (279.31%)
FTSE EPRA/NAREIT Global TR in ZA (129.21%)
FTSE/JSE All Share TR in ZA (97.45%)
Citi World Government Bond TR in ZA (62.66%)
8 Disclosure: The analyst works for Itransact and Sunstrike Capital.

22
PART SEVEN: EDUCATION
INTRODUCTION TO EXCHANGE TRADED PRODUCTS
Traditionally, investing in the market has meant searching for individual shares or investing in unit trusts that try and pick the winning shares in an attempt to do better than the market. This is known as active investing.
This style of investing requires great skill. That skill comes at a price. Strange as it may seem, it is this price that results in a large number of actively-managed funds underperforming, not outperforming, the market. Despite the share market’s impressive long term growth, many investment professionals believe they can consistently outperform markets by picking stocks, and then buying them when the market dips, and selling when it peaks. Over many decades, around the world,
documented research has proven that approximately 80% of active funds that invest in the market will fail to do what they are paid to do – outperform the market.
When it comes to simplicity, one of the best investment products you can own doesn’t try to pick the winners, but invests in all the shares of a market index. For instance, it is possible for you to own the top 40 or even 50 shares on the Johannesburg Stock Exchange with one simple investment. Because there is no “skill” involved in investing like this (a computer simply tracks and captures the best performing shares in the index it tracks), the costs are much lower than active funds. This way of investing also removes the risk of a manager getting it wrong and underperforming.
Exchange Traded Products don’t try to do better than the market, but because of their lower costs they often end up beating the funds that try.
HISTORY OF EXCHANGE TRADED PRODUCTS
In 1975, a gentleman by the name of John Bogle (founder of “Vanguard” one of the world’s largest investment companies) came up with a revolutionary way to invest.
Index (or passive) investing was born. In other words, John Bogle was using the entire market to grow the wealth of investors – and he was cutting the costs of their investing to the bone. Today, index investing – in the form of Exchange Traded Products – provides investors with the performance of the market, or a section of the market, no more and no less, but without the expensive costs of active management.
You may say that it is possible to beat the market. In some cases you will be right. But the odds are heavily stacked against you.
“Do not try to beat the market. Instead, invest in a fund that delivers exactly the performance of the market – but without active management and its associated costs.”

23
DIFFERENT TYPES OF EXCHANGE TRADED PRODUCTS
ETPs are broken
down into two main types.
EXCHANGE TRADED FUNDS (ETFS)
Exchange Traded Funds (ETFs)
Exchange Traded Notes (ETNs)
EXCHANGE TRADED NOTES (ETNS)
ETFs are simply low cost unit trust funds that physically track (mirror) an index. This means that the fund owns the physical stock of the index and the investor purchases a participatory investment in the fund, which then trades as an ETF on the stock market. Most ETFs in South Africa are registered as Collective Investment Schemes (unit trusts), which are regulated by the Financial Services Board (FSB) under the Collective Investment Schemes Act (CISCA). This ensures that an investor’s assets are protected from any type of default by an ETF issuer (normally a bank).
ETNs are not “funds” in the true sense of the word; they are unsecured debt obligations of the institution that issues them (normally a bank). They are structured as a promise to pay a pattern of returns based on the return of a particular index and therefore do not physically hold the assets in a trust like ETFs. ETNs are used to gain access to unique parts of the markets, such as commodities and currencies. Most ETN issuers have the ability to access many other exotic assets, such as oil, wheat, and corn via their global trading operations, and offer these opportunities to investors who cannot easily access these exposures directly.

24
THE DIFFERENCE BETWEEN ACTIVE FUND MANAGEMENT AND PASSIVE FUND MANAGEMENT
ACTIVE INVESTING PASSIVE INVESTING
Actively managed funds try to beat the market. This costs more and therefore have higher fees associated with them.
Passively managed funds don’t try to beat the market. They are the market and therefore have lower fees associated with them.
Active fund managers constantly buy and sell, looking for needles in the haystack – the star performers.
A passively managed fund buys the haystack. It buys all the shares in the index and holds them.
An actively managed fund’s performance depends on the fund manager’s skill and luck. It may or may not outperform its investment objectives.
A passively managed fund does not attempt to beat the market, it simply provides the performance of the index, no more, and no less.
Most actively managed funds do not disclose their holdings regularly – they would be disclosing in-formation to rival companies.
Passively managed funds are 100% transparent. The constituents of the index are published daily in the press.
HOW COSTS DESTROY RETURNSExchange Traded Products are low cost because they are simple. Complexity results in higher costs. Costs destroy returns, and each percentage point saved can have a remarkable outcome over time.
“We never employ fund managers (some of the
world’s most highly paid people) since we
discovered their best kept secret – they could never
consistently beat the stock market index”
- Richard Branson
“It is a failure of the system when money managers are paid huge sums to
move money around while nobody but the investors
themselves suffer the costs of under-performance”
- Warren Buffett
“Most institutional and individual investors will find the best way to own common stock is through
an index fund that charges minimal fees. Those
following this path are sure to beat the net results [after fees and expenses]
delivered by the great majority of investment
professionals.”
- Trevor Manuel

25
The example below illustrates the devastating costs effect of costs over time.
Assumptions
• Amount Invested: R100 000• Term: 20 Years
• Returns: Total Return of 15% Per Annum• Inflation: 6% Per Annum
THE EFFECT OF COSTS OVER TIME
WHY ITRANSACT?
Itransact makes investing simple by providing financial advisers and investors with access to a comprehensive range of high caliber low-cost investment products from leading South African and international asset managers and banks, all in one convenient place.
All investment products on our platform are regulated by the Financial Services Board for complete peace of mind.
Itransact was established in 2010 to address the high fees and costs of investing. And today, we’re proud to be South Africa’s leading independent low cost investment product platform.
We make the market simple

26
CONTACT DETAILS Financial Advisors 0861 432 383Investors 0861 468 [email protected]
Exchange Traded Products are subject to risks similar to those of shares. Investment returns will fluctuate and are subject to market volatility, and when bought or sold, may be worth more or less than their original value. Past performance is not necessarily a guide to the future. The information furnished in this publication, which may include opinions, estimates, indicative rates, terms, price quotations and projections, reflects the existing judgment of the various contributing authors and current market conditions, which judgment and conditions are subject to change without notice, modification or amendment.
Information provided by Itransact does not necessarily reflect the opinion of Itransact, its officers, employees or appointed agents. The information herein has been obtained from various public sources, the accuracy and/or completeness of which Itransact does not guarantee. Itransact recommends that independent tax, accounting, legal and financial advice be sought should any party
seek to place any reliance on the information contained herein. Itransact does not provide investment advice.
This paper may contain ‘forward-looking’ information that is not purely historical in nature. Such information may include, among other things, projections and forecasts. There is no guarantee that any forecasts made will come to pass. Reliance upon information provided by Itransact is at the sole discretion of the user and does not constitute a recommendation, offer or solicitation to buy or sell any products available from Itransact or to adopt any investment strategy based thereon. Unauthorised use or disclosure of information provided by Itransact is prohibited and may not be reproduced and distributed without the express written consent of Itransact. All rights reserved.
Itransact is an authorised financial services provider.
DISCLAIMER

![Venture Capital - Bird & Bird · Venture Capital One of the leading international law firms acting for investors and organisations disrupting, or being disrupted by ... [Struan] has](https://static.documents.pub/doc/80x56/5aeeeb837f8b9ac2468c004c/venture-capital-bird-bird-capital-one-of-the-leading-international-law-firms-acting.jpg)


