Page 1
49
VOTE 2 Provincial Legislature Operational budget R437 609 000
000 Remuneration of the Speaker and Deputy Speaker R 3 253 0001
Statutory amount (Members’ remuneration) R 77 790 000
Total budget R518 652 000
Total to be appropriated (excl. Members’ remuneration) R 440 862 000
Responsible MEC Speaker of the Provincial Legislature
Administering department Provincial Legislature
Accounting officer Secretary: Provincial Legislature
1. Overview
Vision
The vision of the Provincial Legislature (hereafter referred to as the Legislature) is: To be an activist,
people-centred Legislature.
Mission statement
The Legislature’s mission statement is: To deepen democracy and entrench activism in KwaZulu-Natal
through robust oversight, effective public participation and efficient law-making.
Strategic objectives
Strategic policy direction: By focussing on its oversight role and by encouraging public participation, the
Legislature seeks to align its operations and strategic position with the overall aim of government to
achieve accountability and effective service delivery for all citizens of the province in the following areas:
access to quality education and health care, prevention of crime and eradication of corruption, creation of
decent work and expansion of work opportunities, and agrarian reform and rural development.
Law-making
To be an effective, efficient and visible law-maker through:
Improved technical capacity on law-making by the Legislature.
Constitutionally compliant laws enacted by the Legislature.
Oversight
To ensure effective execution of oversight on service delivery, governance and implementation of laws
(and conventions) by the Provincial Executive Council through:
Improved oversight on compliance and accountability by provincial organs of state in terms of
relevant legislative prescripts and protocols.
Improved oversight on service delivery targets set in the NDP, PGDP and MTSF and on the
achievement of government outcomes.
Acceleration of economic transformation in the province.
1 At the time of going to print, the proclamation determining the 2015 salary adjustment relating to office bearers had not been signed by the
Premier, hence this amount remains unchanged from the 2015/16 EPRE.
Page 2
Estimates of Provincial Revenue and Expenditure
50
Public participation
To ensure enhanced public participation in all legislative processes of the Legislature through:
Improved citizen engagement and participation in the legislative processes.
Improved public and civic education programmes to empower the citizens of KwaZulu-Natal.
Governance and leadership
To ensure improved leadership and governance of the Legislature through:
Improved institutional performance, efficiencies, communication and transformation.
Improved institutional fiscal discipline and implementation of financial and supply chain prescripts.
Improved corporate and human capital management services.
Improved institutional internal controls and governance practices.
Improved intergovernmental and international relations.
Core functions
In order to achieve the above strategic objectives, the Legislature is responsible for carrying out the
following core functions:
To maintain the highest standards in drafting, amending and passing legislation.
To timeously consider, pass, amend or reject legislation referred to the Legislature by the Executive
Council or the National Council of Provinces (NCOP).
To maintain oversight over the provincial executive authority in the province, including the
implementation of legislation.
Legislative mandates
The following mandates clearly define the duties and the requirements of the Legislature:
Constitution of the Republic of South Africa (Act No. 108 of 1996)
Promotion of Access to Information Act (Act No. 2 of 2000)
Labour Relations Act (Act No. 66 of 1995)
Basic Conditions of Employment Act (Act No. 75 of 1997)
Employment Equity Act (Act No. 55 of 1998)
Preferential Procurement Policy Framework Act (Act No. 5 of 2000)
Broad-Based Black Economic Empowerment Act (Act No. 53 of 2002)
State Information Technology Agency Act (Act No. 38 of 2002)
KZN Petitions Act (Act No. 3 of 2004)
KZN Funding of Political Parties’ Act (Act No. 7 of 2008)
Financial Management of Parliament Act (Act No. 9 of 2009)
Financial Management of Parliament Amendment Act (Act No. 34 of 2014)
It is noted that provincial legislatures are no longer governed by the Public Finance Management Act (Act
No. 1 of 1999, as amended) and Treasury Regulations. These have been replaced by the Financial
Management of Parliament Amendment Act (FMPAA) which was enacted in 2014, to be implemented
with effect from 1 April 2015. This is commented on in further detail in Section 2 below.
In addition to the above, the Legislature’s functions are governed by the Standing Rules and the
Resolutions of the Legislature Executive Committee (LexCo).
Page 3
Vote 2: Provincial Legislature
51
2. Review of the 2015/16 financial year
Section 2 provides a review of 2015/16, outlining the main achievements and progress made by the
Legislature, as well as providing a brief discussion on challenges and new developments.
Financial Management of Parliament Amendment Act (FMPAA)
As mentioned, the FMPAA was enacted in 2014, with implementation to commence from 1 April 2015. It
is anticipated that the full implementation of the Act will take some time, bearing in mind that the
Legislature has been under the PFMA since its enactment, and therefore 2015/16 was seen as a transitional
period. Accordingly, the Legislature and Provincial Treasury continued working closely together to review
the areas that require change, with the aim being the implementation of the FMPAA as far as possible in
2016/17.
One of the main focus areas in 2015/16 where success was achieved was adapting the 2016/17 MTEF
budget process to fall in line with the FMPAA. In this regard, the Speaker, as the Treasury of the
Legislature, submitted the Legislature’s budget request directly to the MEC for Finance, and not via
Provincial Treasury’s MTEC process which is followed by all provincial departments. The budget request
was based on a zero-based budget exercise which was undertaken by the Legislature, in line with a
resolution taken by the Legislature’s new oversight committee, the Standing Committee on Oversight
(STACOV). The outcome of the zero-based budget exercise was determined at a meeting held between the
MEC and the Speaker, and is commented on later in this chapter.
Cost-containment plan
In December 2014, to address in-year spending pressures, the Legislature devised and implemented a cost-
containment plan. While it is acknowledged that the Legislature is not bound by Cabinet decisions, it has
indicated that it will try and adhere to cost-cutting measures, as far as possible, and hence this cost-
containment plan was further rolled out in 2015/16. The resultant savings were utilised to alleviate in-year
spending pressures, such as the filling of critical posts in terms of the revised organisational structure, as
mentioned below. The areas of cost-containment included scaling down on the purchase of furniture and
equipment, curtailing travel, overtime and catering costs, reviewing and scaling down public participation
events, placing a moratorium on further job evaluations, etc.
Organisational structure
In terms of the provincial cost-cutting measures, Cabinet instructed in 2015/16 that all vacant posts must
be frozen, and any revised organograms which have the effect of increasing a department’s or entity’s
total staff number may not be implemented. As mentioned above, though, the Legislature is not bound by
Cabinet decisions, and therefore continued filling critical posts in terms of its revised organisational
structure, utilising funds reprioritised from enforced savings as far as possible. The revised organisational
structure aims to ensure that the Legislature has sufficient capacity to implement the new legislation
applicable to provincial legislatures, the various SAP modules, as well as the sector oversight model,
which is mentioned below. At the same time, however, rather than employing new staff, the Legislature
began looking at business processes, the re-alignment of functions and the re-distribution of workloads,
with the aim of improving productivity and enhancing business efficiencies.
Strengthening oversight
The Legislature continued to strengthen oversight through continued implementation of the sector
oversight model by giving support to committees and expanding their reach within communities. The
sector oversight model was developed in consultation with National Parliament and the National
Speakers’ Forum, as a standard model to be used by Parliament and the nine legislatures as a mechanism
to hold the executive accountable. For instance, in terms of the model, all legislature committees must
have their own researchers. Researchers were appointed for some of the bigger committees in the
province, and this assisted the oversight role of these committees in 2015/16, and also helped committee
members to improve their skills’ base and better understand the challenges facing communities. However,
the need to implement the Legislature’s revised organisational structure on a phased-in basis meant that
not all committees received the required support in terms of the sector oversight model, meaning that there
was still some reliance on support provided by the Provincial Treasury in 2015/16.
Page 4
Estimates of Provincial Revenue and Expenditure
52
Public participation
In line with the above-mentioned cost-containment plan, the structure of public participation events was
changed in 2015/16 to take place as a report-back session on only one day, with no sitting. Sector
parliaments were also reduced in number, with the People’s Assembly and Learners’ Parliaments being
taken out of the programme. The participants in the Learners’ Parliament were catered for in the Youth
Parliament.
Taking into account the above-mentioned changes in structure, the following public participation events
continued in 2015/16, including the active use of community radio slots to educate members of the public
about the Legislature’s roles and functions:
Workers’ Parliament was held in Amajuba.
Youth Parliament was held in Umzinyathi.
Women’s Parliament was held in Ilembe.
Senior Citizens’ Parliament was held in Umkhanyakude.
People with Disability Parliament was held in Uthukela.
One TLTP event was held in Zululand.
Civil Organisations’ Symposium was held in uMgungundlovu.
The focus of the TLTP initiative was on the Executive Council Members providing responses to issues
raised in the previous years. As a result, the sessions had greater impact on the public than in prior years,
as the public was able to see the link between what they had raised before, and the role of the Legislature
in holding the Executive to account. The first sitting which focussed on having report-back sessions on
issues raised in previous sessions was held in the Umzimkulu Municipality.
Revamping of the Legislature buildings
The Law Society building, owned by the Legislature, was damaged by fire in 2014/15. During the 2015/16
Adjustments Estimate, the Legislature received a once-off allocation of R1.500 million, based on an
assessment by Department of Public Works (DOPW) to renovate this building, and replace the network
cables and office furniture. The project consultants were appointed and the site viewing was completed in
the third quarter of 2015/16. DOPW was in the process of sourcing the construction contractor toward the
end of 2015/16, and it is anticipated that the work will be competed in the first half of 2016/17.
The Legislature received once-off funding in 2015/16 for improvements to the two party caucus rooms, as
well as the main chamber (including the galleries). These improvements, the bulk of which will be
finalised by the end of the financial year, will allow the holding of parallel hearings in the main chamber
and the majority party caucus room. There was slow progress on the revamping of the audio-visual
systems in the main chamber due to delays by DOPW in finalising the needs assessment report. It is
anticipated that this project will commence in late 2015/16, and will continue into 2016/17.
Improved Hansard production
In 2014/15, the Legislature was allocated additional once-off funding of R14 million for the improved
Hansard production project. It was anticipated that the hardware and software would be purchased and
installed toward the end of 2014/15, but the required procurement processes took far longer than
envisaged, and the Hansard production project funding was largely absorbed by other spending pressures.
Although there were no major developments in 2015/16, the Legislature took a decision to continue with
this project on a phased-in basis commencing in 2016/17, from reprioritised savings, and this is
commented on in Section 3 below.
3. Outlook for the 2016/17 financial year
Section 3 looks at the key focus areas of 2016/17, outlining what the Legislature is hoping to achieve, as
well as briefly looking at challenges and proposed new developments. The bulk of the Legislature’s
budget relates to the areas of law-making and oversight, as well as public participation. The Legislature
Page 5
Vote 2: Provincial Legislature
53
will aim to improve its oversight over, among others, departments and public entities during the year.
Also, the Legislature will continue to focus on procedures and processes that need to be reviewed and/or
changed to facilitate the roll-out of the FMPAA, as outlined below.
Financial Management of Parliament Amendment Act (FMPAA)
As mentioned, it is anticipated that the full implementation of the FMPAA will take some time. In
2016/17, the focus will be on fully establishing the Internal Audit and Treasury components in the
Speaker’s office.
It is noted that most provinces are in agreement that the budget allocation of provincial legislatures should
be top-sliced from the provincial equitable share and elevated to National Government level, as this will
ensure the autonomy of provincial legislatures when compared to the other provincial departments, and
will be in line with the concepts of the FMPAA. This issue of top-slicing is unlikely to be resolved in the
near future, though.
Public participation
In line with the previously mentioned changes to public involvement initiatives like TLTP and sector
parliaments, public participation initiatives will continue in 2016/17, although the sector parliaments will
continue to be scaled down by the removal of the People’s Assembly and Learners’ Parliaments from the
programme.
The following public participation events are thus scheduled to be held in 2016/17, although the venues
will only be confirmed in April 2016:
Workers’ Parliament.
Youth Parliament.
Women’s Parliament.
Senior Citizens’ Parliament.
People with Disability Parliament.
Two TLTP events.
With regard to TLTP, the Legislature identified a gap in the programme’s structure in that the report of the
oversight committee teams is not debated and adopted in the area where the report back happens. Going
forward, the Legislature will arrange a two-day sitting, with the first day dedicated to presentation of the
oversight report and responses from the Executive Council, and the second day dedicated to a formal
debate on the report. This addition will allow scrutiny of the responses given by the Executive Council,
and the adoption of the resolutions contained in the report. The Speaker will then be able to refer the
report to the relevant portfolio committees to track the implementation thereof and conduct the necessary
oversight.
Improved Hansard production
As mentioned previously, it is the Legislature’s intention to commence with the installation of the
improved Hansard production project on a phased-in basis over the 2016/17 MTEF, through funds
reprioritised from other areas.
Part of this initiative relates to planned improvements to the video conferencing room. The initial idea of
video conferencing rooms in the legislative sector was for briefings on NCOP legislation via video. The
link to all legislatures is through a platform in Parliament (which is booked two days in advance).
Legislatures currently cannot use the facility to link up on their own or with other institutions which have
the facility. The aim of improving the facility is to widen the scope of operations to enable independent
link-up with other legislatures or any other institution that has the facility. In this way, the facility can be
used by committees to share experiences, without leaving the respective province, thus saving costs. With
prior notification to the Legislature, the facility will also be available for use by departmental HODs to
confer with their counterparts in other provinces.
Page 6
Estimates of Provincial Revenue and Expenditure
54
4. Receipts and financing
4.1 Summary of receipts and departmental receipts collection
Table 2.1 below shows the sources of funding and own receipts of Vote 2 over the seven-year period
2012/13 to 2018/19. The table also compares actual and budgeted receipts against actual and budgeted
payments. Details of departmental receipts are presented in Annexure – Vote 2: Provincial Legislature.
Summary of departmental receipts
The Legislature collects revenue in the form of interest earned on positive cash balances in the bank
against Interest, dividends and rent on land, commission on insurance, waste paper in respect of Sale of
goods and services other than capital assets, as well as recoveries of debts and other miscellaneous items
reflected against Transactions in financial assets and liabilities.
The PFMA and the FMPAA both provide for provincial legislatures to retain any monies received (i.e.
revenue collected). Therefore, in contrast to provincial departments, the Legislature retains its own
departmental receipts, and is thus funded from two sources, namely Treasury funding (equitable share)
and departmental receipts. In accordance with this legislation, the Legislature is allocated any surplus
revenue collected in the prior year during the next year’s Adjustments Estimate. This explains the Surplus
own revenue surrendered and Surplus own revenue from prior year reflected in the Financing section in
Table 2.1.
The surplus own revenue from the prior year reflected in the 2014/15 column is far lower than the surplus
own revenue surrendered in 2013/14. The reason for this is that the revenue collected in 2013/14 included
an amount of R2.998 million, being interest relating to the Political Parties’ Fund (PPF). This amount was
allocated back to the Legislature in the 2013/14 Adjustments Estimate to increase the PPF allocation in
2013/14, and is therefore excluded from surplus own revenue from the prior year in 2014/15.
Sale of goods and services other than capital assets comprises revenue collected from items such as the
sale of old printer cartridges and commission on pay-roll deductions such as insurance and garnishees.
This revenue is difficult to predict, accounting for the fluctuations in the prior years.
Table 2.1 : Summary of receipts and financing
Audited OutcomeMain
Appropriation
Adjusted
Appropriation
Revised
EstimateMedium-term Estimates
R thousand 2012/13 2013/14 2014/15 2016/17 2017/18 2018/19
Treasury funding
Equitable share 401 748 416 457 436 628 455 259 455 259 455 259 481 842 505 975 535 345
Conditional grants - - - - - - - - -
Total receipts: Treasury funding 401 748 416 457 436 628 455 259 455 259 455 259 481 842 505 975 535 345
Departmental receipts
Tax receipts - - - - - - - - -
Casino taxes - - - - - - - - -
Horse racing taxes - - - - - - - - -
Liquor licences - - - - - - - - -
Motor vehicle licences - - - - - - - - -
Sale of goods and services other than capital assets 73 107 69 51 51 63 54 57 60
Transfers received - - - - - - - - -
Fines, penalties and forfeits - - - - - - - - -
Interest, dividends and rent on land 449 802 1 610 432 432 2 214 455 478 506
Sale of capital assets 564 - 486 - - - - - -
Transactions in financial assets and liabilities 1 245 3 015 785 252 252 784 265 278 294
Total departmental receipts 2 331 3 924 2 950 735 735 3 061 774 813 860
Total receipts 404 079 420 381 439 578 455 994 455 994 458 320 482 616 506 788 536 205
Total payments 431 718 460 929 476 027 465 494 479 262 479 262 518 652 538 851 569 128
Surplus/(Deficit) before financing (27 639) (40 548) (36 449) (9 500) (23 268) (20 942) (36 036) (32 063) (32 923)
Financing
of which
Surplus own revenue surrendered (1 702) (3 261) (2 247) - - - - - -
Surplus own revenue from prior year 953 1 702 263 - 2 247 2 247 - - -
Provincial cash resources 27 712 35 998 45 996 9 500 21 021 21 021 36 036 32 063 32 923
Surplus/(Deficit) after financing (676) (6 109) 7 563 - - 2 326 - - -
2015/16
Page 7
Vote 2: Provincial Legislature
55
With regard to Interest, dividends and rent on land, the revenue reflected in 2013/14, 2014/15 and the
2015/16 Revised Estimate is fairly high, largely due to the Legislature’s under-spending each year in
respect of the Members’ remuneration, as well as under-spending in respect of the improved Hansard
production project in 2014/15. This under-spending resulted in more cash in the bank than anticipated.
This category is difficult to predict with accuracy, especially taking into account the reduction in the
Members’ remuneration allocation following the zero-based budget exercise, as commented on later in
this chapter, accounting for the conservative amounts over the MTEF.
Revenue collected against Sale of capital assets in 2012/13 and 2014/15 relates to auction sales of
redundant assets (mainly vehicles). Such auction sales are difficult to predict, and hence no revenue
budget is provided for this category in 2015/16 and over the 2016/17 MTEF at this stage.
Revenue collected against Transactions in financial assets and liabilities is difficult to accurately estimate,
as it relates to the collection of amounts owing from previous financial years, such as debts relating to
both staff and Members, and this accounts for the fluctuating trend, and the conservative amounts
reflected over the MTEF. The 2012/13 amount includes a refund of R1.180 million from the Office of the
Premier in respect of shared costs for certain events held in 2011/12, including Women’s Parliament,
People with Disability Parliament, and the International Day of Disabled Persons. The 2013/14 collection
includes prior years’ interest of R2.998 million relating to the PPF, as explained above.
Summary of receipts and financing
Table 2.1 also compares total receipts and total payments. In 2012/13, the Legislature received provincial
cash resources of R27.712 million as follows:
The operational budget of R17.749 million that was unspent in 2011/12 was allocated back for
spending in 2012/13. This was in line with a decision taken by Provincial Treasury and the Finance
Portfolio Committee (FPC) at the time, that the Legislature be allowed to retain its surplus voted
funds every year from 2012/13 onward.
R2.755 million was allocated toward the above-budget 2012 wage agreement for the Legislature staff.
A once-off R7.208 million was allocated to assist with the implementation and roll-out of SAP.
For the first time in several years, the 2012/13 year-end spending of the Legislature was largely on track,
with minimal over-spending of R676 000. However, the operational budget was over-spent by
R3.815 million, largely because the purchase and installation of the SAP system was higher than
anticipated. This was offset by under-spending of R3.139 million against the Members’ remuneration due
to continued over-provision in the baseline.
In 2013/14, the Legislature received provincial cash resources of R35.998 million, as follows:
R2.998 million, being the interest earned on the PPF since its inception in 2005, was paid into the
Provincial Revenue Fund (PRF) by the Legislature. This amount was formally appropriated back in
the 2013/14 Adjustments Estimate, to be used to increase the PPF allocation for 2013/14 only.
R33 million related to unspent voted funds that remained in the Legislature’s bank account over the
years. Following a detailed reconciliation from 2003/04, an amount of R33 million was paid into the
PRF, and was formally allocated to the Legislature in the 2013/14 Adjustments Estimate, in line with
the above-mentioned decision that the Legislature be allowed to retain its surplus voted funds every
year. These funds were used to offset in-year spending pressures, including the building revamping
projects and the upgrading and filling of critical posts in terms of the sector oversight model.
The Legislature’s budget was over-spent by R6.109 million at the end of 2013/14. The operational budget
was over-spent by R11.064 million, but this was offset by under-spending of R4.955 million in respect of
the Members’ remuneration due to the ongoing over-provision in the baseline. The over-spending in
respect of the operational budget was largely due to the following:
Costs relating to the roll-out of SAP were higher than anticipated, partly due to the support and
change management services required.
There were higher than expected costs in respect of public participation events.
Page 8
Estimates of Provincial Revenue and Expenditure
56
There was spending pressure from the upgrading of posts in terms of the sector oversight model, and
the annual wage adjustment for Legislature staff was higher than budgeted for.
In 2014/15, the Legislature received once-off provincial cash resources which resulted in a net increase of
R45.996 million as follows:
R27.855 million was allocated in respect of the special allowance to Members whose tenure of office
was affected by these elections, but the full amount was not required. During the Adjustments
Estimate, the unspent balance of R19.227 million was split as follows:
R8.753 million was redirected to offset in-year spending pressures in the operational budget.
R974 000 was suspended from Vote 2 to Vote 6: Provincial Treasury for the payment of the
former MEC for Finance’s exit package after the 2014 general elections.
R9.500 million was suspended from 2014/15 and was reallocated back to Vote 2 in 2015/16 for
strengthening oversight and IT infrastructure.
R7 million was allocated to assist with observing and monitoring the 2014 general elections. Of this,
only R2.966 million was spent, but the balance of R4.034 million was redirected in the Adjustments
Estimate to offset in-year spending pressures in the operational budget.
R5 million was allocated for the feasibility study in respect of the proposed new Legislature complex
(in line with the revival of the government office precinct project at the time).
R14 million was allocated for the improved Hansard production project.
R4.955 million, being Members’ remuneration funding that was unspent in 2013/14, was allocated
back to increase the operational budget, as follows:
R2.998 million was allocated to increase the transfer to the PPF in 2014/15. A mentioned, this
amount, which relates to interest earned on the PPF in prior years, was appropriated back to the
Legislature in 2013/14 to increase the transfer to the PPF. However, this amount was inadvertently
not transferred to the PPF, and this adjustment was to correct that oversight.
R1.957 million was allocated to offset in-year spending pressures in the operational budget.
R2.340 million was deducted relating to previous years’ irregular expenditure. Cabinet approved that,
where departments were unable to provide sufficient justification for the irregular expenditure, this
amount must become a first charge against the vote.
The Legislature’s budget was under-spent by R7.563 million at the end of 2014/15, in respect of both the
Members’ remuneration and the operational budget. The Members’ remuneration was under-spent by
R4.147 million due to the ongoing over-provision in the baseline, and the operational budget was under-
spent by R3.416 million. However, if one takes into account the under-spending in respect of funds that
were specifically and exclusively appropriated for the improved Hansard production project and the
Legislature complex feasibility study, then the year-end under-spending in respect of the operational
budget should have been in the region of R19 million. This means that, in effect, the Legislature over-
spent its operational budget by R15.584 million, despite the implementation of a cost-containment plan.
The over-spending in respect of the operational budget was largely due to the following:
There was over-expenditure on consultants and professional services costs relating to SAP.
There was over-spending on contractors, as a result of late invoicing from DOPW, the implementing
agent, in respect of 2013/14 projects such as the Tatham Art Gallery parking for Members.
Audit costs were over-spent because the 2013/14 audit took far longer to complete than anticipated as
a result of problems associated with the change-over to SAP.
There was over-spending in respect of property payments and operating leases because of higher than
budgeted costs, largely in respect of security services, cleaning services, water and electricity, etc.
In the 2015/16 Main Appropriation, the Legislature received once-off provincial cash resources of
R9.500 million, which were suspended from 2014/15 and reallocated back in 2015/16 for strengthening
oversight and IT infrastructure. In the 2015/16 Adjusted Appropriation, additional cash resources of
Page 9
Vote 2: Provincial Legislature
57
R11.521 million were allocated, consisting of R7.563 million allocated back to the Legislature in respect
of the operational budget and Members’ remuneration funding that was unspent in 2014/15,
R2.112 million for the above-budget 2015 wage adjustment for the Legislature staff, R1.500 million to
cater for renovations to the Law Society building which was damaged by fire in 2014/15, as well as
R346 000 to assist the Legislature to implement a long service recognition policy similar to the Public
Service policy implemented in 2012.
As at the end of the third quarter, the Legislature is anticipating to end 2015/16 with a balanced budget.
The surplus of R2.236 million in the 2015/16 Revised Estimate relates to the fact that the Legislature is
anticipating to over-collect revenue by this amount in 2015/16, as explained above.
The Legislature’s budget shows healthy growth over the 2016/17 MTEF as a result of an increase in the
baseline of R30.536 million, R32.063 million, and R32.923 million in each year of the MTEF, in line with
the zero-based budget exercise. Furthermore, additional once-off funding of R5.500 million was allocated
in 2016/17, comprising R1.500 million for the replacement of a lift in the Legislature building, and
R4 million for hosting a Commonwealth Parliamentary Association (CPA) conference in the province.
4.2 Donor funding
The Legislature receives no direct funding in respect of the Legislature Support programme, which is
funded by the European Union (EU), with the aim of contributing to the strengthening of democracy and
good governance. Instead, the programme funds projects which support the entire Legislative sector,
mainly aimed at achieving constitutional imperatives. The specific purpose is to support South African
Legislatures to fulfil their constitutional mandates in a citizen-oriented manner. The allocation of any EU
funding and the payment and monitoring thereof is undertaken centrally at a national level on behalf of the
nine provinces.
5. Payment summary
This section summarises the expenditure and budgeted estimates for the vote in terms of programmes and
economic classification. Details of the economic classification per programme are given in Annexure –
Vote 2: Provincial Legislature.
5.1 Key assumptions
The Legislature applied the following broad assumptions when compiling the budget:
All inflation related increases are based on CPI projections.
Provision was made for the carry-through costs of the above-budget 2015 wage agreement (which, in
the case of the Legislature, was similar to provincial departments) and an inflationary wage
adjustment of 7.2, 6.8 and 6.8 per cent for each of the three years of the 2016/17 MTEF, respectively.
Although the Legislature is not bound by Cabinet decisions, it has indicated that, over the 2016/17
MTEF, it will try and adhere to, as far as possible, the expanded cost-cutting measures, as reissued by
Provincial Treasury in 2015/16, in conjunction with National Treasury Instruction 01 of 2013/14:
Cost-containment measures.
It is noted that, in addition to the above, as a result of the need to lower the expenditure ceiling across
the country (see Section 5.2 below), provincial departments had to adhere to the following guidelines:
Expenditure on Compensation of employees was lowered by freezing all vacant non-OSD posts.
This cut does not affect Education or Health as these are to be protected in this process.
Departments’ equitable share funded Goods and services budgets were cut by 2 per cent.
Departments’ and public entities’ hosting of events budgets were cut over the MTEF.
Although the Legislature, like Education and Health, was protected from these cuts, over the MTEF
only critical vacant posts will be filled in terms of its revised organisational structure, taking into
account that funds will need to be reprioritised internally in this regard. It is noted that the outcome of
Page 10
Estimates of Provincial Revenue and Expenditure
58
the zero-based budget included provision for critical posts that were filled in recent years without
adequate carry-through funding.
Provision was made for ongoing training and change management relating to the roll-out of SAP.
SAP training will have to be provided to any new staff and Members on an ongoing basis.
With regard to public participation, two TLTP sittings and five sectoral parliaments were catered for.
The cost of each of these events will vary slightly, depending on location and the population of the
area. The cost will only be confirmed in April 2016, once the respective venues are finalised.
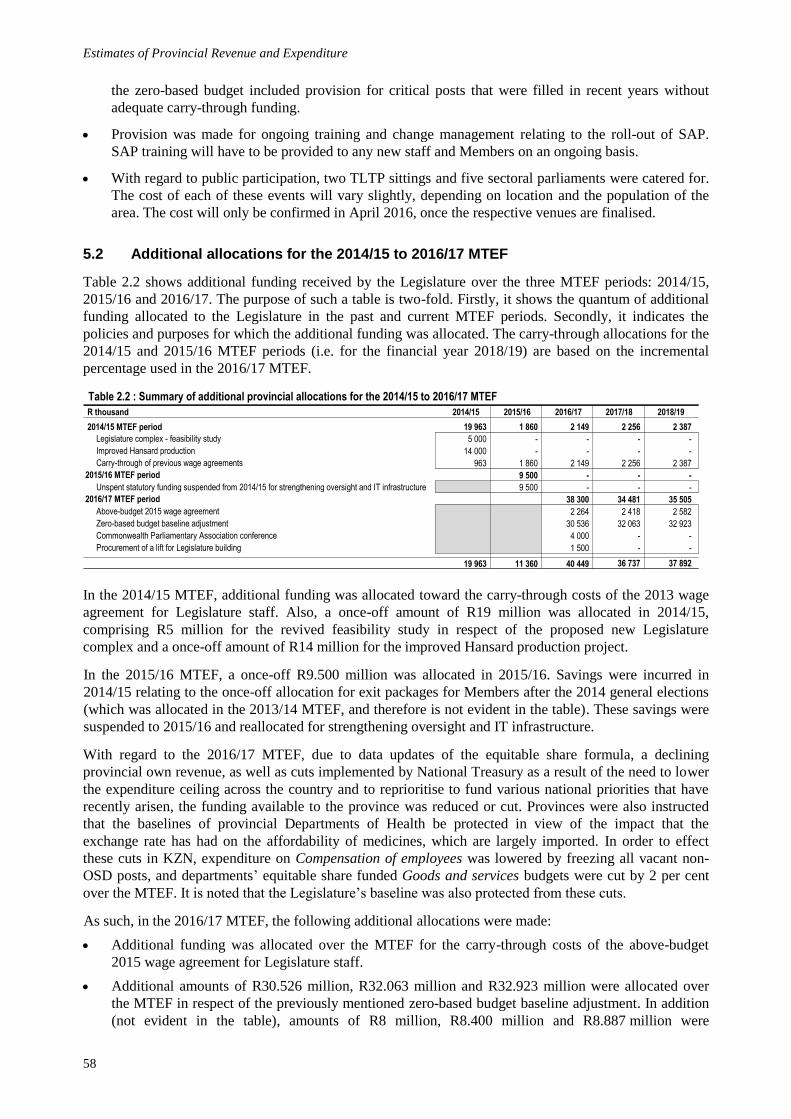
5.2 Additional allocations for the 2014/15 to 2016/17 MTEF
Table 2.2 shows additional funding received by the Legislature over the three MTEF periods: 2014/15,
2015/16 and 2016/17. The purpose of such a table is two-fold. Firstly, it shows the quantum of additional
funding allocated to the Legislature in the past and current MTEF periods. Secondly, it indicates the
policies and purposes for which the additional funding was allocated. The carry-through allocations for the
2014/15 and 2015/16 MTEF periods (i.e. for the financial year 2018/19) are based on the incremental
percentage used in the 2016/17 MTEF.
In the 2014/15 MTEF, additional funding was allocated toward the carry-through costs of the 2013 wage
agreement for Legislature staff. Also, a once-off amount of R19 million was allocated in 2014/15,
comprising R5 million for the revived feasibility study in respect of the proposed new Legislature
complex and a once-off amount of R14 million for the improved Hansard production project.
In the 2015/16 MTEF, a once-off R9.500 million was allocated in 2015/16. Savings were incurred in
2014/15 relating to the once-off allocation for exit packages for Members after the 2014 general elections
(which was allocated in the 2013/14 MTEF, and therefore is not evident in the table). These savings were
suspended to 2015/16 and reallocated for strengthening oversight and IT infrastructure.
With regard to the 2016/17 MTEF, due to data updates of the equitable share formula, a declining
provincial own revenue, as well as cuts implemented by National Treasury as a result of the need to lower
the expenditure ceiling across the country and to reprioritise to fund various national priorities that have
recently arisen, the funding available to the province was reduced or cut. Provinces were also instructed
that the baselines of provincial Departments of Health be protected in view of the impact that the
exchange rate has had on the affordability of medicines, which are largely imported. In order to effect
these cuts in KZN, expenditure on Compensation of employees was lowered by freezing all vacant non-
OSD posts, and departments’ equitable share funded Goods and services budgets were cut by 2 per cent
over the MTEF. It is noted that the Legislature’s baseline was also protected from these cuts.
As such, in the 2016/17 MTEF, the following additional allocations were made:
Additional funding was allocated over the MTEF for the carry-through costs of the above-budget
2015 wage agreement for Legislature staff.
Additional amounts of R30.526 million, R32.063 million and R32.923 million were allocated over
the MTEF in respect of the previously mentioned zero-based budget baseline adjustment. In addition
(not evident in the table), amounts of R8 million, R8.400 million and R8.887 million were
Table 2.2 : Summary of additional provincial allocations for the 2014/15 to 2016/17 MTEF
R thousand 2014/15 2015/16 2016/17 2017/18 2018/19
2014/15 MTEF period 19 963 1 860 2 149 2 256 2 387
Legislature complex - feasibility study 5 000 - - - -
Improved Hansard production 14 000 - - - -
Carry-through of previous wage agreements 963 1 860 2 149 2 256 2 387
2015/16 MTEF period 9 500 - - -
Unspent statutory funding suspended from 2014/15 for strengthening oversight and IT infrastructure 9 500 - - -
2016/17 MTEF period 38 300 34 481 35 505
Above-budget 2015 wage agreement 2 264 2 418 2 582
Zero-based budget baseline adjustment 30 536 32 063 32 923
Commonwealth Parliamentary Association conference 4 000 - -
Procurement of a lift for Legislature building 1 500 - -
19 963 11 360 40 449 36 737 37 892
Page 11
Vote 2: Provincial Legislature
59
reprioritised from savings on the statutory Members’ remuneration to the operational budget, as part
of the baseline adjustment. In total, then, the Legislature’s operational budget was increased by
R38.536 million, R40.463 million and R42.810 million over the 2016/17 MTEF. It is noted that the
baseline was increased to assist the Legislature with operational spending pressures, largely resulting
from critical posts that were filled in recent years without adequate carry-through funding, increasing
travel and subsistence costs relating to Members and portfolio committees, increasing SAP licence
fees and ongoing SAP support, higher than budgeted operating leases and property payments
(particularly increased security services costs), as well as an increase in the secretarial and research
allowances paid to political parties to bring them in line with national guidelines.
A once-off amount of R4 million was allocated in respect of the CPA conference that is planned to be
held in KZN in 2016. This amount includes, among others, provision for the conference venue hire
for six days, accommodation and transport for 250 delegates in and around Durban for this period,
welcoming and gala dinner, conference meals, etc.
A once-off R1.500 million was allocated for the replacement of a lift in the Legislature building.
It is noted that the Legislature requested that the PPF be increased by R5 million in 2015/16, with carry-
through, as part of the zero-based budget exercise. The PPF, which is aimed at assisting political parties to
carry out their constitutional mandate, in terms of the KZN Funding of Political Parties’ Act, No. 7 of
2008, was capped at R30 million in 2011/12, in line with a Cabinet resolution. As such, the “uncapping”
of this amount requires Cabinet approval. Subsequent to the zero-based budget exercise, in December
2015, the Legislature obtained Cabinet approval to reverse the capping. However, Cabinet did not indicate
how the increase should be funded over the MTEF, and this issue is currently under discussion.
5.3 Summary by programme and economic classification
Tables 2.3 and 2.4 below provide a summary of the vote’s expenditure and budgeted estimates over the
seven-year period, by programme and economic classification, respectively. It is noted that the Members’
remuneration forms a direct charge on the PRF, and so is not included as a programme, but is reflected as
Direct charge on the Provincial Revenue Fund.
The following comments are made with regard to the Members’ remuneration allocation:
The 2014/15 amount is high because it includes R8.669 million in respect of the allowance paid to
Members that exited the Legislature following the 2014 general elections. This accounts for the
minimal growth in the Members’ remuneration from 2014/15 to the 2015/16 Main Appropriation.
The 2015/16 Adjusted Appropriation and Revised Estimate reflect a reduction of R8 million, as the
Members’ remuneration continued to be over-budgeted for. These savings were redirected to offset
operational spending pressures in the two programmes in the 2015/16 Adjustments Estimate. Also, as
mentioned, as part of the above-mentioned zero-based budget exercise, the Legislature compiled a
zero-based budget in respect of the Members’ remuneration, based on which the statutory budget was
adjusted downwards by approximately R8 million in each year of the MTEF. These savings were
redirected to offset operational spending pressures.
The Members’ remuneration grows steadily over the MTEF, following the above-mentioned
reductions resulting from the zero-based budget exercise.
Table 2.3 : Summary of payments and estimates by programme: Provincial Legislature
Audited OutcomeMain
Appropriation
Adjusted
Appropriation
Revised
EstimateMedium-term Estimates
R thousand 2012/13 2013/14 2014/15 2016/17 2017/18 2018/19
1. Administration 148 503 168 686 167 774 142 716 165 529 165 529 171 165 174 990 184 161
2. Parliamentary Business 216 055 221 148 226 159 240 457 239 412 239 412 269 697 283 518 299 964
Direct charge on the Provincial Revenue Fund
Members' remuneration 67 160 71 095 82 094 82 321 74 321 74 321 77 790 80 343 85 003
Total 431 718 460 929 476 027 465 494 479 262 479 262 518 652 538 851 569 128
of which:
Departmental receipts 2 331 3 924 2 950 735 735 3 061 774 813 860
2015/16
Page 12
Estimates of Provincial Revenue and Expenditure
60
The Legislature’s operational budget (i.e. the two programmes excluding the Members’ remuneration),
reflects several marked fluctuations over the seven years. As mentioned, the Legislature’s budget was
protected from the MTEF budget cuts. The following paragraphs summarise the trends at programme and
economic classification level, while further detail is given in Section 6.
Programme 1: Administration shows a fluctuating trend, largely because the budget for various once-off
projects, such as the building revamping projects and other major procurement costs, is centralised under
this programme. For instance, the peak in 2013/14 can be ascribed to the continued roll-out of SAP and
several building revamping projects, such as the Tatham Art Gallery parking and renovations to the
Speaker’s cottage. This accounts for the slight reduction from 2013/14 to 2014/15. The 2014/15 amount
includes provision for the continued roll-out of SAP, the purchase of tools of trade (such as lap-tops) for
all new Members following the 2014 general elections, the purchase of motor vehicles for the Speaker’s
Office, the revived Legislature complex feasibility study, as well as procurement costs in respect of the
improved Hansard production project. Although no expenditure was incurred in respect of the latter two
projects, the provision was largely used to absorb other in-year spending pressures. These once-off
amounts explain the reduction from 2014/15 to the 2015/16 Main Appropriation. The 2015/16 Adjusted
Appropriation included funding for the above-budget wage agreement for the Legislature staff, provision
for the renovation of the Law Society building, as well as the reprioritisation of savings from Corporate
Governance in Programme 2 to this programme to establish an Auxiliary Services unit which will oversee
various transversal activities. In addition, the 2015/16 Adjusted Appropriation included unspent
operational and Members’ remuneration funding from 2014/15 that was allocated back to cater for in-
year-spending pressures, including outstanding commitments from 2014/15 relating to building
maintenance and SAP costs, higher than budgeted risk management costs, and continued support and
training relating to SAP and GRAP reporting requirements. These largely once-off amounts in 2015/16, as
well as the fact that the 2016/17 allocation includes once-off provision for the hosting of the CPA
conference and the replacement of a lift in the Legislature building, account for the fairly low growth from
2015/16 to 2016/17. The MTEF allocations include R18.738 million, R19.675 million and
R20.816 million of the additional funding allocated as a result of the zero-based budget exercise,
contributing to the growth in the MTEF baseline when compared to the 2015/16 Main Appropriation.
Table 2.4 : Summary of provincial payments and estimates by economic classification: Provincial Legislature
Audited OutcomeMain
Appropriation
Adjusted
Appropriation
Revised
EstimateMedium-term Estimates
R thousand 2012/13 2013/14 2014/15 2016/17 2017/18 2018/19
Current payments 262 322 290 402 299 174 286 324 306 592 306 592 335 565 348 806 368 061
Compensation of employees 130 132 153 015 160 533 153 269 163 727 163 727 185 627 195 922 206 309
Goods and services 132 083 137 387 138 641 133 055 142 865 142 865 149 938 152 884 161 752
Interest and rent on land 107 - - - - - - - -
Transfers and subsidies to: 78 199 82 436 84 401 87 372 87 372 87 372 97 097 101 988 107 902
Provinces and municipalities 10 16 20 36 36 36 38 40 42
Departmental agencies and accounts 276 - - - - - - - -
Higher education institutions - - - - - - - - -
Foreign governments and international organisations 233 221 141 207 207 207 217 228 241
Public corporations and private enterprises - - - 26 26 26 27 28 30
Non-profit institutions 77 456 82 199 84 240 86 780 86 780 86 780 95 948 100 782 106 627
Households 224 - - 323 323 323 867 910 962
Payments for capital assets 24 037 16 996 9 545 9 477 10 977 10 977 8 200 7 714 8 162
Buildings and other fixed structures 2 853 4 181 2 055 850 2 350 2 350 395 940 995
Machinery and equipment 15 352 6 332 4 179 7 139 7 139 7 139 6 238 5 129 5 427
Heritage assets - - - - - - - - -
Specialised military assets - - - - - - - - -
Biological assets - - - - - - - - -
Land and sub-soil assets - - - - - - - - -
Software and other intangible assets 5 832 6 483 3 311 1 488 1 488 1 488 1 567 1 645 1 740
Payments for financial assets - - 813 - - - - - -
Total 364 558 389 834 393 933 383 173 404 941 404 941 440 862 458 508 484 125
of which:
Departmental receipts 2 331 3 924 2 950 735 735 3 061 774 813 860
Adjusted total 364 558 389 834 393 933 383 173 404 941 404 941 440 862 458 508 484 125
Members' remuneration 67 160 71 095 82 094 82 321 74 321 74 321 77 790 80 343 85 003
Adjusted total (incl. Members' remuneration) 431 718 460 929 476 027 465 494 479 262 479 262 518 652 538 851 569 128
2015/16
Page 13
Vote 2: Provincial Legislature
61
Apart from a slight dip in the 2015/16 Adjusted Appropriation and Revised Estimate, Programme 2:
Parliamentary Business shows reasonable growth over the seven years. This programme includes
substantial provision for public participation initiatives, overseas study tours undertaken by portfolio
committees, support for political parties in the form of constituency, secretarial and research allowances,
as well as the PPF (which is capped at R30 million at this stage, as mentioned previously). Although there
are once-off amounts that affect the trend of this programme in the prior years, they are not as significant
as those in Programme 1, and therefore the trend does not show similar fluctuations. As mentioned, in
2014/15, the Legislature implemented a cost-containment plan, whereby enforced savings were identified
in Programme 2 to offset Programme 1’s projected over-expenditure. These enforced savings included
scaling down in respect of public involvement initiatives and associated travel costs, as well as limiting
expenditure on non-essential Goods and services items, such as catering costs. The slight reduction in the
2015/16 Adjusted Appropriation relates to the reprioritisation of savings from this programme to
Programme 1 to establish an Auxiliary Services unit which will oversee various transversal activities. The
MTEF allocations include R19.798 million, R20.788 million and R21.994 million of the additional
funding allocated to the Legislature as a result of the zero-based budget exercise, again contributing to the
growth in the MTEF baseline when compared to the 2015/16 Main Appropriation.
Compensation of employees in Table 2.4 relates to the Legislature staff (excluding the Members’
remuneration trends, which have already been explained above). Compensation of employees reflects a
steady increase, which can be attributed to the implementation of the prior year job evaluation review
results (with substantial back-pay in some instances), the filling of critical posts in terms of the revised
organisational structure incorporating the sector oversight model, as well as the annual sale of leave (leave
encashment). The 2015/16 Main Appropriation is low as the Legislature did not budget adequately for the
critical posts that were filled in recent years. This was rectified to some extent in the Adjusted
Appropriation by the reprioritisation of funds from other areas, including from the statutory Members’
remuneration which was over-provided for. The 2015/16 Adjusted Appropriation includes additional
funding for the above-budget 2015 wage agreement for the Legislature staff. The increase over the MTEF
provides for the carry-through costs of the above-budget wage agreement, as well as the carry-through
costs of critical posts that were filled in prior years without being adequately budgeted for, funded from
the zero-based budget exercise.
The slight fluctuations in Goods and services in the prior years can largely be ascribed to projects with
once-off costs, including the roll-out of SAP, current building revamping projects, as well as other once-
off projects which are largely catered for under this category. The high 2013/14 spending relates to
outstanding 2012/13 commitments in respect of public participation events, the building revamping
projects, as well as costs relating to the SAP implementing agent. Once-off costs continued into 2014/15,
including the revived Legislature complex feasibility study, a portion of the funding allocated for the
improved Hansard production project, etc. Even though the allocated funds were not spent on these two
projects, they were utilised to absorb in-year spending pressures, accounting for the decrease from
2014/15 to the 2015/16 Main Appropriation. The 2015/16 Adjusted Appropriation includes unspent
operational and Members’ remuneration funding from 2014/15 that was allocated back to cater for in-year
spending pressures, such as outstanding commitments from 2014/15 relating to the building revamping
projects and SAP costs, higher than budgeted risk management costs, continued support and training
relating to SAP and GRAP reporting requirements, etc. The increase over the MTEF comprises additional
funding resulting from the zero-based budget exercise to fund escalating costs relating to operating
payments, property payments, travel and subsistence, etc. The growth from 2016/17 to 2017/18 is fairly
low, because the 2016/17 allocation includes once-off provision for hosting a CPA conference in KZN.
The category Transfers and subsidies increases steadily over the seven-year period, as follows:
Provinces and municipalities caters for the payment of motor vehicle licences.
The 2012/13 amount reflected against Departmental agencies and accounts relates to a transfer to
SARS in respect of overdue PAYE dating back to prior years. When the Legislature moved from the
VIP system to PERSAL in 2003, the balance in the old SARS account was inadvertently not cleared.
Foreign governments and international organisations caters mainly for subscription fees and
conference attendance costs in respect of the CPA. The high spending in 2012/13 and 2013/14 relates
Page 14
Estimates of Provincial Revenue and Expenditure
62
to higher than budgeted attendance costs in respect of CPA conferences. The MTEF amounts are
based on the actual fees paid in 2015/16.
Public corporations and private enterprises caters for insurance claims for motor vehicle accidents
relating to the Legislature’s official vehicles. No accident claims were received in prior years.
Non-profit institutions, which comprises constituency, secretarial and research allowances, as well as
the PPF, shows a steady increase over the seven years, despite the PPF being capped at R30 million,
at this stage, as mentioned previously. The 2014/15 amount includes the once-off R2.998 million
relating to prior year interest earned on the PPF. The MTEF allocations include some additional
funding allocated for the secretarial and research allowances resulting from the zero-based budget
exercise, mainly to provide for support staff, including researchers, as mentioned.
Households caters for donations made as part of the Speaker’s Social Responsibility programme, as
well as staff exit costs, both of which are difficult to predict.
Buildings and other fixed structures, which relates to capital building revamping projects, fluctuates
depending on the nature of the work required – i.e. whether the work is classified as current maintenance
and repairs, rather than capital renovations. The prior year amounts, including the peak in 2013/14, are
largely made up of the costs of the Tatham Art Gallery parking for Members and renovations to the
Speaker’s office. The increase in the 2015/16 Adjusted Appropriation includes a once-off provision for the
renovation of the Law Society building, accounting for the reduction from 2015/16 to 2016/17. Although
the building revamping projects are continuing over the MTEF, the extent and nature of the work to be
done are still under review. As such, the bulk of the funding is reflected as current infrastructure under
Goods and services.
Machinery and equipment shows a fluctuating trend over the seven-year period due to several once-off
costs. The significantly high 2012/13 spending can be ascribed to the purchase and installation of SAP, as
well as the payment for generators that were procured in 2011/12 but not paid for by year-end. The high
2013/14 amount includes provision for outstanding SAP commitments, while the fairly high 2014/15
amount includes the purchase of tools of trade for all new Members following the 2014 general elections.
The 2015/16 Main Appropriation is high as it includes the additional funding for IT infrastructure,
accounting for the decrease from 2015/16 to 2016/17. The 2016/17 allocation includes provision for the
replacement of a lift in the Legislature building, accounting for the fairly low growth from 2016/17 to
2017/18, whereafter the growth continues at a lower level. The MTEF allocations provide for the purchase
of furniture, vehicles and computers for staff and Members.
Software and other intangible assets fluctuates in the prior years, largely due to the roll-out of the various
SAP modules, which went live in 2013/14 (hence the high spending in prior years). The decreasing trend
from 2013/14 to 2015/16 relates to the fact that the SAP roll-out will be in its final stages.
There was expenditure of R813 000 in respect of Payments for financial assets in 2014/15, largely relating
to the write-off of previous years’ debt, some dating back as far as 2002.
5.4 Summary of conditional grant payments and estimates – Nil
5.5 Summary of infrastructure payments and estimates
Table 2.5 below provides a summary of infrastructure payments and estimates, reflecting the cost of
renovations and repairs to the Legislature buildings over the seven-year period, based on input received
from DOPW. Further infrastructure details are given in Annexure – Vote 2: Provincial Legislature.
Infrastructure spending fluctuates markedly over the seven years, as it is dependent on the nature of the
work required to be done to the Legislature buildings. As mentioned, the MTEF infrastructure allocations
are preliminary at this stage. Maintenance and repair: Current spending in the prior year relates mainly to
routine office repairs, including projects such as partitioning in the Administration building to
accommodate new staff, etc. From 2013/14 onward, the building revamping projects are included under
both Upgrades and additions: Capital and Maintenance and repair: Current.
Page 15
Vote 2: Provincial Legislature
63
Maintenance and repair: Current in 2013/14 includes current repairs undertaken to the Speaker’s cottage
and offices of the Deputy Speaker, as well as the revamping of the toilets in the main chamber area. The
MTEF allocations provide for, among others, lift maintenance, day-to-day maintenance, as well as the
painting of the Legislature buildings.
The prior year spending in respect of Upgrades and additions: Capital includes renovations undertaken to
the Speaker’s cottage and costs relating to the Tatham Art Gallery parking for Members. This project was
completed by the end of December 2012, but the Legislature is dependent on DOPW for the submission of
invoices and supporting documentation. The total cost of the parking project was approximately
R6 million, and the bulk was paid in 2013/14, with an outstanding balance paid in 2014/15. The increase
in the 2015/16 Adjusted Appropriation includes a once-off provision for the renovation of the Law Society
building, accounting for the reduction from 2015/16 to 2016/17. The MTEF allocations provide for
continued revamping of the Legislature buildings.
5.6 Summary of Public Private Partnerships – Nil
5.7 Transfers to public entities listed in terms of Schedule 3 of the PFMA – Nil
5.8 Transfers to other entities
Table 2.6 reflects spending on Transfers to other entities from 2012/13 to 2018/19. Note that these were
inadvertently not reported on as other entities in prior year EPRE documents.
Payments are made to the CPA mainly for subscription fees and attendance costs relating to CPA
conferences. The high spending in 2012/13 and 2013/14 comprises higher than budgeted travel and
subsistence costs in respect of CPA conferences. The MTEF amounts are based on the estimated fees to be
paid in 2015/16. Although the Legislature was allocated an additional R4.500 million in 2016/17 to host a
CPA conference in KZN, this amount will not be transferred to the CPA, but will be utilised from the
administrative costs of hosting the conference, and therefore is reflected against Goods and services.
The Legislature transfers funds annually to the PPF, in terms of the KZN Funding of Political Parties’ Act.
As mentioned, the annual transfer was capped at its 2010/11 level of R30 million from 2011/12 onward, in
line with a Cabinet resolution, although this is once again under discussion. The 2014/15 amount includes
the once-off R2.998 million relating to prior years’ interest earned on the PPF, as explained previously.
Table 2.5 : Summary of infrastructure payments and estimates by category
Audited OutcomeMain
Appropriation
Adjusted
Appropriation
Revised
EstimateMedium-term Estimates
R thousand 2012/13 2013/14 2014/15 2016/17 2017/18 2018/19
Existing infrastructure assets 4 796 11 338 8 587 4 900 6 400 6 400 4 490 5 110 4 995
Maintenance and repair: Current 1 943 7 157 6 532 4 050 4 050 4 050 4 095 4 170 4 000
Upgrades and additions: Capital 2 853 4 181 2 055 850 2 350 2 350 395 940 995
Refurbishment and rehabilitation: Capital - - - - - - - - -
New infrastructure assets: Capital - - - - - - - - -
Infrastructure transfers - - - - - - - - -
Infrastructure transfers: Current - - - - - - - - -
Infrastructure transfers: Capital - - - - - - - - -
Infrastructure: Payments for financial assets - - - - - - - - -
Infrastructure: Leases - - - - - - - - -
Total 4 796 11 338 8 587 4 900 6 400 6 400 4 490 5 110 4 995
Capital infrastructure 2 853 4 181 2 055 850 2 350 2 350 395 940 995
Current infrastructure 1 943 7 157 6 532 4 050 4 050 4 050 4 095 4 170 4 000
2015/16
Table 2.6 : Summary of transfers to other entities
Audited OutcomeMain
Appropriation
Adjusted
Appropriation
Revised
EstimateMedium-term Estimates
R thousand Sub-programme 2012/13 2013/14 2014/15 2016/17 2017/18 2018/19
Commonwealth Parliamentary Association 1.2. Office of the Secretary 233 221 141 207 207 207 217 228 241
Political Parties' Fund 2.5. Members' Facilities 30 000 30 000 32 998 30 000 30 000 30 000 30 000 30 000 30 000
Total 30 233 30 221 33 139 30 207 30 207 30 207 30 217 30 228 30 241
2015/16
Page 16
Estimates of Provincial Revenue and Expenditure
64
5.9 Transfers to local government – Nil
The Legislature makes no transfer payments to local government. Although the payment of motor vehicle
licences falls under Transfers and subsidies to: Provinces and municipalities, these funds will not be
transferred to any municipality, and hence the table reflecting transfers to local government is excluded.
5.10 Transfers and subsidies
Table 2.7 reflects spending on Transfers and subsidies by programme and main category. The category as
a whole shows a steady increase from 2012/13 to 2018/19, details of which are provided below the table.
The category Transfers and subsidies under Programme 1 includes the following:
Provinces and municipalities caters for the payment of motor vehicle licences, as mentioned above.
The 2012/13 amount against Departmental agencies and accounts relates to a transfer to SARS for
overdue PAYE dating back to prior years, as explained earlier.
Foreign governments and international organisations caters mainly for CPA subscription fees and
conference costs, as mentioned.
The amounts against Public corporations and private enterprises cater for insurance claims for motor
vehicle accidents relating to the Legislature’s official vehicles.
Households caters for donations made as part of the Speaker’s Social Responsibility programme, as
well as staff exits, both of which are difficult to predict, accounting for the fluctuations.
The category Transfers and subsidies under Programme 2 comprises Non-profit institutions, which
includes the constituency, secretarial and research allowances, as well as the PPF, shows a steady increase,
despite the capping of the PPF at R30 million, as mentioned. The 2014/15 amount includes the once-off
R2.998 million relating to prior years’ interest earned on the PPF. The MTEF allocations include some
additional funding allocated for the secretarial and research allowances resulting from the zero-based
budget exercise, mainly to increase the allowances provided to support staff, including researchers, as
mentioned above.
6. Programme description
The uniform budget and programme structure for all Provincial Legislatures consists of two programmes,
namely Programme 1: Administration and Programme 2: Parliamentary Business. The payments and
budgeted estimates for these two programmes are summarised in terms of economic classification below,
details of which are given in Annexure – Vote 2: Provincial Legislature.
Table 2.7 : Summary of transfers and subsidies by programme and main category
R thousand 2012/13 2013/14 2014/15 2016/17 2017/18 2018/19
1. Administration 743 237 161 592 592 592 1 149 1 206 1 275
Provinces and municipalities 10 16 20 36 36 36 38 40 42
Motor vehicle licences 10 16 20 36 36 36 38 40 42
Departmental agencies and accounts 276 - - - - - - - -
Transfer to SARS 276 - - - - - - - -
Foreign government and international organisations 233 221 141 207 207 207 217 228 241
Commonwealth Parliamentary Association 233 221 141 207 207 207 217 228 241
Public corporations and private enterprises - - - 26 26 26 27 28 30
Insurance companies - - - 26 26 26 27 28 30
Households 224 - - 323 323 323 867 910 962
Social benefits 63 - - - - - - - -
Other transfers to households 161 - - 323 323 323 867 910 962
2. Parliamentary Business 77 456 82 199 84 240 86 780 86 780 86 780 95 948 100 782 106 627
Non-profit institutions 77 456 82 199 84 240 86 780 86 780 86 780 95 948 100 782 106 627
Funding for political parties (e.g. const. allow.) 47 456 52 199 51 242 56 780 56 780 56 780 65 948 70 782 76 627
Political Parties' Fund 30 000 30 000 32 998 30 000 30 000 30 000 30 000 30 000 30 000
Total 78 199 82 436 84 401 87 372 87 372 87 372 97 097 101 988 107 902
Medium-term Estimates
2015/16
Audited Outcome Main
Appropriation
Adjusted
Appropriation
Revised
Estimate
Page 17
Vote 2: Provincial Legislature
65
6.1 Programme 1: Administration
Programme 1 consists of four sub-programmes, as follows:
Office of the Speaker provides political and administrative leadership to the Legislature, and ensures
the provision of protocol services to Members. This sub-programme caters for the running costs of
the Office of the Speaker, as well as the Speaker’s Responsibility programme.
Office of the Secretary co-ordinates planning, performance monitoring, evaluation and reporting, and
ensures effectiveness of internal control, risk management and governance processes.
Financial Management aims to provide efficient and effective financial management, and includes the
CFO’s office, financial management services, as well as SCM services. The main purpose is to plan
the departmental budget, as well as to monitor and evaluate expenditure and revenue collection. In
addition, various costs relating to the vote as a whole are centralised under this sub-programme, such
as cell-phone, land-line and all current maintenance costs.
Corporate Services renders corporate services through ICT, communication, human resources
management and institutional support (i.e. library services, fleet services, security services, etc).
Capital building renovation costs and other major procurement costs are centralised under this sub-
programme, accounting for the size of the budget, as well as the fluctuations in trends.
Tables 2.8 and 2.9 below summarise payments and estimates for Programme 1 for the financial years
2012/13 to 2018/19. It is mentioned that various costs relating to the vote as a whole, including current
maintenance costs, are centralised under the Financial Management sub-programme, while the Corporate
Services sub-programme caters for capital and other major procurement projects. This means that some
projects, such as SAP, are catered for under both sub-programmes. Many of these projects have largely
once-off costs, accounting for the fluctuating trend from 2012/13 to the 2015/16 Adjusted Appropriation.
Table 2.8 : Summary of payments and estimates by sub-programme: Administration
Audited OutcomeMain
Appropriation
Adjusted
Appropriation
Revised
EstimateMedium-term Estimates
R thousand 2012/13 2013/14 2014/15 2016/17 2017/18 2018/19
1. Office of the Speaker 29 855 28 707 23 682 22 867 24 092 24 092 27 735 29 485 31 195
2. Office of the Secretary 13 437 16 530 18 780 17 298 22 724 22 724 23 808 20 869 22 079
3. Financial Management 52 260 54 176 57 177 50 483 47 955 47 955 56 465 57 032 60 339
4. Corporate Services 52 951 69 273 68 135 52 068 70 758 70 758 63 157 67 604 70 548
Total 148 503 168 686 167 774 142 716 165 529 165 529 171 165 174 990 184 161
2015/16
Table 2.9 : Summary of payments and estimates by economic classification: Administration
Audited OutcomeMain
Appropriation
Adjusted
Appropriation
Revised
EstimateMedium-term Estimates
R thousand 2012/13 2013/14 2014/15 2016/17 2017/18 2018/19
Current payments 123 723 151 453 157 255 132 647 153 960 153 960 161 816 166 070 174 724
Compensation of employees 64 971 84 589 82 473 74 669 86 199 86 199 94 633 99 867 104 683
Goods and services 58 645 66 864 74 782 57 978 67 761 67 761 67 183 66 203 70 041
Interest and rent on land 107 - - - - - - - -
Transfers and subsidies to: 743 237 161 592 592 592 1 149 1 206 1 275
Provinces and municipalities 10 16 20 36 36 36 38 40 42
Departmental agencies and accounts 276 - - - - - - - -
Higher education institutions - - - - - - - - -
Foreign governments and international organisations 233 221 141 207 207 207 217 228 241
Public corporations and private enterprises - - - 26 26 26 27 28 30
Non-profit institutions - - - - - - - - -
Households 224 - - 323 323 323 867 910 962
Payments for capital assets 24 037 16 996 9 545 9 477 10 977 10 977 8 200 7 714 8 162
Buildings and other fixed structures 2 853 4 181 2 055 850 2 350 2 350 395 940 995
Machinery and equipment 15 352 6 332 4 179 7 139 7 139 7 139 6 238 5 129 5 427
Heritage assets - - - - - - - - -
Specialised military assets - - - - - - - - -
Biological assets - - - - - - - - -
Land and sub-soil assets - - - - - - - - -
Software and other intangible assets 5 832 6 483 3 311 1 488 1 488 1 488 1 567 1 645 1 740
Payments for financial assets - - 813 - - - - - -
Total 148 503 168 686 167 774 142 716 165 529 165 529 171 165 174 990 184 161
2015/16
Page 18
Estimates of Provincial Revenue and Expenditure
66
The high spending in respect of the sub-programme: Office of the Speaker, particularly in 2012/13 and
2013/14, can largely be attributed to outstanding commitments from prior years relating to public
participation events, as well as the building of capacity in anticipation of the functions to be allocated to
the Office of the Speaker (as the Treasury), in line with the FMPAA. This included largely once-off costs
such as establishing systems and skills development, accounting for the dip in 2014/15 and the 2015/16
Main Appropriation. The slight increase in the 2015/16 Adjusted Appropriation relates to unspent
operational and Members’ remuneration funding from 2014/15 that was allocated back in 2015/16 to cater
for in-year spending pressures relating to the phasing in of the revised organisational structure. The MTEF
allocations reflect reasonable growth as a result of additional funding allocated in terms of the zero-based
budget exercise.
Similarly, the Office of the Secretary sub-programme increased in 2013/14 and 2014/15 to cater for
outstanding commitments from prior years, resulting in the slight decrease in the 2015/16 Main
Appropriation. The increase in the 2015/16 Adjusted Appropriation relates to unspent operational and
Members’ remuneration funding from 2014/15 allocated back to cater for in-year spending pressures
including the filling of some critical posts in terms of the revised organisational structure and higher than
budgeted risk management costs. Also contributing to the increase were savings reprioritised from the
sub-programme: Financial Management, as explained below. The MTEF allocations reflect some growth
as a result of additional funding from the zero-based budget exercise. The 2016/17 allocation includes the
once-off additional funding allocated for the CPA conference, accounting for the slight reduction from
2016/17 to 2017/18.
With regard to the Financial Management sub-programme, the slight fluctuations in the prior years relate
to the Legislature building revamping projects, while the peak in 2014/15 is largely due to the payment of
some SAP invoices relating to prior years. The service provider had to show improvement in some areas
before the Legislature would pay the invoices. These once-off commitments explain the reduction from
2014/15 to 2015/16. The slight reduction in the 2015/16 Adjusted Appropriation relates to the
reprioritisation of savings from this sub-programme, as a result of delays in the filling of certain critical
posts, as well as the non-filling of posts that are not critical. These savings were moved to the sub-
programmes: Office of the Secretary and Corporate Services to fund in-year spending pressures resulting
from the filling of critical posts. The MTEF allocations reflect reasonable growth because of additional
funding allocated in terms of the zero-based budget exercise, mainly to fund increasing property payments
(particularly increased security services costs) and operating leases, largely relating to printing and
publication costs pertaining to the Legislature’s public participation programme.
The Corporate Services sub-programme fluctuates markedly due to various once-off procurement costs.
For instance, the fluctuations in the two prior years can largely be ascribed to the purchase and roll-out of
SAP. The 2014/15 amount is far higher than the 2015/16 Main Appropriation as it includes the purchase
of tools of trade for all new Members, following the 2014 general elections. Also included is a portion of
the once-off funding for the procurement of the new Hansard system (which was not spent on the project
itself, but was used to absorb in-year spending pressures, as mentioned above). The 2015/16 Main
Appropriation is further under-stated because of a decision taken by the Legislature not to continue
establishing the Co-operative Governance unit under Programme 2 at this stage, but rather establish an
Auxiliary Services unit under this sub-programme, which will oversee transversal activities, such as
facilities and security issues, in line with the revised organisational structure. This decision, which is
commented on further in Programme 2 below, was effected in the 2015/16 Adjusted Appropriation. Also
contributing to the increase in the Adjusted Appropriation was unspent operational and Members’
remuneration funding from 2014/15 allocated back to cater for in-year spending pressures relating to the
filling of some critical posts in terms of the revised organisational structure, as well as outstanding
2014/15 commitments in respect of building revamping projects and SAP costs. In addition, savings were
reprioritised from the sub-programme: Financial Management, as mentioned above, and there was a once-
off provision for the renovation of the Law Society building, all of which account for the reduction from
the 2015/16 Adjusted Appropriation to 2016/17. The 2016/17 allocation includes a once-off amount of
R1.500 million for the replacement of a lift in the Legislature building. The MTEF allocations reflect
reasonable growth when compared to the 2015/16 Main Appropriation, as a result of additional funding
allocated in terms of the zero-based budget exercise for various operational spending pressures.
Page 19
Vote 2: Provincial Legislature
67
Compensation of employees increased substantially in the prior years, largely due to the annual wage
agreements for the Legislature staff, the implementation of the job evaluation review results, the filling of
critical posts in terms of the revised organisational structure, as well as the annual leave encashment. The
peak in 2013/14 was due to significant once-off back-pay relating to the upgrading of posts, accounting
for the slight reduction from 2013/14 to 2014/15. This category was under-budgeted for in 2015/16, and
this was corrected in the 2015/16 Adjusted Appropriation by reprioritising savings from other areas, as
well as allocating back unspent operational and Members’ remuneration funding from 2014/15. The
2015/16 Adjusted Appropriation also includes additional funding for the above-budget 2015 wage
agreement. The MTEF allocations provide for the carry-through costs of the above-budget wage
agreement, as well as provision for the carry-through costs of critical posts that were filled in recent years,
funded through the zero-based budget exercise.
The fluctuations in Goods and services can be ascribed to the fact that once-off projects, including the
roll-out of SAP and current building revamping projects, are largely catered for under this category. The
high 2013/14 amount relates to outstanding 2012/13 commitments, including building revamping projects,
as well as the further roll-out of SAP. The 2014/15 amount includes the once-off funding for the Hansard
project and the Legislature complex feasibility study (which was not spent on the projects themselves, but
was largely used to absorb in-year spending pressures, as mentioned). This accounts for the dip from
2014/15 to 2015/16. The increase in the 2015/16 Adjusted Appropriation relates to unspent operational
and Members’ remuneration funding from 2014/15 allocated back in 2015/16 to cater for in-year spending
pressures, including higher than budgeted risk management costs and the payment of some SAP invoices
relating to prior years, accounting for the slight reduction to 2016/17. The 2016/17 allocation includes the
once-off additional funding for hosting the CPA conference in KZN. The MTEF allocations show
reasonable growth as a result of additional funding allocated in terms of the zero-based budget exercise,
largely to fund increasing property payments and operating leases.
The category Transfers and subsidies fluctuates in the prior years, as explained below:
Provinces and municipalities reflects the payment of motor vehicle licences, as mentioned.
The 2012/13 amount reflected against Departmental agencies and accounts relates to a transfer to
SARS in respect of overdue PAYE dating back to prior years, as explained earlier.
Foreign governments and international organisations caters mainly for subscription fees and
conference attendance costs in respect of the CPA, as mentioned.
Public corporations and private enterprises caters for insurance claims for motor vehicle accidents
relating to the Legislature’s official vehicles. No accident claims were received in prior years.
Households caters for donations made as part of the Speaker’s Social Responsibility programme, as
well as staff exits, both of which are difficult to predict.
Buildings and other fixed structures, which relates to the Legislature building revamping projects,
fluctuates depending on the nature of the work required. The 2012/13 and 2013/14 amounts are largely
made up of the costs of the Tatham Art Gallery parking for Members and renovations to the Speaker’s
office. The fairly high 2014/15 amount includes carry-through costs of some prior year projects. The
2015/16 Adjusted Appropriation includes a once-off provision for the renovation of the Law Society
building, as mentioned previously. Although the building revamping projects are continuing over the
MTEF, the extent and nature of the work to be done is still under review. As such, the bulk of the funding
is reflected as current infrastructure under Goods and services at this stage.
Machinery and equipment shows a fluctuating trend from 2012/13 to 2016/17 due to several once-off
purchases. The high 2012/13 spending can be ascribed to the purchase and installation of SAP, as well as
the payment for generators that were procured in 2011/12 but not paid for by year-end. The high 2013/14
amount includes provision for outstanding SAP commitments, while the fairly high 2014/15 amount
provides for the purchase of tools of trade for all new Members following the 2014 general elections.
These once-off amounts account for the fluctuations from 2012/13 to 2014/15. Similarly, the 2015/16
Main Appropriation is high as it includes the additional funding for IT infrastructure, accounting for the
decrease from 2015/16 to 2016/17. The 2016/17 allocation includes the once-off provision for the
Page 20
Estimates of Provincial Revenue and Expenditure
68
replacement of a lift in the Legislature building. The MTEF allocations provide for the purchase of
furniture, vehicles and computers for staff and Members.
Software and other intangible assets fluctuates in the prior years, largely due to the roll-out of the various
SAP modules, which went live in 2013/14 (hence the high expenditure in the prior years). There is
marginal growth over the MTEF, to cater for ongoing SAP costs.
There was expenditure of R813 000 in respect of Payments for financial assets in 2014/15, largely relating
to the write-off of previous years’ debt, some dating back as far as 2002.
Service delivery measures – Programme 1: Administration
Table 2.10 illustrates the main service delivery measures pertaining to Programme 1. It is noted that the
Legislature sector has not yet agreed on standardised service delivery measures. It is further noted that the
Legislature has streamlined Programme 1’s service delivery measures compared to prior years, and has
introduced two new ones, indicated by “New” in the table.
Table 2.10 : Service delivery measures – Programme 1: Administration
Outputs Performance indicators Estimated
performance Medium-term targets
2015/16 2016/17 2017/18 2018/19
1. Improved performance monitoring and reporting
No. of performance reports against Annual Oversight Plans (AOP) and APP targets
9 5 5 5
2. Achieved clean audit by 2016/17 Quarterly review reports on key controls, audits and risk issues
4 4 4 4
3. Developed and implemented transformation plan/policy
No. of reports on the development and implementation of the transformation plan/policy
4 4 4 4
4. Improved ICT management No. of reports on the review and implementation of
the ICT plan
New 4 4 4
5. Improved human resources management and development
No. of reports on development and implementation of the HR plan
New 4 4 4
6. Improved control environment and attainment of clean audit in respect of SCM
No. of reports on the development and implementation of the SCM strategy
New 4 4 4
6.2 Programme 2: Parliamentary Business
This programme consists of six sub-programmes, conforming to the customised budget structure for the
sector. The main objectives and services of these sub-programmes are as follows:
Law-making: To pass effective and relevant laws in the province. This sub-programme also
incorporates the functions of House Proceedings and Hansard.
NCOP: To facilitate NCOP liaison services.
Oversight: To execute and conduct effective oversight of the Executive Committees, and to provide
research and legal services.
Public Participation: To address complaints through the petitions’ system, and to create awareness of
legislative processes through public education and the promotion of public involvement. This sub-
programme combines both staff and sectoral public participation costs.
Members’ Facilities: To provide benefits and facilities in respect of Members and to offer support to
political parties. This sub-programme makes provision for the constituency and secretarial
allowances, as well as the PPF.
Co-operative Governance: To strengthen inter-parliamentary relations.
Tables 2.11 and 2.12 below summarise payments and estimates for Programme 2 for the period 2012/13
and 2018/19. As mentioned under Programme 1 above, a decision was taken by the Legislature in 2015/16
not to establish the Co-operative Governance unit at this stage, but rather establish an Auxiliary Services
Page 21
Vote 2: Provincial Legislature
69
unit under the sub-programme: Corporate Services in Programme 1, to oversee transversal activities, such
as facilities and security issues, in line with the revised organisational structure. This decision was taken in
view of the fact that the Co-operative Governance unit has not been established after three years, partly
because many of the associated governance functions are currently being undertaken by the Office of the
Secretary. This decision was implemented in the 2015/16 Adjusted Appropriation, accounting for an
amount still being reflected in the 2015/16 Main Appropriation. Prior and ensuing years were adjusted for
comparative purposes. As a result of this decision, the Legislature will no longer be using the sub-
programme: Co-operative Governance in terms of the budget structure for the Legislature sector.
Programme 2 shows a generally steady growth over the seven-year period. This programme includes
substantial funding for public participation events, overseas study tours undertaken by portfolio
committees, as well as support for political parties in the form of constituency and secretarial allowances
and the PPF. It is noted, too, that the implementation of the sector oversight model impacts mainly on this
programme, particularly the sub-programmes: Oversight and Members’ Facilities.
The sub-programme: Law-making shows steady growth in the prior years. The high 2013/14 amount
includes provision for outstanding 2012/13 public participation commitments. The 2014/15 amount
includes a portion of the once-off funding for the improved Hansard production project, which was not
spent on the system itself, but was utilised to absorb in-year spending pressures, including the Legacy
project. This project related to the compilation of an end-of-term handover project, entitled Twenty Years
of Democracy: A Legacy Report, with the focus on ensuring a smooth transition between the fourth and
fifth Legislatures. This accounts for the dip from 2014/15 to 2015/16. The high Adjusted Appropriation
relates to savings identified in the sub-programmes: Oversight and Public Participation because of delays
Table 2.11 : Summary of payments and estimates by sub-programme: Parliamentary Business
Audited OutcomeMain
Appropriation
Adjusted
Appropriation
Revised
EstimateMedium-term Estimates
R thousand 2012/13 2013/14 2014/15 2016/17 2017/18 2018/19
1. Law-making 25 881 37 956 41 535 35 609 40 407 40 407 45 063 47 841 50 616
2. NCOP 1 058 275 692 1 962 1 962 1 962 2 066 2 170 2 296
3. Oversight 51 250 61 383 59 081 66 757 67 277 67 277 78 132 83 630 88 480
4. Public Participation 30 182 29 890 30 097 33 994 32 494 32 494 33 648 33 513 35 457
5. Members' Facilities 107 684 91 644 94 754 97 272 97 272 97 272 110 788 116 364 123 115
6. Co-operative Governance - - - 4 863 - - - - -
Total 216 055 221 148 226 159 240 457 239 412 239 412 269 697 283 518 299 964
2015/16
Table 2.12 : Summary of payments and estimates by economic classification: Parliamentary Business
Audited OutcomeMain
Appropriation
Adjusted
Appropriation
Revised
EstimateMedium-term Estimates
R thousand 2012/13 2013/14 2014/15 2016/17 2017/18 2018/19
Current payments 138 599 138 949 141 919 153 677 152 632 152 632 173 749 182 736 193 337
Compensation of employees 65 161 68 426 78 060 78 600 77 528 77 528 90 994 96 055 101 626
Goods and services 73 438 70 523 63 859 75 077 75 104 75 104 82 755 86 681 91 711
Interest and rent on land - - - - - - - - -
Transfers and subsidies to: 77 456 82 199 84 240 86 780 86 780 86 780 95 948 100 782 106 627
Provinces and municipalities - - - - - - - - -
Departmental agencies and accounts - - - - - - - - -
Higher education institutions - - - - - - - - -
Foreign governments and international organisations - - - - - - - - -
Public corporations and private enterprises - - - - - - - - -
Non-profit institutions 77 456 82 199 84 240 86 780 86 780 86 780 95 948 100 782 106 627
Households - - - - - - - - -
Payments for capital assets - - - - - - - - -
Buildings and other fixed structures - - - - - - - - -
Machinery and equipment - - - - - - - - -
Heritage assets - - - - - - - - -
Specialised military assets - - - - - - - - -
Biological assets - - - - - - - - -
Land and sub-soil assets - - - - - - - - -
Software and other intangible assets - - - - - - - - -
Payments for financial assets - - - - - - - - -
Total 216 055 221 148 226 159 240 457 239 412 239 412 269 697 283 518 299 964
2015/16
Page 22
Estimates of Provincial Revenue and Expenditure
70
in the filling of certain critical posts, as well as the non-filling of posts considered not critical. These
savings were moved to the Law-making sub-programme to fund in-year spending pressures as a result of
the filling of critical posts in terms of the revised organisational structure, including carry-through costs of
posts filled from 2014/15. The growth is continued over the 2016/17 MTEF as a result of additional
funding from the zero-based budget exercise.
The NCOP sub-programme shows a generally steady increase. The low amounts in 2013/14 and 2014/15
relate to the fact that there were fewer NCOP activities in those years, in view of the build-up to the 2014
general elections.
The sub-programme: Oversight reflects significant increases, in line with the implementation of the sector
oversight model. Also contributing to the high spending, particularly in 2013/14, was the payment of
outstanding public participation commitments, including outstanding travel claims. This sub-programme
increases substantially from 2015/16 onward to provide for the continued roll-out of the sector oversight
model. The slight increase in the 2015/16 Adjusted Appropriation relates to additional funding for the
above-budget 2015 wage agreement for Legislature staff, offset by enforced savings reprioritised to the
Law-making sub-programme. The growth over the MTEF relates to additional funding from the zero-
based budget exercise.
With regard to the sub-programme: Public Participation, which combines both staff and sectoral public
participation costs, there is a generally steady increase over the seven years. The 2012/13 amount is fairly
high, as it includes payment of outstanding public participation commitments relating to prior years. The
minor fluctuations over the period relate to enforced savings to offset in-year pressures in other areas, such
as Law-making.
The Members’ Facilities sub-programme includes provision for the constituency, secretarial and research
allowances, as well as the PPF, which is capped at R30 million at this stage, as mentioned previously. The
2012/13 amount is high because it includes payment of outstanding travel claims and prior year
commitments in respect of public participation events, accounting for the reduction in 2013/14. The
2014/15 amount includes the once-off R2.998 million relating to prior years’ interest earned on the PPF.
The healthy growth over the MTEF caters for public participation events and the continued
implementation of the sector oversight model. Also, in terms of the zero-based budget exercise, additional
funding was allocated for the secretarial and research allowances, including provision for support staff,
such as researchers, which are contract based, and are not on the Legislature’s organisational structure.
The additional amount was allocated to bring these allowances in line with the guidelines from National
Parliament, including provision for an annual wage adjustment in respect of these support staff. The
MTEF allocations also provide for increased travel and subsistence costs for the various portfolio
committees funded from the zero-based budget exercise.
The Co-operative Governance sub-programme has been commented on above.
Compensation of employees shows reasonable growth over the seven-year period as a result of the annual
wage adjustments for the Legislature staff. The Legislature commenced implementing the sector oversight
model in 2012/13, as explained above, accounting for the increases (as well as the slight fluctuations
relating to the upgrading of posts and resultant backpay) from that year to 2015/16. The MTEF allocations
include provision for the carry-through of posts filled from 2014/15 without adequate budget in respect of
the sector oversight model, funded from the zero-based budget exercise.
The fluctuations in Goods and services can be ascribed to the previously mentioned once-off spending in
prior years. For instance, 2012/13 is fairly high, as it includes payment of outstanding travel claims and
prior year commitments in respect of public participation events, accounting for the reduction from
2012/13 to 2013/14. The further reduction in 2014/15 relates to enforced savings identified under
Programme 2 to offset Programme 1’s projected over-expenditure, in line with the cost-containment plan.
The MTEF allocations include some additional funding resulting from the zero-based budget exercise,
largely to provide for increased travel and subsistence costs for the various portfolio committees.
Transfers and subsidies to: Non-profit institutions comprises the constituency, secretarial and research
allowances payable to political parties, as well as the PPF. The category shows a steady increase over the
Page 23
Vote 2: Provincial Legislature
71
seven years, despite the capping of the PPF at R30 million at this stage. The 2014/15 amount includes the
once-off increase of R2.998 million, relating to interest earned on the PPF which was formally
appropriated back to the Legislature for increasing the 2014/15 transfer to the PPF. The MTEF allocations
include some additional funding for the secretarial and research allowances resulting from the zero-based
budget exercise, mainly to provide for support staff, including researchers, as mentioned above.
Service delivery measures – Programme 2: Parliamentary Business
Table 2.13 below illustrates the main service delivery measures relating to Programme 2. The Legislature
sector has not yet agreed on standardised service delivery measures. It is noted that the Legislature has
introduced two new service delivery measures, indicated by “New” in the table.
Table 2.13: Service delivery measures – Programme 2: Parliamentary Business
Outputs Performance indicators Estimated
performance Medium term targets
2015/16 2016/17 2017/18 2018/19
1. Increased level of awareness and knowledge of the Legislature and its core business
No. of public education campaigns/workshops
20 20 20 20
2. Enhanced oversight, law-making and accountability
No. of sittings facilitated 26 26 26 26
3. Improved oversight over departmental planning No. of final draft AOPs submitted New 18 18 18
No. of progress reports and development of a provincial service delivery baseline
4 4 4 4
4. Improved input into the departmental APPs and budgets
No. of reports on the consideration of 2017/18 draft APPs and budgets tabled at committee meetings
16 15 15 15
5. Improved oversight over departmental performance against their APPs and budgets
No. of analysis reports on quarterly and annual reports
5 per Committee
5 per Committee
5 per Committee
5 per Committee
6. Improved tracking of resolutions Quarterly reports on resolutions 4 4 4 4
7. Improved oversight over financial management and performance of depts. and public entities
No. of reports on Finance Committee hearings conducted
3 3 3 3
8. Improved oversight over depts. and public entities i.r.o. attainment of clean audit reports
No. of SCOPA hearings conducted 2 2 2 2
9. Enhanced oversight through focused intervention studies and oversight visits
No. of focused intervention studies conducted
8 9 16 16
No. of oversight visits conducted 48 64 64 64
10. Empowered committees to perform oversight No. of study tours 5 5 5 5
11. Improved processing of legislation before committees
No. of reports on Bills processed New 4 4 4
7. Other programme information
7.1 Personnel numbers and costs
Tables 2.14 and 2.15 reflect personnel information pertaining to the Legislature. Note that the tables
include information relating to the Legislature staff only, and not the Members of the Legislature.
It is noted that the KZN Legislature’s salary structure is very different to the Public Service. For the most
part, the KZN Legislature’s salary levels are higher than Public Service counterparts. This position is
exacerbated by the fact that, in recent years (apart from 2015/16), the annual wage adjustments for the
administrative staff have been higher than the Public Service wage agreements. This issue of the
increasing wage gap was raised as a concern by STACOV at a meeting held in August 2014, and
negotiations are underway with the unions in this regard. However, prior year above-budget wage
increases continue to have carry-through costs. Also, on occasions when the KZN Legislature received
additional funding from Provincial Treasury to provide for the above-budget wage agreement, the
additional funding was based on the lower Public Service increase.
Page 24
Estimates of Provincial Revenue and Expenditure
72
The personnel numbers from 2012/13 onward include the implementation of the job evaluation review
results, as well as the filling of critical posts in terms of the revised organisational structure, including the
sector oversight model.The following points are noted:
The high personnel numbers in 2012/13 continuing into 2013/14 relate to the employment of interns
during that year, and this accounts for the similar increase in contract worker numbers.
The “Contract workers” shown in Table 2.15 include interns (in the prior years), Members’ drivers,
as well as two SAP specialists, etc. Note that this category excludes contract positions such as
management positions, as well as staff in the office of the Speaker and in the Office of the Whipery.
It is envisaged that a further 26 critical posts in terms of the revised organisational structure will be
filled over the MTEF, once the productivity and work system investigations have been undertaken.
These are not reflected in the tables at this stage. The required budget adjustments and reprioritisation
will be made in-year to fund these critical posts, taking into account the Legislature’s cost-
containment plan, as well as the budget cuts facing the province as a whole.
7.2 Training
Tables 2.16 and 2.17 give a summary of the Legislature’s spending and information on training for the
period 2012/13 to 2018/19. All training for the Legislature is centralised under Programme 1. Both tables
illustrate the number of staff and Members affected by the various training programmes and initiatives,
and this accounts for the number of both staff reflected in Table 2.17 being higher than the personnel
Table 2.14 : Personnel numbers and costs by programme
Personnel numbersAs at
31 March 2013
As at
31 March 2014
As at
31 March 2015
As at
31 March 2016
As at
31 March 2017
As at
31 March 2018
As at
31 March 2019
1. Administration 130 113 115 116 116 116 116
2. Parliamentary Business 104 107 108 109 109 109 109
Total 234 220 223 225 225 225 225
Total provincial personnel cost (R thousand) 130 132 153 015 160 533 163 727 185 627 195 922 206 309
Unit cost (R thousand) 556 696 720 728 825 871 917
Table 2.15 : Summary of personnel numbers and costs by component
Audited OutcomeMain
Appropriation
Adjusted
Appropriation
Revised
EstimateMedium-term Estimates
2012/13 2013/14 2014/15 2016/17 2017/18 2018/19
Total for the department
Personnel numbers (head count) 234 220 223 225 225 225 225 225 225
Personnel cost (R thousands) 130 132 153 015 160 533 153 269 163 727 163 727 185 627 195 922 206 309
Human resources component
Personnel numbers (head count) 8 7 10 9 9 9 10 10 10
Personnel cost (R thousands) 4 554 5 355 5 618 5 730 5 730 5 730 6 497 6 857 7 220
Head count as % of total for department 3.42 3.18 4.48 4.00 4.00 4.00 4.44 4.44 4.44
Personnel cost as % of total for department 3.50 3.50 3.50 3.74 3.50 3.50 3.50 3.50 3.50
Finance component
Personnel numbers (head count) 23 23 24 17 17 17 18 18 18
Personnel cost (R thousands) 12 752 14 995 15 732 16 045 16 045 16 045 18 191 19 200 20 218
Head count as % of total for department 9.83 10.45 10.76 7.56 7.56 7.56 8.00 8.00 8.00
Personnel cost as % of total for department 9.80 9.80 9.80 10.47 9.80 9.80 9.80 9.80 9.80
Full time workers
Personnel numbers (head count) 200 200 210 212 212 212 212 212 212
Personnel cost (R thousands) 123 625 145 364 155 506 147 606 157 541 157 541 178 346 188 126 197 994
Head count as % of total for department 85.47 90.91 94.17 94.22 94.22 94.22 94.22 94.22 94.22
Personnel cost as % of total for department 95.00 95.00 96.87 96.30 96.22 96.22 96.08 96.02 95.97
Part-time workers
Personnel numbers (head count) - - - - - - - - -
Personnel cost (R thousands) - - - - - - - - -
Head count as % of total for department - - - - - - - - -
Personnel cost as % of total for department - - - - - - - - -
Contract workers
Personnel numbers (head count) 34 20 13 13 13 13 13 13 13
Personnel cost (R thousands) 6 507 7 651 5 027 5 663 6 186 6 186 7 281 7 796 8 315
Head count as % of total for department 14.53 9.09 5.83 5.78 5.78 5.78 5.78 5.78 5.78
Personnel cost as % of total for department 5.00 5.00 3.13 3.70 3.78 3.78 3.92 3.98 4.03
2015/16
Page 25
Vote 2: Provincial Legislature
73
numbers reflected in Section 7.1 above. Table 2.17 also includes a gender breakdown, the types of
training, and details of the number of bursaries and learnerships.
The Skills Development Act is not applicable to provincial legislatures. The amounts reflected relate to
specific training courses that will assist in capacitating the various components of the Legislature. The
high 2013/14 amount relates to the training that was conducted to ensure the smooth implementation of
SAP and the sector oversight model. The 2015/16 amount includes provision for the ongoing training of
new Members following the 2014 general elections. The MTEF allocations provide for ongoing SAP
training to both staff and Members, as well as training on the implementation of the FMPAA.
Table 2.16 : Payments on training by programme
Audited OutcomeMain
Appropriation
Adjusted
Appropriation
Revised
EstimateMedium-term Estimates
R thousand 2012/13 2013/14 2014/15 2016/17 2017/18 2018/19
1. Administration 3 576 4 484 3 654 5 084 5 084 5 084 4 184 5 454 5 770
Travel and subsistence 967 857 1 125 1 170 1 170 1 170 1 232 1 294 1 369
Payments on tuition 2 609 3 627 2 529 3 914 3 914 3 914 2 952 4 160 4 401
Other - - - - - - - - -
2. Parliamentary Business - - - - - - - - -
Travel and subsistence - - - - - - - - -
Payments on tuition - - - - - - - - -
Other - - - - - - - - -
Total 3 576 4 484 3 654 5 084 5 084 5 084 4 184 5 454 5 770
2015/16
Table 2.17 : Information on training: Provincial Legislature
Audited OutcomeMain
Appropriation
Adjusted
Appropriation
Revised
EstimateMedium-term Estimates
R thousand 2012/13 2013/14 2014/15 2016/17 2017/18 2018/19
Number of staff 234 289 292 294 294 294 294 294 294
Number of personnel trained 137 102 176 184 184 184 194 204 216
of which
Male 68 39 88 92 92 92 97 102 108
Female 69 63 88 92 92 92 97 102 108
Number of training opportunities 38 38 38 41 41 41 44 46 49
of which
Tertiary 12 12 13 14 14 14 15 16 17
Workshops 15 15 13 14 14 14 15 16 17
Seminars - - - - - - - - -
Other 11 11 12 13 13 13 14 15 16
Number of bursaries offered 17 20 21 22 22 22 23 24 26
Number of interns appointed - 30 - - - - - - -
Number of learnerships appointed 17 - 21 22 22 22 23 24 26
Number of days spent on training 3 306 3 3 3 3 3 3 3
2015/16
Page 27
Annexure – Vote 2: Provincial Legislature
75
ANNEXURE – VOTE 2: PROVINCIAL LEGISLATURE
Table 2.A : Details of departmental receipts: Provincial Legislature
Audited OutcomeMain
Appropriation
Adjusted
Appropriation
Revised
EstimateMedium-term Estimates
R thousand 2012/13 2013/14 2014/15 2016/17 2017/18 2018/19
Tax receipts - - - - - - - - -
Casino taxes - - - - - - - - -
Horse racing taxes - - - - - - - - -
Liquor licences - - - - - - - - -
Motor vehicle licences - - - - - - - - -
Sale of goods and services other than capital assets 73 107 69 51 51 63 54 57 60
Sale of goods and services produced by department
(excl. capital assets)- - - - - - - - -
Sales by market establishments - - - - - - - - -
Administrative fees - - - - - - - - -
Other sales - - - - - - - - -
Sale of scrap, waste, arms and other used current
goods (excl. capital assets)73 107 69 51 51 63 54 57 60
Transfers received from: - - - - - - - - -
Other governmental units - - - - - - - - -
Higher education institutions - - - - - - - - -
Foreign governments - - - - - - - - -
International organisations - - - - - - - - -
Public corporations and private enterprises - - - - - - - - -
Households and non-profit institutions - - - - - - - - -
Fines, penalties and forfeits - - - - - - - - -
Interest, dividends and rent on land 449 802 1 610 432 432 2 214 455 478 506
Interest 449 802 1 610 432 432 2 214 455 478 506
Dividends - - - - - - - - -
Rent on land - - - - - - - - -
Sale of capital assets 564 - 486 - - - - - -
Land and sub-soil assets - - - - - - - - -
Other capital assets 564 - 486 - - - - - -
Transactions in financial assets and liabilities 1 245 3 015 785 252 252 784 265 278 294
Total 2 331 3 924 2 950 735 735 3 061 774 813 860
2015/16
Page 28
Estimates of Provincial Revenue and Expenditure
76
Table 2.B : Payments and estimates by economic classification: Provincial Legislature
Audited OutcomeMain
Appropriation
Adjusted
Appropriation
Revised
EstimateMedium-term Estimates
R thousand 2012/13 2013/14 2014/15 2016/17 2017/18 2018/19
Current payments 262 322 290 402 299 174 286 324 306 592 306 592 335 565 348 806 368 061
Compensation of employees 130 132 153 015 160 533 153 269 163 727 163 727 185 627 195 922 206 309
Salaries and wages 116 522 132 552 140 817 133 021 141 726 141 726 162 664 171 798 180 786
Social contributions 13 610 20 463 19 716 20 248 22 001 22 001 22 963 24 124 25 523
Goods and services 132 083 137 387 138 641 133 055 142 865 142 865 149 938 152 884 161 752
Administrative fees 3 960 56 970 896 896 896 1 395 1 156 1 221
Advertising 6 529 8 550 6 929 9 006 9 056 9 056 8 935 9 208 9 745
Assets less than the capitalisation threshold 1 282 165 756 727 727 727 285 349 369
Audit cost: External 1 425 2 617 3 560 2 251 3 451 3 451 2 019 2 120 2 243
Bursaries: Employees 549 598 261 643 643 643 756 794 840
Catering: Departmental activities 13 431 12 316 10 669 16 513 16 563 16 563 19 146 19 604 20 743
Communication (G&S) 8 150 11 010 10 067 5 660 5 660 5 660 11 967 10 740 11 362
Computer services 3 617 7 930 2 481 1 129 2 938 2 938 3 494 3 541 3 746
Cons and prof serv: Business and advisory services 1 137 3 630 16 438 2 209 4 956 4 956 5 963 7 356 7 782
Cons and prof serv: Infrastructure and planning - - - - - - - - -
Cons and prof serv: Laboratory services - - - - - - - - -
Cons and prof serv: Scientific and technological services - - - - - - - - -
Cons and prof serv: Legal costs 27 402 387 294 294 294 290 305 323
Contractors 7 556 7 512 11 321 5 793 6 575 6 575 10 459 10 616 11 232
Agency and support / outsourced services 1 586 - - - - - - - -
Entertainment 71 60 47 270 285 285 673 714 755
Fleet services (including government motor transport) 1 666 2 110 1 536 1 709 1 709 1 709 1 558 1 635 1 730
Housing - - - - - - - - -
Inventory: Clothing material and accessories - - - - - - - - -
Inventory: Farming supplies - - - - - - - - -
Inventory: Food and food supplies 9 - - 646 646 646 187 28 30
Inventory: Fuel, oil and gas - - - - - - - - -
Inventory: Learner and teacher support material 329 269 - 400 400 400 - - -
Inventory: Materials and supplies 39 101 - 135 135 135 84 88 93
Inventory: Medical supplies - - - 5 5 5 7 7 7
Inventory: Medicine - - - - - - - - -
Medsas inventory interface - - - - - - - - -
Inventory: Other supplies 111 - - - - - - - -
Consumable supplies 541 1 226 1 500 364 369 369 1 210 1 268 1 341
Consumable: Stationery, printing and office supplies 776 1 167 1 043 948 948 948 1 169 1 239 1 311
Operating leases 5 857 7 008 8 361 4 758 4 758 4 758 6 473 6 579 6 961
Property payments 6 181 8 263 8 984 5 521 8 556 8 556 5 298 5 563 5 885
Transport provided: Departmental activity 5 996 4 570 2 335 3 430 3 430 3 430 8 743 8 763 9 271
Travel and subsistence 47 175 38 160 33 954 41 785 41 693 41 693 31 593 31 631 33 466
Training and development 2 609 3 627 2 529 3 914 3 914 3 914 2 952 4 160 4 401
Operating payments 3 295 3 845 5 766 9 835 9 979 9 979 9 464 9 945 10 522
Venues and facilities 8 179 12 195 8 747 14 214 14 279 14 279 15 818 15 475 16 373
Rental and hiring - - - - - - - - -
Interest and rent on land 107 - - - - - - - -
Interest 107 - - - - - - - -
Rent on land - - - - - - - - -
Transfers and subsidies 78 199 82 436 84 401 87 372 87 372 87 372 97 097 101 988 107 902
Provinces and municipalities 10 16 20 36 36 36 38 40 42
Provinces 10 16 20 36 36 36 38 40 42
Provincial Revenue Funds - - - - - - - - -
Provincial agencies and funds 10 16 20 36 36 36 38 40 42
Municipalities - - - - - - - - -
Municipalities - - - - - - - - -
Municipal agencies and funds - - - - - - - - -
Departmental agencies and accounts 276 - - - - - - - -
Social security funds - - - - - - - - -
Entities receiving transfers 276 - - - - - - - -
Higher education institutions - - - - - - - - -
Foreign governments and international organisations 233 221 141 207 207 207 217 228 241
Public corporations and private enterprises - - - 26 26 26 27 28 30
Public corporations - - - - - - 27 28 30
Subsidies on production - - - - - - - - -
Other transfers - - - - - - 27 28 30
Private enterprises - - - 26 26 26 - - -
Subsidies on production - - - - - - - - -
Other transfers - - - 26 26 26 - - -
Non-profit institutions 77 456 82 199 84 240 86 780 86 780 86 780 95 948 100 782 106 627
Households 224 - - 323 323 323 867 910 962
Social benefits 63 - - - - - - - -
Other transfers to households 161 - - 323 323 323 867 910 962
Payments for capital assets 24 037 16 996 9 545 9 477 10 977 10 977 8 200 7 714 8 162
Buildings and other fixed structures 2 853 4 181 2 055 850 2 350 2 350 395 940 995
Buildings - 4 181 2 055 850 2 350 2 350 395 940 995
Other fixed structures 2 853 - - - - - - - -
Machinery and equipment 15 352 6 332 4 179 7 139 7 139 7 139 6 238 5 129 5 427
Transport equipment 1 340 1 821 1 594 2 039 2 039 2 039 1 500 2 254 2 385
Other machinery and equipment 14 012 4 511 2 585 5 100 5 100 5 100 4 738 2 875 3 042
Heritage assets - - - - - - - - -
Specialised military assets - - - - - - - - -
Biological assets - - - - - - - - -
Land and sub-soil assets - - - - - - - - -
Software and other intangible assets 5 832 6 483 3 311 1 488 1 488 1 488 1 567 1 645 1 740
Payments for financial assets - - 813 - - - - - -
Total 364 558 389 834 393 933 383 173 404 941 404 941 440 862 458 508 484 125
of which:
Departmental receipts 2 331 3 924 2 950 735 735 3 061 774 813 860
Adjusted total 364 558 389 834 393 933 383 173 404 941 404 941 440 862 458 508 484 125
Members' remuneration 67 160 71 095 82 094 82 321 74 321 74 321 77 790 80 343 85 003
Adjusted total (incl. Members' remuneration) 431 718 460 929 476 027 465 494 479 262 479 262 518 652 538 851 569 128
2015/16
Page 29
Annexure – Vote 2: Provincial Legislature
77
Table 2.C : Payments and estimates by economic classification: Administration
Audited OutcomeMain
Appropriation
Adjusted
Appropriation
Revised
EstimateMedium-term Estimates
R thousand 2012/13 2013/14 2014/15 2016/17 2017/18 2018/19
Current payments 123 723 151 453 157 255 132 647 153 960 153 960 161 816 166 070 174 724
Compensation of employees 64 971 84 589 82 473 74 669 86 199 86 199 94 633 99 867 104 683
Salaries and wages 57 335 73 323 72 693 63 241 73 018 73 018 82 346 86 961 91 029
Social contributions 7 636 11 266 9 780 11 428 13 181 13 181 12 287 12 906 13 654
Goods and services 58 645 66 864 74 782 57 978 67 761 67 761 67 183 66 203 70 041
Administrative fees 3 834 51 850 855 855 855 1 131 877 926
Advertising 3 286 4 319 2 129 1 776 1 776 1 776 2 772 2 319 2 455
Assets less than the capitalisation threshold 1 282 165 756 727 727 727 279 343 363
Audit cost: External 1 425 2 617 3 560 2 251 3 451 3 451 2 019 2 120 2 243
Bursaries: Employees 219 598 261 433 433 433 346 363 384
Catering: Departmental activities 2 813 1 591 1 124 1 556 1 556 1 556 1 500 1 170 1 238
Communication (G&S) 5 786 8 688 7 610 4 766 4 766 4 766 7 310 5 851 6 190
Computer services 3 617 7 856 2 393 1 129 2 938 2 938 3 494 3 541 3 746
Cons and prof serv: Business and advisory services 344 3 124 13 366 2 010 4 757 4 757 5 842 7 228 7 646
Cons and prof serv: Infrastructure and planning - - - - - - - - -
Cons and prof serv: Laboratory services - - - - - - - - -
Cons and prof serv: Scientific and technological services - - - - - - - - -
Cons and prof serv: Legal costs - - - - - - - - -
Contractors 4 205 3 199 7 662 4 290 4 897 4 897 4 177 4 020 4 253
Agency and support / outsourced services 955 - - - - - - - -
Entertainment 64 30 47 214 214 214 335 358 379
Fleet services (including government motor transport) 1 666 2 074 1 530 1 709 1 709 1 709 1 558 1 635 1 730
Housing - - - - - - - - -
Inventory: Clothing material and accessories - - - - - - - - -
Inventory: Farming supplies - - - - - - - - -
Inventory: Food and food supplies 9 - - 646 646 646 187 28 30
Inventory: Fuel, oil and gas - - - - - - - - -
Inventory: Learner and teacher support material 329 - - - - - - - -
Inventory: Materials and supplies 34 101 - 135 135 135 82 86 91
Inventory: Medical supplies - - - 5 5 5 7 7 7
Inventory: Medicine - - - - - - - - -
Medsas inventory interface - - - - - - - - -
Inventory: Other supplies - - - - - - - - -
Consumable supplies 541 611 907 341 341 341 1 039 1 091 1 154
Consumable: Stationery, printing and office supplies 659 863 923 761 761 761 865 920 974
Operating leases 5 857 7 008 8 361 4 758 4 758 4 758 6 473 6 579 6 961
Property payments 6 181 8 162 8 969 5 521 8 556 8 556 5 288 5 553 5 875
Transport provided: Departmental activity (4) 180 - 85 85 85 344 99 105
Travel and subsistence 8 993 8 654 8 614 12 981 13 366 13 366 13 826 12 525 13 251
Training and development 2 609 3 359 2 529 3 414 3 414 3 414 2 454 3 637 3 848
Operating payments 2 742 2 473 2 884 5 215 5 215 5 215 4 514 4 801 5 079
Venues and facilities 1 199 1 141 307 2 400 2 400 2 400 1 341 1 052 1 113
Rental and hiring - - - - - - - - -
Interest and rent on land 107 - - - - - - - -
Interest 107 - - - - - - - -
Rent on land - - - - - - - - -
Transfers and subsidies 743 237 161 592 592 592 1 149 1 206 1 275
Provinces and municipalities 10 16 20 36 36 36 38 40 42
Provinces 10 16 20 36 36 36 38 40 42
Provincial Revenue Funds - - - - - - - - -
Provincial agencies and funds 10 16 20 36 36 36 38 40 42
Municipalities - - - - - - - - -
Municipalities - - - - - - - - -
Municipal agencies and funds - - - - - - - - -
Departmental agencies and accounts 276 - - - - - - - -
Social security funds - - - - - - - - -
Entities receiving transfers 276 - - - - - - - -
Higher education institutions - - - - - - - - -
Foreign governments and international organisations 233 221 141 207 207 207 217 228 241
Public corporations and private enterprises - - - 26 26 26 27 28 30
Public corporations - - - - - - 27 28 30
Subsidies on production - - - - - - - - -
Other transfers - - - - - - 27 28 30
Private enterprises - - - 26 26 26 - - -
Subsidies on production - - - - - - - - -
Other transfers - - - 26 26 26 - - -
Non-profit institutions - - - - - - - - -
Households 224 - - 323 323 323 867 910 962
Social benefits 63 - - - - - - - -
Other transfers to households 161 - - 323 323 323 867 910 962
Payments for capital assets 24 037 16 996 9 545 9 477 10 977 10 977 8 200 7 714 8 162
Buildings and other fixed structures 2 853 4 181 2 055 850 2 350 2 350 395 940 995
Buildings - 4 181 2 055 850 2 350 2 350 395 940 995
Other fixed structures 2 853 - - - - - - - -
Machinery and equipment 15 352 6 332 4 179 7 139 7 139 7 139 6 238 5 129 5 427
Transport equipment 1 340 1 821 1 594 2 039 2 039 2 039 1 500 2 254 2 385
Other machinery and equipment 14 012 4 511 2 585 5 100 5 100 5 100 4 738 2 875 3 042
Heritage assets - - - - - - - - -
Specialised military assets - - - - - - - - -
Biological assets - - - - - - - - -
Land and sub-soil assets - - - - - - - - -
Software and other intangible assets 5 832 6 483 3 311 1 488 1 488 1 488 1 567 1 645 1 740
Payments for financial assets - - 813 - - - - - -
Total 148 503 168 686 167 774 142 716 165 529 165 529 171 165 174 990 184 161
2015/16
Page 30
Estimates of Provincial Revenue and Expenditure
78
Table 2.D : Payments and estimates by economic classification: Parliamentary Business
Audited OutcomeMain
Appropriation
Adjusted
Appropriation
Revised
EstimateMedium-term Estimates
R thousand 2012/13 2013/14 2014/15 2016/17 2017/18 2018/19
Current payments 138 599 138 949 141 919 153 677 152 632 152 632 173 749 182 736 193 337
Compensation of employees 65 161 68 426 78 060 78 600 77 528 77 528 90 994 96 055 101 626
Salaries and wages 59 187 59 229 68 124 69 780 68 708 68 708 80 318 84 837 89 757
Social contributions 5 974 9 197 9 936 8 820 8 820 8 820 10 676 11 218 11 869
Goods and services 73 438 70 523 63 859 75 077 75 104 75 104 82 755 86 681 91 711
Administrative fees 126 5 120 41 41 41 264 279 295
Advertising 3 243 4 231 4 800 7 230 7 280 7 280 6 163 6 889 7 290
Assets less than the capitalisation threshold - - - - - - 6 6 6
Audit cost: External - - - - - - - - -
Bursaries: Employees 330 - - 210 210 210 410 431 456
Catering: Departmental activities 10 618 10 725 9 545 14 957 15 007 15 007 17 646 18 434 19 505
Communication (G&S) 2 364 2 322 2 457 894 894 894 4 657 4 889 5 172
Computer services - 74 88 - - - - - -
Cons and prof serv: Business and advisory services 793 506 3 072 199 199 199 121 128 136
Cons and prof serv: Infrastructure and planning - - - - - - - - -
Cons and prof serv: Laboratory services - - - - - - - - -
Cons and prof serv: Scientific and technological services - - - - - - - - -
Cons and prof serv: Legal costs 27 402 387 294 294 294 290 305 323
Contractors 3 351 4 313 3 659 1 503 1 678 1 678 6 282 6 596 6 979
Agency and support / outsourced services 631 - - - - - - - -
Entertainment 7 30 - 56 71 71 338 356 376
Fleet services (including government motor transport) - 36 6 - - - - - -
Housing - - - - - - - - -
Inventory: Clothing material and accessories - - - - - - - - -
Inventory: Farming supplies - - - - - - - - -
Inventory: Food and food supplies - - - - - - - - -
Inventory: Fuel, oil and gas - - - - - - - - -
Inventory: Learner and teacher support material - 269 - 400 400 400 - - -
Inventory: Materials and supplies 5 - - - - - 2 2 2
Inventory: Medical supplies - - - - - - - - -
Inventory: Medicine - - - - - - - - -
Medsas inventory interface - - - - - - - - -
Inventory: Other supplies 111 - - - - - - - -
Consumable supplies - 615 593 23 28 28 171 177 187
Consumable: Stationery, printing and office supplies 117 304 120 187 187 187 304 319 337
Operating leases - - - - - - - - -
Property payments - 101 15 - - - 10 10 10
Transport provided: Departmental activity 6 000 4 390 2 335 3 345 3 345 3 345 8 399 8 664 9 166
Travel and subsistence 38 182 29 506 25 340 28 804 28 327 28 327 17 767 19 106 20 215
Training and development - 268 - 500 500 500 498 523 553
Operating payments 553 1 372 2 882 4 620 4 764 4 764 4 950 5 144 5 443
Venues and facilities 6 980 11 054 8 440 11 814 11 879 11 879 14 477 14 423 15 260
Rental and hiring - - - - - - - - -
Interest and rent on land - - - - - - - - -
Interest - - - - - - - - -
Rent on land - - - - - - - - -
Transfers and subsidies 77 456 82 199 84 240 86 780 86 780 86 780 95 948 100 782 106 627
Provinces and municipalities - - - - - - - - -
Provinces - - - - - - - - -
Provincial Revenue Funds - - - - - - - - -
Provincial agencies and funds - - - - - - - - -
Municipalities - - - - - - - - -
Municipalities - - - - - - - - -
Municipal agencies and funds - - - - - - - - -
Departmental agencies and accounts - - - - - - - - -
Social security funds - - - - - - - - -
Entities receiving transfers - - - - - - - - -
Higher education institutions - - - - - - - - -
Foreign governments and international organisations - - - - - - - - -
Public corporations and private enterprises - - - - - - - - -
Public corporations - - - - - - - - -
Subsidies on production - - - - - - - - -
Other transfers - - - - - - - - -
Private enterprises - - - - - - - - -
Subsidies on production - - - - - - - - -
Other transfers - - - - - - - - -
Non-profit institutions 77 456 82 199 84 240 86 780 86 780 86 780 95 948 100 782 106 627
Households - - - - - - - - -
Social benefits - - - - - - - - -
Other transfers to households - - - - - - - - -
Payments for capital assets - - - - - - - - -
Buildings and other fixed structures - - - - - - - - -
Buildings - - - - - - - - -
Other fixed structures - - - - - - - - -
Machinery and equipment - - - - - - - - -
Transport equipment - - - - - - - - -
Other machinery and equipment - - - - - - - - -
Heritage assets - - - - - - - - -
Specialised military assets - - - - - - - - -
Biological assets - - - - - - - - -
Land and sub-soil assets - - - - - - - - -
Software and other intangible assets - - - - - - - - -
Payments for financial assets - - - - - - - - -
Total 216 055 221 148 226 159 240 457 239 412 239 412 269 697 283 518 299 964
2015/16
Page 31
Annexure – Vote 2: Provincial Legislature
79
T
able
2.E
: P
rovi
nci
al L
egis
latu
re -
Pay
men
ts o
f in
fras
tru
ctu
re b
y ca
teg
ory
Pro
ject
nam
eP
roje
ct s
tatu
sT
ype
of
infr
astr
uct
ure
Pro
ject
du
rati
on
To
tal a
vaila
ble
MT
EF
Fo
rwar
d e
stim
ates
R t
ho
usa
nd
s
Sch
oo
l - p
rim
ary/
sec
on
dar
y/
spec
ialis
ed;
adm
in b
lock
; w
ater
;
elec
tric
ity;
san
itat
ion
; et
c.
Dat
e: S
tart
Dat
e: F
inis
hM
TE
F
2016
/17
MT
EF
2017
/18
MT
EF
2018
/19
Exi
stin
g in
fras
tru
ctu
re a
sset
s-
-
4
490
5 11
0
4
995
of w
hich
:
Mai
nten
ance
and
rep
air:
Cur
rent
-
-
4 09
5
4
170
4 00
0
Rep
airs
to L
egis
latu
re a
nd s
enat
eO
ngoi
ngM
sund
uzi
Legi
slat
ure
build
ing
Ong
oing
Ong
oing
Equ
itabl
e sh
are
Pro
gram
me
1P
acka
ged
prog
-
-
3 26
2
3
270
4 00
0
Rou
tine
mai
nten
ance
and
rep
airs
Ong
oing
Msu
nduz
iLe
gisl
atur
e bu
ildin
g an
d ad
min
blo
ck01
Apr
il 20
1631
Mar
ch 2
018
Equ
itabl
e sh
are
Pro
gram
me
1P
acka
ged
prog
-
-
833
90
0
-
Upg
rade
s an
d ad
ditio
ns: C
apita
l-
-
39
5
940
99
5
Legi
slat
ure
reva
mpi
ng c
apita
lO
ngoi
ngM
sund
uzi
Cap
ital r
evam
ping
of L
egis
latu
re
build
ing
Ong
oing
Ong
oing
Equ
itabl
e sh
are
Pro
gram
me
1P
acka
ged
prog
-
-
395
94
0
995
Ref
urbi
shm
ent a
nd r
ehab
ilita
tion:
Cap
ital
-
-
-
-
-
New
infr
astr
uct
ure
ass
ets:
Cap
ital
-
-
-
-
Infr
astr
uct
ure
tra
nsf
ers
-
-
-
-
-
of w
hich
:
Infr
astr
uctu
re tr
ansf
ers:
Cur
rent
-
-
-
-
-
Infr
astr
uctu
re tr
ansf
ers:
Cap
ital
-
-
-
-
-
Infr
astr
uct
ure
: P
aym
ents
fo
r fi
nan
cial
ass
ets
-
-
-
-
-
-
-
-
-
-
To
tal
-
-
4 49
0
5
110
4 99
5
-
-
395
940
995
-
-
4 09
5
4 17
0
4 00
0
Infr
astr
uct
ure
: L
ease
s
Cap
ital i
nfra
stru
ctur
e
Cur
rent
infr
astr
uctu
re
Del
iver
y
mec
han
ism
(in
div
idu
al
pro
ject
or
pac
kag
ed
pro
gra
mm
e)
Exp
end
itu
re t
o
dat
e fr
om
pre
vio
us
year
s
Mu
nic
ipal
ity/
Reg
ion
So
urc
e o
f
fun
din
g
Bu
dg
et
pro
gra
mm
e
nam
e
To
tal p
roje
ct
cost