42
ESTIMATES OF NATIONAL EXPENDITURE BUDGET 2017 VOTE 23 POLICE

ESTIMATES OF NATIONAL EXPENDITURE
BUDGET
2017
VOTE
23POLICE

Estimates of National Expenditure
2017
National Treasury
Republic of South Africa
22 February 2017

ISBN: 978-0-621-45118-4 RP: 09/2017 The Estimates of National Expenditure 2017 is compiled with the latest available information from departmental and other sources. Some of this information is unaudited or subject to revision. The Estimates of National Expenditure e-publications for individual votes are available on www.treasury.gov.za. Compared to the Estimates of National Expenditure publication, the e-publications for each vote contain more comprehensive coverage of all public entities. Also included are tables containing information on programme specific personnel expenditure, conditional grants to provinces and municipalities, public private partnerships and information on donor funding. Expenditure information at the level of site service delivery is included, where appropriate.

Foreword The 2017 Budget is presented at a time when indications are that the global economy could grow moderately better than the last forecast. Global GDP is expected to grow at 3.4 per cent in 2017, 0.3 percentage points higher than 2016. But uncertainty persists. The trade policies that the United States of America will pursue are unclear. The exact nature of Britain’s exit from the European Union and economic impact are unknown. There is also evidence that globalisation is losing favour in some parts of the world and protectionism is growing. The global economy could be very different in future, depending on how these trends evolve.
Given the uncertainty, we have revised down South Africa’s GDP growth projections and expect that tax revenue will be lower over the MTEF period as a result. We have also reduced the expenditure ceiling by R10.3 billion in 2017/18 and R15.9 billion in 2018/19, in line with government’s fiscal objective of reducing the deficit, achieving a primary surplus and stabilising debt. Since its introduction in 2012, the expenditure ceiling in each financial year has never been breached.
Government is committed to delivering on its priorities despite the lowered revenue forecast and expenditure ceiling. It is critical that we allocate our limited resources wisely and use them effectively. In the 2017 Budget process, measures were taken to free-up resources and baselines were reduced across all departments by R7.5 billion in 2017/18, R7 billion in 2018/19 and R6.7 billion in 2019/20. The contingency reserve was also drawn down, and provisionally reserved funds were reallocated. However, the bulk of the funds allocated to priority areas within and across functions were reprioritised from lower-priority budget areas.
To ensure that funding remains focused on frontline service delivery, efforts have been intensified to improve efficiency in expenditure. Budget limits on compensation of employees introduced in the 2016 Appropriation Act are carried over to 2017. Departments will manage personnel headcount and employee earnings in line with these budget allocations.
Overall non-interest expenditure is still set to grow by an annual average of 1.4 per cent in real terms, from R1.24 trillion in 2017/18 to R1.43 trillion in 2019/20. Proposals in the budget include net increases in funding for the Post-School Education and Training, Basic Education, Economic Affairs and Health functions. The Post-School Education and Training function is the fastest growing, at 9.4 per cent over the medium term. The funding is mainly for universities to subsidise fee increases and for the National Student Financial Aid Scheme.
The publication is a concrete expression of the collaborative effort of highly dedicated civil servants across government throughout the process to prepare the Budget. We are particularly appreciative of this, as well as the contributions from the Ministers’ Committee on the Budget and the Directors-General in central government. We are also thankful to all National Treasury staff who, under the expert guidance and leadership of the Minister of Finance, Pravin Gordhan, and his Deputy, Mcebisi Jonas, worked tirelessly to produce this crucial document.
The wide-ranging coverage of the Estimates of National Expenditure provides a coherent and summarised account of the prioritisation, spending plans and service delivery commitments of all 40 national votes and of government agencies. These plans constitute an important mechanism through which Parliament and the public hold institutions, including the National Treasury and its entities, to account.
Within the current difficult fiscal context not everything we believe would be beneficial to do, can be done now. Thus it is imperative that activities planned on budget be done effectively and efficiently.
Lungisa Fuzile Director-General: National Treasury


Introduction The Estimates of National Expenditure publications
The Estimates of National Expenditure (ENE) publications describe in detail government’s expenditure plans over the next three financial years, also known as the medium-term expenditure framework (MTEF) period. The 2017 MTEF period is from 2017/18 to 2019/20.
The ENE publications contain information on: what government institutions aim to achieve over the medium term, and why; how they plan to spend their budget allocations in support of this; and what outputs and outcomes the spending is intended to produce. The publications also provide information on how institutions have spent their budgets in previous years, tables with performance data and targets, personnel data and detailed expenditure trends and estimates by programme, subprogramme and economic classification for each department and the entities that report to the vote’s executive authority. Explanatory narratives detail the institution’s mandate, purpose (and that of its programmes), together with programme-level objectives and descriptions of subprogrammes. Summary data tables at the end of each vote contain data on infrastructure, provincial and municipal conditional grants, departmental public private partnerships, donor funding, and expenditure at the level of site service delivery, where applicable.
A separate 2017 ENE Overview publication is also available on www.treasury.gov.za and summarises the ENE information across all votes. The 2017 ENE Overview contains a narrative explanation and budget-wide summary tables; a description of the budgeting approach; and it also has a write-up on how to interpret the information that is contained in each section of the publications.


Police
National Treasury Republic of South Africa
Contents
Budget summary ............................................................................................................... 1
Vote purpose ...................................................................................................................... 1
Mandate .............................................................................................................................. 1
Selected performance indicators ..................................................................................... 1
Expenditure analysis ......................................................................................................... 2
Expenditure trends ............................................................................................................ 4
Expenditure estimates ...................................................................................................... 4
Goods and services expenditure trends and estimates ................................................ 5
Transfers and subsidies expenditure trends and estimates ......................................... 6
Personnel information ...................................................................................................... 6
Departmental receipts ....................................................................................................... 7
Programme 1: Administration .......................................................................................... 7
Programme 2: Visible Policing ......................................................................................... 9
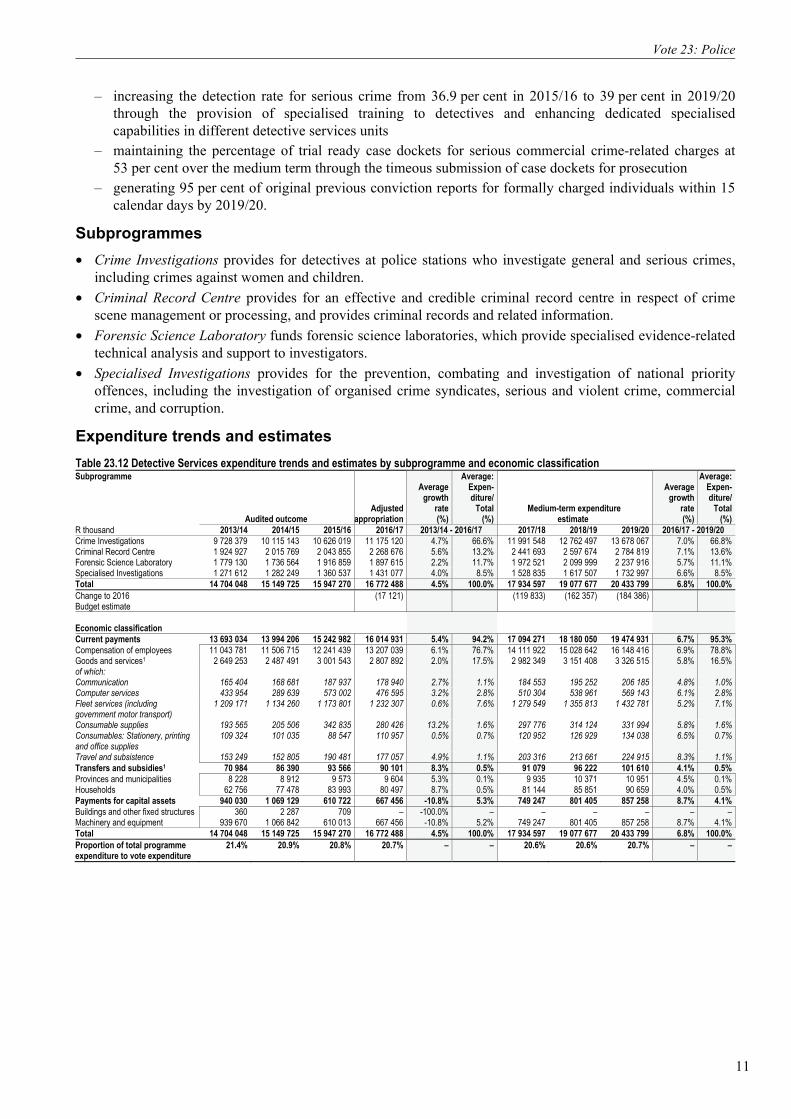
Programme 3: Detective Services ................................................................................... 10
Programme 4: Crime Intelligence ................................................................................... 12
Programme 5: Protection and Security Services .......................................................... 14
Other departments within the vote ................................................................................ 15
Civilian Secretariat for the Police Service ...................................................................... 15
Entity .................................................................................................................................. 24
Additional tables ............................................................................................................... 29

1
Vote 23 Police Budget summary
2017/18 2018/19 2019/20
R million Total Current
payments Transfers and
subsidies Payments for capital assets Total Total
MTEF allocation Administration 18 636.4 16 733.4 690.1 1 213.0 19 782.1 21 144.7Visible Policing 44 100.0 42 353.6 237.8 1 508.6 47 121.6 50 115.5Detective Services 17 934.6 17 094.3 91.1 749.2 19 077.7 20 433.8Crime Intelligence 3 546.0 3 481.8 12.7 51.6 3 765.8 4 046.6Protection and Security Services 2 808.1 2 725.1 5.4 77.6 2 993.8 3 205.3Total expenditure estimates 87 025.1 82 388.0 1 037.0 3 600.1 92 741.0 98 945.9Executive authority Minister of Police Accounting officer National Commissioner of the South African Police Service Website address www.saps.gov.za The Estimates of National Expenditure e-publications for individual votes are available on www.treasury.gov.za. These publications provide more comprehensive coverage of vote specific information, particularly about goods and services, transfers and subsidies, personnel, entities, donor funding, public private partnerships, conditional grants to provinces and municipalities, and expenditure information at the level of site service delivery, where appropriate.
Vote purpose Prevent, combat and investigate crime, maintain public order, protect and secure the inhabitants of South Africa and their property, and uphold and enforce the law.
Mandate The South African Police Service derives its powers and functions from section 205 of the Constitution and from the South African Police Service Act (1995). This legislation regulates the police service in terms of its core function, which is to prevent, investigate and combat crime.
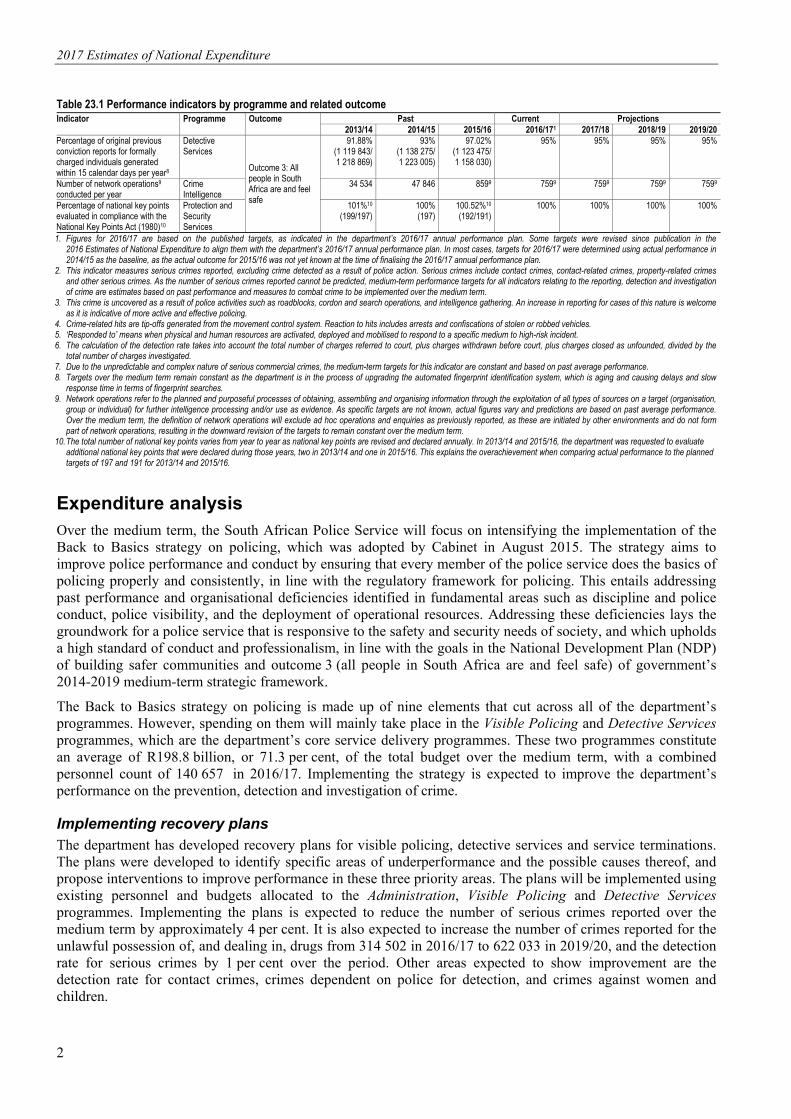
Selected performance indicators Table 23.1 Performance indicators by programme and related outcome Indicator Programme Outcome Past Current Projections
2013/14 2014/15 2015/16 2016/171 2017/18 2018/19 2019/20Number of serious crimes reported per year2
Visible Policing
Outcome 3: All people in South Africa are and feel safe
1 826 967 1 820 796 1 788 139 1 736 551 1 717 742 1 651 437 1 587 692
Number of crimes reported for unlawful possession of, and dealing in, drugs per year3
Visible Policing 260 732 267 034 259 229 314 502 371 833 480 928 622 033
Percentage of crime-related hits4
reacted to as a result of the movement control system screening of:
- Wanted persons
Visible Policing
100%(3 159)
100%(2 746)
100%(2 717)
100%
100% 100% 100%
- Stolen or robbed vehicles 100%(3 926)
100%(3 874)
100%(3 644)
100% 100% 100% 100%
Percentage of medium- to high-risk incidents responded to5 in relation to requests received
Visible Policing 100%(16 107)
100%(17 197)
100%(16 922)
100% 100% 100% 100%
Detection rate6 for serious crimes per year
Detective Services
38.14%(834 538/
2 187 956)
37.4%(820 598/
2 194 207)
36.9%(805 158/
2 182 044)
38% 37% 38% 39%2
Percentage of trial-ready case dockets for serious commercial crime-related charges per year7
Detective Services
54.9%(3 409/6 209)
58.8%(2 993/5 090)
58.59%(2 745/4 685)
53% 53% 53% 53%
2017 Estimates of National Expenditure
2
Table 23.1 Performance indicators by programme and related outcome Indicator Programme Outcome Past Current Projections
2013/14 2014/15 2015/16 2016/171 2017/18 2018/19 2019/20Percentage of original previous conviction reports for formally charged individuals generated within 15 calendar days per year8
Detective Services
Outcome 3: All people in South Africa are and feel safe
91.88%(1 119 843/1 218 869)
93%(1 138 275/1 223 005)
97.02%(1 123 475/ 1 158 030)
95% 95% 95% 95%
Number of network operations9 conducted per year
Crime Intelligence
34 534 47 846 8599 7599 7599 7599 7599
Percentage of national key points evaluated in compliance with the National Key Points Act (1980)10
Protection and Security Services
101%10
(199/197)100%(197)
100.52%10
(192/191)100% 100% 100% 100%
1. Figures for 2016/17 are based on the published targets, as indicated in the department’s 2016/17 annual performance plan. Some targets were revised since publication in the 2016 Estimates of National Expenditure to align them with the department’s 2016/17 annual performance plan. In most cases, targets for 2016/17 were determined using actual performance in 2014/15 as the baseline, as the actual outcome for 2015/16 was not yet known at the time of finalising the 2016/17 annual performance plan.
2. This indicator measures serious crimes reported, excluding crime detected as a result of police action. Serious crimes include contact crimes, contact-related crimes, property-related crimes and other serious crimes. As the number of serious crimes reported cannot be predicted, medium-term performance targets for all indicators relating to the reporting, detection and investigation of crime are estimates based on past performance and measures to combat crime to be implemented over the medium term.
3. This crime is uncovered as a result of police activities such as roadblocks, cordon and search operations, and intelligence gathering. An increase in reporting for cases of this nature is welcome as it is indicative of more active and effective policing.
4. Crime-related hits are tip-offs generated from the movement control system. Reaction to hits includes arrests and confiscations of stolen or robbed vehicles. 5. ‘Responded to’ means when physical and human resources are activated, deployed and mobilised to respond to a specific medium to high-risk incident. 6. The calculation of the detection rate takes into account the total number of charges referred to court, plus charges withdrawn before court, plus charges closed as unfounded, divided by the
total number of charges investigated. 7. Due to the unpredictable and complex nature of serious commercial crimes, the medium-term targets for this indicator are constant and based on past average performance. 8. Targets over the medium term remain constant as the department is in the process of upgrading the automated fingerprint identification system, which is aging and causing delays and slow
response time in terms of fingerprint searches. 9. Network operations refer to the planned and purposeful processes of obtaining, assembling and organising information through the exploitation of all types of sources on a target (organisation,
group or individual) for further intelligence processing and/or use as evidence. As specific targets are not known, actual figures vary and predictions are based on past average performance. Over the medium term, the definition of network operations will exclude ad hoc operations and enquiries as previously reported, as these are initiated by other environments and do not form part of network operations, resulting in the downward revision of the targets to remain constant over the medium term.
10. The total number of national key points varies from year to year as national key points are revised and declared annually. In 2013/14 and 2015/16, the department was requested to evaluate additional national key points that were declared during those years, two in 2013/14 and one in 2015/16. This explains the overachievement when comparing actual performance to the planned targets of 197 and 191 for 2013/14 and 2015/16.
Expenditure analysis Over the medium term, the South African Police Service will focus on intensifying the implementation of the Back to Basics strategy on policing, which was adopted by Cabinet in August 2015. The strategy aims to improve police performance and conduct by ensuring that every member of the police service does the basics of policing properly and consistently, in line with the regulatory framework for policing. This entails addressing past performance and organisational deficiencies identified in fundamental areas such as discipline and police conduct, police visibility, and the deployment of operational resources. Addressing these deficiencies lays the groundwork for a police service that is responsive to the safety and security needs of society, and which upholds a high standard of conduct and professionalism, in line with the goals in the National Development Plan (NDP) of building safer communities and outcome 3 (all people in South Africa are and feel safe) of government’s 2014-2019 medium-term strategic framework.
The Back to Basics strategy on policing is made up of nine elements that cut across all of the department’s programmes. However, spending on them will mainly take place in the Visible Policing and Detective Services programmes, which are the department’s core service delivery programmes. These two programmes constitute an average of R198.8 billion, or 71.3 per cent, of the total budget over the medium term, with a combined personnel count of 140 657 in 2016/17. Implementing the strategy is expected to improve the department’s performance on the prevention, detection and investigation of crime.
Implementing recovery plans The department has developed recovery plans for visible policing, detective services and service terminations. The plans were developed to identify specific areas of underperformance and the possible causes thereof, and propose interventions to improve performance in these three priority areas. The plans will be implemented using existing personnel and budgets allocated to the Administration, Visible Policing and Detective Services programmes. Implementing the plans is expected to reduce the number of serious crimes reported over the medium term by approximately 4 per cent. It is also expected to increase the number of crimes reported for the unlawful possession of, and dealing in, drugs from 314 502 in 2016/17 to 622 033 in 2019/20, and the detection rate for serious crimes by 1 per cent over the period. Other areas expected to show improvement are the detection rate for contact crimes, crimes dependent on police for detection, and crimes against women and children.

3
Vote 23: Police
Transforming the police service Demilitarising and professionalising the police service is a priority in the Back to Basics strategy, as is enforcing integrity and discipline among police officials, guided by the department’s code of conduct. The department has identified one police station in each province for the pilot implementation of the frontline service delivery project, which aims to improve the professional conduct of police officials. The project also aims to ensure that police stations are accessible, and interactions between the police and the public are positive. This requires standardising police services and ensuring that every police station has the basic operational resources and infrastructure required. Implementing the pilot of the project will see standardised signage and branding introduced, police facilities refurbished, and basic policing machinery and equipment acquired. This contributes to the projected increase of R100.8 million, or 4.5 per cent, over the medium term in spending on communication, and 12 per cent, or R789.8 million, over the same period in spending on machinery and equipment.
Enhancing police visibility Enhancing police visibility entails optimising spending on personnel, vehicles and infrastructure to ensure that the police service is accessible to communities and can make its presence felt. A significant proportion of the department’s budget, approximately 76.4 per cent over the medium term, is allocated to spending on compensation of employees. However, to keep spending within the compensation of employees ceiling approved by Cabinet in the 2016 budget, the department plans to reduce personnel numbers from 194 431 in 2016/17 to 191 431 in 2019/20. The reduction in personnel numbers is not expected to reduce the department’s overall performance over the medium term, as most of its performance targets in relation to the investigation and detection of crime will remain constant over the medium term.
A total of R2.5 billion is allocated over the MTEF period to the Administration programme to build, upgrade and maintain police stations. The department plans to build 63 additional police stations over the period at an estimated cost of R588.3 million. The department also plans to prioritise the replacement of vehicles that have mileage in excess of 200 000 kilometres as these vehicles, which constituted 35 per cent of the total fleet at the end of 2015/16, require significant maintenance each year. An amount of R5.7 billion is allocated over the medium term for transportation equipment, including vehicles, and R4.5 billion is budgeted for fleet maintenance.
The department is developing a plan to expand public order policing to support the implementation of the recommendations of the Marikana Commission of Inquiry. Allocations of R242 million in 2017/18 and R355.8 million in 2018/19 were approved by Cabinet in the 2016 budget for this purpose. This explains the projected increase of 7.9 per cent over the medium term in expenditure in the Specialised Interventions subprogramme in the Visible Policing programme.

2017 Estimates of National Expenditure
4
Expenditure trends Table 23.2 Vote expenditure trends by programme and economic classification Programmes 1. Administration 2. Visible Policing 3. Detective Services 4. Crime Intelligence 5. Protection and Security Services Programme
Ann
ual b
udge
t
Adj
uste
d
appr
opria
tion
Aud
ited
ou
tcom
e
Ann
ual b
udge
t
Adj
uste
d
appr
opria
tion
Aud
ited
ou
tcom
e
Ann
ual b
udge
t
Adj
uste
d
appr
opria
tion
Aud
ited
ou
tcom
e
Ann
ual b
udge
t
Adj
uste
d
appr
opria
tion
Rev
ised
es
timat
e
Aver
age:
Ou
tcom
e/Ann
ual
budg
et
(%)
Aver
age:
Ou
tcom
e/Adj
uste
d
appr
opria
tion
(%)
R million 2013/14 2014/15 2015/16 2016/17 2013/14 - 2016/17 Programme 1 14 318.2 14 524.9 14 179.2 15 304.0 15 304.0 15 570.2 16 264.2 16 609.3 16 936.3 17 559.8 17 382.5 17 382.5 101.0% 100.4%Programme 2 34 570.1 35 015.1 35 149.1 37 008.8 37 043.8 36 700.3 38 855.0 38 444.4 38 321.1 40 675.8 40 865.9 40 865.9 100.0% 99.8%Programme 3 14 348.5 14 550.9 14 704.0 15 242.7 15 133.0 15 149.7 15 816.0 16 092.4 15 947.3 16 789.6 16 772.5 16 772.5 100.6% 100.0%Programme 4 2 715.3 2 735.6 2 740.0 2 880.8 2 880.8 2 884.1 3 110.4 3 146.9 3 102.0 3 350.5 3 354.8 3 354.8 100.2% 99.7%Programme 5 1 964.9 1 964.9 2 019.0 2 070.9 2 145.6 2 202.9 2 331.5 2 427.7 2 414.1 2 609.1 2 609.1 2 609.1 103.0% 101.1%Total 67 917.1 68 791.4 68 791.4 72 507.2 72 507.2 72 507.2 76 377.1 76 720.8 76 720.8 80 984.9 80 984.9 80 984.9 100.4% 100.0%Change to 2016 Budget estimate
Economic classification
Current payments
64 212.7 65 084.8 64 818.6 68 924.4 68 766.5 68 576.5 72 604.4 72 903.2 72 714.0 77 007.6 77 152.6 77 152.6 100.2% 99.8%
Compensation of employees
50 358.5 51 231.6 51 241.8 54 210.0 54 449.0 54 332.2 57 884.9 58 277.1 57 478.4 62 070.4 62 038.1 62 038.1 100.3% 99.6%
Goods and services
13 854.2 13 853.2 13 576.8 14 714.4 14 317.5 14 244.3 14 719.6 14 626.1 15 235.7 14 937.1 15 114.4 15 114.4 99.9% 100.4%
Transfers and subsidies
637.3 639.6 812.8 737.1 852.0 899.0 911.9 952.4 990.9 961.0 993.3 993.3 113.8% 107.5%
Provinces and municipalities
28.0 28.0 34.6 33.4 33.4 38.1 37.0 37.0 40.1 40.6 40.6 40.6 110.4% 110.4%
Departmental agencies and accounts
115.5 116.7 93.0 133.8 134.7 134.7 142.0 150.0 155.7 149.4 149.4 149.4 – –
Non-profit institutions
– 1.0 1.0 1.0 1.0 1.0 – 1.0 1.0 – – – 300.0% 100.0%
Households 493.9 493.9 684.3 568.9 682.9 725.2 732.9 764.4 794.1 771.0 803.3 803.3 117.1% 109.6%Payments for capital assets
3 067.1 3 067.1 3 146.4 2 845.7 2 888.8 3 003.5 2 860.8 2 865.3 3 004.0 3 016.3 2 839.0 2 839.0 101.7% 102.9%
Buildings and other fixed structures
1 036.9 1 036.9 868.1 1 099.9 984.9 884.8 998.7 998.7 1 192.4 1 051.4 874.0 874.0 91.2% 98.1%
Machinery and equipment
2 029.9 2 029.9 2 278.1 1 745.5 1 898.5 2 118.4 1 856.5 1 856.5 1 808.1 1 959.2 1 957.0 1 957.0 107.5% 105.4%
Biological assets
0.3 0.3 0.2 0.3 5.4 0.2 5.5 10.0 3.6 5.7 7.9 7.9 102.1% 50.9%
Payments for financial assets
– – 13.6 – – 28.3 – – 11.9 – – – – –
Total 67 917.1 68 791.4 68 791.4 72 507.2 72 507.2 72 507.2 76 377.1 76 720.8 76 720.8 80 984.9 80 984.9 80 984.9 100.4% 100.0%
Expenditure estimates Table 23.3 Vote expenditure estimates by programme and economic classificationProgrammes 1. Administration 2. Visible Policing 3. Detective Services 4. Crime Intelligence 5. Protection and Security Services Programme
Revised estimate
Average growth
rate (%)
Average:Expenditure/
Total(%) Medium-term expenditure estimate
Averagegrowth
rate(%)
Average:Expenditure/
Total(%)
R million 2016/17 2013/14 - 2016/17 2017/18 2018/19 2019/20 2016/17 - 2019/20 Programme 1 17 382.5 6.2% 21.4% 18 636.4 19 782.1 21 144.7 6.7% 21.4%Programme 2 40 865.9 5.3% 50.5% 44 100.0 47 121.6 50 115.5 7.0% 50.7%Programme 3 16 772.5 4.9% 20.9% 17 934.6 19 077.7 20 433.8 6.8% 20.6%Programme 4 3 354.8 7.0% 4.0% 3 546.0 3 765.8 4 046.6 6.4% 4.1%Programme 5 2 609.1 9.9% 3.1% 2 808.1 2 993.8 3 205.3 7.1% 3.2%Total 80 984.9 5.6% 100.0% 87 025.1 92 741.0 98 945.9 6.9% 100.0%Change to 2016 Budget estimate
(227.0) (213.3) (253.2)

5
Vote 23: Police
Table 23.3 Vote expenditure estimates by programme and economic classificationEconomic classification
Revised estimate
Averagegrowth
rate(%)
Average:Expenditure/
Total(%) Medium-term expenditure estimate
Averagegrowth
rate(%)
Average:Expenditure/
Total(%)
R million 2016/17 2013/14 - 2016/17 2017/18 2018/19 2019/20 2016/17 - 2019/20 Current payments 77 152.6 5.8% 94.7% 82 388.0 87 723.8 94 066.7 6.8% 94.9%Compensation of employees 62 038.1 6.6% 75.3% 66 196.8 70 655.4 76 025.2 7.0% 76.4%Goods and services 15 114.4 2.9% 19.5% 16 191.3 17 068.4 18 041.5 6.1% 18.5%Transfers and subsidies 993.3 15.8% 1.2% 1 037.0 1 098.8 1 167.0 5.5% 1.2%Provinces and municipalities 40.6 13.2% 0.1% 43.8 47.0 56.0 11.4% 0.1%Departmental agencies and accounts 149.4 8.6% 0.2% 166.1 178.2 189.6 8.3% 0.2%Households 803.3 17.6% 1.0% 827.1 873.6 921.3 4.7% 1.0%Payments for capital assets 2 839.0 -2.5% 4.0% 3 600.1 3 918.4 3 712.2 9.4% 3.9%Buildings and other fixed structures 874.0 -5.5% 1.3% 891.5 924.9 958.7 3.1% 1.0%Machinery and equipment 1 957.0 -1.2% 2.7% 2 696.5 2 987.2 2 746.8 12.0% 2.9%Biological assets 7.9 212.0% 0.0% 12.0 6.3 6.7 -5.4% 0.0%Total 80 984.9 5.6% 100.0% 87 025.1 92 741.0 98 945.9 6.9% 100.0%
Goods and services expenditure trends and estimates Table 23.4 Vote goods and services expenditure trends and estimates
Audited outcome Adjusted
appropriation
Averagegrowth
rate(%)
Average: Expen-diture/
Total(%)
Medium-term expenditure estimate
Averagegrowth
rate(%)
Average:Expen-diture/
Total(%)
R thousand 2013/14 2014/15 2015/16 2016/17 2013/14 - 2016/17 2017/18 2018/19 2019/20 2016/17 - 2019/20 Administrative fees 59 788 47 951 57 394 61 970 1.2% 0.4% 65 399 69 186 73 056 5.6% 0.4%Advertising 32 295 26 581 39 821 29 634 -2.8% 0.2% 31 447 33 271 35 133 5.8% 0.2%Minor assets 226 229 260 213 239 949 242 897 2.4% 1.7% 277 284 294 348 311 243 8.6% 1.7%Audit costs: External 32 858 34 638 33 266 38 774 5.7% 0.2% 40 906 43 280 45 704 5.6% 0.3%Bursaries: Employees 6 970 8 609 8 252 8 555 7.1% 0.1% 8 769 9 032 9 538 3.7% 0.1%Catering: Departmental activities 38 106 40 115 39 531 33 740 -4.0% 0.3% 35 243 37 288 39 375 5.3% 0.2%Communication 707 442 696 107 714 118 712 996 0.3% 4.9% 739 784 771 302 813 779 4.5% 4.6%Computer services 2 550 149 2 787 020 3 149 413 2 915 795 4.6% 19.6% 3 212 779 3 362 794 3 561 055 6.9% 19.7%Consultants: Business and advisory services
20 160 26 569 27 402 30 337 14.6% 0.2% 27 340 23 596 24 915 -6.4% 0.2%
Infrastructure and planning services 22 427 73 – -100.0% – – – – – – Laboratory services 5 501 5 004 4 407 5 910 2.4% – 6 206 6 566 6 934 5.5% – Legal services 291 323 340 204 293 913 319 801 3.2% 2.1% 341 258 361 051 381 270 6.0% 2.1%Contractors 302 802 413 170 568 491 419 226 11.5% 2.9% 468 471 490 949 527 450 8.0% 2.9%Agency and support/outsourced services
262 192 235 979 344 667 322 866 7.2% 2.0% 314 161 332 602 350 547 2.8% 2.0%
Entertainment 2 166 1 361 1 412 1 952 -3.4% – 2 050 2 168 2 287 5.4% – Fleet services (including government motor transport)
3 902 382 3 739 357 3 753 107 3 834 790 -0.6% 26.2% 4 060 768 4 297 227 4 522 145 5.6% 25.2%
Inventory: Clothing material and accessories
146 018 253 073 245 436 251 680 19.9% 1.5% 269 616 285 187 301 157 6.2% 1.7%
Inventory: Other supplies 86 170 135 963 63 499 104 108 6.5% 0.7% 122 869 124 143 129 705 7.6% 0.7%Consumable supplies 318 883 341 867 492 570 427 666 10.3% 2.7% 450 819 475 797 502 586 5.5% 2.8%Consumables: Stationery, printing and office supplies
362 477 391 508 310 834 384 305 2.0% 2.5% 415 358 436 497 461 342 6.3% 2.6%
Operating leases 2 308 227 2 386 867 2 577 256 2 729 279 5.7% 17.2% 2 897 167 3 082 500 3 273 055 6.2% 18.0%Property payments 929 175 976 382 1 044 282 1 086 908 5.4% 6.9% 1 144 125 1 210 491 1 278 279 5.6% 7.1%Transport provided: Departmental activity
2 617 1 033 1 317 1 880 -10.4% – 1 976 2 091 2 208 5.5% –
Travel and subsistence 754 917 867 739 917 885 929 256 7.2% 6.0% 986 312 1 031 893 1 089 368 5.4% 6.1%Training and development 81 868 75 034 95 245 60 479 -9.6% 0.5% 83 100 87 985 92 947 15.4% 0.5%Operating payments 100 934 121 739 177 231 131 277 9.2% 0.9% 157 883 164 962 172 424 9.5% 0.9%Venues and facilities 45 092 29 755 34 880 28 355 -14.3% 0.2% 30 183 32 218 34 025 6.3% 0.2%Total 13 576 763 14 244 265 15 235 651 15 114 436 3.6% 100.0% 16 191 273 17 068 424 18 041 527 6.1% 100.0%

2017 Estimates of National Expenditure
6
Transfers and subsidies expenditure trends and estimates Table 23.5 Vote transfers and subsidies trends and estimates
Audited outcome Adjusted
appropriation
Averagegrowth
rate(%)
Average: Expen-diture/
Total(%)
Medium-term expenditure estimate
Averagegrowth
rate(%)
Average: Expen-diture/
Total(%)
R thousand 2013/14 2014/15 2015/16 2016/17 2013/14 - 2016/17 2017/18 2018/19 2019/20 2016/17 - 2019/20 Provinces and municipalities Municipal bank accounts Current 34 593 38 106 40 051 40 567 5.5% 4.1% 43 815 46 973 56 012 11.4% 4.4%Vehicle licences 34 593 38 106 40 051 40 567 5.5% 4.1% 43 815 46 973 56 012 11.4% 4.4%Departmental agencies and accounts Departmental agencies (non-business entities) Current 92 962 134 702 155 682 149 440 17.1% 14.4% 166 081 178 214 189 640 8.3% 15.9%Safety and Security Sector Education and Training Authority
31 984 34 904 42 498 38 848 6.7% 4.0% 41 408 43 630 45 569 5.5% 3.9%
Civilian Secretariat for the Police Service
60 978 99 798 113 184 110 592 22.0% 10.4% 124 673 134 584 144 071 9.2% 12.0%
Non-profit institutions Current 1 000 1 000 1 000 – -100.0% 0.1% – – – – – Education Trust 1 000 1 000 1 000 – -100.0% 0.1% – – – – – Households Social benefits Current 345 940 383 028 417 914 421 899 6.8% 42.4% 432 494 456 078 480 396 4.4% 41.7%Employee social benefits 345 940 383 028 417 914 421 899 6.8% 42.4% 432 494 456 078 480 396 4.4% 41.7%Households Other transfers to households Current 338 328 342 167 376 219 381 408 4.1% 38.9% 394 635 417 524 440 906 5.0% 38.0%Claims against the state 291 778 302 144 334 899 328 017 4.0% 34.0% 338 574 358 211 378 271 4.9% 32.7%Detainee medical expenses 46 550 40 023 41 320 53 391 4.7% 4.9% 56 061 59 313 62 635 5.5% 5.4%Total 812 823 899 003 990 866 993 314 6.9% 100.0% 1 037 025 1 098 789 1 166 954 5.5% 100.0%
Personnel information Table 23.6 Vote personnel numbers and cost by salary level and programme¹. 1. Administration 2. Visible Policing 3. Detective Services 4. Crime Intelligence 5. Protection and Security Services
Number of posts estimated for
31 March 2017 Number and cost2 of personnel posts filled / planned for on funded establishment Number
Number of
funded posts
Number of posts
additional to the
establishment Actual Revised estimate Medium-term expenditure estimate
Average growth
rate(%)
Average: Salary
level/Total(%)
2015/16 2016/17 2017/18 2018/19 2019/20 2016/17 - 2019/20
Police Number Cost Unit cost Number Cost
Unit cost Number Cost
Unit cost Number Cost
Unit cost Number Cost
Unit cost
Salary level 194 431 – 194 730 57 478.4 0.3 194 431 62 038.1 0.3 193 431 66 196.8 0.3 192 431 70 655.4 0.4 191 431 76 025.2 0.4 -0.5% 100.0%1 – 6 129 589 – 131 435 29 636.9 0.2 129 589 31 662.6 0.2 129 339 34 004.4 0.3 129 089 36 624.2 0.3 128 839 39 381.5 0.3 -0.2% 67.0%7 – 10 61 739 – 60 385 25 031.2 0.4 61 739 27 130.5 0.4 60 989 28 686.3 0.5 60 239 30 246.6 0.5 59 489 32 566.1 0.5 -1.2% 31.4%11 – 12 2 226 – 2 141 1 890.3 0.9 2 226 2 141.7 1.0 2 226 2 321.4 1.0 2 226 2 513.8 1.1 2 226 2 717.1 1.2 – 1.2%13 – 16 875 – 767 915.7 1.2 875 1 099.0 1.3 875 1 180.0 1.3 875 1 265.8 1.4 875 1 355.3 1.5 – 0.5%Other 2 – 2 4.2 2.1 2 4.4 2.2 2 4.6 2.3 2 4.9 2.5 2 5.2 2.6 – 0.0%Programme 194 431 – 194 730 57 478.4 0.3 194 431 62 038.1 0.3 193 431 66 196.8 0.3 192 431 70 655.4 0.4 191 431 76 025.2 0.4 -0.5% 100.0%Programme 1 37 285 – 37 285 10 279.6 0.3 37 285 11 194.7 0.3 37 135 11 930.3 0.3 36 985 12 766.6 0.3 36 835 13 736.5 0.4 -0.4% 19.2%Programme 2 101 749 – 102 731 30 067.5 0.3 101 749 32 304.5 0.3 101 087 34 466.2 0.3 100 425 36 797.8 0.4 99 763 39 624.8 0.4 -0.7% 52.2%Programme 3 38 908 – 38 766 12 241.4 0.3 38 908 13 207.0 0.3 38 720 14 111.9 0.4 38 532 15 028.6 0.4 38 344 16 148.4 0.4 -0.5% 20.0%Programme 4 9 657 – 9 146 2 819.3 0.3 9 657 3 054.0 0.3 9 657 3 227.7 0.3 9 657 3 427.9 0.4 9 657 3 688.3 0.4 – 5.0%Programme 5 6 832 – 6 802 2 070.5 0.3 6 832 2 277.9 0.3 6 832 2 460.7 0.4 6 832 2 634.4 0.4 6 832 2 827.1 0.4 – 3.5%1. Data has been provided by the department and may not necessarily reconcile with official government personnel data.2. Rand million.

7
Vote 23: Police
Departmental receipts Table 23.7 Departmental receipts by economic classification
Audited outcome Adjusted estimate
Revised estimate
Averagegrowth
rate (%)
Average: Receipt
item/Total
(%) Medium-term receipts estimate
Averagegrowth
rate (%)
Average: Receipt
item/Total
(%) R thousand 2013/14 2014/15 2015/16 2016/17 2013/14 - 2016/17 2017/18 2018/19 2019/20 2016/17 - 2019/20 Departmental receipts 386 341 389 406 478 192 497 993 497 993 8.8% 100.0% 356 004 376 378 393 848 -7.5% 100.0%Sales of goods and services produced by department
153 412 179 121 205 250 211 808 211 808 11.4% 42.8% 158 870 163 670 168 919 -7.3% 43.3%
Administrative fees 23 255 26 206 34 942 38 990 38 990 18.8% 7.0% 28 850 30 650 32 730 -5.7% 8.1%of which: Firearm licences 23 255 26 206 34 942 38 990 38 990 18.8% 7.0% 28 850 30 650 32 730 -5.7% 8.1%Other sales 130 157 152 915 170 308 172 818 172 818 9.9% 35.7% 130 020 133 020 136 189 -7.6% 35.2%of which: House rentals 31 844 32 753 31 157 30 138 30 138 -1.8% 7.2% 30 500 30 500 30 500 0.4% 7.5%Commission on insurance 54 444 58 971 62 144 65 722 65 722 6.5% 13.8% 60 000 62 000 64 000 -0.9% 15.5%Other 43 869 61 191 77 007 76 958 76 958 20.6% 14.8% 39 520 40 520 41 689 -18.5% 12.2%Sales of scrap, waste, arms and other used current goods
12 388 33 045 32 370 25 010 25 010 26.4% 5.9% 15 500 16 800 18 100 -10.2% 4.6%
of which: Sales of scrap, waste and other used goods
12 388 33 045 32 370 25 010 25 010 26.4% 5.9% 15 500 16 800 18 100 -10.2% 4.6%
Fines, penalties and forfeits 50 563 18 929 11 184 1 573 1 573 -68.5% 4.7% 4 480 6 420 8 150 73.0% 1.3%Interest, dividends and rent on land
769 1 210 1 128 1 133 1 133 13.8% 0.2% 865 925 985 -4.6% 0.2%
Interest 769 1 210 1 128 1 133 1 133 13.8% 0.2% 865 925 985 -4.6% 0.2%Sales of capital assets 3 757 15 541 62 650 83 100 83 100 180.7% 9.4% 42 900 44 500 46 100 -17.8% 13.3%Transactions in financial assets and liabilities
165 452 141 560 165 610 175 369 175 369 2.0% 37.0% 133 389 144 063 151 594 -4.7% 37.2%
Total 386 341 389 406 478 192 497 993 497 993 8.8% 100.0% 356 004 376 378 393 848 -7.5% 100.0%
Programme 1: Administration Programme purpose Provide strategic leadership, management and support services to the South African Police Service; and provide for the functions of the Civilian Secretariat for the Police Service.
Expenditure trends and estimates Table 23.8 Administration expenditure trends and estimates by subprogramme and economic classification Subprogramme
Audited outcome Adjusted
appropriation
Averagegrowth
rate(%)
Average: Expen-diture/
Total(%)
Medium-term expenditure estimate
Averagegrowth
rate(%)
Average:Expen-diture/
Total(%)
R thousand 2013/14 2014/15 2015/16 2016/17 2013/14 - 2016/17 2017/18 2018/19 2019/20 2016/17 - 2019/20 Ministry 24 317 30 102 38 964 72 661 44.0% 0.3% 63 397 53 072 56 254 -8.2% 0.3%Management 59 811 66 062 59 692 72 283 6.5% 0.4% 76 725 81 405 86 975 6.4% 0.4%Corporate Services 14 034 128 15 374 241 16 724 449 17 126 961 6.9% 98.7% 18 371 618 19 513 037 20 857 373 6.8% 98.6%Civilian Secretariat 60 978 99 798 113 184 110 592 22.0% 0.6% 124 673 134 584 144 071 9.2% 0.7%Total 14 179 234 15 570 203 16 936 289 17 382 497 7.0% 100.0% 18 636 413 19 782 098 21 144 673 6.7% 100.0%Change to 2016 Budget estimate
(177 314) (38 311) (32 471) (35 528)

2017 Estimates of National Expenditure
8
Table 23.8 Administration expenditure trends and estimates by subprogramme and economic classificationEconomic classification
Audited outcome Adjusted
appropriation
Averagegrowth
rate(%)
Average: Expen-diture/
Total(%)
Medium-term expenditure estimate
Averagegrowth
rate(%)
Average:Expen-diture/
Total(%)
R thousand 2013/14 2014/15 2015/16 2016/17 2013/14 - 2016/17 2017/18 2018/19 2019/20 2016/17 - 2019/20 Current payments 12 539 427 13 800 232 14 755 795 15 572 759 7.5% 88.4% 16 733 355 17 784 037 19 051 570 7.0% 89.9%Compensation of employees 8 701 821 9 390 774 10 279 563 11 194 690 8.8% 61.8% 11 930 255 12 766 646 13 736 484 7.1% 64.5%Goods and services1 3 837 606 4 409 458 4 476 232 4 378 069 4.5% 26.7% 4 803 100 5 017 391 5 315 086 6.7% 25.4%of which: Computer services 2 114 584 2 494 806 2 572 730 2 435 832 4.8% 15.0% 2 698 771 2 819 914 2 987 774 7.0% 14.2%Legal services 291 323 340 204 293 913 318 722 3.0% 1.9% 341 258 361 051 381 270 6.2% 1.8%Contractors 87 197 155 659 140 446 125 614 12.9% 0.8% 154 467 155 401 173 111 11.3% 0.8%Fleet services (including government motor transport)
308 308 296 627 275 573 253 865 -6.3% 1.8% 296 540 314 156 331 749 9.3% 1.6%
Inventory: Clothing material and accessories
95 973 172 590 236 090 251 680 37.9% 1.2% 264 264 279 592 295 249 5.5% 1.4%
Travel and subsistence 213 313 200 725 229 009 234 349 3.2% 1.4% 235 080 239 734 253 214 2.6% 1.3%Transfers and subsidies1 529 030 589 463 652 676 654 154 7.3% 3.8% 690 098 732 265 774 435 5.8% 3.7%Provinces and municipalities 5 772 6 944 6 891 7 174 7.5% – 7 350 7 776 8 211 4.6% – Departmental agencies and accounts
92 962 134 702 155 682 149 440 17.1% 0.8% 166 081 178 214 189 640 8.3% 0.9%
Households 430 296 447 817 490 103 497 540 5.0% 2.9% 516 667 546 275 576 584 5.0% 2.8%Payments for capital assets 1 097 147 1 152 248 1 515 942 1 155 584 1.7% 7.7% 1 212 960 1 265 796 1 318 668 4.5% 6.4%Buildings and other fixed structures
867 002 881 633 1 190 333 874 036 0.3% 6.0% 891 513 924 854 958 657 3.1% 4.7%
Machinery and equipment 229 907 270 390 321 992 273 648 6.0% 1.7% 309 447 334 607 353 321 8.9% 1.7%Biological assets 238 225 3 617 7 900 221.4% – 12 000 6 335 6 690 -5.4% – Payments for financial assets 13 630 28 260 11 876 – -100.0% 0.1% – – – – – Total 14 179 234 15 570 203 16 936 289 17 382 497 7.0% 100.0% 18 636 413 19 782 098 21 144 673 6.7% 100.0%Proportion of total programme expenditure to vote expenditure
20.6% 21.5% 22.1% 21.5% – – 21.4% 21.3% 21.4% – –
Details of transfers and subsidies Departmental agencies and accounts Departmental agencies (non-business entities) Current 92 962 134 702 155 682 149 440 17.1% 0.8% 166 081 178 214 189 640 8.3% 0.9%Safety and Security Sector Education and Training Authority
31 984 34 904 42 498 38 848 6.7% 0.2% 41 408 43 630 45 569 5.5% 0.2%
Civilian Secretariat for the Police Service
60 978 99 798 113 184 110 592 22.0% 0.6% 124 673 134 584 144 071 9.2% 0.7%
Households Social benefits Current 142 656 147 831 155 643 169 523 5.9% 1.0% 178 093 188 064 198 313 5.4% 1.0%Employee social benefits 142 656 147 831 155 643 169 523 5.9% 1.0% 178 093 188 064 198 313 5.4% 1.0%Households Other transfers to households Current 287 640 299 986 334 460 328 017 4.5% 2.0% 338 574 358 211 378 271 4.9% 1.8%Claims against the state 287 640 299 986 334 460 328 017 4.5% 2.0% 338 574 358 211 378 271 4.9% 1.8%Provinces and municipalities Municipalities Municipal bank accounts Current 5 772 6 944 6 891 7 174 7.5% – 7 350 7 776 8 211 4.6% – Vehicle licences 5 772 6 944 6 891 7 174 7.5% – 7 350 7 776 8 211 4.6% – 1. Estimates of National Expenditure data tables are available and can be downloaded from www.treasury.gov.za. These data tables contain detailed information by goods and services, and
transfers and subsidies item by programme.
Personnel information Table 23.9 Administration personnel numbers and cost by salary level¹
Number of posts estimated for 31 March 2017 Number and cost2 of personnel posts filled / planned for on funded establishment Number
Number of
funded posts
Number of posts
additional to the
establishment Actual Revised estimate Medium-term expenditure estimate
Averagegrowth
rate(%)
Average: Salary
level/Total(%)
2015/16 2016/17 2017/18 2018/19 2019/20 2016/17 - 2019/20
Administration Number Cost Unit cost Number Cost
Unit cost Number Cost
Unit cost Number Cost
Unit cost Number Cost
Unit cost
Salary level 37 285 – 37 285 10 279.6 0.3 37 285 11 194.7 0.3 37 135 11 930.3 0.3 36 985 12 766.6 0.3 36 835 13 736.5 0.4 -0.4% 100.0%1 – 6 23 199 – 24 498 4 116.4 0.2 23 199 4 196.3 0.2 23 049 4 511.7 0.2 22 899 4 846.2 0.2 22 749 5 195.4 0.2 -0.7% 62.0%7 – 10 12 998 – 11 754 5 077.7 0.4 12 998 5 756.4 0.4 12 998 6 076.7 0.5 12 998 6 472.2 0.5 12 998 6 980.9 0.5 – 35.1%11 – 12 778 – 762 724.8 1.0 778 807.0 1.0 778 874.7 1.1 778 947.2 1.2 778 1 023.8 1.3 – 2.1%13 – 16 308 – 269 356.3 1.3 308 430.7 1.4 308 462.4 1.5 308 496.1 1.6 308 531.1 1.7 – 0.8%Other 2 – 2 4.2 2.1 2 4.4 2.2 2 4.6 2.3 2 4.9 2.5 2 5.2 2.6 – 0.0%1. Data has been provided by the department and may not necessarily reconcile with official government personnel data.2. Rand million.
9
Vote 23: Police
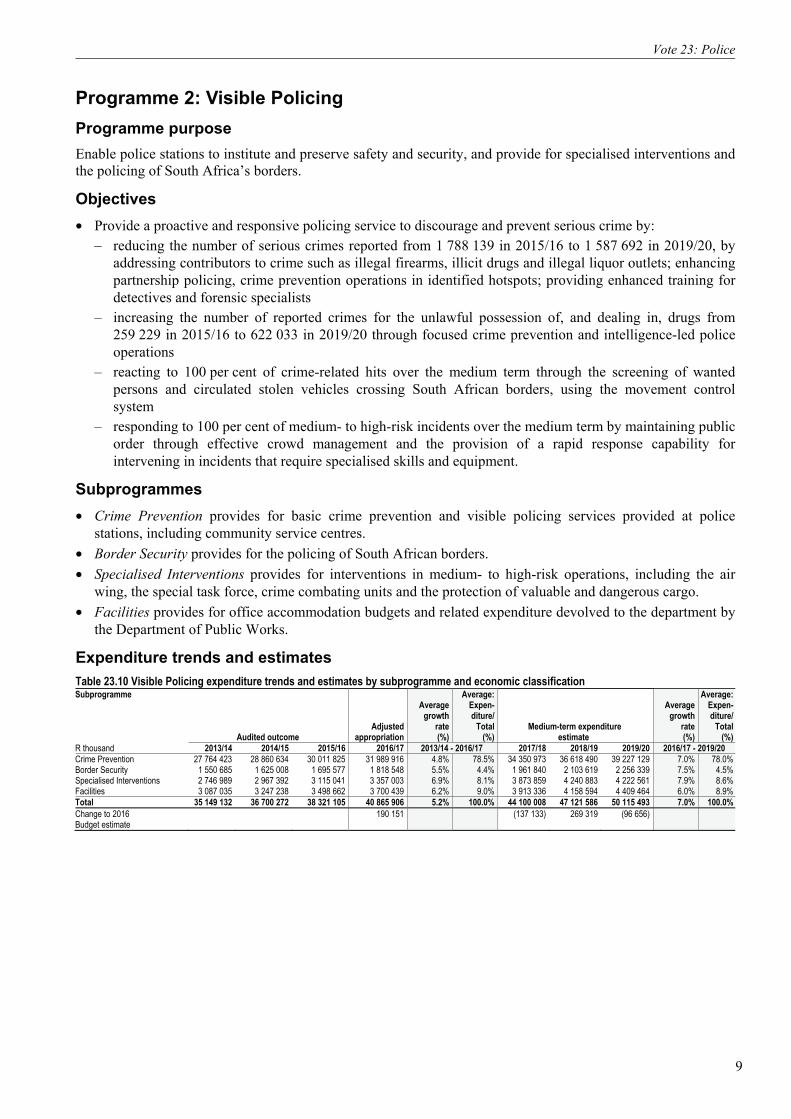
Programme 2: Visible Policing Programme purpose Enable police stations to institute and preserve safety and security, and provide for specialised interventions and the policing of South Africa’s borders.
Objectives • Provide a proactive and responsive policing service to discourage and prevent serious crime by:
– reducing the number of serious crimes reported from 1 788 139 in 2015/16 to 1 587 692 in 2019/20, by addressing contributors to crime such as illegal firearms, illicit drugs and illegal liquor outlets; enhancing partnership policing, crime prevention operations in identified hotspots; providing enhanced training for detectives and forensic specialists
– increasing the number of reported crimes for the unlawful possession of, and dealing in, drugs from 259 229 in 2015/16 to 622 033 in 2019/20 through focused crime prevention and intelligence-led police operations
– reacting to 100 per cent of crime-related hits over the medium term through the screening of wanted persons and circulated stolen vehicles crossing South African borders, using the movement control system
– responding to 100 per cent of medium- to high-risk incidents over the medium term by maintaining public order through effective crowd management and the provision of a rapid response capability for intervening in incidents that require specialised skills and equipment.
Subprogrammes • Crime Prevention provides for basic crime prevention and visible policing services provided at police
stations, including community service centres. • Border Security provides for the policing of South African borders. • Specialised Interventions provides for interventions in medium- to high-risk operations, including the air
wing, the special task force, crime combating units and the protection of valuable and dangerous cargo. • Facilities provides for office accommodation budgets and related expenditure devolved to the department by
the Department of Public Works.
Expenditure trends and estimates Table 23.10 Visible Policing expenditure trends and estimates by subprogramme and economic classification Subprogramme
Audited outcome Adjusted
appropriation
Averagegrowth
rate(%)
Average: Expen-diture/
Total(%)
Medium-term expenditure estimate
Averagegrowth
rate(%)
Average:Expen-diture/
Total(%)
R thousand 2013/14 2014/15 2015/16 2016/17 2013/14 - 2016/17 2017/18 2018/19 2019/20 2016/17 - 2019/20 Crime Prevention 27 764 423 28 860 634 30 011 825 31 989 916 4.8% 78.5% 34 350 973 36 618 490 39 227 129 7.0% 78.0%Border Security 1 550 685 1 625 008 1 695 577 1 818 548 5.5% 4.4% 1 961 840 2 103 619 2 256 339 7.5% 4.5%Specialised Interventions 2 746 989 2 967 392 3 115 041 3 357 003 6.9% 8.1% 3 873 859 4 240 883 4 222 561 7.9% 8.6%Facilities 3 087 035 3 247 238 3 498 662 3 700 439 6.2% 9.0% 3 913 336 4 158 594 4 409 464 6.0% 8.9%Total 35 149 132 36 700 272 38 321 105 40 865 906 5.2% 100.0% 44 100 008 47 121 586 50 115 493 7.0% 100.0%Change to 2016 Budget estimate
190 151 (137 133) 269 319 (96 656)

2017 Estimates of National Expenditure
10
Table 23.10 Visible Policing expenditure trends and estimates by subprogramme and economic classification Economic classification
Audited outcome Adjusted
appropriation
Averagegrowth
rate(%)
Average: Expen-diture/
Total(%)
Medium-term expenditure estimate
Averagegrowth
rate(%)
Average:Expen-diture/
Total(%)
R thousand 2013/14 2014/15 2015/16 2016/17 2013/14 - 2016/17 2017/18 2018/19 2019/20 2016/17 - 2019/20 Current payments 33 945 626 35 797 479 37 338 749 39 764 811 5.4% 97.2% 42 353 595 45 149 876 48 446 538 6.8% 96.4%Compensation of employees 27 299 233 28 893 468 30 067 523 32 304 514 5.8% 78.5% 34 466 218 36 797 752 39 624 834 7.0% 78.6%Goods and services1 6 646 393 6 904 011 7 271 226 7 460 297 3.9% 18.7% 7 887 377 8 352 124 8 821 704 5.7% 17.8%of which: Communication 344 024 343 355 354 690 358 716 1.4% 0.9% 370 711 381 045 402 290 3.9% 0.8%Contractors 176 266 185 664 285 989 228 406 9.0% 0.6% 244 736 261 741 276 399 6.6% 0.6%Fleet services (including government motor transport)
2 204 627 2 137 768 2 128 121 2 165 654 -0.6% 5.7% 2 284 131 2 415 035 2 533 289 5.4% 5.2%
Operating leases 2 224 040 2 312 565 2 498 432 2 649 871 6.0% 6.4% 2 809 470 2 989 834 3 175 253 6.2% 6.4%Property payments 919 034 964 652 1 031 387 1 071 772 5.3% 2.6% 1 126 131 1 191 447 1 258 168 5.5% 2.6%Travel and subsistence 245 720 360 675 308 877 346 805 12.2% 0.8% 355 252 375 763 397 435 4.6% 0.8%Transfers and subsidies1 194 793 205 023 220 596 226 454 5.1% 0.6% 237 814 251 221 270 760 6.1% 0.5%Provinces and municipalities 18 907 20 161 21 681 21 775 4.8% 0.1% 24 352 26 522 34 417 16.5% 0.1%Non-profit institutions 1 000 1 000 1 000 – -100.0% – – – – – – Households 174 886 183 862 197 915 204 679 5.4% 0.5% 213 462 224 699 236 343 4.9% 0.5%Payments for capital assets 1 008 713 697 770 761 760 874 641 -4.6% 2.2% 1 508 599 1 720 489 1 398 195 16.9% 3.0%Buildings and other fixed structures 732 421 1 215 – -100.0% – – – – – – Machinery and equipment 1 007 981 697 349 760 545 874 641 -4.6% 2.2% 1 508 599 1 720 489 1 398 195 16.9% 3.0%Total 35 149 132 36 700 272 38 321 105 40 865 906 5.2% 100.0% 44 100 008 47 121 586 50 115 493 7.0% 100.0%Proportion of total programme expenditure to vote expenditure
51.1% 50.6% 49.9% 50.5% – – 50.7% 50.8% 50.6% – –
Details of transfers and subsidies Non-profit institutions Current 1 000 1 000 1 000 – -100.0% – – – – – – Education Trust 1 000 1 000 1 000 – -100.0% – – – – – – Households Social benefits Current 124 935 142 272 156 252 151 288 6.6% 0.4% 157 401 165 386 173 708 4.7% 0.4%Employee social benefits 124 935 142 272 156 252 151 288 6.6% 0.4% 157 401 165 386 173 708 4.7% 0.4%Households Other transfers to households Current 49 951 41 590 41 663 53 391 2.2% 0.1% 56 061 59 313 62 635 5.5% 0.1%Claims against the state 3 401 1 567 343 – -100.0% – – – – – – Detainee medical expenses 46 550 40 023 41 320 53 391 4.7% 0.1% 56 061 59 313 62 635 5.5% 0.1%Provinces and municipalities Municipalities Municipal bank accounts Current 18 907 20 161 21 681 21 775 4.8% 0.1% 24 352 26 522 34 417 16.5% 0.1%Vehicle licences 18 907 20 161 21 681 21 775 4.8% 0.1% 24 352 26 522 34 417 16.5% 0.1%1. Estimates of National Expenditure data tables are available and can be downloaded from www.treasury.gov.za. These data tables contain detailed information by goods and services, and
transfers and subsidies item by programme.
Personnel information Table 23.11 Visible Policing personnel numbers and cost by salary level¹
Number of posts estimated for
31 March 2017 Number and cost2 of personnel posts filled / planned for on funded establishment Number
Number of funded
posts
Number of posts
additional to the
establishment Actual Revised estimate Medium-term expenditure estimate
Averagegrowth
rate(%)
Average: Salary
level/Total(%)
2015/16 2016/17 2017/18 2018/19 2019/20 2016/17 - 2019/20
Visible Policing Number Cost Unit cost Number Cost
Unit cost Number Cost
Unit cost Number Cost
Unit cost Number Cost
Unit cost
Salary level 101 749 – 102 731 30 067.5 0.3 101 749 32 304.5 0.3 101 087 34 466.2 0.3 100 425 36 797.8 0.4 99 763 39 624.8 0.4 -0.7% 100.0%1 – 6 72 817 – 74 171 18 090.4 0.2 72 817 19 239.1 0.3 72 817 20 623.3 0.3 72 817 22 245.3 0.3 72 817 23 936.4 0.3 – 72.3%7 – 10 27 918 – 27 642 11 062.0 0.4 27 918 11 975.8 0.4 27 256 12 666.8 0.5 26 594 13 283.9 0.5 25 932 14 322.8 0.6 -2.4% 26.7%11 – 12 639 – 598 531.7 0.9 639 619.3 1.0 639 671.3 1.1 639 726.9 1.1 639 785.7 1.2 – 0.6%13 – 16 375 – 320 383.5 1.2 375 470.2 1.3 375 504.9 1.3 375 541.6 1.4 375 579.9 1.5 – 0.4%1. Data has been provided by the department and may not necessarily reconcile with official government personnel data.2. Rand million.
Programme 3: Detective Services Programme purpose Enable the investigative work of the South African Police Service, including providing support to investigators in terms of forensic evidence and criminal records.
Objectives • Contribute to the successful prosecution of offenders by:
11
Vote 23: Police
– increasing the detection rate for serious crime from 36.9 per cent in 2015/16 to 39 per cent in 2019/20 through the provision of specialised training to detectives and enhancing dedicated specialised capabilities in different detective services units
– maintaining the percentage of trial ready case dockets for serious commercial crime-related charges at 53 per cent over the medium term through the timeous submission of case dockets for prosecution
– generating 95 per cent of original previous conviction reports for formally charged individuals within 15 calendar days by 2019/20.
Subprogrammes • Crime Investigations provides for detectives at police stations who investigate general and serious crimes,
including crimes against women and children. • Criminal Record Centre provides for an effective and credible criminal record centre in respect of crime
scene management or processing, and provides criminal records and related information. • Forensic Science Laboratory funds forensic science laboratories, which provide specialised evidence-related
technical analysis and support to investigators. • Specialised Investigations provides for the prevention, combating and investigation of national priority
offences, including the investigation of organised crime syndicates, serious and violent crime, commercial crime, and corruption.
Expenditure trends and estimates Table 23.12 Detective Services expenditure trends and estimates by subprogramme and economic classification Subprogramme
Audited outcome Adjusted
appropriation
Averagegrowth
rate(%)
Average: Expen-diture/
Total(%)
Medium-term expenditure estimate
Averagegrowth
rate(%)
Average:Expen-diture/
Total(%)
R thousand 2013/14 2014/15 2015/16 2016/17 2013/14 - 2016/17 2017/18 2018/19 2019/20 2016/17 - 2019/20 Crime Investigations 9 728 379 10 115 143 10 626 019 11 175 120 4.7% 66.6% 11 991 548 12 762 497 13 678 067 7.0% 66.8%Criminal Record Centre 1 924 927 2 015 769 2 043 855 2 268 676 5.6% 13.2% 2 441 693 2 597 674 2 784 819 7.1% 13.6%Forensic Science Laboratory 1 779 130 1 736 564 1 916 859 1 897 615 2.2% 11.7% 1 972 521 2 099 999 2 237 916 5.7% 11.1%Specialised Investigations 1 271 612 1 282 249 1 360 537 1 431 077 4.0% 8.5% 1 528 835 1 617 507 1 732 997 6.6% 8.5%Total 14 704 048 15 149 725 15 947 270 16 772 488 4.5% 100.0% 17 934 597 19 077 677 20 433 799 6.8% 100.0%Change to 2016 Budget estimate
(17 121) (119 833) (162 357) (184 386)
Economic classification Current payments 13 693 034 13 994 206 15 242 982 16 014 931 5.4% 94.2% 17 094 271 18 180 050 19 474 931 6.7% 95.3%Compensation of employees 11 043 781 11 506 715 12 241 439 13 207 039 6.1% 76.7% 14 111 922 15 028 642 16 148 416 6.9% 78.8%Goods and services1 2 649 253 2 487 491 3 001 543 2 807 892 2.0% 17.5% 2 982 349 3 151 408 3 326 515 5.8% 16.5%of which: Communication 165 404 168 681 187 937 178 940 2.7% 1.1% 184 553 195 252 206 185 4.8% 1.0%Computer services 433 954 289 639 573 002 476 595 3.2% 2.8% 510 304 538 961 569 143 6.1% 2.8%Fleet services (including government motor transport)
1 209 171 1 134 260 1 173 801 1 232 307 0.6% 7.6% 1 279 549 1 355 813 1 432 781 5.2% 7.1%
Consumable supplies 193 565 205 506 342 835 280 426 13.2% 1.6% 297 776 314 124 331 994 5.8% 1.6%Consumables: Stationery, printing and office supplies
109 324 101 035 88 547 110 957 0.5% 0.7% 120 952 126 929 134 038 6.5% 0.7%
Travel and subsistence 153 249 152 805 190 481 177 057 4.9% 1.1% 203 316 213 661 224 915 8.3% 1.1%Transfers and subsidies1 70 984 86 390 93 566 90 101 8.3% 0.5% 91 079 96 222 101 610 4.1% 0.5%Provinces and municipalities 8 228 8 912 9 573 9 604 5.3% 0.1% 9 935 10 371 10 951 4.5% 0.1%Households 62 756 77 478 83 993 80 497 8.7% 0.5% 81 144 85 851 90 659 4.0% 0.5%Payments for capital assets 940 030 1 069 129 610 722 667 456 -10.8% 5.3% 749 247 801 405 857 258 8.7% 4.1%Buildings and other fixed structures 360 2 287 709 – -100.0% – – – – – – Machinery and equipment 939 670 1 066 842 610 013 667 456 -10.8% 5.2% 749 247 801 405 857 258 8.7% 4.1%Total 14 704 048 15 149 725 15 947 270 16 772 488 4.5% 100.0% 17 934 597 19 077 677 20 433 799 6.8% 100.0%Proportion of total programme expenditure to vote expenditure
21.4% 20.9% 20.8% 20.7% – – 20.6% 20.6% 20.7% – –

2017 Estimates of National Expenditure
12
Table 23.12 Detective Services expenditure trends and estimates by subprogramme and economic classification Details of transfers and subsidies
Audited outcome Adjusted
appropriation
Averagegrowth
rate(%)
Average: Expen-diture/
Total(%)
Medium-term expenditure estimate
Averagegrowth
rate(%)
Average:Expen-diture/
Total(%)
R thousand 2013/14 2014/15 2015/16 2016/17 2013/14 - 2016/17 2017/18 2018/19 2019/20 2016/17 - 2019/20 Households Social benefits Current 62 204 77 049 83 913 80 497 9.0% 0.5% 81 144 85 851 90 659 4.0% 0.5%Employee social benefits 62 204 77 049 83 913 80 497 9.0% 0.5% 81 144 85 851 90 659 4.0% 0.5%Households Other transfers to households Current 552 429 80 – -100.0% – – – – – – Claims against the state 552 429 80 – -100.0% – – – – – – Provinces and municipalities Municipalities Municipal bank accounts Current 8 228 8 912 9 573 9 604 5.3% 0.1% 9 935 10 371 10 951 4.5% 0.1%Vehicle licences 8 228 8 912 9 573 9 604 5.3% 0.1% 9 935 10 371 10 951 4.5% 0.1%1. Estimates of National Expenditure data tables are available and can be downloaded from www.treasury.gov.za. These data tables contain detailed information by goods and services, and
transfers and subsidies item by programme.
Personnel information Table 23.13 Detective Services personnel numbers and cost by salary level¹
Number of posts estimated for
31 March 2017 Number and cost2 of personnel posts filled / planned for on funded establishment Number
Number of funded
posts
Number of posts
additional to the
establishment Actual Revised estimate Medium-term expenditure estimate
Averagegrowth
rate(%)
Average: Salary
level/Total(%)
2015/16 2016/17 2017/18 2018/19 2019/20 2016/17 - 2019/20
Detective Services Number Cost Unit cost Number Cost
Unit cost Number Cost
Unit cost Number Cost
Unit cost Number Cost
Unit cost
Salary level 38 908 – 38 766 12 241.4 0.3 38 908 13 207.0 0.3 38 720 14 111.9 0.4 38 532 15 028.6 0.4 38 344 16 148.4 0.4 -0.5% 100.0%1 – 6 22 585 – 22 347 5 157.7 0.2 22 585 5 667.2 0.3 22 485 6 111.2 0.3 22 385 6 583.7 0.3 22 285 7 079.4 0.3 -0.4% 58.1%7 – 10 15 726 – 15 856 6 616.5 0.4 15 726 7 005.3 0.4 15 638 7 422.5 0.5 15 550 7 820.1 0.5 15 462 8 395.1 0.5 -0.6% 40.4%11 – 12 478 – 452 358.8 0.8 478 413.7 0.9 478 448.4 0.9 478 485.5 1.0 478 524.8 1.1 – 1.2%13 – 16 119 – 111 108.3 1.0 119 120.9 1.0 119 129.8 1.1 119 139.3 1.2 119 149.1 1.3 – 0.3%1. Data has been provided by the department and may not necessarily reconcile with official government personnel data.2. Rand million.
Programme 4: Crime Intelligence Programme purpose Manage crime intelligence and analyse crime information, and provide technical support for investigations and crime prevention operations.
Objectives • Contribute to combating crime on an ongoing basis by:
– conducting 759 network operations in support of crime prevention, investigation and prosecution over the medium term
– increasing tactical and operational intelligence products in support of policing activities.
Subprogrammes • Crime Intelligence Operations provides for intelligence based criminal investigations. • Intelligence and Information Management provides for the analysis of crime intelligence patterns that will
facilitate crime detection in support of crime prevention and crime investigation.

13
Vote 23: Police
Expenditure trends and estimates Table 23.14 Crime Intelligence expenditure trends and estimates by subprogramme and economic classification Subprogramme
Audited outcome Adjusted
appropriation
Averagegrowth
rate(%)
Average: Expen-diture/
Total(%)
Medium-term expenditure estimate
Averagegrowth
rate(%)
Average:Expen-diture/
Total(%)
R thousand 2013/14 2014/15 2015/16 2016/17 2013/14 - 2016/17 2017/18 2018/19 2019/20 2016/17 - 2019/20 Crime Intelligence Operations 1 121 807 1 210 919 1 268 466 1 369 617 6.9% 41.1% 1 441 130 1 532 229 1 645 005 6.3% 40.7%Intelligence and Information Management 1 618 220 1 673 200 1 833 573 1 985 201 7.1% 58.9% 2 104 902 2 233 594 2 401 583 6.6% 59.3%Total 2 740 027 2 884 119 3 102 039 3 354 818 7.0% 100.0% 3 546 032 3 765 823 4 046 588 6.4% 100.0%Change to 2016 Budget estimate
4 284 (15 063) (14 586) (14 080)
Economic classification Current payments 2 690 215 2 838 190 3 054 301 3 298 363 7.0% 98.3% 3 481 754 3 696 784 3 972 582 6.4% 98.2%Compensation of employees 2 457 302 2 615 119 2 819 333 3 053 973 7.5% 90.6% 3 227 664 3 427 926 3 688 341 6.5% 91.1%Goods and services1 232 913 223 071 234 968 244 390 1.6% 7.7% 254 090 268 858 284 241 5.2% 7.1%of which: Communication 27 622 27 977 29 542 31 207 4.2% 1.0% 31 647 33 510 35 374 4.3% 0.9%Fleet services (including government motor transport)
117 623 108 931 103 461 119 094 0.4% 3.7% 124 215 131 499 139 081 5.3% 3.5%
Consumables: Stationery, printing and office supplies
9 062 11 633 10 664 13 046 12.9% 0.4% 13 699 14 493 15 304 5.5% 0.4%
Operating leases 24 070 15 004 16 157 12 159 -20.4% 0.6% 17 617 18 522 19 505 17.1% 0.5%Travel and subsistence 27 636 35 497 46 462 45 706 18.3% 1.3% 40 186 42 471 44 851 -0.6% 1.2%Operating payments 9 714 8 230 12 918 7 516 -8.2% 0.3% 12 724 13 488 14 436 24.3% 0.3%Transfers and subsidies1 13 722 14 837 17 032 16 323 6.0% 0.5% 12 668 13 404 14 156 -4.6% 0.4%Provinces and municipalities 927 1 175 1 067 1 041 3.9% – 1 153 1 220 1 289 7.4% – Households 12 795 13 662 15 965 15 282 6.1% 0.5% 11 515 12 184 12 867 -5.6% 0.4%Payments for capital assets 36 090 31 092 30 706 40 132 3.6% 1.1% 51 610 55 635 59 850 14.3% 1.4%Buildings and other fixed structures – – 107 – – – – – – – – Machinery and equipment 36 090 31 092 30 599 40 132 3.6% 1.1% 51 610 55 635 59 850 14.3% 1.4%Total 2 740 027 2 884 119 3 102 039 3 354 818 7.0% 100.0% 3 546 032 3 765 823 4 046 588 6.4% 100.0%Proportion of total programme expenditure to vote expenditure
4.0% 4.0% 4.0% 4.1% – – 4.1% 4.1% 4.1% – –
Details of transfers and subsidies Households Social benefits Current 12 748 13 501 15 949 15 282 6.2% 0.5% 11 515 12 184 12 867 -5.6% 0.4%Employee social benefits 12 748 13 501 15 949 15 282 6.2% 0.5% 11 515 12 184 12 867 -5.6% 0.4%Households Other transfers to households Current 47 161 16 – -100.0% – – – – – – Claims against the state 47 161 16 – -100.0% – – – – – – Provinces and municipalities Municipalities Municipal bank accounts Current 927 1 175 1 067 1 041 3.9% – 1 153 1 220 1 289 7.4% – Vehicle licences 927 1 175 1 067 1 041 3.9% – 1 153 1 220 1 289 7.4% – 1. Estimates of National Expenditure data tables are available and can be downloaded from www.treasury.gov.za. These data tables contain detailed information by goods and services, and
transfers and subsidies item by programme.
Personnel information Table 23.15 Crime Intelligence personnel numbers and cost by salary level¹
Number of posts estimated for 31 March 2017 Number and cost2 of personnel posts filled / planned for on funded establishment Number
Number of
funded posts
Number of posts
additional to the
establishment Actual Revised estimate Medium-term expenditure estimate
Averagegrowth
rate(%)
Average: Salary
level/Total(%)
2015/16 2016/17 2017/18 2018/19 2019/20 2016/17 - 2019/20
Crime Intelligence Number Cost Unit cost Number Cost
Unit cost Number Cost
Unit cost Number Cost
Unit cost Number Cost
Unit cost
Salary level 9 657 – 9 146 2 819.3 0.3 9 657 3 054.0 0.3 9 657 3 227.7 0.3 9 657 3 427.9 0.4 9 657 3 688.3 0.4 – 100.0%1 – 6 5 821 – 5 251 973.5 0.2 5 821 1 140.5 0.2 5 821 1 227.1 0.2 5 821 1 320.5 0.2 5 821 1 429.5 0.2 – 60.3%7 – 10 3 528 – 3 592 1 590.4 0.4 3 528 1 631.9 0.5 3 528 1 695.8 0.5 3 528 1 778.0 0.5 3 528 1 903.4 0.5 – 36.5%11 – 12 258 – 258 210.3 0.8 258 229.2 0.9 258 248.5 1.0 258 269.0 1.0 258 290.8 1.1 – 2.7%13 – 16 50 – 45 45.1 1.0 50 52.4 1.0 50 56.3 1.1 50 60.4 1.2 50 64.7 1.3 – 0.5%1. Data has been provided by the department and may not necessarily reconcile with official government personnel data.2. Rand million.

2017 Estimates of National Expenditure
14
Programme 5: Protection and Security Services Programme purpose Provide protection and security services to all identified dignitaries and government interests.
Objectives • Minimise security violations by:
– protecting all identified local and foreign dignitaries while in transit, without any security breaches, on an ongoing basis
– protecting the locations in which dignitaries, including persons related to the president and deputy president, are present, without security breaches, on an ongoing basis
– auditing 50.8 per cent of strategic installations per year over the medium term – evaluating 100 per cent of national key points annually over the medium term.
Subprogrammes • VIP Protection Services provides for the protection of the president, deputy president, former presidents,
their spouses, and other identified dignitaries while in transit. • Static and Mobile Security provides for the protection of other local and foreign dignitaries and the places in
which all dignitaries, including persons related to the president and the deputy president, are present. • Government Security Regulator provides for security regulations and evaluations, the administration of
national key points, and strategic installations. • Operational Support provides administrative support to the programme, including personnel development.
Expenditure trends and estimates Table 23.16 Protection and Security Services expenditure trends and estimates by subprogramme and economic classification Subprogramme
Audited outcome Adjusted
appropriation
Averagegrowth
rate(%)
Average: Expen-diture/
Total(%)
Medium-term expenditure estimate
Averagegrowth
rate(%)
Average:Expen-diture/
Total(%)
R thousand 2013/14 2014/15 2015/16 2016/17 2013/14 - 2016/17 2017/18 2018/19 2019/20 2016/17 - 2019/20 VIP Protection Services 876 350 977 903 1 158 120 1 275 216 13.3% 46.4% 1 406 967 1 502 260 1 611 830 8.1% 49.9%Static and Mobile Security 863 047 909 698 913 036 955 817 3.5% 39.4% 997 932 1 063 292 1 133 795 5.9% 35.7%Government Security Regulator 90 894 107 649 113 602 124 120 10.9% 4.7% 132 931 141 042 151 505 6.9% 4.7%Operational Support 188 666 207 656 229 340 253 989 10.4% 9.5% 270 248 287 224 308 192 6.7% 9.6%Total 2 018 957 2 202 906 2 414 098 2 609 142 8.9% 100.0% 2 808 078 2 993 818 3 205 322 7.1% 100.0%Change to 2016 Budget estimate
83 312 82 598 79 402
Economic classification Current payments 1 950 249 2 146 386 2 322 195 2 501 695 8.7% 96.5% 2 725 071 2 913 072 3 121 111 7.7% 96.9%Compensation of employees 1 739 651 1 926 152 2 070 513 2 277 907 9.4% 86.7% 2 460 714 2 634 429 2 827 130 7.5% 87.8%Goods and services1 210 598 220 234 251 682 223 788 2.0% 9.8% 264 357 278 643 293 981 9.5% 9.1%of which: Minor assets 2 477 3 732 3 384 3 996 17.3% 0.1% 4 345 4 597 4 853 6.7% 0.2%Communication 7 546 8 221 8 432 9 698 8.7% 0.4% 10 060 10 670 11 281 5.2% 0.4%Contractors 2 012 2 251 826 2 774 11.3% 0.1% 2 957 3 143 3 319 6.2% 0.1%Fleet services (including government motor transport)
62 653 61 771 72 151 63 870 0.6% 2.8% 76 333 80 724 85 245 10.1% 2.6%
Consumables: Stationery, printing and office supplies
5 149 5 754 6 061 6 257 6.7% 0.3% 6 579 6 958 7 347 5.5% 0.2%
Travel and subsistence 114 999 118 037 143 056 125 339 2.9% 5.4% 152 478 160 264 168 953 10.5% 5.2%Transfers and subsidies1 4 294 3 290 6 996 6 282 13.5% 0.2% 5 366 5 677 5 993 -1.6% 0.2%Provinces and municipalities 759 914 839 973 8.6% – 1 025 1 084 1 144 5.5% – Households 3 535 2 376 6 157 5 309 14.5% 0.2% 4 341 4 593 4 849 -3.0% 0.2%Payments for capital assets 64 414 53 230 84 907 101 165 16.2% 3.3% 77 641 75 069 78 218 -8.2% 2.9%Buildings and other fixed structures – 463 – – – – – – – – – Machinery and equipment 64 414 52 767 84 907 101 165 16.2% 3.3% 77 641 75 069 78 218 -8.2% 2.9%Total 2 018 957 2 202 906 2 414 098 2 609 142 8.9% 100.0% 2 808 078 2 993 818 3 205 322 7.1% 100.0%Proportion of total programme expenditure to vote expenditure
2.9% 3.0% 3.1% 3.2% – – 3.2% 3.2% 3.2% – –

15
Vote 23: Police
Table 23.16 Protection and Security Services expenditure trends and estimates by subprogramme and economic classification Details of transfers and subsidies
Audited outcome Adjusted
appropriation
Averagegrowth
rate(%)
Average: Expen-diture/
Total(%)
Medium-term expenditure estimate
Averagegrowth
rate(%)
Average:Expen-diture/
Total(%)
R thousand 2013/14 2014/15 2015/16 2016/17 2013/14 - 2016/17 2017/18 2018/19 2019/20 2016/17 - 2019/20 Households Social benefits Current 3 397 2 375 6 157 5 309 16.0% 0.2% 4 341 4 593 4 849 -3.0% 0.2%Employee social benefits 3 397 2 375 6 157 5 309 16.0% 0.2% 4 341 4 593 4 849 -3.0% 0.2%Households Other transfers to households Current 138 1 – – -100.0% – – – – – – Claims against the state 138 1 – – -100.0% – – – – – – Provinces and municipalities Municipalities Municipal bank accounts Current 759 914 839 973 8.6% – 1 025 1 084 1 144 5.5% – Vehicle licences 759 914 839 973 8.6% – 1 025 1 084 1 144 5.5% – 1. Estimates of National Expenditure data tables are available and can be downloaded from www.treasury.gov.za. These data tables contain detailed information by goods and services, and
transfers and subsidies item by programme.
Personnel information Table 23.17 Protection and Security Services personnel numbers and cost by salary level¹
Number of posts estimated for 31 March 2017 Number and cost2 of personnel posts filled / planned for on funded establishment Number
Number of
funded posts
Number of posts
additional to the
establishment Actual Revised estimate Medium-term expenditure estimate
Averagegrowth
rate(%)
Average: Salary
level/Total(%)
2015/16 2016/17 2017/18 2018/19 2019/20 2016/17 - 2019/20
Protection and Security Services Number Cost Unit cost Number Cost
Unit cost Number Cost
Unit cost Number Cost
Unit cost Number Cost
Unit cost
Salary level 6 832 – 6 802 2 070.5 0.3 6 832 2 277.9 0.3 6 832 2 460.7 0.4 6 832 2 634.4 0.4 6 832 2 827.1 0.4 – 100.0%1 – 6 5 167 – 5 168 1 298.8 0.3 5 167 1 419.6 0.3 5 167 1 531.1 0.3 5 167 1 628.6 0.3 5 167 1 740.8 0.3 – 75.6%7 – 10 1 569 – 1 541 684.5 0.4 1 569 761.1 0.5 1 569 824.5 0.5 1 569 892.3 0.6 1 569 963.9 0.6 – 23.0%11 – 12 73 – 71 64.7 0.9 73 72.5 1.0 73 78.6 1.1 73 85.1 1.2 73 91.9 1.3 – 1.1%13 – 16 23 – 22 22.5 1.0 23 24.7 1.1 23 26.6 1.2 23 28.5 1.2 23 30.5 1.3 – 0.3%1. Data has been provided by the department and may not necessarily reconcile with official government personnel data. 2. Rand million.
Other departments within the vote Civilian Secretariat for the Police Service Budget summary
2017/18 2018/19 2019/20
R million Total Current
payments Transfers and
subsidies Payments for capital assets
Total Total
MTEF allocation Administration 48.1 47.3 0.1 0.7 51.7 55.4Intersectoral Coordination and Strategic Partnerships
24.9 24.6 – 0.3 27.0 28.9
Legislation and Policy Development 28.1 27.8 – 0.4 30.2 32.3Civilian Oversight, Monitoring and Evaluations
23.6 23.3 – 0.3 25.6 27.5
Total expenditure estimates 124.7 123.0 0.1 1.6 134.6 144.1Executive authority Minister of Police Accounting officer Deputy Director General Website address www.policesecretariat.gov.za The Estimates of National Expenditure e-publications for individual votes are available on www.treasury.gov.za. These publications provide more comprehensive coverage of vote specific information, particularly about goods and services, transfers and subsidies, personnel, entities, donor funding, public private partnerships, conditional grants to provinces and municipalities, andexpenditure information at the level of site service delivery, where appropriate.
Department purpose Provide strategic advice and support to the Minister of Police. Exercise civilian oversight over the South African Police Service to ensure a transformed and accountable police service that reflects the values of a developmental state.

2017 Estimates of National Expenditure
16
Mandate The Civilian Secretariat for the Police Service was established in terms of the Civilian Secretariat for Police Service Act (2011) and section 208 of the Constitution, which provides for the establishment of a civilian secretariat for the police service to function under the direction of the Minister of Police. In terms of the act, the secretariat’s mandate is to conduct civilian oversight over the police service and provide policy and strategic support to the minister, including administrative support in relation to the minister’s international obligations. The act also mandates the secretariat to monitor the implementation of the Domestic Violence Act (1998) by the South African Police Service.
Selected performance indicators Table 23.18 Performance indicators by programme and related outcome Indicator Programme Outcome Past Current Projections 2013/14 2014/15 2015/16 2016/17 2017/18 2018/19 2019/20 Total number of provinces implementing community policing forum guidelines
Intersectoral Coordination and Strategic Partnerships
Outcome 3: All people In South Africa are and feel safe
–1 9 9 9 9 9 9
Number of research reports on policing approved by the Secretary of Police per year2
Legislation and Policy Development
–2 –2 1 2 2 2 2
Number of policies on policing submitted to the Minister of Police for approval per year3
Legislation and Policy Development
–3 –3 3 2 2 2 2
Number of bills on policing submitted to the Minister of Police for approval per year4
Legislation and Policy Development
3 –4 –4 4 1 1 1
Number of oversight visits to police stations conducted per year5
Civilian Oversight, Monitoring and Evaluations
529 585 14 20 22 24 26
Number of compliance reports on the implementation of the Domestic Violence Act (1998) by the South African Police Service approved by the Secretary of Police per year6
Civilian Oversight, Monitoring and Evaluations
2 3 3 3 3 3 3
1. Due to inconsistencies observed when measuring this indicator in 2013/14, the indicator was not included in the department’s 2013/14 annual performance plan, hence no performance outcome. 2. This indicator was previously not included in the Estimates of National Expenditure but reported on in the department’s annual performance plan from 2015/16. This indicator has now been
identified as one of the department’s strategic indicators for inclusion in the Estimates of National Expenditure. Targets for 2016/17 and over the medium-term remain constant as the department plans to produce a minimum of two research reports per year.
3. No policies were finalised in 2013/14 and 2014/15 as the department was conducting research in support of policies being developed. The department finalised one more policy than planned in 2015/16, the draft white paper on policing. However, medium-term targets remain constant as they are aligned with the anticipated performance given the lengthy consultation process from past experiences, which is part of the development of policies. Wording of the indicator has been amended to be more specific so that the measurement for policies developed is submission to the Minister of Police for approval.
4. No bills were developed in 2014/15 and 2015/16 due to the deferment of the bills planned for these years to the outer years, as well as due to delays caused by other factors such as the delayed finalisation of the draft white paper on policing and the need for further research. The department anticipates that the Critical Infrastructure Protection Bill, the Firearms Control Amendment Bill, the Protection of Constitutional Democracy against Terrorism and Related Activities Amendment Bill, and the Animal Movement and Animal Produce Bill will be finalised in 2016/17, hence the increased target for this year relative to the medium term. Wording of the indicator has been amended to be more specific so that the measurement for bills developed is the submission to the Minister of Police for approval.
5. The actual outcome for 2013/14 and 2014/15 includes oversight visits conducted by provincial departments of safety on behalf of the department, hence the increased number of visits. From 2015/16, the department only accounts for oversight visits directly conducted by the secretariat, hence the reduced targets. The underachievement in 2015/16 was a result of the reprioritisation of funds initially budgeted for oversight visits to fund the We Are One campaign to condemn the xenophobic attacks that occurred in South Africa in April 2015.
6. This indicator has been amended to focus on compliance reports and not audit reports, as previously reported on. The targets for compliance reports in relation to the implementation of the Domestic Violence Act (1998) remain constant as they have been aligned with the number of reports (three per year), to be submitted to Parliament as per agreement with the police portfolio committee.
Expenditure analysis The NDP says that crime prevention and detection should be done through an integrated approach between state and non-state institutions, with active involvement from civil society. The Civilian Secretariat for the Police Service aligns itself with this vision through overseeing the South African Police Service. In doing so, it forms strategic partnerships and collaborates with various community groups and government organisations on safety and crime prevention.
Over the medium term, the secretariat will focus on assessing provinces’ compliance with community policing forum guidelines; conducting a census in all police stations to assess service delivery by the South African Police Service; and finalising the implementation plans for the white papers on policing, and safety and security. These priorities will be implemented within the secretariat’s three core service delivery programmes: Intersectoral Coordination and Strategic Partnerships, Legislation and Policy Development, and Civilian Oversight, Monitoring and Evaluations, which together constitute an estimated 61.5 per cent, or R248.2 million, of the department’s total medium-term budget.

17
Vote 23: Police
Due to the labour-intensive nature of the secretariat’s oversight functions, an estimated 72.1 per cent of its budget in the period ahead is allocated to compensation of employees. The secretariat will maintain its funded personnel establishment at 139 employees over the medium term to contain spending within the compensation of employees ceiling, and to absorb the effects of the R3.2 million budget cut on compensation of employees over the period. As a result, over the medium term, travel and subsistence represents the second-largest spending item, at 9.4 per cent of total expenditure, as existing personnel will be expected to conduct work in provinces with capacity constraints. This accounts for the estimated increase of 10.1 per cent in expenditure on travel and subsistence over the medium term. As a cost-saving strategy, the secretariat will strengthen its partnerships with provincial departments of safety to ensure that, where legally permissible, they assume greater responsibility for some of the department’s oversight functions at the provincial level.
Monitoring compliance The Intersectoral Coordination and Strategic Partnerships programme manages and encourages national dialogue on community safety and crime prevention. It executes this mandate through partnerships and collaboration with external stakeholders such as the South African Police Service; the Independent Police Investigative Directorate; community, traditional and religious leaders; and provincial departments of community safety. Over the medium term, the secretariat will aim to visit 50 community policing forums in all provinces to assess their compliance with the guidelines. The nature of work performed by this programme is travel intensive as it is carried out across the country. As a result, R12 million is allocated for travel and subsistence in this programme over the period.
Assessing service delivery Over the medium term, the secretariat will conduct a census in all police stations in partnership with provinces with the aim of collecting accurate, reliable and comprehensive baseline information on service delivery by the police service, as well as on the implementation of, and compliance with, policing regulations. Thereafter, the secretariat plans to conduct 72 oversight visits to police stations to monitor the implementation of recommendations made during the census. This accounts for the estimated increase in expenditure of 6.2 per cent for travel and subsistence in the Civilian Oversight, Monitoring and Evaluations programme.
Implementing plans for white papers In April 2016, Cabinet approved the white papers on policing and safety and security for implementation. Over the medium term, the focus of the Policy Development and Research subprogramme in the Legislation and Policy Development programme will be on finalising the development of the implementation plans for the white papers. Key to the development of the implementation plans will be consultation with stakeholders outside of the department who are also expected to comply with the white papers. This partially explains the anticipated increase in spending on communications and travel and subsistence over the medium term, which are set to increase at average annual rates of 8 per cent and 6.5 per cent.
The Policy Development and Research subprogramme is also presently undertaking research on key policy proposals emanating from the white paper on policing, which includes developing a framework for establishing a national policing board and a concept document on the development of a framework for a single police service. It is anticipated that this research will be concluded and approved by the Secretary of Police before the end of 2016/17.

2017 Estimates of National Expenditure
18
Expenditure trends Table 23.19 Departmeental expenditure trends by programme and economic classification Programmes 1. Administration 2. Intersectoral Coordination and Strategic Partnerships 3. Legislation and Policy Development 4. Civilian Oversight, Monitoring and Evaluations Programme
Ann
ual b
udge
t
Adj
uste
d
appr
opria
tion
Aud
ited
ou
tcom
e
Ann
ual b
udge
t
Adj
uste
d
appr
opria
tion
Aud
ited
ou
tcom
e
Ann
ual b
udge
t
Adj
uste
d
appr
opria
tion
Aud
ited
ou
tcom
e
Ann
ual b
udge
t
Adj
uste
d
appr
opria
tion
Rev
ised
es
timat
e
Aver
age:
Ou
tcom
e/Ann
ual
budg
et
(%)
Aver
age:
Ou
tcom
e/Adj
uste
d
appr
opria
tion
(%)
R million 2013/14 2014/15 2015/16 2016/17 2013/14 - 2016/17 Programme 1 34.7 34.7 26.8 28.3 32.4 31.2 36.5 41.8 41.0 42.9 42.9 42.9 99.6% 93.4%Programme 2 16.5 16.5 10.5 20.4 19.5 23.7 22.5 23.9 26.6 22.2 22.2 22.2 101.6% 101.1%Programme 3 14.9 14.9 11.6 26.3 28.4 13.2 23.4 24.8 24.3 24.4 24.4 24.4 82.6% 79.5%Programme 4 18.7 18.7 12.2 24.7 19.5 14.3 22.7 22.7 20.0 21.1 21.1 21.1 77.5% 82.4%Total 84.8 84.8 61.0 99.8 99.8 82.4 105.1 113.2 111.9 110.6 110.6 110.6 91.4% 89.6%Change to 2016 Budget estimate
Economic classification Current payments 84.1 84.1 58.9 98.8 98.8 82.1 103.2 111.3 110.5 108.8 108.9 108.9 91.2% 89.4%Compensation of employees
58.3 58.3 42.9 71.5 69.4 60.9 68.3 68.3 65.3 79.4 79.4 79.4 89.5% 90.3%
Goods and services 25.8 25.8 15.9 27.3 29.4 21.2 34.9 43.0 45.2 29.4 29.4 29.4 95.1% 87.5%Transfers and subsidies – – – – – – 0.2 0.2 – 0.2 0.2 0.2 49.8% 51.5%Departmental agencies and accounts
– – – – – – 0.2 0.2 – 0.2 0.1 0.1 – –
Households – – – – – – – – – – 0.1 0.1 – 100.0%Payments for capital assets
0.7 0.7 2.1 0.9 1.0 0.3 1.7 1.7 1.4 1.5 1.5 1.5 111.6% 110.2%
Machinery and equipment 0.7 0.7 2.1 0.9 1.0 0.3 1.6 1.6 1.4 1.5 1.5 1.5 114.4% 113.0%Software and other intangible assets
– – – 0.1 0.1 – 0.1 0.1 – 0.1 0.1 0.1 32.3% 32.3%
Total 84.8 84.8 61.0 99.8 99.8 82.4 105.1 113.2 111.9 110.6 110.6 110.6 91.4% 89.6%
Expenditure estimates Table 23.20 Departmental expenditure estimates by programme and economic classificationProgrammes 1. Administration 2. Intersectoral Coordination and Strategic Partnerships 3. Legislation and Policy Development 4. Civilian Oversight, Monitoring and Evaluations Programme
Revised estimate
Average growth
rate (%)
Average:Expenditure/
Total(%) Medium-term expenditure estimate
Averagegrowth
rate(%)
Average:Expenditure/
Total(%)
R million 2016/17 2013/14 - 2016/17 2017/18 2018/19 2019/20 2016/17 - 2019/20 Programme 1 42.9 7.3% 38.8% 48.1 51.7 55.4 8.9% 38.5%Programme 2 22.2 10.4% 22.7% 24.9 27.0 28.9 9.2% 20.1%Programme 3 24.4 18.0% 20.1% 28.1 30.2 32.3 9.8% 22.4%Programme 4 21.1 4.0% 18.5% 23.6 25.6 27.5 9.2% 19.0%Total 110.6 9.3% 100.0% 124.7 134.6 144.1 9.2% 100.0%Change to 2016 Budget estimate
(1.4) (1.5) (1.6)
Economic classification
Current payments 108.9 9.0% 98.5% 123.0 132.8 142.2 9.3% 98.6%Compensation of employees 79.4 10.9% 67.9% 88.8 97.5 104.9 9.7% 72.1%Goods and services 29.4 4.4% 30.5% 34.2 35.3 37.3 8.2% 26.5%Transfers and subsidies 0.2 245.4% 0.1% 0.1 0.1 0.1 -14.4% 0.1%Departmental agencies and accounts 0.1 – – 0.1 0.1 0.1 9.8% 0.1%Households 0.1 – – – – – -100.0% –Payments for capital assets 1.5 33.1% 1.5% 1.6 1.7 1.8 5.1% 1.3%Machinery and equipment 1.5 31.5% 1.4% 1.5 1.6 1.7 5.1% 1.2%Software and other intangible assets 0.1 – – 0.1 0.1 0.1 4.7% –Total 110.6 9.3% 100.0% 124.7 134.6 144.1 9.2% 100.0%
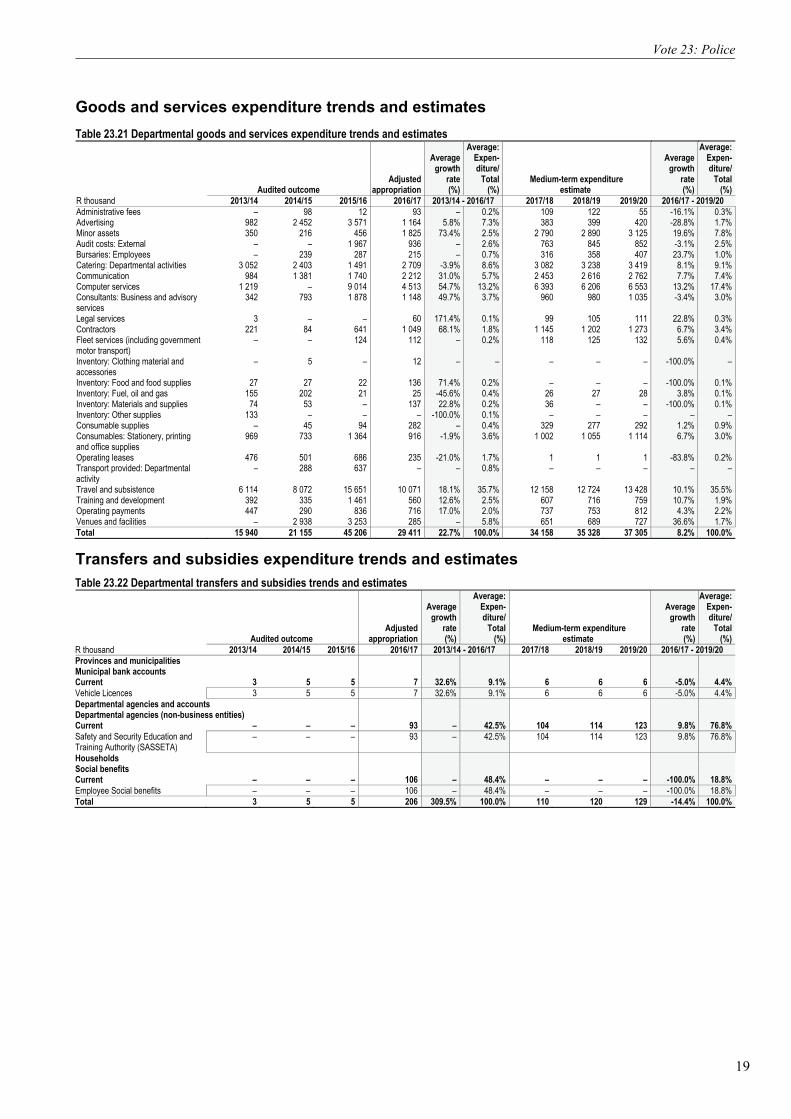
19
Vote 23: Police
Goods and services expenditure trends and estimates Table 23.21 Departmental goods and services expenditure trends and estimates
Audited outcome Adjusted
appropriation
Averagegrowth
rate(%)
Average: Expen-diture/
Total(%)
Medium-term expenditure estimate
Averagegrowth
rate(%)
Average:Expen-diture/
Total(%)
R thousand 2013/14 2014/15 2015/16 2016/17 2013/14 - 2016/17 2017/18 2018/19 2019/20 2016/17 - 2019/20 Administrative fees – 98 12 93 – 0.2% 109 122 55 -16.1% 0.3%Advertising 982 2 452 3 571 1 164 5.8% 7.3% 383 399 420 -28.8% 1.7%Minor assets 350 216 456 1 825 73.4% 2.5% 2 790 2 890 3 125 19.6% 7.8%Audit costs: External – – 1 967 936 – 2.6% 763 845 852 -3.1% 2.5%Bursaries: Employees – 239 287 215 – 0.7% 316 358 407 23.7% 1.0%Catering: Departmental activities 3 052 2 403 1 491 2 709 -3.9% 8.6% 3 082 3 238 3 419 8.1% 9.1%Communication 984 1 381 1 740 2 212 31.0% 5.7% 2 453 2 616 2 762 7.7% 7.4%Computer services 1 219 – 9 014 4 513 54.7% 13.2% 6 393 6 206 6 553 13.2% 17.4%Consultants: Business and advisory services
342 793 1 878 1 148 49.7% 3.7% 960 980 1 035 -3.4% 3.0%
Legal services 3 – – 60 171.4% 0.1% 99 105 111 22.8% 0.3%Contractors 221 84 641 1 049 68.1% 1.8% 1 145 1 202 1 273 6.7% 3.4%Fleet services (including government motor transport)
– – 124 112 – 0.2% 118 125 132 5.6% 0.4%
Inventory: Clothing material and accessories
– 5 – 12 – – – – – -100.0% –
Inventory: Food and food supplies 27 27 22 136 71.4% 0.2% – – – -100.0% 0.1%Inventory: Fuel, oil and gas 155 202 21 25 -45.6% 0.4% 26 27 28 3.8% 0.1%Inventory: Materials and supplies 74 53 – 137 22.8% 0.2% 36 – – -100.0% 0.1%Inventory: Other supplies 133 – – – -100.0% 0.1% – – – – – Consumable supplies – 45 94 282 – 0.4% 329 277 292 1.2% 0.9%Consumables: Stationery, printing and office supplies
969 733 1 364 916 -1.9% 3.6% 1 002 1 055 1 114 6.7% 3.0%
Operating leases 476 501 686 235 -21.0% 1.7% 1 1 1 -83.8% 0.2%Transport provided: Departmental activity
– 288 637 – – 0.8% – – – – –
Travel and subsistence 6 114 8 072 15 651 10 071 18.1% 35.7% 12 158 12 724 13 428 10.1% 35.5%Training and development 392 335 1 461 560 12.6% 2.5% 607 716 759 10.7% 1.9%Operating payments 447 290 836 716 17.0% 2.0% 737 753 812 4.3% 2.2%Venues and facilities – 2 938 3 253 285 – 5.8% 651 689 727 36.6% 1.7%Total 15 940 21 155 45 206 29 411 22.7% 100.0% 34 158 35 328 37 305 8.2% 100.0%
Transfers and subsidies expenditure trends and estimates Table 23.22 Departmental transfers and subsidies trends and estimates
Audited outcome Adjusted
appropriation
Averagegrowth
rate(%)
Average: Expen-diture/
Total(%)
Medium-term expenditure estimate
Averagegrowth
rate(%)
Average: Expen-diture/
Total(%)
R thousand 2013/14 2014/15 2015/16 2016/17 2013/14 - 2016/17 2017/18 2018/19 2019/20 2016/17 - 2019/20 Provinces and municipalities Municipal bank accounts Current 3 5 5 7 32.6% 9.1% 6 6 6 -5.0% 4.4%Vehicle Licences 3 5 5 7 32.6% 9.1% 6 6 6 -5.0% 4.4%Departmental agencies and accounts Departmental agencies (non-business entities) Current – – – 93 – 42.5% 104 114 123 9.8% 76.8%Safety and Security Education and Training Authority (SASSETA)
– – – 93 – 42.5% 104 114 123 9.8% 76.8%
Households Social benefits Current – – – 106 – 48.4% – – – -100.0% 18.8%Employee Social benefits – – – 106 – 48.4% – – – -100.0% 18.8%Total 3 5 5 206 309.5% 100.0% 110 120 129 -14.4% 100.0%

2017 Estimates of National Expenditure
20
Personnel information Table 23.23 Departmental personnel numbers and cost by salary level and programme¹Programmes 1. Administration 2. Intersectoral Coordination and Strategic Partnerships 3. Legislation and Policy Development 4. Civilian Oversight, Monitoring and Evaluations
Number of posts estimated for 31 March 2017 Number and cost2 of personnel posts filled / planned for on funded establishment Number
Number of
funded posts
Number of posts
additional to the
establishment Actual Revised estimate Medium-term expenditure estimate
Average growth
rate(%)
Average: Salary
level/Total(%)
2015/16 2016/17 2017/18 2018/19 2019/20 2016/17 - 2019/20
Civilian Secretariat
Number Cost Unit cost
Number Cost
Unit cost Number Cost
Unit cost Number Cost
Unit cost
Number Cost
Unit cost
Salary level 111 12 110 65.3 0.6 139 79.4 0.6 139 88.8 0.6 139 97.5 0.7 139 104.9 0.8 – 100.0%1 – 6 21 6 24 4.5 0.2 34 6.2 0.2 34 7.3 0.2 34 8.2 0.2 34 8.8 0.3 – 24.5%7 – 10 40 4 40 19.2 0.5 51 24.6 0.5 51 27.8 0.5 51 30.3 0.6 51 32.7 0.6 – 36.7%11 – 12 21 2 20 15.0 0.7 24 18.6 0.8 24 20.8 0.9 24 22.8 1.0 24 24.7 1.0 – 17.3%13 – 16 29 – 26 26.5 1.0 30 30.1 1.0 30 33.0 1.1 30 36.1 1.2 30 38.6 1.3 – 21.6%Programme 111 12 110 65.3 0.6 139 79.4 0.6 139 88.8 0.6 139 97.5 0.7 139 104.9 0.8 – 100.0%Programme 1 51 5 51 27.5 0.5 68 33.3 0.5 68 37.3 0.5 68 40.9 0.6 68 44.0 0.6 – 48.9%Programme 2 21 1 20 13.2 0.7 21 15.4 0.7 21 17.2 0.8 21 18.9 0.9 21 20.3 1.0 – 15.1%Programme 3 23 3 20 13.1 0.7 25 16.4 0.7 25 18.3 0.7 25 20.1 0.8 25 21.6 0.9 – 18.0%Programme 4 16 3 19 11.5 0.6 25 14.4 0.6 25 16.0 0.6 25 17.6 0.7 25 18.9 0.8 – 18.0%1. Data has been provided by the department and may not necessarily reconcile with official government personnel data.2. Rand million.
Departmental receipts Table 23.24 Departmental receipts by economic classification
Audited outcome Adjusted estimate
Revised estimate
Averagegrowth
rate (%)
Average: Receipt
item/Total
(%) Medium-term receipts estimate
Averagegrowth
rate (%)
Average:
Receipt item/Total
(%) R thousand 2013/14 2014/15 2015/16 2016/17 2013/14 - 2016/17 2017/18 2018/19 2019/20 2016/17 - 2019/20 Departmental receipts – 2 – 22 22 – 100.0% 24 26 28 8.4% 100.0%Sales of goods and services produced by department
– 2 – 22 22 – 100.0% 24 26 28 8.4% 100.0%
Sales by market establishments – 2 – 22 22 – 100.0% 24 26 28 8.4% 100.0%of which: Services rendered: Commission on insurance and garnishee
– 2 – 22 22 – 100.0% 24 26 28 8.4% 100.0%
Total – 2 – 22 22 – 100.0% 24 26 28 8.4% 100.0%
Programme 1: Administration
Programme purpose Provide strategic leadership, management and support services to the department.
Expenditure trends and estimates Table 23.25 Administration expenditure trends and estimates by subprogramme and economic classification Subprogramme
Audited outcome Adjusted
appropriation
Averagegrowth
rate(%)
Average: Expen-diture/
Total(%)
Medium-term expenditure estimate
Averagegrowth
rate(%)
Average:Expen-diture/
Total(%)
R thousand 2013/14 2014/15 2015/16 2016/17 2013/14 - 2016/17 2017/18 2018/19 2019/20 2016/17 - 2019/20 Department Management 8 142 9 174 11 725 8 387 1.0% 26.4% 9 277 10 067 10 790 8.8% 19.5%Corporate Services 9 860 8 801 10 241 13 481 11.0% 29.9% 14 965 16 343 17 545 9.2% 31.5%Finance Administration 8 804 10 468 15 674 16 808 24.1% 36.5% 19 505 20 585 22 013 9.4% 39.8%Office Accommodation – – – 1 – – 1 1 1 – – Internal Audit – 2 720 3 320 4 221 – 7.2% 4 303 4 700 5 045 6.1% 9.2%Total 26 806 31 163 40 960 42 898 17.0% 100.0% 48 051 51 696 55 394 8.9% 100.0%Change to 2016 Budget estimate
(541) (649) (709)

21
Vote 23: Police
Table 23.25 Administration expenditure trends and estimates by subprogramme and economic classification Economic classification
Audited outcome Adjusted
appropriation
Averagegrowth
rate(%)
Average: Expen-diture/
Total(%)
Medium-term expenditure estimate
Averagegrowth
rate(%)
Average:Expen-diture/
Total(%)
R thousand 2013/14 2014/15 2015/16 2016/17 2013/14 - 2016/17 2017/18 2018/19 2019/20 2016/17 - 2019/20 Current payments 24 975 30 978 40 400 42 112 19.0% 97.6% 47 266 50 862 54 511 9.0% 98.3%Compensation of employees 18 624 26 311 27 478 33 332 21.4% 74.6% 37 263 40 889 43 997 9.7% 78.5%Goods and services1 6 351 4 667 12 921 8 780 11.4% 23.1% 10 003 9 973 10 514 6.2% 19.8%of which: Audit costs: External – – 969 936 – 1.3% 763 845 852 -3.1% 1.7%Communication 672 537 828 697 1.2% 1.9% 734 777 820 5.6% 1.5%Computer services – – 4 059 2 283 – 4.5% 4 034 3 723 3 931 19.9% 7.1%Consumables: Stationery, printing and office supplies
866 328 409 532 -15.0% 1.5% 560 592 625 5.5% 1.2%
Travel and subsistence 1 476 1 390 3 862 1 088 -9.7% 5.5% 1 137 1 120 1 158 2.1% 2.3%Training and development 392 259 403 560 12.6% 1.1% 607 716 759 10.7% 1.3%Interest and rent on land – – 1 – – – – – – – – Transfers and subsidies1 3 5 4 127 248.5% 0.1% 110 120 129 0.5% 0.2%Provinces and municipalities 3 5 4 6 26.0% – 6 6 6 – – Departmental agencies and accounts
– – – 93 – 0.1% 104 114 123 9.8% 0.2%
Households – – – 28 – – – – – -100.0% – Payments for capital assets 1 828 180 556 659 -28.8% 2.3% 675 714 754 4.6% 1.4%Machinery and equipment 1 828 180 556 659 -28.8% 2.3% 675 714 754 4.6% 1.4%Total 26 806 31 163 40 960 42 898 17.0% 100.0% 48 051 51 696 55 394 8.9% 100.0%Proportion of total programme expenditure to vote expenditure
44.0% 37.8% 36.6% 38.8% – – 38.5% 38.4% 38.4% – –
Details of transfers and subsidies Departmental agencies and accounts Departmental agencies (non-business entities) Current – – – 93 – 0.1% 104 114 123 9.8% 0.2%Safety and Security Education and Training Authority
– – – 93 – 0.1% 104 114 123 9.8% 0.2%
Provinces and municipalities Municipalities Municipal bank accounts Current 3 5 4 6 26.0% – 6 6 6 – – Vehicle Licences 3 5 4 6 26.0% – 6 6 6 – – Households Social benefits Current – – – 28 – – – – – -100.0% – Employee Social benefits – – – 28 – – – – – -100.0% – 1. Estimates of National Expenditure data tables are available and can be downloaded from www.treasury.gov.za. These data tables contain detailed information by goods and services, and
transfers and subsidies item by programme.
Personnel information Table 23.26 Administration personnel numbers and cost by salary level¹
Number of posts estimated for
31 March 2017 Number and cost2 of personnel posts filled / planned for on funded establishment Number
Number of
funded posts
Number of posts
additional to the
establishment Actual Revised estimate Medium-term expenditure estimate
Averagegrowth
rate(%)
Average: Salary
level/Total(%)
2015/16 2016/17 2017/18 2018/19 2019/20 2016/17 - 2019/20
Administration Number Cost Unit cost Number Cost
Unit cost Number Cost
Unit cost Number Cost
Unit cost Number Cost
Unit cost
Salary level 51 5 51 27.5 0.5 68 33.3 0.5 68 37.3 0.5 68 40.9 0.6 68 44.0 0.6 – 100.0%1 – 6 11 4 15 2.6 0.2 24 4.0 0.2 24 4.9 0.2 24 5.7 0.2 24 6.1 0.3 – 35.3%7 – 10 18 1 17 7.7 0.5 22 9.6 0.4 22 10.4 0.5 22 11.3 0.5 22 12.3 0.6 – 32.4%11 – 12 10 – 8 6.2 0.8 9 6.9 0.8 9 7.5 0.8 9 8.2 0.9 9 8.9 1.0 – 13.2%13 – 16 12 – 11 10.9 1.0 13 12.8 1.0 13 14.3 1.1 13 15.7 1.2 13 16.8 1.3 – 19.1%1. Data has been provided by the department and may not necessarily reconcile with official government personnel data.2. Rand million.
Programme 2: Intersectoral Coordination and Strategic Partnerships
Programme purpose Manage and encourage national dialogue on community safety and crime prevention.

2017 Estimates of National Expenditure
22
Expenditure trends and estimates Table 23.27 Intersectoral Coordination and Strategic Partnerships expenditure trends and estimates by subprogramme and economic classification Subprogramme
Audited outcome Adjusted
appropriation
Averagegrowth
rate(%)
Average: Expen-diture/
Total(%)
Medium-term expenditure estimate
Averagegrowth
rate(%)
Average:Expen-diture/
Total(%)
R thousand 2013/14 2014/15 2015/16 2016/17 2013/14 - 2016/17 2017/18 2018/19 2019/20 2016/17 - 2019/20 Intergovernmental, Civil Society and Public-Private Partnerships
8 305 21 304 23 894 19 737 33.4% 88.3% 22 154 24 056 25 748 9.3% 89.0%
Community Outreach 2 145 2 431 2 675 2 471 4.8% 11.7% 2 764 2 966 3 165 8.6% 11.0%Total 10 450 23 735 26 569 22 208 28.6% 100.0% 24 918 27 022 28 913 9.2% 100.0%Change to 2016 Budget estimate
(273) (297) (318)
Economic classification Current payments 10 450 23 735 26 417 21 889 27.9% 99.4% 24 632 26 719 28 593 9.3% 98.8%Compensation of employees 7 676 13 626 13 221 15 402 26.1% 60.2% 17 219 18 893 20 329 9.7% 69.7%Goods and services1 2 774 10 109 13 196 6 487 32.7% 39.3% 7 413 7 826 8 264 8.4% 29.1%of which: Minor assets – 78 31 244 – 0.4% 196 200 285 5.3% 0.9%Catering: Departmental activities 1 284 1 584 1 209 1 915 14.3% 7.2% 2 157 2 280 2 407 7.9% 8.5%Communication 62 384 217 500 100.5% 1.4% 528 557 588 5.6% 2.1%Consultants: Business and advisory services
– 29 – 162 – 0.2% 171 181 191 5.6% 0.7%
Travel and subsistence 1 368 3 211 4 464 2 291 18.8% 13.7% 3 781 3 987 4 211 22.5% 13.8%Operating payments 48 13 199 209 63.3% 0.6% 220 233 246 5.6% 0.9%Transfers and subsidies1 – – – 47 – 0.1% – – – -100.0% – Households – – – 47 – 0.1% – – – -100.0% – Payments for capital assets – – 152 272 – 0.5% 286 303 320 5.6% 1.1%Machinery and equipment – – 152 272 – 0.5% 286 303 320 5.6% 1.1%Total 10 450 23 735 26 569 22 208 28.6% 100.0% 24 918 27 022 28 913 9.2% 100.0%Proportion of total programme expenditure to vote expenditure
17.1% 28.8% 23.7% 20.1% – – 20.0% 20.1% 20.1% – –
Details of transfers and subsidies Households Social benefits Current – – – 47 – 0.1% – – – -100.0% – Employee Social benefits – – – 47 – 0.1% – – – -100.0% – 1. Estimates of National Expenditure data tables are available and can be downloaded from www.treasury.gov.za. These data tables contain detailed information by goods and services, and
transfers and subsidies item by programme.
Personnel information Table 23.28 Intersectoral Coordination and Strategic Partnerships personnel numbers and cost by salary level¹
Number of posts estimated for
31 March 2017 Number and cost2 of personnel posts filled / planned for on funded establishment Number
Number of
funded posts
Number of posts
additional to the
establishment Actual Revised estimate Medium-term expenditure estimate
Averagegrowth
rate(%)
Average: Salary
level/Total(%)
2015/16 2016/17 2017/18 2018/19 2019/20 2016/17 - 2019/20 Intersectoral Coordination and Strategic Partnerships Number Cost
Unit cost Number Cost
Unit cost Number Cost
Unit cost Number Cost
Unit cost Number Cost
Unit cost
Salary level 21 1 20 13.2 0.7 21 15.4 0.7 21 17.2 0.8 21 18.9 0.9 21 20.3 1.0 – 100.0%1 – 6 2 – 2 0.5 0.2 2 0.6 0.3 2 0.6 0.3 2 0.7 0.4 2 0.8 0.4 – 9.5%7 – 10 8 – 7 3.7 0.5 7 3.9 0.6 7 4.3 0.6 7 4.6 0.7 7 5.0 0.7 – 33.3%11 – 12 5 1 5 3.6 0.7 6 4.7 0.8 6 5.7 0.9 6 6.5 1.1 6 7.0 1.2 – 28.6%13 – 16 6 – 6 5.4 0.9 6 6.1 1.0 6 6.6 1.1 6 7.1 1.2 6 7.6 1.3 – 28.6%1. Data has been provided by the department and may not necessarily reconcile with official government personnel data. 2. Rand million.
Programme 3: Legislation and Policy Development
Programme purpose Develop policy and legislation for the police sector and conduct research on policing and crime.
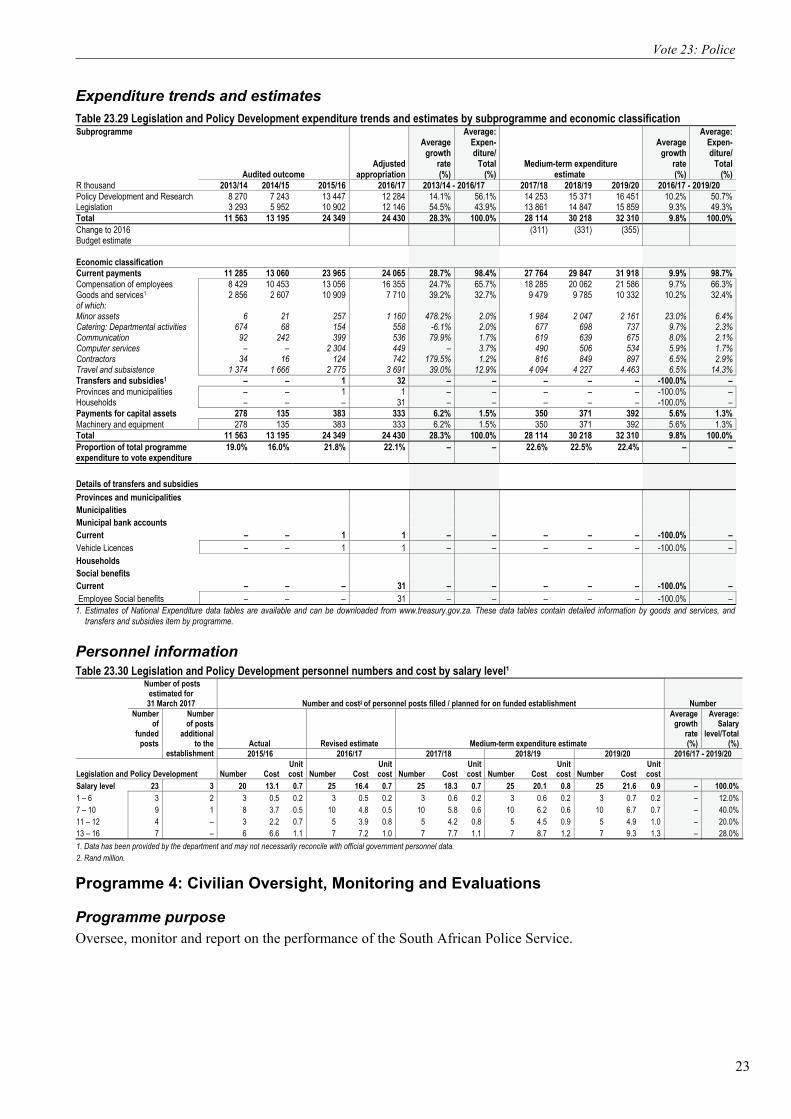
23
Vote 23: Police
Expenditure trends and estimates Table 23.29 Legislation and Policy Development expenditure trends and estimates by subprogramme and economic classification Subprogramme
Audited outcome Adjusted
appropriation
Averagegrowth
rate(%)
Average: Expen-diture/
Total(%)
Medium-term expenditure estimate
Averagegrowth
rate(%)
Average:Expen-diture/
Total(%)
R thousand 2013/14 2014/15 2015/16 2016/17 2013/14 - 2016/17 2017/18 2018/19 2019/20 2016/17 - 2019/20 Policy Development and Research 8 270 7 243 13 447 12 284 14.1% 56.1% 14 253 15 371 16 451 10.2% 50.7%Legislation 3 293 5 952 10 902 12 146 54.5% 43.9% 13 861 14 847 15 859 9.3% 49.3%Total 11 563 13 195 24 349 24 430 28.3% 100.0% 28 114 30 218 32 310 9.8% 100.0%Change to 2016 Budget estimate
(311) (331) (355)
Economic classification Current payments 11 285 13 060 23 965 24 065 28.7% 98.4% 27 764 29 847 31 918 9.9% 98.7%Compensation of employees 8 429 10 453 13 056 16 355 24.7% 65.7% 18 285 20 062 21 586 9.7% 66.3%Goods and services1 2 856 2 607 10 909 7 710 39.2% 32.7% 9 479 9 785 10 332 10.2% 32.4%of which: Minor assets 6 21 257 1 160 478.2% 2.0% 1 984 2 047 2 161 23.0% 6.4%Catering: Departmental activities 674 68 154 558 -6.1% 2.0% 677 698 737 9.7% 2.3%Communication 92 242 399 536 79.9% 1.7% 619 639 675 8.0% 2.1%Computer services – – 2 304 449 – 3.7% 490 506 534 5.9% 1.7%Contractors 34 16 124 742 179.5% 1.2% 816 849 897 6.5% 2.9%Travel and subsistence 1 374 1 666 2 775 3 691 39.0% 12.9% 4 094 4 227 4 463 6.5% 14.3%Transfers and subsidies1 – – 1 32 – – – – – -100.0% – Provinces and municipalities – – 1 1 – – – – – -100.0% – Households – – – 31 – – – – – -100.0% – Payments for capital assets 278 135 383 333 6.2% 1.5% 350 371 392 5.6% 1.3%Machinery and equipment 278 135 383 333 6.2% 1.5% 350 371 392 5.6% 1.3%Total 11 563 13 195 24 349 24 430 28.3% 100.0% 28 114 30 218 32 310 9.8% 100.0%Proportion of total programme expenditure to vote expenditure
19.0% 16.0% 21.8% 22.1% – – 22.6% 22.5% 22.4% – –
Details of transfers and subsidies
Provinces and municipalities Municipalities Municipal bank accounts Current – – 1 1 – – – – – -100.0% – Vehicle Licences – – 1 1 – – – – – -100.0% – Households Social benefits Current – – – 31 – – – – – -100.0% – Employee Social benefits – – – 31 – – – – – -100.0% – 1. Estimates of National Expenditure data tables are available and can be downloaded from www.treasury.gov.za. These data tables contain detailed information by goods and services, and
transfers and subsidies item by programme.
Personnel information Table 23.30 Legislation and Policy Development personnel numbers and cost by salary level¹
Number of posts estimated for
31 March 2017 Number and cost2 of personnel posts filled / planned for on funded establishment Number
Number of
funded posts
Number of posts
additional to the
establishment Actual Revised estimate Medium-term expenditure estimate
Averagegrowth
rate(%)
Average: Salary
level/Total(%)
2015/16 2016/17 2017/18 2018/19 2019/20 2016/17 - 2019/20
Legislation and Policy Development Number Cost Unit cost Number Cost
Unit cost Number Cost
Unit cost Number Cost
Unit cost Number Cost
Unit cost
Salary level 23 3 20 13.1 0.7 25 16.4 0.7 25 18.3 0.7 25 20.1 0.8 25 21.6 0.9 – 100.0%1 – 6 3 2 3 0.5 0.2 3 0.5 0.2 3 0.6 0.2 3 0.6 0.2 3 0.7 0.2 – 12.0%7 – 10 9 1 8 3.7 0.5 10 4.8 0.5 10 5.8 0.6 10 6.2 0.6 10 6.7 0.7 – 40.0%11 – 12 4 – 3 2.2 0.7 5 3.9 0.8 5 4.2 0.8 5 4.5 0.9 5 4.9 1.0 – 20.0%13 – 16 7 – 6 6.6 1.1 7 7.2 1.0 7 7.7 1.1 7 8.7 1.2 7 9.3 1.3 – 28.0%1. Data has been provided by the department and may not necessarily reconcile with official government personnel data. 2. Rand million.
Programme 4: Civilian Oversight, Monitoring and Evaluations
Programme purpose Oversee, monitor and report on the performance of the South African Police Service.
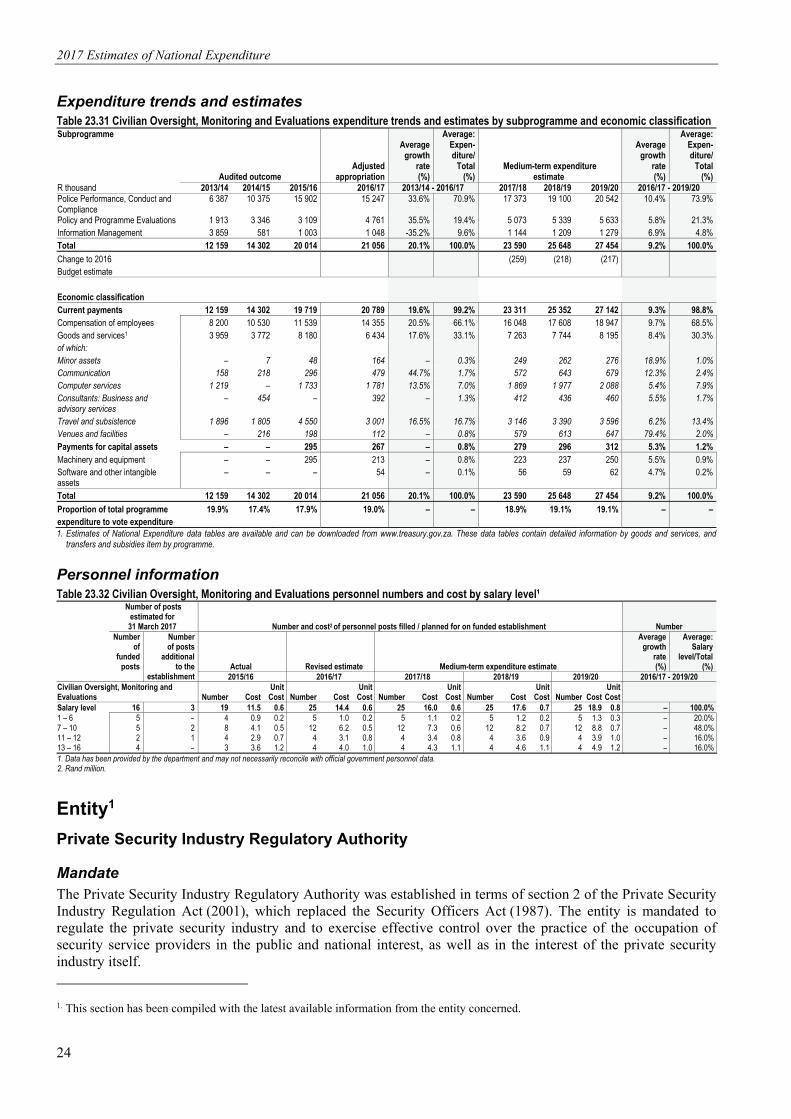
2017 Estimates of National Expenditure
24
Expenditure trends and estimates Table 23.31 Civilian Oversight, Monitoring and Evaluations expenditure trends and estimates by subprogramme and economic classificationSubprogramme
Audited outcome Adjusted
appropriation
Averagegrowth
rate(%)
Average: Expen-diture/
Total(%)
Medium-term expenditure estimate
Averagegrowth
rate(%)
Average:Expen-diture/
Total(%)
R thousand 2013/14 2014/15 2015/16 2016/17 2013/14 - 2016/17 2017/18 2018/19 2019/20 2016/17 - 2019/20 Police Performance, Conduct and Compliance
6 387 10 375 15 902 15 247 33.6% 70.9% 17 373 19 100 20 542 10.4% 73.9%
Policy and Programme Evaluations 1 913 3 346 3 109 4 761 35.5% 19.4% 5 073 5 339 5 633 5.8% 21.3%Information Management 3 859 581 1 003 1 048 -35.2% 9.6% 1 144 1 209 1 279 6.9% 4.8%Total 12 159 14 302 20 014 21 056 20.1% 100.0% 23 590 25 648 27 454 9.2% 100.0%Change to 2016 Budget estimate
(259) (218) (217)
Economic classification
Current payments 12 159 14 302 19 719 20 789 19.6% 99.2% 23 311 25 352 27 142 9.3% 98.8%Compensation of employees 8 200 10 530 11 539 14 355 20.5% 66.1% 16 048 17 608 18 947 9.7% 68.5%Goods and services1 3 959 3 772 8 180 6 434 17.6% 33.1% 7 263 7 744 8 195 8.4% 30.3%of which: Minor assets – 7 48 164 – 0.3% 249 262 276 18.9% 1.0%Communication 158 218 296 479 44.7% 1.7% 572 643 679 12.3% 2.4%Computer services 1 219 – 1 733 1 781 13.5% 7.0% 1 869 1 977 2 088 5.4% 7.9%Consultants: Business and advisory services
– 454 – 392 – 1.3% 412 436 460 5.5% 1.7%
Travel and subsistence 1 896 1 805 4 550 3 001 16.5% 16.7% 3 146 3 390 3 596 6.2% 13.4%Venues and facilities – 216 198 112 – 0.8% 579 613 647 79.4% 2.0%Payments for capital assets – – 295 267 – 0.8% 279 296 312 5.3% 1.2%Machinery and equipment – – 295 213 – 0.8% 223 237 250 5.5% 0.9%Software and other intangible assets
– – – 54 – 0.1% 56 59 62 4.7% 0.2%
Total 12 159 14 302 20 014 21 056 20.1% 100.0% 23 590 25 648 27 454 9.2% 100.0%Proportion of total programme expenditure to vote expenditure
19.9% 17.4% 17.9% 19.0% – – 18.9% 19.1% 19.1% – –
1. Estimates of National Expenditure data tables are available and can be downloaded from www.treasury.gov.za. These data tables contain detailed information by goods and services, and transfers and subsidies item by programme.
Personnel information Table 23.32 Civilian Oversight, Monitoring and Evaluations personnel numbers and cost by salary level¹
Number of posts estimated for
31 March 2017 Number and cost2 of personnel posts filled / planned for on funded establishment Number
Number of
funded posts
Number of posts
additional to the
establishment Actual Revised estimate Medium-term expenditure estimate
Averagegrowth
rate(%)
Average: Salary
level/Total(%)
2015/16 2016/17 2017/18 2018/19 2019/20 2016/17 - 2019/20 Civilian Oversight, Monitoring and Evaluations Number Cost
Unit Cost Number Cost
Unit Cost Number Cost
Unit Cost Number Cost
Unit Cost Number Cost
Unit Cost
Salary level 16 3 19 11.5 0.6 25 14.4 0.6 25 16.0 0.6 25 17.6 0.7 25 18.9 0.8 – 100.0%1 – 6 5 – 4 0.9 0.2 5 1.0 0.2 5 1.1 0.2 5 1.2 0.2 5 1.3 0.3 – 20.0%7 – 10 5 2 8 4.1 0.5 12 6.2 0.5 12 7.3 0.6 12 8.2 0.7 12 8.8 0.7 – 48.0%11 – 12 2 1 4 2.9 0.7 4 3.1 0.8 4 3.4 0.8 4 3.6 0.9 4 3.9 1.0 – 16.0%13 – 16 4 – 3 3.6 1.2 4 4.0 1.0 4 4.3 1.1 4 4.6 1.1 4 4.9 1.2 – 16.0%1. Data has been provided by the department and may not necessarily reconcile with official government personnel data.2. Rand million.
Entity1 Private Security Industry Regulatory Authority
Mandate The Private Security Industry Regulatory Authority was established in terms of section 2 of the Private Security Industry Regulation Act (2001), which replaced the Security Officers Act (1987). The entity is mandated to regulate the private security industry and to exercise effective control over the practice of the occupation of security service providers in the public and national interest, as well as in the interest of the private security industry itself. 1. This section has been compiled with the latest available information from the entity concerned.
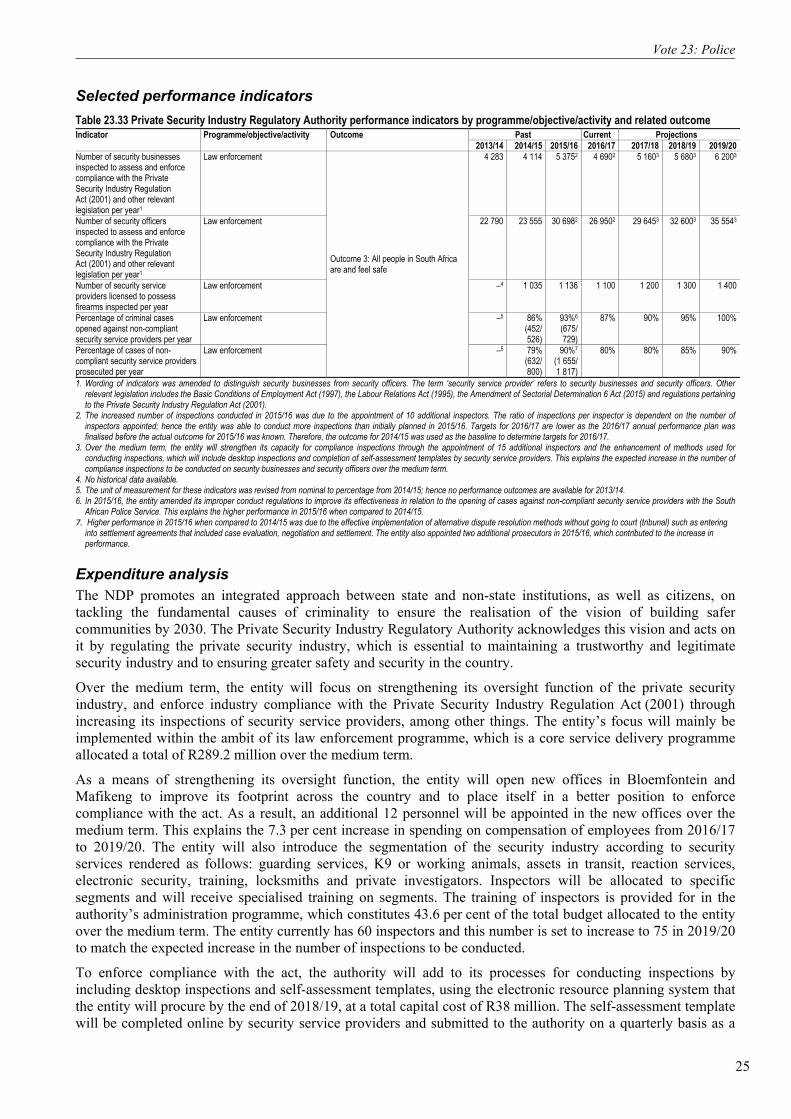
25
Vote 23: Police
Selected performance indicators Table 23.33 Private Security Industry Regulatory Authority performance indicators by programme/objective/activity and related outcome Indicator Programme/objective/activity Outcome Past Current Projections 2013/14 2014/15 2015/16 2016/17 2017/18 2018/19 2019/20 Number of security businesses inspected to assess and enforce compliance with the Private Security Industry Regulation Act (2001) and other relevant legislation per year1
Law enforcement
Outcome 3: All people in South Africa are and feel safe
4 283 4 114 5 3752 4 6902 5 1603 5 6803 6 2003
Number of security officers inspected to assess and enforce compliance with the Private Security Industry Regulation Act (2001) and other relevant legislation per year1
Law enforcement 22 790 23 555 30 6982 26 9502 29 6453 32 6003 35 5543
Number of security service providers licensed to possess firearms inspected per year
Law enforcement –4 1 035 1 136 1 100 1 200 1 300 1 400
Percentage of criminal cases opened against non-compliant security service providers per year
Law enforcement –5 86%(452/526)
93%6 (675/ 729)
87% 90% 95% 100%
Percentage of cases of non-compliant security service providers prosecuted per year
Law enforcement –5 79%(632/800)
90%7 (1 655/ 1 817)
80% 80% 85% 90%
1. Wording of indicators was amended to distinguish security businesses from security officers. The term ‘security service provider’ refers to security businesses and security officers. Other relevant legislation includes the Basic Conditions of Employment Act (1997), the Labour Relations Act (1995), the Amendment of Sectorial Determination 6 Act (2015) and regulations pertaining to the Private Security Industry Regulation Act (2001).
2. The increased number of inspections conducted in 2015/16 was due to the appointment of 10 additional inspectors. The ratio of inspections per inspector is dependent on the number of inspectors appointed; hence the entity was able to conduct more inspections than initially planned in 2015/16. Targets for 2016/17 are lower as the 2016/17 annual performance plan was finalised before the actual outcome for 2015/16 was known. Therefore, the outcome for 2014/15 was used as the baseline to determine targets for 2016/17.
3. Over the medium term, the entity will strengthen its capacity for compliance inspections through the appointment of 15 additional inspectors and the enhancement of methods used for conducting inspections, which will include desktop inspections and completion of self-assessment templates by security service providers. This explains the expected increase in the number of compliance inspections to be conducted on security businesses and security officers over the medium term.
4. No historical data available. 5. The unit of measurement for these indicators was revised from nominal to percentage from 2014/15; hence no performance outcomes are available for 2013/14. 6. In 2015/16, the entity amended its improper conduct regulations to improve its effectiveness in relation to the opening of cases against non-compliant security service providers with the South
African Police Service. This explains the higher performance in 2015/16 when compared to 2014/15. 7. Higher performance in 2015/16 when compared to 2014/15 was due to the effective implementation of alternative dispute resolution methods without going to court (tribunal) such as entering
into settlement agreements that included case evaluation, negotiation and settlement. The entity also appointed two additional prosecutors in 2015/16, which contributed to the increase in performance.
Expenditure analysis The NDP promotes an integrated approach between state and non-state institutions, as well as citizens, on tackling the fundamental causes of criminality to ensure the realisation of the vision of building safer communities by 2030. The Private Security Industry Regulatory Authority acknowledges this vision and acts on it by regulating the private security industry, which is essential to maintaining a trustworthy and legitimate security industry and to ensuring greater safety and security in the country.
Over the medium term, the entity will focus on strengthening its oversight function of the private security industry, and enforce industry compliance with the Private Security Industry Regulation Act (2001) through increasing its inspections of security service providers, among other things. The entity’s focus will mainly be implemented within the ambit of its law enforcement programme, which is a core service delivery programme allocated a total of R289.2 million over the medium term.
As a means of strengthening its oversight function, the entity will open new offices in Bloemfontein and Mafikeng to improve its footprint across the country and to place itself in a better position to enforce compliance with the act. As a result, an additional 12 personnel will be appointed in the new offices over the medium term. This explains the 7.3 per cent increase in spending on compensation of employees from 2016/17 to 2019/20. The entity will also introduce the segmentation of the security industry according to security services rendered as follows: guarding services, K9 or working animals, assets in transit, reaction services, electronic security, training, locksmiths and private investigators. Inspectors will be allocated to specific segments and will receive specialised training on segments. The training of inspectors is provided for in the authority’s administration programme, which constitutes 43.6 per cent of the total budget allocated to the entity over the medium term. The entity currently has 60 inspectors and this number is set to increase to 75 in 2019/20 to match the expected increase in the number of inspections to be conducted.
To enforce compliance with the act, the authority will add to its processes for conducting inspections by including desktop inspections and self-assessment templates, using the electronic resource planning system that the entity will procure by the end of 2018/19, at a total capital cost of R38 million. The self-assessment template will be completed online by security service providers and submitted to the authority on a quarterly basis as a

2017 Estimates of National Expenditure
26
mandatory requirement for the annual renewal of registration certificates for security service providers. In instances where the entity suspects irregularities in the information provided, inspectors will be deployed to the security service providers to investigate further. The introduction of these methods for conducting inspections is expected to lead to an increase in the number of annual inspections conducted on both security businesses and security officers. The entity anticipates that, in 2019/20, the number of inspections conducted on security businesses will increase to 6 200 and the number of inspections conducted on security officers will increase to 35 554.
Revenue is generated from registration fees and levies collected from registered security service providers. The entity expects an increase in the number of security service providers to be registered over the medium term as a result of the planned appointment of 15 additional inspectors and the enhancement of methods used for conducting inspections to include desktop inspections and completion of self-assessment templates by security service providers. The segmentation process will lead to increased revenue, as each type of registration form submitted will be paid for separately. The entity’s revenue is set to increase from R236.6 million in 2016/17 to R265.8 million in 2019/20.
Programmes/objectives/activities Table 23.34 Private Security Industry Regulatory Authority expenditure trends and estimates by programme/objective/activity
Audited outcome Revisedestimate
Averagegrowth
rate(%)
Average:Expen-diture/
Total(%)
Medium-term expenditure estimate
Averagegrowth
rate(%)
Average:Expen-diture/
Total(%)
R thousand 2013/14 2014/15 2015/16 2016/17 2013/14 - 2016/17 2017/18 2018/19 2019/20 2016/17 - 2019/20 Administration 63 670 76 718 90 943 100 409 16.4% 47.4% 109 969 111 174 115 991 4.9% 43.6%Law enforcement 56 999 56 044 68 895 87 657 15.4% 38.4% 88 381 96 708 104 109 5.9% 37.5%Communication, training and registration 16 475 15 963 25 481 48 567 43.4% 14.3% 50 298 44 479 45 745 -2.0% 18.9%Total 137 144 148 725 185 319 236 633 19.9% 100.0% 248 648 252 361 265 845 4.0% 100.0%
Statements of historical financial performance and position Table 23.35 Private Security Industry Regulatory Authority statements of historical financial performance and position Statement of financial performance
Budget Audited outcome Budget
Audited outcome Budget
Audited outcome
Budget estimate
Revised estimate
Average:Outcome/
Budget (%)
R thousand 2013/14 2014/15 2015/16 2016/17 2013/14 - 2016/17 Revenue Non-tax revenue 173 906 128 505 184 049 131 220 198 057 216 442 236 633 236 633 89.9%Sale of goods and services other than capital assets
128 031 118 098 145 733 121 917 184 251 203 400 225 149 225 148 97.9%
of which: Administrative fees 128 031 115 537 145 733 119 422 184 251 203 400 225 149 225 148 97.1%Sales by market establishment – 2 561 – 2 495 – – – – – Other non-tax revenue 45 875 10 407 38 316 9 303 13 806 13 041 11 484 11 485 40.4%Transfers received 1 520 2 145 1 899 778 1 600 – – – 58.2%Total revenue 175 426 130 650 185 948 131 998 199 657 216 442 236 633 236 633 89.7%Expenses Current expenses 166 345 137 144 168 461 148 725 199 657 185 319 236 633 236 633 91.8%Compensation of employees 79 864 65 331 82 992 83 823 96 230 95 902 113 215 113 215 96.2%Goods and services 80 982 69 073 82 619 62 294 95 774 86 419 113 397 113 397 88.8%Depreciation 5 500 2 712 2 797 2 598 7 596 2 983 10 021 10 021 70.7%Interest, dividends and rent on land – 28 53 10 57 15 – – 48.2%Total expenses 166 345 137 144 168 461 148 725 199 657 185 319 236 633 236 633 91.8%Surplus/(Deficit) 9 081 (6 494) 17 487 (16 727) – 31 123 – –
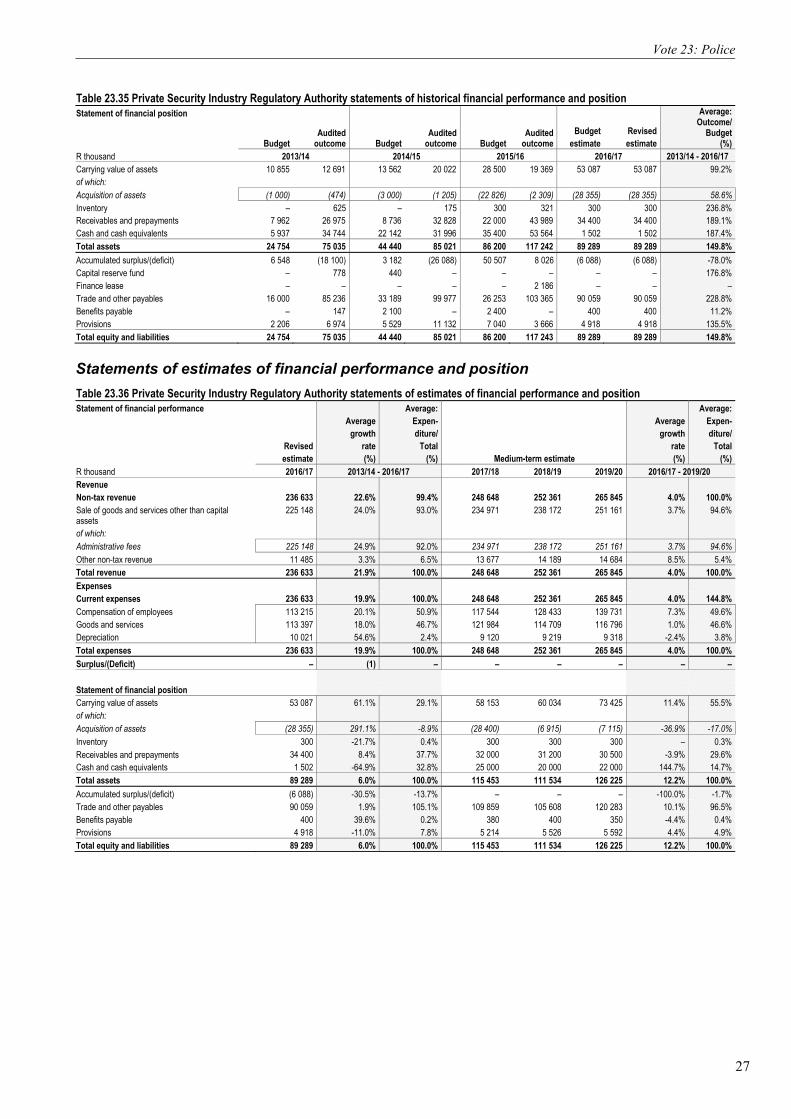
27
Vote 23: Police
Table 23.35 Private Security Industry Regulatory Authority statements of historical financial performance and position Statement of financial position
Budget Audited outcome Budget
Audited outcome Budget
Audited outcome
Budget estimate
Revisedestimate
Average:Outcome/
Budget (%)
R thousand 2013/14 2014/15 2015/16 2016/17 2013/14 - 2016/17 Carrying value of assets 10 855 12 691 13 562 20 022 28 500 19 369 53 087 53 087 99.2%of which: Acquisition of assets (1 000) (474) (3 000) (1 205) (22 826) (2 309) (28 355) (28 355) 58.6%Inventory – 625 – 175 300 321 300 300 236.8%Receivables and prepayments 7 962 26 975 8 736 32 828 22 000 43 989 34 400 34 400 189.1%Cash and cash equivalents 5 937 34 744 22 142 31 996 35 400 53 564 1 502 1 502 187.4%Total assets 24 754 75 035 44 440 85 021 86 200 117 242 89 289 89 289 149.8%Accumulated surplus/(deficit) 6 548 (18 100) 3 182 (26 088) 50 507 8 026 (6 088) (6 088) -78.0%Capital reserve fund – 778 440 – – – – – 176.8%Finance lease – – – – – 2 186 – – – Trade and other payables 16 000 85 236 33 189 99 977 26 253 103 365 90 059 90 059 228.8%Benefits payable – 147 2 100 – 2 400 – 400 400 11.2%Provisions 2 206 6 974 5 529 11 132 7 040 3 666 4 918 4 918 135.5%Total equity and liabilities 24 754 75 035 44 440 85 021 86 200 117 243 89 289 89 289 149.8%
Statements of estimates of financial performance and position Table 23.36 Private Security Industry Regulatory Authority statements of estimates of financial performance and position Statement of financial performance
Revised estimate
Averagegrowth
rate(%)
Average:Expen-diture/
Total(%) Medium-term estimate
Averagegrowth
rate(%)
Average:Expen-diture/
Total(%)
R thousand 2016/17 2013/14 - 2016/17 2017/18 2018/19 2019/20 2016/17 - 2019/20 Revenue Non-tax revenue 236 633 22.6% 99.4% 248 648 252 361 265 845 4.0% 100.0%Sale of goods and services other than capital assets
225 148 24.0% 93.0% 234 971 238 172 251 161 3.7% 94.6%
of which: Administrative fees 225 148 24.9% 92.0% 234 971 238 172 251 161 3.7% 94.6%Other non-tax revenue 11 485 3.3% 6.5% 13 677 14 189 14 684 8.5% 5.4%Total revenue 236 633 21.9% 100.0% 248 648 252 361 265 845 4.0% 100.0%Expenses Current expenses 236 633 19.9% 100.0% 248 648 252 361 265 845 4.0% 144.8%Compensation of employees 113 215 20.1% 50.9% 117 544 128 433 139 731 7.3% 49.6%Goods and services 113 397 18.0% 46.7% 121 984 114 709 116 796 1.0% 46.6%Depreciation 10 021 54.6% 2.4% 9 120 9 219 9 318 -2.4% 3.8%Total expenses 236 633 19.9% 100.0% 248 648 252 361 265 845 4.0% 100.0%Surplus/(Deficit) – (1) – – – – – – Statement of financial position Carrying value of assets 53 087 61.1% 29.1% 58 153 60 034 73 425 11.4% 55.5%of which: Acquisition of assets (28 355) 291.1% -8.9% (28 400) (6 915) (7 115) -36.9% -17.0%Inventory 300 -21.7% 0.4% 300 300 300 – 0.3%Receivables and prepayments 34 400 8.4% 37.7% 32 000 31 200 30 500 -3.9% 29.6%Cash and cash equivalents 1 502 -64.9% 32.8% 25 000 20 000 22 000 144.7% 14.7%Total assets 89 289 6.0% 100.0% 115 453 111 534 126 225 12.2% 100.0%Accumulated surplus/(deficit) (6 088) -30.5% -13.7% – – – -100.0% -1.7%Trade and other payables 90 059 1.9% 105.1% 109 859 105 608 120 283 10.1% 96.5%Benefits payable 400 39.6% 0.2% 380 400 350 -4.4% 0.4%Provisions 4 918 -11.0% 7.8% 5 214 5 526 5 592 4.4% 4.9%Total equity and liabilities 89 289 6.0% 100.0% 115 453 111 534 126 225 12.2% 100.0%

2017 Estimates of National Expenditure
28
Personnel information Table 23.37 Private Security Industry Regulatory Authority personnel numbers and cost by salary level
Number of posts estimated for 31 March 2017 Number and cost1 of personnel posts filled / planned for on funded establishment Number
Number of
funded posts
Number of
posts on approved
establishment Actual Revised estimate
Medium-term expenditure estimate
Averagegrowth
rate(%)
Average:Salary
level/Total(%)
2015/16 2016/17 2017/18 2018/19 2019/20 2016/17 - 2019/20 Private Security Industry Regulatory Authority Number Cost
Unit cost Number Cost
Unit cost Number Cost
Unit cost Number Cost
Unit cost Number Cost
Unit cost
Salary level 274 297 268 95.9 0.4 297 113.2 0.4 301 117.5 0.4 304 128.4 0.4 307 139.7 0.5 7.3% 100.0%1 – 6 92 75 74 13.3 0.2 75 15.3 0.2 75 14.8 0.2 78 16.5 0.2 78 18.8 0.2 7.0% 25.3%7 – 10 155 192 169 61.0 0.4 192 70.9 0.4 196 75.4 0.4 196 82.4 0.4 194 88.1 0.5 7.5% 64.4%11 – 12 20 23 18 12.2 0.7 23 17.0 0.7 23 17.3 0.8 23 18.4 0.8 28 20.8 0.7 7.0% 8.0%13 – 16 7 7 7 9.4 1.3 7 10.0 1.4 7 10.0 1.4 7 11.1 1.6 7 12.1 1.7 6.5% 2.3%1. Rand million.
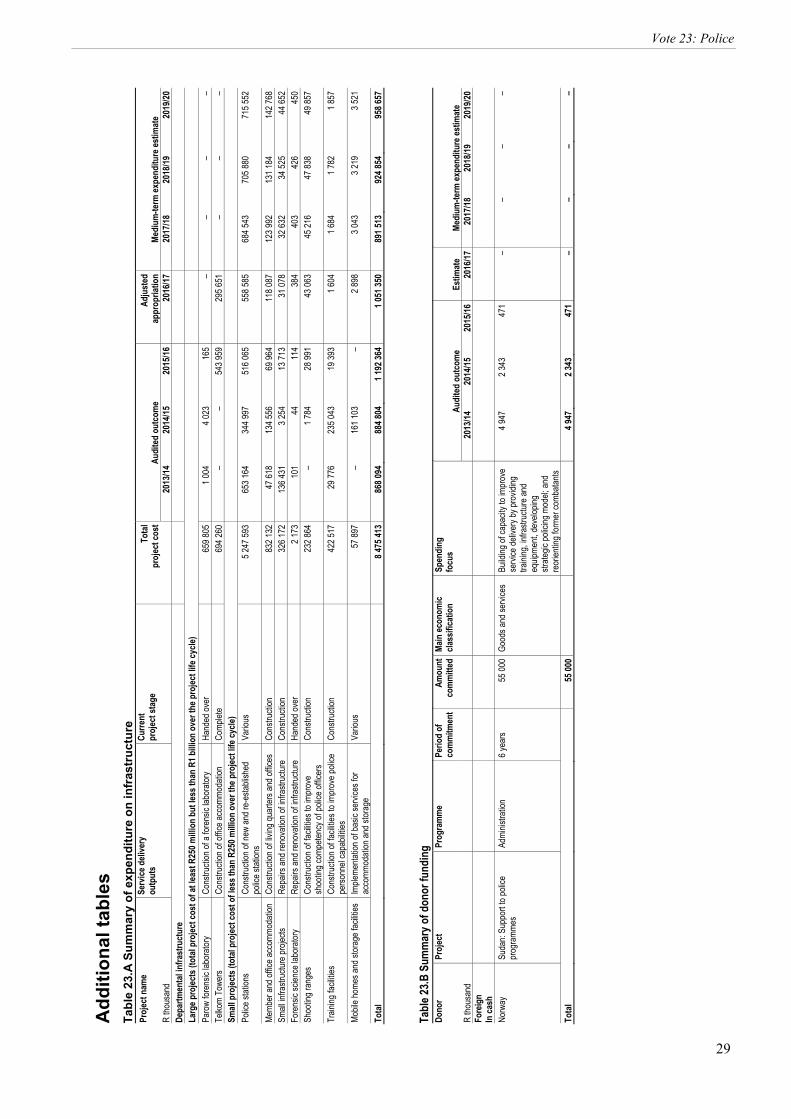
29
Vote 23: Police
Add
ition
al ta
bles
Ta
ble
23.A
Sum
mar
y of
exp
endi
ture
on
infr
astr
uctu
rePr
ojec
t nam
e S
ervic
e deli
very
o
utpu
ts
Cur
rent
p
rojec
t sta
ge
Tota
lpr
ojec
t cos
t A
udite
d ou
tcom
e A
djus
ted
appr
opria
tion
Med
ium
-term
expe
nditu
re es
timat
e R
thous
and
20
13/14
20
14/15
20
15/16
20
16/17
20
17/18
20
18/19
20
19/20
De
partm
enta
l infra
stru
ctur
e
Larg
e pro
jects
(tot
al pr
ojec
t cos
t of a
t lea
st R
250 m
illion
but
less
than
R1 b
illion
ove
r the
pro
ject l
ife cy
cle)
Pa
row
foren
sic la
bora
tory
Cons
tructi
on of
a for
ensic
labo
rator
y Ha
nded
over
65
9 805
1 004
4 0
2316
5 –
–
–
–
Te
lkom
Towe
rs Co
nstru
ction
of of
fice a
ccom
moda
tion
Comp
lete
694 2
60 –
–
54
3 959
295 6
51 –
–
–
Sm
all p
rojec
ts (t
otal
proj
ect c
ost o
f les
s tha
n R2
50 m
illion
ove
r the
pro
ject l
ife cy
cle)
Polic
e stat
ions
Cons
tructi
on of
new
and r
e-es
tablis
hed
polic
e stat
ions
Vario
us
5 247
593
653 1
64
344 9
9751
6 065
558 5
8568
4 543
705 8
8071
5 552
Memb
er an
d offic
e acc
ommo
datio
n Co
nstru
ction
of liv
ing qu
arter
s and
offic
es
Cons
tructi
on
832 1
3247
618
134 5
5669
964
118 0
8712
3 992
131 1
8414
2 768
Sm
all in
frastr
uctur
e pro
jects
Repa
irs an
d ren
ovati
on of
infra
struc
ture
Cons
tructi
on
326 1
7213
6 431
3 2
5413
713
31 07
832
632
34 52
544
652
Fore
nsic
scien
ce la
bora
tory
Repa
irs an
d ren
ovati
on of
infra
struc
ture
Hand
ed ov
er
2 173
101
4411
438
440
342
645
0 Sh
ootin
g ran
ges
Cons
tructi
on of
facil
ities t
o imp
rove
sh
ootin
g com
peten
cy of
polic
e offic
ers
Cons
tructi
on
232 8
64 –
1 7
8428
991
43 06
345
216
47 83
849
857
Train
ing fa
cilitie
s Co
nstru
ction
of fa
cilitie
s to i
mpro
ve po
lice
perso
nnel
capa
bilitie
s Co
nstru
ction
42
2 517
29 77
6 23
5 043
19 39
31 6
041 6
841 7
821 8
57
Mobil
e hom
es an
d stor
age f
acilit
ies
Imple
menta
tion o
f bas
ic se
rvice
s for
ac
comm
odati
on an
d stor
age
Vario
us
57 89
7 –
16
1 103
–
2 898
3 043
3 219
3 521
Tota
l 8 4
75 41
386
8 094
88
4 804
1 192
364
1 051
350
891 5
1392
4 854
958 6
57
Tabl
e 23.B
Sum
mar
y of d
onor
fund
ing
Do
nor
Proj
ect
Prog
ram
me
Perio
d of
co
mm
itmen
t A
mou
ntco
mm
itted
Ma
in ec
onom
ic cla
ssifi
catio
n
Spen
ding
fo
cus
Aud
ited
outc
ome
Est
imat
e M
ediu
m-te
rm ex
pend
iture
estim
ate
R tho
usan
d
2013
/14
2014
/15
2015
/16
2016
/17
2017
/18
2018
/19
2019
/20
Fore
ign
In ca
sh
No
rway
Su
dan:
Supp
ort to
polic
e pr
ogra
mmes
Ad
minis
tratio
n 6 y
ears
55 00
0Go
ods a
nd se
rvice
s Bu
ilding
of ca
pacit
y to i
mpro
ve
servi
ce de
liver
y by p
rovid
ing
traini
ng, in
frastr
uctur
e and
eq
uipme
nt, de
velop
ing
strate
gic po
licing
mod
el; an
d re
orien
ting f
orme
r com
batan
ts
4 94
7 2
343
471
–
–
–
–
Tota
l
55 00
0
4 9
472 3
4347
1 –
–
–
–
2017 Estimates of National Expenditure
30


ESTIMATES OF NATIONAL EXPENDITURE
BUDGET
2017
Private Bag X115, Pretoria, 0001 | 40 Church Square, Pretoria, 0002Tel +27 12 315 5944 | Fax +27 12 395 6697


