181 VOTE 5 Education Operational budget R 32 616 784 486 MEC remuneration R 1 491 514 Total amount to be appropriated R 32 618 276 000 Responsible MEC Mr. E. Mchunu, MEC for Education Administrating department Education Accounting officer Head: Education 1. Overview Vision The vision of the Department of Education is: A well educated, skilled and highly developed citizenry. Mission statement The department’s mission is: To provide equitable access to quality education for the people of KwaZulu-Natal. Strategic goals Strategic policy directions: These are directly linked to the national government’s 12 outcomes which also inform the department’s strategic goals and objectives, as listed below: • Quality basic education; and • Skilled and capable workforce to support an inclusive growth path. Six strategic goals encapsulate the department’s contribution towards the achievement of national and provincial goals, and all other international mandates within the context of the Medium-Term Strategic Framework 2010-2014 for the current electoral cycle, and national and provincial action plans. Hereunder are the department’s strategic goals: • Broaden access to education and provide resources; • Improve schools’ functionality and educational outcomes at all levels; • Develop human resource and organisational capacity and enhance skills; • Develop schools into centres of community focus, care and support; • Ensure good corporate governance, management and an efficient administration; and • Promote national identity and social cohesion. Core functions The core functions of the department are summarised below: Public Ordinary Schools This is the department’s primary function aimed at the provision of educators in schools, the development of educators to ensure that they are equipped to provide the best quality teaching and the provision of
Transcript
181
VOTE 5 Education Operational budget R 32 616 784 486 MEC remuneration R 1 491 514 Total amount to be appropriated R 32 618 276 000 Responsible MEC Mr. E. Mchunu, MEC for Education Administrating department Education Accounting officer Head: Education
1. Overview
Vision
The vision of the Department of Education is: A well educated, skilled and highly developed citizenry.
Mission statement
The department’s mission is: To provide equitable access to quality education for the people of KwaZulu-Natal.
Strategic goals
Strategic policy directions: These are directly linked to the national government’s 12 outcomes which also inform the department’s strategic goals and objectives, as listed below:
• Quality basic education; and
• Skilled and capable workforce to support an inclusive growth path.
Six strategic goals encapsulate the department’s contribution towards the achievement of national and provincial goals, and all other international mandates within the context of the Medium-Term Strategic Framework 2010-2014 for the current electoral cycle, and national and provincial action plans. Hereunder are the department’s strategic goals:
• Broaden access to education and provide resources;
• Improve schools’ functionality and educational outcomes at all levels;
• Develop human resource and organisational capacity and enhance skills;
• Develop schools into centres of community focus, care and support;
• Ensure good corporate governance, management and an efficient administration; and
• Promote national identity and social cohesion.
Core functions
The core functions of the department are summarised below:
Public Ordinary Schools This is the department’s primary function aimed at the provision of educators in schools, the development of educators to ensure that they are equipped to provide the best quality teaching and the provision of
Estimates of Provincial Revenue and Expenditure
182
Learner Teacher Support Materials (LTSM). Also included here is the provision of new schools and school facilities, effective maintenance of existing facilities, as well as monitoring of the quality of education services through the system of whole school evaluation. Lastly, the function includes the provision of food to Public Ordinary School learners from the poorest communities, through the National School Nutrition Programme (NSNP).
Public Special School Education The aim of this programme is to provide public education in special schools and full-service schools.
Further Education and Training (FET) This service is aimed specifically at providing market-related skills, to ensure that learners are employable on completion of training at this level.
Early Childhood Development (ECD) This service evolved as a national initiative to strengthen pre-Grade R education, and to make it available to the majority of citizens.
Adult Basic Education This programme aims to increase the level of skills and reduce the adult illiteracy rate, to enable adults to participate in economic and other structures in the province and the country.
Legislative mandates
The following pieces of legislation, among others, govern the operations of the department:
• Constitution of the Republic of South Africa, No. 108 of 1996
• Public Service Act, No. 103 of 1994
• National Education Policy Act (NEPA), No. 27 of 1996
• South African Schools Act (SASA), No. 84 of 1996
• Employment of Educators Act, No. 76 of 1998
• Further Education and Training Colleges (FETC) Act, No. 16 of 2006
• Adult Basic Education and Training Act, No. 52 of 2000
• South African Council for Educators (SACE) Act, No. 31 of 2000
• South African Qualifications Authority (SAQA) Act, No. 58 of 1995
• National Policy on HIV and AIDS for Learners and Educators in Public Schools and Students and Educators in FET Institutions, 1999
• Education White Paper 5 on Early Childhood Development, 2000
• Education White Paper 6 on Inclusive Education, 2001
• Revised National Curriculum Statement (RNCS), 2002
• Labour Relations Act, No. 66 of 1995
• Employment Equity Act, No. 55 of 1998
• Public Finance Management Act, No. 1 of 1999, as amended and Treasury Regulations
• KZN Provincial SCM Policy Framework of 2006
• Preferential Procurement Policy Framework Act, No. 5 of 2000
• Promotion of Access to Information Act, No. 2 of 2000
Vote 5: Education
183
2. Review of the 2010/11 financial year
Section 2 provides a review of 2010/11, outlining the main achievements and progress made by the department during the year, as well as providing a brief discussion on challenges and new developments.
Public sector strike The department was negatively affected by the public sector strike which lasted from 10 August to 16 September 2010. During this period, it was reported that 90 per cent of schools experienced a complete shut-down. Notwithstanding the loss of teaching and learning time, the matric results of 2010 improved drastically, from 61.1 per cent in 2009 to 70.7 per cent in 2010.
Improving the conditions of service for public servants and educators During 2010/11, the wage dispute was settled at 2.2 per cent above the budgeted increase, and the housing allowance was increased to R800 per month from R500 per month for employees on levels 1 to 10. This wage increase, combined with the carry-through costs of the 2009 under-funded wage agreement, put pressure on the funding for 2010/11, which resulted in some activities being put on hold, especially under ECD.
Public Ordinary Schools The promotion of access to, and participation of historically marginalised groups in education, continued, and the success thereof was evident in the accommodation of all applicants in schools. The department increased the number of No Fee schools from 3 513 to 4 739, including farm schools, rendering close to 80 per cent of the schools in KZN as No Fee schools. The high increase was brought about by the deeming of Quintile 3 schools as No Fee schools, provided they would not be financially adversely affected. Furthermore, for the first time, Quintiles 4 and 5 schools, which had enrolled learners in the previous year for whom a fee exemption had been granted, were reimbursed provided they met all the relevant criteria.
The NSNP was expanded to cover all primary schools in Quintiles 1, 2 and 3 and secondary schools in Quintiles 1 and 2. A deviation was granted by the Department of Basic Education, to the effect that the department may continue to feed primary schools in Quintiles 4 and 5, provided that the minimum requirements of the NSNP conditional grant are being met. Like most programmes, the capacity of NSNP to spend was affected by the public sector strike.
Examinations The 2010 school year saw the department conduct various types of examinations, which included the National Senior Certificate (NSC) examinations, the National Senior Certificate Common Tests for Grade 11 and 12 (on a quarterly basis), as well as the Common Task for Assessments (CTAs) set by the KZN Department of Education and administered to all Grade 9 learners in the province.
Of the 122 444 Grade 12 candidates who sat for the National Curriculum Statement (NCS) examination in 2010, 86 556 passed, achieving a pass-rate of 70.7 per cent, a marked improvement of 9.6 per cent compared to the pass rate of 2009. All systems were in place, and the necessary risk analysis and security checks were conducted to deliver a credible examination, without compromising integrity.
Learner Transport Programme This programme has not experienced much progress or expansion largely due to delays in the transfer of the programme to the Department of Transport relating to delays in signing of the Memorandum of Agreement. The process of transferring some aspects of Learner Transport to the Department of Transport is at a final stage, with the actual hand-over being planned for the beginning of 2011/12. Depending on the progress in this regard, funds will be transferred to the Department of Transport during the 2011/12 Adjustments Estimate.
The review of the implementation of the National Curriculum Statement The 2009 school year saw the first cohort of learners, who entered the education system in Grade 1 in 1998 based on the Outcomes Based Education, writing their NCS examinations. After its implementation,
Estimates of Provincial Revenue and Expenditure
184
the NCS was reviewed under the guidance of the Minister of Basic Education, and the criticism was on the administrative burden on teachers and the under-performance of learners in international tests. The recommendations, which are currently being implemented, were as follows:
• Rationalise the current NCS documents into a single set of simple and coherent curriculum documents per subject per phase from grade R to grade 12;
• Conduct regular external annual assessments in Mathematics, Home Language and English First Additional Language (FAL) in Grades 3, 6 and 9;
• Introduce the teaching of English as a subject, parallel to Home Language, from Grade 1 for learners who will use English as a language of learning and teaching from Grade 4;
• Reduce the overload in the intermediate phase by reducing the number of subjects to six subjects;
• Ensure that teacher training is strengthened and in-service training is provided where it is needed; and
• Re-assert the role of textbooks, develop a national catalogue of textbooks and plan for provision of textbooks for all learners for every subject.
Strategy for improving Grade 12 results and National Strategy for Learner Attainment In addition to the National Strategy for Learner Attainment (NSLA), which is a transversal programme directing the focus of the education system to improve the results of all Grade 12 learners, the department implemented a strategy aimed specifically at improving Grade 12 results in schools, where the pass rate of the school is less than 50 per cent, while encouraging better performing schools to improve their performance even further.
Based on the number of schools in the various performance ranges, the NSLA has borne fruit. The table below shows the overall improvement in schools when comparing the performance of 2008 to 2010.
Improvement in performance of schools per performance range
Infrastructure The department continued to make strides in addressing backlogs in the provision of classrooms, toilets, computer rooms, laboratories and media centres within the context of capacity challenges that exist within the department and the infrastructure industry as a whole. The department continued to implement existing programmes, and initiated new programmes based on new needs and new policy directives, notwithstanding the continuously rising construction costs.
The department explored alternative building materials for infrastructure provisioning, through building ECD classrooms that are add-ons. All new primary schools that are now constructed have ECD classrooms built as part of the scope, and this provides a challenge with expenditure allocation, as schools’ expenditure falls under Programme 2: Public Ordinary School Education, while ECD falls under Programme 7: Early Childhood Development.
The electrification programme continues to be rolled-out by the Department of Minerals and Energy, while the provision and maintenance of solar electrical systems by the department needs to be reconsidered, in light of rampant vandalism of these installations.
The gazetting of the Minimum Uniform Norms and Standards for Infrastructure in early 2010, which now constitutes a planning guide, enabled the department to undertake an assessment of how its infrastructure compares to various norms as stipulated. This will, in the forthcoming years, enable the implementation of the infrastructure programme based on such plans.
Vote 5: Education
185
Public Special School Education In an effort to increase access to education for all learners, particularly learners experiencing barriers to learning, the department scaled up the implementation of Inclusive Education. Learners that require low, moderate and high levels of support are accommodated in ordinary, full-service and special schools, respectively.
To date, 50 ordinary schools are being converted to full-service schools, and 13 special schools as resource centres. Due to the unequal distribution of facilities for learners experiencing barriers to learning, the majority of these facilities are located in rural areas, as these areas are inadequately provided for. The construction of three new special schools did not go according to plan, due to the implementing agent’s inability to deliver. Assistive devices, such as Braille machines for learners, were ordered and delivered to schools, and this will go a long way to ensure quality learning for learners with special needs.
Buses were procured and delivered to 20 special schools that either had inadequate transport or had no transport at all.
Further Education and Training (FET) In 2010/11, the budget for FET was administered as a conditional grant, due to the change in the location of the programme at a national level. Notwithstanding this change, the province remains responsible for over-seeing the functions of the FET colleges and, as such, a protocol agreement was signed between the Department of Higher Education and Training and the provincial Departments of Education.
The department had anticipated that all employees of FET colleges will, with effect from 2010/11, be appointed by the college councils. However, this has not happened to date due to the fact that the legislation has not yet been amended since the creation of the new Department of Higher Education and Training, resulting in the restructuring of the programme budget.
The colleges continued to offer both the National Certificate (Vocational) [NC(V)] and National Education (NATED) programmes in the FET colleges sector, which have enabled the colleges to:
• Increase the pool of local skills, thus reducing the skills shortage;
• Generate a cohort of employable persons, thus reducing poverty;
• Contribute towards self-employment; and
• Provide a platform for employability and self-actualisation.
Adult Basic Education and Training (ABET) The norms and standards for ABET, which allow for progressive implementation thereof, were introduced in 2009/10, however this process was halted due to additional work that needed to be undertaken. Notwithstanding this, the province continued with assessing the readiness of the Public Adult Learning Centres (PALCs) to implement the norms, including the auditing of the various centres to ensure that they run the curricula according to indicated standards, and that they have capabilities to administer their own operations through governance structures. The department awaits direction from the national office in respect of the way forward.
Early Childhood Development (ECD) This programme felt the effect of cost-cutting more than any other programme during the 2009/10 cost-cutting drive, as various ECD activities were put on hold and funds reprioritised to other areas with spending pressures. Various items of LTSM were ordered in 2010/11 to ensure that the learners are not disadvantaged in any way. The department ensured that all Grade 1 learners have gone through Grade R. The salaries of all practitioners was increased from R3 000 to R3 500 per month. In ensuring that there is a supply of educators for Grade R, the department continued to invest in enrolling some practitioners in related studies.
Estimates of Provincial Revenue and Expenditure
186
3. Outlook for the 2011/12 financial year
Section 3 looks at the key focus areas of 2011/12, outlining what the department is hoping to achieve during the year, as well as briefly looking at the challenges, and proposed new developments.
Policy changes and reviews The 2009 Programme of Action from the Presidency, as well as the Medium-Term Strategic Framework, raised critical issues around output based measurements with specific reference to measurement of learner performance, delivery of relevant learner and teacher support material and improvement in the performance of learners. These pronouncements have a profound impact on the performance of the department, as it generally has high learner numbers. Therefore, the performance of the learners in KZN has a significant bearing on the overall performance of the country. To this end, the department needs to build on the successes of 2010’s performance.
Arising from the 2009 Programme of Action, the plan known as Towards the realisation of Schooling 2025 was conceptualised. Schooling 2025 is a long-term plan aimed at the improvement of the schooling system to ensure that education is prioritised as the main lever to alleviate poverty. Schooling 2025 is an integrated plan for which and through which the education sector will be held accountable. This plan seeks to consolidate all existing public commitments and priorities and will flag priorities and key measurable areas of performance for all levels, including schools.
Due to its long-term nature, the plan has been broken down into manageable five-year cycles, termed ‘Action Plans’, the first being the Action Plan to 2014 which sees 2011/12 as its second year of implementation. This plan focuses on three types of goals, these being:
• Output goals, which focus on what the quality of learning outcomes should be, in measurable terms or how grade attainment indicators should be improved;
• Foreground goals, which focus on what the society can observe directly, such as smaller classes; and
• Background goals, which relate to the improvements in administration and governance.
The department will also continue with its drive to convert some Section 20 schools into Section 21 schools, where they will perform the functions performed by Section 21 schools and the department will not need to keep petty cash for such schools.
Public Ordinary Schools This programme houses most of the goals and targets that are contained in the Schooling 2025 Action Plan. To this end, the Annual National Assessments that will be conducted at various exit points will have a direct impact on this programme in terms of implementing the outcomes of the assessments.
Teachers and the teaching process There are a number of interventions to improve the rate at which new, young and appropriately trained teachers enter the teaching profession. These include the placement of Funza Lushaka bursary holders into schools, the awarding of bursaries to non-employees for them to pursue a teaching profession, and the upgrading of unqualified and under-qualified educators who are already in the system.
A large scale training process is underway with a view to ensure that, when changes are implemented in the curriculum, educators are well poised to pass on the knowledge to the learners.
At the beginning of the school year, the department will hold an education summit which will, inter-alia, indicate to the various stakeholders where the department sees itself in the current year. This will ensure that the greater public can hold the department accountable for its plan.
Availability of textbooks, workbooks and other educational material In 2011/12, the department will continue to ensure that all Section 20 schools have the necessary supply of learner and teacher support material on the first day of school.
Vote 5: Education
187
The poor quality of desks and chairs that have previously been supplied to schools is of concern to the department. In order to circumvent this, the department has resolved to only deal with registered manufacturers. However, it must be emphasised that this quality control mechanism can only be enforced in respect of Section 20 schools. The department is exploring partnering possibilities with the Department of Correctional Services with a view to utilising the prisoners to make such desks and chairs in the future.
School infrastructure As mentioned earlier, the school infrastructure provision will be informed by the planning process undertaken in terms of the Minimum Uniform Norms and Standards for Infrastructure. To this end, there are two types of classifications of infrastructure, taking into account a school as a unit of measure, namely, basic functionality and optimum functionality.
To this end, the department intends to deal with the issues of basic functionality as a first phase and this will include projects such as water provision, sanitation, electricity and security, together with the eradication of inappropriate structures. Thereafter, issues of eliminating gross overcrowding, where a school is provided with all facilities required for optimum functionality, will be tackled, and the last phase will be curriculum redress where a school will be provided with a specific, targeted resource, e.g. laboratory, computer room, media centre, etc., to enhance the delivery of the curriculum.
Taking into account the available funding, the department will be pursuing the clustering of schools largely in matters of curriculum redress as a first step of eliminating disparities.
Learner well-being (NSNP) The department acknowledges the use of a school as a location to promote access to children for a full range of public health and poverty reduction interventions. The goal of the department is to develop schools into centres of community development, care, support and agents for nation building.
The goal of the NSNP is to enhance learning capacity and to promote access to education through the provision of nutritious meals to poor learners. In 2011/12, this programme will be extended to cover Quintile 3 secondary schools and thus increase coverage to 2 087 001 learners. Half of the schools in the programme do not have proper food storage and cooking facilities and, as a result, containers have been sourced for cooking and storage purposes. In future, all new schools will have fully equipped kitchens as part of their basic design. It is the intention that economic spin-offs, which have so far been generated by the programme, are extended.
The No Fee policy, which now applies to 4 567 KZN schools, means that a majority of poor learners have been granted access to education. The schools in the upper quintiles, which grant fee exemptions to poor learners, will continue to benefit from the re-imbursement programme, provided that they meet certain criteria.
The Orphaned and Vulnerable Children (OVC) will benefit from the R12 000 allocation per school which is payable directly to the school. Through the HIV and AIDS grant, continuous HIV and AIDS awareness programmes will be given to learners and teachers. Furthermore, the department will continue to assist learners with eye-testing programmes.
Public Special School Education The department will continue with the scaling up of the implementation of the inclusive education strategy. Notwithstanding the inability of the implementing agent to deliver on the construction of new special schools that commenced during 2010/11, the department remains hopeful that the situation will improve in 2011/12.
It is the intention to strengthen the human resource capacity of the educators in special schools through the offering of tailor-made programmes. As part of the monitoring and evaluation aspect, the department will revisit the communities and partner with other departments with a view to ensuring that all learners with special needs are accommodated in schools closest to them.
Estimates of Provincial Revenue and Expenditure
188
Adult Basic Education and Training The norms and standards for ABET, which allow for progressive implementation thereof which were supposed to be implemented in 2010/11, have been put on hold until the re-scoping work that is being done and the separation of functions and responsibilities between the Department of Basic Education and the Department of Higher Education and Training is completed.
Learner Transport Programme The province opted to pursue the approach whereby the provincial Department of Transport will commence with the provision of learner transport as part of the integrated public transportation programme, and the Department of Education will provide the planning data. In this regard, learner transport needs have been determined at various districts, based largely on the distance travelled. However, until the learner transport and public transport programmes have been merged, the Department of Education will maintain the current provision.
HIV and AIDS A two-pronged approach will be used to deliver the HIV and AIDS Life-skills Programme: the targeted approach and the mainstream approach. The former focuses on vulnerable groups and the latter seeks to provide all beneficiaries in schools with life-skills.
As a response to the high prevalence of OVC in the province, 1 500 schools with the highest prevalence of OVC will receive a budget of R12 000 per school, for care and support of OVC. Learners are provided with services like a focussed life-skills programme, psycho-social support, nutrition and other services depending on their particular needs.
A total of 7 896 educators will be trained in the integration of life-skills into the curriculum, lay counselling, care and support, and 600 learners will be trained in peer education.
4. Receipts and financing
4.1 Summary of receipts and financing
Table 5.1 below shows the sources of funding for Vote 5: Education over the seven-year period 2007/08 to 2013/14. The table also compares actual and budgeted receipts against actual and budgeted payments. As illustrated, the total receipts for Vote 5 increase from R18.734 billion in 2007/08 to R36.492 billion in 2013/14. The department receives its allocation through a provincial allocation and conditional grants. The equitable share allocation has grown from R17.857 billion in 2007/08 to R32.886 billion in 2013/14, while the conditional grant has increased from R876.773 million to R3.606 billion in the same period.
The department administers seven conditional grants from 2011/12 onward, and a brief description of each grant follows hereunder.
The Education Infrastructure grant, previously known as the Infrastructure Grant to Provinces (IGP) caters for physical infrastructure needs of schools. This grant has grown from R466.022 million in 2007/08 to R1.341 billion in 2013/14, indicating a growth of some 206 per cent. Note that this grant reduces as a result of National Treasury discontinuing the IGP in its current form, and replacing it with a sector specific grant for Education, Health and Transport. This grant will supplement existing infrastructure budgets and function in a similar manner to the IGP. The decrease in this grant results from a decision taken at a national level to change the way the grant is allocated between the three sectors.
The HIV and AIDS conditional grant funds a life-skills programme, aimed at creating awareness among learners and educators. Discussions are underway with the national department in respect of refocusing this grant to other areas of need.
The coverage of the NSNP grant has been expanded to include Quintile 3 secondary schools. This grant has seen significant growth from R260.006 million in 2007/08 to R1.215 billion in 2013/14.
The Technical Secondary Schools Recapitalisation grant was introduced for the first time in 2010/11, and is aimed at equipping technical secondary schools with the necessary equipment to enhance curriculum delivery. The amount allocated for this grant grows from R15.274 million in 2010/11 to R42.717 million in 2013/14.
The FET College Sector grant is merely a ring-fencing of the previous allocation which was funded through the equitable share. This emanates from the establishment of the Department of Higher Education and Training, whereby all FET colleges will form part of the institutions that will be governed by this department.
The EPWP Incentive grant, which was allocated in the 2010/11 Adjusted Appropriation, is aimed at providing incentives to departments to utilise members of the community in its infrastructure projects.
The Dinaledi Schools grant, which is introduced for the first time in 2011/12, will be used to increase access to maths and science at higher grade level in under-privileged schools.
In 2007/08, the department under-spent its budget by R430.153 million. This is largely attributed to the accounting treatment of the unrecovered portion of the ‘no work, no pay’, relating to the 2007 strike action, which could only be recovered in 2008/09. In order to fairly present the financial statements of the department, the unrecovered portion of the ‘no work, no pay’ was raised as a receivable in 2007/08. This resulted in the actual expenditure on Compensation of employees being reduced by the same amount. The department received a roll-over of R46.271 million in respect of under-spending against the NSNP conditional grant and additional funding of R57 million in respect of the implementation of the Occupation Specific Dispensation (OSD) for educators.
The department over-spent its 2008/09 budget by R654.998 million, largely as a result of the book entry conducted in 2007/08 in respect of the ‘no work, no pay’ which had to be reversed due to funds that were not recovered in 2007/08, and the higher than anticipated overtime payments in respect of the recovery plan. The over-expenditure was also fuelled by the shortfall in funding for the OSD for educators. The department received roll-overs totalling R107.738 million in respect of OSD for educators, vehicles for learners with special needs and under-expenditure on the NSNP conditional grant. Additional funding amounting to R215.455 million was allocated in 2008/09 in respect of costs for OSD for educators and pressures relating to examination services.
In 2009/10, the department undertook to cut spending in various areas, including Buildings and other fixed structures, Goods and services and Machinery and equipment, to reduce its spending levels, as part of the Provincial Recovery Plan. However, due to shortfalls in funding for OSD related costs and the higher than anticipated 2009 wage agreement, the department over-spent by R171.892 million. The department received a roll-over of R38.279 million in respect of the under-expenditure on the NSNP
Estimates of Provincial Revenue and Expenditure
190
conditional grant. The department was affected by the first instalment of the first charge of R111.466 million as per S43(2) of the PFMA.
Also in 2010/11, the department undertook to cut spending in various areas, including Buildings and other fixed structures, Goods and services and Machinery and equipment, to reduce its spending levels. However, due to shortfalls in funding for OSD related costs and the higher than anticipated 2010 wage agreement, as at the end of December 2010 the department projected an over-expenditure of R190.254 million. The currently projected over-expenditure does not take into account the ‘no work, no pay’ which is anticipated to be partly deducted during 2010/11. In 2010/11, the department was affected by the second instalment of the first charge of R133.602 million as per S34 (2) of the PFMA.
While the department received additional funding in the 2010/11 Adjustments Estimate and over the 2011/12 MTEF in respect of the shortfall in OSD for educators and the carry-through costs of the higher than anticipated 2010 wage agreement, there was still a shortfall of R97.173 million with carry-through costs over the MTEF.
4.2 Departmental receipts collection
Table 5.2 below illustrates the revenue collected by the Department of Education over a seven-year period. Details of these receipts are presented in Table 5.A in the Annexure – Vote 5: Education.
Sale of goods and services other than capital assets 26 135 28 532 30 979 31 323 31 323 31 490 34 455 36 420 38 423 Transfers received - 50 - - - - - - - Fines, penalties and forfeits - - - - - - - - - Interest, dividends and rent on land 321 24 094 22 735 210 210 941 231 243 256 Sale of capital assets - - 1 749 - - - - - - Transactions in financial assets and liabilities 26 599 43 920 32 665 16 924 16 924 21 900 20 149 21 156 22 320 Total 53 055 96 596 88 128 48 457 48 457 54 331 54 835 57 819 60 999
R thousand
Main Appropriation
Adjusted Appropriation
Revised Estimate Medium-term Estimates
2010/11
Audited Outcome
The major source of own revenue for the department falls under Sale of goods and services other than capital assets. This category consists mainly of administration fees, which include commission earned on payroll deductions such as insurance and garnishees, examination and remarking fees, as well as fees for the viewing of scripts, housing and parking rental for staff members. The 2007/08 figure includes interest that was earned due to stationery management fees kept in trust, while the litigation process was underway to settle the dispute between the contracted parties. There is a steady increase over the 2011/12 MTEF against this category.
Interest, dividends and rent on land reflects higher collection in 2008/09 and 2009/10 due to the discounts received from the procurement of LTSM. This provision normalises in 2010/11 and over the 2011/12 MTEF, as the discounts received are not recurrent. The department also collects revenue in respect of interest charged on outstanding staff debts.
The revenue collection against Sale of capital assets in 2009/10 relates to the sale of redundant official vehicles.
Revenue collected under Transactions in financial assets and liabilities consists mainly of debts owed to the department, as well as refunds relating to previous years’ expenditure. The increase in 2008/09 is due to the concerted effort of debt collection, and the fluctuations are due to the difficulty in budgeting for the collection against this item.
Vote 5: Education
191
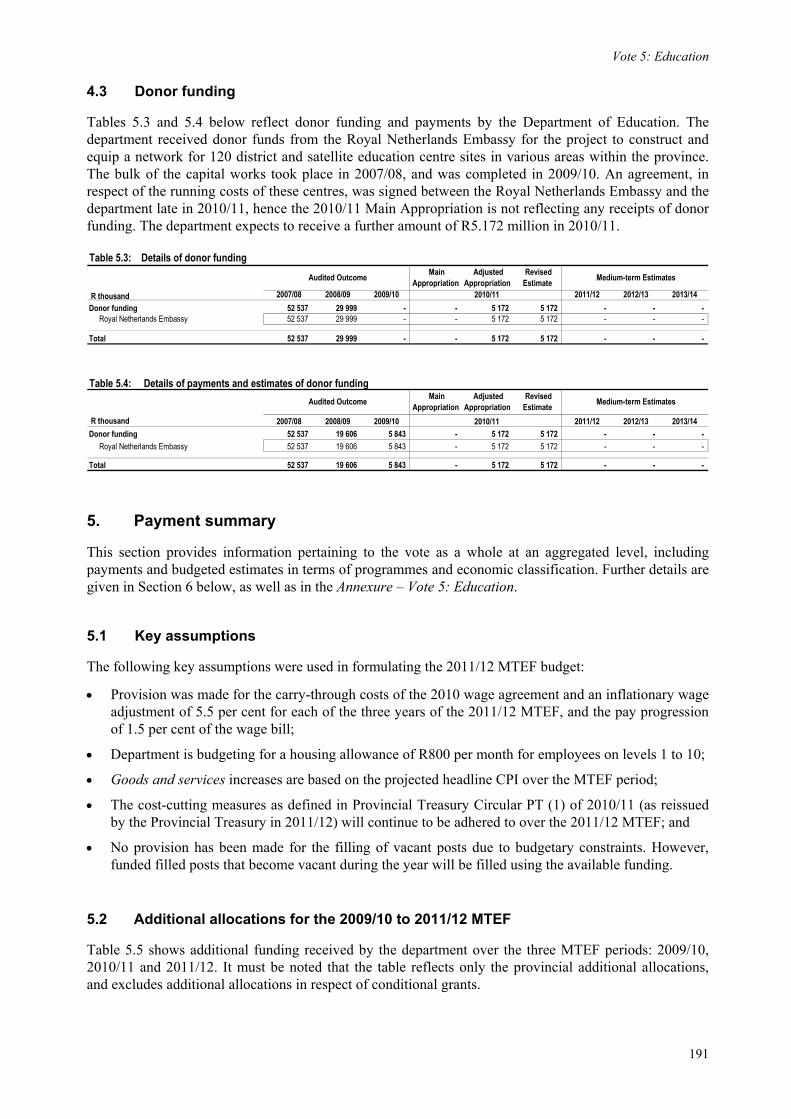
4.3 Donor funding
Tables 5.3 and 5.4 below reflect donor funding and payments by the Department of Education. The department received donor funds from the Royal Netherlands Embassy for the project to construct and equip a network for 120 district and satellite education centre sites in various areas within the province. The bulk of the capital works took place in 2007/08, and was completed in 2009/10. An agreement, in respect of the running costs of these centres, was signed between the Royal Netherlands Embassy and the department late in 2010/11, hence the 2010/11 Main Appropriation is not reflecting any receipts of donor funding. The department expects to receive a further amount of R5.172 million in 2010/11.
This section provides information pertaining to the vote as a whole at an aggregated level, including payments and budgeted estimates in terms of programmes and economic classification. Further details are given in Section 6 below, as well as in the Annexure – Vote 5: Education.
5.1 Key assumptions
The following key assumptions were used in formulating the 2011/12 MTEF budget:
• Provision was made for the carry-through costs of the 2010 wage agreement and an inflationary wage adjustment of 5.5 per cent for each of the three years of the 2011/12 MTEF, and the pay progression of 1.5 per cent of the wage bill;
• Department is budgeting for a housing allowance of R800 per month for employees on levels 1 to 10;
• Goods and services increases are based on the projected headline CPI over the MTEF period;
• The cost-cutting measures as defined in Provincial Treasury Circular PT (1) of 2010/11 (as reissued by the Provincial Treasury in 2011/12) will continue to be adhered to over the 2011/12 MTEF; and
• No provision has been made for the filling of vacant posts due to budgetary constraints. However, funded filled posts that become vacant during the year will be filled using the available funding.
5.2 Additional allocations for the 2009/10 to 2011/12 MTEF
Table 5.5 shows additional funding received by the department over the three MTEF periods: 2009/10, 2010/11 and 2011/12. It must be noted that the table reflects only the provincial additional allocations, and excludes additional allocations in respect of conditional grants.
Estimates of Provincial Revenue and Expenditure
192
The purpose of this table is two-fold. Firstly, it shows the quantum of additional funding allocated to the department in the past and current MTEF periods. Secondly, it indicates the policies and purposes for which the additional funding was allocated.
The carry-through allocations for the 2009/10 MTEF period (i.e. for the financial years 2012/13 and 2013/14) are based on the incremental percentage used in the 2010/11 MTEF and 2011/12 MTEF. A similar approach was used for the carry-through allocations for the 2010/11 MTEF period.
Table 5.5: Summary of additional provincial allocations for 2009/10 to 2011/12 MTEF R thousand 2009/10 2010/11 2011/12 2012/13 2013/14
Expansion of teachers to reduce teacher/learner ratio in Q1 schools - 15 000 20 000 21 000 22 155 Extension of No Fee policy to Q3 schools - - 60 370 63 389 66 875
National priorities 26 437 256 303 684 924 719 170 758 725 Learner Teacher Support Materials 26 437 29 854 18 074 18 978 20 021 Extension of No Fee policy to Q3 schools - 172 533 215 113 225 869 238 291 Expansion of teachers to reduce teacher/learner ratio in Q1 schools - 53 916 387 203 406 563 428 924 Support to inclusive education - - 64 534 67 761 71 488
Reflected in Table 5.5 is additional funding allocated over the 2009/10 MTEF towards the following national and provincial initiatives:
• Carry-through costs of the higher than anticipated 2008 wage agreement; and
• Learner Teacher Support Materials – aimed at the provision of a new set of NCS text books for the Grade 10-12 cohort.
The department also received funds during the 2009/10 MTEF from 2010/11 towards the expansion of teachers to reduce the Learner: Educator (L:E) ratio in Quintile 1 schools, extension of the No Fee policy to Quintile 3 schools and, from 2011/12, support to inclusive education, to make schooling more accessible to poorer learners and learners with special needs.
The department received additional funds over the 2010/11 MTEF in respect of carry-through costs of the higher than anticipated 2009 wage agreement. Further additional funding was allocated in respect of OSD for educators and Policy on Incapacity Leave and Ill Health Retirement (PILIR). The equitable share allocation was reduced in respect of the FET colleges’ funding as it was converted to the FET College Sector grant from 2010/11. The allocation for 2010 World Cup related activities was discontinued from 2010/11 onward.
The department received additional funding over the 2011/12 MTEF in respect of the carry-through costs of the higher than anticipated 2010 wage agreement, the expansion of provincial examination administration and OSD for educators. Also in the 2011/12 MTEF, National Cabinet took a decision to cut all national votes and the provincial equitable share by 0.3 per cent. The bulk of this equitable share reduction in KZN was sourced by capping the interest on the overdraft provision and by marginally decreasing the budgeted surplus of the province. The balance was sourced proportionately from all 16 provincial votes. The effect of this on the Department of Education is a reduction of R15.557 million, R20.095 million and R25.310 million over the 2011/12 MTEF.
Vote 5: Education
193
5.3 Summary by programme and economic classification
Tables 5.6 and 5.7 provide a summary of the vote’s payments and budgeted estimates by programme and economic classification, respectively, for the seven-year period, 2007/08 to 2013/14.
The services rendered by the department are categorised under eight programmes, in accordance with the revised uniform programme and budget structure for all provincial Education departments.
Table 5.6: Summary of payments and estimates by programme
The department’s budget grows substantially from R18.407 billion in 2007/08 to R36.492 billion in 2013/14. All programmes show positive growth over the 2011/12 MTEF. In terms of Section 34(2) of the PFMA, the department is liable for the repayment of previous year’s over-expenditure, resulting in a first charge against the department’s budget. In 2009/10, the first instalment of R111.466 million was implemented against the budget and the second instalment of R106.039 million in 2010/11. In addition, the department is also liable for a further first charge of R27.563 million in line with SCOPA Resolution 10 of 2009 for the unauthorised expenditure in 2006/07 which was implemented in 2010/11. These first charge amounts resulted in the amount available for spending by the department being reduced, as reflected in the footnote to the tables above.
Programme 1: Administration fluctuates between 2007/08 and 2009/10, with 2008/09 being higher than 2009/10 due to the cost-cutting measures implemented in 2009/10. The 2010/11 Adjusted Appropriation has been adjusted upward when compared to the Main Appropriation as a result of the higher than anticipated 2010 wage agreement.
Estimates of Provincial Revenue and Expenditure
194
Programme 2: Public Ordinary School Education reflects significant growth over the seven-year period, largely influenced by the various wage and OSD agreements. Notwithstanding the additional allocation for the higher than anticipated 2010 wage agreement, the 2010/11 Revised Estimate reflects higher spending, largely due to the higher than anticipated wage agreements of 2009 and 2010. These trends are reflected against Compensation of employees. The substantial increase against Programme 2 in 2011/12 is largely attributed to additional funding for the carry-through costs of the higher than anticipated 2010 wage agreement and the OSD for educators.
Programme 3: Independent School Subsidies reflects steady growth over the seven-year period. The decrease in the 2010/11 Revised Estimate is due to the reduction of the per capita allocation as a result of lower number of learners in some schools.
Programme 4: Public Special School Education reflects significant growth over the seven-year period under review. The significant increase from 2009/10 onward is due to focus being placed on expanding inclusive education, with a similar trend reflected between 2007/08 and 2008/09. Additional funding was allocated during the 2009/10 MTEF for support to inclusive education.
The decrease against Programme 5: Further Education and Training in 2009/10 can be attributed to the once-off increase in 2008/09 towards the implementation of the FETC Act, which necessitated the concurrent offering of two curricula for a limited period, as it was anticipated that the old curriculum would be phased out. The decrease in 2011/12 can be attributable to the shortfall in carry-through costs of the higher than anticipated 2010 wage agreement and OSD for educators. The programme reflects modest growth over the 2011/12 MTEF.
Programme 6: Adult Basic Education and Training reflects a decrease from 2009/10 to 2010/11 due to spending pressures in 2009/10 as a result of ABET practitioners who were incorrectly placed under this programme, and this was corrected in the 2010/11 Revised Estimate. The programme grows steadily over the 2011/12 MTEF, and provision has been made for skills programmes for ABET educators.
The significant increase against Programme 7: Early Childhood Development from 2008/09 onward relates to additional funding from 2008/09 for ECD (0-4 year olds) and, from 2010/11, towards the expansion of Grade R. This translates to a significant growth in the programme baseline over the seven-year period. The decrease in the 2010/11 Adjusted Appropriation and Revised Estimate relates to the movement of infrastructure funds to Programme 2 to cater for the construction of ECD classrooms in the new schools and also for the backlogs in upgrading and additions to schools.
Programme 8: Auxiliary and Associated Services fluctuates over the seven-year period. The decrease from 2009/10 to 2010/11 is due to the phasing out of the old curricula at the General Education and Training (GET) and FET levels. The pressure can be seen in the 2010/11 Revised Estimate, which is R20 million higher than the 2010/11 Adjusted Appropriation. This is largely due to the increased number and frequency of exams which resulted in more papers having to be printed, more markers having to be appointed and venues to be hired. The 2011/12 MTEF brings about substantial relief to the Examination Services sub-programme, as an additional R300 million is injected in the first year of the MTEF, largely due to the additional allocation of R126.778 million and the remainder being the reprioritisation of the budget initially set aside for the Masifundisane literacy project, which has reached its end.
Compensation of employees reflects a significant increase of R12.629 billion from 2007/08 to 2013/14 due to higher than anticipated wage agreements and increase in OSD costs, relating to various agreements such as Education Labour Relations Council (ELRC) Agreements No. 3 and 4 of 2009, and PSCBC Resolution 1 of 2007, entered into regarding the remuneration of educators and administrators. The actual cost of the wage and OSD agreements was not fully funded and, as a result, the department had to curtail some of its programmes to curb over-expenditure. This spending pressure can be seen in the 2010/11 Revised Estimate which is higher than the 2010/11 Adjusted Appropriation. However, it must be noted that the effects of ‘no work, no pay’ had not been fully brought into account at the time of the projection.
Goods and services reflects an increase between 2007/08 and 2008/09 due to the increase in the norms and standards allocation per learner, and this trend is comparable to Transfers and subsidies to: Non-profit institutions. The increase in 2009/10 is attributable to the increase in the NSNP allocation in order
Vote 5: Education
195
to expand the programme to other quintiles. The 2010/11 Revised Estimate reflects lower spending compared to the 2010/11 Adjusted Appropriation, due to the effects of cost-cutting measures that were implemented in order to curtail over-expenditure. The Goods and services budget grows substantially from 2010/11 to 2011/12 due to additional funding, especially in the NSNP grant. This increase will ensure that activities such as training and staff development, that were put on hold in 2010/11 and prior years, are revived in order to bring about effective service delivery.
Transfers and subsidies: Non-profit institutions reflects lower spending in the 2010/11 Revised Estimate due to some S21 schools not complying with the requirements to enable the department to transfer funds to them. The allocation has been increased over the 2011/12 MTEF in anticipation of all schools being allocated some of the S21 functions.
Transfers and subsidies to: Households caters for voluntary severance packages and leave gratuities, and the major fluctuations can be ascribed to the difficulty in budgeting for this item.
Buildings and other fixed structures reflects significant growth over the seven-year period, largely due to additional funding in respect of the Education Infrastructure grant. The reduction in the 2010/11 Adjusted Appropriation when compared with the 2010/11 Main Appropriation relates to the transfer of the budget previously set aside for the FET colleges to Compensation of employees within Programme 5 due to the shortfall in funding for the remuneration of FET colleges’ employees who have not been transferred to college councils, and the carry-through costs of the shortfall in funding for the higher than anticipated 2009 wage agreement. The budget against Buildings and other fixed structures was transferred to Machinery and equipment within Programme 4 to cater for the purchase of assistive devices, such as Braille machines, wheelchairs and other equipment for learners with special needs. The high 2010/11 Revised Estimate relates to the spending pressures in respect of the upgrading and major repairs to school infrastructure, especially those schools damaged by storms in 2009. The budget reflects healthy growth over the 2011/12 MTEF.
Machinery and equipment reflects significant growth between 2007/08 and 2009/10. The reduction reflected in the 2010/11 Adjusted Appropriation is due to the transfer of the FET colleges’ budget to Compensation of employees within Programme 5. The 2010/11 Revised Estimate reflects lower spending which is ascribed to cost-cutting measures implemented by the department. The growth in Machinery and equipment in the first two years of the 2011/12 MTEF will assist the department in the acquisition of the tools of trade that are sorely lacking due to previous cost-cutting exercises.
5.4 Summary of payments and estimates by district municipal area
Table 5.8 provides details of the department’s spending within district municipal areas. It must be noted that, due to the nature of services rendered by the department, it is difficult to extract administration costs.
Spending levels in all areas increase on a similar scale over the 2011/12 MTEF. The highest spending occurs in the uMgungundlovu, eThekwini, Zululand and uThungulu district municipal areas, mainly due to the number of schools and training institutions located here, as well as the general need in these areas.
Table 5.8: Summary of payments and estimates by district municipal area
5.5 Summary of conditional grant payments and estimates
Tables 5.9 and 5.10 provide a summary of conditional grants payments and estimates by programme and economic classification for the period 2007/08 to 2013/14.
The department administers seven conditional grants from 2011/12, although no funding has been confirmed for the EPWP Incentive grant for the 2011/12 MTEF.
Table 5.9: Summary of conditional grant payments and estimates by name
The allocation for conditional grants reflects a significant increase from 2007/08 to 2013/14 due to the introduction of the FET College Sector grant and the Technical Secondary Schools Recapitalisation grant in 2010/11. There has also been a substantial increase in the Education Infrastructure grant and NSNP grant over the period under review. The additional allocation for NSNP grant is to cater for the expansion of the programme to Quintile 3 secondary schools, commencing in 2011/12.
The NSNP and Technical Secondary Schools Recapitalisation grant allocations are reflected against Goods and services while the Education Infrastructure grant is reflected against Buildings and other fixed structures. The HIV and AIDS (Life-Skills Education) grant is reflected against Goods and services and Transfers and subsidies to: Non-profit institutions in order to cater for the OVC project. The FET College Sector grant has been allocated against Compensation of employees and Transfers and subsidies to: Non profit institutions.
Also included is the EPWP Incentive grant which provides an incentive to departments that use labour intensive methods in infrastructure delivery and the funding for the Dinaledi Schools grant which will be used for the project aimed at increasing access to maths and science at higher grade level in the under-privileged schools.
Vote 5: Education
197
5.6 Summary of infrastructure payments and estimates
Table 5.11 below presents a summary of infrastructure payments and estimates by category for the vote, including both capital and current expenditure on infrastructure for the period 2007/08 to 2013/14. Detailed information on infrastructure is given in the Annexure – Vote 5: Education.
Table 5.11: Summary of infrastructure payments and estimates
The infrastructure budget shows significant growth over the period. The strong growth over the 2011/12 MTEF, which corresponds to the increase in the Education Infrastructure grant, should enable the department to make provision for pressing infrastructural needs, particularly in respect of the roll-out of Grade R, the building of special schools and non-school buildings.
The Education Infrastructure grant specifically focuses on the backlogs in education and school infrastructure needs, including the replacing of unsafe and inappropriate school structures, maintenance and improving infrastructure delivery capacity. This grant supplements existing infrastructure budgets.
The infrastructure trends among the various infrastructure categories fluctuate substantially over the period 2007/08 to 2009/10 and this is largely due to the changing nature of the infrastructure terrain brought about by natural disasters and/or the inability of some implementing agents to deliver and the stopping of some projects due to financial pressures experienced in 2009/10. New and replacement assets reflects a decrease in the 2010/11 Revised Estimate due to the withdrawal of some infrastructure projects from an implementing agent who consistently failed to deliver. These projects will resume in 2011/12.
The programmes relating to additions and/or renovations of schools to accommodate learners with special needs, boarding facilities, as well as office accommodation will continue over the 2011/12 MTEF. In addition to classrooms and toilets, the budget also includes provision for laboratories, computer centres and ECD spaces, which explains the slight increase in Upgrades and additions and Rehabilitation, renovations and refurbishments over the 2011/12 MTEF and the increase in New and replacement assets.
For the 2011/12 MTEF, a significant portion of the budget has been allocated New and replacement assets to cater for new ordinary schools and special schools to be built. Furthermore, a plan is in place to ensure that all schools have sufficient ablution facilities by 2012/13. The department is also considering the possibility of utilising alternative building material, to achieve faster delivery of infrastructure and are currently researching various options in this regard.
5.7 Public Private Partnerships – Nil
5.8 Transfers to public entities listed in terms of Schedule 3 of the PFMA – Nil
5.9 Transfers to other entities
Table 5.12 provides details of transfers made to other entities over the seven-year period under review.
Estimates of Provincial Revenue and Expenditure
198
Table 5.12: Summary of departmental transfers to other entities
The largest portion of transfers is in respect of Section 21 schools, relating to the transfers of norms and standards funding. The increased budget in respect of special schools, especially from 2007/08 onward, reflects the extent to which the department is focussing on learners with special needs, by making sure that schools are allocated funding that will enable them to assist the learners and to ensure that the inclusive education programme is granted the attention it deserves.
It is anticipated that all schools will attain S21 functions from 2011/12 onward, thus obviating the need to provide petty cash payments.
The decrease in the transfers to FET colleges in 2009/10 is largely attributable to once-off funding allocated in 2008/09 for the implementation of NC(V) programmes, while simultaneously phasing out NATED certificate courses.
Additional allocations for the expansion of Grade R and ECD contribute to the increase over the MTEF.
5.10 Transfers to municipalities - Nil
5.11 Transfers and subsidies
Table 5.13 provides a summary of transfers by programme and main category over the seven-year period.
The department mainly transfers funds to schools and FET colleges. Apart from these, there are smaller transfers and also transfers in respect of employees’ severance packages, which are difficult to predict, thus showing fluctuations over the years.
The category Transfers and subsidies to: Households under Programme 1, over the seven-year period, reflects payments made in respect of severance packages and leave gratuities for employees. The fluctuations are a result of the difficulty in predicting the expenditure in respect of this category.
Programme 2 houses the larger portion of the transfers to schools. The transfers and subsidies increase over the seven-year period, and include the following:
• Non-profit institutions reflects payments made in respect of norms and standards. These payments are made to all Section 21 schools. However, the allocation was increased in 2008/09 and 2009/10 to cater for transfers to Non Section 21 schools for the purchase of stationery as there were delays experienced in the appointment of a managing agent. The increase in the 2011/12 MTEF accounts for the remainder of the schools that will be converted into Section 21 schools. Also included are transfers to schools in respect of the HIV and AIDS programme.
• Households reflects payments in respect of severance packages and leave gratuities for employees. The fluctuations relate to the difficulty in predicting the expenditure in respect of this category.
Transfers and subsidies to: Non-profit institutions under Programme 3 reflects payments made in respect of the subsidy given to independent schools.
Vote 5: Education
199
Table 5.13: Summary of transfers and subsidies by programme and main category
• Transfers and subsidies to: Non-profit institutions reflects payments made to special schools. The decrease reflected in the 2010/11 Revised Estimate is a result of the department buying some of assistive devices on behalf of the schools in order to maximise the discount potential.
• Households caters for severance packages and leave gratuities, which are difficult to predict, hence the fluctuations over the seven-year period.
The category Transfers and subsidies under Programme 5 reflects an increasing trend, while there is a reduction in 2009/10 as a result of the allocation for the FET College Sector Recapitalisation grant which ceased in 2008/09. This category includes the following: • Non-profit institutions reflects payments to FET colleges for the running of these institutions. The
allocation was reduced in 2009/10 due to delays in the transfer of administrative responsibilities to the colleges. The increase over the 2010/11 Main Appropriation is a result of the anticipated transfer of responsibilities to the colleges, which did not take place hence the reduction in the 2010/11 Revised Estimate.
• Households caters for the severance packages and leave gratuities for lecturers and other administrative staff in the colleges.
Transfers and subsidies to: Households under Programme 6 reflects payments in respect of severance packages and leave gratuities, which are difficult to predict, hence the fluctuations.
Estimates of Provincial Revenue and Expenditure
200
The category Transfers and subsidies under Programme 7 increases over the period, and includes: • Non-profit institutions reflects payments made to ECD centres. The 2010/11 Revised Estimate
reflects non-spending as a result of the department undertaking the purchasing of LTSM on behalf of these centres in order to maximise discount potential.
• Households caters for payments in respect of severance packages and leave gratuities, which are difficult to predict, hence the fluctuations.
The category Transfers and subsidies under Programme 8 fluctuates over the seven-year period, and includes the following:
• Departmental agencies and accounts reflects payments made to the Education Training and Development Practices Sector Education and Training Authority (ETDP SETA) in respect of the Skills Development Levy. No payments are reflected in 2007/08 as they were made out of Goods and services.
• Households caters for payments in respect of severance packages and leave gratuities, which are difficult to predict, hence the fluctuations.
6. Programme description
The services rendered by this department are categorised under eight programmes for the current MTEF, which conform to the uniform budget and programme structure for the sector.
The payments and estimates for each programme are summarised in terms of sub-programmes and economic classification, and detailed in the Annexure – Vote 5: Education.
6.1 Programme 1: Administration
Programme 1: Administration has five sub-programmes that are responsible for providing:
• The functioning of the Office of the Member of the Executive Council (MEC) for education;
• Overall management of the education system;
• Education management services for the education system;
• Human resource development for office-based staff; and
• Education Management Information System (EMIS).
Tables 5.14 and 5.15 below reflect payments and budgeted estimates relating to this programme for the period 2007/08 to 2013/14.
Table 5.14: Summary of payments and estimates - Programme 1: Administration
As previously mentioned, in terms of Section 34(2) of the PFMA, the department is liable for the repayment of previous year’s over-expenditure, resulting in a first charge against the department’s budget. In 2009/10, the first instalment of R111.466 million was implemented against the budget and the second instalment of R106.039 million in 2010/11. In addition, the department is liable for a first charge of R27.563 million in line with SCOPA Resolution 10 of 2009 for the unauthorised expenditure of 2006/07 arising from the write-off of expenditure in respect of thefts and losses. This resulted in the programme’s budget available for spending being reduced.
The above-mentioned instalments of the first charge are allocated under the sub-programme: Corporate Services, against Payments for financial assets, as explained above.
The budget increases sharply from 2007/08 to 2009/10, largely due to provisions made for the appointment of subject advisors. The expenditure misallocations between the Corporate Services and Education Management sub-programmes were corrected in 2009/10 and over the 2010/11 MTEF, but prior year figures could not be restated. These expenditure misallocations relate to Compensation of employees and Goods and services.
The Human Resources Development budget is inclusive of the employee bursary budget, as well as the skills development funds. The Education Management Information System (EMIS) shows aggressive growth in the 2011/12 MTEF in order to ensure a speedy roll-out of the South African Schools Administration and Management System (SA-SAMS).
As can be seen in the 2010/11 Revised Estimate, Compensation of employees is higher than the Adjusted Appropriation due to the shortfall in funding for the higher than anticipated 2010 wage agreement. The decrease in 2011/12 highlights that the department has not been able to cover the entire shortfall arising from the wage agreements from previous years, and therefore will continue to implement cost-cutting measures to realise savings that will offset the spending pressures against Compensation of employees.
Goods and services reflects significant growth from 2007/08 to 2008/09 due to funds that were reprioritised in 2007/08 to cover the spending pressures in Compensation of employees. The low spending in 2010/11 is due to the continued implementation of cost-cutting measures.
The high expenditure against Buildings and other fixed structures in 2008/09 relates to the once-off purchase of four new buildings that were bought for administration purposes. The low spending in 2009/10 is due to the cost-cutting exercise undertaken to fund the pressures brought about by the various collective agreements. Buildings and other fixed structures reflects a reduction in the 2010/11 Revised Estimate due to enforced savings to cover spending pressures against the same category in Programme 2.
Estimates of Provincial Revenue and Expenditure
202
Machinery and equipment reflects a decrease from 2007/08 to 2008/09 due to enforced savings to deal with spending pressures. The decrease in 2009/10 and the 2010/11 Revised Estimate is attributable to cost-cutting measures implemented as part of the Provincial Recovery Plan.
The high spending reflected against Payments for financial assets in 2007/08 relates to the write-off of staff debts which could not be recovered during the debt recovery drive by the department.
The budget reflects steady growth over the 2011/12 MTEF.
Service delivery measures – Programme 1: Administration
Table 5.16 below illustrates the main service delivery measures relevant to Programme 1: Administration. The department has complied with the service delivery measures as prescribed by the Education sector.
2010/11 2011/12 2012/13 2013/14 To bring effective management to all levels of the system
• No. of public schools that use SA-SAMS (or its equivalent) to provide data to the national unit record tracking system
1 500 2 500 3 500 4 500
• No. of schools fully trained in the core registration modules in SA-SAMS in reporting period
4 344 3 500 5 890 6 000
• No. of schools that can be contacted electronically (e-mail) by the department
3 218 5 890 4 988 5 896
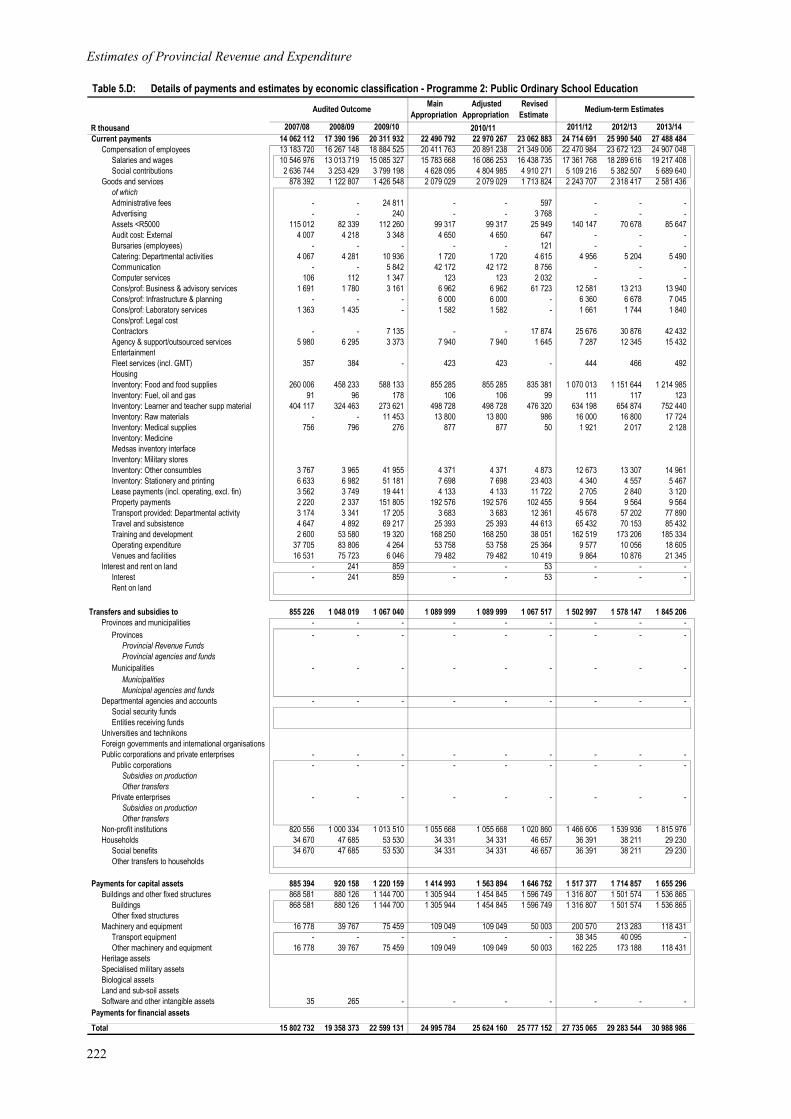
6.2 Programme 2: Public Ordinary School Education
This programme houses the core function of the department, and its aim is the provision of public ordinary schools from Grades 1 to 12, in accordance with the South African Schools Act.
This programme has six sub-programmes over the 2011/12 MTEF, which have the following objectives:
• To provide specific public primary ordinary schools with resources for the Grade 1 to 7 levels;
• To provide specific public secondary ordinary schools with resources for the Grade 8 to 12 levels;
• To provide departmental services for the professional and other development of educators and non-educators in public ordinary schools;
• Human resource development for educators and non-educators;
• To provide additional and departmentally managed sporting and cultural activities in public ordinary schools;
• To provide for the National School Nutrition Programme, funded by a conditional grant; and
• To provide for the HIV and AIDS life-skills programmes, as prioritised by the sector and funded by a conditional grant.
Tables 5.17 and 5.18 reflect payments and budgeted estimates for the period 2007/08 to 2013/14.
This programme includes the budget for educators, their salaries, and development needs. The largest portion of the budget under this programme is allocated to the sub-programme: Public Primary Schools, in proportion to the number of institutions and learners attending these schools. The specific conditional grants funding have been reflected as sub sub-programmes.
Vote 5: Education
203
Table 5.17: Summary of payments and estimates - Programme 2: Public Ordinary School Education
The significant increase in the sub-programmes Public Primary and Public Secondary Schools from 2007/08 onward can mainly be attributed to additional funding received for the higher than anticipated wage agreements of 2007 to 2010. These sub-programmes also benefitted from the various national priorities which were funded between the 2007/08 and 2009/10 MTEFs, which included a reduction of the Learner: Educator (L:E) ratio, QIDS-UP, Systemic Evaluation, Education Infrastructure grant and other personnel priorities. The increase in the 2010/11 Adjusted Appropriation against both sub-programmes is due to the provision for the higher than anticipated 2010 wage agreement and OSD for educators, although the funding received was not sufficient to cover the full cost, accounting for the high Revised Estimate in respect of Public Ordinary Schools. Further, the department had not been adequately funded for the 2008/09 OSD for educators and the 2009 wage agreement, and the impact of these shortfalls continue to hamper the department’s ability to deliver quality services, as other line items have to be continuously reduced to cater for the spending pressure resulting from these shortfalls.
A large portion of the additional allocation in respect of the OSD for educators and the higher than anticipated 2010 wage agreement has been allocated to the Public Primary Schools and Public Secondary Schools sub-programmes, as they bear the largest brunt of the shortfall, leaving other sub-programmes within Programme 2, as well as other programmes, without sufficient funds to cater for the carry-through costs of the higher than anticipated 2010 wage agreement.
The Professional Services sub-programme increases substantially between 2007/08 and 2009/10 as a result of the filling of subject advisor posts. However, a decline is noted in the 2010/11 Main Appropriation due to the re-allocation of incorrectly placed expenditure to the Human Resource Development sub-programme, for which prior year figures could not be restated.
Estimates of Provincial Revenue and Expenditure
204
The Human Resource Development sub-programme fluctuates markedly over the period under review. The low spending from 2007/08 to 2009/10 can be ascribed to the department’s efforts to minimise the projected over-expenditure over the years. The decrease reflected in the 2010/11 Revised Estimate relates to training and staff development being put on hold in order to offset the spending pressures in Compensation of employees. Notwithstanding this, the department allocates the full skills development budget to this programme, as there is an acknowledgement of the importance of improving its employee skills base, and positive growth can be noted over the 2011/12 MTEF.
The In-school Sport and Culture sub-programme shows a fluctuating trend from 2007/08 to 2009/10 due to the fact that the department’s roles and responsibilities in respect of school sport were unclear, and the department therefore did not drive any programmes in this regard, which has since been resolved, hence the high expenditure in 2008/09 and 2009/10. The decrease in the 2010/11 Revised Estimate relates to the implementation of cost-cutting measures. Noticeable growth is reflected in the 2011/12 MTEF, as the department will strive to deliver on its social cohesion responsibilities.
The NSNP grant shows a marked increase in 2009/10 as a result of the programme extension to include Quintile 1 secondary schools. The 2010/11 allocation, which also saw growth as a result of additional funds that were allocated to extend the feeding scheme to Quintile 2 secondary schools, is expected to be fully spent. The growth over the 2011/12 MTEF is a result of additional funds being made available to cater for the extension of the programme to Quintile 3 secondary schools.
There is consistent growth against the HIV and AIDS (Life-Skills Education) grant, except for 2007/08, when the department under-spent the budget, due to the 2007 wage strike and the resultant learner time lost. However, for the two years thereafter, the department spent its allocation fully and is projecting to do the same in 2010/11. The sub-programme grows modestly over the 2011/12 MTEF.
In 2010/11, a new conditional grant called the Technical Secondary School Recapitalisation grant was introduced. This grant is aimed at equipping technical secondary schools with the necessary facilities to enhance curriculum delivery. The 2010/11 allocation is projected to be fully spent, notwithstanding the significant delays that have been experienced with the procurement processes. The allocation over the 2011/12 MTEF almost doubles, as more schools will be accommodated in the programme.
The EPWP Incentive grant was introduced to the department during the 2010/11 Adjustments Estimate. It is anticipated that the grant will be fully spent.
The Dinaledi Schools grant will be introduced in the province in 2011/12, and is aimed at increasing access to maths and science at higher grade level in under-privileged schools.
The increase reflected against Compensation of employees in 2008/09 relates to the higher anticipated 2008 wage agreement and the implementation of the OSD for educators. The increase in 2009/10 is due to the higher than anticipated 2009 wage agreement and the implementation of other collective agreements and the full implementation of the OSD for educators. The increase in the 2010/11 Revised Estimate is due to the higher than anticipated 2010 wage agreement not being fully funded. The increase reflected over the 2011/12 MTEF can be attributed to additional funding received to compensate for the carry-through costs of the higher than anticipated 2010 wage agreement and carry-through costs of the OSD for educators, dating back to 2008/09.
Included under Goods and services is the LTSM for schools that were not allocated S21(c) status as per the Schools Act of South Africa 1995, which allows the schools to procure their own LTSM. It is anticipated that the remainder of the current S20 schools will attain S21 functions by the end of 2010/11. The increase in the expenditure patterns between the period 2007/08 to 2009/10 relates to the growth in additional allocations received, of which the largest share was in respect of NSNP. The downward revision of the Goods and services budget in the 2010/11 Revised Estimate is as a result of programmes such as training and staff development being put on hold in order to fund the projected over-expenditure against Compensation of employees. The 2011/12 MTEF grows substantially, largely influenced by the growth in funding for the NSNP scheme.
Vote 5: Education
205
Transfers and subsidies to: Non-profit institutions saw a steady increase from 2007/08 to 2009/10 largely due to the department not having a managing agent for stationery which resulted in funds being transferred to schools, and as a result of a portion of HIV and AIDS (Life-Skills Education) grant being transferred to schools for the OVC project. The 2010/11 Revised Estimate was adjusted downward due to a downward revision of the per learner allocation to cater for the projected over-expenditure against Compensation of employees. The growth over the 2011/12 MTEF is reflective of the anticipation of all schools attaining some of the S21 functions.
Transfers and subsidies to: Households reflects fluctuations over the seven-year period as it is difficult to accurately budget for the spending against this item.
Buildings and other fixed structures reflects an increase in the 2010/11 Adjusted Appropriation and Revised Estimate due to pressures experienced by this programme as a result of natural disaster. In addition, ECD classrooms now form part of the schools’ delivery programme and are not stand alone in Programme 7, but are constructed during the construction of new schools. The allocation increases significantly over the 2011/12 MTEF due to funds allocated for the construction of classrooms, ECD spaces, laboratories, computer centres and eradication of unsafe facilities at schools.
Machinery and equipment reflects a substantial increase from 2007/08 to 2009/10. The decrease in the 2010/11 Revised Estimate is as a result of the cost-cutting measures implemented. The growth over the 2011/12 MTEF will allow the department to implement its Information Communication Technology (ICT) and Mathematics, Science and Technology (MST) strategy and assist schools with the equipping of laboratories.
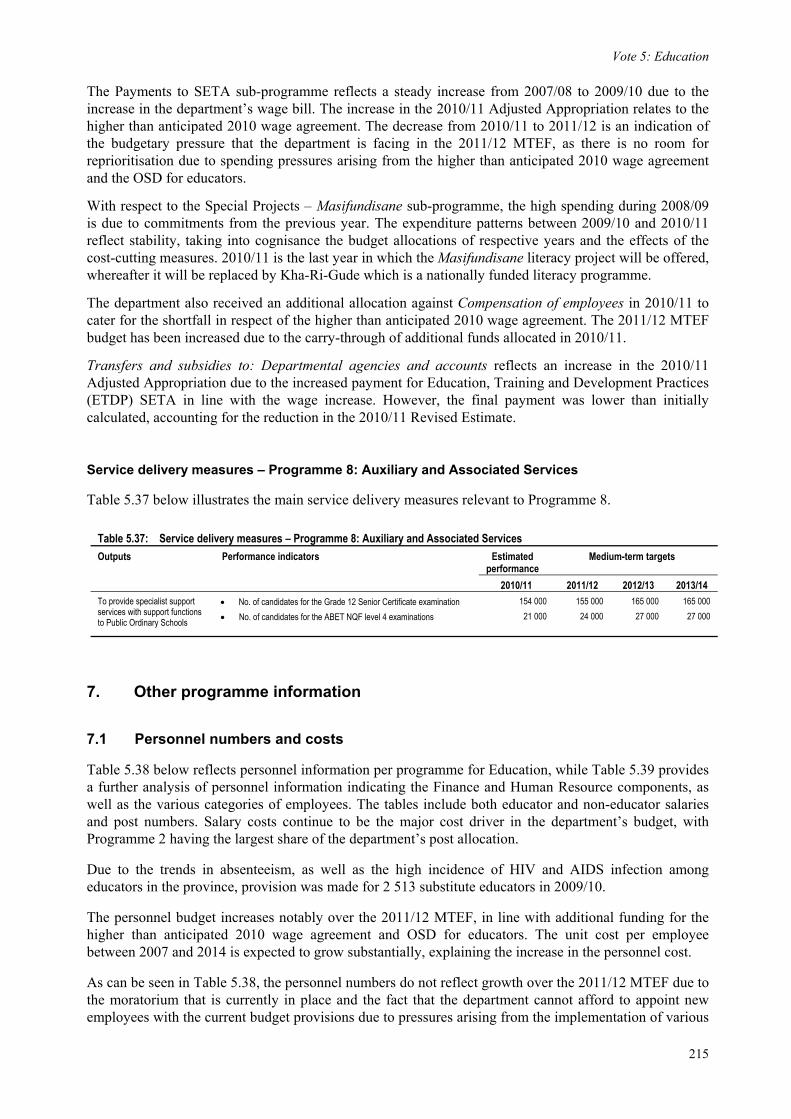
Service delivery measures – Programme 2: Public Ordinary School Education
Table 5.19 below illustrates the main service delivery measures relevant to Programme 2. The department has, as far as possible, complied with the service delivery measures as prescribed by the Education sector.
Table 5.19: Service delivery measures – Programme 2 : Public Ordinary School Education Outputs Performance indicators Estimated
performance Medium-term targets
2010/11 2011/12 2012/13 2013/14 2.1 To provide access in
the public ordinary schooling system in accordance with policy
• No. of learners benefiting from school nutrition programme 1 984 704 2 087 001 2 107 871 2 107 871 • No. of learners with special education needs that are
enrolled in public ordinary schools 13 000 14 000 15 000 16 000
• % of learners that are funded in terms of the norms and standards for school funding
100% 100% 100% 100%
• No. of public ordinary schools converted into full service schools
74 84 94 104
• No. of learners in public ordinary schools benefitting from learner transport
13 000 13 000 13 000 13 000
• No. of learners benefitting from the No Fee policy 1 740 965 1 750 721 1 760 882 1 870 000 • No. of learners enrolled in public ordinary schools 2 569 793 2 569 793 2 569 793 2 600 000 • No. of educators employed in public ordinary schools 88 373 88 373 88 373 89 000 • No. of non-educator staff employed in public ordinary
schools 11 158 11 658 12 058 12 108
2.2 To put in place basic infrastructure for public ordinary schooling in accordance with policy
• No. of public ordinary schools without water supply 100 50 25 15 • No. of public ordinary schools without electricity 650 600 500 400 • No. of schools without sanitation facilities 50 50 50 40 • No. of classrooms in public ordinary schools 45 107 46 607 47 980 49 000 • No. of specialist rooms to be built in public ordinary schools
The purpose of this programme is to support independent schools, in accordance with the South African Schools Act. One of the main aims of this programme is to ensure timeous and orderly registration of independent schools in terms of the South African Schools Act, as well as other legislative frameworks. These schools are evaluated and monitored by the department, and their capacity is developed to ensure the effective functioning of these schools and their governing bodies.
Independent schools provide education and training to learners in the same way as public schools do, but are not governed by the same legislation as public schools. For quality purposes, independent schools are registered with the Association for Independent Schools, and have an Independent Examination Board.
Tables 5.20 and 5.21 below reflect summary of payments and estimates relating to this programme. The sub-programmes are split by the education phase category, as reflected in Table 5.21 below.
Table 5.20: Summary of payments and estimates - Programme 3: Independent School Subsidies
The programme reflects steady growth over the seven-year period in line with the inflationary adjustment. However, the Secondary Phase sub-programme reflects a decrease in the 2010/11 Revised Estimate due to the reduction of the per capita allocation as a result of lower number of learners in the schools.
Service delivery measures – Programme 3: Independent School Subsidies
Table 5.22 below illustrates the main service delivery measure relevant to Programme 3.
6.4 Programme 4: Public Special School Education
The purpose of this programme is to provide compulsory public education in special schools in accordance with the South African Schools Act and White Paper 6 on Inclusive Education. The sub-programmes are aimed at providing:
• Specific public special schools with resources;
• Educators and learners in public special schools with departmentally managed support services;
• Departmental services for the professional and other development of educators and non-educators in public special schools; and
• Additional and departmentally managed sporting and cultural activities in public special schools.
To date, the department has 65 registered special schools, but more than 60 per cent of these are in urban areas. Furthermore, special schools are not inclusive and only admit learners according to the disability category that the school is registered for, thus excluding a number of learners who do not meet the requirement in terms of the admission policies.
Tables 5.23 and 5.24 below reflect payments and budgeted estimates for the period under review.
Table 5.22: Service delivery measures – Programme 3 : Independent School Subsidies Outputs Performance indicators Estimated
PerformanceMedium-term targets
2010/11 2011/12 2012/13 2013/14 To ensure that quality education occurs in independent schools
• No. of learners in subsidised independent schools 28 696 25 600 25 700 25 800
Estimates of Provincial Revenue and Expenditure
208
Table 5.23: Summary of payments and estimates - Programme 4: Public Special School Education
The significant increase from 2010/11 onward against the Special Schools sub-programme is indicative of the level of importance given to this programme. The decrease in the 2010/11 Adjusted Appropriation for Special Schools is as a result of the slow spending in respect of new special schools. This budget was then reprioritised to Programme 2. The increase in the 2010/11 Revised Estimate is largely due to the 2010 wage agreement and carry-through effect of OSD for educators. This programme reflects a substantial increase from 2011/12 onward due to additional funding for the construction of schools for learners with special needs and also for the conversion of some schools into full-service schools.
Compensation of employees reflects a decrease from 2009/10 to the 2010/11 Main Appropriation due to the shortfall carried through relating to the higher than anticipated 2009 wage agreement and OSD for educators. The decrease reflected in 2011/12 is due to the shortfall for the carry-through costs of the higher than anticipated 2010 wage agreement and the OSD for educators. The department allocated most of the additional funding in this regard against Programme 2, leaving other programmes without adequate funding, and there is no room for reprioritisation.
The high 2009/10 amount against Goods and services relates to the implementation and extension of the Inclusive Education programme through the implementation of full service schools. There is a minimum provision against Goods and services over the 2011/12 MTEF, as the bulk of the funding will be transferred to schools as reflected against Transfers and subsidies to: Non-profit institutions.
The decrease in the 2010/11 Revised Estimate against Transfers and subsidies to: Non-profit institutions relates to the department participating in the national tender for assistive devices, whereby the department will procure these on behalf of the schools. This is confirmed by the increase against Machinery and equipment from 2011/12 onward. The increase in 2011/12 is due to the increase in norms and standards.
The decrease against Buildings and other fixed structures in the 2010/11 Adjusted Appropriation and Revised Estimate relates to slow progress in the delivery of infrastructure due to non-delivery by a service provider. The increase over the 2011/12 MTEF relates to additional funding allocated during the 2008/09 MTEF for inclusive education. The substantial increase from 2011/12 onward is due to additional funding for the construction of schools for learners with special needs and also for the conversion of some schools into full-service schools.
Vote 5: Education
209
Machinery and equipment reflects a substantial increase in the 2010/11 Adjusted Appropriation due to funds reprioritised from Buildings and other fixed structures for the purchase of assistive devices, such as wheelchairs, Braille machines and other equipment for learners with special needs. The decrease in the 2010/11 Revised Estimate relates to cost-cutting measures implemented and the department’s effort to curtail spending to cover the anticipated over-expenditure relating to the shortfalls in personnel expenditure.
Service delivery measures – Programme 4: Public Special School Education
Table 5.25 below illustrates the main service delivery measures relevant to Programme 4.
6.5 Programme 5: Further Education and Training
The aim of this programme is to provide Further Education and Training at public FET colleges, in accordance with the Further Education and Training Colleges Act No. 16 of 2006. The objectives are:
• To provide specific public FET colleges with resources;
• To provide specific public youth colleges with resources;
• To provide educators and students at public FET colleges with departmentally managed support services;
• To provide departmental services for the professional development of educators and non-educators at public FET colleges;
• To provide additional and departmentally managed sporting and cultural activities at public FET colleges; and
• To provide for FET recapitalisation.
Tables 5.26 and 5.27 reflect information related to this programme for the period under review.
The budget of this programme has increased over the years, and is expected to increase further to meet the challenges resulting from the transformation of the FET sector.
It must be noted that the conditional grants have been reflected as sub sub-programmes under the sub-programme: Conditional grants, in line with the generic structure for the sector.
Table 5.26: Summary of payments and estimates - Programme 5: Further Education and Training
FET College Sector Recapitalisation grant 115 453 162 974 - - - - - - - FET Colleges Sector grant - - - 642 561 649 177 752 425 540 025 593 964 714 346
Total 480 186 712 189 670 523 642 561 661 840 765 088 760 823 835 268 986 577 Note: Some of the conditional grant funding has been allocated to the Public Institutions sub-programme.
R thousand
Main Appropriation
Adjusted Appropriation
Revised Estimate Medium-term Estimates
2010/11
Audited Outcome
Table 5.25: Service delivery measures – Programme 4 : Public Special School Education Outputs Performance indicators Estimated
performanceMedium-term targets
2010/11 2011/12 2012/13 2013/14 To provide access to special schools in accordance with policy and principles of inclusive education
• No. of professional non-teaching staff employed in public special schools
1 400 1 450 1 500 1 600
Estimates of Provincial Revenue and Expenditure
210
Table 5.27: Summary of payments and estimates by economic classification - Programme 5: Further Education and Training
The funding mechanism for this programme changed from equitable share to conditional grant with effect from 1 April 2010, in preparation for the transfer of the programme to the Department of Higher Education and Training. This change in the funding method resulted in the department having to fund approximately R63 million over the MTEF from its baseline, as the equitable share formula used to determine how much each province should have budgeted for the FET colleges, resulted in a budget that was higher than the baseline for FET colleges. This put pressure on other programmes within a vote that is already experiencing budgetary constraints caused by the implementation of various OSD and wage agreements.
Due to the non-finalisation of this transfer, the department continued to pay salaries for some FET employees on an agency basis, hence the re-allocation of the budget to the Public Institutions sub-programme in the 2010/11 Adjusted Appropriation. This process has been carried through in the 2011/12 MTEF, as it is not yet clear when the FET colleges will be transferred to the Department of Higher Education and Training.
The significant increase in 2008/09 against Public Institutions and Transfers and subsidies to: Non-profit institutions is largely due to the once-off allocation made towards the implementation of the FETC Act. In terms of this Act, a new NC(V) curriculum was offered to students from 2007/08.
Further funding was allocated in 2010/11 in respect of Compensation of employees for the higher than anticipated 2010 wage agreement. To cater for the non-movement of employees to college councils, funds were moved from Buildings and other fixed structures, Goods and services and Machinery and equipment to Compensation of employees. This trend continues over the 2011/12 MTEF, as it is not clear when the colleges will assume their own responsibilities with respect to the payment of these employees. The FET Colleges Sector grant was increased over the 2011/12 MTEF to cater for the carry-through costs of the higher than anticipated 2010 wage agreement.
Transfers and subsidies to: Non-profit institutions reflects the budget that will be transferred to the colleges to administer the NC(V) programmes as provided for in the Norms and Standards.
Service delivery measures – Programme 5: Further Education and Training
Table 5.28 below illustrates the main service delivery measures relevant to Programme 5.
The increase in the number of NC(V) students is noteworthy, and the budget has increased accordingly.
Vote 5: Education
211
Table 5.28: Service delivery measures – Programme 5 : Further Education and Training Outputs Performance indicators Estimated
performance Medium-term targets
2010/11 2011/12 2012/13 2013/14 5.1 To expand the FET college
sector in terms of the economic and social needs of the country
• No. of students enrolled in NC(V) courses in public FET colleges
32 350 49 518 72 360 73 560
5.2 To provide relevant and responsive quality FET learning opportunities
• No. of FET college NC(V) students who completed full courses successfully
32 675 57 588 58 665 60 000
6.6 Programme 6: Adult Basic Education and Training
The objective of this programme is to provide ABET in accordance with the Adult Basic Education and Training Act. It therefore has the responsibility of implementing the national government initiative to afford adults the chance to improve their level of literacy and numeracy. To this end, this programme seeks to eliminate adult illiteracy, improve average levels of education attainment, and provide the skills necessary for adults to contribute to the growth of the economy.
Tables 5.29 and 5.30 below reflect payments and budgeted estimates relating to this programme for the period 2007/08 to 2013/14.
Table 5.29: Summary of payments and estimates: Programme 6: Adult Basic Education and Training
Spending against the Public Centres sub-programme reflects significant growth between 2007/08 and 2009/10 due to spending pressures in respect of the compensation for educators. The decrease reflected in 2010/11 is due to the movement of educators who were incorrectly paid under this programme instead of Programme 2. This is also reflected against Compensation of employees.
The medium-term estimates reflect a steady increase over the 2011/12 MTEF period against Compensation of employees. However, this increase is insufficient due to the effects of the shortfall in the funding for OSD for educators and the higher than anticipated 2010 wage agreement, as most of the additional funding was allocated to Programme 2 leaving this programme and others with insufficient
Estimates of Provincial Revenue and Expenditure
212
additional funding. As part of the broader transformation process in the education system, the ABET delivery sub-system is progressively being put in place. Again, there is no certainty as to where this programme will be provided for in the future, as indications are that it will move to the Department of Higher Education and Training.
Goods and services reflects fluctuations over the seven-year period, with a significant increase in 2008/09 and a reduction in 2009/10 due to the implementation of cost-cutting measures which is also carried over to the 2010/11 Revised Estimate. The budget reflects a steady increase over the 2011/12 MTEF.
Service delivery measures – Programme 6: Adult Basic Education and Training
Table 5.31 below illustrates the main service delivery measures relevant to Programme 6.
Table 5.31: Service delivery measures – Programme 6 : Adult Basic Education and Training Outputs Performance indicators Estimated
Performance Medium-term targets
2010/11 2011/12 2012/13 2013/14 To ensure that all adults without basic education have access to ABET centres
• No. of learners enrolled in public ABET centres in the province 57 000 58 000 59 000 60 200
• No. of educators employed in public ABET centres 6 000 6 500 6 800 7 000
6.7 Programme 7: Early Childhood Development
The objective of this programme is to provide ECD at the Grade R and earlier levels in accordance with White Paper 5 on ECD. The main services are:
• To provide specific public ordinary schools with resources required for Grade R;
• To support particular community centres at the Grade R level;
• To provide particular sites with resources required for pre-Grade R;
• To provide educators and learners in ECD sites with departmentally managed support services; and
• To provide departmental services for the professional and other development of educators and non-educators in ECD sites.
Tables 5.32 and 5.33 reflect payments and budgeted estimates for the period 2007/08 to 2013/14.
The budget for this programme has grown substantially from 2007/08 to 2013/14. This growth reflects the focus of the sector towards universal access to Grade R by 2014. The sub-programmes within this programme reflect fluctuations over the seven-year period under review, with significant additional funding in the 2011/12 MTEF. The pressures brought about by the shortfall in Compensation of employees as a result of the higher than anticipated 2009 wage agreement resulted in some projects, such as installation of jungle gyms, being put on hold in 2009/10.
Table 5.32: Summary of payments and estimates: Programme 7: Early Childhood Development
2007/08 2008/09 2009/10 2011/12 2012/13 2013/14 Grade R in Public Schools 74 579 186 227 227 485 406 340 280 825 270 434 515 638 542 161 572 542 Grade R in Community Centres 57 188 16 390 16 475 94 276 75 865 109 012 110 750 116 281 122 671 Pre-grade R - - - 96 530 96 530 64 303 103 670 108 854 114 841 Human Resource Development 202 29 6 527 1 532 1 532 386 1 514 1 596 1 689
The increase in the 2010/11 Main Appropriation against Goods and services relates to additional funding for the expansion of Grade R. The programme reflects a reduction in the 2010/11 Adjusted Appropriation due to the reprioritisation of funds to cater for spending pressures in Compensation of employees under Programme 2.
Grade R in Public Schools reflects an increase in 2008/09 in line with the national priority aimed at strengthening pre-Grade 1 education and promoting access for the majority of learners thereto. The decrease in the 2010/11 Adjusted Appropriation and Revised Estimate is as a result of the department’s effort to curtail over-expenditure, which saw spending against this programme being kept low to cover spending pressures in other programmes. Furthermore, as mentioned in the analysis in Programme 2, the schools’ delivery programme includes the provision of ECD classrooms in new schools which explains the reduction against Buildings and other fixed structures, as this budget was transferred to Programme 2.
Grade R in Community Centres reflects fluctuations over the seven years. The significant decrease in 2008/09 relates to a change in the focus, whereby more attention is given to Grade R in public schools.
Compensation of employees reflects an increase in the 2010/11 Revised Estimate due to the higher than anticipated 2010 wage agreement. The 2011/12 provision for Compensation of employees is lower than the 2010/11 Adjusted Appropriation as the additional funding allocated is not sufficient to cover the carry-through costs of the higher than anticipated 2010 wage agreement. Despite slow spending patterns in previous years, significant growth can be seen against Goods and services and Buildings and other fixed structures which caters for the roll-out of the programme in 2010/11 and the 2011/12 MTEF.
Service delivery measures – Programme 7: Early Childhood Development
Table 5.34 below illustrates the main service delivery measures relevant to Programme 7.
Table 5.34: Service delivery measures – Programme 7: Early Childhood Development Outputs Performance indicators Estimated
performance Medium-term targets
2010/11 2011/12 2012/13 2012/14 To provide publicly funded Grade R in accordance with policy
• No. of Grade R learners in public schools 180 992 182 492 184 650 186 554 • No. of public schools that offer Grade R 4 145 4 165 4 185 4 205
Estimates of Provincial Revenue and Expenditure
214
6.8 Programme 8: Auxiliary and Associated Services The purpose of Programme 8 is to provide examination support services to learners in the relevant grades, and ensure quality in the provision of education, through quality assurance. The objectives are as follows: • To provide the education institutions as a whole with training and support; • To provide employee human resource development in accordance with the Skills Development Act; • To provide for projects specified by the Department of Education that are applicable to more than one
programme and funded with conditional grants; • To provide for special departmentally managed intervention projects in the education system as a
whole; and • To provide for departmentally managed examination services.
Tables 5.35 and 5.36 reflect payments and estimates relating to the budget for Examination Services, Payments to SETA and Special Projects - Masifundisane.
Table 5.35: Summary of payments and estimates: Programme 8: Auxiliary and Associated Services
The increase in the Examination Services sub-programme from 2007/08 to 2009/10 is indicative of the increased number of exams, due to the expansion in the range of courses offered to learners, as well as the concurrent running of two curricula at FET and GET levels. In addition, the department is still providing examination opportunities to learners to complete their Grade 12 certificates under the old curriculum where the final examination will be in the 2011 school year. The decrease in the 2010/11 Main Appropriation is due to the shortfall in funding for examination fees relating to the increased number of tests conducted for Grade 11 and 12, including the examinations. The increase in the 2010/11 Revised Estimate is due to the increased number of exams, due to the increased number of courses offered to learners, more assessments to be administered, more venues and markers to be hired, more exam papers to be printed, as well as other costs associated with the marking norms for the NCS. From 2011/12, the positive growth is due to additional funding of R441.810 million over the 2011/12 MTEF, which will eliminate the spending pressures in this programme. In addition, due to the Masifundisane literacy project coming to an end, the budget has been reprioritised to the Examination Services sub-programme.
Vote 5: Education
215
The Payments to SETA sub-programme reflects a steady increase from 2007/08 to 2009/10 due to the increase in the department’s wage bill. The increase in the 2010/11 Adjusted Appropriation relates to the higher than anticipated 2010 wage agreement. The decrease from 2010/11 to 2011/12 is an indication of the budgetary pressure that the department is facing in the 2011/12 MTEF, as there is no room for reprioritisation due to spending pressures arising from the higher than anticipated 2010 wage agreement and the OSD for educators.
With respect to the Special Projects – Masifundisane sub-programme, the high spending during 2008/09 is due to commitments from the previous year. The expenditure patterns between 2009/10 and 2010/11 reflect stability, taking into cognisance the budget allocations of respective years and the effects of the cost-cutting measures. 2010/11 is the last year in which the Masifundisane literacy project will be offered, whereafter it will be replaced by Kha-Ri-Gude which is a nationally funded literacy programme.
The department also received an additional allocation against Compensation of employees in 2010/11 to cater for the shortfall in respect of the higher than anticipated 2010 wage agreement. The 2011/12 MTEF budget has been increased due to the carry-through of additional funds allocated in 2010/11.
Transfers and subsidies to: Departmental agencies and accounts reflects an increase in the 2010/11 Adjusted Appropriation due to the increased payment for Education, Training and Development Practices (ETDP) SETA in line with the wage increase. However, the final payment was lower than initially calculated, accounting for the reduction in the 2010/11 Revised Estimate.
Service delivery measures – Programme 8: Auxiliary and Associated Services
Table 5.37 below illustrates the main service delivery measures relevant to Programme 8.
Table 5.37: Service delivery measures – Programme 8: Auxiliary and Associated Services Outputs Performance indicators Estimated
performance Medium-term targets
2010/11 2011/12 2012/13 2013/14 To provide specialist support services with support functions to Public Ordinary Schools
• No. of candidates for the Grade 12 Senior Certificate examination 154 000 155 000 165 000 165 000 • No. of candidates for the ABET NQF level 4 examinations 21 000 24 000 27 000 27 000
7. Other programme information
7.1 Personnel numbers and costs
Table 5.38 below reflects personnel information per programme for Education, while Table 5.39 provides a further analysis of personnel information indicating the Finance and Human Resource components, as well as the various categories of employees. The tables include both educator and non-educator salaries and post numbers. Salary costs continue to be the major cost driver in the department’s budget, with Programme 2 having the largest share of the department’s post allocation.
Due to the trends in absenteeism, as well as the high incidence of HIV and AIDS infection among educators in the province, provision was made for 2 513 substitute educators in 2009/10.
The personnel budget increases notably over the 2011/12 MTEF, in line with additional funding for the higher than anticipated 2010 wage agreement and OSD for educators. The unit cost per employee between 2007 and 2014 is expected to grow substantially, explaining the increase in the personnel cost.
As can be seen in Table 5.38, the personnel numbers do not reflect growth over the 2011/12 MTEF due to the moratorium that is currently in place and the fact that the department cannot afford to appoint new employees with the current budget provisions due to pressures arising from the implementation of various
Estimates of Provincial Revenue and Expenditure
216
collective wage agreements, starting in 2008/09 and 2009/10, which had a carry-through effect. The decrease in personnel numbers against Programme 5 as at 31 March 2011 is as a result of some employees having become FET college council employees.
Table 5.38: Personnel numbers and costs per programme
Head count as % of total for department 0.62 1.17 1.49 1.57 1.57 1.57 0.96 0.96 0.96 Personnel cost as % of total for department 0.60 1.05 0.97 1.51 1.46 0.36 1.17 1.19 1.22
Head count as % of total for department 0.45 0.70 0.53 0.57 0.57 0.57 0.57 0.57 0.57 Personnel cost as % of total for department 0.43 0.63 0.58 0.51 0.49 0.12 0.69 0.70 0.71
Head count as % of total for department 99.69 98.07 99.20 97.05 97.05 97.05 97.05 97.05 97.05 Personnel cost as % of total for department 99.99 97.76 99.20 97.04 96.99 96.96 96.88 96.89 96.89
Head count as % of total for department 0.29 0.54 0.59 0.48 0.48 0.48 0.64 0.64 0.64 Personnel cost as % of total for department 0.61 1.71 120.92 99.59 104.57 110.40 133.48 140.15 147.94
Head count as % of total for department 0.02 2.51 0.20 2.48 2.48 2.48 2.48 2.48 2.48 Personnel cost as % of total for department 0.01 2.23 0.21 2.50 2.54 2.56 2.57 2.56 2.55
Audited Outcome Main Appropriation
Revised Estimate
Medium-term Estimates
2010/11
Adjusted Appropriation
7.2 Training
Tables 5.40 and 5.41 reflect departmental expenditure on training per programme, as well as information on training over the seven-year period under review.
Number of interns appointed 74 150 200 200 200 200 200 250 313 Number of learnerships appointed 347 150 150 50 50 50 50 70 98 Number of days spent on training - 111 - - - - - - -
Medium-term Estimates Audited Outcome
2010/11
Main Appropriation
Adjusted Appropriation
Revised Estimate
The number of personnel trained and training opportunities decreased in 2008/09, as a result of cost-cutting to curtail over-expenditure, while the number of bursaries, interns and learnerships increased steadily, which is in line with the department’s strategy to skill practitioners, particularly in areas of early childhood development and special needs education. The substantial decrease in 2009/10 is attributable to the implementation of cost-cutting measures which saw the external courses being put on hold.
The decrease from the 2010/11 Adjusted Appropriation to 2011/12 is attributable to the continued implementation of cost-cutting measures. A reduction is noted in the 2010/11 Revised Estimate due to the effects of the cost-cutting measures implemented to curtail over-expenditure which had an impact on training expenditure. The training budget is set to increase modestly over the 2011/12 MTEF, in order to address the educators’ skills gaps and improve on the quality of education.
Casino taxesHorse racing taxesLiquor licencesMotor vehicle licences
Sale of goods and services other than capital assets 26 135 28 532 30 979 31 323 31 323 31 490 34 455 36 420 38 423 Sale of goods and services produced by dept. (excl. capital assets) 26 135 28 532 30 963 31 323 31 323 31 490 34 455 36 420 38 423